
India-Bangladesh Bilateral Trade and Potential Free Trade Agreement Bangladesh Development Series
India-Bangladesh Bilateral Trade and Potential
Free Trade Agreement
Bangladesh Development Series
Paper No: 13
The World Bank Office, Dhaka
December, 2006
www.worldbank.org.bd/bds
Document of the World Bank
The World Bank
World Bank Office Dhaka
Plot- E-32, Agargaon,
Sher-e-Bangla Nagar,
Dhaka-1207, Bangladesh
Tel: 880-2-8159001-28
Fax: 880-2-8159029-30
www.worldbank.org.bd
The World Bank
1818 H Street, N.W.
Washington DC 20433, USA
Tel: 1-202-473-1000
Fax: 1-207-477-6391
www.worldbank.org
All Bangladesh Development Series (BDS) publications are downloadable at:
www.worldbank.org.bd/bds
Standard Disclaimer:
This volume is a product of the staff of the International Bank for Reconstruction and Development/The World
Bank. The findings, interpretations, and conclusions expressed in this paper do not necessarily reflect the
views of the Executive Directors of the World Bank or the governments they represent. The World Bank does
not guarantee the accuracy of the data included in this work. The boundaries, colors, denominations, and other
information shown on any map in this work do not imply any judgment on the part of the World Bank
concerning the legal status of any territory or the endorsement or acceptance of such boundaries.
Copyright Statement:
The material in this publication is copyrighted. The World Bank encourages dissemination of its work and will
normally grant permission to reproduce portion of the work promptly.
Design:
Cover designed and published by Progressive Printers.
Illustration Credits:
Front cover (from left): Courtesy of the Chittagong Port Authority, Abdul Hye Swapan, Andrew Biraj
Back cover (from left): Abdul Hye Swapan, Andrew Biraj, Mufty Munir, Courtesy of the Chittagong Port
Authority
CURRENCY EQUIVALENTS
US $1.00 = Tk 69.36 (Bangladesh Taka, August 2006)
GOVERNMENT'S FISCAL YEAR
July 1 – June 30
Acronyms and Abbreviations
AD
Anti-Dumping
MFN
Most Favored Nation
AIT
Advanced Income Tax
NBR
National Board of Revenue
AV
Assessable Value
NCAER
National Council of Applied
Economic Research
BEI
Bangladesh Enterprise Institute
NTB
Non Tariff Barrier
BIDS
Bangladesh Institute of
Development Studies
POL
Petroleum, Oil and Lubricants
BIS
Bureau of Indian Standards
PSI
Pre-shipment Inspection
CD
Customs Duty
QR
Quantitative Restriction
CIF
Cost, Insurance and Freight
RD
Regulatory Duty
DEPB
Duty Exemption Pass Book
REER
Real Effective Exchange Rate
DGFT
Director General of Foreign Trade
RMG
Ready Made Garments
EPB
Export Promotion Bureau
ROW
Rest of the World
EU
European Union
SAARC
South Asian Association for Regional
Cooperation
FCI
Food Corporation of India
Saad
Special Additional Duty
FDI
Foreign Direct Investment
SAFTA
South Asia Free Trade Agreement
FOB
Free on Board
SAPTA
SAARC Preferential Trading
Agreement
FTA
Free Trade Agreement
SD
Supplementary Duty
GDP
Gross Domestic Product
SEDF
HS
Harmonized Code
SPS
South Asia Enterprise Development
Facilities
Sanitary and Phyto-sanitary
IDSC
Infrastructure Development
Surcharge
STE
State Trading Enterprise
LC
Letter of Credit
T&C
Textile and Clothing
iii
LDC
Least Developed Country
TRQ
Tariff Rate Quota
LF
License Fee
VAT
Value Added Tax
M&B
Men and Boys
WTO
World Trade Organization
Vice President
Director for Regional Program
Sector Director
Sector Manager
Task Manager
:
:
:
:
:
iv
Praful C. Patel, SARVP
Alastair J. McKechnie, SAC01
Sadiq Ahmed, SASPR
Ijaz Nabi, SASPR
Zaidi Sattar, SASPR
Table of Contents
Acronyms and Abbreviations……………………………………………………………………………iii
Table of Contents……………………………………………………………………………………….....v
Acknowledgements…………………………………………………………………………………….....ix
Foreword………………………………………………………………………………………………….xi
Executive Summary……………………………………………………………………………………..xiii
Introduction................................................................................................................................................. 1
Chapter 2. Background: bilateral trade and exchange rates................................................................. 3
Chapter 3. India’s trade policies............................................................................................................... 9
Chapter 4. Bangladesh’s trade policies .................................................................................................. 19
Chapter 5. Reconciling the trade statistics ............................................................................................ 33
Chapter 6. Bangladesh imports from India: composition, trends and potential under an FTA ...... 39
Chapter 7. Bangladesh exports to India: composition, trends and prospects under an FTA........... 47
Chapter 8. Informal and Illegal Trade: Dimensions, Trends, Composition, and the Role of
Domestic Indirect Taxes...................................................................................................... 57
Chapter 9. Trade Financing, Logistics and Transaction Costs ........................................................... 67
Chapter 10. Quantifying the economic costs and benefits of an FTA: some industry case studies ... 73
Chapter 11. Implications for Bangladesh and Indian trade policies.................................................... 81
Chapter 12. Summary of Key Findings .................................................................................................. 85
Background Papers................................................................................................................................... 89
Reference…………………………………………………………………………………………………90
List of Figures
Figure 1:
Figure 2:
Figure 2.1:
Figure 2.2:
Figure 2.3:
Figure 2.4:
Figure 2.5:
Figure 2.6:
India 1996/97-2005/06 Example of a typical industrial tariff. MFN rate and
preferential SAPTA rate for Bangladesh…………………………………………………. xv
Bangladesh FY 1996 - FY 2005: Average protective tariffs by type of good…………… xix
Recorded India-Bangladesh Trade 1990/01-2003/04 ............................................................ 3
Shares of recorded trade with Bangladesh in India's total trade............................................. 4
Shares of trade with India in Bangladesh's total trade ........................................................... 4
Bangladesh imports from India FY 1992-2004: distinguishing land border from
sea and air routes.................................................................................................................... 5
India Real Effective Exchange Rate Index 1980-2004 (Annual averages 1990=100:
Increase=devalutaion) ............................................................................................................ 5
Bangladesh Real Exchange Rate Indices 1980-2004 (Annual averages 1990=1000:
increase=devaluation) ............................................................................................................ 6
v
Figure 3.1:
Figure 3.2:
Figure 3.3:
Figure 3.4:
Figure 3.5:
Figure 3.6:
Figure 4.1:
Figure 4.2:
Figure 4.3:
Figure 4.4:
Figure 4.5:
Figure 5.1:
Figure 5.2:
Figure 6.1:
India 1990/91-2005/06: Unweighted Average Tariffs ......................................................... 10
India: trends in average tariffs 2002/03 -2005/06 ................................................................ 10
India 2005/06 Distribution of tariff lines ............................................................................. 11
India 2004/05: Ad valorem equivalents of specific tariffs on cotton shirts
according to cif import price of the shirt.............................................................................. 12
India: ad valorem equivalent of specific MFN tariff, and SAPTA preferential
tariff for Bangladesh, on a $4 cotton shirt............................................................................ 13
India 1996/97-2005/06 Example of a typical industrial tariff. MFN rate and
preferential SAPTA rate for Bangladesh ............................................................................. 13
Bangladesh 1991/92-2004/05: All Tariff Lines. Unweighted Average
Protective Import Duties ...................................................................................................... 19
Bangladesh 1991/92-2004/05: Industrial Tariff Lines. Unweighted Average
Protective Import Duties ...................................................................................................... 20
Bangladesh 1991/92-2004/05: Agriculture Tariff LInes. Unweighted Average
Protective Import Taxes ....................................................................................................... 20
Bangladesh FY 1996-FY 2005 Average protective tariffs for final consumer goods.......... 21
Bangladesh FY 1996 - FY 2005: Average protective tariffs by type of good ..................... 22
India-Bangladesh trade 1998/99-2003/04 Comparison of Indian export ……….…………34
Comparison of Bangladesh export statistics and Indian import……………………………34
Major components of Indian exports to Bangladesh 1996/97-2003/04………………........39
List of Tables
Table 4.1:
Table 4.2:
Table 4.3:
Table 4.4:
Table 4.5:
Table 4.6:
Table 5.1:
Table 5.2:
Table 6.1:
Table 6.2:
Table 6.3:
Table 7.1:
Table 7.2:
Table 7.3:
Table 7.4:
Table 8.1:
Table 8.2:
Table 8.3:
Bangladesh 1991/92-2004/05: Unweighted Average Protective Import Duty Rates........... 29
Bangladesh 2003/04 and 2004/05: Distribution of tariff lines with extra
protection above Customs duties plus IDSC tax, provided by VAT exemptions,
supplementary duties and regulatory duties ......................................................................... 29
Number of tariff lines subject to selective paratariffs FY 03-FY 05.................................... 30
Unweighted average total protection rates by type of product (% of assessable values)..... 30
Bangladesh FY 1998, FY 2004 and FY 2005: some examples of total protection
rates resulting from selective paratariffs on top of Customs duties, the license fee
and the IDSC........................................................................................................................ 31
Bangladesh tariff schedule 2004/05: Tariff lines with "end user" tariff concessions .......... 32
Comparison of Indian export statistics with Bangladesh import statistics
1998/99-2003/04 .................................................................................................................. 37
Comparison of Bangladesh export statistics and Indian import statistics
1991/92-2003/04 .................................................................................................................. 38
Indian exports to Bangladesh 2003/04 ................................................................................. 40
Bangladesh Imports FY 1996 & FY 2001-FY 2004: Composition and Indian shares ........ 44
Indian exports to Bangladesh 2003/04 : 25 principal products exported ............................. 45
Indian imports from Bangladesh during Indian FY 04: comparison of MFN
and preferential SAPTA tariffs ............................................................................................ 48
Indian protection policies for some major exported commodities ....................................... 52
Some agricultural products and processed foods: comparisons of prices and
tariffs in India and Bangladesh ............................................................................................ 53
Bangladesh's principal exports other than garments: Indian exports, imports and tariffs.... 56
Bangladesh imports from India 2002/03: recorded plus survey-based estimates of
smuggled imports ................................................................................................................. 64
Bangladesh land border imports from India 2002/03: recorded plus
survey-based estimates of smuggled imports....................................................................... 64
Trends in estimated "bootleg" smuggled exports from India to Bangladesh ....................... 64
vi
Table 8.4:
Table 8.5:
Table 9.1:
Table 9.2:
Some examples of "technical smuggling": sample of consignments
inspected at Benapole........................................................................................................... 65
Bangladesh sanitary ware tariffs FY 98 and FY 2003-2005 ................................................ 65
Estimated actual and excess costs of transport and Customs clearance in
India at Petrapole ................................................................................................................. 69
Estimated total extra cost for Indian exporters of delays and "speed money"
at Petrapole land border crossing. Cost per 10 ton truckload by various products .............. 72
References
Volume II - Technical Annex:
Methodology and selected case studies: This Technical Annex is made available on a CD-Rom attached
to this report.
vii
Acknowledgements
This report was prepared by Garry Pursell (consultant, SASPR) and Zaidi Sattar (SASPR).
Component studies on various aspects of India-Bangladesh trade were made by Abdul Bayes, Sanjib
Pohit and Samanthak Das, Rajesh Mehta, Arun Goyal and Ashu Garg (consultants). Data International
conducted field survey on informal trade while Ziaul Ahsan compiled and analyzed essential data and
provided superb general research support. Subject to time and other constraints, the authors did their best
to take account of suggestions made by Aaditya Mattoo, Will Martin, Paul Brenton, David Tarr, Phillip
Schuler (all at Bank headquarters in Washington), and many insightful and thoughtful detailed comments
received from peer reviewers Marcelo Olareaga, I.N. Mukherjee (India), Zaid Bakht and Ismail Hossain
(Bangladesh). The report was prepared under the overall guidance of Sadiq Ahmed, Shanta Devarajan,
and Alastair J. McKechnie. Ijaz Nabi and Ejaz Syed Ghani provided useful oversight and direction when
they were needed. In the World Bank Dhaka office Aneeka Rahman and Nermeen Shams Rouf provided
research support while Mehar Akhter Khan and Mildred Gonsalves put the report together and skillfully
formatted the voluminous text in record time. The study also relied on secretarial support at various stages
from Oxana Bricha (Washington), Jyoti Sriram (Delhi) and Joyce Mormita Das (Dhaka). The report was
produced by Rehnuma Amin and Erwin De Nys. Lastly, the authors would like to express their
appreciation to Suman Bery (NCAER) and Farooq Sobhan (BEI) for sponsoring the Dhaka and Delhi
workshops, and to the many government officials, businessmen, academics, researchers, and others in
India and Bangladesh, who attended and provided feedback, essential information and guidance during
the preparation of this report. Finally, the cooperation and support of SEDF for the workshops is
gratefully acknowledged.
The report has been discussed with the Government of India and Government of Bangladesh but does not
necessarily bear their approval for all its contents, especially where the Bank has stated its
judgments/opinions/conclusions/policy recommendations.
ix
Foreword
Bangladesh and India have long shared the common objective of fostering closer economic integration
within the South Asia region. However, there are few analytical studies that describe the likely impact of
such integration. The present report attempts to fill this gap.
While bilateral trade between the two countries has been growing steadily since the early 1990s, exports
from India far outweighed imports from Bangladesh, resulting in a yawning trade gap. Only recently, this
trend is showing signs of abating with a strong pick up in Bangladesh exports, thanks to tariff concessions
from India and removal of other trade barriers with mutual agreement. The signing and ratification of
South Asia Free Trade Agreement (SAFTA) in early 2006 by the two countries sets forth the possibility
of further consolidation of trading arrangement through the formation of bilateral Free Trade Agreement
(FTA).
Critical concerns on the Bangladesh side include the massive trade deficit with India and the large
volumes of informal imports from India across the land border which avoid Bangladesh import duties.
For India, although trade with Bangladesh currently is small, the potential of Bangladesh as an emerging
market on India’s borders will evince great interest for the business and investor communities. In
addition, closer economic ties with Bangladesh are seen as a very important way of reducing the
economic and political isolation of the seven Indian eastern and north eastern states from the rest of the
country. A bilateral FTA could create the scope for resolving some of these critical issues while removing
some vexing tariff and non-tariff barriers.
What would be the implications of a bilateral free trade agreement for both Bangladesh and India? The
present report seeks to answer these critical questions by analyzing different aspects of India-Bangladesh
trade, and, by using industry case studies, tries to measure the potential benefits and costs of a Free Trade
Agreement between the two countries.
The study, completed with research contributions from both sides of the border, finds that a FTA will
bring large welfare gain for consumers in Bangladesh provided there is adequate expansion of
infrastructure and administrative capacity at custom borders. Yet the benefits of such a FTA to
Bangladesh could be wiped out if it has the effect of keeping out cheaper third-country imports, say, from
East Asia. Such trade diversion costs can be huge and the only way to minimize them is through further
unilateral liberalization. For India, since trade with Bangladesh is small relative to its total trade, welfare
gains from a FTA will be modest, though it could trigger cross-border investment opportunities.
Nevertheless, the study finds a weak case for pursuing a bilateral FTA based on the potential economic
benefits to both countries. Instead, it argues that unilateral trade liberalization by both countries would
yield much larger economic benefits whilst minimizing risks. Thus in order to get mileage out of a FTA,
both countries are advised to continue with unilateral liberalization while streamlining border transactions
through trade facilitation.
Sadiq Ahmed
Director
Poverty Reduction & Economic Management
South Asia Region
Shantayanan Devarajan
Chief Economist
South Asia Region
xi
Executive summary
The trading relationship between India and Bangladesh is currently of special interest in both
countries for a number of reasons. Firstly, there are urgent and longstanding concerns in Bangladesh
arising from the perennial, large bilateral trade deficit with India, and from the large volumes of informal
imports from India across the land border which avoid Bangladesh import duties. These concerns have
been particularly acute on the Bangladesh side in the context of discussions between the two governments
of the possibility of a bilateral free trade agreement along the lines of the India-Sri Lanka FTA. Secondly,
even though (because of the disparity in the size of the two economies) India’s trading relationship with
Bangladesh is much less significant for it than it is for Bangladesh, closer economic integration with
Bangladesh is nevertheless seen as a very important way of reducing the economic and political isolation
of the seven Indian eastern and north eastern states from the rest of the country. Finally, both countries
have long shared common objectives for closer economic integration within the South Asia region, and
these have recently been reemphasised by signing on to SAFTA, which takes effect from January 2006.
Under SAFTA, the preferential tariffs agreed in the various rounds of SAPTA-- so far largely ineffective
in generating much intra-regional trade-- will continue, but a number of ambitious new objectives have
been enunciated. These include the eventual elimination of tariffs and non-tariff barriers on trade between
the members, the harmonisation of Customs procedures and documentation, the facilitation of banking
relationships, and cooperation and improvements in the infrastructure for regional trade and cross-border
investments 1 .
This report summarizes and attempts to draw out and synthesize some of the main conclusions of
a series of consultant papers on various aspects of the trading relationship between India and Bangladesh.
The study program originally also included a component which involved a summary and overview of the
current situation on trade policy in each of the five principal South Asian countries (India, Pakistan,
Bangladesh, Sri Lanka and Nepal) plus Bhutan and Maldives. This component became a major separate
study, the results of which were published in a three volume World Bank report in September 2004
(Trade Policies in South Asia: an Overview) and which were discussed in a series of workshops in the
region.
Background: bilateral trade and exchange rates
In 2004 India’s officially recorded exports to Bangladesh were about $1.7 billion but its imports
from Bangladesh were just $78 million. Since 1996/97 Indian exports to Bangladesh (in nominal US
dollars) have been growing at 9.1% annually, just slightly above the general rate of growth of its total
merchandise exports (8.4%), but India’s imports from Bangladesh over the same period have grown on
average at only 3% annually, compared to average growth of its total imports of 9.2%. Consequently
Bangladesh’s bilateral trade deficit with India has been increasing rapidly, on average at about 9.5 %
annually. However, the bilateral trade deficit narrowed for the first time in fiscal 2005/06, when
Bangladesh’s exports rose to $242 million from $144 million in the previous year, while India’s exports
fell to $1.8 billion from $2 billion in FY2004/05.
For India, trade with Bangladesh is a very small part of its total trade-just over one percent since
the mid-1990s, and currently about 3 percent of its total exports and a miniscule share (0.01%) of its total
imports. For Bangladesh, however, India has now become the largest single source of its imports (about
1
Under the Trade Liberalization Program of SAFTA, India pares down its tariffs to 0-5% by 2013 while
Bangladesh has until 2016 to do the same, subject to exclusion of sensitive lists (India’s 763 tariff lines versus
Bangladesh’s 1254, at the 6-digit level).
xiii
15% of the total, ahead of China and Singapore) and accounts for about a tenth of its total trade, despite
exports to India which have declined to only slightly above 1 % of total exports.
Most Bangladesh imports from India come via the land border. According to incomplete
Bangladesh data, during the 1990s about three quarters of imports were by land and river, but this
proportion has declined since then to between 50 and 60 percent Two reasons for the decline in the share
of the land border trade are:
•
•
A requirement imposed by Bangladesh in July 2002 that two major imports from India-sugar and
textile yarns-could henceforth only be imported by sea. The reason given for these measures was
the control of illegal activities and smuggling at or near the land border Customs posts 2 .
Increasing congestion and delays at the land border crossings-especially at Petrapole-Benapole-as
a result of inadequate infrastructure and administrative capacity on both the Indian and
Bangladesh sides.
Studies of informal trade between India and Bangladesh have consistently found a pattern similar
to that of formal trade i.e. large volumes of goods being smuggled from India to Bangladesh, but much
smaller volumes being smuggled in the other direction. This general conclusion that there is also a
substantial Indian trade surplus on informal account, is confirmed once again in the studies done as part of
this project. The study finds that apart from cross border smuggling, the practice of over- and underinvoicing in formal trade makes a significant contribution to the volume of informal trade.
The appreciation of the real Taka/Rupee exchange by about 50% between mid-1980s up to about
1999, would have contributed to the expansion of both formal and informal Indian exports to Bangladesh,
and retarded the growth of Bangladesh exports to India. However, recorded Bangladesh imports from
India have grown even more rapidly since the exchange rate trend was reversed after 1999, and
Bangladesh exports to India have continued to stagnate. Two possibilities arise: (a) faster productivity
growth in India increased the difficulty of Bangladesh exports competing there, offsetting the favourable
trend in the exchange rate since 1999; (b) significant tariff and non-tariff barriers constraining
Bangladesh’s major exports (RMG) or minor exports which have experienced rapid growth elsewhere.
A nation’s overall trade deficit, rather than a bilateral trade deficit, is what matters. Bangladesh’s
trade deficit with India has been consistently offset by trade surpluses with other countries, especially
with the US and the EU, and by worker remittances. These surpluses have in turn supported the exchange
rate of the Taka with other currencies, including the Taka/Rupee rate, and have both enabled, and have
been a consequence of, macroeconomic policies which have avoided destabilizing fluctuations in the
balance of payments, domestic prices and the exchange rate. As in other countries, there is no economic
logic in the idea that trade should be balanced with individual trading partners, and the real concerns
behind contrary arguments are usually efforts to prevent or moderate import competition.
In Bangladesh it is often argued that the deficit is aggravated by India’s protectionist policies that
have hobbled Bangladesh exports to India. However, for the past 8 years India’s imports from the world
as a whole have been growing at over 9 percent a year recently, each year’s increase in imports has been
exceeding Bangladesh’s total exports. Many of these imports have been coming in over considerably
higher tariffs than the tariffs faced by Bangladesh exporters, owing to the extensive tariff preferences
given to Bangladesh by India under SAPTA, and to the extent that there are non-tariff and bureaucratic
barriers, they are probably more constraining than the ones that Bangladesh would face. This suggests
2
The ban on sugar imports over land border was lifted in mid-2005 while the ban on yarn imports were removed
in December 2005 for 100% export industries.
xiv
that the low level and slow growth of Bangladesh’s exports to India reflect fundamental comparative
advantage factors, not discriminatory import policies.
This issue is also considered in the consultant studies in the light of what is likely to happen were
there free trade between India and Bangladesh. The general finding of the studies is that some aspects of
India’s import regime are retarding Bangladesh exports, but that in the short and medium run the potential
for expanded exports to India is not very great, even under an FTA or with the full implementation of
SAFTA.
India’s trade policies
Non-tariff barriers. India’s licensing restrictions on imports of raw materials and manufactured
intermediates were removed during its 1991/92 reforms, but imports of nearly all industrial consumer
goods and agricultural products continued to be restricted, either by import licensing which operated as a
de facto import ban in most cases, or-especially in the agricultural sector- by “canalisation” through
parastatals such as FCI. These restrictions were finally removed in April 2001.
Against a background of almost 40 years of de facto autarchy, the abolition of this comprehensive
import licensing system created considerable apprehension as to how well local producers of industrial
consumer goods and of agricultural products would be able to compete with imports. Partly because of
this apprehension, after the Uruguay Round, India made sure that it implemented all the WTO-compatible
procedures that allow non-tariff restrictions to be applied to imports.
Tariffs. As well as removing QRs from intermediates and capital goods, the 1991/92 reforms
reduced tariffs and pre-announced a tariff reduction program. Under this program tariffs came down
steadily from prohibitive levels at the beginning (average almost 130% in 1990/91) to much lower levels
(average about 35%) in 1997/98 (Fig 1). However, in 2000, ad valorem tariffs were supplemented by the
introduction of prohibitively high specific tariffs to protect textile fabric and garment producers.
Fig 1
India 1996/97-2005/06 Example of a typical industrial tariff . MFN rate
and preferential SAPTA rate for Bangladesh
70
MFN tariff
60
Preferential tariff for Bangladesh
Tariff %
50
40
30
20
10
0
1997
1998
1999
2000
2001
2002
2003
2004
2005
2006
Only a year after the final removal of import licensing, a new tariff reduction process started in
2002/03. This new program focussed on industrial tariffs. There were three major omissions:
xv
•
•
•
Agriculture, livestock, fisheries and processed foods (HS 01-24)
Textile fabrics and clothing products, about half of which continue to be protected by specific
tariffs
A few important manufacturing sectors, notably the auto and fertilizer industries
For most industrial goods, there was an especially large tariff reduction in 2004/05 and 2005/06.
90 percent of industrial tariffs are now at 12.5%, far lower and far more uniform then they have
ever been in the past 50 years. From the perspective of SAARC countries including Bangladesh, these
changes mean that Indian domestic markets for most manufactured goods are highly competitive, with
prices that are close to world prices, and are likely to be difficult to penetrate even with complete
exemption from Indian tariffs under bilateral or multilateral free trade arrangements such as those planned
under SAFTA.
In contrast to industrial tariffs, tariffs on “agricultural” products (defined in the broad sense to
include fisheries, livestock and livestock products, agricultural products and processed foods) were left
out of the new tariff reduction program: in 2005/06, on average, they were about 40%, more than three
times the level of non-agricultural tariffs
Specific duties protecting the textile and garment industries. Just before the withdrawal of
import licensing from textiles and garments in April 2001, the government imposed specific duties on a
large number of textile fabrics and garments, in order to protect domestic producers against low price
import competition. At present these tariffs are the greater of the standard 15% rate, or the specific
amount (usually Rupees per metre of per kg, or per garment). This system was designed to make it
impossible or very difficult for other developing countries with strong textile and garment industries to
compete in India. It also has the effect of excluding the products to which the specific duties are applied,
from subsequent reductions in ad valorem tariffs.
Ready made garments are Bangladesh’s principal export, and these specific tariffs in India are of
special concern to it in the context of regional trade arrangements including SAPTA and SAFTA. As
discussed in the case study of the RMG industry, given the low margins between fabric costs and garment
export prices, tariffs at this level make it very difficult for Bangladesh RMG exporters to compete in India
India’s SAPTA preferences for Bangladesh. Though SAFTA took effect from 1 January 2006,
superseding SAPTA, tariff concessions offered under the latter remain valid until the completion of the
Trade Liberalization Programme of SAFTA. At present India has given preferences to Bangladesh on
approximately 2925 tariff lines, about 58% of the total number of its approximately 5000 6-digit HS lines.
Two thirds of these preferences were agreed in the third SAPTA negotiating round and came into force
during India’s 2000/01 fiscal year. A majority of the preferences are special “LDC-only” preferences:
most of these are 50%, some are 60%, and a few 15%, 75% or 100%.
In practice Bangladesh is the only relevant beneficiary of India’s LDC-only SAPTA preferences,
since Nepal and Bhutan have long had duty free access to the Indian market under their bilateral treaties,
and the Maldives trade is negligibly small (at least from India’s perspective). Therefore, in a sense, these
preferences constitute a de facto bilateral asymmetric preferential trade arrangement between India and
Bangladesh, asymmetric because many substantial preferences have been given by India, but for all
practical purposes few and negligible preferences for Indian imports have been given by Bangladesh
In order to qualify for India’s SAPTA preferences, products imported from Bangladesh would
have to satisfy the SAPTA origin rule, which is that the cif value of non-SAPTA imported inputs included
in the exported product should not exceed 70% of the fob price. As discussed in the case study of the
ready made garment industry, this provision is extremely important for firms in Bangladesh wishing to
xvi
export woven garments to India, because value-added margins in cutting, sewing and assembling
garments from imported fabrics are typically around 30% of fob prices, and may be less. To get around
this constraint, they can use imported Indian fabrics, even though they might not have done so if they had
a free choice unconstrained by this consideration.
Anti-dumping (AD) is one of the WTO-legitimate measures that India introduced during the
1990s, as a way of providing extra protection as its tariffs came down and its import licensing system was
dismantled. By the late 1990s and early 2000s, India had become the world’s most active user of antidumping. However, there are recent indications that AD activity has been slowing: the number of new
cases brought during 2003/04 was 14 compared to 30 in each of the previous two years
So far, there have only been three cases involving SAARC countries, two in Nepal, and one in
Bangladesh. The Bangladesh case was finalized in December 2001, and involved Indian imports of lead
acid vehicle batteries from Japan, Korea, China and Bangladesh. Anti-dumping duties were imposed on
all imports from the four countries, and in the case of the Bangladesh firm these were prohibitive and
blocked all subsequent exports to India.
As regards Bangladesh’s trade with India, the large number of Indian AD cases against exporters
in China and other countries, and (except for the acid battery case) the absence of AD actions against
Bangladesh exporters, is an advantage for Bangladesh exporters by sheltering them to some extent from
the competition of these other exporters. However, most probably this situation principally reflects the
absence of Bangladesh exports. Were they to expand, even if their shares in the Indian markets of
individual products were small, the exporting firms face the risk that they will be caught up in Indian AD
actions mainly concerned about imports from other countries, as happened in the acid battery case. The
best strategy for reducing the likelihood that AD cases will be brought, and for minimising the damage if
they are, is to follow low protection policies in the domestic market. By following its present protection
policies with the almost automatic use of para-tariffs to provide very high protection levels (see below)
Bangladesh is doing the opposite and increasing its vulnerability to AD actions in India and elsewhere, if
these protected industries begin to export.
Export policies India operates a comprehensive set of export policies. Three aspects of these
policies that are relevant for India’s trading relationship with Bangladesh in the context of a bilateral FTA
or SAFTA are described below:
• India restricts the Customs posts which can administer its various import duty neutralisation
schemes, and in June 2005 it was reported that DEPB 3 -which is one of the most widely usedwas not available at any of the land border Customs posts with Bangladesh except at
Petrapole.
• Rebates for exporters under these schemes have been substantially reduced during the past
five years as tariff levels have declined. These reduced rates mean that Indian domestic
prices of exportable garments (as well as of other exportables) are likely to be not far above
fob export prices, and may be below cif prices, increasing the difficulty for Bangladesh
exporters to compete in the Indian market, even under an FTA.
• In recent years India has demonstrated that it is willing to subsidize its exports of rice when
there have been large domestic surpluses. In some years India’s exports were large relative to
the narrow international market and probably reduced world prices, with resulting economic
welfare benefits to Bangladesh as an importer.
3
Duty Exemption Pass Book. This system is described in the Overview report and in recent changes in DEPB
rates for garments are given in the RMG industry case study (Table 6, p.15).
xvii
Bangladesh’s trade policies
This section summarises some of the main findings of the World Bank’s trade policy Overview
report that are relevant for the Bangladesh’s trading relationship with India, and includes new information
that is now available for 2004/05, especially on Bangladesh’s para-tariffs, which during 2004/05
continued to increase their role in Bangladesh’s policies of protecting domestic producers from import
competition.
Non tariff barriers. During the late 1980s and early 1990s, import licensing system was
abolished. Of the continuing QR restrictions the most important were the parastatal import monopoly over
sugar and the ban on textile fabric imports for use in the domestic market, which protected the textile
industry. The sugar import monopoly was removed in September 2003 and the import ban on textile
fabrics in January 2005, both being replaced by very high tariffs. But there are still QRs on the import of
chicks, eggs, salt,. Various permits, clearances and approvals are also required for extensive lists of other
products, even though they are not formally subject to import licensing. In the various studies undertaken
as part of this project, except for sugar and textile fabrics, explicit QRs did not emerge as an impediment
or special issue either for Indian exporters or in Bangladesh, possibly because the products still subject to
QRs were not covered in the studies..
Customs clearance at land border Customs posts The land border trade is subject to very
serious administrative constraints in Bangladesh, because 38 out of the 42 land border Customs posts with
India severely restrict the imported goods that can be cleared, and only four land border posts can clear all
imported goods. In terms of volume the most important by far of the Customs posts with comprehensive
Customs clearance powers is at Benapole, which borders Petrapole on the Indian side and which is on
main roads linking Kolkata with Jessore and Dhaka.
In addition to these general constraints on imports by the land border, both Bangladesh and India
have periodically constrained imports of certain products by specifying the ports at which they can be
cleared by Customs. This in turn provides a strong incentive to send the goods illegally, either by
“bootleg” smuggling which bypasses the Customs posts altogether, or by “official” smuggling involving
bribes to Customs and other officials on both sides of the border
General tariff trends. The drastic tariff reductions of the early 1990s stalled after 1995/96, and
during the following ten years up to 2004/05, tariffs declined only slightly. Average industrial tariffs
came down modestly but the average protective rate for agriculture (including fisheries, livestock and
processed foods) was 32.7% in 2004/05, slightly higher than it had been 10 years earlier. By July 2006,
the unweighted average protective rate over all tariff lines declined by 7.7 percentage points, from 32% to
24.3%.
Para-tariffs This slowing of tariff reduction occurred because continuing cuts in Customs duties
were offset by increases in the scope and levels of a variety of para-tariffs which were imposed on top of
Customs duties. By 2004/05 about 40% of the unweighted average protection level was due to paratariffs, and para-tariffs were being applied to 21% of total tariff lines.
The para-tariffs have been principally but not exclusively used to provide extra protection to
domestically produced consumer goods. As a result, during the 10 years since 1995/96 there has been no
downward trend in the average protection rate of consumer goods (Fig 2) despite reductions in Customs
duty rates during the period and the discontinuance of the license fee in 2002/03. By contrast the average
protection rates on basic raw materials, intermediate goods and capital goods are much lower, and in the
case of raw materials and intermediate goods have been trending down since 1998/99.
xviii
Fig 2
Bangladesh FY 1996 - FY 2005: Average protective tariffs by type of good
45
40
Protective tariff %
35
30
25
20
15
Final consumer goods
10
Intermediate goods
Raw materials
5
0
1996
1997
1998
1999
2000
2001
2002
2003
2004
2005
“End user” tariff concessions. As well as using the para-tariffs to raise the protection for the
outputs of domestic industries, the government has developed a system of special “end user” tariffs which
provide low concessional tariffs on the inputs and capital equipment for specified industries or for
specified uses. These concessional tariffs are much lower than normal MFN tariffs, and in the case of
machinery and parts used by exporters, the concessional tariff is zero. However, there are only two major
industries which receive special end-user concessions for their intermediate materials, namely the
pharmaceutical industry and the insecticide industry. Bangladesh has well developed systems (mainly
export processing zones and bonded warehouses) for providing duty free intermediate materials for its
export firms, and this is not handled as part of the “end user” concessional tariff system..
Agriculture, livestock, fisheries and processed food. Bangladesh’s trade policies in these
sectors warrant separate treatment because, as in India, they differ in important ways from its
manufacturing trade policies, in addition to which Indian agricultural products are generally a large
although fluctuating share of its total exports to Bangladesh.
The high protection rates for some of the agricultural and other primary products, but especially
of processed foods, from the viewpoint of Bangladesh consumers constitute a substantial and highly
regressive indirect tax. This has important implications for the likely economic effects of an FTA with
India, because if Bangladesh were to import these products duty free there could be large economic
welfare benefits for Bangladesh consumers, but also difficult adjustment problems for the Bangladesh
producers that lose protection. How the resulting economic costs and benefits might work out is discussed
in a project case study paper using the example of the sugar industry. By contrast, it is probable that not
much would change for Bangladesh consumers or for producers, if rice and Bangladesh’s other cereal
crops were included in an India-Bangladesh FTA, because of the Bangladesh protection levels that are
already quite low.
Bangladesh’s tariff preferences for India. Bangladesh gives tariff preferences to imports from
India under the Bangkok Agreement and under SAPTA. Overall, the tariff preferences Bangladesh has
given to India (and to the other member countries) under both the Bangkok Agreement and SAPTA are
xix
purely symbolic: their main effect has been to further increase the complexity of the tariff schedule and
Customs administration rather than to provide any substantive preferences for imports from India of any
of the other Bangkok Agreement or SAPTA countries.
Export policies Bangladesh’s exports are dominated by ready made garments, most of which are
exported to the US and the EU. Nearly all garment exports are from firms operating in export processing
zones or as bonded warehouses. In both cases they can import their textile and other inputs free of
Customs duties and all other import taxes (including the 3% advance income tax) with the use of “backto-back LCs” i.e. letters of credit based on LCs issued for their exports. As noted previously, machinery
used by exporters is also exempt from all import taxes under the “capital machinery” provision for
exporters. There is also a 5% subsidy on domestic fabrics used by garment exporters. Apart from these,
there is a standard array of duty neutralization schemes (e.g. duty drawback) and export incentives (e.g.
preferential export credit) and export promotion institutions and activities of the kind used in many
developing countries (see the trade policy Overview report for a summary). In addition, however, there
are a number of non-standard export policies which would need to be discussed with India in the context
of bilateral FTA, or with the India and the other South Asian countries in the context of SAFTA. These
combine export bans and restrictions on a number of unprocessed or partially processed primary products
and export subsidies when some of these products are exported in processed form. The intention of these
measures is to make processed exports more profitable by increasing gross margins by lowering the prices
of the raw materials and increasing the return from the exported finished products, but both measures
contravene WTO rules and the Agreement on Agriculture in particular. They are also likely to run into
trouble if used to promote exports to India or to one of the other South Asian countries as part of a free
trade agreement.
Reconciling the trade statistics
A component of this study is a paper which provides detailed comparisons of the Indian and
Bangladesh statistics of bilateral trade. One purpose of this exercise was to check whether there were any
major discrepancies as to the general level of, and trends in, the total recorded trade. Secondly, by making
detailed comparisons, the object was to throw some light on the scale and scope of overinvoicing,
underinvoicing, and similar practices, the likely products involved, and more broadly the potential scale
of “technical smuggling”.
In making these comparisons it turned out that the Bangladesh NBR trade database does not
record “back to back L/C” imports i.e. imports of duty free intermediate inputs used by Bangladesh EPZ
and bonded warehouse exporters, and so these are recorded in the Indian export statistics but omitted
altogether from the corresponding Bangladesh NBR import statistics.
Fortunately payments under back-to-back LCs are recorded by Bangladesh Bank, adding the
totals to NBR’s total import data, gives a very approximate correspondence between the general level of
the two sets of data for the years 1998/99 to 2002/03. Both statistics also indicate similar year to year
changes during this period. Although data recording deficiencies and statistical errors may conceivably
explain some of these differences, they are consistent with many reports of illegal practices at the
Bangladesh Customs, especially at the Petrapole-Benapole land crossing, and with large scale
discrepancies between the Indian and Bangladesh trade statistics data at product level.
As regards the much smaller reverse trade from Bangladesh to India, the correspondence between
Bangladesh’s aggregate export statistics and the Indian import statistics is fairly close. Over the whole
period, the difference between aggregate Indian imports and aggregate Bangladesh exports has the
expected positive sign, and the positive margins correspond to the expectation that cost of freight and
insurance is low. This does not mean there was no undervaluation or misclassification to avoid import
xx
duties occurring on the Indian side, only that it was not so egregious as to show up in the aggregate
import statistics.
As well as comparing aggregates, the consultant study also compared the Indian export and
Bangladesh import statistics for 1999/2000 and 2000/01 at HS 6-digit product level. The value differences
were quite minor for most of the individual products analyzed. However, when the study looked at a
sample of products that had high values in either the Indian export statistics or the Bangladesh import
statistics, large discrepancies were discovered, predominantly cases with lower values in the Bangladesh
import statistics than in the Indian export statistics, but also the reverse i.e. where the recorded import
values in Bangladesh considerably exceed the export values in India.
In addition to income tax evasion, some researchers in Bangladesh have suggested that overinvoicing--especially of capital equipment imports-- is used to accumulate unrecorded foreign exchange
outside the country, which in turn finances illegal imports or is used to profit from free market premia on
the official exchange rate. Tax evasion and the various advantages of holding black money outside
Bangladesh could still be relevant motivations and may explain some of these observed differences
between the Indian and Bangladesh statistics.
Bangladesh imports from India: composition, trends and potential under an FTA
Disaggregating the Bangladesh import statistics by some major commodity categories shows the
following:
• Highly variable but sometimes large imports of cereals (mainly wheat and rice) from India.
Bangladesh is also importing from other countries, but India has been the main supplier in recent
years.
• An apparently declining role of India as a supplier of duty free intermediate goods (mainly
textiles) for Bangladesh’s export RMG sector.
• According to Bangladesh’s import statistics, India is supplying fairly constant shares of
Bangladesh’s imports of basic raw materials, intermediate goods used for domestic production,
capital goods and non-cereal final consumer goods. However, according to India’s export
statistics, exports of these products have been growing considerably faster than indicated by the
Bangladesh import statistics, on average at around 15% annually since 1996/97, with especially
big increases in 2002/03 and 2003/04.
India exports a wide range of products to Bangladesh. According to the Indian export statistics for
2003/04, there were at least some exports in all but 4 of the 98 HS chapters. About a third of total exports
were primary agricultural, fish and livestock products, 6.6% processed foods and drinks (including animal
foods), and most of the rest manufactured products. Leaving aside textile and clothing exports, most of
which go duty free to Bangladesh RMG exporters, India was supplying 21.5% of Bangladesh’s total
recorded imports for use in the domestic market. Adding unrecorded smuggled imports, the Indian share
of total imports for the Bangladesh domestic market is plausibly between 30% and 35%.
This means that Indian exporters to Bangladesh are successfully competing with exporters in the
rest of the world (ROW) and have achieved substantial shares in Bangladesh’s import markets, while in
most cases paying relatively high tariffs which in principle are the same for all exporters. If Bangladesh’s
MFN tariffs for the rest of the world were to remain the same while India received duty free treatment
under SAFTA or a bilateral FTA, for most of these products Indian exporters would have a substantial
price advantage in products in which it appears from the trade data they are already highly competitive.
An NCAER survey asked Indian traders who were already exporting to Bangladesh by what
percentage they would expect their exports to expand under three different hypotheses on Bangladesh
xxi
tariff reductions (50%, 75% and 100%). For the free trade alternative (100% tariff reduction) the average
estimated increase for 58 products was 34 %, distributed as follows: agricultural products 31%, processed
foods 45%, manufactures 35%.
These responses underline the considerable potential for trade diversion with an FTA i.e. the
probability that Indian exporters would be able to undercut ROW suppliers and substantially increase
their shares in Bangladesh’s import markets. On the basis of 2003/04 trade data, before allowing for
market share increases, a very rough estimate of the Bangladesh government import duty revenue loss is
$207 million. It would be greater than this to the extent that Indian exporters increase their import market
shares
Bangladesh exports to India: composition, trends and prospects under an FTA
Since 2001/02 Bangladesh’s officially recorded exports to India have been increasing fairly
rapidly, and this increase was sustained until fiscal year 2005/06 when it rose to around $200 million.
However, it was from a very low level of only $50-60 million in 2001/02. It is still a miniscule share of
India’s total imports (less than 0.1%) and only about 1% of Bangladesh’s total exports. About two thirds
of Bangladesh’s exports to India consist of just two products, anhydrous ammonia (which is imported
duty free as an input into India’s urea industry) and raw jute. According to the various informal trade
surveys, smuggled merchandise exports from Bangladesh to India by the bootleg route are also very low.
The very low level and slow growth of Bangladesh’s exports to India is not necessarily
attributable to restrictive import policies in India.
•
•
•
For industrial products without SAPTA preferences, Indian industrial MFN tariffs came down
from 44.9% in 20001/04 to 30.8% in 2003/04, to 20% in 2004/05, and to 12.5% in 2006/07.
Despite this steep decline only 7 Bangladesh industrial products without SAPTA preferences
appear in India’s 2003/04 import basket, and then at very low annual import levels of no more
than about $300,000 per product.
Most of India’s 2925 (HS 6-digit) SAPTA preferences for Bangladesh are on industrial
products, and the most frequent concession rate is 50%. Assuming this preference rate, a
typical Indian industrial preferential tariff for Bangladesh has declined during the past five
years from 23% to 7.5%. Despite this, only seven industrial products with preferences appear
among India’s principal imports from Bangladesh in 2003/04, and the imports of each of these
were less than $500,000. This almost complete absence of response of Bangladesh exports to
the numerous and fairly substantial Indian preferences under SAPTA, and to the decline of the
preferential tariffs over the period, suggests that currently Bangladesh producers are probably
not producing many products that are in demand in India. Alternatively, if these products are
being produced in Bangladesh, it seems that, despite declining Indian tariffs, Bangladesh
producers’ costs are too high to compete with Indian producers, or with exporters in other
countries who have to pay the higher MFN tariffs.
Three quarters of Bangladesh’s exports are ready made garments, most of which go the US and
Europe. Bangladesh RMG producers appear to have a marked labour cost advantage over RMG
producers in India, owing to lower wages and similar labour productivity, but India’s specific
duties on garments appear to have prevented any substantial penetration of its domestic markets
by developing country clothing producers including Bangladesh. Under SAPTA, Bangladesh
RMGs benefits from Indian preferences –mainly either 50% or 60%-and these are applied to
reduce both the ad valorem and the specific components of compound tariffs. Presumably
helped by this protection and the SAPTA preference advantage, Bangladesh RMG exports to
India-almost entirely woven cotton shirts -grew fairly rapidly after 1999/2000 up to 2003/04,
but the total level in that year ($4.57 million) was still tiny both in relation to the Indian
xxii
domestic RMG market and to Bangladesh’s total RMG exports. This suggests that high
protection levels provided by India’s specific duties on garments are mostly redundant by wide
margins. That is, actual domestic prices in India are probably not far above and may even be
below prevailing international prices at the cif stage in India. It is also relevant that Sri Lankawhich is a major RMG exporter- has had negligible RMG exports to India, despite the 75%
preference for garments negotiated under the Sri Lanka-India FTA.
In general, India’s import policies for “agricultural” products have been and remain much more
protective than its industrial protection policies, and in their present form they preclude substantial Indian
imports from Bangladesh or from any other country. .
How about the prospects for Bangladesh exports to India under an FTA or under SAFTA in
which Bangladesh exporters would have duty free access to the Indian market would not be subject to
Indian NTBs (such as its agricultural import monopolies), while India’s existing tariffs and import
policies would remain in place with respect to the rest of the world? Based on the performance of
Bangladesh’s existing industries, the short to medium run prospects for expanded exports to India even in
such favourable circumstances appear to be quite modest. The most obvious apparent opportunity would
appear to be in RMGs, but:
• India is also a major exporter of RMGs, in 2003/04 with exports of $6.2 billion versus
Bangladesh’s exports of $4.9 billion. Indian domestic prices of exportable garments appear to be
close to or even below cif prices.
• These likely difficulties of competing in India are compounded by the absence of a competitive
low cost textile industry in Bangladesh, more so for fabrics than for yarns. This means that RMG
firms exporting to India would have to deal with the usual delays and difficulties of international
procurement of their textile inputs, whereas the Indian firms with which they would be competing
would in general obtain their inputs at highly competitive prices nearby in the domestic Indian
market.
• In order to satisfy whatever rules of origin would be agreed under the FTA, Bangladesh exporters
would probably need to source some of their textile inputs in India. If that turns out to be the case,
it would be crucial to ensure fast and low cost transport and Customs clearance of the textile
inputs obtained from India, preferably over the land border. Otherwise, if costs are high and there
are unpredictable delays, Indian traders will be deterred from ordering garments in Bangladesh
rather than in India.
• If the Indian RMG market were to be opened preferentially to Bangladesh exporters on a free
trade basis, and Bangladesh exporters were able to take advantage of the opportunity, it is likely
that some of the RMG exports that go to India will be diverted from other markets. Hence, not all
of the increase in RMG to India would represent a net increase in total Bangladesh RMG exports.
• The RMG market in India is far larger and more diversified than RMG production in Bangladesh.
Even so, because of the importance of product differentiation in final consumer goods like
garments-style, fashion, brands etc-some Bangladesh producers might be able to find market
niches in India if they are able link into strong Indian marketing organizations. However the
reverse is also the case, and under an FTA with India, RMG exports from India to Bangladesh
based on these considerations could be susstantial.
The report also considers the export prospects in India under an FTA of Bangladesh’s principal
secondary exports and also finds that that the prospects for exporting these products to India under an
FTA appear to be quite limited. This is because (1) the Indian tariffs on the products that are currently
being exported to India in non-negligible quantities-fertilizers and raw jute- are zero and 2.5%, so an FTA
would make little difference; (2) exports of the other products to India are zero or negligible despite low
Indian preferential tariffs in most cases; (3) with some exceptions, exports would have to compete in
xxiii
India with Indian firms that are exporting themselves and are likely to be highly competitive in their
domestic markets.
These apparently very limited possibilities for Bangladesh to find substantial export markets in
India under an FTA for its present major exportables, suggest the best prospects may be in industries and
products which are still to be developed, for example natural gas itself or products such as power,
fertilizers, chemicals, steel etc based on natural gas or coal inputs and/or other resources. This kind of
development could be accelerated and distribution and marketing in India facilitated by direct investment
including joint ventures on the part of Indian firms.
Informal and illegal trade: dimensions, trends, composition, and the role of domestic indirect taxes
Ever since Bangladesh’s independence there has been a substantial informal unrecorded trade
across the India-Bangladesh land borders. Much of this trade is quasi legal and is best characterized as
“informal” rather than illegal, because there is wide participation by local people in the border areas, and
the trade generally bypasses Customs posts. At the other extreme there is trade which goes in larger
quantities-mostly by truck-through the formal legal Customs and other channels, but which involves
explicitly illegal practices such as underinvoicing, misclassification and bribery of Customs and other
officials, and which in Bangladesh is sometimes called “technical” smuggling.
All the literature on the India-Bangladesh informal trade confirms that this trade is essentially
one-way, from India to Bangladesh. Leaving aside gold, silver and currency which is smuggled into India
in part to pay for Indian goods, smuggled “bootleg” merchandise exports from Bangladesh exports to
India have been estimated at only about 3% of smuggled bootleg Indian exports to Bangladesh. There are
no studies of “technical” smuggling from Bangladesh to India, but the scale is probably small in view of
the very low level of the recorded trade.
According to very approximate estimates based on surveys in Bangladesh during 2002, total
smuggled exports (“bootleg” plus “technical”) from India to Bangladesh may have been around $500
million, about 42% of Bangladesh’s recorded imports from India in 2002/03, or about 30% of total
imports (recorded plus smuggled). Most of the smuggled imports came by the land border, and the total
estimated value of “technical” smuggling was slightly higher than the value of “bootleg” smuggling.
However, this estimate is based on interviews with “knowledgeable persons” in various regions on the
Bangladesh side of the border only, and the estimated values of smuggling in some key products (notably
cattle and sugar) are much lower than estimates from the Indian side. These discrepancies suggest that the
total smuggling could be as high as $900 million, equivalent to about three quarters of the total recorded
trade, or about 42% of total Bangladesh imports (recorded plus smuggled).
Comparisons of three studies of “bootleg” smuggling suggest that it may have declined over the 8
years, 1995-2003, and it might be tempting to conclude from these statistics that smuggling from India
has been declining and to link the apparent decline to import liberalization in Bangladesh, in particular to
the steady reduction of Customs duties during the same period. However, for a number of reasons this
would be a hazardous generalization because of inherent deficiencies in the surveys and the fact that there
were no attempts to study “technical” smuggling prior to 2002. In addition some trends in Bangladesh’s
import policies since 1998/99 have probably increased rather than reduced smuggling incentives, in
particular the use of para-tariffs which have drastically increased protection rates on a wide range of
locally produced consumer goods. The increasing bifurcation of protection rates, with very high tariffs
(including para-tariffs) on locally produced consumer goods and low tariffs on raw materials and
intermediates, has also increased the incentive and potential for “technical” smuggling through false
documentation, i.e. falsifying the description of products so that they are misclassified as products subject
to low rather than high tariffs.
xxiv
The consultant studies find that preferences for formal trade will be influenced by:
• The level of Bangladesh protective tariffs.
• The rigor of Customs administration, especially on the Bangladesh side.
• The nature of the goods and VAT administration in Bangladesh.
• The state of the infrastructure (roads, storage, technical and administrative capabilities etc)
on both the Indian side and the Bangladesh side at the border Customs posts, and the
resulting time and transaction costs associated with the use of these formal routes.
The report suggests a number of policy and other reforms that would serve the economic interests
of both India and Bangladesh by channelling trade away from the bootleg routes to the formal routes, and
by reducing the incentives and scope for corrupt practices in the formal routes:
• Bangladesh would bring down its presently very high tariffs protecting import substitution
industries by reversing the policies under which protection rates have been drastically
increased over the past 6 or 7 years by the use of para-tariffs on top of Customs duties
• Both countries would improve the infrastructure –physical and administrative-at their land
border Customs posts. This would need to be done in a coordinated way-there would no
point if the infrastructure were improved on one side of the border but bottlenecks were to
remain or even increase on the other side of the border.
• Both countries would continue and accelerate efforts to streamline and improve the
administrative structures that affect land border trade, especially Customs administration.
For Customs the purposes would be to speed up and simplify Customs clearance and to
reduce the incentives for, and scope of corrupt practices.
• The administrative reforms would include expanding the facilities and the Customs
clearance powers available at Bangladesh’s smaller land border Customs posts.
Trade financing, logistics and transaction costs
A study of the financing of India-Bangladesh trade points out that the hawala networks perform
better than the formal banking system in terms of simplicity, speed, transaction costs, and reliability, and
that for these reasons they are not only financing much of the informal bootleg smuggling trade from
India to Bangladesh, but also substantial parts of the exports to Bangladesh that go through the legal
routes. It notes that under Bangladesh Bank rules LCs are compulsory for all import consignments in
excess of $5000, but involve very high transaction costs, mainly due to credibility problems of
Bangladesh banks and resulting high confirmation charges by prime US or other international banks. As a
result, according to the study, in practice “the LC is a mere cover to move goods through the Customs”.
This finding, that the LCs in this trade are not in practice being used for their normal function of reducing
the risks and facilitating financing for both the importers and the exporters, implies that they would not be
used in the trade if they were not compulsory. If this is correct, they involve non-negligible transaction
costs without protecting the suppliers and importers against commercial risks such as defective
shipments, non-payment, delayed payments etc
Informal exports from India to Bangladesh are also paid for by gold and Taka smuggled into
India. The smuggled Taka are used to buy Rupees from informal foreign exchange traders who offer
considerably more favourable Taka/Rupee rates than can be obtained from the banks, which are obliged
to first convert the taka to US dollars and then to Rupees, as there is no official direct Taka/Rupee foreign
exchange market. The study states that the lack of such an official market means that remittances to
Bangladesh of the Bangladeshi immigrant community in India, go entirely by the informal hawala
networks, and argues for the establishment of an official Taka/Rupee market to facilitate these
remittances and also India-Bangladesh trade.
xxv
There are serious logistical problems (congestion, delays, side-payments etc) at the land Customs
stations on the India- Bangladesh border. NCAER organized surveys of exporters and transporters in the
Kolkata-Petrapole region which handles by far the largest share of the recorded India-Bangladesh land
border trade through Benapole in Bangladesh. The NCAER survey at Petrapole did not systematically
investigate the logistics costs of Bangladesh exports to India, but, according to the authors, Bangladesh
exporters are treated in an unsympathetic and discriminatory way at Petrapole. This is of considerable
interest and concern in Bangladesh and would be worth exploring in follow-up studies..
There is strong case for investing in larger and much improved infrastructure and facilities at
Petrapole and at the other land border Customs stations. For Bangladesh the present system involves
substantial terms of trade losses, since the landed costs of imports from India of products such as wheat,
rice, fruit, cattle feed, bauxite and other products appear to be much higher than they would be if the
congestion were removed. Bangladesh exporters and potential exporters also have an obvious interest in
faster and less expensive commodity movements across the border. Likewise, on the Indian side, even
though it can be assumed that the congestion costs of exports to Bangladesh are recovered in the prices
charged, at higher prices the volumes of the exports must be lower than they otherwise would be. If the
required investments are not made, congestion will increase with the general growth of trade, and would
largely cancel or offset economic benefits that would otherwise occur if tariffs or other trade barriers were
to be reduced. This last point is especially relevant if India and Bangladesh were to ever implement an
effective FTA, since without very substantial investments in infrastructure and administrative capabilities,
increases in trade would be slowed down or blocked by increases in congestion and the associated
increases in “speed money” rents.
Quantifying the economic costs and benefits of an FTA: some industry case studies
If there were a bilateral free trade agreement between India and Bangladesh, or if SAFTA is
eventually implemented in a comprehensive way, there would be economic costs and benefits for various
groups in the two countries and for the two governments, and also repercussions affecting exporters and
importers outside the South Asia region. In order to bring out these issues in a reasonably non-technical
way, a methodology was developed for analysis at the level of individual industries, and applied in a
number of industry case studies.
In this methodology, changes in “economic welfare” resulting from an FTA are treated as the sum
of changes in the money value of consumers’ surplus, producers’ surplus and government revenue from
tariffs (customs duties). Consumers’ and producers’ surpluses are a shorthand way of summarizing
economic benefits that may accrue to a variety of economic agents, not just final consumers and
producers. For example, governments normally share in producer surpluses through taxes on profits, and
some shares may go to foreigners if there is portfolio and/or foreign direct investment (FDI). It is also
likely that traders (e.g. wholesale distributors and exporters) may share in producer surpluses, especially
exporters who undertake marketing functions.
Free trade agreements discriminate against imports from rest of the world (ROW) countries that
are not parties to the agreements. Insofar as the imports from the ROW countries that are excluded are
traded at lower prices than the imports from the FTA countries, there is an economic welfare loss for the
FTA members, and also an economic loss for the ROW exporters who lose their markets. These trade
diversion effects need to be allowed for in any comprehensive evaluation of the costs and benefits of
FTAs. The difficulty of quantifying these effects does not diminish their importance, and as a rule of
thumb it might be plausible to assume that the per unit producer surplus losses resulting from the
excluded ROW exports at least equal the producer surplus gains of the new exports from the FTA
member that replaces them. This kind of calculation is discussed in the cement industry case study, where
xxvi
it appears that an India-Bangladesh FTA would exclude Indonesian, Malaysian and Thai clinker exporters
from the Bangladesh market.
Case studies simulated the likely effects of an India-Bangladesh FTA in the following industries:
Cement
Light bulbs
Bicycle rickshaw tyres
Sugar
Ready made garments
In the simulations for the first four of these industries, it turned out that under an FTA there are
expanded Indian exports to Bangladesh, but no exports from Bangladesh to India. This was not predicted
in advance, but was a result of finding that in the 2002/03 base scenario (a) India was exporting all these
products to the rest of the world and –except for cement-also to Bangladesh (b) Indian export prices were
substantially lower than ex-factory before-tax prices of the same or similar products in Bangladesh (c)
none of the products were being exported from Bangladesh (d) potential export supply prices in
Bangladesh-defined as ex-factory prices minus estimated duty drawback for inputs subject to tariffs-in
each case substantially exceeded ex-factory prices in India.
The simulations for ready made garments (using the example of mens’ cotton shirts and trousers)
predict increased Bangladesh exports to India, but also increased RMG exports from India to Bangladesh.
In the base simulations for cement, light bulbs, rickshaw tyres and sugar, following an FTA
production in Bangladesh ceases altogether and the entire Bangladesh market is supplied by imports from
India. In each of these industries, this seemed to be the most plausible likely outcome given the
information obtained on prevailing prices and costs in Bangladesh, even after allowing for cost reductions
that would result from duty free imports of intermediate inputs from India that would also result from an
FTA. It was not a surprising outcome in view of the very high protection rates all of these industries were
receiving in Bangladesh, and the fact that –despite apparently substantial smuggling of a number of these
products-actual domestic prices were approximately reflecting the tariff protection that had been
provided. The protective tariff rates (Customs duties plus para-tariffs) in 2002/03 were:
Table 1: Protection rates on selected goods traded
Cement
Light bulbs
Bicycle rickshaw tyres
Sugar
Ready made garments (cotton
shirts & trousers)
66.7%
66.0%
35.5%
86.4%
65.5%
In the simulations for the first four of these industries, the duty free imports from India create
economic welfare benefits for Bangladesh consumers which considerably exceed the economic welfare
losses of Bangladesh producers plus the government fiscal losses which are a result of the zero tariffs on
the imports from India. Hence, in each case, the FTA creates a substantial net welfare benefit for
Bangladesh. Because of the very high Bangladesh tariffs and the resulting large gaps between the
protected prices pre-FTA and India’s export prices, these “welfare triangles” are much larger than the
welfare triangles often found in similar exercises in other countries
Since Indian exports expand there are also economic benefits for the Indian producers (producer
surpluses), so in each of these cases the net joint economic benefit to Bangladesh and India together
exceeds the net economic benefits in Bangladesh alone. On the other hand the FTA diverts trade from the
xxvii
countries that were previously supplying Bangladesh with imports of the finished products or with inputs
for the Bangladesh industries that cease production following the FTA.
With the exception of the RMG case study, the economic welfare outcomes depend crucially on
what is assumed about competition between Indian exporters to Bangladesh following an FTA. The base
scenarios assume that the Indian industries are competitive and following an FTA would export to
Bangladesh at the export prices they were charging prior to the FTA in selling to the rest of the world and
to Bangladesh. But in signing on to an FTA with India, Bangladesh in effect would be extending its
general tariff protection levels to Indian as well as to Bangladesh producers, and this raises the possibility
for the Indian firms to collude and sell to Bangladesh at higher prices than their prevailing export prices to
the rest of the world, and even at higher prices than their prevailing domestic prices. If that happens, as
discussed in some of the case studies, the Indian industry extracts a share of the consumer welfare benefit
that would have gone to Bangladesh consumers in a competitive scenario.
The RMG industry case study was chosen to explore the possibility of Bangladesh exports to
India following an FTA and the economic welfare consequences. As expected, lower wages in
Bangladesh than in India combined with similar labour productivity mean that RMG production costs in
Bangladesh are lower than they are in India. Moreover, some Bangladesh exports to India of mens’ and
boys’ woven shirts started in the late 1990s and were growing fairly rapidly up to 2003/04, although
starting from a very low level. Since these exports were taking place over fairly high Indian tariffs (28.4%
for shirts in 2003/04) it seemed plausible that exports would increase at a faster rate under an FTA, and
the economic welfare consequences were estimated for alternative annual export levels to India of
between $8.5 million and $41 million. The paper argues that higher export levels for Bangladesh shirts
than these are unlikely because of evidence that the Indian domestic market for RMGs is highly
competitive, with domestic prices not far above fob export prices. It also argues that some part of
increased Bangladesh exports to India would be diverted from exports to other countries, so that the net
export increase from the opening to the Indian market provided by the FTA would be less than the
increased exports going to India.
Implications for Bangladesh and Indian trade policies
Implications for Bangladesh. The simulated economic effects of an India-Bangladesh FTA in
the industry case studies which predict Indian exports to Bangladesh, all indicate large economic welfare
gains for Bangladesh consumers which far outweigh the total of government revenue losses, producer
surplus losses resulting from the contraction of Bangladesh production, and losses of economic rents in
Bangladesh resulting from the contraction of both “bootleg” and “technical” smuggling. In addition, an
FTA would also generate some Bangladesh producer surplus gains from expanded exports to India, but
these are likely to be quite limited owing to the highly competitive nature of most Indian markets. All this
presupposes that infrastructure and administrative capacity would have to be greatly improved and
expanded on both sides of the land border crossings to reduce bottlenecks and to stay ahead of the
expanded bilateral trade, otherwise the economic welfare gains from the FTA would be severely
compromised by increasing congestion, delays and informal payments.
The prediction that an FTA with India could bring large net economic welfare benefits for
Bangladesh must be qualified by some important risks:
• By providing a captive protected market to Indian suppliers, there is a risk that instead of
exporting to Bangladesh at prevailing world prices, the Indian producers will collude with each
other and possibly with some Bangladesh producers and set prices that will transfer most of the
economic benefit of the FTA arrangement to India. This could result in a net economic welfare
loss for Bangladesh.
xxviii
•
•
There is a risk of terms of trade losses for Bangladesh if, following the FTA, some Indian
industries export to Bangladesh at competitive prices which are nevertheless higher than
prevailing world prices. As it happened, none of the few industries chosen for study in the
project fitted this pattern, but it is highly likely that would be some among the large numbers of
products being produced in India but not currently being exported. The terms of trade loss for
Bangladesh in such cases is the excess of these Indian export prices over cif import prices when
the same products are imported from the rest of the world.
In the recent past India has subsidized its exports of rice, wheat and sugar in order to get rid of
excess stocks generated by problems with its domestic support and other policies. Bangladesh
has benefited from these subsidies by importing Indian supplies of these commodities at the
subsidized prices. However, if Bangladesh were a captive market for these products under an
FTA, India would be able to supply Bangladesh at whatever higher prices would be possible
given the Bangladesh MFN tariffs, probably involving lower or zero Indian export subsidies.
These risks for Bangladesh of an India-Bangladesh FTA are substantial and serious, and raise the
basic question: why not aim to obtain the same economic welfare gains from a policy of multilateral
import liberalization, which could produce the same consumer surplus benefits for Bangladesh consumers
and the same net domestic economic benefits, while avoiding the risks?
Implications for India India’s trade with Bangladesh is very small relative to its total trade and
to its economy, and so the economic welfare consequences of an FTA involving Bangladesh (whether
bilateral or as part of SAFTA) are also quite minor even though they are significant for Bangladesh. As
discussed above, there are potential producer surplus benefits for Indian producers and traders from the
expansion of exports to Bangladesh that would result from an FTA.
The RMG case study suggests the possibility of some Indian consumer welfare benefits from
Bangladesh RMG exports to India under an FTA, but these and other potential consumer welfare benefits
appear to be quite limited in view of the current general openness of India’s industrial import policies, and
the competitiveness of domestic production and prices in most of the sectors with high and very high
import protection, notably agricultural products and the textile and clothing sectors protected by specific
tariffs..
All of this suggests that there is no compelling case for India to pursue an FTA with Bangladesh,
based on the potential economic welfare benefits to India. Whatever economic benefits might result from
an FTA with Bangladesh, are potentially available on a much broader basis and larger scale from
continuing the general unilateral import liberalization process that has been under way during the past
three years. This would pay special attention to non-tariff barriers and prohibitive tariffs in the
agricultural sector (including livestock and fisheries products and processed foods) and to the specific
duties protecting the textile and clothing sectors.
India-Bangladesh cooperation in other areas The suggestions above that both India and
Bangladesh would obtain greater and more secure economic benefits by giving priority to unilateral trade
liberalization on a multilateral basis, rather than by pursuing free trade arrangements, does not mean that
other cooperative endeavors should be neglected. In particular there would be substantial benefits from
coordinated improvements in the transport, storage and administrative infrastructures at and adjoining the
India-Bangladesh land borders, as well as in harmonization and cooperation in Customs administration
and banking relationships. As well as facilitating bilateral trade and reducing its cost, this would help
reduce black economy activities in both countries associated with both the “bootleg” and “technical”
smuggling routes, and improve fiscal resources, especially in Bangladesh. Finally, there is little doubt that
regional cooperation in energy and infrastructure could yield dividends in terms of cross-border
investments and joint ventures.
xxix
KEY MESSAGES
•
India is by far the largest single source for Bangladesh’s imports (15% of total in FY05), ahead
of China and Singapore. Bangladesh’s perennial large bilateral trade deficit with India might be a cause
for concern but it has not led to any balance of payments problem for Bangladesh as consistent trade
surpluses with such trading partners as US and EU compensate for these deficits.
•
Movements in bilateral real effective exchange rates (REER) could significantly impact trade
flows. There is strong evidence that appreciation of bilateral Taka/Indian Rupee REER contributed to the
expansion of both formal and informal Indian exports to Bangladesh, while retarding the growth of
Bangladesh exports to India, during most of the 1990s.
•
Indian exports face import weighted Bangladesh tariffs of about 29%, suggesting that they
compete favourably with imports from the rest of the world. Though protection remains high with paratariffs being imposed on top of custom duties, India is able to export a wide range of products to
Bangladesh covering all but 4 of the 98 HS chapters. Bangladesh granted few – mostly symbolic -- tariff
concessions to India under SAPTA.
•
India’s specific tariffs on Bangladesh’s major exports (RMG) make it difficult for such exports
to penetrate the Indian market. Though industrial tariffs in India are now mostly at 15%, most
Bangladesh exports face 7.5% tariffs under SAPTA. Yet exports are negligible suggesting they face stiff
competition from domestic production and ROW exports.
•
Bangladesh exports a miniscule (<1%) share of India’s imports, a negligible share (1%) of its
own exports, and a small range of products (fertilizer and jute goods made up two-thirds of exports).
Bangladesh exports might have been restrained by (a) faster productivity growth in India bolstering its
comparative advantage in competing goods, and/or (b) tariff and non-tariff barriers constraining
Bangladesh’s major exports (RMG) or minor exports, which have experienced rapid growth elsewhere.
India uses WTO-compliant measures – e.g. anti-dumping, standards – for “contingent” protection which
could pose as non-tariff barriers to imports from Bangladesh.
•
The large volume of informal/illegal trade remains a problem magnified by poor logistics and
infrastructure at land border posts that prompts higher transaction costs for formal imports. Cross-border
and technical smuggling are further encouraged when both India and Bangladesh restrict imports over
land border via designated ports.
•
Informal trade is substantial but difficult to measure because of its clandestine nature.
Informal and illegal trade between India and Bangladesh, by some estimates, could be as high as three
quarters of recorded trade. It is mostly one way -- from India to Bangladesh. Quite apart from the wellknown cross-border informal trade, this study notes the existence of significant volumes of illegal imports
into Bangladesh through legal channels (technical smuggling) by under-invoicing, misclassification, and
bribery of customs.
•
The study finds that preferences for formal trade will be influenced by the levels of Bangladesh
protective tariffs, rigor of customs administration, and the state of infrastructure at border posts (roads,
storage, technical and administrative capabilities). To reduce informal/illegal imports, both countries need
to (a) improve infrastructure – physical and administrative – at land border customs posts; (b) streamline
and harmonize customs procedures and administration; (c) expand facilities at smaller customs border
xxx
posts; and (d) for Bangladesh, bring down the high protective tariffs. Trade Liberalization Programme
under SAFTA could facilitate this process.
•
Trade financing is weak and transaction costs remain high. A sub-components of this study on
the financing of India-Bangladesh trade points out that the hawala networks perform better than the
formal banking system in terms of simplicity, speed, transaction costs, and reliability, and that for these
reasons they are not only financing much of the informal bootleg smuggling trade from India to
Bangladesh, but also substantial parts of the exports to Bangladesh that go through the legal routes. In
practice, “the LC is a mere cover to move goods through Customs”, finds this study. If this is correct, they
involve non-negligible transaction costs without protecting the suppliers and importers against
commercial risks such as defective shipments, non-payment, delayed payments etc.
Though SAFTA has been signed and ratified by the two countries, the possibility of a bilateral
FTA between India and Bangladesh has been mooted and pursued with more or less vigour at different
times. The economic implications of such an arrangement have not been clearly spelled out in the public
discourse. The present study develops a methodology, by using industry case studies, to quantify the
economic welfare implications of an FTA between the two countries.
•
Free trade agreements discriminate against imports from rest of the world (ROW) and, in so far
as the imports from the ROW countries that are excluded are traded at lower prices than the imports from
the FTA countries, there is an economic welfare loss for the FTA members, and also an economic loss for
the ROW exporters who lose their markets. These trade diversion effects need to be allowed for in any
comprehensive evaluation of the costs and benefits of FTAs.
•
For the few industry case studies simulated (cement, light bulbs, sugar, readymade garments) the
likely effects of an FTA, for the first three, seem to be an expansion of Indian exports to Bangladesh, but
no exports from Bangladesh to India. This was mainly because Indian export prices for these products
were substantially lower than ex-factory before-tax prices of the same or similar products in Bangladesh.
The simulations for ready made garments predict increased Bangladesh exports to India, but also
increased RMG exports from India to Bangladesh.
Policy implications of FTA
•
For Bangladesh: Consumer welfare gains far outweigh losses in government revenue or
producer surplus, provided infrastructure and administrative capacities are expanded at the borders. Yet,
welfare gains could vanish if, after getting a captive protected market under an FTA, Indian producers
collude amongst themselves or with Bangladeshi importers. Bangladesh would be better served in
pursuing similar welfare gains from multilateral liberalization.
•
For India: India’s trade with Bangladesh is rather small relative to its total trade such that the
economic welfare gains from an FTA are modest, largely stemming from gains in producer surplus due to
expanded exports. India stands to gain from the continuation of its policies of unilateral liberalization
paying special attention to the removal of non-tariff barriers, specific duties on textiles and garments, and
prohibitive tariffs on agricultural products.
•
India-Bangladesh cooperation in other areas. FTA or not, the study finds substantial benefits
from coordinated improvements in the transport, storage and administrative infrastructures at and
adjoining the India-Bangladesh land borders, as well as in harmonization and cooperation in Customs
administration and banking relationships.
xxxi
Introduction
The trading relationship between India and Bangladesh is currently of special interest in both
countries for a number of reasons. Firstly, there are urgent and longstanding concerns in Bangladesh
arising from the perennial, large bilateral trade deficit with India, and from the large volumes of informal
imports from India across the land border which avoid Bangladesh import duties. These concerns have
been particularly acute on the Bangladesh side in the context of discussions between the two governments
of the possibility of a bilateral free trade agreement along the lines of the India-Sri Lanka FTA. Secondly,
even though (because of the disparity in the size of the two economies) India’s trading relationship with
Bangladesh is much less significant for it than it is for Bangladesh, closer economic integration with
Bangladesh is nevertheless seen as a very important way of reducing the economic and political isolation
of the seven Indian eastern and north eastern states from the rest of the country. Finally, both countries
have long shared common objectives for closer economic integration within the South Asia region, and
these have recently been reemphasised by signing on to SAFTA 4 , which takes effect from January 2006.
Under SAFTA, the preferential tariffs agreed in the various rounds of SAPTA 5 -so far largely ineffective
in generating much intra-regional trade- will continue, but a number of ambitious new objectives have
been enunciated. These include the eventual elimination of tariffs and non-tariff barriers on trade between
the members, the harmonisation of Customs procedures and documentation, the facilitation of banking
relationships, and cooperation and improvements in the infrastructure for regional trade.
This paper summarizes and attempts to draw out and synthesize some of the main conclusions of
a series of consultant papers on various aspects of the trading relationship between India and Bangladesh.
The consultant studies cover the following topics:
• A comparison and analysis of Indian-Bangladesh trade using official statistics, and other
statistical sources and publications, including a summary of existing studies of informal IndiaBangladesh trade
• The collation of information on a sample of products and industries in India and Bangladesh in
order to assess the potential for trade between the two countries (e.g. under an FTA)
• Smuggled imports from India in Bangladesh (both “bootleg” and “official” smuggling)
• A paper on a partial equilibrium empirical methodology for simulating the economic welfare
consequences of an India-Bangladesh FTA at the level of individual industries
• Case studies of a number of industries applying the economic welfare methodology and
providing illustrative quantitative simulations of changes in economic welfare summarized as
changes in consumer welfare (consumers’ surplus), producer welfare (producers’ surpluses) and
government revenues. These changes are estimated separately for both India and Bangladesh, and
the likely impacts on other countries (the rest of the world) are considered but not quantified.
• Some aspects of the transport, regulatory and transaction costs of Indian exports to Bangladesh
through the principal land border crossing at Petrapole-Benapole.
The study program originally also included a component which involved a summary and
overview of the current situation on trade policy in each of the five principal South Asian countries (India,
Pakistan, Bangladesh, Sri Lanka and Nepal) plus Bhutan and Maldives. This component became a major
separate task, the results of which were published in a three volume World Bank report in September
4
5
South Asia Free Trade Area. Under the Trade Liberalization Program of SAFTA, India pares down its tariffs to
0-5% by 2013 while Bangladesh has until 2016 to do the same, subject to exclusion of sensitive lists (India’s
763 tariff lines versus Bangladesh’s 1254, at the 6-digit level).
South Asia Preferential Trade Agreement. SAPTA and the other South Asian preferential trade agreements are
discussed in the World Bank trade policy Overview report (Vol II, Ch 5).
1
2004 (Trade Policies in South Asia: an Overview) and which were discussed in a series of workshops in
the region. The sections of the trade policy Overview report which deal with trade policies in India and
Bangladesh, are important background for understanding the India-Bangladesh trade and trade policy
issues that are discussed in the various consultant studies, and will be frequently referred to in this paper.
The rest of this paper is organized as follows. Section 2 deals with trends in India’s and
Bangladesh’s real exchange rates and in their bilateral merchandise trade, to provide a broader
perspective to the following more detailed discussion. Section 3 provides a brief update of the sections in
the trade policy Overview report, on recent developments in India’s trade policies, and this is followed in
section 4 by a somewhat more extensive update of Bangladesh’s trade policies. The key points that
emerge from these sections are that whereas trade liberalization has had an energetic revival in India over
the past three years, in Bangladesh trade policy reform slowed and in some key respects (mainly because
of the increasing use of para-tariffs on top of Customs duties) the system remains as or more distortive
than it had been 10 years before in the mid-1990s. Section 5 then summarizes some of the principal
findings of the comparisons of the Indian and Bangladesh trade statistics and their implications for
policies and trade administration, especially Customs administration. Section 6 discusses the nature and
economic role of India’s exports to Bangladesh and the likely effects of an FTA or substantial tariff
preferences, and section 7 discusses Bangladesh’s exports to India and the prospects for expanding them.
This is followed by a summaries of the findings of the consultant studies on informal/illegal trade (section
8) and trade financing and trade logistics (section 9), and by an outline and interpretation of the economic
welfare simulations of the industry case studies (section 10). The concluding section 11 summarizes
some of the principal findings of the consultant studies that seem relevant for trade policies in India and
Bangladesh, including especially policies on preferential regional trade and SAFTA, and suggests some
priorities for further study and research.
2
Chapter 2: Background: bilateral trade and exchange rates
19
91
19
92
19
93
19
94
19
95
19
96
19
97
19
98
19
99
20
02
20
03
20
04
In 2004 India’s officially recorded exports to Bangladesh were about $1.7 billion but its imports
from Bangladesh were just $78 million. Indian exports to Bangladesh grew very rapidly during the 1990s,
and have continued to grow since 2000 (Fig 2.1). By contrast Bangladesh exports to India-almost zero in
the early 90s-have stagnated at very low levels
Fig 2.1
at well below $100 million annually. In
Recorded India-Bangladesh Trade 1990/01-2003/04
inflation adjusted US dollars they are presently
about the same as they were 20 years ago 1800
during the 1980s. Since 1996/97 Indian exports 1600
1400
to Bangladesh (in nominal US dollars) have 1200
been growing at 9.1% annually, just slightly 1000
800
above the general rate of growth of its total
600
merchandise exports (8.4%), but India’s
400
imports from Bangladesh over the same period
200
have grown on average at only 3% annually,
0
compared to average growth of its total imports
of 9.2%. Consequently Bangladesh’s bilateral
trade deficit with India has been increasing
Indian Exports to Bangladesh
Indian Imports from Bangladesh
rapidly, on average at about 9.5 % annually.
3
Fig 2.2
Shares of recorded trade with Bangladesh in India's total trade
3.5
3
2.5
2
1.5
1
0.5
Exports
Total
03
-0
4
20
02
-0
3
20
01
-0
2
20
00
-0
1
20
99
-0
0
19
98
-9
9
19
19
97
-9
8
96
-9
7
0
19
%
For
India,
trade
with
Bangladesh is a very small part of its
total trade-just over one percent since
the mid-1990s, and currently about 3
percent of its total exports and a
miniscule share (0.01%) of its total
imports (Fig 2.2). For Bangladesh
(Fig 2.3) however, India has now
become the largest single source of its
imports (about 16% of the total, ahead
of China and Singapore) and accounts
for about a tenth of its total trade,
despite exports to India which have
declined to only slightly above 1 % of
total exports.
Imports
Fig 2.3
Most Bangladesh imports
6
Shares of trade with India in Bangladesh's total trade
from India come via the land border .
18
According to incomplete Bangladesh
16
data, during the 1990s about three
14
quarters of imports were by land and
river, but this proportion has declined
12
since then to between 50 and 60
10
percent (Fig 2.4). These statistics do
8
not include duty free (“back to back
6
L/C”) imports from India of inputsmainly textiles-for Bangladesh’s
4
export industries, but most of these
2
probably also come by the land
0
border. One reason for the decline in
1997
1998
1999
2000
2001
2002
2003
2004
the share of the land border trade is a
Share
of
imports
Share
of
total
trade
Share
of
exports
requirement imposed by Bangladesh
Based on statistics of trade with Bangladesh from Indian statistics (indian fiscal years)
in July 2002 that two major imports
compared with total Bangladesh trade from Bangladesh statistics (for Bangladesh fiscal years)
from India-sugar and textile yarnscould henceforth only be imported by sea. The reason given for these measures was the control of illegal
activities and smuggling at or near the land border Customs posts, and immediately afterwards there was
a big jump in officially recorded imports of sugar from India which presumably came by sea 7 . However, a
more basic reason for the decline in the share of the land border trade is increasing congestion and delays
at the land border crossings-especially at Petrapole-Benapole-as a result of inadequate infrastructure and
administrative capacity on both the Indian and the Bangladesh sides, in the face of rapidly increasing total
volumes of trade.
Studies of informal trade between India and Bangladesh have consistently found a similar pattern
to the pattern of formal trade i.e. large volumes of goods being smuggled from India to Bangladesh, but
much smaller volumes being smuggled in the other direction. This general conclusion that there is also a
substantial Indian trade surplus on informal account, is confirmed once again in the studies done as part of
this project.
6
7
We were unable to obtain equivalent statistics on the land/sea breakdown of Bangladesh exports to India.
There is no product breakdown of the land border and sea trade. The consultant studies did not report Indian
statistics distinguishing the land and sea trade with Bangladesh
4
20
00
19
99
19
98
19
97
19
96
19
95
19
94
19
93
19
81
19
82
19
83
19
84
19
85
19
86
19
87
19
88
19
89
19
90
19
91
99
92
19
93
19
94
19
95
19
96
19
97
19
98
19
99
20
00
20
01
20
02
20
03
20
04
Index 1990=100
19
92
In the past, a major
Fig 2.4
reason for the expansion of
Bangladesh imports from India FY 1992-2004:
Indian exports to Bangladesh
distinguishing land border from sea and air routes
800
(and also to the other South
Asian countries) was the
700
massive devaluation of the
600
Indian Rupee, which started in
about 1985 and finished in 1992.
500
The Rupee devaluation (Fig 2.5)
400
up to 1992 supported India’s
300
trade liberalization during this
period, and is best interpreted as
200
a return to a more normal and
100
economically efficient situation,
following many years of
0
extreme
exchange
rate
overvaluation, during which
By sea and air
By land and river
India’s exports to the world as a
Note: data is for Bangladesh fiscal y ears. It excludes indian duty free exports used as
whole, including the other South
inputs by Bangladesh exporters ("Back to Back LC imports") and imports through some
small land border customs posts.
Asian countries, were taxed and
compressed. Since 1992 the real
value of the Rupee (as indicated
Fig 2.5
India Real Effective Exchange Rate Index 1980-2004
by the Rupee REER index) has
(Annual averages 1990=100: Increase=devalutaion)
been kept at approximately the
150
same level, with adjustments of
140
the nominal exchange rate
130
120
offsetting differences in inflation
110
in India and average inflation in
100
its trading partners. While this
90
was happening, the real value of
80
the Bangladesh Taka (Fig 2.6)
70
60
moved within a fairly narrow
50
band of about 10% around trends
40
of slow devaluation from 1980
30
up to 1996, modest appreciation
20
from 1997 to 1999, followed by
10
0
slow but steady devaluation
which was still continuing in
early 2005. The strength of the
Calendar Year
Taka since the mid-1980s has
reflected the strong growth of ready made garment exports and of remittances from Bangladeshis working
outside the country, which together have been sufficient to balance increases in imports resulting from
import liberalisation measures, especially the removal of many QRs and the reduction of tariffs in the
early 1990s. However, one consequence of the relatively stable Taka alongside the devaluation of the
Rupee between 1985 and 1992, was that the Taka/Rupee rate appreciated in real terms by about 30% (Fig
2.6). This appreciating trend of the real Taka/Rupee exchange rate continued at a slower pace until, in
1999, the total real appreciation of the Taka in relation to the Rupee was about 50%, compared to its
value in the mid 1980s. Since about 1999, this trend has been reversed, with the real Taka/Rupee
exchange rate devaluing on average at about 4 % per year, about the same as the average rate of real
devaluation of the Taka viz a viz the rest of the world.
5
19
80
19 0
8
19 2
8
19 3
84
19
8
19 5
8
19 6
87
19
8
19 8
8
19 9
9
19 0
91
19
9
19 2
9
19 3
9
19 4
95
19
9
19 6
9
19 7
98
19
9
20 9
0
20 0
0
20 1
02
20
0
20 3
04
The
persistent and
Fig 2.6
substantial appreciation of the real
Bangladesh Real Exchange Rate Indices 1980Taka/Rupee exchange rate from
2004
160
the mid-1980s up to about 1999,
150
140
combined with Bangladesh’s
130
liberalization of its import
120
policies, are plausibly important
110
100
reasons for the expansion of
90
recorded formal Indian exports to
80
70
Bangladesh over this period.
60
Conversely, the Taka appreciation
50
Taka/Indian Rupee Index
REER index (total trade)
would have retarded the growth of
40
30
formal, recorded Bangladesh
20
exports to India during the same
10
0
period. However, as noted above,
recorded Bangladesh imports
from India have grown even more
Calendar year
rapidly since the exchange rate
trend was reversed after 1999, and Bangladesh exports to India have continued to stagnate. This is
consistent with observations in a number of the consultant studies that efficiency and productivity have
been growing in India, especially in Indian manufacturing, resulting in an acceleration of general export
growth, a very small part of which has consisted in rapid growth of exports to Bangladesh. Faster
productivity growth in India would have also increased the difficulty of Bangladesh exports competing
there, offsetting the favourable trend in the exchange rate since 1999. This is also consistent with the
consultant studies, which for a sample of products found that most prices-especially prices of
manufactured goods-were markedly higher in Bangladesh than in India.
Rupee devaluation and faster productivity growth in India would also tend to increase informal
Indian exports to Bangladesh, while retarding informal Bangladesh exports to India. However, in this
case import liberalisation would be expected to divert some of the growth of informal trade into formal
channels. There is support for this latter hypothesis in the study on informal trade, which finds that
informal imports from India had somewhat declined in absolute terms compared to informal imports
estimated by earlier studies, but were markedly lower relative to the total volume of formal recorded
imports from India.
In popular discussions of economic policy in Bangladesh, some groups see the bilateral trade
deficit with India as a problem, and use it to argue against both general trade liberalisation, and
preferential or free trade with India. However, the trade deficit with India has been consistently offset by
trade surpluses with other countries, especially with the US and the EU, and by worker remittances. These
surpluses have in turn supported the exchange rate of the Taka with other currencies, including the
Taka/Rupee rate, and have both enabled, and have been a consequence of, macroeconomic policies which
have avoided destabilizing fluctuations in the balance of payments, domestic prices and the exchange rate.
As in other countries, there is no economic logic in the idea that trade should be balanced with individual
trading partners, and the real concerns behind contrary arguments are usually efforts to prevent or
moderate import competition. 8
8
Bangladesh also consistently runs large trade deficits with developing countries in East and South East Asia. In
this respect the Bangladesh public debate on trade which focuses on the trade deficit with India, resembles the
US public discussions on the US bilateral trade deficit with China.
6
Alongside popular concerns in Bangladesh about the trade deficit with India, it is also often
argued that the deficit is aggravated by protectionist policies that have hobbled Bangladesh exports to
India. However, as noted above, for the past 8 years India’s imports from the world as a whole have been
growing at over 9 percent a year: on average, each year’s increase in imports has been exceeding
Bangladesh’s total exports. Many of these imports have been coming in over considerably higher tariffs
than the tariffs faced by Bangladesh exporters, owing to the extensive tariff preferences given to
Bangladesh by India under SAPTA, and to the extent that there are non-tariff and bureaucratic barriers,
they are probably more constraining than the ones that Bangladesh would face 9 . This suggests that the
low level and slow growth of Bangladesh’s exports to India reflect fundamental comparative advantage
factors, not discriminatory import policies.
This issue is also considered in the consultant studies in the light of what is likely to happen were
there free trade between India and Bangladesh. The general finding of the studies is that some aspects of
India’s import regime are retarding Bangladesh exports, but that in the short and medium run the potential
for expanded exports to India is not very great, even under an FTA or with the full implementation of
SAFTA. On the other hand the studies also find very recent and strong protectionist trends in
Bangladesh’s import policies which are a major constraint on Bangladesh imports in general and which, if
still enforced against the rest of the world during an FTA with India, would lead to a large expansion of
imports from India and an increase in Bangladesh’s bilateral trade deficit.
9
An example is Indian anti-dumping, which has been concentrated on developing countries, especially China and
other East and South East Asian countries. For the products which it affects, it provides protection in the Indian
market for exporters in countries not subject to anti-dumping duties. See further discussion in section 3 below.
7
Chapter 3: India’s trade policies
There is a detailed description and analysis of India’s trade policies in the World Bank trade
policy Overview report. This section summarizes and updates some of the principal findings of that
report, and expands on some aspects that relevant for India’s trade with Bangladesh.
Non-tariff barriers to imports. During the 1980s and before India had a comprehensive import
licensing system under which imports of many products were effectively banned and most others were
subject to stringent import licensing. The principal exceptions were inputs needed by exporters and a
number of “essential” products such as foodgrains, that could only be imported by government import
monopolies. The restrictions on imports of raw materials and manufactured intermediates were removed
during India’s 1991/92 reforms, but imports of nearly all industrial consumer goods and agricultural
products continued to be restricted, either by import licensing which operated as a de facto import ban in
most cases, or-especially in the agricultural sector- by “canalisation” through parastatals such as FCI.
Among other things these import restrictions hobbled SAPTA, especially in the first two negotiating
rounds in 1995 and 1997, when the other South Asian countries complained that it was meaningless for
India to grant tariff preferences when the same products were subject to import licensing. In response to
these complaints, in 1998 India exempted the SAARC countries from its general system of import
licensing. At about the same time (following pressure at the WTO) it started removing these controls viz a
viz the rest of the world, and the final 715 tariff lines were freed on April 1, 2001.
Against a background of almost 40 years of de facto autarchy, the abolition of this comprehensive
import licensing system created considerable apprehension as to how well local producers of industrial
consumer goods and of agricultural products would be able to compete with imports. Partly because of
this apprehension, after the Uruguay Round, India made sure that it implemented all the WTO-compatible
procedures that allow non-tariff restrictions to be applied to imports. These include in particular,
government-mandated import monopolies or State Trading Enterprises (STEs), tariff rate quotas (TRQs)
applied to a number of agricultural commodities, technical standards and regulations implemented by the
Bureau of Indian Standards (BIS), sanitary and phyto-sanitary (SPS) rules mainly applied to agricultural
and food products, other health and safety regulations, and anti-dumping. In May 2001 a “War Room”
was established in the Ministry of Commerce, and a list of 300 “sensitive” consumer products was
published, imports of which were subsequently regularly monitored so as to be able to take prompt action
to pre-empt or minimize disruption caused by imports to local producers,
During the past few years, discussions of trade and other policies in India have begun to
recognize that the earlier concerns about the ability of local producers to compete without protection from
the import licensing system and/or from high tariffs were vastly exaggerated, and there is new confidence
in the competitiveness of Indian producers, as evidenced by rapidly growing exports and foreign
exchange reserves, and faster overall economic growth. Along with these new perceptions, there are signs
of some consequent relaxation of the vigilance with which the various non-tariff protective measures are
being pursued 10 . These changed attitudes have also underpinned the dramatic reductions in industrial
tariffs which started in 2002/03 and are described below.
10
For example, the “sensitive list” of products has been removed from the Ministry of Commerce (DGFT)
website, reportedly because (for most products on the list) despite tariff reductions, there have been few imports
to monitor. In addition, some important products (notably a number of steel products) have been omitted from
the list of products requiring compulsory BIS certification, and anti-dumping activity appears to have slowed.
9
Average tariff %
140
130
120
110
100
90
80
70
60
50
40
30
20
10
0
Fig 3.1
India 1990/91-2005/06: Unweighted Average Tariffs
19
91
19
92
19
93
19
94
19
95
19
96
19
97
19
98
19
99
20
00
20
01
20
02
20
03
20
04
20
05
20
06
Customs clearance at land
border Customs posts India has 83
Customs posts on its land borders
with Bangladesh. All except three
are formally authorized to clear all
kinds of exports and imports 11 .
This contrasts with Bangladesh’s
land border Customs posts, only
four of which have unrestricted
clearance powers for imports from
India (see section 4 below).
Whether all of the Indian Customs
posts actually have the capacity
for unlimited clearance is another
matter, since legal exports of
many Indian products are obliged
to go by the few land border
crossings-especially
PetrapoleBenapole-at
which
the
Bangladesh customs posts are
authorised to clear them.
Averages over all tariff lines, including para-tariffs as well as Customs duties until last para-tariff
was removed in 2004/05. Estimates for FY 199292 & FY 2001 not available
50
45
40
35
30
25
20
15
10
5
0
Fig 3.2
India: trends in average tariffs 2002/03 -2005/06
Tariffs. As well as
removing QRs from intermediates
and capital goods, the 1991/92
reforms reduced tariffs and preannounced a tariff reduction
program. Under this program
tariffs came down steadily from
prohibitive levels at the beginning
(average
almost
130%
in
1990/91) to much lower levels
2003
2004
2005
2006
(average about 35%) in 1997/98
All tariff lines
Non-agriculture
Agriculture
(Fig 3.1). Then, in large measure
Unweighted averages. Includes protection from para-tariff (Sadd) which abolished in 2004/05.
to compensate for the removal of
"Agriculture"=HS 01-24; "non-agriculture"=HS 25-99
the consumer good QRs, during
the following four years this downward move was reversed and tariffs went up. In 2000, this upward
trend was supplemented by the introduction of prohibitively high specific tariffs to protect textile fabric
and garment producers.
However, only a year after the final removal of import licensing, a new tariff reduction process
started in 2002/03. This new program focussed on industrial tariffs. There were three major omissions:
• Agriculture, livestock, fisheries and processed foods (HS 01-24)
• Textile fabrics and clothing products, about half of which continue to be protected by specific
tariffs
• A few important manufacturing sectors, notably the auto and fertilizer industries
11
Customs notification No 63/94-Cus.(N.T)
10
Tariff
<15%
15%
>15%
Specific & >15%
12
13
14
15
c
0
>1
0
ec
ifi
Sp
55
-1
00
35
-5
0
30
25
20
15
10
5
0
Percent pf total tariff lines
For most industrial goods,
Fig 3.3
there was an especially large tariff
India 2005/06
reduction in 2004/05 resulting from
Distribution of tariff lines
a cut in the generally applied
100
maximum
Customs
duty
90
accompanied by the abolition of
80
the Sadd 12 , the one remaining para70
tariff 13 . This was followed by a
60
further cut in the maximum
50
industrial tariff to 15% in 2005/06,
40
and to 12.5% in 2006/07. Without
30
counting the specific textile and
20
10
clothing tariffs, during the four
0
years average industrial tariffs fell
by more than half to 15.3%.
Moreover, the compression of
Tariff rate %
tariffs as the ceiling came down
All tariff lines
Non-agriculture
Agriculture
greatly reduced their variance:
before allowing for the specific
tariffs, 90 percent of industrial tariffs are now 14 at 15% (Fig 3.3), far lower and far more uniform
than they have ever been in the past 50 years. Even after allowing for the specific textile and clothing
tariffs and assuming that these all involve ad valorem equivalent rates in excess of 15%, almost 85% of
industrial tariffs are at the uniform 15% rate. Moreover, the decline in the maximum tariff has made large
numbers of ad hoc reductions for particular users or uses irrelevant, and has been accompanied by major
simplifications of the tariff schedule in which many of these have been eliminated 15 . For many Indian
manufacturing industries, with their domestic sales protected by a 15% tariff against imports, and buying
from domestic suppliers also protected by 15% tariffs or importing inputs over a 15% tariff, effective
protection to their processing margins in the domestic market is also around 15%, far lower than the
effective protection rates that were generally available from the tariff structure only three or four years
ago, and only slightly above the processing margins available from exporting. Consequently, relative to
selling in the domestic market, exporting is now much more attractive for Indian firms than it was even in
the recent past. From the perspective of SAARC countries including Bangladesh, these changes mean that
Indian domestic markets for most manufactured goods are highly competitive, with prices that are close to
world prices, and are likely to be difficult to penetrate even with complete exemption from Indian tariffs
under bilateral or multilateral free trade arrangements such as those planned under SAFTA.
% share of 10,558 non-agricultural
tariff lines (HS 25-99)
4.3
84.6
5.3
5.8
Special additional duty: prior to its abolition, 4% of the assessable value of an import plus Customs duty plus
additional duty
A very small “education cess” equal to 2% of (Customs duties plus additional duties) was introduced in July
2004. With a Customs duty of 15% and the normal 16% additional duty, this is equivalent to 0.67% of the cif
price. It is ignored in the rest of this paper
In fiscal year 2006/07, 90 percent of industrial tariffs are at 12.5%.
In particular, many items have been removed from the annual “Jumbo” exemption notification. As discussed in
the trade policy Overview report (Vol II, p.41), these ad hoc exemptions and partial exemptions have long been
a source of complexity and opacity in Indian trade policies.
11
In contrast to industrial tariffs, tariffs on “agricultural” products (defined in the broad sense to
include fisheries, livestock and livestock products, agricultural products and processed foods) were left
out of the new tariff reduction program: they came down just a bit in 2004/05 but in 2005/06 on average
they were about 40%, almost three times the level of non-agricultural tariffs (Fig 3.2). They are also much
more dispersed than industrial tariffs (Fig 3.3): just over three quarters are at 30%, but there are many
very high tariffs, with 13.7% of the total tariff lines subject to tariffs of between 50% and 100%, and
2.1% of tariff lines with tariffs well over 100%. As in Bangladesh (see discussion in the next section)
there are high tariffs protecting domestic production of processed foods, and also therefore this section of
the manufacturing sector.
HS chapter
04
15
16
17
18
19
20
21
Processed food products included in the HS chapters
Dairy products, eggs, honey etc
Animal & vegetable fats and oils etc
Preparations of meat, fish, crustaceans etc
Sugar and sugar confectionery
Cocoa and cocoa preparations
Preparations of cereals, starch or milk; pastry cook products
Preparations of vegetables, fruits, nuts, etc
Miscellaneous edible preparations
Average of 8 processed food chapters
Average
tariff %
34.1
75.5
34.1
35.4
30.0
31.2
30.2
30.0
37.6
In addition government import monopolies have continued for all the foodgrains except maize and barley,
and tariff rate quotas are used to regulate imports of powdered milk, maize, crude sunflower and
safflower oils, and refined rape, mustard, colza and mustard oils. Hence, in these sectors there are
extensive barriers against import competition, even though (as discussed in the trade policy Overview
report 16 ) domestic prices of many agricultural commodities-including for example the principal food
grains and sugar-in most years are not very different from world prices.
Tariff rate %
Specific duties protecting the textile and garment industries Just before the withdrawal of import
licensing
from textiles and
Fig 3.4
garments in April 2001, the
India
2004/05:
Ad
valorem
equivalents of specific tariffs
government imposed specific duties
on
cotton
shirts
according
to cif import price of the shirt
on a large number of textile fabrics
70
and garments, in order to protect
60
domestic producers against low
price import competition. The
50
specific duties are applied to
40
approximately 41% of the fabric
and clothing tariff lines in the
30
textile and clothing HS chapters
20
(chapters 50-63) 17 . At present these
tariffs are the greater of the standard
10
15% rate, or the specific amount
0
(usually Rupees per metre of per
kg, or per garment). The ad valorem
3
4
5
6
7
8
9
10
MFN tariff
Preferential tariff
equivalent of these duties varies
CIF price per shirt $US
with the cif price: for example (see
16
17
See especially Vol III, pp 10-12.
For more on the India’s specific tariffs, see the chapter on textiles and garments in the trade policy Overview
report (Vol III, Ch 3, pp 63-64 and Appendix tables)
12
Fig 3.4) for a man’s cotton shirt, at prevailing world prices of $3 to $4 per shirt, it is equivalent to an ad
valorem MFN tariff of between 63% and 47%: only for luxury brands selling at well over $10 cif per shirt
would the 15% ad valorem become the operative tariff. This system was designed to make it impossible
or very difficult for other developing countries with strong textile and garment industries to compete in
India. It also has the effect of excluding the products to which the specific duties are applied, from
subsequent reductions in ad valorem tariffs. For example (Fig 3.5) between 2000/2001 and 2005/20006
the ad valorem equivalent of the specific duty on a $4 man’s shirt has remained at or just slightly below
50% since 2001/02, even though the regular ad valorem tariff on the shirt went down from about 45% to
15% during the same period.
Tariff rate %
Ready made garments are Bangladesh’s principal export, and these specific tariffs in India are of
special concern to it in the context of regional trade arrangements including SAPTA and SAFTA. The
SAPTA preferences are applied to specific as well as ad valorem duties, but-as is the case with the MFN
duties-the ad valorem equivalents for standard low price imports are much higher than the preferential ad
valorem rates, and their use has also excluded the products to which they are applied from India’s general
tariff reduction programs (as illustrated in Fig 3.5). To continue the example of mens’ cotton shirts,
without the specific duty the
Fig 3.5
preferential tariff for Bangladesh
India: ad valorem equivalent of specific MFN tariff, and SAPTA
would be 7.5%, but in 2004/05
90
the preferential specific tariff
80
was equivalent to an ad valorem
70
tariff of 31.6% on a $3 shirt, and
to a tariff of 23.7% on a $4 shirt
60
(Fig 3.4). As discussed in the
50
case study of the RMG industry,
40
given the low margins between
30
fabric costs and garment export
prices, tariffs at this level make it
20
very difficult for Bangladesh
10
RMG exporters to compete in
0
India
1999/00 2000/01 2001/02 2002/03 2003/04 2004/05 2005/06
MFN tariff
70
Fig 3.6
India 1996/97-2005/06 Example of a typical industrial
tariff . MFN rate and preferential SAPTA rate for
B
l d h
60
50
Tariff %
India’s
SAPTA
preferences for Bangladesh ,
Nepal, Bhutan and Maldives are
“less
developed”
(LDCs)
members of SAPTA, and the
more
developed
members
(India, Pakistan and Sri Lanka)
can extend tariff preferences to
them without being obliged to
extend the same preferences to
the other more developed
members. At present India has
given preferences to Bangladesh
on approximately 2925 tariff
lines, about 58% of the total
number of its approximately
Preferential tariff
40
30
20
10
0
1997 1998 1999 2000 2001 2002 2003 2004 2005 2006
MFN tariff
13
Preferential tariff for Bangladesh
5000 6-digit HS lines 18 . Two thirds of these preferences were agreed in the third SAPTA negotiating
round and came into force during India’s 2000/01 fiscal year. A majority of the preferences are special
“LDC-only ” preferences: most of these are 50%, some are 60%, and a few 15%, 75% or 100%. The
others are preferences also given to the “developed” SAPTA members i.e. to Sri Lanka and Pakistan, and
most of these are less generous-10% or 15%: only a few are as high as 50%.
In India, the SAPTA preferences are applied to Customs duties (both ad valorem and specific) but
were not applied to the Sadd duty: consequently, before the Sadd was abolished in 2004/05, the
preferential protective rates for Bangladesh resulting from a typical 50% SAPTA preference, were in fact
more than 50% of the general MFN rate. The preferences are scattered through 53 of the 97 HS chapters,
so there are no SAPTA preferences for products covered by 44 of the 97 chapters. In practice Bangladesh
is the only relevant beneficiary of India’s LDC-only SAPTA preferences, since Nepal and Bhutan have
long had duty free access to the Indian market under their bilateral treaties, and the Maldives trade is
negligibly small (at least from India’s perspective). Therefore, in a sense, these preferences constitute a de
facto bilateral asymmetric preferential trade arrangement between India and Bangladesh, asymmetric
because many substantial preferences have been given by India, but for all practical purposes few and
negligible preferences for Indian imports have been given by Bangladesh (see discussion in the next
section).
In order to qualify for India’s SAPTA preferences, products imported from Bangladesh would
have to satisfy the SAPTA origin rule, which is that the cif value of non-SAPTA imported inputs included
in the exported product should not exceed 70% of the fob price, or put another way, that national value
added should be no less than 30% of the fob price. In this respect Bangladesh has an advantage over the
“developed” SAPTA members (India, Pakistan and Sri Lanka) for which the minimum value-added ratio
is 40%. Both were reduced (from 40% and 50% respectively) in November 2000, mainly in response to
complaints from the SAPTA members other than India, that the rules were too stringent. However, there
was already some built-in flexibility from a provision that excludes inputs obtained in other SAPTA
members in calculating the imported input ratios i.e. by in effect treating such inputs as part of the valueadded. As discussed in the case study of the ready made garment industry 19 , this provision is extremely
important for firms in Bangladesh wishing to export woven garments to India, because value-added
margins in cutting, sewing and assembling garments from imported fabrics are typically around 30% of
fob prices, and may be less. If these firms use fabrics imported from China or other non-SAPTA
countries, this limits their ability to compete in exporting to India, because if they cut their export prices
they may breach the rule of origin conditions and find that these shipments are subject to the higher MFN
tariffs in India, rather than the lower SAPTA preferential tariffs. To get around this constraint, they can
use imported Indian fabrics, even though they might not have done so if they had a free choice
unconstrained by this consideration 20 .
Fig 3.6 illustrates how India’s SAPTA preferences for Bangladesh have developed since 1996/97,
using the example of a typical industrial product subject to India’s general maximum Customs duty and
the para-tariffs that were applied up to 2003/04, and assuming a 50% tariff preference for Bangladesh
during 2000/01 and after. This example brings out a number of points that are relevant for interpreting
the stagnation of Bangladesh exports to India during this period.
18
19
20
Rajesh Mehta (op cit) p.8. These shares of tariff lines with SAPTA preferences were estimated using HS 6-digit
tariff lines. These have now been replaced in India with an 8-digit classification and the shares calculated on
this basis may have changed somewhat.
Garry Pursell (2005, March). Free Trade between India and Bangladesh? A Study of the Ready Made Garment
Industry.
In principle it would seem that Bangladesh woven garment exporters could also satisfy the origin rule by
importing fabrics from Pakistan. India and Pakistan are the only SAPTA members with substantial exportoriented textile industries.
14
•
•
Between 1996/97 and 1999/2000 there were relatively few products with preferences. Imports
from Bangladesh without preferences would have had to compete in India with domestic
producers after paying tariffs which ranged from just over 40% to almost 60% during these years.
Products with preferences (not indicated in the diagram) would have still been subject to tariffs
which varied between 20 and 30 percent during the period. For three of these years (1997/98,
1998/99, and 1999/2000) Bangladesh exporters of consumer goods were exempt from India’s
import licensing system and in this respect had a major advantage over exporters from nonSAARC countries, but it seems that the Indian tariffs (whether or not reduced by preferences)
were too high for them to take advantage of this opportunity
After 2000/01 there was a big increase in the number of products with tariff preferences for
Bangladesh, and this is illustrated in Fig 3.6 by the introduction of a preferential tariff for
Bangladesh in this year. Since 2000/01 both MFN tariffs and the corresponding lower preferential
tariffs for Bangladesh have steadily declined. From the viewpoint of Indian traders, this would
have made importing from both Bangladesh and the rest of the world more attractive, relative to
buying from local suppliers, with a substantial margin of preference for imports from Bangladesh.
However, up to 2003/04 only Indian imports from the rest of the world have been growing, not
Indian imports from Bangladesh, and this pattern was continuing in the first three quarters of
2004/05, when the MFN tariff for this representative industrial product was 20%, and the
preferential tariff for Bangladesh only 10%. As already noted, this suggests that the explanations
for the stagnation of Bangladesh exports to India have to do with comparative advantage and
supply side factors in Bangladesh, not lack of demand or protection in India.
Anti-dumping Anti-dumping (AD) is one of the WTO-legitimate measures that India introduced
during the 1990s, as a way of providing extra protection as its tariffs came down and its import licensing
system was dismantled. As of June 2004, 117 anti-dumping measures were in force affecting exporters in
29 different countries and 167 different products 21 . By the late 1990s and early 2000s, India had become
the world’s most active user of anti-dumping. However, there are recent indications that AD activity has
been slowing: the number of new cases brought during 2003/04 was 14 compared to 30 in each of the
previous two years 22 .
In the beginning the products affected by AD were almost all intermediate goods which had been
freed from QRs during the 1991/92 reforms, but Indian firms also began to bring AD cases against
imports of consumer goods after QRs were also removed from them between 1998 and 2001. There is an
extensive discussion of India’s anti-dumping policies and practice in the World Bank trade policy
Overview report 23 . Three major points made in that discussion are:
• Nearly all products that have been subjected to AD duties were being exported to India at
generally prevailing international prices. In a number of cases the Indian firms which obtained
AD protection were exporting the same products at the same prevailing international prices.
Whether or not that is the case is irrelevant for an AD finding: the only considerations are
whether there is a “dumping margin” and whether there is “injury” to domestic firms. A
“dumping margin” is defined as the excess of the product’s domestic price in the exporting
country, or the export price to third countries, over the export price to India.
21
22
23
India, Ministry of Commerce and Industry, Directorate General of Anti-Dumping and Allied Duties, Annual
Report 2003-2004.
This may have been influenced by EU objections (taken up at the WTO in December 2003) to Indian AD
procedures, and more generally by increasing confidence in India as to the international competitiveness of
Indian industries.
Op cit Vol II, pp 74-79.
15
•
•
The anti-dumping duties are applied to imports from individual exporting firms. They usually
vary from firm to firm and are imposed on top of normal import duties. In many cases the AD
duties are prohibitively high and effectively exclude the affected firms from the Indian market.
The texts of the AD cases make it clear that the AD duties imposed in early cases are intended as
a warning to exporters in other countries to charge “fair and reasonable” prices in exporting to
India. This intimidation factor may be more important in restraining import competition than the
direct effects of the AD duties that are actually imposed.
What is the relevance of India’s anti-dumping for India’s imports from Bangladesh? So far, there
have only been three cases involving SAARC countries, two in Nepal, and one in Bangladesh. The
Bangladesh case was finalized in December 2001, and involved Indian imports of lead acid vehicle
batteries from Japan, Korea, China and Bangladesh 24 . Anti-dumping duties were imposed on all imports
from the four countries, and in the case of the Bangladesh firm these were prohibitive and blocked all
subsequent exports to India. The Bangladesh firm did not provide what the Indian AD Authority
considered to be adequate information on its domestic prices and costs, and so the “dumping margin” was
estimated from the “best information available”, which as is usual in such cases, was data on the costs and
prices of the complaining Indian firms. However, the Bangladesh firm was protected by very protective
high tariffs in the Bangladesh domestic market. Using a supplementary duty, these were increased from
an already high level in FY 98, as follows:
FY 1998
FY 2001
FY 2003
FY 2004
FY 2005
47.2%
69.3%
75.3%
85.5%
72.2%
According to a spot check in Bangladesh in late 2003, actual domestic battery prices were
approximating world prices plus these tariffs. This suggests that had the Bangladesh firm provided its
domestic price and cost data in the form requested by the Indian AD Authority, the “dumping margin”
and the AD duty determined by the AD Authority may well have been even higher than the margin and
duties determined on the basis of Indian domestic costs and prices.
The key lesson from this case is that products which sell in Bangladesh at high prices made
possible by high tariffs and/or other protective instruments, and are exported at much lower international
prices-even if the latter are the prevailing normal prices in international trade-are vulnerable to antidumping actions of this kind. This is true generally for exports to all countries which have operative antidumping systems, even if the Bangladesh share in the importing country’s market is very small, if
Bangladesh is one of a number of countries that have a larger combined market share. In this regard it is
relevant to note that there is no provision in SAPTA that prevents members from taking AD action
against each other, and none has so far been envisaged for SAFTA.
As regards Bangladesh’s trade with India, the large number of Indian AD cases against exporters
in China and other countries, and (except for the acid battery case) the absence of AD actions against
Bangladesh exporters, is an advantage for Bangladesh exporters by sheltering them to some extent from
the competition of these other exporters. However, most probably this situation principally reflects the
absence of Bangladesh exports. Were they to expand, even if their shares in the Indian markets of
individual products were small, the exporting firms face the risk that they will be caught up in Indian AD
24
Details of the case are on the Indian anti-dumping authority website at
http://commerce.nic.in/adfin_leadbat.htm
16
actions mainly concerned about imports from other countries, as happened in the acid battery case. The
best strategy for reducing the likelihood that AD cases will be brought, and for minimising the damage if
they are, is to follow low protection policies in the domestic market. By following its present protection
policies with the almost automatic use of para-tariffs to provide very high protection levels (see section 4
below) Bangladesh is doing the opposite and increasing its vulnerability to AD actions in India and
elsewhere, if these protected industries begin to export.
Export policies India operates an extremely comprehensive set of export policies which have
been an outcome of many years of efforts to make remove or offset barriers and disincentives for exports
that were an inevitable by-product of its import substitution policies. 25 Two aspects of these policies that
are relevant for India’s trading relationship with Bangladesh in the context of a bilateral FTA or SAFTA
are the following:
• Rebates for exporters under duty neutralization schemes such as duty drawback and DEPB 26
have been substantially reduced during the past five years as tariff levels have declined. For
example, DEPB rates for exported garments which were 16% during 2002/03 had been
reduced to a range of between 3.2% and 8.5% in December 2004. As pointed out in the
RMG case study, these reduced DEPB rates mean that Indian domestic prices of exportable
garments (as well as of other exportables) are likely to be not far above fob export prices, and
may be below cif prices, increasing the difficulty for Bangladesh RMG exporters to compete
in the Indian market, even under an FTA. This reduces or even removes the standard ‘uneven
playing field” problem of an FTA on the Indian side i.e. the problem that FTAs will normally
allow exporters to exempt or rebate import duties on inputs in the normal way, but that the
exported products then compete without paying tariffs with producers in the partner country,
which pay normal tariffs on their imported inputs.
• In recent years India has demonstrated that it is willing to subsidize its exports of rice when
there have been large domestic surpluses. In some years India’s exports were large relative to
the narrow international market and probably reduced world prices, with resulting economic
welfare benefits to Bangladesh as an importer. Bangladesh would need to think carefully
about the economic costs and benefits of this if rice were to be included in an FTA with India.
India has also been willing to subsidize wheat and sugar exports when there have been
domestic surpluses, but in these cases the volumes have not been sufficient to have much
impact on world prices, so this is less of a complication in thinking about these two sectors in
the context of a bilateral FTA or SAFTA.
25
26
An up-to-date outline of these policies is in the World Bank trade policy Overview report (vol II, Chapter 4)
Duty Exemption Pass Book. This system is described in the Overview report and in recent changes in DEPB
rates for garments are given in the RMG industry case study (Table 6, p.15).
17
Chapter 4: Bangladesh’s trade policies
There is a detailed description and analysis of Bangladesh’s trade policies in the recent World
Bank trade policy Overview report 27 . This section summarises some of the main findings of that report
that are relevant for the Bangladesh’s trading relationship with India, and includes new information that is
now available for 2004/05, especially on Bangladesh’s para-tariffs which during 2004/05 continued to
increase their role in Bangladesh’s policies of protecting domestic producers from import competition.
Various aspects of Bangladesh’s import policies are considered first and at most length, since they would
be most directly affected if there were an FTA between India and Bangladesh. This is followed by a brief
discussion of some relevant aspects of export policies.
Non tariff barriers During the late 1980s and early 1990s, most explicit QRs were abolished. Of
the continuing restrictions the most important by far was the ban on textile fabric imports for use in the
domestic market, which protected the textile industry. This was finally removed in January 2005. But
there are still QRs on the import of chicks, eggs, salt and some packaging materials, and also on a few
other products (e.g. mosquito insecticides) ostensibly for health, safety environmental and other grounds.
Various permits, clearances and approvals are also required for extensive lists of other products, even
though they are not formally subject to import licensing. In addition, the Bangladesh Bank requires that
all imports be financed by an LC issued by an authorised bank in Bangladesh, and until December 2003 it
required the importer to deposit a 30% cash margin. Moreover, in order to curb imports when the central
bank thought the foreign exchange situation was weak, the margin was periodically increased for
particular commodities. In the various studies undertaken as part of this project, except for sugar and
textile fabrics, explicit QRs did not emerge as an impediment or special issue either for Indian exporters
or in Bangladesh, possibly because the products still subject to QRs were not covered in the studies.
Import procedures in Bangladesh and the resulting transaction costs for importers were also not covered
explicitly, but they did come up in some of the work in India on transaction costs and the financing of
Indian exports to Bangladesh. In particular the Bangladesh Bank LC rules and more generally the
credibility of the Bangladesh banks were reported to constrain Indian exports to Bangladesh, and as one
of the factors responsible for illegal practices in the border trade, especially at the Petrapole-Benapole
border crossing.
27
Fig 4.1
Bangladesh 1991/92-2004/05:All Tariff Lines,
Unweighted Average Protective Import Duties
80
% of assessable value
70
60
50
40
30
20
10
0
19
91
/9
19 2
92
/9
19 3
93
/9
19 4
94
/9
19 5
95
/9
19 6
96
/9
19 7
97
/9
19 8
98
/9
19 9
99
/0
20 0
00
/0
20 1
01
/0
20 2
02
/0
20 3
03
/0
20 4
04
/0
5
An important general nontariff constraint on Bangladesh’s
imports from India is the fact that
only four out of the 42 Customs posts
on the land border with India are
allowed to clear all imported goods:
the others are limited to dealing with
a very short list of products and must
obtain case-by-case authorization
from the National Board of Revenue
for clearing anything not on this list
(see discussion below). In additionostensibly in the interests of limiting
illegal imports- since July 2002
Bangladesh has required that two of
its principal imports from India –
sugar and textile yarns-can only be
Para-tariffs
Customs duties
World Bank Trade Policies in South Asia: an Overview. Report no 29949, September 7, 2004. Three volumes.
19
imported through its sea ports. Restrictions on what land border Customs posts are allowed to handle also
exist on the Indian side, as discussed previously in the section on India’s trade policies.
General tariff trends. During the first five years of the 1990s, up to 1995/96, Bangladesh’s tariffs
were cut drastically (Table 4.1 and Figs 4.1, 4.2, and 4.3). The unweighted average protective rate of all
tariff lines fell from 73.6% in 1991/92 to 32% in 1995/96. After 1995/96 this liberalizing impetus stalled,
and during the following ten years up to 2004/05 tariffs declined only slightly. Average industrial tariffs
came down modestly (by 6.4 percentage points from 31.9% to 25.4%) but the average protective rate for
agriculture (including fisheries, livestock and processed foods) 28 was 32.7% in 2004/05, slightly higher
Fig 4.2
Bangladesh 1991/92-2004/05: Industrial Tariff Lines.
Unweighted Average Protective Import Duties
% of assessable value
80
70
60
50
40
30
20
10
Para tariffs
90
05
04
20
04
/
03
20
03
/
02
20
02
/
01
20
01
/
00
20
00
/
99
19
99
/
98
19
98
/
97
19
97
/
96
19
96
/
95
19
95
/
94
19
94
/
93
19
93
/
19
92
/
19
91
/
92
0
Customs duties
Fig 4.3
Bangladesh 1991/92-2004/05: Agriculture Tariff LInes.
Unweighted Average Protective Import Taxes
80
70
60
50
40
30
20
10
0
19
91
/9
2
19
92
/9
3
19
93
/9
4
19
94
/9
5
19
95
/9
6
19
96
/9
7
19
97
/9
8
19
98
/9
9
19
99
/0
0
20
00
/0
1
20
01
/0
2
20
02
/0
3
20
03
/0
4
-10
Para tariffs
28
HS 1-24. This definition of “agriculture” differs somewhat from the WTO definition of the sectors covered by
the Agreement on Agriculture, mainly by including fisheries and marine products (HS 03) and excluding hides
and skins and various natural textile fibres such as jute, cotton and wool.
20
than it had been 10 years earlier. In fiscal 2006/07, over all tariff lines, the unweighted average protective
rate declined by 7.7 percentage points, from 32% in FY1995/96 to 24.3%.
Para-tariffs This slowing of tariff reduction occurred because continuing cuts in Customs duties
were offset by increases in the scope and levels of a variety of para-tariffs which were imposed on top of
Customs duties. By 2004/05 (see Table 4.1) about 40% of the unweighted average protection level was
due to para-tariffs, and para-tariffs were being applied to 21% of total tariff lines. How these para-tariffs
interact with Customs duties and with each other and affect protection levels is complex. Formulas were
developed as part of this and the earlier trade policy Overview report for estimating the resulting total
protection rates for different combinations of para-tariffs. These are given in Annex I, together with some
examples. 29
Five different para-tariffs have been used at different times since the early 1990s viz:
License fee (LF): from 1991/92 until it was discontinued in 2002/03, at a fixed rate on assessable
value (AV). The assessable value of an imported good is usually the cif price +1%.
•
•
Regulatory duties (RD): from 2000/01 at varying rates on assessable value (AV) until
discontinued in 2004/05.
Infrastructure Development Surcharge (IDSC): since 1997/98 to the present. Currently at the rate
of 4% on assessable values
Supplementary duties (SD): since 1991/92 to the present: at varying rates on assessable values
plus Customs duty. The rates generally used during 2004/05 were 15, 25, 30, 35, 60, and 90
percent. Imposed as was usually the case on top of a 25% Customs duty, these correspond to
considerably bigger increases in the protection rate (e.g, a 15% supplementary duty increases
protection by 18.8 percentage points, and a 90% supplementary duty increases protection by
112.5%).
Protective VAT: since 1991/92 to
the present. This is the practice of imposing
the normal 15% VAT on an imported
product but exempting the same product
from VAT when it is produced
domestically. The base for the VAT on
imports is (AV+CD+RD+SD)-it does not
include the IDSC. Whether the exemption
of the domestically produced product
actually provides extra protection depends
on whether the subsequent buyer is also
subject to VAT and loses the normal VAT
credit. As discussed in the World Bank
trade policy Overview report, this technique
has generally been used for final or near
final stage consumer goods and provides
29
Fig 4.4
Bangladesh FY 1996-FY 2005 Average protective tariffs for final
consumer goods
45
40
Protective tariff %
•
35
30
25
20
15
10
5
0
96
19
97
19
98
19
19
99
Selective para-tariffs
00
20
01
20
0
20
2
03
20
04
20
05
20
CD, License fee & IDSC
When starting this study we did not find any conceptually sound methods for measuring the combined
protective rate of Customs duties and the para-tariffs, either at NBR or elsewhere in writings and research on
Bangladesh’s trade policies. Perhaps for this reason, there is no discussion or recognition in Bangladesh either
in official publications or elsewhere, of the total protection rates resulting from the tariff system. Most
discussions just mention the Customs duties, but this is meaningless without taking account of the para-tariffs.
Elucidating and publicising the protection rates resulting from Customs duties and para- tariffs would appear to
be a straightforward and obvious task for the National Board of Revenue or the Tariff Commission.
21
extra protection since the VAT system in Bangladesh does not effectively extend to wholesale and retail
distribution. 30
In addition importers have to pay a tax called advance income tax (AIT) This is charged on nearly
all imports at 3% of assessable value, and can be credited against the importer’s income tax liability. For
this reason in principle it is not a protective tax, insofar as the domestic producers of the product are also
subject to income taxes. For this reason it has not been considered a protective tax in this study, but if
income taxes are not imposed or not collected on domestic production, it would operate as another
protective para-tariff.
During the first part of the period covered by the India-Bangladesh trade study, the last four of the
protective para-tariffs listed above were in force, and since July 2004 when the regulatory duties were
discontinued, the last three have been in force. The IDSC for the most part is an across-the-board import
tax at a flat rate from which relatively few imported products are exempt. During FY 04 and 05 the rate
was 4%, so the effect in most cases is just to increase the Customs duty by this amount. In 2004/05 this
means that the four standard Customs duty “slabs” of 25, 15, 7.5 and 0 percent are in practice 29, 19, 11.5
and 4 percent, and the distortionary effects resulting from the dispersion of the four Customs duty rates is
actually slightly reduced. 31
By contrast, the three other para-tariffs have been used selectively to provide very high protection
levels to a wide range of import substitution industries, in some cases to intermediate manufactured
products, but in the vast majority of cases to protect domestically produced final consumer goods. The
deployment of the selective para-tariffs has been growing especially rapidly, albeit somewhat erratically,
since 1998/99. In 2004/05 about a fifth (21.07%) of all tariff lines (1405 out of a total of 6667 lines) were
subject to either a supplementary duty, a protective VAT, or both (Table 4.2) 32 . In 2003/04 there was a
sudden spurt in the use of regulatory duties, with the number of products subject to them jumping from 35
to 334, but for unknown reasons they were all cancelled in the 2004/05 budget (Table 4.3).However this
change was more than offset by a big expansion (a 55% increase) in the number of products subject to
supplementary duties. Consequently both the absolute number of tariff lines and subject to one or more
para-tariff, and the proportion of
total tariff lines subject to paraFig 4.5
tariffs, once again increased in
Bangladesh FY 1996 - FY 2005: Average protective tariffs by type of
this year.
45
good
30
31
32
35
30
25
20
15
10
5
Final consumer goods
Intermediate goods
20
05
20
04
20
03
20
02
20
01
20
00
19
99
19
98
19
97
0
19
96
Protective tariff %
40
The concentration of
extra para-tariff protection in
consumer goods is apparent
from Table 4.4, which shows
unweighted
average
total
protection rates distinguishing
basic raw materials, intermediate
goods, capital goods and final
consumer goods over the 10
years since 1995/96. In 2004/05,
without the selective para-tariffs,
the maximum normal protection
Raw material
See especially the discussion in the appendix (p. 69) of Volume III.
It is increased in relation to unsubsidized exports, however.
The tariff lines referred to here are Bangladesh’s 8-digit HS classification of MFN tariffs i.e. leaving out special
discounted tariffs for specified “end users” and preferential tariffs (for example under SAPTA)
22
resulting from the maximum Customs duty (25%) and the IDSC tax (4%) and with VAT applied to both
imports and the domestic product, was 28.5%. 33 But in 2004/05 the average final consumer good
protection rate was 37.3%, reflecting the effect of the selective para-tariffs. Also, during the 10 years
since 1995/96 there has been no downward trend in this protection rate (Figs 4.4 and 4.5) despite
reductions in Customs duty rates during the period and the discontinuance of the license fee in 2002/03.
By contrast the average protection rates on basic raw materials, intermediate goods and capital goods are
much lower, and in the case of raw materials and intermediate goods have been trending down since
1998/99 (Fig 4.5). The downward trend in intermediate good tariffs is especially marked, and suggests the
existence of a consistent policy which seems to have started in about 1998/99, of increasing the protection
to the processing margins of import competing industries selling in the domestic market, by pushing up
the tariffs protecting their outputs while reducing the tariffs on their intermediate inputs. One of the key
reasons for these much lower protection levels and divergent trends during the five years is the much
lower incidence of the selective para-tariffs among raw materials and intermediate goods, and to a lesser
extent capital goods (Table 4.3). Thus, in 2004/05 the selective para-tariffs added 12.75 percentage points
to the average protection of final consumer goods, but only 0.87, 1.30. and 3.06 percentage points
respectively to the average protection of raw materials, intermediate goods and capital goods.
So far the effects of the para-tariffs on average protection levels have been discussed, but the
essential feature of these instruments is that they are selective and flexible and provide wide discretion in
deciding the level of protection to be afforded to particular products and the firms and industries that
produce them. For example, the government can decide whether to impose a 15%, a 35% or a 90%
supplementary duty on top of a normal Customs duty, whether or not to provide a domestic VAT
exemption, or perhaps to provide a combination of both. In this way the para-tariffs directly contradict
and appear to have largely undermined a number of key objectives of the 1990s tariff reforms, which
were to cut tariffs and make them more uniform, reduce their complexity by cutting the number of
Customs duty slabs, and in these ways to also reduce the scope for discretion in decisions on protection
levels.
Some indication of the selective use of the para-tariffs to provide high protection levels is given
Table 4.5. This reproduces the total protection rates in 1997/98 and 2003/04 for a sample of 55 products
and product groups analysed in the World Bank trade policy overview report 34 and adds the total
protection rates in 2004/05 for the same products. For most industries producing this group of products,
there has been a massive increase in tariff protection during the years since 1997/98, even though
protection rates were high to start with. Between 1997/98 and 2003/04 the simple average protection rate
for the group of products went up by approximately 24 percentage points, from 50.8% to 74.7%. It
increased for 50 of the 55 products, in most cases very substantially e.g. processed seafood from 35% to
88%, milk powder from 47% to 62%, sugar from 47% to 85%, sweet biscuits from 47% to 131%,
cement from 25% to 66%, soaps and detergents from 61% to 98%, plastic tableware from 51% to 91%,
textile fabrics from 65% to 72%, glass and glass products from 47% to 85%. For only five of the
products did the total protection rate decline, and this reduction was minimal and from already high
levels e.g. the salt protection rate fell from 150.8% to 143.2%, and the protection rate for after shave
preparations fell from 64.6% to 54.6%. During 2004/05, the total protection rates of most of the products
in this group fell, but the majority remained considerably higher than they had been in 1997/98. The
average protection rate of the group declined to the still very high level of 66%, with protection rates of
individual products and product groups ranging from 47.2% to 141%.
33
34
Because the base for the import VAT does not include the IDSC tax, whereas the base for VAT paid by a
domestic producer is the ex-factory price, the effect of the VAT is to slightly reduce the total protection rate, in
this case by about 0.52 percentage points.
Op cit , Vol II, Table 3.15
23
“End user” tariff concessions. As well using the para-tariffs to raise the protection for the outputs
of domestic industries, the government has developed a system of special “end user” tariffs which provide
low concessional tariffs on the inputs and capital equipment for specified industries or for specified uses.
In 2004/05, corresponding to the 6667 MFN tariff lines, there were 2503 “end user” concessional tariffs
(Table 4.6), often more than one for the same product. These concessional tariffs are much lower than
normal MFN tariffs, and in the case of machinery and parts used by exporters, the concessional protective
tariff is zero. On average the “end user” tariff was 7.4%, and 10.5% if the zero machinery and part tariffs
for exporters are excluded. This compares with the average MFN protective rate of 26.6% and with the
following protective structure if only the four normal Customs duties and IDSC tax are imposed:
As indicated in Table 4.6, there are only two major industries
Customs
Protective rate
which receive special end-user concessions for their intermediate
duty %
%
materials, namely the pharmaceutical industry and the insecticide
0
3.48
industry. Bangladesh has well developed systems (mainly export
7.5
10.98
15
18.48
processing zones and bonded warehouses) for providing duty free
25
28.48
intermediate materials for its export firms, and this is not handled as
part of the “end user” concessional tariff system. Hence, except for
these two industries, the end user concessions do not appear to be systematically used to increase the
effective protection (processing margins) of import substitution industries. Instead, this is generally done
by applying the lower standard Customs duty rates to inputs and adding para-tariffs to the protection for
final products. For example, the HS chapter covering plastics and plastic products includes the following
protective tariffs:
HS code
3924.10.00
3924.90.90
3922.10.00
3922.20.00
3922.90.00
3918.10.00
3918.10.00
3919
3920
3901-3914
Plastic tableware & kitchenware
Household toilet articles of plastic
Baths, showers, sinks, washbasins of plastic
Lavatory seats and covers
Toilet systems of plastic
Floor coverings of PVC
Floor coverings of other plastics
Plastic adhesive rolls and foil
Plate, sheet, film of plastic-other
Plastic polymers in primary form (PVC, polyethylene, polystyrene etc)
2004/05 protection
rate %
83.7
83.7
59.7
59.7
59.7
47.2
47.2
47.2
47.2
18.5
The high protection rates for the final products on this list (and for other final plastic products not
shown here) are due to supplementary duties (applied to 35 products in this chapter) and the use of the
protective VAT in combination with a supplementary duty in the case of tableware, kitchenware and
household toilet articles. Para-tariffs are not applied to the intermediate plastic polymers which are just
subject to the 15% Customs duty and the 4% IDSC. The protection rate for a variety of other final plastic
products (presumably not yet produced in Bangladesh?) is generally 28.5%. Similar patterns of tariff
escalation are found both within and between other HS tariff chapters: for example the average MFN
tariff for iron and steel (HS 71) is 13.6% while the average protective tariff for iron and steel products is
30%, and closer investigation of these two product groups and others will almost always reveal cases of
much steeper tariff escalation, where para-tariffs have been applied to finished products.
The end user concessions are more important for machinery and equipment, where the protective
tariff for machinery and parts used by firms selling in the domestic market is 7.5% and zero for the same
machinery and parts if they are used by “100% export oriented” firms. Most users of machinery in
Bangladesh probably benefit from these concessions since the 7.5% “capital machinery” concession for
non-exporters applies to about 40% of the tariff lines in the two principal HS chapters covering non-
24
electrical and electrical machinery (HS 84 and HS 85). Without these concessions many machines would
cost more, since the same standard MFN tariff structure applies to them as shown above for plastic
products i.e. Customs duties of zero, 7.5%, 15% or 25% corresponding to protection rates of 3.48%,
10.98%, 18.48% and 28.48%. But the concession is not available unless the machines are used as capital
equipment to produce something else, and a close look at these chapters reveals a number of productsmostly durable consumer goods probably being produced domestically-with very high protection rates.
For example:
HS code
8415.1010
8607 & 8609
8414.5110
8413.20
8414.20
841810
Domestic air conditioners <3 bhp
Engines for three wheelers, 4 stroke
Domestic room fans
Hand air pumps
Hand & foot operated air pumps
Domestic refrigerators
2004/05
protective rate %
72.2
72.2
59.7
47.8
47.8
47.2
These examples suggest that the government is willing to provide high protection to local
machinery production when final consumers are the users, but that it prefers low tariffs for industrial
machines -e.g. the 3.7% or 7.5% tariffs on textile machinery- in part probably because of the lobbying
power of industrial users. In any case these very large differences certainly contribute to a very distorted
protection structure in the machinery sector, with negative or very low effective protection rates for most
industrial machines and extremely high effective protection rates for a number of consumer durables and
perhaps some other machines 35 . The low tariffs on industrial machines also increase the effective
incentives of products they help to produce that are sold domestically, but on the other hand the antiexport bias of the incentive system is somewhat lower than it otherwise would be if exporters did not
receive this concession.
Agriculture, livestock, fisheries and processed food. Bangladesh’s trade policies in these sectors
warrant separate treatment because, as in India, they differ in important ways from its manufacturing
trade policies, in addition to which Indian agricultural products are generally a large although fluctuating
share of its total exports to Bangladesh 36 . Understanding “low” tariffs as 10-15% or below, “moderate” as
15-25%, “high” as 25-40%, and very high as exceeding 40%, these policies can be characterised as
follows:
• Relative to other products, low tariffs and other incentives (no large input subsidies) for the major
food grain crops -- rice, coarse grains, wheat, and pulses. Together, these account for by far the
largest part of agricultural GDP and agricultural employment. They are economically efficient, low
cost industries, and trade policies have been managed to keep consumer prices down by allowing
imports-most of which come from India- over quite low tariffs (around 10%) during periods when
domestic production has lagged behind demand.
• Very high tariffs on frozen shrimp and fish, and quite high tariffs on tea and raw jute, despite the fact
that these are all major exports and that competition between exporting producers would be expected
to keep domestic prices broadly in line with export prices.
35
36
Tariffs on steel and other machinery inputs (e.g. steel, metals, electronic components) are higher than industrial
machinery tariffs (zero for machinery used by exporters and up to 7.5% for most domestic market users), so
effective protection for local production of these machines and also for replacement parts is probably negative
in most cases. By contrast consumer durable tariffs are much higher than the tariffs on most of the inputs that
are used to produce them, so the firms that produce them in Bangladesh have extremely high effective
protection to their processing margins.
For more detail on Bangladesh’s trade policies with regard to these products see the trade policy Overview
report (volume III, Chapter 1, pp 16-18).
25
•
•
Except for coconut oil, low or moderate tariffs protecting import competing oilseed farmers and
edible oil producers. Very high tariffs protecting the sugar industry and a number of other import
substitution crops, in particular some vegetables, fruits, nuts, and spices.
In the livestock sector, high to very high protection for dairy products and the poultry industry, but
low for cattle herding as a result of an export ban on live cattle, skins and partially processed leather.
High or very high tariffs protecting import substitution food processing industries, as is apparent
from the following unweighted average protective tariffs for the HS processed food chapters:
HS chapter
04
15
16
17
18
19
20
21
Products included
Dairy products, eggs, honey etc
Animal & vegetable fats and oils etc
Preparations of meat, fish, crustaceans etc
Sugar and sugar confectionery
Cocoa and cocoa preparations
Preparations of cereals, starch or milk; pastry cook products
Preparations of vegetables, fruits, nuts, etc
Miscellaneous edible preparations
Average of 8 HS processed food chapters
Average protection
rate 2004/05 %
45.3
33.1
30.2
39.5
41.1
44.8
42.2
32.9
38.6
As with the rest of manufacturing, protection rates for the processed food industries have been
kept up by the widespread use of the selective para-tariffs; otherwise the maximum protection rate in
2004/05 would have been 28.5%. Like other sectors, the averages also conceal large variations in
protection rates within individual chapters, with exceptionally high protection rates for some products that
have received special treatment, and much lower for others.
The high protection rates for some of the agricultural and other primary products, but especially
of processed foods, from the viewpoint of Bangladesh consumers constitute a substantial and highly
regressive indirect tax. This has important implications for the likely economic effects of an FTA with
India, because if Bangladesh were to import these products duty free there could be large economic
welfare benefits for Bangladesh consumers, but also difficult adjustment problems for the Bangladesh
producers that lose protection. How the resulting economic costs and benefits might work out is discussed
in a project case study paper using the example of the sugar industry. By contrast, it is probable that not
much would change for Bangladesh consumers or for producers, if rice and Bangladesh’s other cereal
crops were included in an India-Bangladesh FTA, because of the Bangladesh protection levels that are
already quite low.
Bangladesh’s tariff preferences for India. Bangladesh gives tariff preferences to imports from
India under the Bangkok Agreement and under SAPTA. 37 The current members of the Bangkok
agreement are India, Bangladesh, Sri Lanka, Republic of Korea, Laos and China (China joined in 2001).
However, the Bangladesh tariff schedule’s list of tariff preferences only mentions India, Sri Lanka and
South Korea. In FY 05 in Bangladesh only 132 tariff lines (out of a total of 6667) were subject to
preferences under this agreement, the general preference rate was only 10% of Customs duties, and
preferences did not apply to para-tariffs. Consequently the tariff advantages accorded were negligible. For
example, after allowing for para-tariffs, the preferential total protective rate for car engines > 2600 cc 38
was 25.98% versus a general MFN rate of 28.48%, and the preferential rate for peppers 39 was 66.01%
37
38
39
For more on the Bangkok Agreement and SAPTA, see the World Bank trade policy Overview report, volume II
chapter 5.
HS 84082030
HS 04091120
26
versus a general MFN rate of 69.31%. Under SAPTA, Bangladesh gives preferences on 561 tariff lines to
India as one of the three more developed SAARC countries (the others are Pakisan and Sri Lanka).
However, the preferences are once again only 10% of Customs duties and do not apply to para-tariffs, so
the margins of preference are negligible. For example in FY05 the preferential total protective rate for
India on processed meats 40 (in “wrapped/canned” form) was 44.88% versus 47.75% on meat from nonpreferential sources. For raw materials and intermediate inputs where Bangladesh’s protection rates are
generally very low, the SAPTA preference margins are also extremely small and in a number of cases
where the Customs duty has been cut to zero, the preference margin is also zero e.g. both the preferential
and the MFN total protective rates of a number of mineral ores 41 are 3.48%. Overall, the tariff preferences
Bangladesh has given to India (and to the other member countries) under both the Bangkok Agreement
and SAPTA are purely symbolic: their main effect has been to further increase the complexity of the tariff
schedule and Customs administration rather than to provide any substantive preferences for imports from
India of any of the other Bangkok Agreement or SAPTA countries. In studies and surveys done as part of
the India-Bangladesh trade project, they were never mentioned and for all practical purposes can be
ignored.
Customs clearance at land border Customs posts Actual or prospective Indian exports to
Bangladesh in principle are subject to the same Customs clearance as rules any other exports if they go by
sea to the main Bangladesh sea ports (i.e. Chittagong & Mongla) or by air, and similarly Bangladesh
exports to India that are sent through India’s principal sea ports or by sea or air are also subject to the
same Customs clearance rules as other exports to India. But for exports originating in the Indian states
near the land border, land and/or river transport over the land border is frequently the most direct and
least expensive route, especially if the market for the goods is in the nearby border areas of Bangladesh,
and for trade between the north-east and eastern Indian states and Bangladesh the land border is the only
feasible route. But the land border trade is subject to very serious administrative constraints in
Bangladesh, because 38 out of the 42 land border Customs posts with India severely restrict the imported
goods that can be cleared, and only four land border posts can clear all imported goods. In terms of
volume the most important by far of the Customs posts with comprehensive Customs clearance powers is
at Benapole, which borders Petrapole on the Indian side and which is on main roads linking Kolkata with
Jessore and Dhaka. Two others are at Hili and Shonamosjid on the north west border with West Bengal,
and the fourth at Tamabil in the far north east, on the border with Meghalaya. Of the others, 36 Customs
posts can only deal with 17 specified (mostly agricultural) products, 42 and to clear other products special
permission has to obtained from the National Board of Revenue. Two other Customs posts are restricted
to clearing products included in a different small list.
In addition to these general constraints on imports by the land border, both Bangladesh and India
have periodically constrained imports of certain products by specifying the ports at which they can be
cleared by Customs. Bangladesh did this in July 2002, when it imposed a ban (still in force) on the import
of sugar and textile yarns through any of its land ports-including and especially Benapole- and required
all imports to come by sea. These are consistently two of the principal products which Bangladesh
imports from India, and the ostensible reason was to reduce “official” smuggling with the connivance of
Customs, which was alleged to be particularly prevalent at the Petrapole-Benapole crossing. 43
40
41
42
43
Most meats in HS chapter 02
Mineral ores, ash etc in HS 26 e.g. HS 26264000 (ash and residues containing aluminium)
Livestock, fish-pona, fresh fruits, seeds, rice, wheat, stone & boulders, coal, chemical fertilisers, china clay,
timber, lime stone, onions, garlic, ginger, ball-clay, quartz
These measures are discussed in the project case studies on sugar and ready made garments (pp 28 and 34
respectively)
27
As noted in the previous discussion of India’s trade policies, from time to time India has also
placed limits on the imports from neighbouring countries that can be cleared at its land border Customs
posts, but in June 2005 it seems that this “port notification instrument” was not deliberately being used as
a way of restricting imports from Bangladesh. 44 More important, India restricts the ports which can
administer its various export incentives, and in June 2005 it was reported that DEPB-which is the most
widely used-was not available at any of the land border Customs posts with Bangladesh except at
Petrapole, resulting in the diversion of Indian exports to Bangladesh, to this crossing 45 . In Bangladesh,
however, it seems that there are no limits on the exports that can be cleared by Customs at its land border
Customs posts.
Potential exports from India to Bangladesh that are not eligible to be cleared by Bangladesh
Customs at a nearby border crossing will be often faced with the alternative of either transporting the
goods –perhaps a thousand kilometres or more- to the Petrapole crossing or one of the other three
unrestricted crossing places, or to a distant port such as Haldia for shipment by sea. For the north east and
eastern Indian states, these alternatives will often be prohibitively costly, so the restrictions amount to a
ban on exports from these states to the nearby regions of Bangladesh, in products that are not listed. This
in turn provides a strong incentive to send the goods illegally, either by “bootleg” smuggling which
bypasses the Customs posts altogether, or by “official” smuggling involving bribes to Customs and other
officials on both sides of the border (see the section below on informal trade).
There are a number of obvious reasons for the limits on the products that can be cleared at land
border Customs posts. It is principally a legacy of the long period of highly restrictive import policies
followed by both countries in the past, involving pervasive QRs of all kinds and prohibitively high tariffs
which discriminated above all against trade between each other and with other developing countries,
much more than against trade with developed countries. The consequent low volumes of legal trade meant
that there was no, or very little, need to incur the expense of installing capacity for Customs clearance at
large numbers of small border Customs posts, or to even establish Customs posts at all at many border
crossings. For example, India’s de facto ban on the import of all consumer goods (including agricultural
products and textiles) which was only finally phased out in April 2001, meant that there was no point in
maintaining the capacity for clearing imports of these goods, except at major ports to handle exceptional
cases. A further consequence was that there was also no point in building transport and storage and other
infrastructure at these places, since the volume of legal trade that was feasible trade did not justify it.
Export policies Bangladesh’s exports are dominated by ready made garments, most of which are
exported to the US and the EU. Nearly all garment exports are from firms operating in export processing
zones or as bonded warehouses. In both cases they can import their textile and other inputs free of
Customs duties and all other import taxes (including the 3% advance income tax) with the use of “backto-back LCs” i.e. letters of credit based on LCs issued for their exports. As noted previously, machinery
used by exporters is also exempt from all import taxes under the “capital machinery” provision for
exporters. Until June 2005 there was also an arrangement which paid subsidies on domestic fabrics used
by garment exporters. Apart from these, there is a standard array of duty neutralization schemes (e.g. duty
drawback) and export incentives (e.g. preferential export credit) and export promotion institutions and
activities of the kind used in many developing countries (see the trade policy Overview report for a
summary). In addition, however, there are a number of non-standard export policies which would need to
be discussed with India in the context of bilateral FTA, or with the India and the other South Asian
countries in the context of SAFTA. These combine export bans and restrictions on a number of
44
45
Personal communication from Arun Goyal, June 3 2005.
Ibid
28
unprocessed or partially processed primary products 46 , and export subsidies when some of these products
are exported in processed form. The intention of these measures is to make processed exports more
profitable by increasing gross margins by lowering the prices of the raw materials and increasing the
return from the exported finished products, but both measures contravene WTO rules and the Agreement
on Agriculture in particular. They are also likely to run into trouble if used to promote exports to India or
to one of the other South Asian countries as part of a free trade agreement.
Table 4.1: Bangladesh 1991/92-2004/05: Unweighted Average Protective Import Duty Rates
1991/92
1992/93
1993/94
1994/95
1995/96
1996/97
1997/98
1999/99
1999/2000
2000/01
2001/02
2002/03
2003/04
2004/05
Customs
duties
70.64
57.93
43.47
34.24
28.70
28.24
27.27
26.59
22.40
21.10
21.02
19.91
18.82
16.39
All tariff lines
ParaTotal
tariffs
prot rate
2.98
73.62
2.59
60.52
2.43
45.90
3.30
37.55
3.26
31.96
3.38
31.61
5.88
33.15
5.82
32.41
6.99
29.39
7.43
28.54
8.41
29.43
6.51
26.42
10.29
29.11
10.23
26.62
Industrial tariff lines
Customs
ParaTotal
duties
tariffs prot rate
69.72
3.44
73.16
57.34
2.99
60.33
43.13
2.84
45.97
33.52
3.54
37.06
28.40
3.47
31.87
27.79
3.58
31.37
26.80
5.98
32.78
26.23
5.92
32.15
21.86
7.33
29.19
20.39
7.84
28.23
20.28
8.47
28.75
19.08
6.74
25.82
18.02
8.81
26.82
15.67
9.76
25.43
Agriculture tariff lines
Customs
ParaTotal
duties
tariffs prot rate
76.64
-0.01
76.63
61.83
-0.03
61.80
45.58
-0.17
45.41
37.49
2.23
39.72
30.07
2.28
32.36
30.25
2.48
32.73
29.42
5.42
34.83
28.19
5.37
33.56
24.87
5.41
30.28
24.53
5.46
30.00
24.60
8.15
32.74
23.85
5.44
29.29
22.56
17.22
39.77
19.89
12.81
32.70
Table 4.2: Bangladesh 2003/04 and 2004/05: Distribution of tariff lines with extra protection above
Customs duties plus IDSC tax, provided by VAT exemptions, supplementary duties and regulatory duties
Extra protection from
2003/04
No of tariff lines
VAT only
SD only
RD only
VAT+SD
VAT+RD
SD+RD
Subtotal
No extra protection
Total lines
372
389
145
233
122
67
1328
5549
6877
Percent of total
lines
5.41
5.66
2.11
3.39
1.77
0.97
19.31
80.69
100.00
2004/05
No of tariff lines
339
823
0
243
0
0
1405
5262
6667
Percent of
total lines
5.08
12.34
0.00
3.64
0.00
0.00
21.07
78.93
100.00
IDSC=Infrastructure Development Surcharge; VAT=Value added tax; SD=Supplementary
duty;RD=Regulatory duty. SourceL:World Bank staff estimates from NBR database
46
Raw hides, wet blue leather, and unfrozen and unprocessed prawns and shrimps are among the banned exports.
A complete list of banned and restricted exports is given in the trade policy Overview report (see Vol III, Table
1.6 p 24).
29
Table 4.3: Number of tariff lines subject to selective paratariffs FY 03-FY 05
Number of tariff lines
With protective supplementary duties
With protective VAT
With regulatory duties
Change from previous year
Protective supplementary duties
Protective VAT
Regulatory duties
2002/03
2003/04
2004/05
356
442
35
691
727
334
1066
582
0
+335
+285
+299
+375
-145
-334
Table 4.4: Unweighted average total protection rates by type of product (% of assessable values)
FY
1996
1997
1998
1999
2000
2001
2002
2003
2004
2005
Basic raw
materials
17.4
18.1
20.2
19.9
17.4
17.0
17.1
15.9
16.2
15.6
Intermediate
goods
29.6
28.9
30.6
30.4
25.9
24.6
24.8
22.3
22.5
19.6
Capital
goods
23.0
23.2
25.2
25.4
19.4
17.7
18.0
18.7
19.2
18.1
Final consumer
goods
39.4
39.1
40.2
38.6
37.5
37.4
39.3
34.1
40.2
37.3
All
goods
31.9
31.6
33.1
32.4
29.4
28.5
29.4
26.4
29.1
26.5
Notes: Calclulated from NBR database. The tariff lines averaged are MFN rates only: the averages do not include
many "end user" tariff reductions, including tariff exemptions for end users who are exporters. The averages for
intermediate and capital goods are considerably lower than shown here if these "end user" tariff reductions are
averaged with the general MFN rates. Thje product definitions are adapted from the World Bank SINTIA protection
software
30
Table 4.5: Bangladesh FY 1998, FY 2004 and FY 2005: some examples of total protection rates
resulting from selective paratariffs on top of Customs duties, the license fee and the IDSC
HS code
Product or product group
0302
0302
0402
0405-0406
0805, 0806, 0808
0906, 0907
1701
1704, 1806
1905
2007,2009 & 2103
Fish, fresh
Fish, wrapped/canned
Milk Powder
Dairy Products
Fruits:oranges, grapes, apples (fresh)
Cinnamon, cloves
Cane sugar
Sugar confectionery
Bakery products (sweet biscuits etc)
Food Preparation (Juice, Jam, Jelly,
Tomato-ketchup etc)
Soft drinks
Salt
Portland Cement
Paint & Varnish
Perfumes
Cosmetics
Shampoos
Toothpaste
After Shave preparation
Soap & detergent
Safety Matches
Sheet Polythene
Plastic Sanitary-ware
Plastic Table & Kitchenware
Ply wood & particle board
Textile Fabrics
220210
2501
25232910
3208-3210
33,033,307
3304-3305
3305
3306
3307
3401
3605
3919-3921
3922
3924
4410-4412
5208-5212,5407-5408 & 55125516
5701-5705
5701-5705
610910, 620342, 620520
6302
6402-6404
6402-6405
6802
6904-6906
6907-6908
6910
6911-6912
7003-7005, 7009,7013
7304, 7306
7306
7324, 7418
821210
8301
8414
85061020
850710
8527
85281290
853929
8539
85441920
8544
8712
9403
9501-9503
Average
Jute Carpet
Other Carpet
RMG Products: cotton shirts, trousers & Tshirts
Cotton sheets
Sports Footwear
Other Footwear
Ceramic Tiles: Other
Ceramic Bricks, Blocks, Roofing Tiles etc.
Ceramic Tiles: Glazed/Unglazed
Ceramic Sanitary ware
Ceramic Tableware & Kitchenware
Glass & Glass Products
Iron & Steel Pipe: Other
Iron & Steel Pipe: ERW pipe
Iron, Steel & Copper Sanitary-ware
Razor
Lock
Electric Fan
Dry Cell Battery
Lead acid Battery
Radio & Cassette player
Colour TV
Light bulbs
Fluorescent lamps
Electric cables: Co-axial cable
Electric cables: Other
Bicycle & other Cycle
Furniture
Toys
31
Total protection rates
FY 1998 FY 2004
FY 2005
35.0
64.0
32.0
35.0
88.0
50.8
47.2
61.9
86.7
68.9
90.9
86.7
47.5
86.0
86.7
46.9
66.5
63.3
34.7
98.4
73.2
47.2
85.5
137.0
47.2
131.0
137.0
85.5
86.7
47.2
46.0
150.8
25.4
47.2
68.5
64.6
64.6
47.2
64.6
61.4
54.3
47.2
47.2
54.6
47.2
64.8
47.2
47.2
47.2
47.2
54.3
54.3
47.2
47.2
47.2
47.2
47.2
47.2
47.2
47.2
47.2
47.2
47.2
47.2
47.2
47.2
47.0
47.1
54.3
54.3
47.2
47.2
34.7
47.2
47.2
50.8
Change
FY 98 to
FY 04
29.0
53.0
14.8
22.0
38.5
19.6
63.7
38.3
83.8
38.3
Change
FY 04 to
FY 05
-32.0
-37.3
24.8
-4.2
0.7
-3.3
-25.1
51.5
6.0
1.2
68.6
143.2
66.0
66.0
98.5
65.4
65.4
98.5
58.8
98.5
53.0
53.0
66.0
90.9
53.0
71.6
56.7
141.0
72.2
59.7
72.7
43.5
56.6
72.2
72.2
72.2
47.2
47.2
59.7
83.7
47.2
69.3
22.6
-7.6
40.6
18.8
29.9
0.8
0.8
51.3
-5.8
37.1
-1.3
5.8
18.8
36.3
5.8
6.8
-12.0
-2.2
6.3
-6.3
-25.8
-21.9
-8.8
-26.3
13.5
-26.3
-5.8
-5.8
-6.3
-7.2
-5.8
-2.3
75.9
53.0
85.5
83.7
59.7
47.2
28.8
5.8
38.3
7.8
6.8
-38.3
85.5
53.0
66.0
61.3
53.0
54.6
89.0
98.5
85.5
53.0
85.5
85.5
53.0
53.0
66.0
85.5
85.5
58.7
53.7
66.0
53.0
66.0
85.5
85.5
53.0
85.5
74.7
47.2
47.2
59.7
49.8
47.2
64.0
64.0
72.7
72.7
47.2
59.7
72.2
47.2
47.2
59.7
72.2
72.2
47.2
47.2
47.2
47.2
59.7
59.7
47.2
59.7
72.2
65.4
38.3
-1.3
11.7
14.1
5.8
7.4
41.9
51.3
38.3
5.8
38.3
38.3
5.8
5.8
18.8
38.3
38.3
11.8
6.7
11.7
-1.3
18.8
38.3
50.8
5.8
38.3
23.9
-38.3
-5.8
-6.3
-11.5
-5.8
9.5
-25.0
-25.8
-12.8
-5.8
-25.8
-13.3
-5.8
-5.8
-6.3
-13.3
-13.3
-11.5
-6.5
-18.8
-5.8
-6.3
-25.8
-38.3
6.8
-13.3
-9.3
Table 4.6: Bangladesh tariff schedule 2004/05: Tariff lines with "end user" tariff concessions
Concession code
10
11
15
20
21
25
26
30
31
45
50
51
5A to 5K
61,62,64,65, 6A to 6E
End use category
General exemption
General exemption, under certain conditions
General exemption, within a period
Capital machinery
Capital machinery, parts
Machinery textile industry (Table-1)
Machinery textile industry (Table-2)
Capital machinery, 100% export oriented
Capital machinery (parts), 100% export oriented
Parts for manufacturing solar panels
Raw materials for insecticides: Annex 1
Raw materials for insecticides: Annex 2
Poultry sector (feeding systems etc)
Pharmaceutical & antibiotic raw materials
All "end user" tariff lines
Total number of MFN tariff lines
Note: Compiled from NBR tariff database
32
No of
tariff lines
9
31
2
505
231
24
41
505
231
13
56
83
72
700
2503
6667
Average
protective
rate %
4.0
10.1
3.5
7.5
7.5
3.7
7.5
0.0
0.0
4.0
4.1
20.2
3.9
14.2
7.4
26.6
Chapter 5: Reconciling the trade statistics
A component of the project is a paper which provides detailed comparisons of the Indian and
Bangladesh statistics of bilateral trade 47 . One purpose of this study was to check whether there were any
major discrepancies as to the general level of, and trends in, the total trade. Secondly, by making detailed
comparisons, the object was to throw some light on the scale and scope of overinvoicing, underinvoicing,
and similar practices, the likely products involved, and more broadly the potential scale of “technical
smuggling”.
There are a number of well known problems that have to be allowed for in making comparisons
of this kind, before much can be inferred on these two questions. They include in particular:
a. Freight and insurance which increase cif values above fob values
b. Time lags between the fob stage in the exporting country and the cif stage in the importing
country 48
c. Differences in the reporting periods of the statistics
d. Differing valuation practices at the Customs services
In the case of the India-Bangladesh trade, a priori, differences attributable to (a) and (b) should
be minor relative to trade with countries outside the South Asia region, certainly for the land border
trade 49 , and to a lesser extent for the sea trade, given the proximity of the Indian and Bangladesh ports. As
regards (c), the Indian published trade statistics are for its April-March fiscal year, whereas the
Bangladesh statistics are for its July-June fiscal year. As a spot check on how important this period
difference might be, the Bangladesh import data over three years was reassembled into two Indian fiscal
years, 1999/2000 and 2000/2001 for detailed comparison with Indian export data for the same periods.
But (d) was a problem in 1999/2000 and before, in that during this period Bangladesh Customs was still
using a predetermined list of “tariff values” as the base for Customs and other import duties on number
of products, and these values, not invoice values, were entering the import statistics. 50 However, except
for petroleum it was decided that this was probably not on its own a major source of discrepancies
between the Indian and the Bangladesh data, on the grounds that the committee that was deciding on the
tariff values was looking at international prices each three months and was fixing tariff values that would
not have differed very greatly from normal cif prices in international trade 51 .
A more serious problem than these is that the Bangladesh NBR trade database does not record
“back to back L/C” imports i.e. imports of duty free intermediate inputs used by Bangladesh bonded
warehouse exporters, and so these are recorded in the Indian export statistics but omitted altogether from
the corresponding Bangladesh NBR import statistics. As India is an important supplier of these inputsmainly textile yarns and fabrics for Bangladesh’s garment exporters-this is the source of large
discrepancies between the Indian export statistics and Bangladesh’s import statistics, both in the
aggregate and when disaggregated.
47
48
49
50
51
Rajesh Mehta (2004) AnOverview and Analysis of India’s Trade with Bangladesh
This may place a given shipment in a later statistical period (e.g. fiscal year) in the importing country, and may
affect the exchange rate at which the shipment is valued.
This depends on the valuation practices at the land borders and how fob and cif prices are defined when all that
is involved is crossing the border and transferring the goods from (say) an Indian truck to a Bangladesh truck.
This practice was discontinued in FY 2001 for all products except POL (petroleum, oils and lubricants) and
vessels imported for scrap.
In 1999/2000 854 8-digit HS products (about 13% of the total) were subject to tariff values
33
20
04
20
03
20
02
20
01
04
20
03
20
02
20
01
20
00
20
99
19
98
19
97
19
96
19
95
19
94
19
93
19
19
92
$US million
20
00
19
99
$US million
Fortunately
payments
Fig 5.1
under back-to-back LCs are
India- Bangladesh trade 1998/99-2003/04 Comparison of
recorded by Bangladesh Bank,
Indian export statistics and Bangladesh import statistics
2000
although
they
are
not
1800
disaggregated below 2-digit HS
1600
level and are not available
1400
before 1998/99. Even though the
1200
timing of these payments differs
1000
800
from Customs clearance times
600
(which are the basis for the NBR
400
import data), adding the totals to
200
NBR’s total import data, gives a
0
very
approximate
correspondence between the
general level of the two sets of
Indian exports to Bangladesh
Bangladesh imports from India
data for the years 1998/99 to
2002/03. Both statistics also
Fig 5.2
indicate similar year to year
Comparison of Bangladesh export statistics and Indian
changes during this period
import statistics 1991/92-2003/04
100
(Table 5.1 and Fig 5.1).
90
However there is a major
80
discrepancy in 2003/04, when
70
the recorded total Bangladesh
imports are only about 75% of
60
the value of recorded Indian
50
exports. More generally, in four
40
of the six years, recorded
30
Bangladesh imports are less than
20
recorded Indian exports, and
10
over the six years total recorded
0
Bangladesh imports are $492
million (7.6%) less than total
Bangladesh exports to India
Indian imports from Bangladesh
recorded Indian exports. Since
the Indian exports are recorded
fob and the Bangladesh imports are or should be recorded cif, these differences are the opposite of
expectations, even though the overall freight and insurance cost may not be very great owing to the trade
that goes by the land border crossings. It is also unlikely that these discrepancies can be explained by
timing differences, since the Bangladesh statistical year (July 1-June 30) lags the Indian statistical year
(April 1-March 31) by three months and would should pick up most shipments from India that arrive in
Bangladesh after the end of the Indian statistical year. Although data recording deficiencies and statistical
errors may conceivably explain some of these differences, they are consistent with many reports of illegal
practices at the Bangladesh Customs, especially at the Petrapole-Benapole land crossing, and with the
large scale discrepancies between the Indian and Bangladesh data at product level, discussed below.
As regards the much smaller reverse trade from Bangladesh to India, the correspondence between
Bangladesh’s aggregate export statistics and the Indian import statistics is fairly close. Table 5.2 and Fig
5.2 show comparisons for the 13 years 1991/92 to 2003/04. For these comparisons there is no problem of
unrecorded imports, since duty free imports for exporters are recorded by Indian Customs and included in
India’s import statistics, just as any other import. Differences between the statistics in individual years are
substantial, including some years in which recorded imports in India are less than Bangladesh’s exports,
but for this trade the fiscal year difference between Bangladesh and India increases the likelihood that this
34
will happen, and timing differences of a few large shipments could create large proportionate
discrepancies owing to the low volume of the total trade. Over the whole period, the difference between
aggregate Indian imports and aggregate Bangladesh exports has the expected positive sign, and the
positive margins (3.4% between 1992 and 1998, 2.2% between 1999 and 2004) correspond to the
expectation that cost of freight and insurance is low. This does not mean there was no undervaluation or
misclassification to avoid import duties occurring on the Indian side, only that it was not so egregious as
to show up in the aggregate import statistics.
As well as comparing aggregates, the consultant study also compared the Indian export and
Bangladesh import statistics for 1999/2000 and 2000/01 at HS 6-digit product level. The value
differences were quite minor for most of the individual products that they analyzed –in 2000/01 within
10% (plus or minus) of the recorded Indian export values of 3013 products, out of a total of 3423
products that were recorded as being exported from India to Bangladesh 52 . However, when the study
looked at a sample of products that had high values in either the Indian export statistics or the Bangladesh
import statistics, large discrepancies were discovered, predominantly cases with lower values in the
Bangladesh import statistics than in the Indian export statistics, but also the reverse i.e. where the
recorded import values in Bangladesh considerably exceed the export values in India. The study then
calculated the total discrepancy for textile products 53 , and found that about three quarters of the aggregate
discrepancy over all tariff lines was attributable to these products, and therefore probably simply reflected
the fact that duty free “back to back L/C” exports to Bangladesh are not included in Bangladesh’s import
statistics. However, it also pointed out and gave examples 54 of large discrepancies for many high value
non-textile products.
For this synthesis report, a brief further analysis was undertaken of the data for the 50 products
(defined as HS 6-digit level) with the largest absolute discrepancies in 2000/01. Textile products and a
petroleum product were removed, leaving 41 products altogether which accounted for about half the total
recorded Indian exports (net of textile exports) to Bangladesh in that year. The results are striking:
41 major non-textile products exported from India to Bangladesh in 2000/01 (Indian fiscal year):
Differences between Indian and Bangladesh trade statistics
No of
Value fob in
Value cif in
Difference
Difference as
products
Indian trade
Bangladesh
$US million
% of Indian
(HS 6statistics $US trade statistics
fob value
digit)
million
$US million
All products
41
355
238
-117
-33%
Bangladesh value <
21
286
82
-203
-71%
Indian value
Bangladesh
20
69
156
+87
+126%
value>Indian value
The following examples give a better feel for what may lie behind these aggregates. Other examples are
given in the consultant study. For nearly all the products there were similar differences in the same
direction during 1999/2000.
There are many possible mundane reasons for these discrepancies, including timing differences 55
and simple classification or other mistakes at the Indian or Bangladesh Customs. However, four of the
52
53
54
55
See Mehta, op.cit, Table IV.3
Ibid Table IV.6
Ibid Table IV.4
Comparisons over longer time periods for products with large discrepancies would provide a useful check on
the likely importance of timing differences.
35
project consultant studies independently reported that “well informed sources” generally agree that illegal
practices are widespread at Petrapole-Benapole, which is the by far the most important land-border
crossing for India-Bangladesh trade. These reports mainly emphasize under-invoicing and
misclassification to reduce Bangladesh import duties, and point out that in most cases the benefits of
overinvoicing on the Indian side in order to obtain higher export incentives are far less than the extra
import duties that would need to be paid in Bangladesh, assuming the export valuations are actually used
at Bangladesh Customs. In this regard it should be noted that underinvoicing by Indian exporters in order
to reduce Customs duties for Bangladesh importers, on its own does not explain lower import values for
the same goods in Bangladesh import statistics: for that some of the shipments would have to be not
recorded at all in Bangladesh, or recorded differently from the values provided to the Indian Customs.
Products with Bdesh value< Indian value
070310
Onions & shallots
100630
Milled rice
270119
Other coal (bituminous)
879600
Chassis fitted with engines (for
buses, cars, three wheelers and
trucks)
Product with Bdesh value> Indian value
401120
New tyres used on buses/lorries
rim size>15
841182
Gas turbines
845522
Rolling mills-cold
870210
Motor vehicles, diesel engine
public transport type (=buses?)
Value fob
in Indian
trade
statistics
$US
million
Value cif in
Bangladesh
trade
statistics $US
million
Difference
$US million
Difference
as % of
Indian fob
value
8.3
65.1
29.9
26.5
3.1
23.3
3.3
0.01
-5.2
-41.8
-26.6
-26.5
-63
-64
-89
-100
6.3
13.5
+7.3
+115
nil
1.4
0.8
24.0
12.0
10.0
+24.0
+10.6
+9.2
+
+757
+1150
An interesting outcome of the trade statistics comparison which was not expected in advance, is
the importance of substantially higher values of some Indian exports in Bangladesh than the export values
of the same products in India. These differences in individual products seem to far exceed likely transport
costs, and some products were simply not recorded at all in the Indian export statistics. In 2000/01 these
cases were offsetting about half of the total apparent undervaluation in Bangladesh, and were thereby
cancelling out a good part of the aggregate discrepancy between the two sets of trade statistics.
Leaving aside freight and insurance, recording mistakes and timing differences, apart from import
duty evasion, there are also obvious income tax evasion motivations which could give rise to differences
such as these. On the exporting side, Indian exporters might underinvoice or otherwise understate the
value of their exports in order to reduce their income tax liabilities, and conversely Bangladesh importers
might overstate the cost to them of imports in order to reduce their income tax liabilities. For
overinvoicing in Bangladesh to be worthwhile, import duties would need to be zero or quite low, and the
most likely candidates are therefore duty free intermediate inputs and capital equipment used by
exporters. Imported intermediate inputs used by exporters are routinely exempt from import duties, and
as pointed out in section 4 above, most machines imported by exporters are free of all import duties
including the AIT (advance income tax) and VAT, by virtue of the special “capital machinery” tariff
provisions for exporters. However it is also possible that in some cases it may pay to overinvoice products
subject to positive but low import duties e.g. machines subject to the general “capital machinery”
protective tariff of 7.5%.
36
In addition to income tax evasion, some researchers in Bangladesh (e.g. Muinul Islam 56 ) have
suggested that overinvoicing-especially of capital equipment imports- is used to accumulate unrecorded
foreign exchange outside the country, which in turn finances illegal imports or is used to profit from free
market premia on the official exchange rate. For a number of years free market foreign exchange premia
for the Taka have been very small, but tax evasion and the various advantages of holding black money
outside Bangladesh could still be relevant motivations and may explain some of these observed
differences between the Indian and Bangladesh statistics.
These and other indications of widespread illegal Customs practices, especially at the Petrapole–
Benapole crossing, are despite a number of Bangladesh government initiatives to reduce them. These
initiatives include pre-shipment inspection (compulsory since 1999) of Indian consignments to
Bangladesh by PSI inspectors in India 57 , the use of new computers and software in Bangladesh to speed
up clearance and reduce Customs official discretion 58 , and the Bangladesh Bank’s requirement that to be
cleared all imports require a letter of credit from a Bangladesh bank. It is possible that these measures
may have reduced the scope and scale of illegal practices, but the project studies indicate that there are
still many problems. In particular, it is reported that containers are tampered with between the factories or
warehouses at which the PSI inspections take place and Petrapole 59 , that PSI valuations are not always
being recognised by Bangladesh Customs officials, and that LCs are being issued to meet formal
requirements, but are not in practice being used to finance most Bangladesh land border imports from
India 60 . All of these issues would warrant further investigation, ideally by a coordinated joint effort
involving both the Indian and the Bangladesh Customs services and other relevant organisations in both
countries. A useful first step would be to systematically compare the Indian export and Bangladesh import
statistics in more detail and for a longer period than was done for the project consultant study, focussing
on products such as those mentioned above for which there are indications of large disparities.
Table 5.1: Comparison of Indian export statistics with Bangladesh import
statistics 1998/99-2003/04
56
57
58
59
60
1999
2000
2001
2002
2003
2004
Indian
exports
statistics (X)
$ million
996
636
935
1002
1176
1741
1999-2004
6486
Bangladesh import statistics
NBR
Back to
Total
database
back LCs
(M)
$ million
$ million
$ million
951
131
1082
446
176
622
629
178
807
839
136
974
1115
95
1210
1186
112
1298
5166
827
5994
Difference
(M-X)
$ million
86
-14
-128
-28
34
-443
Difference
% of X
-492
-7.6
8.7
-2.2
-13.7
-2.8
2.9
-25.4
This has been a theme in the writing of Muinal Islam e.g. in his chapter (pp 125-127) in Jayanta Kumar Ray
and Prabir De (eds): Promotion of Trade and Investment in the Eastern South Asian Subregion. Bookwell, New
Delhi 2003.
There is a note on the operations of the Bangladesh PSI inspectors in India in Arun Goyal’s study of trade
financing (pp 18-20). Arun Goyal (2004, October). Study on Financing of India-Bangladesh Trade.
This contrasts with Customs clearance on the Indian side at the Petrapole-Benapole crossing, which is still
being done by hand
In 2004 one knowledgeable person interviewed in Kolkata said that better enforcement of the PSI system is
deterred by an atmosphere of intimidation (including physical violence) in and around Petrapole.
This topic is discussed in Goyal’s trade financing study
37
Table 5.2: Comparison of Bangladesh export statistics and Indian import
statistics 1991/92-2003/04
1992
1993
1994
1995
1996
1997
1998
1999
2000
2001
2002
2003
2004
19921998
19992004
Bdesh stats Exports
to India
$m
2.1
9.8
16.7
46.7
72.6
46.1
65.5
59.6
64.6
63.4
50.3
84.1
89.2
Indian stats Imports
from Bdesh
$m
5.8
7.3
17.9
38.2
86.0
62.3
50.9
62.4
78.3
80.6
59.3
62.1
77.6
Indian M minus
Bdesh X
$m
3.7
-2.5
1.2
-8.5
13.4
16.2
-14.6
2.8
13.7
17.2
9.0
-22.0
-11.6
Diff as % of
Bdesh M
%
180.2
-25.3
6.9
-18.2
18.5
35.1
-22.3
4.7
21.2
27.1
17.9
-26.2
-13.0
259.5
268.4
8.9
3.4
411.2
420.3
9.1
2.2
38
Chapter 6: Bangladesh imports from India: composition, trends and potential
under an FTA
As discussed in the previous section, there are large discrepancies between the Indian statistics of
exports to Bangladesh and the Bangladesh statistics of imports from India, both in the aggregate and even
more so at the level of individual commodities. Disaggregating the Bangladesh import statistics (Table
6.1) by some major commodity categories shows the following:
• Highly variable but sometimes large imports of cereals (mainly wheat and rice) from India.
Bangladesh is also importing from other countries, but India has been the main supplier in recent
years.
• An apparently declining role of India as a supplier of duty free intermediate goods (mainly
textiles) for Bangladesh’s export RMG sector. According to the Bangladesh import data, in
2003/04 “Back-to-back LC” imports from India only accounted for 3.5% of its total “Back-toback LC” imports
• That India is supplying fairly constant shares of Bangladesh’s imports of basic raw materials,
intermediate goods used for domestic production, capital goods and non-cereal final consumer
goods
The Indian export statistics have been not been sorted into these categories, but a separation into
the three categories illustrated in Fig 6.1 (cotton and cotton textiles, cereals and “all other”) confirms the
importance and variability of cereal exports, and is consistent with a declining Indian role in the supply of
inputs to Bangladesh exporters, since this is the main destination of its cotton textile exports. However,
according to these statistics, “all other” exports have been growing very rapidly, on average at around
15% annually since 1996/97, with especially big increases in 2002/03 and 2003/04. This suggests that at
least one of the following categories of Indian exports to Bangladesh –basic raw materials, intermediate
goods used in domestic production, capital goods, or non-cereal consumer goods, have been growing
faster than indicated by the Bangladesh import statistics.
India exports a wide range of products to Bangladesh. According to the Indian export statistics for
2003/04, there were at least some exports in all but 4 of the 98 HS chapters. About a third of total exports
were primary agricultural, fish and livestock products, 6.6% processed foods and drinks (including animal
foods), and most of the rest manufactured products (Table 6.2).Leaving aside textile and clothing exports,
most of which go duty free to Bangladesh RMG exporters, India was supplying 21.5% of Bangladesh’s
total imports for use in the domestic market.
Fig 6.1
Major components of Indian exports to Bangladesh 1996/972003/04 (Indian export data)
1200
1000
$US
million
Table 6.3 shows the top 25
product groups (defined by 2-digit
HS codes) exported by India to
Bangladesh in 2003/04, as
recorded in India’s trade statistics.
To improve comparability with
Bangladesh’s import data, the
textile and clothing (T&C) HS
chapters
were
removed
in
constructing the table, because
duty free imports for exporters
(“back-to-back LC” imports) are
not included in the NBR database,
and these are mostly T&C
products for Bangladesh RMG
800
600
400
200
0
97
19
19
98
All other
39
99
19
00
20
Cereals
01
20
02
20
20
03
Cotton & cotton textiles
04
20
exporters. India’s principal exports are then compared with Bangladesh’s total imports of the same
product groups as recorded in the NBRs database for Bangladesh’s fiscal 2003/04, and Bangladesh’s
average protective tariffs during 2003/04 are shown for each product group. The average tariffs allow for
para-tariffs and have been calculated on three different bases: as an unweighted average of all the MFN 8digit tariff lines in each chapter; as an unweighted average including all MFN tariff lines plus reduced
“end user” tariffs plus all reduced preferential tariffs; and finally, as in the second case but weighting by
total imports during the year.
Table 6.1: Indian exports to Bangladesh 2003/04 (fom Indian export statistics)
HS
code
1-14
15-24
25-49
50-63
64-98
Primary agricultural, fish, and livestock products
Processed foods and drinks (including animal foods)
Miscl mineral and manufactured goods
Textile fibres, textiles and clothing
All other (including machinery and transport
equipment)
TOTAL
$ US
million
571
115
318
269
468
Share
%
32.8
6.6
18.3
15.4
26.9
1741
100.0
During 2003/04 the 25 product groups accounted for 81% of India’s total recorded exports to
Bangladesh, and almost 96% of total exports to Bangladesh after excluding T&C exports. The fiscal year
difference, the exclusion of T&C imports and other factors discussed previously should be borne in mind
in comparing the Indian and Bangladesh statistics, but the data nevertheless provide a useful preliminary
overview of the likely consequences for Bangladesh of free trade with India. In particular note that:
• India’s share of Bangladesh’s total imports of each of these product groups is quite high: more
than half for 8 product groups, between 20% and 30% for 7 product groups; between 10% and
20% for 7 product groups; and in only three cases less than 10%.
• Average protective tariffs for most of the product groups are high. Even after allowing for and
averaging over “end user” tariff lines, and weighting by imports, only 5 of the 25 product
groups (cereals, non-electrical machinery, animal foods, pharmaceuticals and railway
equipment) have average tariffs of less than 10% , and the average import weighted tariff of the
other 20 product groups is 29%
This means that Indian exporters to Bangladesh are successfully competing with exporters in the
rest of the world (ROW) and have achieved substantial shares in Bangladesh’s import markets, while in
most cases paying relatively high tariffs which in principle are the same for all exporters. If Bangladesh’s
MFN tariffs for the rest of the world were to remain the same while India received duty free treatment
under SAFTA or a bilateral FTA, for most of these products Indian exporters would have a substantial
price advantage in products in which it appears from the trade data they are already highly competitive.
The potential for expanded Indian exports to Bangladesh is supported by a very interesting
NCAER paper 61 which was prepared as part of the project. The paper outlines the results of a survey
carried out in Kolkata by an NCAER team, and a survey in Bangladesh by Data International which asked
for information on domestic prices of a set of representative products. 62 The Kolkata survey received
responses from 82 firms exporting to Bangladesh and from 50 manufacturers who were supplying them.
Many responses were incomplete and the coverage of individual questions (including price information)
61
62
Das, Samantak, Somnath Mukherjee and Sowmya Srinivasan, Study of a Sample of Products/Industries in
India. Mimeo 2003.
The Kolkata survey was done during July and August 2002, and the Bangladesh survey a few months earlier.
40
was not the same in India and Bangladesh. As regards comparative prices in the two countries, the sample
of reasonably reliable responses that could be compared in the end was quite small and covered only 30
products. Nevertheless, the results were striking, indicating that prices of 25 of the 30 products were
higher in Bangladesh, and in most cases very considerably higher-on average for the 30 products about
62% higher. 63
Number of products with prices
Higher in India
Higher in
Total number
Bangladesh
of products
Agricultural products
Processed foods
Manufactured products
TOTAL
1
4
5
9
4
12
25
10
4
16
30
Average ratio of
Bangladesh price to
Indian price
1.83
2.00
1.39
1.62
The NCAER paper also provides information for these products on indirect taxes in the two
countries. In Bangladesh, except for exempted products, there is just the 15% VAT, but in India (also
except for exempted products) there is the central government excise tax –usually 16%- and at the time of
the survey the central sales and state sales taxes 64 . The paper does not discuss the implications of the
indirect taxes for the price comparisons, but a finding of major importance emerges when these are
factored in. This is that the combined incidence of the central excise tax and central and state sales
taxes in India is in general much higher than the Bangladesh VAT. This means that reported retail
price comparisons if anything understates the excess of Bangladesh prices over Indian prices after the
indirect taxes have been removed. As a rough test of this, for this synthesis, using arbitrary assumptions
on retail margins and the indirect taxes reported in the paper, approximate pre-tax ex-factory prices were
derived and compared for the five products which according to the surveys had lower retail prices in
Bangladesh 65 . For one product, this reversed the comparison, and in the other four it substantially reduced
the estimated excess of the Indian price.
Product
Estimated ratio of
Bangladesh price to
Indian price: retail incl
indirect taxes
Estimated ratio of
Bangladesh price to
Indian price: tax free
wholesale or exfactory
0.98
0.95
0.85
Bangladesh:
% of VAT to
retail price
India: % of
indirect
taxes to
retail price
11.8
nil
12.5
22.8
6.5
18.3
1.15
0.81
11.9
nil
22.7
13.8*
Domestic soap
0.85
Dry red chilly
0.89
Ceiling fan (sweep
0.78
type 900-1200 mm)
UPS (600-625 VA)
0.99
Paints
0.70
* The comparison for paints is of wholesale prices only
63
64
65
27 of these comparisons are of retail prices and 3 of wholesale prices. 12 of the retail price comparisons were
confirmed by comparisons of wholesale prices of the same products. Details of the comparisons are given in
Table A.4 of the NCAER report.
The NCAER paper reports state sales taxes in West Bengal only, and not central sales taxes or sales taxes in
other states. Some products shipped to West Bengal from other states might be subject to central sales tax in
addition to the state sales tax, so the total incidence of indirect taxes could be even higher than indicated in the
paper.
For this exercise it was assumed that in Bangladesh the VAT is collected at ex-factory and wholesale levels in
Bangladesh but not at retail level.
41
The surveys were not able to obtain adequate data on tax free ex-factory or tax free wholesale
prices which could be compared directly, but the higher incidence of indirect taxes in India suggests that
the potential for exports from India to Bangladesh is even greater than suggested by the comparisons of
tax inclusive prices at retail level, since legal exporters are exempt from these indirect taxes, in addition to
which they are exempt from or receive rebates of import duties and indirect taxes on their inputs.
Conversely, allowing for the indirect tax difference-at least for this small sample of products-reduces
even further the likelihood that there would be many exports from Bangladesh to India under free trade.
However, this has to be interpreted carefully, since the NCAER sample was of products already being
exported by India, so it is unlikely to include products that would be traded in the other direction 66 .
The incidence of indirect taxes also confirms suggestions in some of the industry case studies that
illegal “bootleg” smuggling from India to Bangladesh in border areas is inhibited by the fact that some if
not all of the smugglers on the Indian side pay tax inclusive prices for the goods that are smuggled. As
pointed out in the case study on sugar, this means that both the Indian central government and the Indian
state governments are obtaining part of the smuggling economic rents from the excise tax and the sales
taxes on the smuggled goods, which in effect constitute an Indian export tax on products which are
smuggled to Bangladesh.
The NCAER survey also asked Indian traders who were already exporting to Bangladesh by what
percentage they would expect their exports to expand under three different hypotheses on Bangladesh
tariff reductions (50%, 75% and 100%). For the free trade alternative (100% tariff reduction) the average
estimated increase for 58 products was 34 %, distributed as follows:
Type of product
Number of
products
Agricultural
Processed food
Manufactured
Mineral
All products
14
4
39
1
58
Average of expected
increases in exports to
Bangladesh %
31
45
35
10
34
For only 4 of the 58 products was the expected increase in exports 10% or less (wheat, C.I. sheets, paints,
and bauxite), and not surprisingly three of these products were already facing low Bangladesh protective
tariffs 67 .
The aggregated data on Indian exports to Bangladesh and the NCAER exporter survey suggest
that there is considerable potential for trade diversion with an FTA i.e. Indian exporters would be able to
undercut ROW suppliers and substantially increase their shares in Bangladesh’s import markets. This in
turn would have important economic welfare consequences. One immediate consequence would be lost
government revenue from the protective tariffs that would no longer be applied to imports from India. For
the product groups for which Indian export data is provided in Table 6.2, assuming that under an FTA
India would not supply crude oil and petroleum products and omitting the mineral fuels and oils HS
chapter, a very approximate estimate of the total government revenue from protective tariffs on 2003/04
66
67
A similar survey was not carried out on the Bangladesh side. A useful follow up to this study would be to put
similar questions to Bangladesh traders exporting to India. However, the sample would be much smaller than
the Indian sample, owing to the low volume of this trade and the relatively few products involved (see section 7
below).
Wheat 7.5%, C.I. sheets 10%, bauxite 3.5%. The NCAER questionnaire did not attempt to distinguish
protective tariffs from the (in principle) non-protective import taxes i.e. the VAT and the advance income tax. It
is likely that the respondents may have had in mind all the Bangladesh import taxes including these.
42
imports is $738 million, of which $207 million was from imports of these products from India 68 . Under
an FTA the government revenue loss would therefore at least be $207 million, and it would be greater
than this to the extent that Indian exporters were to increase their shares in these import markets. But
increased market share would be the outcome of lower prices and/or better quality and service for
Bangladesh buyers of the imports, and at the same time would increase competition for Bangladesh
producers. In evaluating the net economic welfare effect of the FTA in Bangladesh, these benefits to
Bangladesh buyers and some potential economic costs for producers would need to be weighed with the
government revenue effects. Under the project, a methodology for doing this kind of evaluation at the
level of individual industries was developed and some industry case studies were undertaken. This work
is briefly summarised in section 10.
68
These are very rough estimates made by applying the import weighted tariff rates given in Table 6.3 to total
2003/04 imports and are indicative of orders of magnitude only. They assume that para-tariffs as well as
Customs duties would be zero under an FTA, but that Bangladesh’s VAT would be applied in the normal way
to imports from India. The estimates would ideally be done at a more disaggregated level and using if available
actual tariff collections.
43
Table 6.2: Bangladesh Imports FY 1996 & FY 2001-FY 2004: Composition and Indian shares
(using Bangladesh trade statistics)
Description
Imports from World
Basic Raw Materials
Intermediate Goods: total
Intermediate Goods:
Domestic Consumption
Intermediate Goods: Backto-Back-L/C & EPZ Imports
Capital Goods
Final Consumer Goods:
Total
Final Consumer Goods:
Wheat & Rice
Other Final Consumer
Goods
Total
Imports from India
Basic Raw Materials
Intermediate Goods:
Domestic Consumption,
Back-to-Back L/C
Intermediate Goods:
Domestic Consumption
Intermediate Goods: Backto-Back-L/C
Capital Goods
Final Consumer Goods:
Total
Final Consumer Goods:
Wheat & Rice
Other Final Consumer
Goods
Total
Indian share of imports %
Basic Raw Materials
Intermediate Goods: Total
Intermediate Goods:
Domestic Consumption
Intermediate Goods: Backto-Back-L/C
Capital Goods
Final Consumer Goods:
Total
Final Consumer Goods:
Wheat & Rice
Other Final Consumer
Goods
Total
1995-96
Imports
Share
million $
%
2000-01
Imports in
Share
million $
in %
2001-02
Imports
Share
million $
in %
2002-03
Imports
Share
million
in %
$
2003-04
Imports
Share
million $
in %
758
3,632
1,936
11.5
54.9
29.3
903
4,956
2,082
10.8
59.3
24.9
852
4,761
2,169
9.1
51.1
23.3
1,015
5,240
2,445
10.7
55.3
25.8
1,409
5,899
2,702
12.8
53.4
24.5
1,696
25.7
2,874
34.4
2,592
27.8
2,795
29.5
3,197
29.0
1,165
1,057
17.6
16.0
1,463
1,036
17.5
12.4
2,555
1,151
27.4
12.3
1,447
1,775
15.3
18.7
2,016
1,720
18.3
15.6
479
7.2
251
3.0
246
2.6
345
3.6
332
3.0
578
8.7
785
9.4
905
9.7
1,430
15.1
1,387
12.6
6,612
100.0
8,357
100.0
9,319
100.0
9,477
100.0
11,044
100.0
117
442
11.1
42.1
84
405
10.4
50.2
126
400
13.0
41.1
135
436
11.2
36.0
218
448
16.8
34.5
276
26.3
227
28.2
264
27.1
340
28.1
336
25.9
165
15.8
178
22.0
136
13.9
95
7.9
112
8.6
125
367
11.9
34.9
115
202
14.3
25.1
176
272
18.1
27.9
156
484
12.9
40.0
178
455
13.7
35.0
273
26.0
73
9.0
116
11.9
274
22.7
231
17.8
93
8.9
129
16.0
156
16.0
209
17.3
224
17.2
1,051
100.0
807
100.0
974
100.0
1,210
100.00
1,299
100.0
15.4
12.2
14.3
9.3
8.2
10.9
14.8
8.4
12.2
13.3
8.3
13.9
15.5
7.6
12.4
9.8
6.2
5.2
3.4
3.5
10.8
34.7
7.9
19.5
6.9
23.6
10.8
27.3
8.8
26.5
57.1
29.1
47.0
79.6
69.5
16.1
16.5
17.2
14.6
16.1
15.9
9.7
10.5
12.8
11.8
Sources: NBR database (Customs clearance basis) and Bangladesh Bank for Back-to-Back LC imports (payment basis). Total
imports from India during FY 04 in this Table are much less (by about $400 million) than total exports to Bangladesh during
Indian FY 04 shown in the Indian export statistics. See discussion in section 5 above
44
Table 6.3: Indian exports to Bangladesh 2003/04: 25 principal products exported (as defined by
HS 2-digit product codes) . Textile and clothing HS chapters 50-63 excluded
HS code
25 largest exported product groups
Cereals (mainly rice and wheat)
Non-electrical machinery
Vegetables
Vehicles-cars, trucks, buses, tractors
Articles of iron & steel
Iron & steel
Animal food
Mineral fuels, mineral oils etc
Electrical machinery
Aluminium & articles thereof
Salt, lime & cement, earths, stone etc
Rubber & rubber articles
Organic chemicals
Plastics and plastic articles
Sugar and sugar confectionery
Dyes, pigments, tanning agents,
paints etc
Edible fruit and nuts
Inorganic chemicals
Paper, paperboard, paper articles
Pharmaceuticals
Coffee, tea, spices
Miscl chemical products
Railway equipment
Optical, photographic etc equipment
Books, newspapers etc
Indian
exports
(X)
Bdesh
total
imports
(M)
Share of
X in M
$ million
$ million
%
10
84
7
87
73
72
23
27
85
76
25
40
29
39
17
32
429.2
98.9
92.4
82.4
81.9
74.3
72.9
67.5
52.3
37.1
36.7
34.6
34.4
33.4
32.1
29.1
357.7
1185.8
166.9
354.9
86.3
268.5
63.2
813.1
438.1
69.1
220.3
59.9
183.9
235.1
134.4
84.9
8
28
48
30
9
38
86
90
49
25.7
21.7
14.3
14.0
13.8
12.3
5.6
5.4
5.1
Total: 25 principal products
exported
69 other product groups
Total : all product groups (84 HS chapters)
Bangladesh
protective
tariffs rates %
Unwtd avg
MFN lines
Unwtd avg
all lines
Wtd by
total imports
all lines
120.0
8.3
55.3
23.2
94.8
27.7
115.4
8.3
11.9
53.7
16.6
57.8
18.7
14.2
23.9
34.3
11.00
18.86
32.22
42.87
32.68
18.35
1.65
29.64
25.61
23.88
23.43
22.73
15.17
26.42
54.59
20.07
11.00
10.93
31.48
38.92
30.34
18.19
1.50
27.68
19.83
20.25
22.20
19.13
14.03
23.91
46.67
19.45
6.82
7.75
11.08
24.19
21.90
13.13
0.16
43.65
15.07
14.22
25.38
25.78
10.71
18.62
92.78
11.52
37.3
81.2
106.5
94.1
37.3
74.3
9.1
94.1
14.9
68.9
26.7
13.4
14.9
37.0
16.5
61.3
5.8
34.2
35.23
17.38
28.92
8.58
45.23
22.89
21.18
13.50
16.68
35.23
16.53
27.25
9.22
44.71
20.76
21.18
8.50
16.68
76.15
16.85
28.68
3.86
43.04
16.34
8.24
10.13
20.05
1406.8
5271.0
26.7
n.a
n.a
n.a
65.5
1589.3
4.1
n.a
n.a
n.a
1472.3
6860.4
21.5
n.a
n.a
n.a
Notes: The Indian export statistics are for the April-March 2003/04 fiscal year whereas the Bangladesh NBR
statistics of total imports are for Bangladesh's July-June 2003/04 fiscal year. This is probably the principal reason
Indian cereal and animal food exports exeed Bangladesh total imports. Duty free intermediate inputs imported by
Bangladesh exporters are not included in the Bangladesh NBR database. Most of these are textiles which are
included in the Indian export statistics. To make the two data sets more comparable the textile and clothing HS
product groups (HS 50-63) have been omitted from this table i.e. from both Indian exports and Bangladesh imports.
The protective tariffs include para-tariffs as well as Customs duties and are averages of the 8-digit products included
in each 2-digit HS chapter.The unweighted average of MFN lines excludes all "end user" and preferential tariffs
within each 2-digit chapter. The unweighted average for all lines includes the MFN tariff lines and end-user and
preferential tariffs which are shown as separate tariff lines for each 8-digit product to which they are applied. The
import weighted tariffs are calculated using all the tariff lines including the end-user and preferential reduced tariffs.
45
Chapter 7: Bangladesh exports to India: composition, trends and prospects
under an FTA
As discussed previously, Bangladesh’s exports to India, after increasing quite rapidly in the early
1990s from almost negligible levels, levelled off after 1995/96 and in 2003/04 were about the same in
nominal US dollars, and lower in inflation adjusted dollars, than they had been 9 years earlier (Fig 5.2).
From India’s perspective they are a miniscule share of its total imports (less than 0.1%) and are only
about 1% of Bangladesh’s total exports. Since 2001/02 they have been increasing fairly rapidly, and
according to the most recent Indian import statistics, this increase was sustained until India’s 2005/06
fiscal year at roughly a 30% rate, rising to $120 million in 2005/06. However it was from a very low level
of only $50-60 million in 2001/02 69 .. These levels are much too low to be confident in projecting longer
term trends, because the exports are dominated by just a few products, changes in which can cause large
proportionate changes in the totals. For example, the increase between 2002/03 and 2003/04 was almost
entirely due to increased exports of just one product, anhydrous ammonia.
About two thirds of Bangladesh’s exports to India consist of this one product, (which is imported
duty free as an input into India’s urea industry) plus raw jute. In 2003/04 there were only seven products
(including these two) with exports exceeding $1 million, and between them these seven accounted for
87% of Bangladesh’s total exports. As indicated in Table 7.1, there were only 29 products (defined at HS
6-digit level) with Indian imports exceeding $100,000.
To what extent is the very low level and slow growth of Bangladesh exports to India a
consequence of high tariffs and/or other restrictions in India? In discussing this it is useful to distinguish
four broad categories of imports for which there are different protection policies in India.
Industrial products (other than textiles and clothing) without SAPTA preferences. As noted in
section 3, since 20001/01 India has been providing SAPTA preferences to Bangladesh on about 2925 6digit tariff lines, about 58% of the total number of lines. This leaves about 2075 products without SAPTA
preferences. Omitting textiles and clothing and the “agricultural” HS products (discussed separately
below), there are still a large number of mainly manufactured products for which imports from
Bangladesh are treated on an MFN basis in the same way as imports from other countries without
preferences. More products fall into this category to the extent that preferences are or would be precluded
for Bangladesh by the SAPTA rules of origin. For these products typical Indian industrial MFN tariffs
came down from 44.9% in 20001/04 to 30.8% in 2003/04, to 20% in 2004/05, and to 15% in 2005/06.
Despite this steep decline in India’s protection rates (illustrated in Fig 3.6) only 7 Bangladesh industrial
products without SAPTA preferences appear in India’s 2003/04 import basket as summarized in Table
7.1, and then at very low annual import levels of no more than about $300,000 per product. Very little
change is apparent from the import data for the first three quarters of 2004/05. Moreover, during this
period none of these products were subject to India’s general import licensing system, which was already
lifted for Bangladesh and the other SAFTA countries in 1998. This suggests that most of these industrial
products are not being produced in Bangladesh, or if they are, that the Bangladesh producers have not
found it profitable to compete either with producers in other countries in supplying India, or with
domestic Indian producers even though Indian industrial tariffs are now at historically low levels.
69
According to export data from the Bangladesh Export Promotion Bureau, Bangladesh exports to India shot up to
$242 million in Bangladesh’s fiscal 2005/06, compared to $144 million in the preceding year. Divergence between
the two data is partly due to the difference in fiscal years: April-March for India and July-June for Bangladesh.
47
Table 7.1: Indian imports from Bangladesh during Indian FY 04: comparison of MFN and
preferential SAPTA tariffs
HS code
Indian imports FY 04
$US
% of total
millon
2003/04 tariff
MFN
SAPTA
2004/05 tariff
MFN
SAPTA
pref rate
28
53
03
62
53
08
27
56
41
34
41
41
41
84
84
04
84
52
84
84
52
28
22
52
85
20
39
85
1400
0310
0269
0520
1010
0290
0119
0710
0719
0119
0411
0419
0449
4790
7982
0613
8590
0420
4311
4511
0299
0111
0290
0522
0790
0980
1729
2510
62
0590
Anhydrous ammonia
Raw jute
Hilsa fish
M&B woven shirts-cotton
Jute fabrics
Betel nuts & other nuts
Steam coal
Twine ropes jute & other fibres
Leather whole hide
Household soaps
Wet blue
Wet-Other
Dry-Other
Other knitting machines
Mixing, stirring etc machines
Shrimp & prawns frozen
Other machinery-parts
Cotton sewing thread -retail sale
Offset printing machy
Cotton carding machines
Other cotton waste
Toilet soaps
Fruit juice or pulp based drinks
Cotton single yarn
Accumulator (battery) parts
Mango & other juices
Tubes & hoses
Broadcast equipment subsystem
M&B woven shirts-other fibres
Subtotal 29 products-avg tariffs
All other imports
Total imports
9 products with no prefs-avg
tariffs
20 products with prefs-avg
tariffs
20 products with prefs-wtd avg
tariffs
2005/06 tariff
MFN
SAPTA
31.74
20.43
5.01
4.17
2.2
2.19
1.85
0.64
0.42
0.25
0.24
0.24
0.22
0.21
0.21
0.19
0.19
0.18
0.18
0.18
0.17
0.16
0.15
0.15
0.15
0.11
0.11
0.11
40.9
26.3
6.5
5.4
2.8
2.8
2.4
0.8
0.5
0.3
0.3
0.3
0.3
0.3
0.3
0.2
0.2
0.2
0.2
0.2
0.2
0.2
0.2
0.2
0.2
0.1
0.1
0.1
0
5
35.2
49.7
30
35.2
30
24.8
30
36
30
30
30
30.8
30.8
35.2
30.8
24.8
30.8
30.8
19.6
36
35.2
24.8
30.8
35.2
36
30.8
0
2.5
19.6
27
14.4
16.5
30
12.3
27.4
4.6
27.4
27.4
27.4
30.8
30.8
19.6
30.8
14.4
30.8
30.8
11.8
4.6
35.2
14.4
11.2
11.8
17.2
30.8
0
5
30
44.8
20
30
20
20
20
20
20
20
20
20
20
30
20
20
20
20
15
20
30
20
20
30
20
20
pref
rate
0
2.5
15
22.4
8
12
20
8
18
0
18
18
18
20
20
15
20
10
20
20
7.5
0
30
10
5
7.5
8
20
0
5
30
46.2
15
30
15
15
15
15
15
15
15
10
15
30
15
15
15
10
15
15
30
15
15
30
15
15
pref
rate
0
2.5
15
23.1
6
12
15
6
13.5
0
13.5
13.5
13.5
10
15
15
15
7.5
15
10
7.5
0
30
7.5
3.75
7.5
6
15
0.1
72.15
5.48
77.63
34.82
0.1
92.9
7.1
100.0
44.9
84.5
31.5
44.9
20.9
49.8
22.2
24.9
13.7
51.4
18.7
25.7
11.2
27.8
27.8
18.9
18.9
13.9
13.9
37.33
48.1
33.1
17.8
23.7
11.4
20.9
10.0
19.6
10.4
16.7
8.1
16.2
7.9
Notes: Import data from India Ministry of Commerce DGFT website. Tariffs from Arun Goyal Easy Reference Customs
Tariff, various editions. Tariffs for M&B (mens' & boys') shirts are specific tariffs applied to unit value of imports from
Bangladesh in 2003/04. The MFN ad valorem tariff equivalents for the MFN tariffs assume the same unit values. The
weighted averages are weighted by importsfrom Bangladesh. Hence the MFN rates show what the weighted average tariff
on Bangladesh imports would have been in the absence of preferences. 2003/04 imports are used as weights in estimating
the 2004/05 and 2005/06 weighted averages since import data for these years is not available. Note that rules of origin
(maximum non-SAPTA content 70%) have to be satisfied for the preferential tariffs to be applied. Note also that the
SAPTA preference did not apply to the Indian Sadd import tax so the de facto preference was less than the nominal
preference during 2003/04 and before. The Sadd tax was abolished in January 2004.
48
Industrial products (other than textiles and clothing) with SAPTA preferences. Most of India’s
2925 SAPTA preferences for Bangladesh are on industrial products, and the most frequent concession
rate is 50%. Assuming this preference rate, a typical industrial preferential tariff for Bangladesh has
declined during the past five years as follows:
MFN
tariff %
2001/02
2002/03
2003/04
2004/05
2005/06
41.3
36.0
30.8
20.0
15.0
Preferential
tariff %
23.0
20.3
17.7
10.0
7.5
Price advantage for
Bangladesh exporters
over
MFN
exporters 70
13.0
11.5
10.0
8.3
6.5
From the perspective of actual or potential Bangladesh exporters to India (or equally from the
perspective of Indian importers) the reductions in the preferential tariff since 2001/02 have greatly
reduced the price disadvantage of Bangladesh exporters viz a viz domestic Indian suppliers. At the same
time, however, the price advantage of Bangladesh exporters over MFN suppliers has also declined, from
about 13% in 2001/02 to 6.5% in 2005/06.
Despite the large number of substantial SAPTA preferences and the decline in preferential tariffs
during this period, only seven industrial products with preferences appear among India’s principal imports
from Bangladesh in 2003/04, and the imports of each of these were less than $500,000 (Table 7.1). For a
number of these products the rates of preference are low (e.g. 10% for processed hides and skins) and so
the preferential tariffs are not much less than MFN tariffs, but for others imports were very small despite
very substantial preferences. In particular, the preferential tariffs for household soaps and toilet soaps
were only 4.6% versus MFN tariffs of 36%, but Indian imports from Bangladesh were only $250,000
and $160,000 respectively. This almost complete absence of response of Bangladesh exports to the
numerous and fairly substantial Indian preferences under SAPTA, and to the decline of the preferential
tariffs over the period, suggests once again that Bangladesh producers are probably not producing many
products that are in demand in India. Alternatively, if these products are being produced in Bangladesh, it
seems that, despite declining Indian tariffs, Bangladesh producers’ costs are too high to compete with
Indian producers, or with exporters in other countries who have to pay the higher MFN tariffs.
Textile and clothing (T&C) 71 products Three quarters of Bangladesh’s exports are ready made
garments, most of which go the US and Europe. How have these products been faring in the Indian
market, and would Bangladesh’s RMG industry export much to India if there were a bilateral FTA with
India, or if the T&C sector is not put on a SAFTA negative list ? These questions are explored in a case
study prepared for the project on the RMG industry. 72 The case study focuses on mens’ and boys’ woven
cotton shirts, which are major Bangladesh RMG exports, in order to make some more general points
about the likely consequences of free trade between the two countries in the T&C sector as a whole. As
background, the paper points out that Bangladesh RMG producers appear to have a marked labour cost
advantage over RMG producers in India, owing to lower wages and similar labour productivity, but that
India’s specific duties on many fabrics and garments (see section 3 above) –as intended- have succeeded
in preventing any substantial penetration of its domestic markets by developing country T&C producers.
70
71
72
Defined as the difference of the preferential tariff inclusive price from the MFN tariff inclusive price, expressed
as a percentage of the MFN tariff inclusive price
HS 50-63
Garry Pursell (2005, March). Free Trade Between India and Bangladesh? A Case Study of the Ready Made
Garment Industry
49
Under SAPTA, Bangladesh RMGs benefits from Indian preferences –mainly either 50% or 60%-and
these are applied to reduce to both the ad valorem and the specific components of compound tariffs.
These preferences are substantial-for example (see Fig 3.5) in 2005/06 the ad valorem equivalent of the
preferential specific tariff for Bangladesh on a $4 cotton shirt is estimated at 23.7%, whereas the ad
valorem equivalent of the tariff for a $4 MFN sourced shirt-say from China- would be 47.3%. MFN
tariffs at this level appear to be restricting Indian imports from MFN sources to high value brands and
products, and to be precluding any substantial penetration from these countries of India’s mass
consumption, low priced domestic markets. Presumably helped by this protection and the SAPTA
preference advantage, Bangladesh RMG exports to India-almost entirely woven cotton shirts -grew fairly
rapidly after 1999/2000 up to 2003/04, but the total level in that year ($4.57 million) was still tiny both in
relation to the Indian domestic RMG market and to Bangladesh’s total RMG exports. This general point
is also symptomatic of the low level of Bangladesh exports of other T&C products to India (see Table
7.1).
The case study then considers what would happen under an India-Bangladesh FTA on the
assumption that India would retain its specific tariffs on imports from MFN sources but either abolish
them just for Bangladesh as part of a bilateral FTA, or for all the SAARC countries as part of SAFTA.
Using the example of mens’ and boys’ woven cotton shirts, it works through the economic welfare
consequences on various alternative assumptions about the likely demand response in India and the
supply response in Bangladesh. This discussion brings out a number of points which overall suggest that
there is a quite a low likelihood that there would be very substantial Bangladesh RMG exports to India
even under this very favourable policy scenario, at least in the short to medium run. In particular:
• India is also a major exporter of RMGs, in 2003/04 with exports of $6.2 billion versus
Bangladesh’s exports of $4.9 billion.
• It also has a very large and diversified textile industry which exports on its own account and
supplies its RMG firms. By contrast, Bangladesh’s textile industry-especially the fabric sector-is
a problem industry with high costs and high domestic prices, and is protected against imports by
very high tariffs. As a result, Bangladesh’s RMG exporters rely mainly on imported yarns and
fabrics.
• The paper argues that the very high protection levels provided by India’s specific duties on
fabrics and garments are mostly redundant by wide margins. That is, actual domestic prices in
India of all T&C products-yarns, fabrics, garments, and made-ups-are probably not far above and
may even be below prevailing international prices at the cif stage in India. This generalization is
partly based on reports that imports for the domestic market (as distinct from duty free imports of
textile inputs by RMG exporters) of T&C products not subject to specific duties, have so far been
minimal despite substantial reductions in ad valorem tariffs. The report also notes that Sri Lankawhich is a major RMG exporter has had negligible RMG exports to India, despite the 75%
preference for garments negotiated under the Sri Lanka-India FTA. This preference means that
during 2003/04, 2004/05 and 2005/06 Indian preferential ad valorem tariffs have been 12%, 5%,
and 3.75% , and for garments subject to specific tariffs the tariffs for Sri Lanka are 25% of the
MFN tariff. In 2003/04, the ad valorem equivalent for Sri Lanka of the Indian specific tariff on a
$4 shirt would have been about 12%. As Sri Lankan exporters have not been competing in India
with these substantial preferences, the paper suggests that it would probably also be difficult for
Bangladesh RMG exporters to compete there, even if the protective umbrella of India’s specific
tariffs continues to keep out suppliers in the rest of the world.
• These likely difficulties of competing in India are compounded by the absence of a competitive
low cost textile industry in Bangladesh, more so for fabrics than for yarns. This means that RMG
firms exporting to India would have to deal with the usual delays and difficulties of international
procurement of their textile inputs, whereas the Indian firms with which they would be competing
50
•
•
•
would in general obtain their inputs at highly competitive prices nearby in the domestic Indian
market.
In this regard, the potential Bangladesh RMG exporters would need to satisfy whatever rules of
origin would be agreed under the FTA. Under SAPTA, the origin rule for Bangladesh is
minimum domestic value added of 30%, but for many RMG products this could be difficult to
meet unless some of the inputs are purchased in another SAPTA country e.g. India. If that turns
out to case, it would be crucial to ensure fast and low cost transport and Customs clearance of the
textile inputs obtained from India, preferably over the land border. Otherwise, if costs are high
and there are unpredictable delays, Indian importers will be deterred from ordering garments in
Bangladesh rather than in India.
The paper also points out that if the Indian RMG market were to be opened preferentially to
Bangladesh exporters on a free trade basis, and Bangladesh exporters were able to take advantage
of the opportunity, is likely that some of the RMG exports that go to India will be diverted from
other markets. Hence, not all of the increase in RMG to India would represent a net increase in
total Bangladesh RMG exports.
The RMG market in India is far larger and more diversified than RMG production in Bangladesh.
Even so, because of the importance of product differentiation in final consumer goods like
garments-style, fashion, brands etc-some Bangladesh producers might be able to find market
niches in India if they are able link into strong Indian marketing organizations. However the
reverse is also the case, and under an FTA with India, RMG exports from India to Bangladesh
based on these considerations might well exceed Bangladesh RMG exports to India. An
indication that this could happen is that during 2003/04 Bangladesh RMG imports from India
were just over $5 million 73 . These were mainly cotton trousers and shirts which were being
imported over an 85.5% tariff. The paper points out that if RMG imports from India were
profitable despite such an extremely high tariff, they would be likely to expand very substantially
with a zero tariff under an FTA. This would be especially likely if the Bangladesh textile sector
were excluded from the FTA by the use of a negative list, because Bangladesh garment producers
selling domestically would then continue to be burdened by much higher textile input costs than
their Indian competitors.
Agricultural, fish, livestock and processed food and drink products During 2003/04 exports of
these products from India to Bangladesh were $731 million 74 , but the reverse trade was tiny, just under
$29 million 75 . Of this, approximately $20 million was raw jute, Hilsa fish ($5 million), betel and some
other nuts ($2.2 million) and the rest consisted of very small volumes of frozen shrimp and fruit drinks.
Once again it is natural to ask whether these almost negligible recorded export levels and their persistent
failure to grow can be explained by restrictive Indian import policies. As noted in section 3 and discussed
in more detail in the World Bank trade policy Overview report, these policies in fact have been and
remain much more protective than industrial protection policies. In particular:
• Import of the main foodgrains is still monopolized by parastatals, and some grains and powdered
milk imports are subject to tariff rate quotas
• Tariffs on these “agricultural” products were excluded from the tariff reduction program which
started in 2002/03 and –except for system of specific duties protecting the T&C sector-remain
much higher than industrial tariffs. At present the generally applied tariff is 30%, but tariffs on
many products are much higher, so the unweighted average tariff is around 40%.
Does this mean that there would be substantial export opportunities for Bangladesh in India if
under an FTA, India were to remove its import restrictions and tariffs for Bangladesh while keeping them
73
74
75
Ibid pp 27-32
HS 01-24 plus raw cotton exports
HS 01-24 plus raw jute imports
51
in force for the rest of the world? A thorough answer to this question would require updating and
extending earlier studies of the relation of actual prices in both countries to world prices. However, there
are a number of reasons for thinking that such studies would find quite limited export opportunities in
India for Bangladesh exporters.
Firstly, as is the case of the textiles and clothing sector, the protection policies for some major
Indian agricultural and other primary products can be characterized as “just in case” policies. That is,
domestic prices are typically close to or even below world prices, but high protection is provided just in
case there are downward swings in world prices or discounted shipments that might disrupt farmers and
processors. Some obvious examples are for products which are regularly or periodically exported. For
example (Table 7.2):
Table 7.2: Indian protection policies for some major exported commodities
Tariff and NTBs in India
2004/05
Rice
Wheat
Maize
Sugar
Tea
Coffee
Onions
87.2%+STE
70% or 80% + STE
15% or 50% (TRQ)
60% +NTB
100%
100%
30%
Total exports
2003/04
$ million
907
520
77
264
338
162
156
Exports to
Bangladesh
2003/04
$ million
197
196
36
32
1
0
62
Notes: STE=State Trading Enterprise= import monopoly of Food Corporation of India (FCI). TRQ=Tariff
Rate Quota i.e. 15% tariff for a specified quantity of imports, 50% tariff for imports in excess of the quota.
NTB=Non Tariff Barrier. For sugar this refers to the application of the Essential Commodities Act to sugar
imports and to government surveillance of imports. See discussion in the project case study of the sugar
industry 76
In recent years Indian rice and wheat exports have been heavily subsidized in order to cover the
difference between domestic procurement prices and prevailing world market export prices. However
owing to international and domestic transport costs, cif prices are much higher than fob prices, and
domestic procurement and wholesale prices have typically exceeded the former –thus necessitating
subsidies if there are to be exports-but have usually been below or only slightly above cif prices, and cif
prices plus internal transport costs at inland Indian domestic markets. In any case, domestic prices have
been far below the theoretical landed cost of imported rice and wheat were they to pay India’s prohibitive
tariffs. These tariffs therefore are essentially supplements to FCI’s import monopoly over these and other
food grains 77 , and would be reduced with special exemptions if ever the government decided to allow
some imports. Domestic prices of maize and other coarse grains have also typically been within their fobcif bands i.e. above fob prices but lower than cif import prices in most years. Similarly, domestic prices of
tea and coffee have not been very different from export prices; in fact, in the case of tea, traders who sell
in both export and the domestic market buy the tea at the same auctions, so the expectation is that at this
level domestic prices for given qualities would be about equal. Finally, onion prices in India are highly
sensitive politically, and onion exports are subject to export controls, with the result that domestic onion
prices are generally well below export prices. All this suggests that there would be limited prospect for
76
77
Garry Pursell, 2004, December. Free Trade Between India and Bangladesh? A Case Study of the Sugar
Industry.
All food grains except maize and barley
52
exports of these products from Bangladesh to India with an FTA, certainly not in the case of rice, wheat,
coarse grains, sugar and onions which Bangladesh is importing from India on a fairly large scale.
Secondly, of Bangladesh’s principal primary and processed food exports-frozen shrimp, raw jute,
fish, tea, vegetables, and tobacco –all except raw jute are also exported on a much larger scale by India
(see Table 7.4). In 2003/04 Indian imports of shrimp and fish from Bangladesh were minimal despite a
relatively low 15% tariff resulting from a 50% SAPTA preference, and imports of vegetables and tobacco
were zero. This again suggests that domestic prices in India are probably close to, or not far above export
prices, probably leaving few opportunities for Bangladesh exporters even if an FTA were to cut the Indian
tariffs they face to zero.
Thirdly, as noted previously, in the project price surveys 78 , of 14 agricultural and processed food
products for which Indian and Bangladesh prices were compared, only one had a lower retail prices in
Bangladesh, and only two had lower wholesale prices.
Table 7.3: Some agricultural products and processed foods: comparisons of prices and
tariffs in India and Bangladesh
Rice
Wheat
Apple
Cumin seed
Grapes
Lentils
Mango
Onion
Red dry chilly
Turmeric
Soya oil
Mustard oil
Milk powder
Sugar
Ratio of Bangladesh price to
Indian price
Retail
Wholesale
1.77
1.48
1.15
n.a.
2.09
2.20
2.95
n.a
1.60
1.52
1.23
0.89
4.74
5.12
2.39
2.74
0.85
0.78
1.26
1.32
1.10
1.05
3.68
1.47
1.20
1.10
n.a.
1.85
Indian tariff
2004/05 & NTB
%
87.2+STE
70 or 80 + STE
50
30
40
30
30
30
70
87.2
Bangladesh tariff
2003/04
%
7.5
7.5
86
66.5
86
11
86
26.5
26.5/49
49/66.5
45
85
15 or 60 (TRQ)
60+ NTB
7.5
7.5
63.25 +NTB
98.4
Although there are large margins of error in these price comparisons 79 , they are broadly consistent with
what is known about the relation between past studies of Indian agriculture which have quantified the
prevalence of tariff redundancy in rice 80 , wheat and sugar. In addition, these comparisons also suggest the
likely existence of tariff redundancy in apples, cumin seeds, grapes, mangoes, onions, and milk powder,
because the excess of Bangladesh prices over Indian prices in these cases is too large to be explained by
78
79
80
Das, Samantak et al (op cit)
Among others, the observed prices are affected by many factors, including quality, specification, type of retail
or wholesale outlet, location, and seasonal influences.
The considerable excess of Bangladesh rice prices over Indian prices in the surveys summarized in the NCAER
paper is puzzling, since there were substantial exports of rice from India to Bangladesh at the time of the
survey. One of a number of possible explanations is that retail and wholesale rice prices in West Bengal (where
the Indian survey was carried out) were depressed by local supply surpluses, whereas the export prices for
Bangladesh were based on procurement prices in the surplus areas of north-west India. These were then
subsidized to bring them down to whatever was needed to undercut import prices that Bangladesh importers
might otherwise have paid for rice from Thailand or other exporting countries.
53
the excess of Bangladesh tariffs over Indian tariffs. Tariff redundancy might also explain lower prices in
India then Bangladesh for soya oil, mustard oil and turmeric despite much higher Indian tariffs than
Bangladesh tariffs. Only two comparisons –for red chillies and lentils-suggest some prima facie
possibility of exports from Bangladesh to India under an FTA.
Bangladesh’s secondary exports So far the prospects for Bangladesh exports to India have been
considered according to product groups which are treated differently by India’s import policies. Table 7.2
supplements this with some data on Bangladesh’s principal secondary exports, which usually account for
about 20% of its total exports. Exports of the principal 28 products and product groups during 2002/03 as
reported by the Bangladesh Export Promotion Bureau, are given in the first column, and data on Indian
imports, exports and tariffs in the adjacent columns. Note the following:
• Total exports of the 26 products in 2002/03 were approximately $1.4 billion, but only $51 million
of this total -3.6%-were exports to India 81
• Exports to India were accounted for almost entirely by four products-fertilizers, raw jute, jute
manufactures, and frozen fish. Of the remaining 24 products, for 12, exports to India were zero,
for 10, less than $1 million, and 2 could not be quantified but were probably also zero or very
small.
• Exports to India were zero or low even though India’s preferential tariffs for most of them are
very low. In 2005/06 India’s tariffs on 22 of the products were 15% or less, and most were below
10%. Only 6 of the products were subject to high or relatively high tariffs in India: tea (100%),
vegetables, tobacco, and cigarettes (30%) and textile fabrics and terry towels (both subject to
specific duties)
• India is also exporting 21 of the 28 products, in most cases in much larger volumes than
Bangladesh.
These observations suggest that the prospects for exporting these products to India under an FTA
are quite limited. This is because (1) the Indian tariffs on the products that are currently being exported to
India in non-negligible quantities-fertilizers and raw jute- are zero and 2.5%, so an FTA would make little
difference; (2) exports of the other products to India are zero or negligible despite low Indian preferential
tariffs in most cases (sports footwear and ceramic tableware 3.75%, tents 7.5%); (3) with only five
exceptions, exports would have to compete in India with Indian firms that are exporting themselves and
are likely to be highly competitive in their domestic markets. This leaves five products which are not
being exported by India in which Bangladesh exporters conceivably might have better prospects in the
Indian market under an FTA viz caps (headgear), tents, ceramic tableware, camera parts, and golf shafts.
However, the advantage for these products of an FTA over the situation in 2005/06, would be quite
limited in view of the already low 2005/06 preferential tariffs (respectively 15%, 7.5%, 3.75%, 7.5%, and
15%)
Summary: The very low level and slow growth of Bangladesh’s exports to India is not primarily
attributable to restrictive import policies in India. Indian tariffs on industrial goods have fallen
dramatically in the past three years and are now at historically low levels, and even lower on many
products on which India has given large numbers of substantial preferences to Bangladesh under SAPTA.
Important exceptions to these developments are textiles and clothing, where many fabrics and garments
are protected by specific duties, and “agriculture” (understood in the broad WTO sense to include to also
include fish and livestock products and processed foods) where there are still government import
monopolies and other NTBs, and tariffs are still vary from high to prohibitive. But there is a great deal of
tariff redundancy in both these two sectors, with domestic prices of most T&C products (including ready
81
Exports to India are from the Indian import statistics and are given for Indian fiscal 2002/03 for comparability
with the Bangladesh EPB’s 2002/03 export data. There were no major changes in India’s imports of these
products during the Indian fiscal 2003/04.
54
made garments) and of many agricultural products are at or even below international prices. In addition,
in the industrial sector, many more Indian industries than in the past are exporting, and domestic markets
are increasingly competitive. This means that the prospects for the expansion of Bangladesh exports to
India are at present quite limited, and would remain modest even if Bangladesh from an FTA with India
under which Bangladesh exporters would have duty free access to the Indian market, while the present
tariffs and other restrictions on imports into India from the rest of the world would remain the same.
55
Table 7.4: Bangladesh's principal exports other than garments: Indian exports, imports and tariffs
Bdesh
Bangladesh exports
during 2002/03
Indian
imports
Indian
exports
HS code
030613
4107
5310??
5307/5607
5303
6504
310210
281420
8712
630619
6404/6405
5802
630710
0303
691110
900691
49
27101950
Various
2710
090240
07
950631
240220
39232910
64
85392190
2401
Various
Indian tariff 2005/06
MFN
Shrimp
Leather (bovine)
Jute manufactures
Jute yarn/twine
Raw jute
Cap
Urea#
Anhydrous
ammonia#
Bicycles
Tent
Leather footwear
Terry towel
Shop towel
Frozen fish
Ceramic tableware
Camera parts
Printed materials
Furnace oil
Textile fabrics
Naphtha
Bulk tea
Vegetables
Golf shaft
Cigarettes
PVC bags
Sports footwear
Indicator lamp
Tobacco
Handicrafts
Total
$ million
297.0
191.2
133.7
122.8
82.4
81.7
78.6
To India
$ million
0.3
3.3
0.1
20.4
0.0
25.3
2003/04
$ million
61.7
1.5
1.1
1.0
20.5
0.0
102.8
238.8
2003/04
$ million
836
135
65
76
1
1
3
%
30
15
15
15
5
15
0
5
Pref
for Bdesh
%
15
13.5
6
7.5, 6.0
2.5
15
0
0
52.5
46.8
35.1
29.6
26.9
24.8
18.8
17.3
16.6
16.2
15.2
15.0
13.7
13.2
10.3
10.3
9.9
9.0
7.2
6.7
5.9
0.1
0.0
0.0
1.9
0.0
0.1
?
0.0
0.0
?
0.0
0.0
0.0
0.2
0.2
12.4
0.1
0.3
26.6
818.0
22.6
18.8
0.1
0.8
0.1
37.0
0.2
0.4
?
44
2
557
12
22
124
3
1
95
185
4186
861
236
329
0
29
13
768
5
174
?
15
15
15
15 +S
15
30
15
15
0 or 15
10
15+S
5 or 10
100
30
15
30
15
15
15
30
15
15
7.5
7.5
6 +S
7.5
15
3.75
7.5
0 or 7.5
10
6 or 7.5+S
5 or 10
100
30
15
30
7.5
3.75
6
30
7.5 ?
Notes: Bangladesh total exports in 2002/03 from Export Promotion Bureau website at www.epbbd.com EPB treats
sales of somelocally produced intermediate to Bangladesh exporters as "exports" : these have been excluded from
this table (e.g. zippers and acrylic yarn). # "Chemical fertilizer" exports in the EPB statistics are urea and
"anhydrous ammonia" in the Indian import statistics (Table 7.1) HS codes are not given for some of the product
groups so in these cases the comparisons with the Indian trade statistics are approximations, and could not be made
in the case of "handicrafts" Indian tariffs from Goyal Easy Reference Customs Tariff 2005-06. Indian exports and
imports in 2003/04 and Bangladesh export to India in 2002/03 from DGFT trade database. 0.0=<$0.5 million, -=zero
Geater of ad valorem or a specific duty indicated by ad valorem duty rate and +S
56
Chapter 8: Informal and illegal trade: dimensions, trends, composition, and
the role of domestic indirect taxes
Ever since Bangladesh’s independence there has been a substantial informal unrecorded trade
across the India-Bangladesh land borders, and a number of studies both in Bangladesh and in India have
dealt with different aspects of it. 82 Much of this trade is quasi legal and is best characterized as
“informal” rather than illegal, because there is wide participation by local people in the border areas, the
trade generally bypasses Customs posts, and because –as S.K. Chaudhuri’s classic study noted-“the field
operators generally operate in liaison with the anti-smuggling enforcement agencies”. 83 Informal trade of
this kind usually involving large numbers of local people individually transporting small quantities-often
just as head loads or by bicycle rickshaw-and in Bangladesh is sometimes called “bootleg” smuggling. At
the other extreme there is trade which goes in larger quantities-mostly by truck-through the formal legal
Customs and other channels, but which involves explicitly illegal practices such as underinvoicing,
misclassification and bribery of Customs and other officials, and which in Bangladesh is sometimes
called “technical” smuggling.
While these two types of smuggling are conceptually distinct, the various studies also recognise
that there is continuum of smuggling activities between them, involving for example medium and larger
scale operators using trucks or boats which may cross the border at Customs posts without being
recorded, or in regions where there are no Customs posts. In addition, although the goods may be carried
across the border in small quantities by large numbers of people, trucking to the border areas-often from
distant parts of India-and storage there-is frequently organized by medium size and large traders who are
also exporting to Bangladesh through formal channels. The inevitable absence of a clear demarcation
between these kinds of smuggling has been a problem for the various studies which have attempted to
quantify the level and composition of this trade through systematic interviews of “knowledgeable
persons” in known smuggling centres. With the exception of some separate estimates of “technical
smuggling” into Bangladesh in the study prepared as part of this project, all the past studies have focussed
on “bootleg” smuggling and have reported accordingly, but it is unlikely that the “knowledgeable
persons” responding were distinguishing between these two different smuggling routes. Hence, among the
many other obvious difficulties of obtaining some rough quantification of this trade, the estimates of
“bootleg” smuggling-especially in the region of the principal Petrapole-Benapole land border crossing-are
likely to be picking up the results of “technical” smuggling as well. This in turn means that adding
separate estimates of “technical” smuggling to estimates of “bootleg” smuggling will overstate the total
value of unrecorded trade.
All the literature on the India-Bangladesh unrecorded trade confirms that this trade is essentially
one-way, from India to Bangladesh. Omitting gold, silver and currency which is imported into India in
part to pay for Indian goods, the 1994 NCAER survey estimated Bangladesh to India unrecorded trade at
only about $10 million 84 , compared with an India to Bangladesh estimate of $371 million. In order to
update previous studies on the latter, under this project quick surveys were carried out during April-May
2002 in five smuggling-prone zones along Bangladesh’s western borders with India, and in three zones in
its north and eastern borders with India. Based on the opinions of police, security forces and others, and
on earlier more complete surveys, these eight zones were considered to account for 77% of the total of
82
83
84
Seven of these studies are briefly reviewed in the project paper on informal trade. India-Bangladesh Informal
Trade: Findings on Bangladesh Imports from India. Draft mimeo, January 2005.
Chaudhuri, S.K. (NCAER) 1995. Cross Border Trade Between India and Bangladesh, p.27. Italics added. The
report continues: “Once in a while, either due to a breach of the understanding or to demonstrate efficiency or
agility of the law enforcing staff (to meet anti-smuggling targets, if any), some seizures are stage managed and
the petty operators bear the consequences”.
Ibid p. 53, Table 3.5
57
bootleg imports. In addition, a separate study was made of “technical” smuggling, based on interviews
with importers, Customs agents and officials and others at Benapole and Chittagong, as well as a sample
of Bangladesh Customs intelligence inspections of shipments at Benapole between January and
November 2002.
These estimates of “bootleg” smuggling were then compared with similar 1998 estimates for the
same five western zones in a study by Rahman and Razzaque 85 . For this synthesis, this comparison has
been taken back further to include the results of the Chaudhuri (NCAER) study, which was based on field
surveys in India during July and August 1994, and which also focussed on bootleg smuggling. 86 This is
combined below with some findings from some of the other project consultant studies to comment on the
total size of, and trends in this trade and its commodity composition. This is followed by a discussion of
the role of domestic indirect taxes in the smuggling trade, which has largely been ignored in previous
work, and finally by a summary of policy and other reforms which would affect smuggling and which
would seem to be in the economic interests of both countries, whether or not they participate in an FTA.
Size According to the 2002 surveys and some very approximate extrapolations from them,
Bangladesh’s smuggled imports from India during 2002/03 were approximately $500 million, or about
40% of recorded imports from India, and approximately 30% of total imports (recorded plus smuggled)
from India (Table 8.1). The total value of goods imported by “technical” smuggling- underinvoicing,
misdeclarations and other illegal practices at Customs- is estimated to exceed total “bootleg” smuggling
by a substantial margin, and most of the “technical” smuggling occurs at the land border. Between them,
‘bootleg” and “technical” smuggling at the land borders add about 70% to total land border imports
(Table 8.2) but appear to be much less prevalent in the sea and air trade. Based on surveys at Chittagong
which asked about underinvoicing and misdeclaration practices, total technical smuggling of imports
from India by sea and air was about 17% of the total recorded value of this trade, compared to 32% of the
total recorded value of imports by the land border. These shares would be somewhat lower if it were
possible to allocate “back-to-back L/C” imports (i.e. duty free imports of inputs used by Bangladesh
exporters) between the land border and the sea trade, but these imports are not recorded by NBR and the
available estimates are from Bangladesh Bank statistics on letters of credit which do not distinguish these
two routes.
For many reasons that are emphasized in the 2002 survey reports, the estimates of “bootleg”
smuggling and even more so the estimates of “technical” smuggling are very rough approximations at
best and subject to wide margins of error. Indications of the possible size of these errors is apparent from
the project study on trade financing and the case study of the sugar industry. In the first study, a byproduct of interviews with “knowledgeable persons” in India on India-Bangladesh trade financing gave
estimates of the value of live animals and some major smuggled commodities which were much larger
than the estimates based on the surveys in Bangladesh:
These estimates in the Goyal study were based on the opinions of relatively few people and may
not be reliable, since the focus of the study was on financing and they were not systematically checked
against the estimates of other informed people. However, Goyal’s estimate for sugar smuggling is roughly
consistent with the sugar case study, which estimates sugar smuggling at between $170 million and $215
million in 2001/02 and from $100 million to $127 million in 2002/03. A partial explanation for these
discrepancies may be that Goyal’s and the sugar study estimates were including “technical” as well as
85
86
Rahman, A. and Razzaque. 1998. Informal Border Trade between Bangladesh and India: An Empirical Study in
Selected Areas. The Asia Foundation.
The 2002 study is the first documented attempt to estimate the size and scope of “technical” smuggling. There
are a number of other estimates of the approximate total size of technical smuggling, but none of them explain
in detail how the estimates are arrived at.
58
“bootleg” smuggling, whereas the Bangladesh surveys which distinguish individual products are in
principle for “bootleg” smuggling only. Even so, the resulting discrepancy in the estimate of total land
border smuggling is very large: for example, the total discrepancy of just these five commodities as
reported in Goyal’s study, would about double the survey-based total (bootleg+technical) estimate for
2002/03 from $422 million to $831 million, and assuming a smaller discrepancy for sugar of $100
million, still increases the total survey based estimate by about 40%, from $422 million to $708 million.
These very large differences underline the importance of coordinated contemporaneous surveys on both
sides of the border with iteration between the survey teams involved to explore and narrow down
discrepancies. Unfortunately, all the studies which have aimed to quantify cross border smugglingincluding the 2002 Bangladesh survey, the 1998 Bangladesh surveys reported by Rahman and Razzaque,
and the 1994 NCAER survey –have all faced time and resource constraints which would have been
needed for this kind of coordination, and therefore are based solely on the analysis of survey results
dealing with imports in the case of the Bangladesh surveys, and on exports in the case of the 1994
NCAER survey in India 87 .
Live animals (mainly cows &
buffaloes)
Sugar
Rice
Wheat
Onions
TOTAL
2002 Bangladesh
survey
$ US million
100
Goyal: trade
financing report
$US million
222
Difference
$US million
27
9
14
1
151
250
30
48
10
560
+ 223
+ 21
+ 34
+9
+ 409
+122
Trends Table 8.3 compares the estimates of “bootleg” smuggling from the three surveys
mentioned above and compares these with the Bangladesh statistics of recorded imports from India for
the same years (for comparability excluding back- to- back LC imports in all years since they are not
available for FY 1995 ). According to these estimates, during the 8 years total bootleg smuggling declined
both in absolute terms and relative to total recorded imports from India, the latter from 58% of total
imports in FY 1995 to to 20% of total imports, and from 51% of total imports by the land border in FY
1998 to 41% of land border imports in FY 2003. It might be tempting to conclude from these statistics
that smuggling from India has been declining and to link the apparent decline to import liberalization in
Bangladesh, in particular to the steady reduction of Customs duties during the same period. However, for
a number of reasons this would be a hazardous generalization:
• The discrepancies discussed above between the Bangladesh 2002 survey-based estimates of
smuggled cattle and some major commodities, and alternative estimates from the Indian side, are
very large and would need to be checked before generalizing about trends
• The 2002 Bangladesh survey is the only attempt to quantify “technical” smuggling, and without
estimates for earlier years no generalizations about trends are possible. In this regard it is relevant
87
This study used information provided by BIDS on smuggling centres in Bangladesh to help choose the outward
smuggling centres in India to be surveyed, but the smuggling estimates were entirely based on interviews in
India. The goods being smuggled were valued at prevailing prices in these regions, which were considerably
lower than the prices at which the goods were sold on the Bangladesh side. Ideally, these valuations would need
to be adjusted to compare the NCAER smuggling estimates with estimates made in Bangladesh. The NCAER
study had a separate component dealing with underinvoicing through the comparison of the Indian and
Bangladesh trade statistics, but concluded (p.99) that statistical errors and other factors (including especially
overinvoicing on the Indian side to benefit from Indian export incentives) were too pervasive to allow realistic
estimates. The study (pp 18-19) also did not attempt to deal with misclassification, understatement of weights
and quantities and similar practices at Customs.
59
•
•
to note that trends in “technical” and “bootleg” smuggling are probably related. For example, if
smuggling through underinvoicing and other means through the legal route becomes more
difficult, it is likely that some smuggling will be diverted to “bootleg” routes, and vice versa.
Despite the introduction of pre-shipment inspection in India for Indian exports to Bangladesh and
other measures, the consultant studies do not indicate that the legal route has become markedly
more rigorous, at least at the land borders.
According to the sugar industry case study, sugar smuggling increased between FY 1995 and FY
2002 : it only declined sharply after imports via the land border were banned in 2003, suggesting
that large quantities of sugar were previously being imported illegally under the cover of legal
imports.
Finally, as discussed previously, since the mid-1990s in some key respects Bangladesh’s import
policies have become more, not less distortive. Changes in tariffs seem to be related to smuggling
incentives in the following ways, and overall it is plausible that the net incentive to smuggle may
have increased rather than decreased:
o Including para-tariffs, Bangladesh’s protection rates on a wide range of locally produced
consumer goods have gone up, many to very high levels, increasing the incentive to
smuggle, especially at Customs by underinvoicing, misclassification and other practices
o Although Bangladesh’s longstanding ban on the import of textile fabrics was recently
removed, textile fabric protective import duties remain very high and continue to provide
a strong motive for fabric smuggling from India
o Tariffs on a few important products which are smuggled on a large scale have remained
low during the period (e.g. rice and wheat) so this incentive to smuggle has not greatly
changed.
o Tariffs on most industrial raw materials, parts and components and machines have
declined, reducing the incentive to smuggle them by both the “technical” and bootleg
routes.
o However, the increasing bifurcation of protection rates, with very high tariffs (including
para-tariffs) on locally produced consumer goods and low tariffs on raw materials and
intermediates, will have increased the incentive and potential for “technical” smuggling
through false documentation i.e. falsifying the description of products so that they are
misclassified as products subject to low rather than high tariffs
o The incentives for “ technical” smuggling through under declaration of the quantities of
duty free shipments of inputs for exporters–especially yarns, fabrics, dyes and other
inputs for use by RMG exporters- has probably not greatly changed and remains
considerable.
Composition According to the 2002 surveys, the value of “bootleg” smuggling was divided as
follows:
Cows and buffaloes
Agricultural products
Processed foods
Textiles
All other
% of total
43
14
17
16
10
Of which 90% rice, wheat,
pulses & timber
Of which 88% sugar
Of which sarees 63%
43 products
These shares were roughly the same as in the 1998 survey, except for an increase in the share of
processed foods (nearly all sugar) and a smaller share of textiles. The products being smuggled
60
correspond fairly closely to the products mentioned in NCAER’s survey of exporters in Kolkata 88 . In this
survey, for products which were the same or similar to those they were exporting, the exporters were
asked whether the “source of entry” into Bangladesh was (1) legal only (2) illegal only or (3) both legal
and illegal. For 52 products, the responses divided as follows 89 :
Type of product
Agricultural
Processed foods
Manufactured
Mineral (bauxite)
TOTAL
“Source of entry”
Legal only (no. of Both
legal
products)
illegal
(no.
products)
4
10
1
3
20
13
1
0
26
26
and
of
Since the question just referred to the entry channel, “illegal” is best interpreted as bootleg
smuggling i.e. exports that were going over the border and bypassing the Customs posts. However,
underinvoicing and similar practices could have been going on when the products were exported by the
legal route.
There is very limited information on the commodity composition of “technical” smuggling. Some
indication is provided by the diverse set of agricultural and industrial products included in 52 shipments
that were inspected by Bangladesh Customs Intelligence at Benapole during January –November 2002
and found to have under-declared the weight or the number of items in the shipment (Table 8.4). Most of
these shipments were of industrial products-only 8 of the 42 (4 of rice, 2 of spices, one each of coconuts
and lentils) were agricultural products. Judged by the number of separate shipments, false declarations
were most common for paper board and paper products, followed by sanitary ware. Under-declarations of
weight or quantity varied from 10% to 67% and averaged about 30%, but values were not provided in the
data set, so it is not possible to infer anything about the ranking of different commodities in terms of the
value of technical smuggling.
The third column of Table 8.4 shows the import duty rates to which these products were (or
should have been) subject during FY 2003. The first rate is the protective tariff including the protection of
the para-tariffs, and the second is the total rate the importer would have had to pay inclusive of VAT. In
two cases (rice and lentils) the import duty rate was very low by Bangladesh standards (7.5%) and both
were exempt from VAT, but the import duty saving was probably substantial due to the fairly large
quantities involved, in the case of rice (four consignments) 734 tons declared as 410 tons, and in the case
of lentils 130 tons declared as 100 tons. However all the other tariffs were much higher: mostly 35.5%
before VAT and 55.9% with VAT included. Tariffs at these levels combined with under declaration of
quantities (e.g. a shipment of stainless steel kitchen ware- declared quantity 12 tons, assessed quantity 16
tons) provide large financial savings if they are not prevented. Another example is sanitary ware which
accounts for 5 of the 52 consignments in the data set, with a total of 7333 pieces declared as 4100 pieces,
and very high tariffs in 2002/03 –inclusive of VAT 71.1% (plastic sanitary ware) and 132.1% (ceramic
sanitary ware). Sanitary ware products (see Fig 8.5) are a few of many mostly final consumer goods for
which protective tariffs were sharply increased after 1998/99, in order to encourage and protect local
producers, and this example demonstrates one of the consequences of these policies at Customs and on
smuggling incentives and the volumes of goods being smuggled.
88
89
17 products mentioned as being smuggled by the exporters were also on the list of smuggled products turned up
by the Bangladesh survey. 9 products were not, however: 3 agricultural, 1 processed food, and 5 manufactures.
The NCAER survey did not attempt to estimate quantities or values of the smuggled goods.
Das, Samantak et al, op.cit Table A.2
61
Smuggling and domestic indirect taxes. The various past studies of informal and illegal trade
between India and Bangladesh, pay little or no attention to domestic indirect taxes i.e. in India, the central
excise tax and the central and state sales taxes (the latter recently replaced in most states by a state VAT),
and the VAT in Bangladesh. Yet these are very important for understanding the nature and modalities of
the trade and its economic impact. In both countries agricultural products, livestock and fish are exempt
from these taxes, and this is presumably one of a number of reasons why they dominate the estimates of
“bootleg” smuggling. But manufactured products in India, including most processed foods, are subject to
indirect taxes which are generally at least 20% (the 16% central excise tax plus sales tax or state VAT). If
these products are purchased in India at retail, wholesale or even from the producing factories, the
purchase prices will (or should in principle) include these taxes. Hence, if the goods are then smuggled
over the border by the bootleg route, the indirect taxes are a kind of de facto export tax under which the
Indian central government and an Indian state government (e.g. West Bengal) in effect taxes the eventual
buyers in Bangladesh. Alternatively, since the smuggled goods presumably escape paying the VAT in
Bangladesh, this amounts to a transfer from the Bangladesh government to the central and state
government in India, insofar as the smuggled goods substitute for locally produced or legitimately
imported goods that would have been subject to the Bangladesh VAT.
However, as noted above, if Indian manufactured goods are exported to Bangladesh by the legal
route, the cost of the goods to the exporter does not include these domestic indirect taxes, which means
that the cost to (say) an exporting trader will be at least 17% less than the cost of the same goods
purchased domestically, in addition to which the cost of the goods is further reduced by duty drawback,
DEPB or one of the other mechanisms by which exporters are either exempted from, or compensated for,
import duties which increase the costs of their raw material inputs. On the other hand, from the
perspective of a Bangladesh importer choosing between the formal legal route and the bootleg route, the
formal route involves Bangladesh Customs duties including the Bangladesh VAT and the associated
transport and transaction costs. Hence preferences for the formal route will be influenced by:
• The level of Bangladesh protective tariffs. If these are low or the products exported are exempt
(as is the case for inputs and equipment used by Bangladesh exporters) the formal route is
obviously preferable, but if the tariffs are high –as is the case for most Bangladesh manufactured
consumer goods-there will be a strong incentive to ship by bootleg routes
• The rigor of Customs administration, especially on the Bangladesh side. If high import duties can
be reduced or evaded by misclassification, underinvoicing and similar practices and if the bribes
and other side payments and the risk of penalties do not absorb too much of the perceived
benefits, the attractiveness of the bootleg route will be reduced and will be substituted by
“technical” smuggling in the legal route.
• The nature of the goods and VAT administration in Bangladesh. The VAT charged on imported
goods would not be a deterrent to importing if VAT administration in Bangladesh were rigorous
and if it covered all products and all stages of production and distribution. In that case the VAT
charged on importing could be offset against VAT liabilities at subsequent points in the
production or distribution chain and would not be a disadvantage for Bangladesh importers using
the formal route as against importing by the bootleg route, where there would be no documented
VAT payment to credit against subsequent transactions. In practice the Bangladesh VAT is
reported to effectively cover formal manufacturing activities but does not effectively extend to
wholesale and retail distribution. In that case the VAT would not constitute a disadvantage (or at
least not a substantial disadvantage) for importing intermediate raw materials and components
from India by the formal route, but is likely to be a substantial disadvantage for the import of
final consumer goods (including replacement parts of consumer durables) by the formal route.
Hence evasion of the Bangladesh VAT on imports of consumer goods is an independent extra
motive to either smuggle by the bootleg route or participate in underinvoicing and other evasion
practices using the legal route. This is even more the case if the Bangladesh “supplementary
62
duty” is used to raise Bangladesh protection rates, since both duties are included in the base for
the VAT 90 .
• The state of the infrastructure (roads, storage, technical and administrative capabilities etc) on
both the Indian side and the Bangladesh side at the border Customs posts, and the resulting time
and transaction costs associated with the use of these formal routes. It is widely recognized, both
in India and Bangladesh, that there are serious deficiencies on all of these counts at the land
Customs posts, most importantly at the Petrapole-Benapole crossing. As already noted, a major
problem on the Bangladesh side is that all except a few of its Customs posts are restricted to
clearing a very limited set of products. This means that exporters or potential Indian exporters of
the many products not on this list in most areas along the land borders have to choose between
shipping the goods over long distances to the few places where legal imports are authorized by
Bangladesh, or organizing for them to be shipped across the border by the illegal bootleg route
Some conclusions The above discussion suggests a number of policy and other reforms that
would serve the economic interests of both India and Bangladesh by channelling trade away from the
bootleg routes to the formal routes and by reducing the incentives and scope for corrupt practices in the
formal routes
• Bangladesh would bring down its presently very high tariffs protecting import substitution
industries by reversing the policies under which protection rates have been drastically increased
over the past 6 or 7 years by the use of para-tariffs on top of Customs duties
• Both countries would improve the infrastructure –physical and administrative-at their land border
Customs posts. This would need to be done in a coordinated way-there would no point if the
infrastructure were improved on one side of the border but bottlenecks were to remain or even
increase on the other side of the border.
• Both countries would continue and accelerate efforts to streamline and improve the administrative
structures that affect land border trade, especially Customs administration. For Customs the
purposes would be to speed up and simplify Customs clearance and to reduce the incentives for,
and scope of corrupt practices. The present pre-shipment inspection system at present operating in
India on behalf of Bangladesh Customs would be part of this effort
• The administrative reforms would include expanding the facilities and the Customs clearance
powers available at Bangladesh’s smaller land border Customs posts
• Bangladesh would continue to expand the effective coverage and improve the administration of
its VAT system
For Bangladesh these reforms would reduce the incentives for imports from India to come by the
bootleg route, under which a substantial share of the economic rents are collected on the Indian side, both
in the form of smugglers’ margins and Indian indirect taxes included in the purchase prices of the goods
in India. The trade diverted to the formal channel would provide Customs revenue, and this would be
higher if administrative and other reforms reduce the scope for corrupt practices. Better infrastructure,
faster clearance times and reduced transaction costs would also improve the prospects of Bangladesh
exporters finding market niches in India, especially if they rely on importing inputs from India since in
that case two border crossings are involved.
These reforms would also benefit India, first by reducing “black economy” activities in India
associated with the bootleg border trade and the organization of “technical” through Bangladesh Customs,
and secondly by improving the access of Indian exporters to the Bangladesh market.
90
For example, with a 25% Customs duty alone the 15% VAT is 18.8% of the cif price, but if a supplementary
duty of 25% is also imposed, the VAT becomes 23.4% of the cif price.
63
Table 8.1: Bangladesh imports from India 2002/03: recorded plus survey-based
estimates of smuggled imports
Recorded: land border
Recorded: sea and air
Recorded: back to back LC
Total recorded imports
Bootleg: land border
"Technical" smuggling (land)
"Technical" smuggling (sea)
Total unrecorded imports
$US
million
580
535
95
1210
% of
total
34
31
6
70
237
185
90
512
14
11
5
30
1722
100
Total imports
Sources: recorded imports from NBR trade database, back to back LC imports from Bangladesh
Bank, estimated smuggled imports from surveys during 2002.
Table 8.2: Bangladesh land border imports from India 2002/03:
recorded plus survey-based estimates of smuggled imports
$US
million
Recorded: land border
Bootleg: land border
"Technical" smuggling (land)
Total land border imports
Sources: as for Fig 8.1
580
237
185
1002
% of
total
58
24
18
100
Table 8.3: Trends in estimated "bootleg" smuggled exports from India to Bangladesh
FY
Recorded
land
Recorded
total
Estimated
bootleg
Estimated bootleg as
% of
% of
land
total
$ million
$ million
$ million
1995
n.a.
645
371
n.a.
58
1998
603
786
309
51
39
2003
580
1176
237
41
20
Notes: Back to back LC imports from India n.a. in FY 1995 & have been excluded from the FY 1998 and FY 2003
imports for consistency. Land border imports also n.a. for FY 1995." Bootleg" imports from studies mentioned in
the text.
64
Table 8.4: Some examples of "technical smuggling": sample of consignments
inspected at Benapole (January-November 2002) and found to have
declared quantities less than assessed quantities
No of
consignments
Paper board and paper products
Sanitary ware
Marble & granite
Rice
Magnesium sulphide
Spices
Methi (?)
Motor parts
Vushi (?)
Leaf springs
Acetic acid
Coconut
Stainles steel kitchen ware
Lentils
Chips (?)
Plywood
Poultry feed
Synthetic sarees
Medicinal herbs
Assorted goods
Insulator/electrical arrestor
Total number of consignments
15
6
5
4
3
2
2
2
1
1
1
1
1
1
1
1
1
1
1
1
1
52
Import duty rates
%(Before VAT/after
VAT)
25.5/44.4
48.8/71.1 or 92.2/132.1
25.5/44.4 or 35.5/55.9
7.5/7.5
35.5/55.9
35.5/55.9
25.5/44.4 or 35.5/55.9
35.5/55.9
26/26
35.5/55.9
7.5/7.5
35.5/55.9
52.1/52.1
Notes: The product descriptions are not precise and the HS codes and tariffs are not reported in the original data
from which this table is compiled. Consequently the 2002/03 tariffs indicated in the third column may not be the
same as the actual tariff rates. Blanks indicate that the product description is not sufficiently detailed to attribute a
tariff. The two sets of rates for sanitary ware are respectively for plastic and ceramic sanitary ware.The inspections
were undertaken by Bangladesh Customs Intelligence
Fig 8.5: Bangladesh sanitary ware tariffs FY 98 and FY 2003-2005
FY
1998
2003
2004
2005
Ceramic HS 6910
Protective
Incl
VAT
rate %
%
47.2
68.9
92.2
89.0
64.0
132.1
128.3
98.1
65
Plastic HS 3922
Protective
Incl
VAT
rate %
%
47.2
68.9
48.8
66.0
59.7
71.1
90.9
83.7
Chapter 9: Trade financing, logistics and transaction costs
As part of the project, consultant studies were prepared on the financing of India-Bangladesh
trade and on some aspects of its logistics. The original intention was to deal with Bangladesh exports to
India as well as Indian exports to Bangladesh, but in both cases the surveys and studies only covered the
latter, mainly because the volume of Bangladesh exports to India is so small that it was difficult to
identify participants that could throw much light on these aspects. Ideally this work would have been a
coordinated effort carried out in both countries, but for various reasons it was done only on the Indian
side by Indian consultants. Despite these shortcomings, the studies have brought out some interesting
aspects of these activities. The principal findings are briefly summarized below, first for trade financing,
and secondly for trade logistics and transaction costs.
Trade financing
This study 91 deals with the financing of Indian exports to Bangladesh-both exports by the legal
route, and informal (smuggled “bootleg”) exports. It distinguishes the following principal sources of
foreign exchange and mechanisms by which Bangladesh importers pay for imports from India:
• LCs issued by Bangladesh banks
• Lines of credit released by the Indian government for Bangladesh imports of Indian capital goods
• Informal hawala (also known as hundi) payment networks
• Remittances from Bangladeshis working outside South Asia (especially in the Middle East)
through the hawala networks
• Remittances to Bangladesh from the large Bangladesh migrant communities living in India
• Smuggling of gold and currency (mainly Taka) into India from Bangladesh
• Illegal trafficking in narcotics, arms, stolen property and women and children from Bangladesh
into and through India
The study makes a number of points about these financing mechanisms which are highly relevant
for understanding the nature of the bilateral trade.
First, as regards LCs, it notes that Bangladesh government rules they are compulsory for all
import consignments in excess of $ 5000, but involve very high transaction costs. This is principally due
to high charges (up to 3% of the transaction) for LC confirmation by a prime US or other developed
country bank. In addition, until December 2003 Bangladesh importers were required by Bangladesh Bank
to deposit compulsory margins which tied up working capital and involved a substantial extra cost as the
margins generally exceeded the margins that would have been required by the banks issuing the LCs.
According to the study, adding these costs to a variety of other transaction costs makes LC financing
prohibitively expensive for most Bangladesh importers, so most LCs are not confirmed by prime foreign
banks and therefore do not provide working capital to the Indian exporters since they cannot be
discounted. In addition delivery of the goods in Bangladesh is typically taken by the importers without
negotiating the LCs, so that in practice “the LC is a mere cover to move goods through the Customs” 92 .
The study comments that LC costs would have declined since Bangladesh Bank’s compulsory margin
requirements were dropped in December 2003, but implies that the costs are still too high for the LCs to
in fact finance imports from India, and that payments and delivery of the goods are being directly
negotiated between the Bangladesh buyers and the Indian suppliers without any substantive role for the
compulsory LCs except as additional documentation during Customs clearance.
91
92
Goyal, Arun (2004, Ocotober). Study on Financing of India-Bangladesh Trade
Ibid p.13
67
This finding, that the LCs in this trade are not in practice being used for their normal function of
reducing the risks and facilitating financing for both the importers and the exporters, implies that they
would not be used in the trade if they were not compulsory. If this is correct, they involve non-negligible
transaction costs without protecting the suppliers and importers against commercial risks such as
defective shipments, non-payment, delayed payments etc. 93 A priori, this would appear to be relevant in
any assessment of whether compulsory LCs are in fact an effective additional check on underinvoicing
and other illegal practices at Customs in the India-Bangladesh trade.
Secondly, the study points out that the hawala networks perform much better than the formal
banking system in terms of simplicity, speed, transaction costs, and reliability, and that for these reasons
they are not only financing much of the informal bootleg smuggling trade from India to Bangladesh, but
also substantial parts of the exports to Bangladesh that go through the legal routes. Remittances from the
Bangladeshi workers in the Gulf countries and from Bangladeshi residents in India provide the foreign
exchange, usually as US dollars or as Rupees in India, and Taka are provided by the Bangladesh
importers. As regards imports into Bangladesh through formal Customs channels, some form of hawala
payment would generally be needed to balance accounts if there is “technical” smuggling. For example,
prices and quantities in a shipment as given in the shipping documents and an accompanying LC might
match, but additional payments to the exporter will be needed if the quantities exceed the declared
quantities or the products are different from the descriptions given in the documents.
Thirdly, the study notes that, in addition to hawala payments, informal exports from India to
Bangladesh are also paid for by gold and Taka smuggled into India. According to the study, recorded
Customs seizures in India of gold and currency are very small but are only “the tip of the iceberg” as the
Indian Customs officials at the border avoid this kind of seizure owing to involved judicial procedures in
gold and currency cases. The smuggled Taka are used to buy Rupees from informal foreign exchange
traders who offer considerably more favourable Taka/Rupee rates than can be obtained from the banks,
which are obliged to first convert the taka to US dollars and then to Rupees, as there is no official direct
Taka/Rupee foreign exchange market. The report points out that the lack of such an official market means
that remittances of the Bangladeshi immigrant community to Bangladesh (estimated at about $260 million
a year) go entirely by the informal hawala networks.
Trade logistics and transaction costs
It has long been recognized that there are serious logistical problems (congestion, delays, sidepayments etc) at the land Customs stations on the India- Bangladesh border 94 . In order to provide some
quantitative indications of the scale of these problems, as part of this project NCAER organized surveys
of exporters and transporters in the Kolkata-Petrapole region during July and August 2002. The results of
these surveys are summarized and interpreted in a paper by Samantak Das and Sanjib Pohit 95 . This paper
first of all describes some of the infrastructure deficiencies and procedural hazards at these places, which
include (at Petrapole, which is by far the best equipped) inadequate and congested roads, absence of
government bonded warehouses, irregular power supplies, inadequate sanitary facilities and drinking
water, prevalence of theft and other crimes, frequent strikes, prevalence of speed money, a single border
gate which handles all truck and other traffic as well as individual travellers and which is wide enough for
93
94
95
So called “back-to-back” LCs that finance imports of inputs needed by exporters are presumably not subject to
these problems, since they have the backing of the original export LCs issued by banks in the US, Europe and
other countries from which the exports have been ordered.
These have been described and analysed as part of a comprehensive study of transport and logistics in the
India-Nepal-Bhutan-Bangladesh sub region edited by Uma Subramanian (op cit)
Das, Samantak, and Sanjib Pohit (2004). “Quantifying the Transport, Regulatory and Other Costs of Indian
Overland Exports to Bangladesh”. Mimeo.
68
only one truck at a time to pass through. They point out that these and other deficiencies are if anything
more severe at other land Customs stations, and they give the examples of Hilli and Mahadipur.
The Petrapole crossing was chosen for the survey because it handles by far the largest share of the
recorded India-Bangladesh land border trade. Petrapole is on a major road 95 kilometres from Kolkata.
The neighbouring town on the Bangladesh side of the border is Benapole, which in turn is linked by a
highway to Jessore and Dhaka. The survey was carried out in Kolkata and Petrapole and responses were
obtained from 15 transporters and 82 exporters, all engaged in the India-Bangladesh trade. The questions
were framed so as to elicit the opinions of the transporters and exporters on the excess time and cost of
transporting goods from Kolkata, clearing Indian Customs, unloading the goods on the Bangladesh side,
and returning to the Indian side of the border. The excess cost and time involved was estimated by asking
what each exporter or transporter considered should have been normal or reasonable, and comparing that
with the actual time spent and actual expenses. In the case of congestion on the road from Kolkata to
Petrapole, the “normal” time seems to have been defined as the time a truck would have taken to travel
the same distance in normal conditions along an equivalent stretch of other national highways. What
might have been considered “normal” or “reasonable” for activities such as the various stages of Customs
clearance is more subjective, but the responses appear to have been reasonably consistent, probably
because of queuing and waiting times that were about the same for everyone. The respondents were than
asked to put a value on the estimated excess time they spent at the various points in the shipment and
clearance process, in particular loading in Kolkata, transport from Kolkata to Petrapole, clearing Indian
Customs at Petrapole, unloading in Bangladesh, and returning to the Indian side of the border. How this
excess time was valued was left to them: the answers presumably mainly reflect the estimated
opportunity cost of the time as they perceived it e.g. for a trucker, what could have been earned by using
the truck during the “excess” time that it is tied up at Petrapole. In addition, all the respondents mentioned
that as a matter of routine they pay “speed money” to police, Customs and other officials. They also
experience delays in receiving export remittances, which they also attribute to slow bureaucratic
processes. The perceived cost of these delays and the speed money payments 96 were then aggregated with
the estimated excess time costs to give estimates of the total excess costs involved, and then these
estimates were expressed as a percentage of the average value of a typical shipment. According to these
calculations, the actual cost of an average shipment from Kolkata to the point of Customs clearance in
Bangladesh was 12.31% of the value of the shipment, compared to an “ideal” cost of 1.93% of the value
of the shipment. These costs were divided as follows:
Table 9.1: Estimated actual and excess costs of transport and Customs
clearance in India at Petrapole
Transport and Customs clearance time
Speed money
Time for receipt of export remittance
Total
Cost as % of average shipment value
Ideal or normal
Excess
Actual
1.71
5.73
7.44
2.50
2.50
0.22
2.15
2.15
1.93
10.38
12.31
These costs are based on averages of the relevant variables, and the variances are considerable
with some very high maximum values e.g. excess transport and Customs clearance costs as high as 18%
96
The survey obtained apparently reliable information on “speed money” at Petrapole, apparently because people
had no or few reservations about discussing it since it is so prevalent and open. However no information was
asked for or provided on underinvoicing, misclassification and similar practices, most of which probably takes
place on the Bangladesh side in connection with Customs clearance and which involve much larger bribes and
other side-payments than the amounts involved in speed money payments.
69
of the average shipment value. However, as the paper points out, the shipment values to which they are
related are averages of all the commodities that the respondents were shipping, and the estimates thus do
not pick up differences between different types of commodity, which are likely to be considerable. They
also depend on respondent estimates of opportunity costs, the basis for which is not known.
In order to obtain a better idea how these costs vary across different types of commodity, for this
synthesis the data on time delays, speed money, and export remittance delays was combined with data
from the same NCAER survey on shipment values by commodity, and information on Indian trucking
costs from another study 97 . These calculations (Table 9.2) show that the impact of the Petrapole
bottlenecks is serious for low value commodities but minimal for high value commodities 98 . For example,
the total logistics cost for a truck load of wheat valued at Rs 56,000 was 10.94% of the value of the
wheat, but without the excess transport and Customs clearance time and delay in receiving export
remittances, and without “speed money” payments, the total cost should have been 1.96% of the value of
the wheat. Thus congestion and logistics inefficiencies added to the cost of getting the wheat from
Kolkata through Petrapole to the Bangladesh Customs clearance point at Benapole, and increased its
landed cost there by about 9%. By contrast, the total logistics cost for a truck load of truck and motor
parts valued at Rs 2.7 million was only 0.75% of the cargo’s value, and would have only been 0.12% of
the value under ideal conditions. The reasons for these large differences between low value and high
value commodities is that wasted truck time and speed money are the same regardless of the value of the
cargoes that the trucks are carrying, and therefore are more significant for low value cargoes. On the other
hand, in these calculations the cost of the time delays for the cargoes has been estimated as the interest
cost of working capital, which has been assumed at 1% per month. These costs i.e. the interest cost of the
shipments while they are being transported and cleared by Indian Customs, and the interest cost of delays
in payments for the export cargoes, are the same percentages of their values whether they are high or
low. However this leaves out other costs of delay which for some products may greatly exceed the simple
working capital interest cost e.g. deterioration of perishables such as fruits and some other foods, and
buyer penalties for not meeting agreed delivery times. In addition, as already noted, the study is also
confined to delays and other costs borne by Indian exporters: delays and other costs in clearing Customs
in Bangladesh side of the border obviously increase the total logistics cost of the trade above the costs
incurred in India.
The NCAER survey at Petrapole did not systematically investigate the logistics costs of
Bangladesh exports to India, but according to the authors 99 Bangladesh exporters are treated in an
unsympathetic and discriminatory way at Petrapole. For example:
o
At the border Bangladesh trucks have to give way to Indian trucks going in the opposite direction
with waits of 4-5 hours to cross.
o
Once the trucks enter India, immediate transhipment to Indian trucks is required, since there is no
bonded warehouse in which the goods can be stored. As no facilities are provided for the transhipment,
damage to the goods results
97
98
99
Subranamian, Uma et al op.cit Appendix 6
It is likely that these commodity-specific estimates somewhat overstate the differences: in particular the very
high estimates for cement and bauxite look implausible.. For products such as these it is possible that extra
speed money might be paid to shorten the time the trucks spend clearing Customs, reducing the total per truck
cost. Another possibility is that lower speed money rates and faster clearance times are established for
obviously low value cargoes such as cement, perhaps reflecting the view that excessive payments and delays
would reduce the traffic in these products. These possibilities could not be explored in the survey, which was
only able to obtain information on speed money and delays for an average mix of all the products being
transported, not according to the type of merchandise the trucks were carrying.
Ibid pp 11-12
70
o
Bangladeshi exporters complain that they are badly treated when entering India at Petrapole,
despite paying substantial bribes. Consequently they prefer to fly to Kolkata in order to explore business
opportunities, even though the cost is much higher than the cost of land travel
Issues such as these are of considerable interest and concern in Bangladesh and would be worth exploring
in follow-up studies. These would need to be done in Bangladesh and in a carefully focussed way in
India, in view of the very low volume of the trade and the small number of commodities involved.
The paper makes a strong case for investing in larger and much improved infrastructure and
facilities at Petrapole and at the other land border Customs stations. The desirability of doing so is
apparent from the extra logistics costs illustrated in Table 9.2 e.g. for Bangladesh the present system
involves substantial terms of trade losses, since the landed costs of imports from India of products such as
wheat, rice, fruit, cattle feed, bauxite and other products appear to be much higher than they would be if
the congestion were removed. Bangladesh exporters and potential exporters also have an obvious interest
in faster and less expensive commodity movements across the border. Likewise, on the Indian side, even
though it can be assumed that the congestion costs of exports to Bangladesh are recovered in the prices
charged, at higher prices the volumes of the exports must be lower than they otherwise would be. If the
required investments are not made, congestion will increase with the general growth of trade, and would
largely cancel or offset economic benefits that would otherwise occur if tariffs or other trade barriers were
to be reduced. This last point is especially relevant if India and Bangladesh were to ever implement an
effective FTA, since without very substantial investments in infrastructure and administrative capabilities,
increases in trade would be slowed down or blocked by increases in congestion and the associated
increases in economic rents.
71
Table 9.2: Estimated total extra cost for Indian exporters of delays and "speed money" at
Petrapole land border crossing. Cost per 10 ton truckload by various products
Cars
Engineering equipment
Truck and motor parts
Electric pumps
Fans
Cosmetics
TV/VCD parts
Stabilizers
Cotton yarn
Paper
Air conditioners
Bleaching powder
Cumin seed
Red dry chilly
Paints
Milk powder
Bicycle parts
PVC pipes
Mustard oil
Marble slabs
CI sheets
Lentils
MS rods
Black stones
Jute carpets
Apples
Pig iron
Sugar
Glass ware
Mangoes
Rice
Wheat
Cattle feed
Cement
Bauxite
Value of shipment
per truck
Rs '000
3077
2800
2727
2500
1502
1449
1424
1369
904
884
625
600
524
460
450
414
375
355
350
290
240
220
200
197
180
120
113
107
90
80
79
56
49
22
21
Interest
cost
Rs
4277
3892
3791
3475
2088
2013
1979
1903
1257
1229
869
834
728
639
626
576
521
493
487
403
334
306
278
274
250
167
156
149
125
111
110
78
68
30
30
Truck
cost
Rs
3553
3553
3553
3553
3553
3553
3553
3553
3553
3553
3553
3553
3553
3553
3553
3553
3553
3553
3553
3553
3553
3553
3553
3553
3553
3553
3553
3553
3553
3553
3553
3553
3553
3553
3553
Speed
money
Rs
1202
1202
1202
1202
1202
1202
1202
1202
1202
1202
1202
1202
1202
1202
1202
1202
1202
1202
1202
1202
1202
1202
1202
1202
1202
1202
1202
1202
1202
1202
1202
1202
1202
1202
1202
Total
cost
Rs
9032
8647
8546
8230
6843
6768
6734
6658
6012
5984
5624
5589
5483
5394
5381
5331
5276
5248
5242
5158
5089
5061
5033
5029
5005
4922
4911
4904
4880
4866
4865
4833
4823
4785
4785
Total cost as %
of shipment
value
0.29
0.31
0.31
0.33
0.46
0.47
0.47
0.49
0.66
0.68
0.90
0.93
1.05
1.17
1.20
1.29
1.41
1.48
1.50
1.78
2.12
2.30
2.52
2.55
2.78
4.10
4.37
4.57
5.42
6.08
6.13
8.66
9.93
22.26
22.44
Notes: Estimates based on data collected in NCAER survey of exporters and tranporters in Kolkata-Petrapole region
during July and August 2002.Supplemented by estimates of Indian trucking costs in India in Annex 6 of Uma
Subramanian et al. This estimates the annual total cost of a 10 ton truck at $US 12,385.The fixed component of this
after deducting tyre and fuel cost is $6440 per annum, or $17.60 per day. The average delay per shipment which the
exporters and truckers interviewed by NCAER thought was uneccesary or excessive was about 100 hours or 4.17
days per truck.This was used to estimate the cost of the delay per truck and the working capital interest cost,
assuming an interest rate of 1% per month. It was assumed that "speed money" is the same for each truck regardless
of its cargo. Bribes related to Customs clearance are not included in these costs, and no costs incurred in Bangladesh
after the goods have been unloaded there for Customs clearance, are included in these estimates
72
Chapter 10: Quantifying the economic costs and benefits of an FTA: some
industry case studies
If there were a bilateral free trade agreement between India and Bangladesh, or if SAFTA is
eventually implemented in a comprehensive way, there would be economic costs and benefits for various
groups in the two countries and for the two governments, and also repercussions affecting exporters and
importers outside the South Asia region. The likely size of these effects and how they would be
distributed is relevant for people involved in the discussions on preferential trade policies in the two
countries, and also for trade policies more generally. In order to bring out these issues in a reasonably
non-technical way, a methodology was developed for analysis at the level of individual industries, and
applied in a number of industry case studies. It is hoped that these can serve as models for similar studies
of the likely impact of an FTA or of SAFTA on other industries. The main features of the methodology
are briefly summarised below. This is followed by an outline of the principal results of the empirical case
studies, including some unexpected by-products that the case studies turned up. The concluding section
then outlines the implications of the case studies for India’s and Bangladesh’s policies on preferential and
free trade, and for their trade policies more generally.
Methodology. 100 Even though SAPTA and various bilateral preferential trade agreements have
been operating in South Asia for a number of years, and it has been agreed to begin implementing
SAFTA from January 2006, there is little no recognition of their potential economic costs and benefits,
either in the texts of the agreements or in the general statements and discussions that have accompanied
them. The negotiations and the debates have been almost entirely mercantilist, focusing on the extent to
which under the agreements national industries do or do not obtain new export opportunities, resisting
concessions that might provide serious competition for established local industries, and worrying about
losses of Customs duty revenue. Little or no attention has been paid to the potential for trade diversion
costs, by which trade may be diverted from low cost suppliers in other parts of the world to higher cost
suppliers in South Asia, or to the potential consumer costs and benefits. One purpose of the methodology
paper and of the applications of the methodology to some industry case studies of free trade between
India and Bangladesh, is to make these basic issues clear, realistic and it is hoped easily understood by
non-specialists in these two countries and in South Asia more generally. With this in mind a traditional
and highly simplified comparative static framework has been used and applied to bring out the main
points, fully recognizing that the simulated results for individual industries would need to be modified if
general equilibrium including macro-economic repercussions (e.g. exchange rate effects) were
considered. To simplify the presentation and also the empirical estimation of welfare changes, the models
use linear demand and supply functions, and except where otherwise indicated, assume competitive
behavior on both the supply and demand sides. Market structures in South Asia-especially in
manufacturing-are often far from competitive, but as a first approximation it is useful to look at the
outcomes on the assumption that firms behave as though they are competitive. This provides a benchmark
which can be modified to allow for various forms of non-competitive behavior in simulating the likely
outcome of an FTA.
Changes in “economic welfare” resulting from an FTA are treated as the sum of changes in
consumers’ surplus, producers’ surplus and government revenue from tariffs (customs duties).
Consumers’ and producers’ surpluses are a shorthand way of summarizing economic benefits that may
accrue to a variety of economic agents, not just final consumers and producers 101 . For example,
100
101
The methodology is described in Pursell, Garry (2004, Dec 14): Analyzing the Economic Welfare Consequences
of a Free Trade Agreement; Partial Equilibrium Methods for Industry Level Studies.
On the welfare estimates, in principle, compensating variations should be estimated, not just areas under curves.
However, that requires more reliable and complete information on both demand and supply parameters, and
also better information on prices and industrial structures. The case studies are intended to illustrate some
73
governments normally share in producer surpluses through taxes on profits, and some shares may go to
foreigners if there is portfolio and/or foreign direct investment (FDI). It is also likely that traders (e.g.
wholesale distributors and exporters) may share in producer surpluses, especially exporters who
undertake marketing functions. Consumers’ surpluses may refer to benefits to buyers of intermediate
goods and equipment, not only benefits to final consumers, and in practice they include increases or
decreases in the number of specifications, qualities or brands of a given good that are available to
consumers as a result of trade policy changes e.g. consumers may benefit just because of an increase in
the number of brands and varieties that are available, even if there is no change in the prices of the
existing varieties.
Only protective tariffs have been considered in estimating the fiscal costs of FTAs, not indirect
domestic taxes such as the VAT in Bangladesh and the additional (excise) duties and sales taxes in India.
The latter are general taxes which are applied to both imports as well as domestic sales, and imports under
preferential agreements such as FTAs are not exempt. Therefore, if as a result of an FTA duty free
imports into Bangladesh of product x from India replace imports of x from the rest of the world (ROW),
the loss of Customs revenue is just the protective tariff (customs duty plus para-tariffs) that would have
been paid on the imports from ROW, not the Bangladesh VAT on those imports, since that is also
charged on the imports from India. However smuggled goods will usually avoid domestic indirect taxes
as well as tariffs, so if there is smuggling this needs be taken into account in simulating the fiscal effects
of an FTA.
The comparisons of pre and post-FTA situations are of standard comparative static “long run”
equilibria which assume that all the short run adjustments have been made on both the supply and demand
side. As with any comparative static analysis, in principle it is possible to estimate the likely path to a new
equilibrium and to calculate the present value of the change, but the information required to do that with
confidence is generally difficult to obtain. The main concern for policy-makers in this adjustment process
is usually the employment consequences for industries that as a result of an FTA would face tougher
competition and would be obliged to contract and/or improve their efficiency. If some quantitative
estimates can be obtained on the scope for productivity improvements, this can be modelled and some
rough estimates of the differences this might make to economic welfare outcomes are provided in the
cement industry case study. However, it is much more difficult to estimate the likely contraction path of
firms and industries which in the short run are likely to stay in business provided they can cover their
variable costs, but which would eventually cease production. During this process the resulting annual
producer surplus losses are likely to be higher than in the eventual long run equilibrium in which the
macro-economy is assumed to have adjusted so that the equivalent of the labour, capital and other
resources released by the contracting firms have found employment elsewhere. On the other hand,
consumer benefits may be greater during the process than estimated for the long run equilibrium, if the
prices of the exports from the partner FTA country (say Indian firms exporting to Bangladesh) charge
lower prices in order to meet the competition of Bangladesh firms which base their prices on their
variable rather than their total production costs. The continuing production of the Bangladesh firms would
in general also mean that the government will continue to collect import duties on imported inputs,
reducing the estimated government revenue loss during the adjustment process below the eventual
revenue loss in the long run equilibrium when the Bangladesh firms will have ceased or cut production.
For convenience the case study comparisons of economic welfare use a common numeraire
which could either be the currency of one of the countries or a common foreign exchange numeraire (e.g.
the US dollar). This means that changes in consumer surpluses, producer surpluses, and customs revenue
are valued equally, both within each country and across countries. These could obviously be valued
general points about the likely levels and distribution of welfare changes. These could be refined in subsequent
studies.
74
differently e.g. in Bangladesh a Taka or dollar of customs revenue could be valued more or less than a
Taka or dollar of consumer benefits resulting from a reduced price of some commodity, and a dollar of
producer surpluses in India could be weighted differently from a dollar of producer surpluses in
Bangladesh. This is always possible in any kind of economic welfare analysis, but before this is done, it is
useful to calculate a starting point with known weights to provide the direction and provisional size of the
welfare changes.
The methodology recognizes that a free trade agreement is very different from a common market.
In particular, whereas a common market will tend to equalize prices in the member countries, with an
FTA domestic prices for a given commodity in participating countries can differ, perhaps substantially-in
fact that is likely to be the norm rather than the exception. Apart from differing domestic indirect taxes,
for internationally traded goods, this is principally because the member countries maintain their own tariff
structures, and because duty free access to the markets of the other FTA member or members is always
subject to rules of origin requiring minimum levels of national content which have to be verified with
documentation presented as part of Customs clearance. Unless there is smuggling, these formal Customs
requirements for trade prevent the kind of arbitrage that tends to equalize prices at all stages-ex factory,
wholesale and retail-within a common market. Moreover, goods exported to an FTA partner country can
normally be sold equally profitably at lower prices than the prices of the same goods sold domestically,
because (as is the case with all exports) the tariffs on the imported inputs used in their production are
rebated or exempt. For these and other reasons, how domestic prices are determined following an FTA,
and the resulting repercussions on the economic welfare of the various groups that are affected, can be
quite complex.
The methodology also recognises the importance of the informal and illegal trade, specifically the
“bootleg” and the “technical” smuggling from India to Bangladesh. As pointed out previously, the
“bootleg” smuggling across the border amounts to a de facto trade arrangement under which the Indian
products being smuggled do not pay Bangladesh’s customs duties and VAT, but are subject to various
informal private payments to officials in both countries. Just as under a formal FTA or preferential
agreement, the smuggled imports potentially divert imports that would have otherwise come from the rest
of the world (ROW) and India by the formal channels, provide competition to Bangladesh producers, and
potentially benefit Bangladesh buyers to the extent that the smuggling reduces prevailing prices and
provides qualities and varieties that would otherwise not be available. The fact of this already pre-existing
de facto informal preferential trade needs to be taken into account in assessing the likely consequences of
a formal FTA, and various possible outcomes are discussed in the methodology paper.
One key consequence that the paper brings out is that the cost of smuggled goods by the
”bootleg” route, on the Indian side includes Indian domestic taxes, wholesale and perhaps retail margins,
Indian smuggling margins, plus bribes paid to Indian officials. These costs and economic rents can be
expected to be included in the price charged for the smuggled goods when they arrive in Bangladesh, and
so the trade involves possibly substantial economic benefits to the smuggling networks in India as well as
in Bangladesh. However, if a formal FTA including the smuggled products is agreed, it is likely that the
formal trade will substitute or perhaps completely replace the bootleg smuggling trade. This is because,
like all exports, the exports under the FTA would be exempt from Indian domestic indirect taxes, would
benefit from standard export duty neutralisation facilities such as duty drawback and DEPB, and providing transport and Customs facilities are adequate-in principle can be shipped in larger quantities
involving lower transport logistics costs and trader margins. Therefore one of the consequences of a
formal FTA will be to reduce or perhaps eliminate the transaction costs and economic rents of the bootleg
smuggling trade, both in the exporting country and in the importing country. In principle, these economic
costs and benefits would need to be considered in assessing the likely overall economic consequences of
the FTA.
75
The methodology paper also discusses the likely effects of an FTA in the case of products which
are being smuggled by the “technical” smuggling route. The products going by this route are not subject
to Indian domestic indirect taxes, but there are reports that at the Petrapole land border many forego the
usual Indian duty neutralization rebates in order to avoid or minimise checks by Indian Customs officials.
The principal consequence of an FTA for these products is that it would remove most if not all of the
bribe extracting leverage of Bangladesh officials, so that in assessing the economic consequences of the
FTA in Bangladesh, there would be two separate economic losses at the border, the loss of Customs
revenue that was previously collected, and secondly the loss of the Customs and other officials’ economic
rents, which effectively are a form of privatised Customs revenue. A variant of this outcome, also
discussed in the paper, is the possibility that the combined rate of Customs duties actually collected plus
the bribe rate is less than the total formal import duty rate. In that case the leakage at Customs may be
affecting the price level of the product in Bangladesh, so that the de facto protection to domestic
producers may be lower than the apparent protection rate in theory made available by the official Customs
duty and para-tariff rates. The in turn will reduce the potential consumer welfare benefits of the FTA in
Bangladesh, since they are already benefiting to some extent from the smuggling. On the Indian side,
another outcome of an FTA is that the Indian exporters would no longer have a motive to not collect the
available export rebates such as DEPB and drawback, and this extra cost to the Indian government would
need to be taken into account in assessing the net benefits (mainly increased Indian exporter producer
surpluses). Depending on the competitiveness of the Indian exporters, there could also be welfare benefits
in Bangladesh if the Indian exporters pass on the duty neutralization payments they receive to their
Bangladesh customers.
By definition, free trade agreements (and more generally any kind of preferential agreement)
discriminate against imports from rest of the world (ROW) countries that are not parties to the
agreements. Insofar as the imports from the ROW countries that are excluded are traded at lower prices
than the imports from the FTA countries, there is an economic welfare loss for the FTA members, and
also an economic loss for the ROW exporters who lose their markets. These trade diversion effects need
to be allowed for in any comprehensive evaluation of the costs and benefits of FTAs, but in practice those
negotiating or managing most FTAs only pay attention to the Customs revenue losses from the diverted
trade, and zero attention to the economic losses of the affected ROW exporters. This point is recognised
in the methodology, but it notes that the information that would be needed to provide some quantification
of the economic losses in ROW countries is normally not available, especially if a large number of ROW
exporters are affected. However, the difficulty of quantifying these effects does not diminish their
importance, and as a rule of thumb it might be plausible to assume that the per unit producer surplus
losses resulting from the excluded ROW exports at least equal the producer surplus gains of the new
exports from the FTA member that replaces them. This kind of calculation is discussed in the cement
industry case study, where it appears that an India-Bangladesh FTA would exclude Indonesian, Malaysian
and Thai clinker exporters from the Bangladesh market.
Summary of industry case studies 102 This section summarises some of the principal findings of
case studies which simulated the likely effects of an India-Bangladesh FTA in the following industries 103 :
Cement
Light bulbs
Bicycle rickshaw tyres
Sugar
102
103
At the time this synthesis was prepared final drafts of the case studies of fluorescent lights, bicycle rickshaw
tyres and passenger cars were not available owing to missing and inconsistent data and various other loose ends
that still needed attention. This summary is based on early working drafts
Case studies also included fluorescent tube lights and passenger cars, but results were too preliminary to be
cited here.
76
Ready made garments
In interpreting these case studies, an important caveat is that only very limited empirical survey
work was done in preparing them, and so if only for this reason the estimates of economic welfare costs
and benefits are preliminary estimates only which would be certain to change with more complete
knowledge of the various parameters on both the demand and the supply side of these industries in both
countries. Most of the simulations take as a base scenario the situation (i.e. demand, production, market
structure, imports, tariffs, exports etc) during Bangladesh’s 2002/03 fiscal year, as that was the latest year
for which reasonably complete data was available when the studies were started. Among other things, the
situation in these industries will have changed since 2002/03, and of course this would need to be allowed
for in current thinking about the likely impact of an FTA.
In the simulations for the first four of these industries, it turned out that under an FTA there are
expanded Indian exports to Bangladesh, but no exports from Bangladesh to India. This was not predicted
in advance, but was a result of finding that in the 2002/03 base scenario (a) India was exporting all these
products to the rest of the world and –except for cement-also to Bangladesh (b) Indian export prices were
substantially lower than ex-factory before-tax prices of the same or similar products in Bangladesh (c)
none of the products were being exported from Bangladesh (d) potential export supply prices in
Bangladesh-defined as ex-factory prices minus estimated duty drawback for inputs subject to tariffs-in
each case substantially exceeded ex-factory prices in India.
The results point to Bangladesh’s apparent lack of comparative advantage viz a viz India, which
is not surprising in that the broad comparative advantage of both countries is in relation to developed
countries, but this is especially the case with Bangladesh which has a much less diverse industrial and
agricultural structure than India. However, comparative advantage is not static and is changing all the
time, so in the medium to long run there will be industries established in Bangladesh which will find it
profitable to export to India, based on factors such as lower labour costs, resources such as natural gas, or
transport costs and proximity (the latter especially in relation to the Indian NE states). The problem is that
it is difficult to predict what these future exports might be: all we could do in the various studies was to
look at the evidence from Bangladesh’s actual present trade and industrial structure, and on that basis
there doesn’t seem to be many possibilities for substantial exports right away 104 .
The simulations for ready made garments (using the example of mens’ cotton shirts and trousers)
predict increased Bangladesh exports to India, but also increased RMG exports from India to Bangladesh.
In the base simulations for cement, light bulbs, fluorescent tube lights, bicycle rickshaw tyres, and
sugar, following an FTA production in Bangladesh ceases altogether and the entire Bangladesh market is
supplied by imports from India. In each of these industries, this seemed to be the most plausible likely
outcome given the information obtained on prevailing prices and costs in Bangladesh, even after allowing
for cost reductions that would result from duty free imports of intermediate inputs from India that would
also result from an FTA. It was not a surprising outcome in view of the very high protection rates all of
these industries were receiving in Bangladesh, and the fact that –despite apparently substantial smuggling
of a number of these products-actual domestic prices were approximately reflecting the tariff protection
that had been provided. The protective tariff rates (Customs duties plus para-tariffs) in 2002/03 were:
104
It is possible that the potential for Bangladesh exports to India is larger than can be inferred from the existing
situation. But from the available evidence it is hard to argue convincingly for a large expansion of exports
from Bangladesh to India for the time being. The rest is speculation, though plausible.
77
Cement
Light bulbs
Fluorescent tube lights
Bicycle rickshaw tyres
Sugar
Automobiles
Ready made garments (cotton shirts & trousers)
66.7%
66.0%
75.3%
35.5%
86.4%
59% or 89% (2004/05 tariffs)
65.5%
In the simulations for the first six of these industries, the duty free imports from India create
economic welfare benefits for Bangladesh consumers which considerably exceed the economic welfare
losses of Bangladesh producers plus the government fiscal losses which are a result of the zero tariffs on
the imports from India. Hence, in each case, the FTA creates a substantial net welfare benefit for
Bangladesh. Because of the very high Bangladesh tariffs and the resulting large gaps between the
protected prices pre-FTA and India’s export prices, these welfare rectangles and triangles are much larger
than the welfare amounts often found in similar exercises in other countries. In particular the net
quantifiable economic annual welfare benefit for Bangladesh from an FTA with India that includes sugar
is estimated at $153 million, and for cement at $171 million.
Since Indian exports expand there are also economic benefits for the Indian producers (producer
surpluses), so in each of these cases the net joint economic benefit to Bangladesh and India together
exceeds the net economic benefits in Bangladesh alone. On the other hand the FTA diverts trade from the
countries that were previously supplying Bangladesh with imports of the finished products or with inputs
for the Bangladesh industries that cease production following the FTA. The case studies do not provide
information that would allow the welfare losses in the ROW countries to be estimated, but in no case is
the value of the excluded exports sufficient to generate plausible producer surplus losses that would be
large enough to offset the joint benefits of the FTA in Bangladesh and India.
The simulations do not allow for the likelihood that efficiency improvements and cost reductions
would take place in the Bangladesh industries under the spur of import competition, and therefore the
local Bangladesh industries cease production. In only one case-cement-did the Bangladesh firms
surveyed provide any indication of the likely scope for cost reductions-and in that case the estimated
reduction was still not sufficient to prevent the demise of the industry under the simulated FTA. A useful
supplement to these and similar studies would be to look more carefully at the potential for cost and price
reductions in protected domestic industries in Bangladesh and the extent to which the industries would
survive and prosper without protection. If they would, the economic welfare benefits of an FTA in
Bangladesh would be larger than estimated in these case studies, because of lower producer welfare losses
to be subtracted from consumer welfare benefits.
With the exception of the RMG case study, the economic welfare outcomes depend crucially on
what is assumed about competition between Indian exporters to Bangladesh following an FTA. The base
scenarios assume that the Indian industries are competitive and following an FTA would export to
Bangladesh at the export prices they were charging prior to the FTA in selling to the rest of the world and
to Bangladesh. But in signing on to an FTA with India, Bangladesh in effect would be extending its
general tariff protection levels to Indian as well as to Bangladesh producers, and this raises the possibility
for the Indian firms to collude and sell to Bangladesh at higher prices than their prevailing export prices to
the rest of the world, and even at higher prices than their prevailing domestic prices. If that happens, as
discussed in some of the case studies, the Indian industry extracts a share of the consumer welfare benefit
that would have gone to Bangladesh consumers in a competitive scenario.
The simulations in which this possibility is modelled, drastically alter both the overall level of the
economic welfare changes, and how they are distributed within and between the two countries. For
78
example, in the case of the cement industry, with a collusive profit maximising price for the Indian
exporters there is still an overall substantial (although reduced) positive joint net benefit for Bangladesh
and India together, but the net welfare change in Bangladesh is negative (minus $22 million) while there
is a large positive welfare benefit (+$178 million) in India. Bangladesh cement consumers still benefit
from lower prices than before the FTA, but these benefits are now less than they were in the first
simulation, and are more than offset by the producer surplus losses of Bangladesh cement producers who
still go out of business, plus the government’s loss of tariff revenue. In advance, the likelihood of this
happening is difficult to predict, but its possibility underlines a key difference between an FTA and
unilateral general trade liberalisation, where the Indian exporters to Bangladesh are competing with ROW
exporters, and as a result are unlikely to have much if any market power in Bangladesh.
The sample of industries studied does not include any cases in which, before the FTA, the Indian
industry is not exporting but has lower costs than the Bangladesh industry. In that case it would be likely
to export to Bangladesh following an FTA, but at higher prices than prevailing world prices, even though
the industry is competitive and there is no collusion or price fixing in the Bangladesh market. This
possibility is discussed in the methodology paper, which points out that in such a case the resulting terms
of trade loss for Bangladesh is principally explained by the excess production costs (relative to world
prices) of the Indian suppliers, whereas in the collusion case it is absorbed by economic rents (higher
profits) which do not involve real resource costs. This increases the probability that the net welfare
outcome for India and Bangladesh jointly will be negative, depending on the extent to which the
preferential export prices exceed world prices. Following the reduction of India’s general maximum
industrial tariff to 15% in March 2005, the scope for welfare reducing exports of this kind under an FTA
is less than it used to be, and the same tariff reduction also leaves reduced scope for similar welfarereducing exports from Bangladesh to India, since the 15% tariff in principle constitutes an upper limit on
the excess of the price at which the exports could sell in India, over cif import prices from the rest of the
world.
Because of the prevalence bootleg and “technical” smuggling from India to Bangladesh, some
economic welfare accounting is needed to allow for the effects of an FTA on the economic rents earned in
these activities. There is an extensive discussion of this topic in the sugar case study and it is also dealt
with in some of the others e.g. in the rickshaw tyre case study. The sugar case study recognizes that
economic rents from smuggling also exist in the exporting country, and points out that an FTA will
reduce these rents, partially or even fully offsetting the economic benefits of the FTA to Indian exporters.
The RMG industry case study was chosen to explore the possibility of Bangladesh exports to
India following an FTA and the economic welfare consequences. As expected, lower wages in
Bangladesh than in India combined with similar labour productivity mean that RMG production costs in
Bangladesh are lower than they are in India. Moreover, some Bangladesh exports to India of mens’ and
boys’ woven shirts started in the late 1990s and were growing fairly rapidly up to 2003/04, although
starting from a very low level. Since these exports were taking place over fairly high Indian tariffs (28.4%
for shirts in 2003/04) it seemed plausible that exports would increase at a faster rate under an FTA, and
the economic welfare consequences were estimated for alternative annual export levels to India of $8.5
million and $41 million. The paper argues that higher export levels for Bangladesh shirts than these are
unlikely because of evidence that the Indian domestic market for RMGs is highly competitive, with
domestic prices not far above fob export prices. It also argues that some part of increased Bangladesh
exports to India would be diverted from exports to other countries, so that the net export increase from the
opening to the Indian market provided by the FTA would be less than the increased exports going to
India. It then calculates some illustrative economic welfare benefits that the exports would generate in
Bangladesh, estimating them at between $1.1 million and about $5.6 million annually. Most of this is
attributable to producer surplus benefits of Bangladesh RMG exporters, offset to a minor extent by
consumer surplus losses due to consequent small increases in domestic RMG prices in Bangladesh. There
79
is a welfare benefit for Indian consumers resulting from the Bangladesh exports to India, but a somewhat
larger loss for Indian RMG producers, who (as in all FTA arrangements) are obliged to compete on
unequal terms in their domestic market with the Bangladesh producers, since the Bangladesh producers
obtain their inputs duty free, whereas the prices of the inputs of the Indian producers selling domestically
are raised by tariffs.
As noted in the general methodology and as applied in the case studies, costs and benefits to the
consumers, producers and the governments in both India and Bangladesh are weighted equally by
expressing and comparing them in money terms. In most of the case studies there is a net welfare gain
from the FTA because the benefits to consumers are greater than the losses of producers plus the revenue
losses of the governments. These net outcomes would change if the effects on the various groups were to
be weighted differently. In this regard, however, it is relevant to note that if low income and poverty
considerations were to be take into account in deciding on the weights, the preponderance of consumer
benefits might be even greater than is the case with equal weights. For example, in the rickshaw tyre case
study, benefits of lower tyre prices to the rickshaw wallahs and their customers would probably have high
weights and the economic welfare calculation in this case would favour the FTA even more. Similarly,
the high prices of sugar and cement created by the high protection policies being followed in Bangladesh
towards these industries are very regressive, and unequal welfare weights designed to take account of
poverty and low incomes would also increase the estimated net welfare improvement in Bangladesh from
an FTA.
80
Chapter 11: Implications for Bangladesh and Indian trade policies
Implications for Bangladesh. The simulated economic effects of an India-Bangladesh FTA in the
industry case studies which predict Indian exports to Bangladesh, all indicate large economic welfare
gains for Bangladesh consumers which far outweigh the total of government revenue losses, producer
surplus losses resulting from the contraction of Bangladesh production, and losses of economic rents in
Bangladesh resulting from the contraction of both “bootleg” and “technical” smuggling. In addition, an
FTA would also generate some Bangladesh producer surplus gains from expanded exports to India, but
these are likely to be quite limited owing to the highly competitive nature of most Indian markets. All this
presupposes that infrastructure and administrative capacity would be greatly improved and expanded on
both sides of the land border crossings to reduce bottlenecks and to stay ahead of the expanded bilateral
trade, otherwise the economic welfare gains from the FTA would be severely compromised by increasing
congestion, delays and informal payments.
The prediction that an FTA with India could bring large net economic welfare benefits for
Bangladesh must be qualified by some important risks:
o
o
o
By providing a captive protected market to Indian suppliers, there is a risk that instead of
exporting to Bangladesh at prevailing world prices, the Indian producers will collude with each
other and possibly with some Bangladesh producers and set prices that will transfer most of the
economic benefit of the FTA arrangement to India. As noted in the simulations for the cement
and sugar case studies, if these prices are sufficiently high there could be a net economic welfare
loss for Bangladesh, with consumer surplus benefits insufficient to outweigh government and
producer surplus losses.
There is a risk of terms of trade losses for Bangladesh if, following the FTA, some Indian
industries export to Bangladesh at competitive prices which are nevertheless higher than
prevailing world prices. As it happened, none of the few industries chosen for study in the project
fitted this pattern, but it is highly likely that would be some among the large numbers of products
being produced in India but not currently being exported. The terms of trade loss for Bangladesh
in such cases is the excess of these Indian export prices over cif import prices when the same
products are imported from the rest of the world.
In the recent past India has subsidized its exports of rice, wheat and sugar in order to get rid of
excess stocks generated by problems with its domestic support and other policies. Bangladesh has
benefited from these subsidies by importing Indian supplies of these commodities at the
subsidized prices. However, if Bangladesh were a captive market for these products under an
FTA, India would be able to supply Bangladesh at whatever higher prices would be possible
given the Bangladesh MFN tariffs, probably involving lower or zero Indian export subsidies.
Under an FTA, Bangladesh might also forego similar benefits in importing other commodities
subject to similar cyclical production and world price patterns
These risks for Bangladesh of an India-Bangladesh FTA are substantial and serious, and raise the
basic question: why not aim to obtain the same economic welfare gains by from a policy of multilateral
import liberalization, which could produce the same consumer surplus benefits for Bangladesh consumers
and the same net domestic economic benefits, while avoiding the risks? With multilateral import
liberalization, there would be no producer surplus benefits for Bangladesh exporters from protected
preferential markets in India, but the potential for these appear to be quite limited, owing to India’s recent
reductions of its industrial tariffs to quite low levels, and tariff redundancy in its protected agricultural
and textile and clothing sectors. Multilateral import liberalization would also not disadvantage third
countries, which in the case of Bangladesh are largely other developing countries. To implement such a
policy, first priority would be to phase out the para-tariffs, eliminating first of all the use of the VAT and
the supplementary duties as protection instruments, and moving towards a simple, low and uniform
81
Customs-duty plus VAT import duty structure, along the lines of the structure currently in place for
nearly all of India’s industrial products.
Implications for India India’s trade with Bangladesh is very small relative to its total trade and to
its economy, and so the economic welfare consequences of an FTA involving Bangladesh (whether
bilateral or as part of SAFTA) are also quite minor even though they are significant for Bangladesh. As
discussed above, there are potential producer surplus benefits for Indian producers and traders from the
expansion of exports to Bangladesh that would result from an FTA, and these might be increased further
if some Indian industries were able to effectively collude in supplying Bangladesh under the umbrella of
high Bangladesh MFN tariffs. However, in such situations it would probably be unlikely that Bangladesh
would maintain high MFN tariffs if the principal impact of such tariffs would be to facilitate the transfer
of economic rents to Indian suppliers. Furthermore, there would be offsetting losses of economic rentsincluding Indian indirect taxes-associated with the smuggling networks on the Indian side of the border,
given the likelihood that the FTA would divert trade to the legal routes.
The RMG case study suggests the possibility of some Indian consumer welfare benefits from
Bangladesh RMG exports to India under an FTA, but these and other potential consumer welfare benefits
appear to be quite limited in view of the current general openness of India’s industrial import policies, and
the competitiveness of domestic production and prices in most of the sectors with high and very high
import protection, notably agricultural products and the textile and clothing sectors protected by specific
tariffs. In addition, any likely expansion of Indian exports to Bangladesh under an FTA is likely to be
very small relative to the total Indian market, with no or minimal impact on prices, except possibly in
some border areas for some products. Consequently, Indian policy does not need to be concerned that
export expansion to Bangladesh might produce significant consumer price increases.
All of this suggests that there is no compelling case for India to pursue an FTA with Bangladesh,
based on the potential economic welfare benefits to India. Whatever economic benefits might result from
an FTA with Bangladesh, are potentially available on a much broader basis and larger scale from
continuing the general unilateral import liberalization process that has been under way during the past
three years. This would pay special attention to non-tariff barriers and prohibitive tariffs in the
agricultural sector (including livestock and fisheries products and processed foods) and to the specific
duties protecting the textile and clothing sectors. In view of substantial tariff redundancy in most
segments of these sectors, such policies would probably not require much producer adjustment and would
provide some limited benefits to Indian consumers as well as some limited export opportunities for
neighbouring countries including Bangladesh.
It could be argued that an FTA and MFN liberalisation could complement each other and that
regional agreements are politically easier to institute and manage, and therefore the two should go hand in
hand. For this argument to be valid, regional cooperation must have reached a high level to prompt a
virtuous cycle of protection reductions. There are problems on the Bangladesh side due to (a) the very
high protection levels to its import substitution industries (b) concerns about Customs revenue losses
from an FTA (c) limited potential-in the short to medium run at least for Bangladesh exports to India
under an FTA (d) the extreme political sensitivity in Bangladesh stemming from the fixation on the
bilateral trade deficit with India, which is likely to increase rapidly and substantially under an FTA. For
these reasons Bangladesh would only go into a bilateral FTA with India (or into SAFTA) if India were to
agree to extensive concessions while Bangladesh would insist on a very extensive negative list.
Additionally, the fiscal consequences in Bangladesh can be managed much more effectively and
directly with multilateral liberalization than under a bilateral FTA (or under SAFTA), since if an FTA is
actually implemented there would be zero Customs duty revenue from imports from India, whereas MFN
liberalization can be managed (as has been the case in India) with phased tariff reductions. A second
82
reason is that the studies show that there are already serious administrative problems and complexities in
the Bangladesh tariff regime even though Bangladesh’s SAPTA preferences are negligible. These
complexities would be greatly magnified if Bangladesh started to phase in substantial tariff preferences
and eventually exemptions as part of an FTA. A third reason is that tariff reform in Bangladesh needs to
focus on the removal of the para-tariffs. While in principle that could go on simultaneously with FTA
negotiations, the process would be much more complex, especially with regard to “sensitive” negative list
industries. A fourth reason is that Bangladesh multilateral liberalization won’t create a lopsided increase
in the bilateral trade deficit with India: imports from India will increase, but along with imports from
other countries. Finally, with general import liberalization there would still be an opportunity cost of not
dealing with the trade infrastructure along the land border with India, but it wouldn’t be concentrated
there…it would also create pressure to deal with the infrastructure and administrative capacity at the
seaports.
India-Bangladesh cooperation in other areas The suggestions above that both India and
Bangladesh would obtain greater and more secure economic benefits by giving priority to unilateral trade
liberalization on a multilateral basis, rather than by pursuing free trade arrangements, does not mean that
other trade-related cooperative endeavors should be neglected. In particular there would be substantial
benefits from coordinated improvements in the transport, storage and administrative infrastructures at and
adjoining the India-Bangladesh land borders, as well as in harmonization and cooperation in Customs
administration and banking relationships. As well as facilitating bilateral trade and reducing its cost, this
would help reduce black economy activities in both countries associated with both the “bootleg” and
“technical” smuggling routes, and improve fiscal resources, especially in Bangladesh. Finally, there is
little doubt that regional cooperation in energy and infrastructure could yield dividends in terms of crossborder investments and joint ventures.
83
Chapter 12: Summary of key findings
General observations. India is now the largest single source for Bangladesh’s imports (16% of
total in FY05), ahead of China and Singapore. Bangladesh’s perennial large bilateral trade deficit with
India might be a cause for concern but it has not led to any balance of payments problem for Bangladesh
as consistent trade surpluses with such trading partners as US and EU compensate for these deficits. The
large volume of informal/illegal trade remains a problem though.
Taka/Rupee exchange rate and India-Bangladesh trade
• Bilateral Taka/Indian Rupee REER play an important role in affecting trade flows between India and
Bangladesh. The appreciation of the real Taka/Rupee exchange rate by about 50% between mid1980s up to about 1999, would have contributed to the expansion of both formal and informal Indian
exports to Bangladesh, and retarded the growth of Bangladesh exports to India.
•
Despite a reversal of exchange rate trend since 1999, Bangladesh exports to India stagnated. This
could be due to (a) faster productivity growth in India bolstering India’s comparative advantage in
competing goods, and/or (b) tariff and non-tariff barriers constraining Bangladesh’s major exports
(RMG) or minor exports which have experienced rapid growth elsewhere.
India’s trade policies
• Import policies. While liberalizing its import regime, India has used WTO-compatible rules for
“contingent” protection – e.g. anti-dumping, standards. Though industrial tariffs in India are now
mostly at 15%, specific tariffs on garments make it difficult for Bangladeshi garment exports to
penetrate the Indian market.
•
Export policies. India restricts the widely used DEPB scheme for exports over land routes –Petrapole
being the only land border at which this duty neutralization scheme is allowed. Rebates under duty
neutralization schemes have fallen considerably suggesting that domestic prices are close to fob
prices and well below cif prices making it difficult for Bangladeshi exports to India to compete in the
Indian market.
Bangladesh’s trade policies
Import policies.
• Quite apart from the general constraints at land borders, both India and Bangladesh resort to limiting
certain imports via designated land ports thus encouraging illegal imports – both cross-border and
technical smuggling.
• Though custom duties have been brought down, para-tariffs imposed on top of custom duties, have
led to a slowdown in reduction of protection since the mid-nineties.
• India exports a wide range of products to Bangladesh covering all but 4 of the 98 HS chapters,
making up nearly 15% of Bangladesh’s imports, excluding textiles, which mostly come in at zero
tariffs. India is supplying a fairly constant share of Bangladesh’s imports of basic raw materials,
intermediate goods, capital goods and non-cereal consumer goods. This despite the fact that dutiable
imports from India face import weighted tariffs of about 29%, suggesting that they compete favorably
with imports from the rest of the world.
• Bangladesh granted few – mostly symbolic -- tariff concessions to India under SAPTA.
Export policies
• Bangladesh exports a miniscule (<1%) share of India’s imports, a negligible share (1%) of its own
exports, and a small range of products (fertilizer and jute goods made up two-thirds of exports).
85
•
•
Bangladesh exports to India face tariffs of 15% for industrial products without SAPTA preference.
That negligible amounts get exported suggest that they face major competition with imports from
ROW. But, for goods with SAPTA preference and a rate of only 7.5%, there are not much exports
either. Bangladesh business leaders tend to argue that SAPTA coverage is irrelevant as it excludes
exports of interest to Bangladesh. For instance, specific tariffs on textile and garments keep off
competitive imports from other developing countries, including Bangladesh.
Bangladesh exports are dominated by RMG exports which import all raw materials under the bonded
system free of custom duties. A 5% export subsidy exists on domestic fabrics/yarn used by garment
exporters. Besides, there is an array of subsidies and bans on primary products (wet blue leather)
which would have to be discussed with India in the context of an FTA or SAFTA.
Informal trade
• Informal and illegal trade between India and Bangladesh is substantial and, by some estimates, could
be as high as three quarters of recorded trade. It is mostly one way -- from India to Bangladesh. Quite
apart from the well-known cross-border informal trade, this study notes the existence of significant
volumes of illegal imports into Bangladesh through legal channels (technical smuggling) by underinvoicing, misclassification, and bribery of customs.
• The study finds that preferences for formal trade will be influenced by the levels of Bangladesh
protective tariffs, rigor of customs administration, and the state of infrastructure at border posts
(roads, storage, technical and administrative capabilities).
• To reduce informal/illegal imports, both countries need to
⇒ improve infrastructure – physical and administrative – at land border customs posts;
⇒ streamline and harmonize customs procedures and administration at the border to reduce
incentives for corruption
⇒ expand facilities at smaller customs border posts
⇒ For Bangladesh, bring down the high protective tariffs. Trade Liberalization Programme
under SAFTA will facilitate this process.
Trade Financing and transaction costs
• A study of the financing of India-Bangladesh trade points out that the hawala networks perform better
than the formal banking system in terms of simplicity, speed, transaction costs, and reliability, and
that for these reasons they are not only financing much of the informal bootleg smuggling trade from
India to Bangladesh, but also substantial parts of the exports to Bangladesh that go through the legal
routes. If this is correct, they involve non-negligible transaction costs without protecting the suppliers
and importers against commercial risks such as defective shipments, non-payment, delayed payments
etc.
Reconciling the trade statistics
• The study made a detailed comparison of the Indian and Bangladesh statistics of bilateral trade. The
purpose was to check any major discrepancies as to the general level of, and trends in, the total
recorded trade. Such a comparison could throw light on the scale and scope of over-invoicing, underinvoicing, and similar practices, the likely products involved, and more broadly the potential scale of
“technical smuggling”.
• There was greater convergence between Bangladesh export data and Indian import data. But
discrepancies were found, at both the aggregate and product level, between Bangladesh import data
and Indian export data. Bangladesh Bank import statistics appeared to be more complete than NBR
data which did not fully record bonded imports from India.
86
Quantifying economic costs and benefits of an FTA
• A methodology was developed to quantify, by using industry case studies, the economic welfare
implications of an FTA between the two countries. Free trade agreements discriminate against
imports from rest of the world (ROW) and, in so far as the imports from the ROW countries that are
excluded, are traded at lower prices than the imports from the FTA countries, there is an economic
welfare loss for the FTA members, and also an economic loss for the ROW exporters who lose their
markets. These trade diversion effects need to be allowed for in any comprehensive evaluation of the
costs and benefits of FTAs.
• The following industry case studies simulated the likely effects of an FTA: cement, light bulbs, sugar,
readymade garments. For the first three, it turned out that under an FTA there are expanded Indian
exports to Bangladesh, but no exports from Bangladesh to India. This was because (a) India was
exporting all these products to the rest of the world and –except for cement -- also to Bangladesh; and
(b) Indian export prices were substantially lower than ex-factory before-tax prices of the same or
similar products in Bangladesh. The simulations for ready made garments predict increased
Bangladesh exports to India, but also increased RMG exports from India to Bangladesh.
Policy implications of FTA
Implications for Bangladesh. The static simulation results show export expansion for India in all
products except garments. In these instances, consumer welfare gains far outweigh losses in government
revenue or producer surplus in Bangladesh. But these gains could be extremely limited unless
infrastructure and administrative capacities are expanded at the borders. Yet, by providing a captive
protected market to Indian suppliers under an FTA, the possibility arises of collusion amongst Indian
producers or between them and Bangladeshi importers, thus shaving off some of the welfare gains.
Bangladesh would be better served in pursuing similar welfare gains from multilateral liberalization.
Implications for India. India’s trade with Bangladesh is rather small relative to its total trade
such that the economic welfare gains from an FTA are modest, largely stemming from gains in producer
surplus due to expanded exports. Even in the RMG case, consumer gains are limited thanks to the general
openness of India’s current trade policies. India stands to gain from the continuation of its policies of
unilateral liberalization paying special attention to the removal of non-tariff barriers, specific duties on
textiles and garments, and prohibitive tariffs on agricultural products.
India-Bangladesh cooperation in other areas. The arguments against FTA and in favour of
multilateral liberalization notwithstanding, immense possibilities exist for gainful bilateral economic
cooperation. The study finds substantial benefits from coordinated improvements in the transport, storage
and administrative infrastructures at and adjoining the India-Bangladesh land borders, as well as in
harmonization and cooperation in Customs administration and banking relationships. Finally, there is
little doubt that regional cooperation in energy and infrastructure could yield dividends in terms of crossborder investments and joint ventures.
87
Background Papers
Bayes, Abdul (2002). “India-Bangladesh Informal Trade: Findings on Bangladesh Imports from India”.
World Bank: India-Bangladesh trade study, project report.
Das, Samantak and Sanjib Pohit (2003). “Quantifying the Transport, Regulatory and Other Costs of
Indian Overland Exports to Bangladesh”. NCAER: India-Bangladesh trade study, project report.
Goyal, Arun (2004). “Study on Financing of India-Bangladesh Trade”. Academy of Business Studies,
Delhi. India-Bangladesh trade study, project report.
Mehta, Rajesh (2004). “An Overview and Analysis of India-Bangladesh Trade”. RIS. India-Bangladesh
trade study, project report.
Pursell, Garry (2004). “Analyzing the Economic Welfare Consequences of a Free Trade Agreement:
Partial Equilibrium Methods of Industry Level Studies”. India-Bangladesh trade study, project report.
----------- (2004). “Free Trade between India and Bangladesh? Analysing and Quantifying Potential
Economic Costs and Benefits: A Case Study of the Cement Industry”. India-Bangladesh trade study,
project report.
----------- (2004). “Free Trade between India and Bangladesh? A Case Study of the Sugar Industry”.
India-Bangladesh trade study, project report.
----------- (2004). “Free Trade between India and Bangladesh? A Case Study of the Ready Made
Garment Industry”. India-Bangladesh trade study, project report
----------- (2004). “India-Bangladesh FTA: Methodology and Selected Case Studies”. India-Bangladesh
trade study, project report.
----------- and Abdul Bayes (2004). “Study of India-Bangladesh Trade and Trade Policies: Simulations of
Economic Welfare Effects of a Free Trade Agreement – A Case Study of Light Bulbs”. IndiaBangladesh trade study, project report.
----------- (2004). “Study of India-Bangladesh Trade and Trade Policies: Simulations of Economic
Welfare Effects of a Free Trade Agreement – A Case Study on Tube Lights”. India-Bangladesh trade
study, project report.
----------- (2004). “Study of India-Bangladesh Trade and Trade Policies: Simulations of Economic
Welfare Effects of a Free Trade Agreement – A Case Study of Tyres”. India-Bangladesh trade study,
project report.
89
References
Acharya, Shankar and Associates (1985). Aspects of the Black Economy in India, Government of India,
Ministry of Finance. March
Ahluwalia, Deepak and Ashok Gulati (1999). India’s Sugar Industry- Priorities for Reform, Paper
presented at NCAER-IEG-World Bank workshop, New Delhi April 15-16
Akram, Tanweer. “Public Enterprise Inefficiency and the Road to Privatization in Bangladesh”.
Anderson, James E. and Wincoop, Eric Van (2001). “Borders, Trade and Welfare”. National Bureau of
Economic Research, working paper # W8515, October.
Asian Development Bank (1998). Prospects of Regional Trade Under SAPTA. Report prepared by Data
International for Asian Development Bank (ADB), Bangladesh Resident Mission.
ASSUC (2001). Association des Organisations Professionnelles du Commerce des Sucres pour les pays
du l’union Europeanne.
Bakht, Z. (1996). “Cross Border Illegal Trade in Bangladesh: Composition, Trends and Policy Issues.”
Bangladesh Institute of Development Studies (BIDS), Dhaka.
----------- and Binayak Sen (2002), Border Trade in the South Asian Growth Quadrangle (Bangladesh,
Bhutan, India and Nepal), Bangladesh Institute of Development Studies, May 2002.
Baljit Rai (1993). “Demographic Aggression against India—Muslim Avalanche from Bangladesh”, BS
Publishers, Chandigarh
-----------. Bangladesh Bank, Annual Reports, 2002-2004. Dhaka
-----------. Economic Trends. Monthly. Various issues. Dhaka
Bangladesh Bureau of Statistics. Bangladesh Statistical Bulletin. Monthly. Various issues.
Baruah, Srinath (2000). "Certain Observations on Informal Border Trade with Neighbouring Countries
and Economic Prospects of the North Eastern Region".
Bayes, Abdul (2004). Technical Smuggling: Impressions from Informal Investigations, India-Bangladesh
trade study, draft project report.
Bhagwati, J. (1982). "Alternative Theories of Illegal Trade: Economic Consequences and Statistical
Detection." Weitwirstschfliches, Vol. XVII.
----------- and Hansen, A. (1973). ”A Theoretical Analysis of Smuggling.” Quarterly Journal of
Economics, LXXXVII.
Borell, Brent (1999). A New Era in World Sugar Trade Implications for South Asian Countries. Chapter
11 in Blarel, Benoit
Bougheas, Spiros, P.O. Demetrades, and E.L.W. Morgenroth (1999). “Infrastructure, Costs and Trade”.
90
Journal of Development Economics 47.
Buencamino, Leonides and Gorbunov. Sergei (November 2002). Discussion Paper of the United Nations,
Department of Economic and Social Affairs “Informal Money Transfer Systems:Opportunities and
Challenges for Development Finance”
Celent Communications, LLC, “Global Money Transfers: Exploring the Remittance Gold Mine”, 8
August 2002, (http://www.celent.com).
Center for Monitoring Indian Economy (2004). India’s Trade.
Chaudhari, S.K. (1995). “Cross Border Trade between India and Bangladesh”. National Council of
Applied Economic Research (NCAER), New Delhi, working paper # 58.
Chow, Garland and J.J. McRae (1989). “Nontariff Barriers and the Structure of the U.S.-Canadian
(Transborder) Trucking Industry”. Transportation Journal 30(2):4-21.
CMIE (July 2004). Industry Market Size and Shares. Centre for Monitoring the Indian Economy.
Mumbai
Coalition against Trafficking in Women (CATW) (2000) - Asia Pacific "Trafficking in Women and
Prostitution in the Asia Pacific".
Cooper, R.N. (1974). “Tariffs and Smuggling in Indonesia.” In J. Bhagwati (ed.)
Illegal Transactions in International Trade. North Holland.
Cudmore, Edgar and Whalley, John (2003). “Border Delays and Trade Liberalization,” National Bureau
of Economic Research, working paper # W9485, February.
Das, Samantak, Somnath Mukherjee and Sowmya Srinivasan (2003). Study of a Sample of Products/
Industries, NCAER: India-Bangladesh trade study, project report
Directorate of Sugar, Ministry of Food and Civil Supplies (2004). Summary of Indian sugar policies as of
October 2004. http://fcamin.nic.in/Dir _Of_Sug.htm.
Eusufzai, Zaki (2000). Liberalization in the Shadow of a Large Neighbour: The case of Bangladesh-India
Economic Relations, Loyola Marymont University.
Exim Bank of India (1999). “Transaction Costs of Indian Exports: An Analysis”. Working paper # 104.
Faruquee, Rashid (ed) (1998). Bangladesh Agriculture in the 21st Century, University Press, Dhaka
Ghafur, A., Muinul Islam and Naushad Faiz. (1990). “Illegal International Trade in Bangladesh: Impact
on Domestic Economy, Phase 1.” BIDS, Dhaka.
G.O.I., MoC (2002). Report of the Committee on Informal Cross Border Trade, G.O.I., July.
Goldar, B.N. and Ashok Gulati (1991). Effective Incentives for Sugarcane and Sugar, Mimeo. August
----------- and Mehta, R. (2001). “The Budget and Customs Duties”, Economic and Political Weekly,
Vol.XXXVI, No.12, March 2001.
91
Goyal, Arun (2004). Easy Reference Customs Tariff 2004-2005, Academy of Business Studies, New
Delhi.
Government of India (1998). Mahajan Committee on Sugar Industry, Summary of the Committee’s
recommendations at http://members.tripod.com
----------- (2002). Report on the Committee on Informal Cross Border Trade, Ministry of Commerce and
Industry, Department of Commerce, Economic Division
Gulati, Ashok, Garry Pursell and Kathleen Mullen (2003). Indian Agriculture Since the Reforms:
Performance, Policy Environment, and Incentives, Mimeo, May. Report prepared for the World Bank
Gulati, Ashok and Sudha Narayanan (2003). Subsidy Syndrome in Indian Agriculture, Oxford University
Press, New Delhi
Himadri Bhattacharya (September 2002). “Deregulation of Gold in India: A Case Study in Deregulation
of a Gold Market”, Research Study No 2, Centre for Public Policy Studies, World Gold Council,
London.
Hummels, David (2001). “Time as a Trade Barrier”. Working paper, Purdue University, July 2001.
India Infoline (2004). Sector Database: Sugar, www.indiainfoline.com 18 February 2004.
Indian Sugar Mills Association (2004). Sugar Situation www.indiansugar.com
Kalra, G.D. and Ashok Gulati (1992). Effective Incentives in India’s Agriculture: Cane-gur and Sugar
Cane in Uttar Pradesh, Mimeo. April.
Lin, J. Y. and Nugent, J.B (1995). “Institutions and Economic Development” in Handbook of
Development Economics, Volume III, Edited by J. Behrman and T.N. Srinivasan.
Mahmud, W (1989). The Impact of Overseas Labour Migration on the Bangladesh Economy, Bangladesh
Development Studies, 8(3).
Mehta, R. (1997). “Trade Policy Reforms, 1991-92 to 1995-96: Their Impact on External Trade”,
Economic and Political Weekly, April, pp.779-784.
----------- (1999). Tariff and Non-Tariff Barriers of Indian Economy: A Profile, RIS.
----------- (2000). “Removal of QRs and Impact on India’s Import”, Economic and Political Weekly,
Vol.XXXV, No.19, May 2000.
----------- (2000). “The South Asian Preferential Trading Arrangement: Impact on Intra-regional Trade”,
The Asia Pacific Journal, Vol.4, No.1, June 2000.
----------- (2000). QR Removal and India’s Import: The Case of India’s Unilateral Offer for SAARC
Countries, RIS.
----------- (2002). Establishment of Free Trade Arrangement Among BIMST-EC Countries: Some Issues,
RIS Discussion Paper No. 23, January 2002.
92
----------- (2003). Indian Industrial Tariffs: Towards WTO Development Round Negotiations, RIS.
Muni, S.D. (1992). “India and Nepal: A Changing Relationship,” Konark
Oryza summary of April 27th 2003. Report from New Delhi, India
Pitt, M.M. (1981). “Smuggling and Price Disparity.” Journal of International Economics, Vol. II,
Amsterdam
Prasad HAC (July 2002). Report of Committee on Informal Cross Border Trade, Ministry of Commerce,
Government of India
Pohit, Sanjib, and Nisha Taneja (2000). India’s Informal Trade with Bangladesh and Nepal: A
Qualitative Assessment, ICRIER Working Paper No. 58, July.
Pursell, Garry and Alberto Valdes (eds). Implications of the Uruguay Round Agreement for South Asia:
The Case of Agriculture
----------- and Anju Gupta (1998). Trade Policies and Incentives in Indian Agriculture. Background Paper
1: Sugar and Sugarcane, World Bank Policy Research Working Paper no, 1953. August
Rahman, Aneeka (July 2003). Policy Regime in the Sugar Sector. World Bank Dhaka office. Policy note.
Rahman, Atiur (2002). Issues in Indo-Bangladesh Smuggling of Goods and Services and Economic
Security of Bangladesh.
Rahman, A. and A. Razzaque. (1998). Informal Border Trade between Bangladesh and India: An
Empirical Study in Selected Areas. The Asia Foundation.
Rahman, M. (2001). “Bangladesh-India Economic Relations: Current Status and Unfinished Tasks.”
Paper presented at the Eighth Indo-Bangladesh Dialogue on Economic Cooperation, January, 2001,
Center for Policy Dialogue.
Rashid, M. Rehan and Abbas, Tanveer (October 2003). Problems in Trade Finance between North East
India and Bangladesh. South Asia Enterprise Development Facility (SEDF), Dhaka
Rao V.L. et al. (1997). India’s Border Trade with Select Neighbouring Countries, RIS.
South Asian Association for Regional Cooperation (SAARC), 2005. Agreement on South Asian Free
Trade Area (SAFTA).
Shahabuddin, Quazi and Paul Dorosh (2002). Comparative Advantage in Bangladesh Crop Production,
International Food Policy Research Institute , MSSD Discussion Paper No 47. October
Siddiqui Tasneem and Abrar CR (2001). Migrant Workers Remittances and Microfinance Institutions,
Geneva ILO (Mimes)
Subramanian, Uma (1999). “South Asia Transport: Issues and Options”. Paper presented at the World
Bank/ESCAP Regional Technical Workshop on Transport and Transit Facilitation, Bangkok, April.
----------- and Arnold, John (2001). “Forging Subregional Links in Transport and Logistics in South
93
Asia”. The World Bank, Washington, D.C., January.
Taneja, Nisha, (1999). Informal Trade in the SAARC Region, ICRIER Working Paper No. 47.
----------- (2001). Informal Trade in SAARC Region, Economic and Political Weekly.
Unnayan Bikalper Nitinirdharoni Gobeshona (UBINIG), (1995). Trafficking in Women and Children: The
Cases of Bangladesh, pp. 20 &21
USDA (2003). Indian Sugar Annual 2003, GAIN Report #IN3028 dated 4/10/2003.
World Bank. (1995). India and Bangladesh: Prospects for Economic Cooperation. Private Sector
Development and Finance Division, South Asia Country Department I, Washington D.C.
----------- (2002). Bangladesh: Agricultural Growth and Rural Poverty Dynamics: A Regional
Perspective, South Asia Rural Development Unit, July 1. Mimeo
----------- (2003). Bangladesh: Public Expenditure Review. World Bank Report No. 24370- BD.
Washington D.C.
94
95
World Bank Bangladesh Development Series publications
Paper No. 1
Bangladesh PRSP Forum Economic Update – Recent Developments and
Future Perspectives (Nov. 2005).
Paper No. 2
End of MFA Quotas: Key Issues and Strategic Options for Bangladesh Ready
Made Garment Industry (Dec. 2005).
Paper No. 3
Bangladesh Country Water Resources Assistance Strategy, (Dec. 2005).
Paper No. 4
Comparative Advantages of Health Care Provision, (Dec. 2005).
Paper No. 5
Targeting Resources for the Poor in Bangladesh (Dec. 2005).
Paper No. 6
Improving Trade and Transport Efficiency – Understanding the Political
Economy of Chittagong Port (Dec. 2005).
Paper No. 7
Revitalizing the Agricultural Technology System in Bangladesh (Dec. 2005).
Paper No. 8
Bangladesh Integrated Nutrition Project, Effectiveness and Lessons Learned
(Dec. 2005).
Paper No. 9
Social Safety Nets in Bangladesh: An Assessment (Jan. 2006)
Paper No. 10
Bangladesh Country Assistance Strategy (April 2006)
Paper No. 11
Economics and Governance of NGOs in Bangladesh (April 2006)
Paper No. 12
Bangladesh Country Environmental Analysis (September 2006)
Paper No. 13
India-Bangladesh Bilateral Trade and Potential Free Trade Agreement
(December 2006)
Forthcoming Publications
Bangladesh: Piloting Reform through the Development and Management of
Economic Zones
The Bangladesh Vocational Education and Training System
Bangladesh Strategy for Growth and Employment
All Bangladesh Development Series papers are downloadable at www.worldbank.org.bd/bds
96


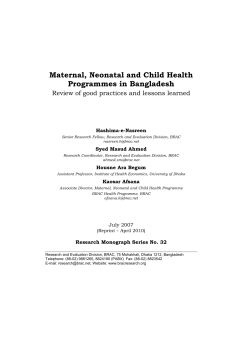
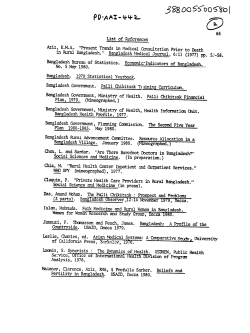


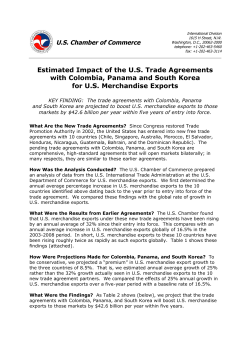

© Copyright 2026