
Activated expression of the chemokine Mig after chemotherapy
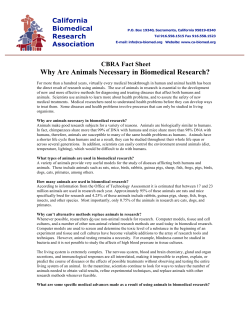
From www.bloodjournal.org by guest on November 7, 2014. For personal use only. 2012 119: 4868-4877 doi:10.1182/blood-2011-07-367581 originally published online April 3, 2012 Activated expression of the chemokine Mig after chemotherapy contributes to chemotherapy-induced bone marrow suppression and lethal toxicity Huili Lu, Shunying Zhu, Lan Qian, Di Xiang, Wu Zhang, Aifang Nie, Jin Gao, Mingyuan Wu, Jinming Gao, Bao Lu, Yan Yu, Wei Han and Anja Moldenhauer Updated information and services can be found at: http://www.bloodjournal.org/content/119/21/4868.full.html Articles on similar topics can be found in the following Blood collections Hematopoiesis and Stem Cells (3271 articles) Information about reproducing this article in parts or in its entirety may be found online at: http://www.bloodjournal.org/site/misc/rights.xhtml#repub_requests Information about ordering reprints may be found online at: http://www.bloodjournal.org/site/misc/rights.xhtml#reprints Information about subscriptions and ASH membership may be found online at: http://www.bloodjournal.org/site/subscriptions/index.xhtml Blood (print ISSN 0006-4971, online ISSN 1528-0020), is published weekly by the American Society of Hematology, 2021 L St, NW, Suite 900, Washington DC 20036. Copyright 2011 by The American Society of Hematology; all rights reserved. From www.bloodjournal.org by guest on November 7, 2014. For personal use only. HEMATOPOIESIS AND STEM CELLS Activated expression of the chemokine Mig after chemotherapy contributes to chemotherapy-induced bone marrow suppression and lethal toxicity Huili Lu,1,2 Shunying Zhu,3 Lan Qian,1 Di Xiang,1 Wu Zhang,4 Aifang Nie,5 Jin Gao,1 Mingyuan Wu,1 Jinming Gao,6 Bao Lu,7 *Yan Yu,3 *Wei Han,1 and Anja Moldenhauer2,8 1Laboratory of Regeneromics, School of Pharmacy, Shanghai Jiaotong University, Shanghai, China; 2Institute for Transfusion Medicine, Charite´-Universita¨tsmedizin Berlin, Berlin, Germany; 3Shanghai Municipality Key Laboratory for Veterinary Biotechnology, School of Agriculture and Biotechnology, Shanghai, China; 4Institute of Hematology and 5Department of Endocrine and Metabolic Disease, Ruijin Hospital, Shanghai Jiao Tong University, Shanghai, China; 6Department of Respiratory Disease, Peking Union Medical College Hospital, Peking, China; 7Division of Pulmonary, Children’s Hospital, Harvard Medical School, Boston, MA; and 8Institute for Hemostaseology and Transfusion Medicine, Klinikum Ludwigshafen, Ludwigshafen, Germany Alterations in gene expression after chemotherapy may potentially help to identify mediators that induce suppression or regeneration in bone marrow. This paper reports our observation that the expression of the chemokine monokine induced by IFN-␥ (Mig) and its receptor CXCR3 was significantly activated in mice after treatment with the chemotherapeutic agent 5-fluorouracil (5-FU). The neutralization of antibodies against the activated Mig increased the survival rate and accelerated BM recovery after che- motherapy. In addition, elevation of Mig plasma levels after 5-FU treatment corresponded with increased mortality. The cell cycle–inhibiting effect of the prophylactic administration of Mig protected hematopoietic progenitor cells (HPCs) from 1--D-arabinofuranosylcytosine in spleen colony assays and enhanced the irradiated recipients’ survival. In CXCR3ⴚ/ⴚ mice, Mig did not propagate BM suppression, indicating that the suppressive effect of Mig is dependent on CXCR3. On the one hand, Mig stimu- lated p70 S6K and Erk1/2 pathways in mesenchymal stroma cells, inhibiting mesenchymal stroma cell–dependent HPC expansion. Moreover, Mig suppressed the STAT5 pathway in HPCs, inhibiting leukocyte differentiation. Our results strongly suggest that Mig contributes to the acute lethal toxicity arising from 5-FU administration. Neutralization of Mig may offer new strategies to alleviate BM toxicity with potentially dramatic implications for chemotherapy. (Blood. 2012;119(21):4868-4877) Introduction Blood originates in the bone marrow (BM), where hematopoietic stem cells (HSCs) and hematopoietic progenitor cells (HPCs) reside. The process of hematopoiesis is tightly regulated by several positive and negative signals.1,2 Of the different types of blood cells, leukocytes are especially susceptible to intercalating agents, and because of their proliferative activity and constant turnover, they have a rather limited life span. They must constantly be replenished from hematopoietic cells, and because therapeutic cytotoxins attack these cells directly, the BM is very highly sensitive to chemotherapy.3,4 If the direct cytotoxicity of chemotherapeutic drugs on BM cells were the exclusive cause of BM suppression, chemotherapy without accompanying BM toxicity would be an impossibility. If, in contrast, not just BM toxicity alone but also chemotherapy-related changes in BM gene expression contribute to BM suppression, then the BM might be saved by inhibiting the expressed suppressive BM genes. Chemotherapy-induced BM suppression and regeneration has several standard characteristics. In normal mice, a limited dose range of 5-fluorouracil (5-FU) results in decreased bone marrow cellularity that reaches its minimum at approximately day 7 after administration and a recovery to pretreatment levels 2 weeks after 5-FU treatment.5,6 As expected, BM cellularity correlates inversely with the 5-FU dose: the higher the dose, the lower the BM cellularity. However, the amount of time required for marrow cells to reach their minimum and to recover is rather constant and dose-independent. This suggests that BM suppression after chemotherapy may not be solely based on direct cytotoxicity but also may be affected by other factors, such as the expression of suppressive components. Mounting evidence suggests that chemokines are not only important for the migration and proliferation of leukocytes but also are involved in tissue repair, tumor progression, and hematopoiesis. More than 20 chemokines have thus far been shown to manifest suppressive activity on the proliferation of HPCs.7 One of these chemokines, macrophage inflammatory protein 1 ␣ (MIP-1␣), has been demonstrated to have a chemoprotective effect by accelerating neutrophil recovery in mice treated with chemotherapeutic agents, but it did not protect HPCs or improve the colony-forming capacities.8 That may be attributed to the maturation stage of HPCs, because MIP-1␣ preferably targets rather mature HPCs and not the most primitive HPCs.9 In addition, clinical outcomes in tests with MIP-1␣ were not satisfactory.10 Which chemokines are induced by chemotherapy and how their expression modulates the BM response to anticancer drugs remains unclear. Based on a transcriptome analysis of BM cells from mice receiving 5-FU chemotherapy, we found that the expression of Mig and its receptor CXCR3 was extremely up-regulated. Mig is a CXC-chemokine (CXCL9) that shares the receptor CXCR3 with Submitted July 14, 2011; accepted March 16, 2012. Prepublished online as Blood First Edition paper, April 3, 2012; DOI 10.1182/blood-2011-07-367581. The publication costs of this article were defrayed in part by page charge payment. Therefore, and solely to indicate this fact, this article is hereby marked ‘‘advertisement’’ in accordance with 18 USC section 1734. *Y.Y. and W.H. are the corresponding authors. The online version of the article contains a data supplement. 4868 © 2012 by The American Society of Hematology BLOOD, 24 MAY 2012 䡠 VOLUME 119, NUMBER 21 From www.bloodjournal.org by guest on November 7, 2014. For personal use only. BLOOD, 24 MAY 2012 䡠 VOLUME 119, NUMBER 21 IP-10 (IFN-␥–inducible protein, also known as CXCL10) and I-TAC (IFN-␥–inducible T-cell ␣ chemoattractant, also known as CXCL11).11,12 In recent years, Mig has been studied primarily for its role in autoimmune diseases, angiostasis, and immunomodulation.13-15 The primary protein sequence of murine Mig (MuMig) and human Mig (HuMig) is highly conserved, with a sequence identity of 74%.16 A high degree of sequence identity also has been observed for the receptor CXCR3, with an 86% identity level.17,18 Recombinant HuMig decreases the number of committed and primitive human HPCs in vitro, and the absolute number and cycling status of mouse HPCs in vivo.19 Interestingly, Mig knockout mice have normal peripheral leukocyte and differential counts,20 and CXCR3 knockout mice are normal in both appearance and growth.21 Compared with other chemokines with myelosuppressive properties, the physiologic and pathologic roles of Mig in the regulation of hematopoiesis in steady and stress states remain unknown. Here, we present a series of in vitro and in vivo experiments to demonstrate the direct and indirect ways that Mig regulates HPC proliferation, and we outline the potential application of anti-Mig antibody to alleviate or ameliorate chemotherapyinduced BM cytotoxicity. Methods High-density oligonucleotide microarray The GeneChip methodology developed by Affymetrix was used to monitor global gene expression during mouse BM regeneration induced by a single injection of 5-FU. In total, 5 RNA samples were extracted from BM cells collected on days 0, 3, 7, 11, and 14 after 5-FU treatment. Between 5 and 20 mice were used for each time point to obtain sufficient amounts of cells for RNA extraction. Equal amounts of poly(A) RNA from each sample were used to synthesize double-stranded cDNA. Five cRNA samples were prepared by in vitro transcription using equal amounts of cDNA. These samples were used for hybridization in mouse genome expression oligonucleotide arrays (GeneChip Mouse Expression Set 430; Affymetrix) containing 34 323 well-substantiated mouse genes. The hybridization intensity information was gathered by GeneChip scanner 3000 and analyzed with Affymetrix Microarray Suite Version 5.1. The global scaling strategy was used for all arrays conducted, which set the average signal intensity of the array to a target signal of 500. Comparative analyses for expression data at each time point were calculated using day 0 BM arrays as the baseline. Preparation of rMuMig and anti-Mig antibodies In vitro experiments were performed using commercial recombinant Mig (PeproTech). For in vivo experiments, rMuMig was produced internally. rMuMig was expressed in an Escherichia coli expression system and then purified to a homogeneity of more than 99% with less than 1 EU/g endotoxin using the LAL method (Xiamen Houshiji) as described previously.22 Anti-Mig polyclonal antibodies were produced in Wistar rats (SLACCAS) by immunization with rMuMig. In brief, 300 g of rMuMig was mixed with equal volume of Freund’s complete adjuvant (Bio Basic). The mixture was injected subcutaneously into 3 rats. Twenty-one days after the initial injection, the rats were boosted by readministration of the mixture once a week for 3 weeks. Anti-Mig serum was collected from the animals 2 weeks after the last booster. Control serum was collected from rats immunized with PBS using the same protocol. The anti-rMuMig polyclonal antibody was shown to interact specifically and effectively with rMuMig at the dilution from 1:1000 to 1:10 000 (supplemental Figure 1, available on the Blood Web site; see the Supplemental Materials link at the top of the online article). MIG PARTICIPATES IN MYELOSUPPRESSION 4869 CXCR3-deficient (CXCR3 KO) mice The CXCR3 KO mouse line was developed from C57BL/6 mice by gene targeting, as described previously,21 and it was kindly provided by Dr Bao Lu (Harvard Medical School, Boston, MA). The CXCR3–/– and C57BL/6 background wild-type (WT) mice (SLACCAS) were maintained under pathogen-free conditions in a vented caging system. Animal experiments were performed on 8- to-10-week old mice with the authorization of the Animal Care and Use Committee of the School of Pharmacy of Shanghai Jiao Tong University. rMuMig were administered to mice subcutaneously in a volume of 50 L. One microliter of control rat serum or anti-Mig rat serum diluted in 10 L of PBS was injected subcutaneously. 5-FU was administered intravenously (tail vein). Immunoassay of plasma levels of chemokines Mouse peripheral blood (PB) samples were obtained by retro-orbital punctures. Plasma was aliquoted after centrifugation for 10 minutes at 1000g. Aliquots were frozen immediately at ⫺20°C. ELISA were performed in accordance with the manufacturer’s instructions (Quantikine Immunoassays; R&D Systems). Hematologic analysis and colony assay Bone marrow cells were flushed from the femur and tibia from each mouse with 10 mL of PBS containing 2% FCS. After centrifugation at 1000g for 10 minutes, cell pellets were resuspended in 5 mL of PBS. The total numbers of BM nucleated cells were counted using a hemocytometer after lysis of the red blood cells (RBCs) with 3% acetic acid in PBS solution at a dilution of 1:10. An automated Hematology Analyzer MEK-6318K (Nihon Kohden) was used to confirm the bone marrow numbers. For colony assay, nucleated cells were separated from the BM by Ficoll and seeded in appropriate numbers into 1.2% methylcellulose medium supplemented with 30% of fetal bovine serum and cytokines (10 ng/mL human [h]EPO, obtained from Kirin Kunpeng; 10 ng/mL mouse [m]SCF, mIL-3, mIL-6, obtained from PeproTech; 20 ng/mL hG-CSF obtained from 3SBio). Cells were incubated under humidified conditions for 7 days at 37°C. Colonies consisting of more than 50 cells were scored using an inverted microscope as described previously.23 Flow cytometry Flow cytometry analysis of cell surface markers on mouse BM nucleated cells (BMNCs) was performed as described previously.24 In brief, BMNCs were flushed from mouse femurs into buffer A (PBS and 2% fetal calf serum). Cells were then washed with buffer A by centrifugation at 500g for 5 minutes. The color-labeled antibodies anti-CXCR3, c-Kit, Sca-1, lineagemarkers (CD5, CD11b, CD45R, Gr-1, and TER119), or their isotype antibodies were added to the cell suspension after incubation of the cells with an Fc blocker. Stained cells were washed twice and analyzed using the FACSCalibur flow cytometer (BD Biosciences). Flow cytometry analysis of cell cycles was performed as described previously.22 Spleen colony assay Hematopoietic stem cells were determined by the spleen colony (CFU-S) assay of Till and McCulloch.25 Donor mice were killed on day 9 after treatment with 225 mg/kg 5-FU, and the BM cells were flushed from tibia and femurs. Lineage negative (lin⫺) cells were isolated from BM cells using an EasySep Mouse Hematopoietic Progenitor Cell Enrichment Kit (StemCell Technologies) and reserved for use later as donor cells in the CFU-S assay. Donor cells were cultured in IMDM plus 20% FBS and cytokines (10 ng/mL of mSCF, mIL-3, mIL-6, and 20 ng/mL hG-CSF), with or without rMuMig. After incubation for 4 hours, 1--D-arabinofuranosylcytosine (Ara-C) was directly added to cell cultures to reach a final concentration of 1mM. After incubation for 1 hour, cells were washed twice and resuspended in saline. For each group, 15 recipient mice were irradiated with 790 cGy (81 cGy/min) from a Cs137 source. Donor cells were intravenously From www.bloodjournal.org by guest on November 7, 2014. For personal use only. 4870 LU et al BLOOD, 24 MAY 2012 䡠 VOLUME 119, NUMBER 21 Figure 1. Mig and its receptor CXCR3 are activated in BM cells after chemotherapy. Normal mice received a single injection of 5-FU (250 mg/kg). (A) BM cells were obtained and counted at different times after 5-FU treatment. Total BM cell counts fell rapidly and reached a minimum on day 7, when BM recovery began. (B left) BM cells pooled from 5 to 20 mice at each time point were used to prepare samples for hybridization to Affymetrix mouse genome expression oligonucleotide arrays. The hybridization intensities of genes encoding Mig, IP-10, I-TAC, and CXCR3 are shown on days 0, 3, 7, 11, and 14 after 5-FU treatment. On day 7, the mig and cxcr3 genes were up-regulated 30- and 6-fold, respectively, compared with baseline (day 0). No significant changes in signal intensities of ip-10 and i-tac were observed. (Right) Plasma levels of ligand protein (determined by ELISA) and receptor expression in BM (determined by FACS). Samples of 3 to 5 mice per time point were individually analyzed for each dot. A 30-fold increase of Mig protein level and more than a 2-fold increase of CXCR3 expression in BMNCs were detected on day 7 (P ⬍ .05). There was no change in IP-10 and I-TAC expression. (C) CXCR3 expression of BMNCs, lin⫺ cells, and LSK cells were highly up-regulated during BM regeneration. On day 9 after 5-FU treatment lin⫺ cells and LSK cells were examined for CXCR3 expression in the BM of both nontreated normal mice and treated mice during regeneration. Gray line indicates PE-conjugated isotype control; black line, PE-conjugated anti–mouse CXCR3. Shown is 1 representative result of 3 independent experiments (n ⫽ 4-6). injected within a 3-hour period after irradiation. After 11 days, spleens were excised, fixed in Tellesniczky solution, and the visible splenic nodules were counted under a microscope. The number of transplanted lin⫺ cells was adjusted to 10 to 20 colonies per spleen. The formation of endogenous colonies was excluded in control mice, which received saline only and no donor cells. Isolation and incubation of human CD34ⴙ progenitor cells This experiment was approved by the ethical review board of the Charite-Universita¨tsmedizin Berlin. Cord blood specimens were collected from full-term deliveries with informed consent from the mothers. CD34⫹ cells were isolated with magnetic microbeads (Miltenyi) and then cultured From www.bloodjournal.org by guest on November 7, 2014. For personal use only. BLOOD, 24 MAY 2012 䡠 VOLUME 119, NUMBER 21 MIG PARTICIPATES IN MYELOSUPPRESSION 4871 Figure 2. Mig inhibits BM proliferation through CXCR3 in vivo and in vitro. Normal mice (n ⫽ 6) were injected once daily for 5 consecutive days with 15 g/kg recombinant Mig protein or with PBS as control after 5-FU treatment. BMNCs and lin⫺ cells were collected within 24 hours after the final injection, and their cell cycle status was analyzed by flow cytometry. (A-B) Both BMNCs and lin⫺ cells of WT mice were depressed significantly during the S phase; however, in CXCR3 KO mice (C; n ⫽ 4), Mig did not interfere with the cell cycle. (D-E) BMNCs were collected from healthy WT or CXCR3 KO mice for colony assays with PBS (control) or 30 ng/mL recombinant HuMig (Mig). Mig significantly inhibited colony formation in WT mouse but had no effect on KO mouse. *P ⬍ .05, **P ⬍ .01. Shown are means ⫹ SEM of 4 separate tests in WT mice and 3 in KO mice. in stem cell medium (IMDM supplemented with 20% FBS, 2mM Lglutamine, 50 g/mL gentamicin, and 7.3 ⫻ 10⫺5M mercaptoethanol) as described previously.23,26 For expansion, CD34⫹ cells were cultured in 96-well plates with medium exchanges twice a week. Cell numbers were determined weekly using a hemocytometer and trypan blue exclusion, and the expansion rates were calculated. Images of cell pellets at the well bottom were taken at room temperature under an inverse microscope (Axiovert 200 M; Carl Zeiss) equipped with a digital camera (MicroPublisher 3.3; Weiss Imaging); QCapture Pro 6.0 software was used for image acquisition. Apoptosis assay After isolation, 105 human CD34⫹ HPCs were incubated with hSCF (20 ng/mL) for 4 hours in combination with Mig (10 ng/mL) or PBS as control. Cells were then incubated with 300mM Ara-C for 1 hour. Incubated cells were then washed and cultured in stem cell medium for another 72 hours. Apoptotic cells were assessed by the Annexin-V Apoptosis Detection kit (BD Biosciences Pharmingen), using flow cytometry according to manufacturer’s instructions. Percentages of early and late apoptosis were determined. Development of mesenchymal stroma cell–conditioned medium Informed consent having been obtained, MSCs were grown from bone marrow specimens and cultured with ␣-MEM supplemented with 12.5% FBS, 2mM L-glutamine, and 100 U/mL penicillin/streptomycin. MSCs were characterized by their spinal morphology and mesenchymal surface markers (CD34 and CD45 negative; CD44, CD90, CD105, CD146, and CD166 positive; all purchased from BD Biosciences Pharmingen).27,28 MSCs (5 ⫻ 105) of passages 3 to 4 were seeded in 25-cm2 flasks and cultured for 1 to 2 days. When the cells reached more than 80% confluence, they were stimulated with 20 ng/mL Mig with or without 2 g/mL anti-CXCR3 monoclonal antibody (R&D Systems) in fresh medium. Supernatants were collected after 40 hours and mixed with stem cell medium at 1 ⫹ 1, resulting in a final concentration of 10 ng/mL Mig or 1 g/mL antibody. CD34⫹ cells were cultured with this conditioned medium of supernatant-media mixture, and CD34-CD45 expression was analyzed by flow cytometry 1 week later. Signaling pathway assay The Milliplex Map Multi-Pathway Signaling Phosphoprotein kit was used to detect the downstream signaling of Mig-CXCR3 interaction in both, CD34⫹ HPCs and MSCs. For cell stimulation, 150 000 freshly isolated CD34⫹ cells were incubated with or without 20 ng/mL Mig in PBS/0.02% human albumin at 37°C for 30 minutes. For MSCs, cells were cultured to confluence and starved of serum for 4 hours before being subjected to the same stimulation procedure. Cell lysates were collected and total protein quantities were determined. Signals of phosphorylation of Erk (ERK/MAP kinase 1/2, threonine 185/tyrosine 187), STAT3 (serine 727), JNK (Thr183/ Tyr185), p70 S6 kinase (Thr412), IB-␣ (Ser32), STAT5A/B (Tyr694/ Tyr699), and p38 (Thr180/Tyr182) were detected by a Luminex 200 system (Millipore) according to the manufacturer’s manual; the mean fluorescent intensities were analyzed. Statistical analysis Results are expressed as means ⫾ SEM. Statistically significant differences over time in the same treatment group or among different treatment groups at a single time point were determined by 1-way ANOVA followed by 2-tailed Student t test (Excel 2003; Microsoft). Results from survival experiments were analyzed using the log-rank test and expressed as Kaplan-Meier survival curves. Statistical significance was assumed for P values less than .05. Results 5-FU treatment induces expression of CXCR3 and its ligand Mig In accordance with the time span for 5-FU–induced bone marrow suppression and regeneration (Figure 1A) the expression of genes encoding both CXCR3 and its ligand Mig were found to be highly induced on day 3 after injection of 5-FU, reaching a maximum on day 7, decreasing on day 11, and returning to pretreatment levels on day 14. In contrast, genes encoding the other 2 ligands of CXCR3, IP-10 and I-TAC, were not observed to be significantly altered in comparison with baseline (Figure 1B left). From www.bloodjournal.org by guest on November 7, 2014. For personal use only. 4872 LU et al BLOOD, 24 MAY 2012 䡠 VOLUME 119, NUMBER 21 We also detected the expression of CXCR3 and its ligands at protein levels. Plasma concentrations of the 3 ligands were examined by ELISA, and Mig concentrations were significantly increased by 29.8-fold on day 7 (P ⬍ .05; Figure 1B right). No changes in IP-10 and I-TAC were evident. The population of CXCR3⫹ BM cells was significantly elevated on days 3, 7, and 11, returning to baseline levels by day 14 after 5-FU treatment (Figure 1B right). Evidently, the temporary protein expression profiles of both receptor and ligand comply with their corresponding gene expression patterns. In addition, the expression of CXCR3 in HPC of lin⫺ and LSK (lin⫺Sca-1⫹c-Kit⫹) cells, particularly in LSK cells, was highly up-regulated during the period of BM regeneration (Figure 1C). Mig inhibits the cell cycle of HPCs through CXCR3 To elucidate the influence of Mig on cell cycling, BMNCs and lin⫺ HPCs of WT C57 mice were compared within 24 hours after 5-FU administration. Exogenous Mig inhibited both BMNC and HPC cycling, reducing the S phase from 18.97% ⫾ 1.07% to 15.30% ⫾ 0.87% in BMNCs and from 14.98% ⫾ 1.98% to 11.37% ⫾ 1.66% in lin⫺ cells (P ⬍ . 01; Figure 2A-B). Because CXCR3 is the only known receptor for Mig in mice, we injected Mig into CXCR3 knockout (KO) mice using the identical protocol as for the WT mice and then examined the cell cycle status of BMNCs. These CXCR3 KO mice were backcrossed at least 6 generations onto the C57BL/6 strain.21 No differences were observed between KO mice receiving Mig or the PBS control (32.09% ⫾ 2.70% vs 30.12% ⫾ 2.32%; P ⫽ .31; Figure 2C). The baseline of S phase percentage was higher in the CXCR3 KO mice than in WT mice (32.09% ⫾ 2.70% vs 18.97% ⫾ 1.07%, P ⬍ .001; Figure 2A,C). Colony assays were performed with BMNCs collected from WT or KO mice femurs to evaluate the effects of Mig on colony-forming HPCs in vitro. Results are demonstrated as percentages in comparison with control group colony numbers. In WT mice, Mig significantly inhibited the colony formation of HPCs in vitro (colony numbers from every 10 000 BMNCs: 93.6 ⫾ 5.0 in the Mig group vs 138.7 ⫾ 14.1 in the control group; P ⬍ .05; Figure 2D), whereas this ability was lost in CXCR3 KO mice (colony numbers from every 10 000 BMNCs: 59.2 ⫾ 0.3 in the Mig group vs 53.3 ⫾ 6.5 in the control group; P ⫽ .91; Figure 2E). These data suggest that Mig may hinder BM expansion in vitro through its receptor CXCR3. Mig protects HPC from chemotherapy in vitro To elucidate the influence of Mig on cultured progenitors, lin⫺ HPCs were isolated and cultured with Mig or PBS as a control before the addition of the drug Ara-C, which belongs to the same class of cell cycle–specific chemotherapeutic agents as 5-FU but is more widely used in cellular experiments. The cultured cells were injected into recipient mice. A group of mice receiving saline only but no donor HPCs served as “negative control,” and a group of mice receiving HPCs and no treatment with Ara-C served as “positive control.” On day 11 after transplantation, surviving mice were killed, and CFU-S numbers were counted. Only 0.14 ⫾ 0.38 CFU-S were found in the negative control, indicating that there was almost no recipient-derived CFU-S. Positive control mice had a mean of 39.2 ⫾ 15.3 CFU-S from 1 ⫻ 104 donor HPCs, indicating a successful transplantation of donor HPCs. In Ara-C treated cells, Mig-pretreated HPCs induced significantly higher CFU-S numbers than PBS-pretreated HPCs (12.1 ⫾ 2.6 vs 7.8 ⫾ 2.7, both from Figure 3. Mig pretreatment protects linⴚ cells from chemotherapy in CFU-S assays. Donor lin⫺ cells were isolated and treated with Ara-C and then transplanted into irradiated recipient mice. Mig group cells were preincubated with the 300 ng/mL recombinant Mig protein. Before incubation with Ara-C, control cells were supplemented with equal volumes of PBS. (A) Eleven days after transplantation, mice from both groups were killed, and CFU-spleen numbers were counted. In the Mig group (n ⫽ 13), significantly higher CFU-spleen numbers were observed than in the PBS group (n ⫽ 8; **P ⫽ .002). (B) Mice injected with Mig-treated cells showed higher survival rates (*P ⫽ .039). Data are representative of 3 independent experiments (n ⫽ 7-16). 1 ⫻ 104 donor HPCs; P ⫽ .002; Figure 3A). This suggests that a higher number of HPCs in the Mig group were protected from Ara-C and reconstituted hematopoiesis after transplantation. We also analyzed the mice’s survival rate and observed higher survival rates in the Mig group than in the PBS group (P ⫽ .039; Figure 3B). Antibody neutralization of Mig accelerates BM regeneration Having demonstrated that activation of endogenous Mig expression after chemotherapy is associated with BM suppression, we further postulated that Mig also might contribute to the acute lethal toxicity of 5-FU–dependent BM suppression. Mice receiving a 90% lethal dose of 5-FU were treated with Mig or PBS as control (Figure 4A top). Mice receiving Mig demonstrated significantly lower survival rates than the control group. The median survival time for the Mig and control group was 5.8 and 7.3 days, respectively (P ⫽ .048; Figure 4A bottom). Therefore, BM suppression-induced expression of Mig would seem to contribute to the acute lethal toxicity of 5-FU. To test our hypothesis that activated expression of Mig and CXCR3 are involved in the pathologic changes in BM after chemotherapy, we applied an antibody neutralization strategy to From www.bloodjournal.org by guest on November 7, 2014. For personal use only. BLOOD, 24 MAY 2012 䡠 VOLUME 119, NUMBER 21 MIG PARTICIPATES IN MYELOSUPPRESSION 4873 Figure 4. Effects of Mig and anti-Mig antibody after 5-FU treatment. Mice received a single dose 5-FU (300 mg/kg) on day 0 and then were treated for 3 days intravenously with either Mig (15 g/kg; n ⫽ 16) or PBS as control (n ⫽ 15; A top). Mice treated with Mig showed lower survival rates than the control mice (P ⫽ .048; A bottom). When mice had been treated with either control (nonsensitized rat serum; n ⫽ 7) or anti-Mig rat serum (n ⫽ 11), the anti-Mig group showed significantly higher survival rates than mice in the control group (P ⫽ .005; B). (C-D) Anti-Mig serum significantly accelerated the recovery of BM (C) and increased colony counts per femur (D) compared with controls. Mice were injected with 225 mg/kg 5-FU on day 0 and treated with either control serum or anti-Mig serum. BM mononuclear cells were counted and cultured for GM-CFU on days 8, 9, 10, 12, and 14. Each point represents the mean ⫹ SEM in 2 independent experiments (n ⫽ 6; *P ⬍ .05). study the hematologic effects of anti-Mig antibody. Mice receiving a 90% lethal dose of 5-FU were treated with anti-Mig immune or control serum (Figure 4B top). We observed that anti-Mig serum significantly improved the survival of mice compared with control serum (P ⫽ .005; Figure 4B bottom). The median survival time for the anti-Mig and control group was 10.7 and 8.4 days, respectively. In another experiment, mice were treated with a single injection of 5-FU at day 0 followed by daily administration of the anti-Mig immune or control serum from day 1 to day 10. Although the minimum levels of BM cells remained unaltered, we observed that anti-Mig significantly improved the recovery of both BM cell numbers (Figure 4C) and colony-forming progenitors (Figure 4D). CXCR3 KO mice regenerated faster than normal mice after 5-FU treatment We further examined the effect of the interruption of Mig-CXCR3 on hematologic regeneration after chemotherapy in the CXCR3 KO mouse model and the C57/BL6 WT counterparts from which it derives. Both KO and WT mice were injected with 225 mg/kg 5-FU on day 0. On days 0, 7, 9, and 11, BM and cultured BM mononuclear cells were counted for the colony assay. As shown in Figure 5, KO mice were observed to have a significantly better recovery on days 9 and 11 in BM numbers and on days 7, 9, and 11 in CFU numbers, which supports the idea that blockage of CXCR3-Mig interaction could enhance the myeloregeneration after 5-FU treatment. Mig directly protects human CD34ⴙ HPCs through CXCR3 In our study, Mig protected mouse HPCs from the cell cycle toxic agent Ara-C. We therefore applied Ara-C to human HPCs to evaluate the influence of Mig on chemotherapy-induced apoptosis. Ara-C treatment significantly up-regulated the percentage of apoptosis in CD34⫹ cells (all Ara-C–treated groups, P ⬍ .01, compared with non–Ara-C controls), but Mig reduced this percentage significantly (26.37% ⫾ 1.12% of SCF ⫹ Mig group vs 35.52% ⫾ 1.21% of SCF alone; P ⬍ .001). The apoptosis inhibitory effect of Mig was reversed using anti-CXCR3 monoclonal antibodies (34.26% ⫾ 1.22% of SCF ⫹ Mig ⫹ anti-CXCR3 group compared with SCF alone; P ⫽ .27). From www.bloodjournal.org by guest on November 7, 2014. For personal use only. 4874 BLOOD, 24 MAY 2012 䡠 VOLUME 119, NUMBER 21 LU et al Figure 5. Regeneration of bone marrow after 5-FU treatment in WT and CXCR3 KO mice. WT and CXCR3 KO mice were treated with 225 mg/kg 5-FU on day 0. On days 0, 7, 9, and 11, BM (A) and CFU-GM (B) were analyzed for hematopoietic regeneration. KO mice demonstrated a significantly better BM recovery than WT mice. Each point represents the mean ⫾ SEM in 2 independent experiments (n ⫽ 6; *P ⬍ .05). Mig inhibits CD34ⴙ cell expansion through modulating MSCs Unexpectedly, Mig did not directly inhibit the expansion of CD34⫹ HPCs in in vitro cell cultures (data not shown), which opposed our previous in vivo observations. We hypothesized that Mig might suppress the bone marrow through other cell types, possibly MSCs. MSCs exist within the BM niches and are key components for constituting the microenvironment for HSC self-renewal and differentiation. When cotransplanted with HSCs, MSCs can significantly improve the marrow engraftment and support HPC expansion because of a full range of secreted cytokines.29,30 In a well-established culture system based on MSC conditioned medium (CM), we assessed the influence of Mig on MSC-induced HPC expansion.23 When Mig was directly added to the culture it had no effect, but when the MSCs were stimulated by Mig before harvest of the supernatants, we observed a significant inhibition of HPC expansion (Table 1, †P ⬍ .01 between Mig CM group and CM group). Application of the neutralizing anti-CXCR3 mAb IC6, which targets the amino-terminal 1 to 95 amino acids of CXCR3-A, reversed the inhibitory effect of Mig on CD45⫹ cells (Table 1, ‡P ⬍ .01 between anti–CXCR3-Mig CM group and Mig CM group), but only partially the inhibitory effect on CD34⫹ HPCs. Mig regulates hematopoiesis by reducing phospho-STAT5 in HPCs and activating phospho-p70S6K and -Erk1/2 in MSCs To demonstrate the intracellular actions aroused by Mig-CXCR3 binding, we searched for evidence of the phosphorylation of signaling proteins in cell lysates after stimulation with Mig. We were in fact successful in observing different profiling of phosphorylation in MSCs and in CD34⫹ HPCs: Mig stimulated the phospho-p70 S6K and -Erk significantly in MSCs (P ⫽ .006 and P ⫽ .014, respectively, compared with control MSCs), but it reduced the level of phospho-STAT5 in CD34 ⫹ HPCs (P ⫽ .022 compared with control HPCs). Because STAT5 is critical in the function of GM-CSF, leading to the differentiation of CD34⫹ cells into CD34⫹CD45⫹ HPCs and promoting Table 1. CD34ⴙ and CD45ⴙ cell expansion when cultured with MSC conditioned medium Condition Total numbers CD34ⴙ CD45ⴙ 5944 ⫾ 730*† 4504 ⫾ 715*† 3541 ⫾ 599*† CM 11 358 ⫾ 1406†‡ 8967 ⫾ 898†‡ 6689 ⫾ 1192†‡ CM ⫹ Mig 10 549 ⫾ 625†‡ 8402 ⫾ 516†‡ 6363 ⫾ 876†‡ Mig CM 7950 ⫾ 437*‡ 6491 ⫾ 503*‡ 4817 ⫾ 579*‡ Anti-CXCR3-Mig CM 8933 ⫾ 1390*‡ 7126 ⫾ 13 727*‡ 6057 ⫾ 1160†‡ Medium control CM indicates nonstimulated supernatant; CM ⫹ Mig, nonstimulated supernatant ⫹ Mig; Mig CM, supernatant of Mig-stimulated MSCs; and anti-CXCR3–Mig CM, supernatant of Mig ⫹ anti-CXCR3–stimulated MSCs. *Significant difference compared with CM. †Significant difference compared with Mig CM. ‡Significant difference compared with medium control. the expansion of CD45⫹ lineage cells,31 inhibition of phospho-STAT5 by Mig could theoretically reduce the effect of GM-CSF. After 1 week’s incubation with GM-CSF, we observed a high expansion of CD45⫹ cells (3.28 ⫾ 0.15 ⫻ 104 in GM-CSF alone vs 0.97 ⫾ 0.08 ⫻ 104 without GM-CSF control; P ⫽ 7.52 ⫻ 10⫺14), whereas the GM-CSF– dependent expansion was significantly inhibited by Mig (2.36 ⫾ 0.15 ⫻ 104 of GM-CSF ⫹ Mig vs GM-CSF alone; P ⫽ 3.42 ⫻ 10⫺6), which in turn was reversed by the anti-CXCR3 mAb IC6 (2.89 ⫾ 0.12 ⫻ 104 of GM-CSF ⫹ Mig ⫹ anti-CXCR3 vs GMCSF ⫹ Mig, P ⫽ 2.95 ⫻ 10⫺4; Figure 6C). Discussion Activation of Mig expression has been reported in several stressrelated, but nonhematopoietic situations, including infections, inflammatory diseases, malignancies, and graft-versus-host diseases (GVHDs).32-36 For the first time, using a transcriptome analysis, we were able to demonstrate that expression of murine Mig, and its receptor CXCR3, was transiently activated in the BM after chemotherapy, indicating their potential to regulate chemotherapy-induced myelosuppression. A previous study included the testing of more than 30 more or less randomly selected chemokines and identified 19 of a myelosuppressive quality.7 Among these chemokines, 9 were found to inhibit hematopoiesis by inducing cell cycle arrests of progenitor cells in vivo.19 The studies reported that injection of Mig could impair the capacity of HPCs to form colonies, thereby inducing myelosuppression in normal mice, which worsens, if used in combination with CCL2 or CCL20.19 The genetically engineered form of one of these chemokines, MIP-1␣, significantly alleviated neutropenia by protecting myeloid progenitors, when used before chemotherapy.8 In that study, 3 different chemotherapeutics were used in one in vivo model. The underlying mode of action, however, was not elucidated. In the present study, CFU-S assay revealed that incubation with Mig before Ara-C treatment in vitro protected lin⫺ HPCs and improved the survival and number of CFU-S in irradiated recipients after transplantation. According to our results, injection of Mig after chemotherapy decreased the number of BMNCs, reduced the colony-forming capacity of HPCs in vitro, and retained the G0/G1 phase in HPCs in vivo, which explains the Ara-C–protective effect of Mig in lin⫺ cells. Alternatively, in the murine myelodepression and myeloregeneration model, Mig reduced the number of BMNCs in the S phase, thereby aggravating bone marrow suppression.22 Mig plasma levels were increased immediately after 5-FU treatment that corresponded to the reduced survival rates when the mice had received additional Mig injections after 5-FU. This emphasizes the myelosuppressive role of Mig after chemotherapy. From www.bloodjournal.org by guest on November 7, 2014. For personal use only. BLOOD, 24 MAY 2012 䡠 VOLUME 119, NUMBER 21 Figure 6. Mig regulates hematopoiesis through different signaling pathways in MSCs and HPCs. (A) Mig activated p70 S6K and Erk in MSCs. (B) Mig inhibited STAT5 phosphorylation in CD34⫹ HPCs. Signaling pathways of MSCs and HPCs were examined after stimulation with 20 ng/mL Mig for 30 minutes. Shown are means ⫹ SEM of the mean fluorescent intensities (MFI; per 10 g of total protein) of 2 independent, duplicate experiments (*P ⬍ .05). (C) Freshly isolated CD34⫹ cells (8000) were incubated for 1 week. GM-CSF induced the expansion of CD45⫹ cells compared with medium alone (#P ⬍ .001). Mig significantly reduced the GM-CSF– dependent CD45⫹ expansion, and the effect was reversed by anti-CXCR3 monoclonal MIG PARTICIPATES IN MYELOSUPPRESSION 4875 To date, CXCR3 is the only known receptor for Mig. The other CXCR3 ligands, IP-10 and I-TAC, share with Mig the same angiostatic and chemotactic functions,37,38 but of the 3 ligands, only the expression of Mig was up-regulated in myelosuppressed BM, which indicates the exclusive role of Mig in myelosuppression. We anticipate that the myelosuppressiveness of Mig is conveyed through the common receptor CXCR3. In the absence of CXCR3, for example in the CXCR3 KO mice, Mig neither reduced the S phase percentage of BMNCs in vivo nor inhibited colony formation in vitro. Moreover, when treated with the same dosage of 5-FU, the bone marrows of CXCR3 KO mice regenerated faster than those of WT mice. We attribute this to the missing MigCXCR3 axis resulting in the lack of a Mig-dependent myelosuppression. When LSK cells were isolated for Ca2⫹ influx experiments, we observed that CXCR3 KO mice lacked the react ability to Mig stimulation (supplemental Figure 2). In in vitro experiments, Mig did not directly inhibit the expansion of human CD34⫹ cells, which we found contradictive to the results observed previously in mice. Therefore, we hypothesized that Mig-induced myelosuppression could depend on nonhematopoietic cells of the bone marrow. MSCs are major nonhematopoietic components of BM and constitute a fundamental part of the microenvironment within the hematopoietic niche, and they are also known to support hematopoietic reconstitution after transplantation.29,30 Interestingly, CXCR3 is highly expressed on MSCs in both mice and humans,27 indicating a possible functionality of Mig on both cell types. Here, supernatants from MSC cultures elevated HPC expansion, unless the MSCs had been stimulated with Mig before harvest. In that case, HPCs expanded significantly less compared with nonstimulated MSC conditioned medium. Our conclusion is that Mig-dependent BM suppression also is related to its influence on MSC. In fact, the phosphorylation of Erk and p70 S6K, which are mostly related to protein synthesis,39,40 were significantly activated in MSCs on Mig-stimulation. Erk also can activate STAT1, which is crucial in signal transductions from interferons and is critical for nitric oxide (NO) production and inducible NO synthase activation in MSCs.41,42 NO is a potent inhibitor of cell proliferation,43 which could explain the suppressed HPC expansion in our study. p70 S6K is well known as a negative regulator in the signaling and secretion of insulin.44 Insulin stimulates cell cycling and enhances the proliferation of hematopoietic cells.45 Conversely, the negative regulation of insulin might have the effect of inhibiting the proliferation of HPC. p70 S6K is also involved in the expression of mesenchymal transforming growth factor  (TGF),46 a potential inhibitor of primitive hematopoietic cells.47 Therefore, Mig might suppress the expansion of HPCs through enhancing TGF secretion by MSCs. In the signaling pathways of CD34⫹ cells, however, Mig acts in a different way. Instead of stimulating it, Mig reduces the phosphorylation of STAT5. STAT5 is required for the maintenance of HSCs and HPCs in humans and plays a crucial role in the signaling of G-CSF and GM-CSF, which initiate differentiation along the white lineage.48 Inhibition of STAT5 phosphorylation could impair both CD45 differentiation and the colony-forming capacity of HPCa, and the GM-CSF–dependent expansion of HPCs was indeed reduced by Mig. This provides explanation for our findings that colony formation in WT mice was reduced after treatment with Figure 6 (continued) antibody (**P ⬍ .001) compared with GM-CSF ⫹ Mig. Pictures of cell pellets after incubation were taken, and the dimensions were measured (total magnification, ⫻100; objective lens’ magnification, ⫻10). Bars represent means ⫹ SEM of 2 independent, quadruplicate experiments. From www.bloodjournal.org by guest on November 7, 2014. For personal use only. 4876 BLOOD, 24 MAY 2012 䡠 VOLUME 119, NUMBER 21 LU et al Mig. In CFU-S experiments, when the HSCs and HPCs were incubated with hematologic growth factors such as SCF and G-CSF, STAT5 usually increases, initiating the cycling of cells and increasing the susceptibility of HPCs to chemotherapy. Conversely, down-regulation of STAT5 induced by Mig could accordingly inhibit the cell cycle and protect HPCs as we had observed. In mice, there exists only one form of CXCR3, and Mig therefore had no myelosuppressive character in CXCR3 KO mice. There are however 2 known variants of human CXCR3 that have distinct functions: CXCR3-A promotes proliferation and chemotaxis and CXCR3-B inhibits proliferation.49 The N terminus of CXCR3-B mRNA has a longer extracellular domain than that of the classic CXCR3-A mRNA, and they both share a common sequence from the 79th nucleotide. That means that the IC6 mAb used here targeted the N-terminal 1 to 95 amino acids of CXCR3-A and might have only little affinity to CXCR3-B. That might explain why the IC6 anti-CXCR3 mAb only partially reversed the Mig-induced inhibition of the MSC-dependent expansion of CD34⫹ HPCs, which could imply that Mig’s function on MSCs is conveyed through CXCR3-B. That notwithstanding, because both were significantly reversed by the IC6 antibody; the inhibition of CD45⫹ cell differentiation and the protection of HPCs from chemotherapeutics were probably transmitted through CXCR3-A. Combining the observations in both HPCs and MSCs, we can get an idea of the functional role of Mig. When applied in advance Mig reduced the phosphorylation of STAT5 in HPCs, reducing downstream cell cycling and protecting them from chemotherapy. When applied after chemotherapy, Mig delayed the regeneration of HPCs and BMNCs and reduced the survival rates in mice. But, Mig activated the p70 S6K and Erk1/2 signaling pathways in MSCs; this can explain the inhibition of HPC expansion and the decrease of hematopoietic cell numbers, which further prevents myeloregeneration after chemotherapy. The profound expression of Mig after chemotherapy led us to suspect an inhibitory effect of Mig on BM regeneration. Unlike previous studies,8,19 we did not limit the analysis of the chemoprotective effect of Mig to one in vivo model. Instead, we investigated its influence on different target cells, including human cells, within the bone marrow niche, such as CD34⫹ HPCs, lin–HPCs, and MSCs. We also identified the corresponding signaling pathways to illustrate the underlying molecular mechanisms. In conclusion, the alleviation of chemotherapy-induced myelosuppression using an anti-Mig antibody is an absolutely novel idea. Furthermore, our microarray-based strategy to define negative and positive regulators in chemotherapy-induced bone marrow suppression may open a new arena for the development of bone marrow regeneromics. Acknowledgments This work was supported in part by the German Academic Exchange Service and the China Scholarship Council (grant A/09/90104), National Natural Science Foundation of China (grants30801419 and 30901873), the Science & Technology Commission of Shanghai Municipality (grant 09540700600), and the China Ministry of Science and Technology (grants 2007AA02Z149 and 2009ZX09103-743). Authorship Contribution: H.L., S.Z., L.Q., D.X., W.Z., A.N., Jin Gao, and M.W. performed the experiments, analyzed the results, and composed the figures; Jinming Gao, and B.L. raised the CXCR3 KO mice; and H.L., Y.Y., W.H., and A.M. designed the research and wrote the manuscript. Conflict-of-interest disclosure: The authors declare no competing financial interests. Correspondence: Wei Han, School of Pharmacy, Shanghai Jiao Tong University, 800 Dongchuan Road, Shanghai 200240, China; e-mail: [email protected]; or Yan Yu, School of Agriculture and Biotechnology, Shanghai Jiao Tong University, 800 Dongchuan Road, Shanghai 200240, China; e-mail: [email protected]. References 1. Moore MA. Review: Stratton Lecture 1990. Clinical implications of positive and negative hematopoietic stem cell regulators. Blood. 1991;78(1):1-19. 2. Han W, Yu Y, Liu XY. Local signals in stem cellbased bone marrow regeneration. Cell Res. 2006;16(2):189-195. 3. Tubiana M, Carde P, Frindel E. Ways of minimising hematopoietic damage induced by radiation and cytostatic drugs—the possible role of inhibitors. Radiother Oncol. 1993;29(1):1-17. 4. Mauch P, Constine L, Greenberger J, et al. Hematopoietic stem cell compartment: acute and late effects of radiation therapy and chemotherapy. Int J Radiat Oncol Biol Phys. 1995;31(5): 1319-1339. 5. Harrison DE, Lerner CP. Most primitive hematopoietic stem cells are stimulated to cycle rapidly after treatment with 5-fluorouracil. Blood. 1991; 78(5):1237-1240. 9. 10. 11. 12. 6. Kopp HG, Avecilla ST, Hooper AT, et al. Tie2 activation contributes to hemangiogenic regeneration after myelosuppression. Blood. 2005;106(2):505-513. 7. Broxmeyer HE, Kim CH, Cooper SH, Hangoc G, Hromas R, Pelus LM. Effects of CC, CXC, C, and CX3C chemokines on proliferation of myeloid progenitor cells, and insights into SDF-1-induced chemotaxis of progenitors. Ann N Y Acad Sci. 1999;872:142-162; discussion 163. 8. Gilmore GL, DePasquale DK, Shadduck RK. Pro- 13. 14. tective effects of BB-10010 treatment on chemotherapy-induced neutropenia in mice. Exp Hematol. 1999;27(2):195-202. Keller JR, Bartelmez SH, Sitnicka E, et al. Distinct and overlapping direct effects of macrophage inflammatory protein-1 alpha and transforming growth factor beta on hematopoietic progenitor/ stem cell growth. Blood. 1994;84(7):2175-2181. Clemons MJ, Marshall E, Durig J, et al. A randomized phase-II study of BB-10010 (macrophage inflammatory protein-1alpha) in patients with advanced breast cancer receiving 5-fluorouracil, adriamycin, and cyclophosphamide chemotherapy. Blood. 1998;92(5):1532-1540. Bacon K, Baggiolini M, Broxmeyer H, et al. Chemokine/chemokine receptor nomenclature. J Interferon Cytokine Res. 2002;22(10):10671068. Trotta T, Costantini S, Colonna G. Modelling of the membrane receptor CXCR3 and its complexes with CXCL9, CXCL10 and CXCL11 chemokines: putative target for new drug design. Mol Immunol. 2009;47(2-3):332-339. Colonna M. Toll-like receptors and IFN-alpha: partners in autoimmunity. J Clin Invest. 2006; 116(9):2319-2322. Fall N, Bove KE, Stringer K, et al. Association between lack of angiogenic response in muscle tissue and high expression of angiostatic ELRnegative CXC chemokines in patients with 15. 16. 17. 18. 19. 20. juvenile dermatomyositis: possible link to vasculopathy. Arthritis Rheum. 2005;52(10):3175-3180. Gong JH, Nicholls EF, Elliott MR, et al. G-protein-coupled receptor independent, immunomodulatory properties of chemokine CXCL9. Cell Immunol. 2010;261(2):105-113. Farber JM. HuMig: a new human member of the chemokine family of cytokines. Biochem Biophys Res Commun. 1993;192(1):223-230. Soto H, Wang W, Strieter RM, et al. The CC chemokine 6Ckine binds the CXC chemokine receptor CXCR3. Proc Natl Acad Sci U S A. 1998; 95(14):8205-8210. Lu B, Humbles A, Bota D, et al. Structure and function of the murine chemokine receptor CXCR3. Eur J Immunol. 1999;29(11):3804-3812. Broxmeyer HE, Pelus LM, Kim CH, Hangoc G, Cooper S, Hromas R. Synergistic inhibition in vivo of bone marrow myeloid progenitors by myelosuppressive chemokines and chemokineaccelerated recovery of progenitors after treatment of mice with Ara-C. Exp Hematol. 2006; 34(8):1069-1077. Park MK, Amichay D, Love P, et al. The CXC chemokine murine monokine induced by IFNgamma (CXC chemokine ligand 9) is made by APCs, targets lymphocytes including activated B cells, and supports antibody responses to a bacterial pathogen in vivo. J Immunol. 2002; 169(3):1433-1443. From www.bloodjournal.org by guest on November 7, 2014. For personal use only. BLOOD, 24 MAY 2012 䡠 VOLUME 119, NUMBER 21 21. Hancock WW, Lu B, Gao W, et al. Requirement of the chemokine receptor CXCR3 for acute allograft rejection. J Exp Med. 2000;192(10):15151520. 22. Lu H, Yu M, Sun Y, et al. Expression and purification of bioactive high-purity mouse monokine induced by IFN-gamma in Escherichia coli. Protein Expr Purif. 2007;55(1):132-138. 23. Moldenhauer A, Futschik M, Lu H, et al. Interleukin 32 promotes hematopoietic progenitor expansion and attenuates bone marrow cytotoxicity. Eur J Immunol. 2011;41(6):1774-1786. 24. Han W, Ye Q, Moore MA. A soluble form of human Delta-like-1 inhibits differentiation of hematopoietic progenitor cells. Blood. 2000;95(5):16161625. 25. Till JE, McCulloch EA. A direct measurement of the radiation sensitivity of normal mouse bone marrow cells. Radiat Res. 1961;14:213-222. MIG PARTICIPATES IN MYELOSUPPRESSION populations reveals highly distinct cytokine responses. PLoS One. 2009;4(11):e7989. 32. Liu MT, Armstrong D, Hamilton TA, Lane TE. Expression of Mig (monokine induced by interferongamma) is important in T lymphocyte recruitment and host defense following viral infection of the central nervous system. J Immunol. 2001;166(3): 1790-1795. 33. Yoong KF, Afford SC, Jones R, et al. Expression and function of CXC and CC chemokines in human malignant liver tumors: a role for human monokine induced by gamma-interferon in lymphocyte recruitment to hepatocellular carcinoma. Hepatology. 1999;30(1):100-111. 34. Sauty A, Dziejman M, Taha RA, et al. The T cellspecific CXC chemokines IP-10, Mig, and I-TAC are expressed by activated human bronchial epithelial cells. J Immunol. 1999;162(6):3549-3558. 26. Moldenhauer A, Genter G, Lun A, Bal G, Kiesewetter H, Salama A. Hematopoietic progenitor cells and interleukin-stimulated endothelium: expansion and differentiation of myeloid precursors. BMC Immunol. 2008;9:56. 35. Hardison JL, Wrightsman RA, Carpenter PM, Lane TE, Manning JE. The chemokines CXCL9 and CXCL10 promote a protective immune response but do not contribute to cardiac inflammation following infection with Trypanosoma cruzi. Infect Immun. 2006;74(1):125-134. 27. Chamberlain G, Wright K, Rot A, Ashton B, Middleton J. Murine mesenchymal stem cells exhibit a restricted repertoire of functional chemokine receptors: comparison with human. PLoS One. 2008;3(8):e2934. 36. Kobayashi H, Novick AC, Toma H, Fairchild RL. Chronic antagonism of Mig inhibits cellular infiltration and promotes survival of class II MHC disparate skin allografts. Transplantation. 2002;74(3): 387-395. 28. Halfon S, Abramov N, Grinblat B, Ginis I. Markers distinguishing mesenchymal stem cells from fibroblasts are downregulated with passaging. Stem Cells Dev. 2011;20(1):53-66. 37. Romagnani P, Annunziato F, Lasagni L, et al. Cell cycle-dependent expression of CXC chemokine receptor 3 by endothelial cells mediates angiostatic activity. J Clin Invest. 2001;107(1):53-63. 29. Le Blanc K, Rasmusson I, Sundberg B, et al. Treatment of severe acute graft-versus-host disease with third party haploidentical mesenchymal stem cells. Lancet. 2004;363(9419):1439-1441. 38. Proost P, Schutyser E, Menten P, et al. Aminoterminal truncation of CXCR3 agonists impairs receptor signaling and lymphocyte chemotaxis, while preserving antiangiogenic properties. Blood. 2001;98(13):3554-3561. 30. Li T, Wu Y. Paracrine molecules of mesenchymal stem cells for hematopoietic stem cell niche. Bone Marrow Res. 2011;2011:353878. 31. Han L, Wierenga AT, Rozenveld-Geugien M, van de Lande K, Vellenga E, Schuringa JJ. Single-cell STAT5 signal transduction profiling in normal and leukemic stem and progenitor cell 39. Shin S, Wolgamott L, Yu Y, Blenis J, Yoon SO. Glycogen synthase kinase (GSK)-3 promotes p70 ribosomal protein S6 kinase (p70S6K) activity and cell proliferation. Proc Natl Acad Sci U S A. 2011;108(47):E1204-E1213. 40. Briaud I, Lingohr MK, Dickson LM, Wrede CE, 41. 42. 43. 44. 45. 46. 47. 48. 49. 4877 Rhodes CJ. Differential activation mechanisms of Erk-1/2 and p70(S6K) by glucose in pancreatic beta-cells. Diabetes. 2003;52(4):974-983. Samardzic T, Jankovic V, Stosic-Grujicic S, Trajkovic V. STAT1 is required for iNOS activation, but not IL-6 production in murine fibroblasts. Cytokine. 2001;13(3):179-182. Rosenzweig SD, Holland SM. Defects in the interferon-gamma and interleukin-12 pathways. Immunol Rev. 2005;203:38-47. Kosonen O, Kankaanranta H, Lahde M, Vuorinen P, Ylitalo P, Moilanen E. Nitric oxidereleasing oxatriazole derivatives inhibit human lymphocyte proliferation by a cyclic GMP-independent mechanism. J Pharmacol Exp Ther. 1998;286(1):215-220. Rhodes CJ, White MF. Molecular insights into insulin action and secretion. Eur J Clin Investig. 2002;32(Suppl 3):3-13. Saeki K, Yasugi E, Okuma E, et al. Proteomic analysis on insulin signaling in human hematopoietic cells: identification of CLIC1 and SRp20 as novel downstream effectors of insulin. Am J Physiol Endocrinol Metab. 2005;289(3):E419E428. Ryu JM, Lee MY, Yun SP, Han HJ. High glucose regulates cyclin D1/E of human mesenchymal stem cells through TGF-beta1 expression via Ca2⫹/PKC/MAPKs and PI3K/Akt/mTOR signal pathways. J Cell Physiol. 2010;224(1):59-70. Cheng T, Shen H, Rodrigues N, Stier S, Scadden DT. Transforming growth factor beta 1 mediates cell-cycle arrest of primitive hematopoietic cells independent of p21(Cip1/Waf1) or p27(Kip1). Blood. 2001;98(13):3643-3649. Schepers H, van Gosliga D, Wierenga AT, Eggen BJ, Schuringa JJ, Vellenga E. STAT5 is required for long-term maintenance of normal and leukemic human stem/progenitor cells. Blood. 2007;110(8):2880-2888. Furuya M, Yoneyama T, Miyagi E, et al. Differential expression patterns of CXCR3 variants and corresponding CXC chemokines in clear cell ovarian cancers and endometriosis. Gynecol Oncol. 2011;122(3):648-655.


© Copyright 2026