
Full Cost, Profit and Competition Munich Personal RePEc Archive Paul Jael
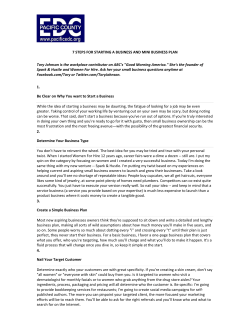
M PRA
Munich Personal RePEc Archive
Full Cost, Profit and Competition
Paul Jael
31. October 2014
Online at http://mpra.ub.uni-muenchen.de/59630/
MPRA Paper No. 59630, posted 3. November 2014 03:51 UTC
Full cost, profit and competition
1
Full Cost, Profit and
Competition
Paul Jael
October 2014
Abstract
During the marginalist controversy, full costers failed to convince economists of the
superiority of full cost pricing over marginal theory of imperfect competition. The
controversy was closed prematurely; various contributions published immediately
thereafter in the fifties did not renew the debate despite their relevance. Topics
included entry prevention, target rate of profit and the emergence of the market price
The present paper shows that the full cost pricing is not so justified by the need for a
rule of thumb than as a rational behaviour aiming at long term profit maximisation,
especially in the case of highly competitive markets with few suppliers. The paper
focuses also on the relationship between full cost pricing and changes in demand
(mostly cyclical). It is also shown that the race for performance deserves a central
position in the analysis of competition; it is too often neglected in favour of the sole
competition on margins.
JEL classification: D21, D40, D49
Keywords: pricing, competition, market structure, full cost
Full cost, profit and competition
2
1- The marginalist controversy
The marginalist theory of producer’s equilibrium is the result of a development that
culminates in the impressive work of Joan Robinson "Theory of imperfect
competition", published in 1933. It claims that in perfect competition as in monopoly
or in oligopoly, the firm will choose to produce the quantity that equates marginal
revenue1 with marginal cost, because that is the way to profit maximisation.
Less than ten years later, this theory will be openly challenged by the economists of
the Oxford Economists Research Group (OERG), who confront it with the practice of
entrepreneurs consulted during interviews. The main contributions are:
- The article by Hall and Hitch, "Price Theory and Business Behaviour", published
in 1939, which is the starting point of controversy.
- Andrews's book, "Manufacturing Business" published in 1949.
- Harrod’s essay "The Theory of Imperfect Competition Revisited", published in
1952 but prefigured by an article dating from 1939.
Revelation is that the perception of entrepreneurs absolutely does not match the
marginalist analysis. Without going into the details of the argument, or in peripheral
ideas and disregarding nuances among stakeholders, we can summarise the essence of
criticism by these leading ideas:
-
-
-
-
Entrepreneurs ignore the elasticity of their demand, do not know their marginal
revenue and marginal cost curves and are not concerned about equalising these
two variables.
Instead of that, they apply a rule of thumb. Price is based on the "full cost". There
are two variants: following Hall and Hitch, it results from the addition of three
terms: direct cost, indirect cost and profit margin. According to Andrews, who
calls it "normal cost", it results of multiplying the direct cost by a factor, which
implicitly determines a margin to cover overhead and profit.
Full cost pricing (FCP) results in some price stability; entrepreneurs are reluctant
to change the price as often as maximising short-term profit would require.
Companies are not trying to maximise profit in the short term but in the long term;
so they avoid such pricing that would generate a rate of profit high enough to
attract new firms in their market, which would result in a future decline of their
individual demand.
The price being set at full cost, producers will try to sell a production as wide as
what the market can absorb, an amount in excess of that which normally equates
marginal cost with marginal revenue. The equalisation of these two variables is
therefore disqualified.
In his essay, Harrod mentions three reasons for firms to prefer full cost pricing to the
marginalist rule:
-
1
Not tempting candidates for entering the market.
Avoid overinvestment2 : why bother investing in a capacity when the optimisation
rule commands to use it only partially? Harrod strongly fights what he calls "The
doctrine of excess capacity."
In perfect competition, marginal revenue equals price.
In imperfect competition, the tangency between the decreasing demand and the average cost happens normally
at the left of minimum average cost.
2
Full cost, profit and competition
-
3
Take out insurance against uncertainty: selling the maximum means occupying the
market. Is there a better advertising for a firm than seeing its products widespread
in society 1 ? The enterprise is consolidating its chances of future survival.
Proponents of marginalism reply. Thereof follows a debate known as the "marginalist
controversy" or the "full cost of controversy." The main contributions to the defence of
marginalism are:
-
Machlup’s article, "Marginal Analysis and Empirical Research", published in
1946.
The review of Andrews’ book by Austin Robinson in 1949.
The lecture of Heflebower at the "Business Concentration and Price Policy"
conference in 1952.
Argumentation follows three main axes:
1. Discrediting the work of rebel economists; these would have a caricatural or
oversimplified understanding of the marginalist theory, they accept uncritically the
responses from entrepreneurs. According to Machlup, entrepreneurs apply
unconsciously marginalist precepts. The fact that the language of entrepreneurs
does not match the economists’ one proves nothing; it is normal that economists
reason at a higher level of abstraction.
2. Arguing about specific points. So, A. Robinson noted two inconsistencies in the
book of Andrews:
-
Andrews regularly invokes competition, more intense than is generally
admitted- he said-, but he denies the profit maximisation which drives it.
The full cost is presented as an alternative to the influence of demand on
price, but the vagueness concerning the determination of the profit margin
calls it implicitly in the game again.
3. Considering the full cost as soluble in the theory of imperfect competition.
Providing some precautions, the profit margin it includes is then assimilated to the
difference between price and marginal cost, difference which standard theory of
imperfect competition derives from the demand elasticity.
Experts generally consider the Heflebower response as bringing the controversy to its
end. It asserts the third line of defence with force and it seems to have convinced the
vast majority of neoclassical economists, who turned the page over. We can therefore
speak of a victory of marginalism. More recent commentators write in these terms 2 :
“By and large, FCP was “marginalized” in both senses of the word” (Mongin, 1992).
“The controversy over the normal-cost prices doctrine came to an end with its
absorption into the theory of imperfect competition” (Lee, 1992).
In my view, the marginalist victory was due, not to the weakness of the ideas
expressed by the full costers, but to shortcomings in their presentation. As often
happens during a contest, the ideas have poured first and their ordering did not follow,
giving an impression of immaturity. Some ideas have also created a "wrong track"
effect; this is the case for the "kinked demand" and for the questioning of profit
maximisation. Moreover, the term "oligopoly" comes incessantly in the debate, but as
1
Edwards sums it up by the aphorism "Goodwill snowballs" (1955)
Acknowledgement of this victory does not necessarily mean that these authors consider it as theoretically
justified.
2
Full cost, profit and competition
4
I will show later, this term is ambiguous and that ambiguity is at the heart of the
present issue.
Finally, supreme gap, the explanation of the profit margin is barely sketched, which is
unforgivable in the eyes of a profession accustomed to formulas and mathematical
proofs. This gap opens up an avenue for those who want to assimilate the mark up of
full cost with the one of imperfect competition given by the formula of Joan Robinson:
=
ε
(ε−1)
(1)
where p is the equilibrium price, ̅ is the marginal cost and ε is the elasticity of
demand.
The page has probably been turned over too quickly and maybe not innocently. When
the spotlights on the controversy went off, the closely following years saw the theory
of full cost get enriched seriously. The main contributors are Edwards, Bain,
Lanzillotti and mostly Sylos-Labini.
Since the sixties, few new arguments have been added to the theory. Instead, the
studies adopt the point of view of the historian who tries to understand this episode of
economics. Also should be mentioned numerous empirical studies that generally
confirm the empirical findings of the OERG1, namely the wide use of full cost. Let us
also mention two contributions of Baumol not adopting the thesis of full cost but
attacking the orthodox theory on parallel trails:
-
The proposition that oligopolistic firms maximise, not their profit but their sales
subject to a minimum profit constraint.
The theory of contestable markets telling that when entry and exit of firms in a
market are perfectly free and costless, the market assumes the properties of perfect
competition, even if it is oligopolistic.
2- The theory of full cost improves
As noted above, the mid to late fifties see various contributions complete the full cost
theory and fill some gaps of its first generation. Improvement takes three directions:
1. Models of entry prevention.
2. The target return on investment.
3. The switch from the full cost of the individual firm to the market price.
Discreetly, the concepts of full cost have been refined and it is now possible to build
an alternative to marginalism which is perfectly credible. To be sure, there is still some
way to go. Various clarifications are still desirable. The opinions of full costers are not
always consistent, which, at this stage, is fortunate, because unanimity may cause
sterility.
1
The reader will find more precisions in Nubbemeyer (2010) and Lucas (2003).
Full cost, profit and competition
5
2.1- ENTRY PREVENTION
Of the three themes, this is the one which has raised the most abundant literature.
Following Harrod who initiated the topic, the price must be set so that no profit is
generated; otherwise the profit would be wiped out by the arrival of new competitors.
The price so established thus equals the cost of production because it cannot include
profit. This view is not unanimous. “Much of Andrews’s writings suggests, however,
that some premium in the form of a profit margin in excess of normal profits (…) can
be secured where entry is not easy” (Bhagwati, 1970, p. 302). This idea will be
developed by Bain and Sylos-Labini in several books and articles and by Modigliani
(1958) who will formalise their approach. Bhagwati (1970) provides an excellent
overview of this debate.
The central concept in this context is what Modigliani called "entry preventing price"
and Bain "limit price": this is the highest price that the incumbents think they may ask
without causing the arrival of competitors.
Modigliani’s model defends ardently the existence of the said premium and analyses
mathematically the factors that influence it. It is based on two pillars:
1. As oligopoly suppliers are not negligible elements on their market, the arrival of a
new firm will reduce the market price; it is this reduced price which must allow the
newcomer to achieve profitability, a condition that he should normally have
expected. Understanding this game therefore gives incumbents a safety margin.
2. The basic assumption of Modigliani’s model is what he calls the "Sylos postulate."
Sylos-Labini, analysing the entry of new firms, considers that incumbents do not
change their production and comply with the price reductions resulting from the
enlargement of supply1.
Modigliani comes to the following formula which gives an approximation (i.e. the
maximum) of the entry preventing price (P0):
P0 ≈ Pc (1+
)
(2)
P0 is:
- higher when the average cost curve is steeper;
- lower when the market size (S) is larger 2;
- lower when the elasticity of demand (ε) is higher around the competitive price (Pc),
which corresponds to the minimum average cost.
Bhagwati reckons that the premium as shown in the SBM model (Sylos-BainModigliani) is overestimated. On the one hand, the existence of this premium makes
entry more attractive and thus stimulates attempts, which has the effect of reducing the
premium. The risk of failure will be more readily accepted if the potential benefit is
greater. On the other hand, this model assumes too confidently that existing firms will
survive first. The investors often see initial losses as inherent in the investment. As
entrants are often multiproduct firms active on adjacent markets, they usually have
1
He explains this behaviour by the will to dissuade entrants and the fear of a rise in unit cost due to the falling of
production.
2
S is the ratio of the quantity taken by the whole market at price Pc on the output minimizing the average cost of
the firm.
Full cost, profit and competition
6
reserves which allow bearing these losses. Bhagwati also mentions the case where
market demand is growing as being favourable to the premium reduction.
Sylos-Labini and Modigliani find it natural to assign the new comers almost no part of
the existing demand. Edwards ventures the following rationalisation: goodwill ties
customers to their usual supplier, especially in the area of capital goods. However, he
admits that if the incoming lets those customers discover they were "exploited" before
his arrival, he would easily take up most part of the demand.
Edwards notes that in addition to profit, inefficiency among incumbents is also an
incentive to entry. If the entrant is more efficient, its success is assured.
2.2- TARGET RATE OF PROFIT
In 1958, Lanzillotti revives the investigative technique of interviewing entrepreneurs
about their practice. The purpose of the article "Pricing Objectives in Large
Companies" is to remedy the "inadequate state of knowledge of the price-making
process" (1958, p. 921). Twenty companies were surveyed among the 200 largest
American industrial companies, who faced a variety of competitive environments. The
questions were designed to identify the objective that guides pricing but also to
understand procedures.
The most frequently cited goals are:
1. Pricing to achieve a target return on investment.
2. Stabilisation of price and margin.
3. Pricing to realise a target market share.
4. Pricing to meet or prevent competition.
Target rate of profit comes first. A common strategy is to tolerate fluctuations in profit
rate from year to year, at the condition that the goal should be achieved over a longer
period. Price calculation is based on a standard activity level, to prevent that
fluctuations in the real rate of activity unduly affect the price.
Lanzillotti assimilates the second goal to "cost-plus" methods which include the full
cost pricing. He believes that the distinction between the first two goals is difficult to
define and concludes: “Cost-plus, therefore, may be viewed as one step on a road to
return-on-investment as a guide” (1958, p932).
Lanzillotti also believes that "target-return pricing implies a policy of stable or rigid
pricing, even though exceptions are found within particular product lines” (1958, p
940).
Sylos-Labini, on his side, has presented the formula for determining the profit margin
and price. He gave several versions and kept improving it after the publication of his
famous book "Oligopoly and Technical Progress." Such as it appears in the article
« La théorie des prix en régime d’oligopole et la théorie du développement » published
in 1971, it clearly fits the target rate of profit:
Full cost, profit and competition
=
+
k
+r 7
(3)1
p is the price, v is the variable unit cost, k is the total fixed cost, xn is the annual
production, r is the target profit rate and K is the capital. As Lanzillotti, Sylos believes
that « les grandes entreprises qui jouent le rôle de ‘price leaders’, ont l’intention de
réaliser un taux de profit non dans chaque année isolée mais sur une série d’un certain
nombre d’années2 » (1971, p 250).
According to Sylos, the target rate of profit is somehow « le taux permis par les
barrières de protection dont jouit l’entreprise. Et puisque celles-ci sont différentes
entre les divers marchés et même à l’intérieur de chaque marché, les taux de profit pris
comme objectif seront différents3 » (1971, p. 256).
2.3- THE MARKET PRICE
Each company calculates its own full cost to determine the price it will quote. But if
buyers are rational, there can be only one market price. How will this be established?
Traditionally, full costers use the concept of "price leadership" to solve this problem.
Andrews, followed by Sylos-Labini, sets the paradigm as follows: the firm with the
highest output size has a lower production cost, which makes it the price leader,
because inevitably it will attempt to impose a price based on that cost.
In an article titled "Price Competitive Leadership: a Critique of Price Leadership
Models" published in 1957, Lanzillotti shows the shortcomings of traditional models
of price leadership and attempts to promote a new conception.
In these models, roles are codified and the price leader is clearly identified: he rings
the bell and the followers automatically apply the rises and falls in prices which he
decides. Lanzillotti criticises these models for their static nature. Dynamic forces at the
source of these behaviours are ignored. “Moreover, the models appear to be based
largely on highly institutionalised structures wherein interfirm price relationships are
essentially settled, under which circumstances price leadership emerges as a type of
collusion with the ringleader clearly identifiable” (1957 p55). According to Lanzillotti,
markets in the real economy are rather characterised by instability; weakness of
traditional models to account for the working of these markets is obvious. They are
relevant only for a very particular type of case.
Lanzillotti proposes a new model he calls "Competitive Price Leadership" (CPL),
because “the prices set are those which materialise from the operation of competitive
1
In fact, Sylos is more interested in the dynamics of price fluctuations than in the statics of price formation. To
him, equation (3) aims at allowing an oligopoly industry to go through cost variations without falling in a price
war. According to Sylos, demand fluctuations produce output adaptation and cost fluctuations generate price
adaptation. This last one tends to be softened; on the long run, the target return will nonetheless obtain because
the factors of production prices are thought to fluctuate cyclically.
2
The large firms which act as price leaders intend to get a profit rate, not in each isolated year but on a series of
a certain number of years.
3
the rate allowed by the barriers protecting the enterprise. And as these vary from market to market and even
inside each market, the profit rates aimed at will be different.
Full cost, profit and competition
8
forces” (1957, p 55). This contrasts with the collusive behaviour in previous models.
He enumerates the characteristics of these markets. We miss the place to list them
here, but I can sum them up in a few words: a real competition, but with a limited
number of firms.
"Competitive Price Leadership" is the title of the paper written by Ante Farm (2014)
where he ventures on the path traced by Lanzillotti. He analyses the process of price
formation in the market that he so summarises: “In this model, the market price goes
down if and only if a price cut appears profitable for a firm even if its competitors
follow suit, while the market price goes up if and only if a higher market price is
profitable for every firm. Thus, the market price is determined by the lowest market
price preferred by a firm…” (2014, p.1).
The "collusive price leader" attempts to maximise the benefit of the industry, the
"competitive price leader" is guided by maximising its own profit. The competitive
price leader is simply defined as the firm which prefers the lowest price. “If there are
many such firms, the choice of a price leader among these is immaterial and may be
expected to vary randomly or depend on which firm is assumed to have the best
information on market conditions” (2014, p10).
In Farm’s model, businesses watch the prices of their competitors to imitate or to
counter them. Such a practice would be blameworthy in the case of tenders, but it is
perfectly legitimate when prices are set without negotiation by the seller, as is the case
of consumer goods, to which Farm limits its analysis.
My opinion is that what Lanzillotti and Farm describe is simply competition as it
works, not in economic literature but in the real world. The attribution of the label
"price leadership" seems to me unnecessary and even confusing. Cases certainly exist
where suppliers are split between a leader who has the initiative and followers, but the
economic literature seems to see price leadership wherever there is oligopoly.
Notwithstanding this observation, the Lanzillotti-Farm model is a remarkable
achievement.
Farm’s rule was applied implicitly by Sylos-Labini some decades sooner (1962, pp 4150). I say "implicitly" because Sylos’ model works with specific hypotheses: there
operates on the market, three groups of businesses- small, medium and large- with unit
costs decreasing in that order. The question is to determine towards which price and
which distribution of firms among the three groups we are moving, given the total
demand of the initial situation and the different cost structures. Of course, the big
companies have the privilege to set the price and thus to determine, according to their
benefit, which categories of firms will survive at their side. The issue of competitors
elimination combines with entry prevention. Sylos’ conclusion reads as follows: “the
price tends to settle at a level immediately above the entry preventing price of the least
efficient firms which it is to the advantage of the largest and most efficient firms to let
live” (1962, 50).
Full cost, profit and competition
9
3- Full Cost, competition and oligopoly
To which market structure is full cost pricing dedicated at? Economists do not seem
unanimous. Before answering this question, I will take a step back and identify the
market structures, because the theory on the subject seems to me incomplete.
3.1- CRITERIA
The first task is to highlight the criteria underlying market structures. I distinguish five
of them. To facilitate the presentation, the following tables affect a formal notation to
each criterion and to their possible values .
Number of suppliers (Ns)
1
n
∞
1 supplier
> 1 but not sufficient to prevent individual influence on the price
sufficient to prevent individual influence on the price
Market access (A)
F
B
Free and absence of handicap for entrants
Existence of economic or intentional barriers
Collusion (C)
C1
C2
Culture of the competition
Cartel or implicit agreement
Number of demanders (Nd)
1
n
∞
1 demander
> 1 but not sufficient to prevent individual influence on the price
sufficient to prevent individual influence on the price
Differentiation of products (D)
D1
D2
homogeneity
heterogeneity
Usually, applications of criterion A and of criterion C are converging. The existence of
a cartel is often accompanied by entry barriers. But there are exceptions in both
directions: a cartel may be unable to filter the entries despite his attempts. More often,
the absence of collusion does not preclude the existence of barriers of economic
nature, such as the need to master complex technologies or the level of investment
necessary to enter the market.
Full cost, profit and competition
10
3.2- TYPOLOGY OF MARKETS
Combining these criteria, we can establish a typology. The full combination of all
these criterion values results in 72 kinds of markets. In reality, they are less numerous
because some associations are inconsistent.
In fact, market structures subject to the attention of economists are not numerous. The
table below shows the main ones:
Table 1
Market type
Ns
A
Perfect competition
Monopoly
Imperfect competition
Monopolistic competition
Oligopoly
∞
1
>1
>1
n
F
B
I
F
I
C
Nd
C1
∞
I
>1
>1
>1
n.a.
I
C1
I
D
D1
n.a.
I
D2
I
I = indifferent
n.a. = not applicable
When a market structure is indifferent (I) regarding one or more criteria, it may be
considered as a gathering of some subordinate forms. For example, imperfect
competition includes monopolistic competition and oligopoly.
Table 1 lists the typology I would call "mainstream." A hierarchy of criteria is
implicitly underlying any typology. Mainstream hierarchy of criteria gives the prime
role to Ns and particularly the distinction between Ns = n and Ns = ∞. Since
Chamberlin, criterion D has gained some recognition, but at a lower level. Criteria A
and C are considered secondary.
I would view favourably a reversal of the mainstream hierarchy (except for the
distinction between Ns = 1 and Ns > 1, which remains essential). It is tailored to
highlight perfect competition. This market structure captures a major part of the
attention of economists. Of course, they admit that the criteria combination in the first
row of Table 1 is uncommon in the real world. But as its name suggests, perfect
competition is erected in a theoretical perfection which the competitive sector of the
economy is supposed to approach. As such, it is a sublimated representation; otherwise
the effort of analysis that is devoted to it would be disproportionate.
However, situations are known where thousands of bakers apply prices recommended
by their professional association and sell their bread at a higher price than
supermarkets, which are fewer but engaged in fierce competition. The criterion Ns
seems overvalued.
Is perfect competition really a simplified and sublimated representation of a vast
reality? Some of its properties make it doubtful. For example, the long-term
equilibrium of the producer makes him work at his optimum size; in consequence, an
increase in market demand can only be met by a change in the number of firms. Is this,
even if simplified, a representation of real economy?
Full cost, profit and competition
11
In my opinion, perfect competition is representative of a very specific markets type:
organised markets, such as those of some raw materials. Other situations deviate.
Ideally, the term "perfect competition" should even be replaced by that of "organised
markets". In fact, what is "perfect" in this market structure is not the competitive
combativeness of protagonists but its adaptation to the needs of economic modelling.
3.3- A HOLE IN THE CLASSIFICATION?
Organised markets and monopoly are defined by relatively clear boundaries and are
relatively consistent sets. Between these two extremes lies imperfect competition,
especially oligopoly if product differentiation is disregarded. Is his intermediate
structure also a coherent whole? Table 1 above considered criteria A and C as
irrelevant in the definition of oligopoly. Does it not offend common sense that so
important factors as freedom of access or the practice of collusion are not
discriminating?
Let’s take the oligopoly row in Table 1; if we assign the value F to Criterion A and the
value C1 to criterion C, a subset is defined which admittedly is radically competitive.
In contrast, the remaining part of the oligopoly set is only weakly competitive. The
border between the competitive camp and the non-competitive camp crosses
oligopoly. Accordingly, logic commands to divide this block. Such a split must
resonate up to the terminology. The bringing to light of a competitive oligopoly is all
the more necessary when we limit the sphere of perfect competition to organised
markets.
In the already mentioned essay, Harrod regrets that the horizontality of individual
demand curve is established as the supreme criterion to determine the types of markets
and that, therefore, all markets with a downward curve are classified together in the
non-competing sphere. About terminology, he writes: “We lack a vocabulary that is
both well established and appropriate” (1952, p.171). Above, I put facing each other
the competition camp and the non-competition camp. The first one includes perfect
competition and a part of oligopoly; the second one includes monopoly and the other
part of oligopoly. Speaking of the first of these two camps, Harrod proposes the
following terminology:
“Free competition” is an expression often used in popular literature, and it
might be convenient to adapt this for technical purposes. It would be natural to
use it for all cases where there is unrestricted (or relatively unrestricted) entry,
and these would be divided into those of free competition with a perfect market
and those of free competition with an imperfect market (downward-sloping
short-period particular demand curve (1952, p.179).
"Free competition with imperfect market" is his proposal to designate the firmly
competitive subset of oligopoly. Of the four basic market structures to be considered
after breaking the oligopoly block, this one – I think- is the most widespread in real
economy. Competition is the norm in our economic system and organised markets are
in minority. This structure deserves thus better than such a convoluted name while
others have simple and direct labels. In the rest of this article, I call it "oligopolistic
competition".
Full cost, profit and competition
12
As a corollary, we have also defined another structure: the non-competitive oligopoly,
which I will call "monopolistic oligopoly."
Oligopolistic competition is defined as follows:
Table 2
Criterion Value
Ns
n
A
F
C
C1
Nd
>1
D
I
In the economic reality, collusion and barriers to entry are often a matter of degree.
Many markets lie probably very close to the boundary between monopolistic oligopoly
and oligopolistic competition. Yet important parts of the real economy are currently
closer to oligopolistic competition, due to some recent developments:
-
World globalisation of trade has brought down many national monopolies.
The high turnover of managers and executives (sometimes even between
competitors) leads them to accept more easily the risks of competition.
Antitrust legislation becomes stronger; consumer unions are watchful, and so are
the media. Collusion has bad reputation.
Temptation of collusion certainly still exists. Here comes criterion Ns. His influence is
indirect, because a system of collusion is more difficult to build when suppliers are
numerous.
3.4- WHICH IS THE PREDILECTION AREA OF FULL COST PRICING?
Probably neither organised markets nor monopoly. The remaining candidates are
monopolistic oligopoly (MO) and oligopolistic competition (OC). As economists
generally do not distinguish between these two structures, it is difficult to find the
answer to our question in the economic literature. Here are response elements found
among some economists:
Hall & Hitch
Andrews
Harrod
MO+OC “Most businesses take into account in their pricing
the probable reaction of competitors and potential
competitors to their prices. Where this element of
oligopoly is present and in many cases where it is
absent, there is a strong tendency among
businesses to fix prices at a level which they
regard as their full cost” (1939, p. 33).
OC
He insists strongly on competition and repeats that
it is usually more widespread and fiercer than
supposed by the economists.
OC
Entry prevention is the ground of his
argumentation and it is more representative of OC
than of MO.
Full cost, profit and competition
13
Sylos-Labini
MO
Lanzillotti
OC
He devotes the whole introductory chapter
of “Oligopoly and Technical Progress” to
industrial concentration, responsible for a
weakening of price competition.
The description he gives of competitive price
leadership is very close to our definition of OC
(1957, pp55-56).
The rationality of full cost pricing in the case of oligopolistic competition was proved
by full costers and the following sections of the present paper will argue further in this
direction. I therefore consider it is its favourite field. The case of monopolistic
oligopoly, meanwhile, can be understood in two ways:
1. Either, we consider that full cost pricing is not characteristic of it and that the
behaviour of suppliers is correctly described by the theory of imperfect
competition,
2. or we adopt Sylos’ view, that the presence of barriers to entry affects the full cost
only in such a way that the target rate of profit exceeds the normal rate.
Let us go back to the rationality of full cost pricing in oligopolistic competition. To
give up short-term profit, the entrepreneur must obviously find a compensating
benefit. This advantage is triple:
1. Securing its market: avoiding the risk of shrinkage due to new entrants. In
Harrod’s words, firms make themselves vulnerable by asking a price higher than
full cost.
2. Reducing uncertainty. Harrod speaks of an "insurance against future uncertainties".
He explains: “…present sales improve future prospects and have their own
importance on this account” (1952, p.174). We also find this argument in Andrews
(1949, p.92). Let us illustrate this with an example: if during my travels, I see
many Volkswagen, I'll think about this brand when I shall have to buy a car.
Occupation of the market is an efficient and free advertising.
3. Avoiding waste of overcapacity. The arrival of new firms attracted by profit
reduces the particular demand of the firm; hence the equilibrium output falls below
capacity level. Harrod shows that full cost pricing avoids this waste.
The question must be asked if the fear of outlet shrinking refers only to a danger
coming from potential entrants or if a scenario à la Bertrand, a price war between
incumbents, induces the same behaviour. The argument mentioned above, which
explains the sacrifice of profit as a response to uncertainty, keeps its relevance when
incumbents act behind a closed door. Occupying the market remains an advantage.
Not to maximise production reinforces the risk of being left behind by competitors.
The outdistanced firm, lacking recognition and economies of scale, can be eliminated
from the market. In balanced duopoly, it is unlikely that a firm can increase production
quickly enough to satisfy all the customers of its rival and grab them. However, with,
say, ten firms, it only takes each to increase moderately its production to have one of
them, less dynamic, become superfluous. Internal competition is added to the external
threat to persuade enterprises to exploit their full demand. There is a further reason:
companies are not necessarily satisfied with their market share. Economic theory
considers them as mere numbers devoid of past (and age) and of own objectives.
Full cost, profit and competition
14
However, their market shares result of their history and provide contrasted
gratifications. Dissatisfaction of some suffices firms is all it takes to prevent market
supply following a quiet path.
4- Framework, definitions, assumptions
In the fifth and sixth sections, I will present my version of the full cost pricing in
oligopolistic competition. Beforehand, it is necessary to clarify the definition of
certain concepts and to expose the assumptions I rely on.
4.1- FORMS OF COMPETITION
What is the object or what are the objects of competition? According to Chamberlin,
firms handle three parameters to get a place on the market:
-
price,
product quality,
marketing spending.
It has become common to oppose "price competition" and "nonprice competition", the
latter including the last two categories of Chamberlin.
When firms compete on price, the adjustment variable can be either cost or profit
margin. In the real economy, costs cutting is omnipresent. Yet most models of price
competition give prominence to profit margin adjustment. Among the first ones to be
open to other forms of competition, Chamberlin is however unable to distinguish
between these two types of adjustments and to grant costs competition its rightful
place.
I would classify the forms of competition according to their object as follows:
object
profit margin
cost
quality
image
M
C
Q
I
price effect
price direct
price indirect
non price
non price
PD
PI
NP
NP
nature
strategy
performance
performance
performance
St
Pe
Pe
Pe
In fact, there is an important difference between M competition and all others.
Competitions C, Q and I consist in a race to performance. Firms try to be more
productive than competitors, to offer better products or to create brand preference. By
contrast, we cannot say that enterprises pursue the objective of better pricing. M
competition planes prices and profit margins to a level to be explained by economic
models. It has a standardising effect. On the contrary, C, Q, I competitions offer
businesses the opportunity to shine. In my opinion, the essential distinction is the one
which opposes St vs Pe competitions. The hegemony of M competition in the
economic literature is paradoxical regarding the importance of various forms of Pe
competition in the real economy.
Full cost, profit and competition
15
4.2- COST CURVES
Microeconomic theory attributes to average and marginal cost curves the famous Ushape. Regarding the long run cost, Wicksell initiated the notion that the growing firm
meets economies of scale at smaller sizes than diseconomies (1934, p.129). The "U"
provides the advantage of easy tangency with a straight line.
Marginalist theory assigns the same U-shape to short-term cost curves. It is generally
admitted that this form originates from the productivity of the variable factor that is
first increasing and then decreasing. Another perspective is the one of Viner who
draws the average variable cost curve entirely increasing; it is then the addition of this
growing curve with the hyperbole of the average fixed cost that produces the U-shape.
However, the reign of the U curve is not undisputed. The first criticisms happened
during the marginalism debate, but other criticisms followed. Here are some
examples:
Andrews criticises the thesis of the increasing ineffectiveness of management. He
sees the unit cost constant or slightly decreasing.
Harrod: “ it is quite possible that, even if there is an eventual upward slope, the long
period curve has a flat bottom for a considerable range of outputs” (1952, p.180).
Eiteman having surveyed entrepreneurs on their perception of this curve, notes the
pre-eminence of the downward curve along its entire length.
Heflebower: “… the conclusion seems clear that there is a substantial volume range
within which marginal costs, particularly as viewed by managements, are
approximately constant, given constant factors prices” (1955, p.372).
Stigler notes that the U curve has a corollary: if the output of an industry grows, this
will happen due to the increased number of firms rather than to the increase in their
individual production, because individual output is restricted by the existence of an
optimum size. However, his empirical research shows that industry expansion is
usually performed through the rise of individual productions.
Simon: “…for the observed data make it exceedingly doubtful that the cost curves are
in fact generally U-shaped” (1978, p.348).
Baumol: “Rather, these investigators tell us, the AC curve of reality has a flat
bottom…” (1982, p.9).
Nubbemeyer reports a study of Blinder et al. (1998): “In an extensive questionnaire
on pricing behaviour, they found that only 11 per cent of firms report that their
marginal cost curves are rising. In contrast, 40 per cent stated that they are facing
falling marginal costs, and for 48.4 per cent marginal costs were constant” (2010 p.
57).
It can be observed that the arguments are empirical rather than theoretical. It could be
deplored that these authors do not generally specify whether they consider the short
term or the long term cost curve. Anyway, it seems easy to explain theoretically the
horizontal and the decreasing shapes for both.
The charts presented in this paper therefore contain no U-shaped cost curve; all will
be designed horizontal.
Full cost, profit and competition
16
4.3- DEFINITIONS AND NOTATION
The developments contained in sections 5 and 6 that follow, will operate on the usual
categories of microeconomics: total revenue, average revenue, marginal revenue, total
cost, average cost, marginal cost and profit. However, I find it necessary to make
further distinctions about profit and cost:
-
-
Normal profit is the annual return on capital that produces no incentive for the
capitalist and the entrepreneur to invest or to disinvest. It includes a risk premium
that varies from one enterprise to another. The ratio of normal profit on capital
represents the rate of return expected by financial markets.
Gross profit is the total annual profit earned by the company.
Net profit is gross profit from which the normal profit is deducted.
Normal profit margin (πm), gross profit margin (πg) and net profit margin
(πn) are the margins included in price, to secure corresponding profit.
Gross cost (Cg) is the sum of all costing elements of the firm.
Net cost (Cn) is gross cost minus normal profit margin.
Our notation mentions in this order:
-
dimension: total (T), average (A) or marginal (M)
category: Cg, Cn, πg, πn, R (revenue) ...
subscript st or lt to specify short term or long term, if necessary.
For example, ACglt is the average long-term gross cost.
4.4- ASSUMPTIONS
H1 :
H2 :
H3 :
H4 :
H5 :
H6 :
We are in oligopolistic competition. Accordingly, the criteria characterising the
market have the values in Table 2 above.
Firms have no individual influence on the price of the factors they buy on the
markets
The objective of the firm is profit maximisation; profit opportunities will never
be neglected for non-rational reasons.
Firms are subject to risk aversion.
Available information, both technical and commercial, is important. Firms use
it intensely and even conduct surveys to enlarge it (in the limits of an
acceptable cost); they competently form their expectations and estimates.
Consumers are rational. They pay more, only for superior utility.
Heterodox economists, group to which full costers belong, usually attack the dogma of
perfect rationality and that of perfect information. In neoclassical economics, perfect
rationality goes with profit maximisation. This assumption is challenged by the
Herbert Simon School and its critique was to be found in the article by Hall and Hitch.
My hypothesis H3 indicates that I do not share these doubts, or at least that I do not
consider that the assumption of perfect rationality leads microeconomic theory in the
wrong direction. What I believe is that enterprises favour long-term profit rather than
short-term profit and I do not doubt that most economists share this view. The real
dividing line is between those who think that maximising short-term profit is the way
Full cost, profit and competition
17
of maximising long-term profit and those who believe that the pursuit of short-term
profit maximisation can hamper long-term profit maximisation. It is the latter position
that this paper defends.
The assumption of perfect information is more harmful because it removes one of the
essential dimensions of the real economy: uncertainty. H5 hypothesis states that I find
it wrong, however, to fall into the opposite exaggeration. The affirmation of Hall and
Hich, widely adopted by their successors, that producers have no idea of their demand
curves, and marginal cost or revenue curves is excessive, even if it comes from
empirical investigations. As these variables are an intuitive knowledge, its expression
is naturally more difficult.
5- Determination of full cost
5.1- THE HANDICAP OF ENTRANTS
Which is the target rate of profit that must intervene in the formula of full cost?
Logically, it should be the rate of profit that we called "normal" and which some call
"cost of capital". As pure product of the competitive process, it seems justified to
retain it in the context of oligopolistic competition, although it is clear that the
monopolistic sector of the economy can expect a higher rate.
We saw in Section 2.1, that according to some authors, the handicap of incomers
results in inflating the margin that incumbents can get. This thesis becomes dubious
when we consider the whole economy. Let us not forget the context: competition plays
unhindered and not only from outsiders. In these circumstances, profit rate falls
necessarily down to the requirement from capital market. An increase of this rate can
only occur in a protected industry: it cannot be general. In most cases, the
abovementioned premium tends to zero.
Bhagwati’s criticism of SBM model seems very relevant (see above). On the contrary,
the "Sylos postulate" looks disputable. The SBM model makes the mistake, so
common, of limiting competition to M competition. Obviously, an entrant only dares
to venture if he has some reason to be confident in his ability in technological or
commercial matters.
Of course, the incumbents have advantages due to their presence in the market:
customer relationships, trained personnel, routine, technical expertise... These assets
are not all closed to incoming candidates, but these ones have to make more effort. On
his side, the incomer may also enjoy advantages: plant designed according to the most
modern standards, reputation of being a price cutter, spin-off related to a university...
Business models should logically assume that the entrant’s general situation is as
favourable as that of its installed competitors; simply, otherwise he would not have
come1. As a corollary of the equal ability of incomers, incumbents will suffer an
erosion of their market share, unless the sector is growing strongly.
As observed by Harrod, incomers are not necessarily small businesses condemned to
achieve a breakthrough to have the same strengths as incumbents. Often very large
companies are investing in new markets to diversify their production; diversification is
even not necessarily a step into the unknown: technology evolution sometimes brings
together productions previously far apart. Think of Apple's entry into telephony,
1
With such a requirement, attempts are less frequent, but their success is more likely
Full cost, profit and competition
18
Sony’s coming in computer industry... Edwards and Bhagwati point out that an
incomer already present on adjacent markets is more able to withstand the initial
losses resulting from the price war eventually provoked by his arrival.
5.2- FULL COST PRICING IN FORMULAS
Let us take the formula (3) of Sylos (see above) and express it differently:
= +
(4)
= (5)
where c is the net unit cost that I shall clarify below, π is the normal profit
margin (πm), r is the normal rate of profit (including risk premium) and V is
the speed of capital (K ) turnover in the cost of annual output (C)1 .
=
!
"
(6)
A same rate of profit can be obtained either by a high turnover of capital coupled with
a small margin, either by slower rotation coupled with a higher margin.
The cost c is full, including direct costs, both fixed and variable, and the margin
covering indirect costs. Selling expenses are included as well as production costs and
overhead. Only the cost of capital is excluded.
Full cost price includes thus depreciation of equipment. Some authors question the
validity of this imputation on the grounds that the equipment, once acquired, costs
nothing to the enterprise. Neoclassical theory has always been wary of historical cost.
The marginalist price must not look to the past. By denying the past, this theory
deprives the firm of a future, since the renewal of equipment is normally financed
through depreciation, which is a guarantee of its continuity.
5.3- ESTIMATE OF FULL COST
In the above developments, full cost is considered as a perfectly available datum.
Obviously, the reality is quite a different matter. Full cost should be estimated by the
producer. In this matter, there is no absolute rule to refer to. Each company builds its
estimation formula. Excluding the objective differences between firms (technology,
size, organisation ...), their estimates may still vary for methodological reasons: the
methods of allocating indirect costs and even the boundaries between direct and
indirect costs vary. This will be especially true when firms are multiproduct.
To properly handle this issue, we need to distinguish between the theoretical full cost
(FCT) and the estimated full cost (FCE). What has been defined in previous sections is
FCT. FCE, meanwhile, is plural; managers reckon it in a rather intuitive way and
simple enough not to make their task impractical. In the marginalism debate, one of
the most used expressions was "rule of thumb", to describe the full cost pricing
procedure. In the present perspective, the rule of thumb regards FCE. FCT, for its part,
is a product of rationality.
1
C = q.c where q is the annual output.
Full cost, profit and competition
19
Given hypothesis H6, the market accepts only one price. Without the Walrasian
auctioneer, it will need a period of trial and error before the single price arises1. How
does it emerge? The answer differs depending on whether one considers the objective
differences (differences in costs) or subjective (related to the estimation). The first
ones will be analysed in Section 6.5. Waiting to address this section, let us assume that
the costs of competing firms coincide. In this case, what will happen when the FCE
diverge between competitors?
Firms price on the ground of their own FCE; this process results in a plurality of
prices. Each firm can compare its price with those of competitors and buyers also do
perform this comparison. Two opposing forces act simultaneously: the most expensive
firms will be tempted to lower their prices to avoid losing customers. Cheaper firms
understand they can increase their margins with little risk. When a firm plays the role
of market leader, its price serves as a reference for the other suppliers. Otherwise, the
equilibrium price will be partly a result of chance, within the range between the
extreme estimates of full cost.
Participants in this tâtonnement may have the impression (not wrong, but excessive) to
have to suffer the price as if they were in perfect competition. Harrod reports that
many entrepreneurs complain that even outside the conditions of perfect competition,
“the market does dictate a price” (1952, p.158) ; we may conjecture that this feeling
comes from the tâtonnement to achieve a market price from divergent FCE’s.
6- Equilibrium of the producer
6.1- SUPPLY CURVE AND EQUILIBRIUM
Firms’ equilibrium is given by the intersection of its individual demand curve with its
individual supply curve. What about the latter? The short run supply curve is simply a
horizontal line at the level resulting from the confrontation of FCE’s, as set forth in
Section 5.3. In the long run, the supply curve must take account of economies and
diseconomies of scale. This curve is determined only if the ACglt curves of different
suppliers have sufficient similarity. Otherwise, only the short term supply curve is
determined. Our provisional hypothesis of identical productivity among competitors
does not mean that their cost curves are similar. Neither its average cost curve nor its
marginal cost, in the short or in the long term, are eligible to be the supply curve of the
firm, because this one must take into account the behaviour of its competitors. Supply
curve has an exogenous part. In the absence of objective cost differences, the short run
supply curve will establish at a level close to the full cost. And this one matches the
level of ACglt curve for the firms’ target size2. In most cases, this curve is a good
approximation of the short term supply curve and even of the long run supply curve
when it is horizontal. It makes more sense to relate the supply curve to ACglt than to
ACgst, because the rate of capacity utilisation is not an adequate parameter: it can vary
greatly from competitor to competitor.
Our explanation of equilibrium matches this comment of Edwards: “there is an
equilibrium of price, but not a determinate price-output equilibrium in the usual sense.
In a word, the ‘right’ (equilibrium) price is independent of the planned or achieved
output of the firm” (1955, p 113).
1
Walrasian tâtonnement is badly named, because only one agent gropes: the auctioneer. Buyers and sellers are
content to be price takers. But in the search for equilibrium in oligopolistic competition, they are the groping
agents.
2
Hence Keynes’ opinion that price is governed by long run average cost (1939 p.46).
Full cost, profit and competition
20
In Figure 1-A, point E represents equilibrium. The meeting of supply and demand for
the individual firm may be a tangent, but then it is a special case.
Is our rule that firms must aim at "exhausting" their individual demand always valid?
The case where owners follow particular objectives, such as company control or a
preference for external investments, seems to be an exception, because then firms
deliberately limit their size. However, this case does not imply rewriting of our
optimisation rule, because demand curve includes this dimension. In fact, this curve is
the resultant of three factors:
-
A first exogenous factor: total market demand.
A second exogenous factor: the relative performance of the firm in attracting
customers.
An endogenous factor: when a firm deliberately limits its supply, it encourages
demanders to turn to its competitors, which increases their individual demand and
therefore reduces the demand of the firm in question.
6.2- ADVANTAGE OF FULL COST PRICING: GRAPHIC ACCOUNT
Before explaining why it is the advantage of the firm to produce the quantity PQ, for
which marginal cost is greater than marginal revenue, a preliminary remark is
necessary. Orthodox theory institutes profit maximisation as the business motivation,
but as normal profit is included in cost, it is by deduction net profit that is to be
maximised. This idea is not credible. In the long run, net profit is close to zero; it
cannot thus serve as the remuneration specific to an agent; it must be a supplement to
another remuneration. In fact, the dividend of shareholders includes indistinctly
normal profit and net profit. Capitalists are not interested in this distinction proper to
economists. It is thus maximisation of gross profit which motivates decisions and not
that of net profit.
Let us compare the gross profit earned by the firm which applies full cost pricing
(Figure 1-A) with the one obtained by the marginalist firm (Figure 1-B). On the left,
market price equals full cost (OD); it will produce OQ. The shaded area indicates
gross profit. Net profit is obviously zero. On the right, the firm maximises its net
profit. To this end, it equates marginal revenue with marginal cost1. It will thus
produce O'Q' and set the price up to the demand level which is OI. The shaded area
represents the gross profit. It is cut by the ACgst curve; the upper part FGHI is the net
profit. The existence of a net profit prompted new firms to enter the market, which
translates into a demand shifted to the left in Figure 1-B. Despite the presence of net
profit, gross profit is lower, which is showed by the comparison of surfaces IFKJ and
EBCD.
1
Due to the lack of consistency between the worlds of full cost and of marginalism, the graphical comparison is
possible only under some assumptions. So, as explained in section 6.1, we associate the supply curve, the full
cost level and the horizontal cost curves ACglt, ACgst and MCgst.
Full cost, profit and competition
21
Figure 1 : Advantage of full cost pricing
Figure 1-B represents a moment in a dynamic process of progressive narrowing of
demand and production. If the average cost curve is U-shaped, this narrowing ends
when demand becomes tangent to it; if the cost curve is totally horizontal, the limit is
zero production.
Marginalist rule provides thus less profit than full cost pricing and is therefore not
optimal. This raises two paradoxes:
-
Empirical studies (from the OERG) were needed to cast doubt on the marginalist
optimisation, while its theoretical inadequacy was obvious.
The evolutionary theory of the firm came to the rescue of marginalist theory, while
the firm which aims at respecting its recommendations would weaken itself.
Evolutionary theory should rather be invoked to explain the preponderance of full
cost in empirical surveys.
6.3- DEMAND VARIATIONS
Changes in the firm’s individual demand may be attributable to the following causes:
-
Long-term trend, usually characterised by an expansion.
Cyclical fluctuations.
Seasonal fluctuations (for a limited number of products).
Accidental variations (natural disasters, climatic, political conditions).
Change in the number of competing firms or in their respective market shares.
Unlike the latter, the previous four involve a variation in industry demand.
Faced with these changes, the firm must react; it has choice between two policies:
-
Price-reaction: keeping production steady and adjusting price.
Quantity-reaction: keeping price steady and adjusting production.
In the short run, a rising quantity-reaction is impossible when production is running at
full capacity. According to Andrews, Edwards and Sylos, large companies commonly
take care to have capacity reserves available.
Full cost, profit and competition
22
Price-reaction expands or decreases deliberately the profit margin. Price may also vary
in case of quantity-reaction, when cost is depending on quantity produced (long term
average cost not horizontal).
Given the close relationship it establishes between price and cost, full cost theory
implies that the quantity-reaction is preferred whenever possible. Full costers have
advanced several justifications for this behaviour, especially the permanence of a trust
relationship between the firm and its clients. Another reason is - in my view- not given
enough attention: the reliability of forecasts. For a given change in revenue, the profit
with a fixed quantity and variable price is more volatile than his alter ego with variable
quantity and fixed price1. Now, the reduction of uncertainty is a major concern for
entrepreneurs.
This behaviour could be related to the empirical discovery of some price rigidity by
Rotemberg (1982)2, itself already confirming an earlier study by Godley and Nordhaus
(1972).
In the case of depressed demand, the quantity-reaction may involve:
-
The laying off of some part of previously active factors of production.
The retention of factors combined with a loss of productivity.
Stockpiling of unsold finished goods.
Business cycle is the main cause of fluctuation in demand. It deserves thus special
attention. Many economists have studied empirically the cyclical changes in prices and
profit margins. And these studies come to different conclusions. The three theses,
procyclical, stable and contracyclical prices and margins, are each widely reported.
By contrast, the pro-cyclical variation in the rate of profit does not seem challenged.
That those changes could be contracyclical may surprise. But Spiegel and Stahl (2014)
draw attention to the influence of the cycle on market structure. Market entry tends to
be stronger during the boom. According to these authors, the pricing policy is
therefore intended more dissuasive in booms. Moreover, if creations and liquidations
of companies let the number of firms increase during booms and decrease during
depressions, the variations of the number of firms affect individual demand in the
opposite direction to the fluctuations of the sectorial demand.
The margin focused by most empirical studies is that of price over marginal cost, not
over average cost. Their findings are applicable to full cost pricing with caution. In
addition, the estimate of marginal cost is problematic; it is an abstract concept that
does not appear in any accounting and that economists have to infer from
macroeconomic data. The study by Machin and Van Reenen (1993) is an exception
since it is based on data from the microeconomic level and it identifies the margin
with the ratio of profit to revenue. This study, more in line with our purpose, finds a
procyclical margin variation. Anyway, to satisfy, full cost theory must be compatible
with the three possible cycle forms, because all markets do not necessarily behave
identically.
1
If we assume a quasi-stable unit cost, price minus cost will vary more widely than price.
The results of Rotemberg, like those of other empirical studies, do not operate the distinction between
oligopolistic competition and monopolistic oligopoly which is essential in the present paper. Comparisons
between these studies and our object must be treated cautiously.
2
Full cost, profit and competition
23
In formulas (5) and (6), if we enter, not the variable C, V and r, but their average over
the cycle, we get acyclical margin and price, with a profit rate fluctuating cyclically
around its average. On the whole cycle, the rate of profit reaches the long-term target.
The higher rate of profit during the boom will not encourage the entry of new firms;
the lower profit in depression will not incite the incumbents to retire. Entrepreneurs
understand that the pendulum will bring compensation sooner or later. They do not
expect the normal profit at each stage of the business cycle.
The intensity of business cycle differs greatly between sectors and is generally larger
in those supplying investment than in those feeding consumption. In sectors subjected
to the most intense fluctuations, the market may force an enterprise to complete the
quantity-reaction by a price-reaction1.
Thanks to the compensation between the good and bad times, this price-reaction does
not undermine the achievement of normal long-term profit. Reduced prices in
depressions do not encourage disengagement, nor do the high prices in the boom
attract incomers. The resulting profit margin meets thus the criteria of full cost. It
therefore seems reasonable to consider the result of this price-reaction as a cyclical
component included in the margin of the full cost. The margin formula (5) is replaced
with:
= +γ
(7)
where γ is the cyclical component.
When procyclical, the cyclical component is positive in booms and negative in
depressions. The signs are reversed in the case of a contracyclical component.
6.4- RELATION WITH THE EQUILIBRIUM OF IMPERFECT COMPETITION
During the controversy, one of the marginalist arguments was to consider full cost, not
as an explanation but as a simple procedure of pricing. In this role, the full cost is
subordinated to the pricing explanation proposed by the theory of imperfect
competition. The idea is this: the profit margin included in the full cost must vary to
adapt to demand fluctuations. A fraction of the full cost is thus function of demand.
Confusion of this variable part with the profit of imperfect competition given by the
formula (1) of J. Robinson leads easily to the hackneyed conclusion that full cost
theory does not bring anything new.
This argument is admissible only in the special case where price varies procyclically
and where demand fluctuations are very pronounced. It is founded only if our above
model enables a component of full cost to behave like the margin of formula (1). This
element cannot be anything but the cyclical component, the only element that is
responsive to demand2. In fact, this assimilation is impossible.
Firstly, the cyclical component is positive when times are good but negative when they
are bad. The net profit of imperfect competition can become negative only in very
specific circumstances as a drop in demand particularly violent.
1
This price-reaction is generally procyclical, although the opposite is possible in special cases
On Figure 1-A, the cyclical component is not discernible. Its existence affects the altitude of ACglt and the size
of the gap between it and ACnlt.
2
Full cost, profit and competition
24
Secondly, the rationale for integrating the cyclical component into the full cost was
precisely that it does not participate in attraction and repulsion forces that affect the
number of suppliers in the market over the long run. Does it make sense to say that the
profit of imperfect competition does not attract new entrants? Of course not, and
J. Robinson conceived it so, she who characterised this equilibrium as being of short
run, as opposed to the "full equilibrium" where profit was gone.
6.5- PRODUCTIVITY DIFFERENCES BETWEEN COMPETITORS
We may at last abandon the simplification introduced in Section 5.4 and take account
of cost differences between competitors.
There is no unanimity among economists about pricing in situation of differentiated
costs. According to Knight, Andrews and Edwards, the cost of the most efficient
business makes the price. Instead, J. Robinson believes it is the price of the marginal
firm. In fact, it is Farm (2014), who provides the most correct answer to this problem
(see section 2.3).
The most efficient firm enjoys a privilege: it can set the price as it pleases at any level
higher than its full cost and not higher than the full cost of its competitors.
It should choose a price near its own full cost when it wants to eliminate competitors
from the market. But it seems rational that the most efficient firm prefers the other
option. Indeed, this is a unique opportunity for firms to achieve a net profit without the
risks that are usually associated. Maximising long-term profit prohibits net profit when
available to all, but recommends it when it is a privilege.
Let there be n firms F1 …Fn, with C1 < C2 … < Cn where Ci is the full cost of the firm i.
If firm F1 chooses a price equal to Cm where m > 1, each firm F2 ... Fm-1 could impose a
price lower than Cm, that firm F1 must accept. But they have the same interest as F1 to
take advantage of net profit that is the reward for their performance.
Figure 2 : net profit originating from a productivity advantage
In Figure 2, where C1 is the full cost of the most efficient firm and C2 a higher price it
chooses, the net profit is represented by the grey rectangle.
The market price will tend towards the full cost of the marginal firm or rather of the
"normal" firm. By normal firm, I mean one which does not enjoy exclusive
advantages, which is subject to management within the standard and that exploits
Full cost, profit and competition
25
publicly known technologies. But an aggressive competitive strategy may reduce the
level of the market price.
Let’s consider now the case of a market with non-homogeneous products. Absolute
cost differences are only significant relatively to product quality. The type of product
differentiation that interests us here is that where there is an objective hierarchy of
quality between products1, for example, motors of different powers. Generally, the
best quality implies a higher cost of production. Figure 2 remains valid for this case.
Suppose that product 1 is of better quality than product 2 and that their absolute
production costs are identical. The horizontal axis represents, not units of product, but
units of abstract utility for consumers. The cost of a unit of utility is lower in firm F1.
This firm can so achieve a net profit by setting its price on the ground of the
conditions of production of firm F2.
Differences in productivity may come from patents, from an advantageous location,
from better management or from a larger size if returns to scale are increasing. And
also from sharper specialisation. This last advantage benefits rather to small firms,
which possibly enables them to withstand large businesses even in the presence of
economies of scale. Economists commonly overestimate, not economies of scale
themselves, but their impact on competition because they perceive small businesses as
the miniature version of the large companies. For example, if the small business is
aimed at a market segment where consumers are particularly demanding, the higher
cost will be offset by higher revenue.
Economic theory, following Viner (1932, p.25) believes that in the long run, net profit
due to a productivity advantage tends to disappear, because it is absorbed by a
remuneration adjustment of the factor generator of this efficiency. This is probably
true for the factor land and sometimes for certain employees in specific functions. But
this law that excess profits are transferred to the remuneration of a factor does not
generally hold. Often the surplus of productivity originates in the department of R&D.
In this case, the surplus cannot be transferred to the remuneration of researchers, but
only partially. The firm pays them for their possible future inventions, not for the past
ones. And such remuneration may not anticipate innovations that remain uncertain as
they have not yet taken place, because past inventions do not guarantee future
inventions. Only factors of which the productive advantage is permanent can claim
obtaining a rent or a quasi-rent. It is also doubtful that the factor can retrieve the
benefit after it has been incorporated the stock value.
7- Conclusions
The dominance of full cost pricing is confirmed by numerous empirical studies.
Orthodox microeconomic theory got out of this difficulty by relegating it to the status
of "rule of thumb". Sylos wrote: “Far from representing only a rough and approximate
rule for behaviour a ‘rule of thumb’, the full cost principle can be fully rationalised”
(2007, p. 96). The present paper aims at contributing to this project. By the late fifties,
this rationalisation was already quite advanced and it has received little attention since
then. It is therefore useful to get it again on track.
The theoretical elements on which I insisted were:
1
As opposed to the type where only differentiated consumer tastes establish a system of preferences. It is of
course a simplification to consider that a hierarchy of preferences can have a perfectly objective basis.
Full cost, profit and competition
26
1. Specification of the market structure concerned by full cost. Highlighting of
oligopolistic competition.
2. Equilibrium analysis using cost curves which are not U-shaped
3. Reaffirmation of profit maximisation. But this process happens mainly at the level
of Pe competition and not of M competition.
4. The firm can maximise its gross profit with a zero net profit. The desire to
maximise net profit would lead it on highly risky paths and to a likely reduction in
gross profit.
5. Relation of full cost theory with the literature that analyses the effects of the
business cycle on prices and margins.
6. Clarifying of the algebraic formula of full cost established by Sylos.
7. Distinction between the two levels of full cost that are its rationality and its
estimate.
8. Re-value of forms of competition based on performance and loss from its pedestal
by competition on margins.
The topic of producer’s equilibrium is not naturally a controversial opposition between
cost of production thesis and demand thesis, although it has evolved in this way. The
basic question is not: is it either cost or demand that makes the price? Some role may
be assigned to both. But it is: how does it work? For this issue, equalisation of
marginal cost and marginal revenue is not the right solution.
References
Andrews, P.W.S. 1959. Manufacturing Business. Macmillan London.
Bain, Joe S. 1950. “A Note on Pricing in Monopoly and Oligopoly”. American
Economic Review, vol 39: 448-464.
Bhagwati Jagdish N. 1970. “Oligopoly Theory, Entry Prevention, and Growth”.
Oxford Economic Papers, Vol. 22 n°3 (nov), 297-310
Baumol, William J. 1958. “On the Theory of Oligopoly”. Economica 24 (99): 187198.
Baumol, William J. 1982. “Contestable Markets: An Uprising in the Theory of
Industry Structure”. American Economic Review. 72 (1): 1-15.
Bertrand, J. 1883. “Théorie des richesses”. Journal des savants (septembre) : 499-508.
Chamberlin, Edward Hastings. 1962. The Theory of Monopolistic Competition.
Harvard University Press, Cambridge Massachusetts.
Cournot, A.A. 1980. Œuvres complètes. Tome VIII Recherches sur les principes
mathématiques de la Théorie des richesses. Librairie philosophique J.Vrin Paris.
Dixon, Huw. 2007. “Chapter 6: Oligopoly Theory Made Simple” in Surfing
Economics. www.huwdixon.org/SurfingEconomics/chapter6.pdf.
Edgeworth, Francis. 1993. Papers relating to Political Economy. Volume 1,
Thoemmes Press Bristol.
Edwards, H. R. 1955. “Price Formation in Manufacturing Industry and Excess
Capacity”. Oxford Economic Papers 7 (1) dec : 94-118.
Eiteman, Wilford J. 1947. “Factors Determining the Location of the Least Cost Point”.
American Economic Review. 37 (December): 910-918.
Eiteman, Wilford, and Glenn E. Guthrie. 1952. “The Shape of the Average Cost
Curve”. American Economic Review. 42 (December): 832-838.
Full cost, profit and competition
27
Farm, Ante. 2014. “Competitive Price Leadership”. www2.sofi.su.se/ afa/docs/Competitive_Price_Leadership.pdf
Godley, W.A.H, and W.D. Nordhaus. 1972. “Pricing in the Trade Cycle”. The
Economic Journal, vol 82 September: 853-882.
Hall, R.L., and C.J. Hitch. 1939. “Price Theory and Business Behaviour”. Oxford
Economic Papers 2 (May): 12-45.
Harrod, R.F. 1952. Economic Essays. Harcourt, Brace and cie, New York
Heflebower, Richard B. 1955. “Full Costs, Cost Changes, and Prices” in Business
Concentration and Price Policy. Princeton University Press.
Keynes, J.M. 1939. “Relative Movements of Real Wages and Output”. The Economic
Journal 49 (193): 34-51
Knight, Frank H. 1921. “Cost of Production and Price over Long and Short Period”.
Library
of
Economics
and
Liberty.
www.econlib.org/library/Essays/JPE/knCPP1.html
Lanzillotti, Robert F. 1957. “Competitive Price Leadership- A Critique of Price
Leadership Models”. The Review of Economics and Statistics”, vol. 34, 55-64
Lanzillotti, Robert F. 1958. “Pricing Objectives in Large Companies”. American
Economic Review 18 (5) December: 921-940.
Lee, F.S. 1999. Post Keynesian Price Theory. Cambridge University Press (Virtual
Publishing). Cambridge
Lee F.S., and J. Irving-Lessman. 1992. “The Fate of an Errant Hypothesis: The
Doctrine of Normal-Cost Prices”. History of Political Economy 24:2 : 373-309
Lester, Richard A. 1946. “Shortcomings of Marginal Analysis for Wage-Employment
problems”. American Economic Review 36 (March): 63-82.
Lucas, M.R. 2003. « Pricing decision and the neoclassical theory of the firm ».
Management Accounting Research, 14: 201-207.
Machin, Stephen, and John Van Reenen.1993. “Profit Margins and the Business
Cycle: Evidence from UK Manufacturing Firms”. The Journal of Industrial
Economics 41 (1): 29-50
Machlup, Fritz. 1946. “Marginal Analysis and Empirical Research” . American
Economic Review 36 (September): 519-554
Modigliani, Franco. 1958. “New Developments on the Oligopoly Front”. Journal of
Political Economy, 66(3) June, 215-232
Mongin, Philippe. 1990-91. “The Early Full-Cost Debate and the Problem of
Empirically Testing Profit Maximization”. Journal of Post Keynesian
Economics, 13:2 (Winter): 236-251.
Mongin, Philippe. 1992. “The Full-Cost Controversy of the 1940s and the 1950s: A
Methodological Assessment”. History of Political Economy 24:2 311-356.
Nubbemeyer, Elmar. 2010, A Reconsideration of Full-Cost Pricing.
www.edoc.ub.uni-muenchen.de/12313/2/nubbemeyer_Elmar.pdf.
Oliver, Henry M. 1947. “Marginal Theory and Business Behavior”. American
Economic Review 37 (June): 375-383
Ray, Korok, and Jacob Gramlich. 2012. Full-Cost Pricing and Economic Pricing:
Reconciling
Two
Approaches.
www.korokray.files.wordpress.com/2012/11/fcpep.pdf
Robinson, Austin. 1950. “The Pricing of Manufactured Products”. The Economic
Journal 51: 771-780.
Robinson, Joan. 1946. The Economics of Imperfect Competition. Macmillan and co,
London.
Full cost, profit and competition
28
Rotemberg, Julio J, and Michael Woodford. 1999. “The Cyclical Behavior of Prices
and Costs”. NBER Working Paper Series. Working paper 6909.
www.nber.org/papers/w6909
Rotemberg, Julio J. 1982. “Sticky Prices in the United States”. The Journal of
Political Economy 90 (6): 1187-1211.
Simon, Herbert A. 1978. “Rational Decision-Making in Business Organizations”.
Nobel Prize in Economics Documents 1978-1.
Spiegel, Yossi, and Konrad Stahl. 2014. Industry Structure and Pricing over the
Business Cycle. www.tau.ac.il/spiegel/papers/Spiegel-stahl-CRESSE.pdf
Sraffa, Piero. 1925. On the Relations Between Cost and Quantity Produced. Ed Langer
& Lee Chicago Illinois.
Stigler, Georges J. 1968. The organization of Industry. Irwin Homewood.
Sylos-Labini. 1962. Oligopoly and Technical Progress. Harvard University Press,
Cambridge Massachusetts
Sylos-Labini, Paolo. 1971. « La théorie des prix en régime d’oligopole et la théorie du
développement ». Revue d’économie politique. 81 (2) : 244-272.
Sylos-Labini, Paolo. 2007. “Oligopoly: Static and Dynamic Analysis”. Revue
d’économie Industrielle, 118 (2e trimestre): 91-107.
Viner, Jacob. 1932. “Cost Curves and Supply Curves”. Zeitschrift für
Nationalökonomie, bd III Hft 1 Sonderabdruck, 23-46.
Wicksell, Knut. 1934. Lectures on Political Economy. Volume One: General Theory.
Routledge & Kegan London


![[SAMPLE] [FATE] Admission Test MS/MPhil Applied Economics](http://cdn1.abcdocz.com/store/data/000280384_1-36c875e9987fa6617a1b651429f3357f-250x500.png)


© Copyright 2026