
Orava Residential REIT Annual Report 2014
1
ORAVA RESIDENTIAL REAL ESTATE
INVESTMENT TRUST PLC
ANNUAL REPORT 2014
including
Board of Directors Report
Consolidated financial statements 1 Jan – 31 December 2014
Auditor’s Report
TRANSLATION ONLY
2
CEO's review
In 2014, Orava Residential Real Estate Investment Trust plc (“Orava Residential REIT”) achieved its
targeted financial result. As in the previous year, the result was above all achieved by successful
property acquisitions which the company carried out at tax-free contract prices totalling more than EUR
46 million.
In 2014, the result of rental operations was affected by a lower occupancy rate than in the previous
year, as well as the reduced weight of provincial towns and older properties. The occupancy rate of
rental operations was particularly affected by new apartments that were vacant upon purchase.
In general, apartments had a downward price trend in 2014, but the prevailing market situation provided
a wholesale buyer like Orava Residential REIT – a company that buys whole buildings and large
number of apartments simultaneously – with possibilities to make inexpensive acquisitions. A total of
552 apartments in 20 different properties were acquired during the year. The debt-free selling prices of
the acquisitions totalled EUR 46.2 million. The successful apartment acquisitions had a significant
impact on the financial result for the year. At the end of 2014, the fair value of the investment properties
totalled over EUR 130 million, which means a growth of 65 per cent from the previous year. Regionally,
the investment properties were more widely distributed than before, located across 30 towns by the end
of the year. In conjunction with the company's strategy work in late 2014, the regional and age
distribution targets of the residential portfolio were updated, and the target towns were given growth
criteria in addition to size criteria.
The sales of apartments vacated by individual tenants terminating their tenancy were fairly slow in 2014,
albeit that the markets picked up somewhat towards the end of the year. In all, 29 apartments were sold
from 12 different properties. In addition to apartment sales, the sales from the investment portfolio were
supplemented by sales of building plots, bringing the 2014 total sales from the portfolio to EUR 5.7
million.
In 2014, the company increased its shareholders' equity by directed share issues associated with the
acquisitions and by concluding convertible bond agreements that the lenders exchanged for shares in
the company. The number of Orava Residential REIT shareholders continued to grow and doubled from
the previous year. At the end of January 2015, the Residential REIT had over 5,800 shareholders.
Trading in the company's share on the Helsinki Stock Exchange also continued to be lively, and the
average daily turnover in 2014 exceeded EUR 254,000.
INVESTING IN ORAVA RESIDENTIAL REIT
The company facilitates investments in a professionally managed and distributed residential portfolio.
When building up and managing its residential portfolio, the company utilises professionals from across
the field, such as Newsec Asset Management Oy, Ovenia Oy, Raksystems Anticimex Oy and Realia
Management Oy.
Apartments have traditionally been less sensitive to economic cycles than commercial and office
premises, for instance. Residential investments have also historically provided good protection from
inflation.
The basic idea of the Tax Exemption Act regulating the operations of Orava Residential REIT is the
one-time taxation of profits from real exempted estate business in limited company form, making
taxation directly equivalent to the taxation of real estate investment business functions. The company is
exempt from paying income tax and capital gains tax provided that certain conditions are met. Among
3
other things, the company must distribute as dividends at least 90% of its financial result excluding
unrealised value changes. The company is exempt from capital gains tax provided that it has owned the
sold investment property for at least five years.
The price and weekly turnover of the company's shares on the Helsinki Stock Exchange during the
period 14.10.2013–5.2.2015
Orange line: Trading code OREIT
Red line: Trading code OREITN0114
Average daily turnover in total EUR 245 thousand
OPERATING ENVIRONMENT
The company invests in apartments available for lease in Finland. The factors affecting the demand for
lease apartments include the economic outlook, interest rates, income level and the growth of
population in different localities. The factors affecting the supply of apartments include the prices in the
residential market, the economic outlook, possible capacity shortage in the construction sector and the
government's support actions. The prices, rent levels and maintenance costs of apartments determine
the rental income from properties in different localities.
4
BUSINESS MODEL
The company invests in apartments available for lease in Finland. The factors affecting the demand for
lease apartments include the economic outlook, interest rates, income level and the growth of
populations in different localities. The factors affecting the supply of apartments include the prices in the
residential market, the economic outlook, possible capacity shortage in the construction sector and the
government's support actions. The prices, rent levels and maintenance costs of apartments determine
the rental income from properties in different localities.
Orava Residential Real Estate Investment Trust plc is a real estate fund taking the form of a REIT (Real
Estate Investment Trust), investing mainly in lease apartments. The objective of the company's lease
and investment activities is to produce profits for the shareholders in the form of dividends and an
increase in the company's share price. The company engages in real estate investment business by
leasing, developing, contracting and selling residential apartments, residential real estate properties or
housing companies it owns. The company seeks to invest mainly in lease apartments producing a good
rental income in major and medium-sized Finnish towns. Although most of the company's investment
properties are leasable residential apartments, it can also own commercial premises. In addition, the
company seeks to efficiently utilise the liabilities to equity ratio in its portfolio management.
The company's mission is to increase the number of lease apartments by channelling capital into
residential investments, and its vision is to be the leading residential fund in Finland by 2020. This
includes the best profit, the most satisfied customers and the highest market value.
The company is planning to increase the size of its real estate portfolio in the medium term of 3–5 years
to about EUR 300–500 million.
The company's income consists of rental income from investment properties and changes in their value.
The company's financial result consists of net rental income from apartments, realised and unrealised
changes in value, costs of liabilities and administrative expenses.
In the residential market, prices depend on whether the apartments are acquired one by one or in larger
entities. Major investors have been able to utilise the wholesale market where the buyer of a residential
property obtains a discount of 10–30 per cent. Orava Residential REIT also operates in the wholesale
market and seeks to utilise its price level. There are no guarantees that the discounts in the wholesale
market remain at this level. However, as long as the company can acquire investment properties with a
wholesale discount, investors in the company's shares can also benefit from these advantages usually
available to major investors. As a rule, the wholesale discount is greater as an investment property’s
age increases is, and decreases in relation to the size of town is where the investment property is
located.
When assessing the fair value of the investment properties, the company uses a method based on
reference transactions. The method is typically used for evaluating apartments to be sold as individual
apartments. The fair value of the company's investment properties is determined using a computerassisted mass assessment system based on asking price, agreed price data and multi-variable
regression methodologies.
The data used for the reference transaction method consists primarily of the apartments for sale
advertised in the Oikotie.fi service of Sanoma Group, continuously obtained from Oikotie in electronic
form. Oikotie.fi is one of the largest portals in Finland for advertising apartments for sale, and the
service contains, besides the advertisements of real estate agents, also those submitted by private
individuals.
The Real Estate Funds Act prescribes that the company must measure real estate properties, other
than those in its own use, at fair value on its balance sheet. In addition, the change in fair value of the
company's investment properties is entered through profit and loss as measurement gain or loss for the
5
period during which it is created. Legislation also contains detailed provisions regarding the
measurement and assessment of the company's assets carried out by an independent, external real
estate appraiser.
INVESTMENT PROPERTIES
On 31 December 2014, the total value of investment properties owned by the company was EUR 130.6
million. There were 1,318 apartments in all, and the total floor space of the properties was 82.2
thousand square metres.
Investment properties owned by the company on 31 December 2014 in full or in part by town
Region
Number of
properties
Apartments
Floor
and business space
2
facilities (pcs) (m )
Espoo & Kauniainen ***)
2
11
703
3327
Helsinki
1
24
1,436
5204
Järvenpää ***)
3
24
1986
7910
Kerava
1
19
2071
6421
Kirkkonummi ***)
2
104
6973
13834
Nurmijärvi
2
43
3094
6630
Sipoo
1
14
1140
1848
Vantaa *) ******)
3
113
7118
11502
Helsinki Region *) ***)
15
352
24519
56676
Jyväskylä **)
4
20
2130
4455
Lahti
5
73
4,148
5542
Oulu
5
25
1538
3842
Tampere
6
58
3609
11130
Turku
2
18
1287
4397
Major towns
22
194
12712
29367
Hamina
1
16
1040
1329
Heinola
1
20
1164
738
Hämeenlinna
1
11
527
1009
Kokkola
1
4
321
949
Kotka *)
5
197
10888
8101
Lohja
2
62
3892
5719
Pori
2
58
3183
2754
Porvoo ***) ******)
2
42
2662
7247
Riihimäki
1
16
773
745
Rovaniemi
2
80
4587
5362
Fair value
(€1,000)
6
Salo ****)
1
74
4518
3240
Savonlinna
1
51
2723
2297
Tornio
2
65
3737
2921
Varkaus ******)
3
76
4,915
2103
Major towns
25
772
44927
44514
Total
62
1318
82158
130556
*) As Oy Vantaan Maauunintie 14 and As Oy Kotkan Alahovintie 7 both have one business facility (a
day care centre).
**) The apartments in As Oy Jyväskylän Kruununtorni used to be four office facilities and one storage
facility.
***) There are 11 business facilities at Kiint Oy Liikepuisto in Porvoo.
****) As Oy Salon Ristinkedonkatu 33 has one business facility and a day care centre.
*****) As Oy Varkauden Ahlströminkatu 12 has two business facilities and two storage facilities also
suitable for use as business facility.
******) Includes a total of EUR 1.1 million of financial assets for the sale of building plots
MEASUREMENT OF THE COMPANY'S INVESTMENT POPERTIES
Investment assets are measured at acquisition cost including transaction costs. The acquisition cost of
self-constructed or developed investment assets consists of construction costs accumulated by the
completion date, capitalised borrowing costs and other expenses. Fair value is used for measurement
after the original recognition.
The profit or loss due to changes in fair value is recorded through profit and loss in the period it was
created. Fair value was determined in accordance with IFRS 13, Fair Value Measurement, which
entered into force on 1 January 2013. The Real Estate Funds Act also requires that changes in fair
value are recorded as income or expense.
The fair value of apartments is determined using the price measurement model created by the
management company. The model is based on an apartment pricing model where the following factors,
among others, are used as the determining parameters:
Price information available for properties within the same postcode area and for properties
located within one square kilometre of the investment property, as well as price information
available for the from the investment property itself;
ownership/lease of the building plot;
floor area of the apartment;
age of the real estate property;
state of repair of the apartment;
whether the apartment has its own sauna; and
the type of the real estate property.
7
An external expert and real estate appraiser audits the management company's assessment process,
calculation methods and reporting once a year. In addition, the valuation of an external, authorised real
estate appraiser is obtained of the value of the company's real estate assets. Realia Management Oy
and Turun Seudun OPKK act as the external experts and authorised real estate appraisers. In line with
the framework agreement concluded with both of them they produce a separate valuation certificate or
valuation calculation of each investment property held by the company, determining the value of the
apartments in that investment property . The value calculations are made either on the basis of a review
or as desktop work. The valuation is done by the valuation experts of Realia Management Oy or Turun
Seudun OPKK who, as a rule, are authorised real estate appraisers (AKA) and real estate appraisers
holding a general authorisation and approval of the Central Chamber of Commerce (KHK). The
appraisers are chosen for each property taking into account its location and nature. The nationwide
network and expertise of real estate agencies in the Realia Group (Huoneistokeskus, SKV
Kiinteistönvälitys and Huom!) and OP-Kiinteistökeskus are utilised in the valuation process.
MANAGEMENT OF THE COMPANY'S INVESTMENT PROPERTIES
The company has signed an agreement with Newsec Asset Management Oy and Ovenia Oy (real
estate managers) for apartment management services. The duties of real estate managers include the
technical and administrative management of real estate properties, renting and rent administration, as
well as the financial administration and reporting of the company's subsidiaries. An annual expense
budget is drawn up for all managed real estate properties regarding their maintenance, annual repair
and construction contracting activities, approved separately by the company. Members of the
management of real estate manager companies are also members of the Boards of Directors of the
company's subsidiaries and associate companies.
INVESTMENT STRATEGY
The investment strategy consists of three areas: i) acquisition and divestment of investment properties,
ii) investment property strategy and iii) financing strategy.
Acquisition and divestment of investment properties
The company seeks to utilise the wholesale discount often achievable by major investors on the
apartment market by mainly acquiring or developing entire properties for its portfolio and by buying units
consisting of several apartments. The apartments are sold to the market one by one. The regional
distribution of apartment values and ages can also be affected by sales.
INVESTMENT PROPERTY STRATEGY
Location of apartments
The company estimates the income from apartment investments to be better, as a rule, in provincial
towns when compared to Helsinki or other major towns. The calculations made by the company indicate
that the gross rental yield is currently 2–3 per cent higher in provincial towns than in Helsinki. Once
management costs are taken into account, the advantage of provincial towns is reduced to 1–2%.
The differences in the increase of value of apartments in different areas is mainly affected by the growth
of population, the economic success of the area and its general attractiveness as a place to live in. The
8
company estimates the increase in value to be slightly better in Helsinki than in in provincial towns. The
company estimates that the net rental yield and expected increase in value are together 0.5–1.5 per
cent higher in medium-sized provincial towns than in Helsinki. As a rule, major towns are somewhere
between these extremes. The third important element of the total yield, wholesale discount, is also
typically bigger in smaller towns. On the other hand, the apartments are significantly easier to sell in the
Helsinki region and in major towns than in smaller localities. The difference in saleability also increases
as the state of apartment market deteriorates.
The company seeks a balance between expected yield and saleability so that the target is to have the
same regional distribution in the apartment portfolio as that of the whole apartment mass in Finland. The
apartment portfolio is divided into portfolios of the Helsinki region, major towns and the rest of Finland.
The strategic weighting according to location is:
i)
ii)
iii)
The Helsinki Region portfolio mainly consists of properties acquired or developed by the
company in the capital region and in its surrounding municipalities, and its objectives are
good rental yield and the best possible increase in value.
The major towns portfolio consists of properties acquired or developed by the company in
the five major towns outside the Helsinki region, i.e. in Tampere, Turku, Oulu, Jyväskylä
and Lahti, and its objectives are good rental yield and a good increase in value.
The rest of Finland portfolio consists of investment properties acquired or developed by the
company in major or medium-sized towns outside the Helsinki region and the above major
towns, and its objective is optimal rental yield.
In this context, medium-sized town means a town with at least 20,000 inhabitants. As a rule, the
properties to be acquired for the Residential REIT shall be located in towns for which Statistics Finland
forecasts population growth. If the forecasted population growth of a target town remains materially
below the average in the entire country, it is additionally required that the property to be acquired be
located in the pedestrian zone in the centre of the town. The target weighting compliant with the
company's current investment strategy is 52% for the Helsinki region, 22% for major towns and 26% for
the rest of Finland. The intention is to keep the weighting values within about ten percentage points of
the target values.
The distribution of fair valus of investment properties by region on 31 December 2014 and 31
December 2013.
Region
31 Dec 2014
31 Dec 2013
Helsinki region
44 %
38 %
Major cities
34 %
43 %
Minor size cities
23 %
19 %
Age of apartments
The company also seeks to diversify its holdings regarding age distribution. The company estimates
that the return of investments made in old apartments is, as a rule, higher than that of investments
made in new apartments. The calculations made by the company indicate that the gross rental yield in
Helsinki, for example, is about 2 per cent higher for old apartments than for new ones. Once the
management costs are taken into account, the difference is reduced to about 1.5 per cent. As ageing
has the biggest reducing effect on the price of new apartments, their expected increase in value is lower
than that of old apartments. The higher repair costs of old apartments reduce this difference. Wholesale
discounts are also typically higher for older properties. On the other hand, property development can
also produce substantial savings in the acquisition prices of properties. However, old properties carry
bigger risks than new properties. Old properties are often more difficult to sell than new ones, and
unexpected repair costs can prove to be a problem. The company is seeking a balance between the
9
higher yield expectations of old apartments and the lower risk of new apartments so that an
overweighting of 50 per cent is sought in the portfolio for newer (built in the 1990s and 2000s)
apartments compared to the weighting distribution of the entire apartment base. The exact target
weighting for newer apartments is 51 per cent measured by market values. The company tries to keep
the weighting value within about ten percentage points of the target value.
The distribution of fair values of investment properties by age group on 31 December 2014
and 31 December 2013.
Construction year
31 Dec 2014
31 Dec 2013
1989 and before
42 %
44 %
1990 and after
58 %
56 %
CUSTOMERS
The tenants of investment properties are customers of Orava Residential REIT.
On 31 December 2014, about 93 per cent of tenants were private individuals and 7 per cent companies,
some of which had leased the apartment for its employee, and some leased the apartment further as
furnished. Of the person-tenants, the average age of main tenants was 41.5 years. 34 per cent of the
tenants were less than 30 years old, 48 per cent were 30–60 years old and 18 per cent were over 60
years old. The average duration of the lease was 5.0 years. 37 per cent of the leases were for less than
one year, 48 per cent were for 1–10 years, 10 per cent were for 11–19 years and 5 per cent were for
over 20 years. On 31 December 2014, the longest continuous lease had lasted for 40.5 years.
Length of the lease
%
Age of the main tenant
%
Less than 1 year
37 %
Less than 30 years
34 %
1 to 10 years
48 %
30 to 60 years
48 %
10 to 20 years
11 %
More than 60 years
18 %
More than 20 years
5%
BOARD OF DIRECTORS
The Board of Directors of Orava Residential REIT has six members: Peter Ahlström, Mikko Larvala,
Tapani Rautiainen, Veli-Matti Salmenkylä, Jouni Torasvirta and Timo Valjakka. The Chairman of the
Board is Jouni Torasvirta, and the Vice Chairman is Tapani Rautiainen. Four of the members have been
on the Board ever since the company was established. During the period under review, the Board of
Directors had 23 meetings, 13 of them being telephone meetings. The Board members' rate of
attendance at Board meetings was 97%.
10
Name
Year of
birth
Position
On the Board
since
Owns the company's
shares (pcs)
Jouni Torasvirta
1965
Chairman
2010
7,787 ****
Tapani Rautiainen
1957
Vice Chairman
2010
709,286 *, **
Peter Ahlström
1964
Member
2013
0
Mikko Larvala
1966
Member
2013
0
Veli Matti Salmenkylä
1960
Member
2010
100
Timo Valjakka
1960
Member
2010
719,661 *, ***
* Ownership corporations under the member's control, Länsi-Suomen Vuokratalot Oy (260,423
shares), Avaintalot Oy (160,456 shares) and Maakunnan Asunnot Oy (69,422 shares).
** Ownership through corporation under the member's control, Sysmäläntien Kiinteistöt Oy
(218,985 shares).
** Ownership through corporation under the member's control, Godoinvest Oy (229,360 shares).
**** Ownership through a management company (5,687 shares).
11
Board of Directors’ Report
Orava Residential *Real Estate Inetment Trust plc (”Orava Residential REIT”, Business ID 2382127-4,
address Kanavaranta 7, 00160 HELSINKI) was established on 30 December 2010 as a real estate fund
as referred to in the Real Estate Funds Act. Its rules were approved bu the Finnish Financial
Supervisory Authority on 28 January 2011. The Finnish Financial Supervisory Authority has confirmed
the latest amendments on 25 March 2014. The current rules are appended to the financial statements.
Orava Residential REIT is a Finnish public limited company established under the laws of Finland. The
year 2014 was the company’s fourth financial period.
The company name in Swedish is Orava Bostadsfastighetsfond Abp and in English Orava Residential
Real Estate Investment Trust plc. Orava Asuntorahasto is the company’s auxiliary business name. The
company’s shares are included in the book-entry securities system. The company’s shares are listed on
the main list of Nasdaq Helsinki, and the trading code is OREIT.
The purpose of the company as a real estate fund under the Act on Real Estate Funds (1173/1997) is to
let residential and other real estate property which it owns or possesses due to its shareholding, to
engage in ordinary housing management and maintenance focusing on its own real estate property, to
exercise construction contracting on the company’s behalf and to finance all these operations. The
operations of the company aim to take advantage of the Act on the Tax Exemption of Certain Limited
Liability Companies Engaging in Apartment Rental Operations (the ”Tax Exemption Act” 299/2009).
Major events during the financial period 1 January – 31 December 2014
A total of 1,366,558 shares in Orava Residential REIT, the dividend rights of which became equal to
those of the listed shares in connection with the dividend payment of December, were combined with
the old shares in the book-entry system and admitted to trading on 3 February 2014.
After the shares listed in February and admitted to trading, 25,687 shares subscribed in the March 2013
share issue, the dividend rights of which differ from the aforementioned shares, still remained unlisted.
The company applied for them to be admitted to public trading on the stock exchange list of the Helsinki
Stock Exchange after their dividend rights became equal to those of the listed shares in December
2014.
On 6 February 2014, Orava Residential REIT's Board of Directors elected Pekka Peiponen, M.Sc.
(Econ.), as the CEO.
As decided by the General Meeting, a new condition was added to the rules for real estate investment
operations concerning the payment of the performance-based management fee (a "high watermark"
condition). According to the new condition, the performance-based management fee will only be paid if
the closing stock exchange price for the financial period is higher than the highest closing stock
exchange price for the previous financial periods adjusted for dividends, issues and splits.
The company acquired a total of 118 apartments through transactions made and an agreement
concluded on 31 March 2014. Their aggregate debt-free purchase price was EUR 12.7 million. A
residential property of 74 apartments at Maauunintie 14 in Vantaa was purchased from VATROhousing
Oy included in the SATO Group. Twenty apartments at Asunto Oy Tampereen Ruuti completed in June
2014 were acquired from Lujatalo Oy In addition, on 30 April 2014, a binding agreement was concluded
with Varma Mutual Pension Insurance Company on the purchase of the share capital of Asunto Oy
Helsingin Koirasaarentie 1 (24 apartments).
The company concluded a service agreement with Ovenia Oy at the end of June. The service
agreement covers housing management, property manager and apartment rental services. Some of the
properties acquired at the end of the period and the apartments located in them were given for
management by Ovenia Oy according to the agreement.
The company acquired a total of 131 apartments from A. Ahlström Real Estate Ltd and its subsidiaries
through transactions implemented on 25 June 2014. Their aggregate debt-free purchase price was EUR
4.1 million. The transaction included the assignment of a contribution in kind of EUR 1.34 million, which
12
was paid with 104,415 new shares issued by the company and the subscription of 206,708 new shares
in a directed issue allocated to the seller. The subscription price of the new shares, EUR 12.82 per
share, was the average price of the company's share on the Helsinki Stock Exchange during the five
trading days preceding 25 June 2014, the date of implementation of the transaction, weighted by share
turnover, adjusted for the dividends decided by the Annual General Meeting but not paid (EUR 0.56 per
share).
On 26 June 2014, the company concluded a binding agreement on the acquisition of a total of 26
apartments from Pohjola Rakennus Oy Sisä-Suomi at a debt-free purchase price of EUR 4.4 million.
The company concluded a convertible bond agreement of EUR 1 million with Erikoissijoitusrahasto
UBView on 26 June 2014. The convertible bond is primarily intended for financing acquisitions of
investment properties, and secondarily for the company's general working capital purposes. Under the
agreement, both parties have the right to convert the capital of the convertible bond into new shares in
the company. The subscription price of the share is the average stock exchange price weighted by the
share turnover on the date of presentation of the subscription notice for the new share in trading on
NASDAQ OMX Helsinki.
At the end of June, the company implemented directed issues of 418,923 shares, prepared a
prospectus and applied for the shares to be admitted to trading on the main list of the Helsinki Stock
Exchange (trading code OREITN0114). Trading in the new shares started on 30 June 2014. In the
directed issues, A. Ahlström Real Estate Ltd subscribed for 311,123 shares and Nordea Bank Finland
Plc for 7,800 shares at the subscription price of EUR 12.82 per share. In addition, the company
allocated a charge-free share issue of 100,000 shares to itself.
The acquisition of 26 apartments from Pohjola Rakennus Oy agreed in June 2014 was implemented
according to plan on 27 August 2014. The apartments purchased are located in three new properties:
As Oy Tampereen Vuoreksen Emilia (14 apartments), As Oy Jyväskylän Ahjotar (8 apartments) and As
Oy Jyväskylän Kyläseppä (4 apartments). The apartments were without tenants at the time of the
acquisition.
An agreement on the market guarantee for new shares (trading code: OREITN0114) was concluded
with Nordea Bank Finland Plc, and the market guarantee according to the agreement began on 7 July
2014. Under the agreement, Nordea Bank Finland Plc will provide a purchase and sale offer for a new
share in Orava Residential REIT so that the largest allowed difference between the purchase and sale
offer is 4% of the purchase offer. The offers shall include at least a number of shares the value of which
corresponds to EUR 4,000.
On 6 August 2014, Orava Residential REIT signed a second convertible bond of EUR 1 million in
accordance with the terms and conditions of the previous bond (26 June 2014) with
Erikoissijoitusrahasto UBView. The 80,000 new shares allocated by Orava Residential REIT to itself in a
charge-free issue on 7 August 2014 were recorded in the Trade Register on 15 August 2014. After the
issue, the number of the company's shares totalled 4,813,317 shares.
On 29 September 2014, Orava Residential REIT signed a convertible bond of EUR 1 million in
accordance with the terms and conditions of the previous bond (26 June 2014) with
Erikoissijoitusrahasto UBView.
The company acquired 58 apartments from Skanska at a debt-free price of EUR 13.5 million through a
binding agreement concluded on 30 September 2014. The apartments acquired are new and located in
Espoo, Kirkkonummi, Järvenpää, Tampere, Lempäälä and Raisio. The apartments were acquired
without tenants.
Through a transaction concluded on 30 September 2014, the company acquired 54 apartments from A.
Ahlström Real Estate Ltd in Kotka at an aggregate debt-free purchase price of EUR 1.45 million. The
transaction was financed through a directed issue allocated to A. Ahlström Real Estate Ltd, where A.
Ahlström Real Estate Ltd subscribed for 114,806 new shares issued by the company. The subscription
price of the new shares was EUR 12.63 per share, which was the weighted average price during the
five days of stock exchange trading preceding the beginning of the subscription period. In addition, the
13
company allocated a charge-free share issue of 80,000 shares to itself. The new shares did not entitle
their holders to dividends paid during 2014.
The 114,806 shares allocated by Orava Residential REIT to A. Ahlström Real Estate Ltd on 30
September 2014 in connection with a property acquisition and the 80,000 new shares allocated to the
company itself in a charge-free issue were recorded in the Trade Register on 8 October 2014. After the
issues, the number of the company's shares totalled 5,008,123. NASDAQ OMX Helsinki Oy ("the
Helsinki Stock Exchange") approved Orava Residential REIT's listing application concerning the issued
shares. The shares became subject to trading on 10 October 2014. The trading code of the shares on
the stock exchange list of the Helsinki Stock Exchange was OREITN0114.
The shares assigned by the company in accordance with the convertible bond agreements concluded
by the company in June and August were recorded under the company's equity items on 8 October
2014. The increase in the share capital was EUR 1.6 million, in addition to which the company's reserve
for invested unrestricted equity was increased by EUR 0.4 million. After the increases, the company's
share capital was EUR 49,057,130.00. After the registration of the number of shares, the imputed net
asset value per share was EUR 12.27 calculated using figures at the end of September.
The transaction including 59 apartments agreed with Skanska Rakennus Oy in September 2014 was
paid according to plan on 29 October 2014 The apartments purchased are located in six new properties:
As Oy Espoon Albert (4 apartments), As Oy Kirkkonummen Tammi (14), As Oy Järvenpään Saundi (8),
As Oy Härmälänrannan Nalle (3), As Oy Lempäälän Tikanhovi (17) and As Oy Raision Valonsäde (13).
The apartments were without tenants at the time of the acquisition.
On 28 November 2014, the company concluded a binding agreement on the acquisition of Asunto Oy
Kirkkonummen Kummikallio. The property includes 84 apartments. The purchase price of EUR 2.7
million will be paid in its entirety with new shares in the company's directed issue allocated to
Osuusasunnot Oy. The subscription price of the shares, EUR 11.33 per share, was the weighted
average price of the share during the five days of trading on the Helsinki Stock Exchange preceding the
date of concluding the agreement.
The company updated its strategy for 2015 on 17 December 2014. The strategic financial objectives
remained unchanged: the targeted total return on the share shall be at least 10% p.a., the targeted
dividend return shall be 7–10% p.a. on net assets per share, and the crediting rate shall be
approximately 50%. In addition to the financial targets, the main strategic targets are: increasing
shareholders' equity to EUR 90 million in 2015 and to EUR 200–300 million in the medium term,
diversifying the acquisition of debt financing, raising the economic occupancy rate to more than 95%,
dropping property management costs to 5% and repair costs to 10% below the statistical benchmark,
and increasing the amount of apartment sales to approximately 10% of the value of investment
properties on the opening statement of financial position. In addition, the regional and age distribution
targets for portfolio management were updated, and the acquisition criteria for apartments were
specified further.
On 31 December 2014, the company concluded a binding agreement on the acquisition of Asunto Oy
Rovaniemen Rekimatka 16–18 and Asunto Oy Rovaniemen Rekimatka 29. The properties include a
total of 80 apartments. The purchase price of EUR 4.0 million was paid with new shares issued by the
company in a directed issue allocated to Royal House Oy. The subscription price of the shares, EUR
10.60 per share, was the weighted average price of the share during the five days of trading on the
Helsinki Stock Exchange preceding the date of concluding the agreement.
In the fourth quarter, the company continued concluding convertible bond agreements in accordance
with the terms and conditions of the previous convertible bond agreements. Convertible bond
agreements were concluded to a total amount of EUR 2.0 million, of which EUR 1.99 million was
converted by 31 December 2014. Under the terms and conditions of the convertible bonds concluded by
the company, the company has assigned a total of 418,614 of its shares in conversions of its convertible
bonds during the period under review. At the end of the period, the company possessed 39,386 treasury
shares.
14
Result of operations and financial position
The Group’s revenue for 2014 totalled EUR 15.3 million (2013: EUR 9.7 million). The revenue was
divided into income from ordinary operations of EUR 6.5 million (2013: EUR 3.2 million) and capital
gains of EUR 8.8 million (2013: EUR 6.5 million). Income from ordinary operations includes rental
income, compensation for use and other income. Capital gains are made up of profit from sales of
investment properties less sales commissions for sold apartments, as well as the change in the fair
value of apartments.
Operating expenses totalled EUR 5.4 million (2013: EUR 2.2 million), of which maintenance costs and
annual repairs accounted for EUR 2.8 million (2013: EUR 1.5 million) and the performance-based
management fee EUR 0.8 million (2013: EUR 0.0 million). The growth in costs is mainly due to the
expansion of the operations.
Operating profit amounted to EUR 9.9 million (2013: EUR 7.4 million)
Financial income and expenses stood at EUR –1.4 million (2013: –639,000) and taxes for 2014 at EUR
94,000 (2013: EUR 48,000).
Profit for the period amounted to EUR 8.4 million (2013: EUR 6.8 million). Comprehensive income items
totalled –270,000 (2013: EUR 183,000), and comprehensive profit for the period was EUR 8.1 million
(2013: EUR 6.9 million).
Business operations
Investment properties and their fair value
Orava Residential REIT abides by the Real Estate Funds Act. According to section 10 of the Act, the
company must measure real estate properties, other thant those in its own use, at fair value on its
balance sheet.
Orava Residential Real Estate Investment Trust plc uses its own appraisal process and value
determination method in the measurement of the fair value of its investment properties. As of 1 January
2013, the fair value has been recognised in accordance with IFRS 13, Fair Value Measurement, which
entered into force on 1 January 2013. Accordingly, the profit or loss due to changes in fair value is
recorded through profit and loss in the period during which it was created. The Real Estate Funds Act
also requires that changes in fair value are recorded as income or expenses.
Changes in fair value are recorded in revenue. In line with the strategy of Orava Residential REIT,
apartments are sold individually to the market. The value of investment properties held by Orava
Residential REIT is the sum total of market values of individual apatments calculated using the price
measurement model.
Rental operations
Over the period under review, occupancy rates in rental operations were at a lower level year-on-year.
This was primarily due to the acquisitions made during the period, where the share of new apartments
without tenants was higher than in the comparison period. In addition, the prolonged poor economic
situation has made letting slightly more difficult.
The economic occupancy rate for the fourth quarter was 88.7%, while it was 89.4% for the entire period
under review.
At the end of the period, the company had a total of 1,294 residential apartments (2013: 772) and a total
of 1,318 apartments. There were 1,017 leases at the end of the period, and 62 apartments were for sale
(2013: 29).
15
1
Gross rental yield,%
Net rental yield,%
Economic occupancy rate,%
Operational occupancy rate,%
Tenant turnover/month, %
Jan – 31 Dec 2014
1 Jan – 31 Dec 2013
6,7
8,0
4,0
4,5
89,4
93,8
88,7
92,5
2,1
2,3
Of the entire lease base for residential apartments, 25 were agreements valid for a fixed term. A total of
237 agreements were terminated during the period (2013: 119).
Rent increase clause
It was decided in April 2013 that from the beginning of June 2013 the rent increase condition for new
leases will be the cost-of-living index plus 3.25%.
Acquisitions
Time
Property
31 Mar 2014 2 properties
(Helsinki, Vantaa)
and apartments from
1 property (Tampere)
Debt-free
purchase
price
(MEUR)
Company
loan
(MEUR)
Directed
issues
(shares)
Apartments
(number)
12.7
1.7
0
11
25 Jun 2014
4 properties
(Kotka, Riihimäki,
Savonlinna and Varkaus)
4.1
-
311,123
131
26 Jun 2014
Apartments from
3 properties (Tampere and
Jyväskylä)
4.4
3.4
-
26
30 Sep 2014 Apartments from
6 properties
13.5
10.9
-
59
30 Sep 2014 A property
from Kotka
1.5
-
114,806
54
28 Nov 2014 A property from
Kirkkonummi
6.2
3.5
235,922
84
31 Dec 2014 2 properties
from Rovaniemi
4.0
-
368,000
80
TOTAL
46.4
19.5
1,029,851
552
In the fourth quarter, the company acquired a property from Osuusasunnot Oy in Kirkkonummi at a
debt-free price of EUR 6.2 million through a binding agreement concluded on 28 November 2014. The
property includes 84 apartments. The transaction was implemented according to the agreement on 5
January 2015. The transaction was financed through a directed issue allocated to Osuusasunnot Oy,
where Osuusasunnot Oy subscribed for 235,922 new shares issued by the company. The subscription
price of the new shares was EUR 11.33 per share, which was the weighted average price during the
five days of stock exchange trading preceding the day the agreement was concluded.
16
In addition, the company acquired two properties from Royal House Oy in Rovaniemi at a debt-free
purchase price of a total of EUR 4.0 million through a binding agreement concluded on 31 December
2014. The properties include a total of 80 apartments. The transaction was finalized according to the
agreement on 9 February 2015. The transaction was financed through a directed issue allocated to
Royal House Oy, where Royal House Oy subscribed for 368,000 new shares issued by the company.
The subscription price of the shares was EUR 10.60 per share, which was the weighted average price
during the five days of stock exchange trading preceding the day the agreement was concluded.
Apartment sales
During the period under review, the company sold a total of 29 apartments from twelve different housing
companies. The debt-free selling prices of the apartments totalled EUR 2.9 million. The sales of
apartments picked up slightly during the autumn, and the apartment sales during the fourth quarter
totalled EUR 0.9 million. In addition, the company sold two plots during the period, the aggregate selling
price of which was EUR 2.75 million. The housing companies located on the plots concluded leases
with the new owner. The sales from the investment portfolio totalled EUR 5.7 million. The brokerage
fees for the sales amounted to EUR 115,000.
In accordance with the company's investment strategy, the aim is to annually sell apartments for 10 per
cent of the value of the investment properties on the company's opening statement of financial position.
The sales of apartments are implemented by selling apartments released from rental use individually. In
2014, the sales of investment properties corresponded to slightly more than 7% of the value of
investment properties on the opening statement of financial position.
Investment properties on 31 December 2014
The fair value of investment properties at the end of the period totalled EUR 130,7 million (31 December
2013: EUR 79.2 million). Orava Residential REIT had a total of 1,318 apartments on 31 December 2014
(31 December 2013: 791), the aggregate leasable surface area of which was approximately 82,2 m2
(31 December 2013: 50,1 m2). The apartments were located at 63 different housing companies, where
the company's holding was 100% in 16 of the cases. More detailed information on the investment
properties is presented in the tables section.
Age and regional distributions of the investment portfolio (EUR at fair
values)
Newer (1990 ->)
Older (– 1989)
Helsinki Region
Major towns
Medium-sized towns
31 Dec 2014
58%
42%
43%
23%
34%
31 Dec 2013
56%
44%
38%
19%
43%
The values of the apartments owned by the REIT are measured at fair value at least on a monthly basis,
and are published at least on a quarterly basis, but always when a change in the REIT's economic
situation requires it, or when changes in the condition of the real estate have a material impact on the
value of the holdings of the REIT. A more detailed account of the apartment price measurement model
is presented in the 2014 financial statements.
Financing
Financial expenses (net) totalled EUR 1.4 million for the period 1 January –31 December 2014 (2013:
EUR 639,000), and amortisation of the parent company's loans from financial institutions totalled EUR
3.1 million. The parent company's financial institution loans are hedged in their entirety in terms of
interest rates through interest rate swaps concluded with Danske Bank.
The long-term interest-bearing loans of Orava Residential REIT and the company loans allocated to the
shares in housing companies totalled EUR 58.1 million on 31 December 2014 (31 December 2013:
EUR 37.3 million).
17
In addition to these, the long-term loans on the statement of financial position also include EUR 478,000
in rental deposits paid by tenants (31 December 2013: EUR 251,000).
Major events after the financial period
The 500,000 shares allocated to the company itself in a charge-free directed issue on 17 December
2014 were recorded in the Trade Register on 5 January 2015. The company may use the shares
allocated to it to strengthen the capital structure, develop its business operations and expand its
ownership base through both acquiring investment properties and issuing convertible bonds. After the
issue, the number of the company's shares totalled 5,706,123. On 19 January 2015, the company
submitted a listing application for 47,800 shares to be admitted to trading on the stock exchange list of
the Helsinki Stock Exchange as of 20 January 2015. After the listing, the total number of the company's
listed shares was 5,253,923.
On 23 January 2015, the company specified the result estimate for the fourth quarter. Orava Residential
REIT estimated in its interim report for the third quarter published on 7 November 2014 that the financial
result for the fourth quarter is expected to remain weaker than that for the third quarter. The
comprehensive profit for the third quarter was EUR 1.9 million. The company's further specified estimate
of the result for the fourth quarter was EUR 1.7–2.3 million.
On 23 January 2015, the company announced that it is investigating possibilities for the implementation
of a financing arrangement of an estimated EUR 40 million. The arrangement would consist of a credit
facility of an estimated EUR 15 million, which would be used to finance the acquisition of new
properties, and a covered bond of an estimated EUR 25 million, which would mainly be directed to
domestic institutional investors and whose purpose would be to refinance the company's existing loans
and promote the expansion of the company's business operations.
The Financial Supervisory Authority approved the company's prospectus, which is related to the listing
of a total of 1,056,122 shares, on 23 January 2015. The shares are related to the directed issue
allocated to Osuusasunnot Oy (235,922 shares), communicated by the company on 28 November
2014, the directed issue allocated to Royal House Oy (368,000 shares), communicated on 31
December 2014, and the charge-free directed issue allocated to the company itself (500,000 shares).
The company also filed an application with the Helsinki Stock Exchange concerning the admission to
trading of the shares subscribed in the directed issue allocated to Osuusasunnot Oy and the chargefree shares allocated to the company itself, in total 688,122 shares, on the stock exchange list of the
Helsinki Stock Exchange with the trading code OREIT. Trading in the shares in question started on 27
January 2015. The ISIN code of the shares listed is FI4000068614.
The 368,000 shares allocated to Royal House Oy were recorded in the Trade Register and applied to
be admitted to trading on the Helsinki Stock Exchange in connection with the finalization of the
transaction on 9 February 2015. In addition, the company allocated a charge-free share issue of
200,000 shares to itself. The shares allocated to the company itself do not entitle their holders to
dividends to be paid from the result for 2014 in 2015. After the aforementioned shares have been
registered, the number of the company's registered shares totals 6,510,045, and the company's
registered share capital is EUR 56,376,500.
On 10 February 2015, the company implemented a transaction for 22 apartments with Skanska
Rakennus Oy at a debt-free purchase price of EUR 4.6 million. The apartments purchased are located
in two new properties, one in Mikkeli (12 apartments) and the other in Pori (10). The apartments were
without tenants at the time of the acquisition.
At its meeting on 11 February 2015, the Board of Directors allocated 39,952 shares to the management
company Orava Funds plc. The subscription price of the shares was the weighted average price during
the last five days of stock exchange trading in 2014. Orava Funds plc set off the payment of the
subscription price against its performance-based management fee receivable of EUR 423,491.20 to be
paid in shares.
18
Operating environment
National economy
Finland's GDP growth is estimated to have settled in the range –0.4% – 0.0% in 2014, and it is
forecasted to remain in the range +0.1% – +1.0% in the current year. The change in private
consumption that has a key impact on the housing market is estimated to have been approximately –
0.4% – +0.2% in the ended year and to be –0.2% – +0.9% in 2015. The market interest rates in the euro
area have continued to fall, and short-term rates are also expected to remain at less than one per cent
for the next four to five years. The estimate is based on the most recent economic forecasts by 15
parties drawing up forecasts on the Finnish economy and the market interest rate expectations
calculated on the basis of the euro interest rate curve published by the European Central Bank.
The housing market is estimated to start strengthening slowly as a result of the picking up of overall
economic activities in 2015.
Demand in housng market
During October–December 2014, households drew down EUR 3.9 billion in new mortgages, or 6% more
than a year previously according to statistics from the Bank of Finland. The euro-denominated mortgage
base totalled EUR 89.8 billion at the end of December, and the annual growth in the mortgage base was
1.7%.
The average marketing period for old apartments in the country overall according to the Finnish
Etuovi.com portal increased from 112 days in September to 135 days in December, while it was 109
days in December in the previous year.
The demand for apartments has continued to be weak during the end of the autumn and beginning of
the winter.
Supply in the housig market
According to Statistics Finland, building permits for apartment blocks were granted for 816 apartments
in October, which was 15% less than a year previously. Correspondingly, in January–October, a total of
14,840 building permits were granted for apartment block apartments, or 22 % more than a year
previously. The annual change in the sliding annual sum of building permits granted for apartment
blocks was +25 %.
The three-month change in the housing construction volume index that describes the value of on-going
new construction was +12% in August, and the change year-on-year was –17%.
The supply in the housing market has continued at a low level, even though some signs of a potential
turn are visible.
Prices, rents and return in the housing market
In the fourth quarter of 2014, the rents of non-subsidised apartments increased by 3.0% year-on-year.
The change in the prices of apartments during the fourth quarter was –1.0% year-on-year. The ratio of
housing prices to rents is slightly below the long-term average; the ratio calculated from the square
metre prices and rents of the fourth quarter was 15.5. The 40-year average for the ratio of square metre
prices to annual rents in Finland is 16.7.
During the next 12 months we expect housing prices throughout the country to remain approximately
the same or at the end of period start rising slightly and the growth rate in rents for non-subsidised
apartments to remain approximately the same if the market interest rate expectations and economic
forecasts prove to be accurate with regard to their essential components affecting the housing market.
Outlook for Orava Residential REIT
Orava Residential REIT estimates that it has reasonably good preconditions for maintaining
good profitability in 2015 and achieving the targeted total return of 10 per cent on
shareholders' equity.
19
The value of the apartments in the investment portfolio is expected to remain at the same level
or at the end of period to start increasing moderately as a result of the predicted strengthening
of the overall economy. The rental income is estimated to rise slightly, as we believe that we
can increase the economic occupancy rate compared with the previous year. The result
impact of the acquisition of properties is expected to remain at the level of the previous year.
The ratio of maintenance and repair costs to the value of investment assets is also expected to
remain approximately at the level of the previous year.
Research and development
The company continues to invest resources into developing and growing its real estate fund business
and into developing other services in cooperation with management company Orava Funds plc. The
extent of development activities is largely based on the actual growth and cash flow funding.
Management of the company
The company's Board of Directors has six members. Four ordinary members were elected for the Board
of Directors with the company's Memorandum of Association. The following persons have been
members of the Board since the company was established: Jouni Torasvirta, chairman (born in 1965,
M.Sc. Econ., CEO of Orava Funds plc), Tapani Rautiainen, deputy chairman (born in 1957, M.Sc.
Econ., chairman of the Board of Maakunnan Asunnot Oy), Veli Matti Salmenkylä (born in 1960, M.Sc.
Tech., financial and administrative director of Orava Funds plc) and Timo Valjakka (born in 1960, LL.B.,
CEO of Maakunnan Asunnot Oy). The extraordinary GM held in June 2013 elected Mikko Larvala (born
in 1966, LL.B. M.Sc. Econ., senior counsel at Bird & Bird Attorneys-at-Law), and the extraordinary GM
held in September 2013 elected Peter Ahström (born in 1964, B.Sc. Tech., CEO of A. Ahlström
Kiinteistöt Oy) as Board members. The members of the Board have in total over 60 years experience in
the real estate industry and over 40 years experience in the securities market.
The Board of Directors convened 23 times during the financial period, and the attendance rate during
the period was 97%. The Board of Directors assesses that its members Veli Matti Salmenkylä and Jouni
Torasvirta are independent of the major shareholders of the company, Tapani Rautiainen and Timo
Valjakka are independent of the company, and Mikko Larvala and Peter Ahlström are independent of
both the company and its major shareholders.
The AGM held on 18 March 2014 revised the Board members' fees. Until the end of March 2014, the
Board members received a monthly fee of €600, the Chairman of the Board a monthly fee of €1,000,
and Board members received a fee of €200 per meeting and the Chairman a fee of €400 per meeting.
From April 2014, the Board members received a monthly fee of €900, the Chairman of the Board a
monthly fee of €1,500, and Board members received a fee of €300 per meeting and the Chairman a fee
of €600 per meeting.
The Board members' fees totalled €107,000 in 2014.
Jouni Torasvirta
Peter Ahlström
Mikko Larvala
Tapani Rautiainen
Veli Matti Salmenkylä
Timo Valjakka
EUR 1,000
29
16
16
15
16
16
Remuneration paid to Board members Board members are not in an employment relationship with
Orava Residential REIT.
On 6 February 2014, the Board of Directors of Orava Residential REIT appointed Pekka Peiponen as
the CEO. Orava Residential REIT does not pay a salary to its CEO.
Orava Residential REIT's auditor is PricewaterhouseCoopers Oy, with Eero Suomela, Authorised Public
Accountant, as the chief auditor. The auditor is paid a fee in accordance with the invoice.
20
Management company Orava Funds plc
Orava Residential REIT was established at the initiative of Orava Funds plc. Orava Funds had acted as
the management company of Orava Residential REIT ever since it was established on 30 December
2010.
Orava Funds is responsible for the organisation, management and development of the operations and
administration of Orava Residential REIT and prepares its business strategy and annual budget.
The personnel of Orava Residential REIT are part of the business organisation of the management
company. The management company is responsible for the personnel expenses incurred from the
operational activities of the Orava Residential REIT.
As compensation for the management services, Orava Residential REIT pays the management
company 0.6% of the fair value of the assets of the REIT as an annual fixed management fee and 20%
(plus VAT) of the annual return on the REIT, calculated on the basis of the change in the Trust's share
price and the dividends paid, exceeding the hurdle rate of 6% as a performance-based management
fee.
The fixed management fee is calculated on a quarterly basis, and the value is considered to be the
latest fair value of the assets according to IFRS in the previous quarter. The fixed management fees
during the period under review (1 January – 31 December 2014) amounted to € 613.5 thousand.
The performance-based management fee will only be paid if the closing stock exchange price for the
financial period is higher than the highest dividend, issue and split-adjusted closing stock exchange
price for the previous financial periods.
The performance-based management fee for 2014 was EUR 0.8 (2013: EUR 0). On 23 January 2015,
the Board of Directors and management company of Orava Residential REIT decided to amend the
management agreement so that, in the calculation of the performance-based fee, net assets per share
will be used as the closing price instead of the stock exchange price if they are lower than the stock
exchange price.
Half of the performance-based management fee can be paid in the REIT's own shares.
Risks and risk management
Risk management at Orava Residential REIT is based on an ability and willingness to bear risks,
knowledge of major risks and the decided risk management policy. Risk management is part of daily
operations and part of business management.
The goal of risk management is to identify the main uncertainties associated with achieving the targets,
to measure and assess the risks identified in advance and to decide on the actions to be taken
regarding them. Major risks are classified into strategic and operative risks as well as financial and
damage risks.
Risks are taken as an inherent part of business, and they are assessed both from the perspective of
utilising the possibilities associated with them and from the perspective of mitigating and eliminating
them.
Risk management is integrated as part of the strategy process, operations management system and
business processes of Orava Residential REIT. The ultimate responsibility for risk management lies with
the Board of Directors of Orava Residential REIT. It decides on the objectives of risk management,
confirms the general principles of risk management, defines the duties and responsibilities and monitors
major risks. Orava Funds, the management company of Orava Residential REIT, is responsible for the
organisation, management, development and reporting of risk management. The business organisation
is responsible for the identification and assessment of any risks affecting its operations.
The risk management system is based on monthly reporting which monitors the development of the fair
value of investment assets, the financial position, revenue, profitability, sales, trade receivables,
expenses and, through them, the result trend. As part of risk management, the Board of Directors
discusses and approves, at least annually, the authorisations regarding access to accounts etc.
21
The risks involved in Orava Residential REIT's business operations are regularly assessed as part of
the company's annual planning and strategy process, the preparation and decision-making process
concerning agreements related to the acquisition of investment assets and other agreements, and other
operational activities. The company seeks to manage risks through risk surveys and actions taken on
their basis, as well as through systematic monitoring and market analyses.
Most significant risks
As part of the annual planning process, the most significant assessed through a risk survey where key
risks are identified, the likelihood of their being materialised and their impact if materialised are
estimated and the risk management methods are defined. The risk survey was conducted in the autumn
of 2014 as part of the company's annual planning and strategy process. If materialised, any of the risks
described below may have a materially detrimental impact on the company's business operations,
financial position, operational result and future outlook.
Risks related to the prevailing macroeconomic situation
The uncertain global economic and financial market conditions may have an unfavourable impact on the
company's business operations, operational result, financial position, solvency and sources of capital.
The global debt crisis and the ensuing global recession which started in 2008 have had a negative
impact on general business conditions, increased unemployment and reduced the confidence of
entrepreneurs and consumers in the economy. Despite the enhanced measures taken by a number of
governments, regulatory authorities and central banks round the world, the recovery of the economy
has been slow. Recently, the general economic conditions in Europe and elsewhere in the world have
increasingly reduced the foresee-ability of the economy. There is also a risk that the global economy will
descend into recession.
Even though the result of the company's business operations and the values of investment properties
have remained fairly stable until now, the uncertainty in the global economy and the financial market
may, however, affect the company. The current uncertainty and lack of foreseeability in the financial
market and the macroeconomic conditions have had a detrimental impact on the availability of financing
and have increased the price of capital. It may also be hard for the company to secure external
financing for its investments on competitive terms and financing may become more difficult due to
decreased supply or growth in interest margins. Even though the company believes that its capital
structure and financing will generate sufficient liquidity, there can be no certainty that changes in
financial markets will not affect the company's solvency and availability of financing, or that the sources
of financing will provide sufficient liquidity in all situations and at all times. The continuing European
sovereign debt crisis, potential unfavourable development of macroeconomic conditions and the
continuing uncertainty in the financial market may have an adverse impact on the company's business
operations, financial position, operating result, future outlook and share price.
The uncertain global economic and financial market conditions have had a negative impact on the
Finnish economy, A slow-down in the economy or a recession, regardless of its depth, or any other
economic development in Finland may impact on the company's business operations in a number of
ways by affecting income, assets, solvency, business operations and/or the financial situation of the
company and its tenants or potential investors. The value of residential apartments typically follows any
fluctuations that occur in the economy The value of residential apartments is impacted by a number of
factors, such as interest rates, inflation, economic growth, the business environment, availability of
financing, taxation and activity of construction. If the general economic situation weakens or the prices
of apartments decline for some reason, it is possible that the value and yield of investment properties
and the value of the company decrease. Great uncertainty also prevails in the future development of the
economy. The company will not necessarily be able to utilise opportunities resulting from economic
fluctuations or adapt to a long-term recession or depression. In addition, even though slow-downs in
economic growth and recessions have historically increased the demand for rental apartments in
Finland, it is possible that the demand for rental apartments will, however, decrease when the economy
slows down or declines.
22
Risks related to the company’s business operations
The company does not necessarily find suitable investment properties or it may be challenging and
difficult for the company to acquire investment properties that meet the company's goals. There can also
be no guarantees that the investments made by the company will be successful in all circumstances.
The opportunities for acquiring investment properties that meet the goals may weaken materially as a
result of increased competition in the housing market, for example, in which case the targeted yields
may not necessarily be met. There can also be no certainty that it is possible to acquire investment
properties within the planned schedule or at all. It is possible that the company cannot acquire
apartments from the planned regions. The acquisition region may thereby become considerably smaller
than planned, in which case it is not possible to distribute the apartment portfolio in the planned scope.
As a result, the regional risk may increase and yield may decline.
The attractiveness of an investment property from the point of view of potential tenants is affected by its
location, for example. The regions in which the company's investment properties are located may
become less attractive. The appeal of an individual region may change considerably over time, which
may have an adverse impact on the yield and rentability of investment properties located in the region in
question. As the company's current investment properties are focused on the Helsinki Region and
specific major and medium-sized Finnish cities, the company's business operations are dependent on
the development of these regions and the general development in the Finnish economy.
The housing market is sensitive to fluctuations in demand and supply. The prices of apartments in
Finland have historically followed the macroeconomic development. The cost level of housing and rental
housing is impacted by a number of different factors, such as regulation, interest rates, economic
growth, the availability of loan financing and taxation. Changes in demand and supply resulting from
new production, investors' demand and supply and other factors may also have a material impact on
housing costs and rental housing. A decrease in housing costs is likely to have a direct impact on the
fair values of the company's apartment portfolio.
It is possible that the liquidity of the investment properties acquired by the company weakens, in which
case fewer properties may be sold than planned or they may not be sold at all at the planned prices and
on the planned schedule. A number of factors beyond the company's control affect the sales of the
company's investment properties, such as the availability of bank financing to potential buyers, interest
rates and the demand for and supply of similar apartments. A potential lack of liquidity in the housing
market may restrict the company's opportunities to sell its apartments or change its investment portfolio
at the right time due to the economic situation or other circumstances. It the market is not sufficiently
active or is illiquid, there can be no certainty of whether the company will be able to implement sales as
expected or at all.
The company obtains a certificate of valuation and a condition assessment for the investment properties
in relation to the acquisition of each investment property. However, when acquiring investment
properties, the company's estimate of the condition of the property is only based on the condition of
some residential apartments located in the property. Accordingly, there can be no certainty that the
condition of all of the residential apartments corresponds to the assessments made in advance, in which
case the company may incur additional expenses. After the acquisition of investment properties,
Newsec Asset Management Oy or Ovenia Oy inspects the condition of each apartment.
It takes a significant part of the company management work effort to make the acquired apartment
portfolio generate rental income according to targets. Forecasting market rents is associated with
uncertainty, and market rents may be realised at a lower level than forecasted, in which case the
company's yield declines. The demand for rental apartments is also associated with uncertainty. The
occupancy rate of the company's properties and tenant turnover depend on general economic factors.
The occupancy rate has a signifi cant impact on the company's operations. Tenant turnover incurs costs
for the company resulting from the signing of leases or minor renovations usually performed when a
tenant moves out, for example. However, the company strives to keep the occupancy rate of investment
properties it lets at a high level by performing repairs in the investment properties. In addition, the
company may incur losses from unpaid rental receivables.
The leases concluded by the company with its tenants are valid until further notice. The tenant may
terminate the rental relationship at one month's notice. Therefore, the agreements valid until further
notice include a risk that notice may be given to terminate a significant number of leases within a short
23
period. In such cases, it may be difficult for the company to conclude a sufficient number of replacement
leases within a short period.
According to the Real Estate Funds Act, the company shall measure apartments and real estate in other
than its own use at fair value on its balance sheet. In addition, the change in the fair value of the
company's apartments and real estate is recognised through profit or loss as a valuation gain or loss for
the period during which it arises. Due to this, the company may become subject to significant gains or
losses from the changes in the fair value of apartments and real estate regardless of whether they are
sold. The company may suffer harm due to valuation losses from apartments and real estate, even
though the company's business operations are profitable. This may lead to a breach of specific
covenants. If it is not possible to change or become released from the covenants of debt obligations,
this may have an adverse impact on the terms and conditions of the company's financing.
The company regularly performs renovation and maintenance repairs in apartments and real estate. It is
also possible that large repair needs appear simultaneously in a number of apartments and properties
acquired by the company.
The costs of modernisation and maintenance repairs are significant and mainly related to pipe repairs,
facades, roofs, windows and balcony renovations. The pipes of residential buildings must typically be
repaired at approximately 40-50-year intervals, usually including the repair of both water and sewage
pipes. Facades, roofs and balconies must be renovated at approximately 25–35-year intervals. The
company expects the current repair and maintenance costs of its properties to remain at approximately
the same level in proportion to the size of the company's apartment portfolio in the future. In any case,
renovation and maintenance repair costs may increase due to apartment energy efficiency
requirements, for example, and therefore, there can be no certainty that the amount of investments
made by the company in renovation and maintenance costs will not significantly increase from the
company's current estimate.
It is also possible that tenants cause significant damage to apartments. If insurance companies or
tenants do not indemnify the damage caused, the company may have to bear the liability for potential
repair costs. Large unexpected repairs and repair costs may lead decreased solvency, a decline in the
occupancy rate, loss of rental income and lower profitability. The company may also become liable to
indemnify any damage caused or become involved in legal proceedings, which may harm the
company's and its partners' public image.
The fair value of the company's apartment portfolio is determined monthly using a comparable sales
multi-variable regression method using asking price material obtained from the Oikotie.fi service and
certain other purchase price material. Even though the company attempts to ensure the correctness of
its valuation methods by using an external valuer, the company's measurement model is not necessary
suitable for all investment properties. There may be errors in the source material for the measurement,
or a human error may take place in the measurement. Therefore, there can be no certainty that the
company's valuations precisely reflect the value of the company's investment properties and their
accessory asset items at any particular time. As a rule, the results of the model cannot be generalised
to apply to apartments that deviate from the material used in the measurement in terms of their age,
surface area or other key characteristics. It is also possible that the function form common to all cities
used in the modelling is not optimal for every submarket to be estimated. Transparency has been
emphasised in the choice of the estimation method at the cost of higher technical complexity in the
calculation. Finally, it is also possible that there may be a programming error in the software used for
estimation, although attempts are made to prevent this by using the latest versions of the software.
According to the general market practice in real estate fund operations, a separate management
company provides specific services needed by the company. Due to this, the company has concluded a
management agreement with Orava Funds plc. In accordance with the management agreement, the
company alone is liable for the risk caused by its investment operations and the risks related to
24
apartments and the company's other assets, and the responsibility of the management company is
limited.
The management agreement is valid for a fixed term until the company's shares are subject to trading in
a regulated marketplace, after which it continues until further notice with a period of notice of 12 months
for both parties. The services provided by the management company are essential from the point view
of the continuity of the company's business operations, so the company is to a certain extent dependent
on the services provided by the management company.. If notice is given to terminate the management
agreement, the company will have to quickly obtain a new service provider. There can also be no
certainty that a corresponding service provider is found, or that that the company succeeds to conclude
a corresponding agreement regarding the terms and conditions. In addition, the company's main
financing bank has the right to call in the loans provided to the company prematurely if the management
company or its direct or indirect owners change, and, in such cases, the company is obligated to
compensate for the costs incurred by the lender bank from this.
Excluding the CEO, the company has no personnel of its own, due to which the key persons employed
by the managing company that act as the company's agent have emphasised significance for the
company's success. It is possible that persons employed by the management company change, the
expertise of the persons involved in the operations becomes outdated, their ability to manage their tasks
deteriorates, or the agreement concluded with the management company expires and the company
does not manage to conclude a corresponding replacement agreement.
In its business operations, the company uses service providers it considers reliable. The company has
an agreement with Newsec Asset Management Oy and Ovenia Oy on apartment management services,
financial administration tasks and apartment rental, and with Realia Management Oy, Newsec Asset
Management Oy, Turun Seudun OP-Kiinteistökeskus Oy and Päijät-Hämeen OP-Kiinteistökeskus Oy
on the semi-annual appraisal of the real estate securities owned by the company. In addition, the
company has mainly used Raksystems Anticimex Oy for making condition assessments.
The ability of service providers to deal with their tasks may deteriorate, or they may discontinue their
operations. The company may not necessarily be able to conclude agreements with service providers
on acceptable terms and conditions or the quality of the services they provide may not be sufficient. Any
of these issues may affect the ability of the company to implement its projects on time and within the
agreed budget and cause additional costs to the company.
The investment properties acquired by the company shall be in accordance with the provisions on the
environment, health and safety laid down in Finnish legislation and other related regulation. Investment
properties may be in conflict with applicable statutory provisions; for example, they may contain
construction materials hazardous to health. Any such event or a significant decrease in the value of
investment properties which is not known or identifiable when investment properties are acquired or
becomes evident at a later stage may have an adverse impact on the company. To ensure lawfulness, it
may be necessary to make special investments in the removal, improvement or replacement of
construction materials or structures, Correspondingly, the removal or cleaning costs of contamination,
damage, stress or an adverse impact may be higher than expected. In addition, incompliance with
regulations or the need to comply with new, stricter regulations may lead to higher costs or weaken the
development of the company's operations. Even though the company has so far not been held
responsible for measures related to the environment, health or safety, there cannot be full certainty that
the company could not be held responsible for such measures in the future. Any of the risks described
above may, if materialised, have an adverse impact on the company's business operations, financial
position, result of operations, future outlook and the value of the company's shares.
In the company's view, its insurance coverage is typical for the industry. For example, all the investment
properties owned by the company have valid, full value, real estate insurance. This full value, real estate
insurance cover includes property insurance cover, real estate ownership liability cover, the CEO's and
25
Board of Directors' liability insurance and legal expenses insurance. In addition, the company and the
management company have a joint administration liability insurance policy. However, the insurance
policy includes releases from liability and limitations of liability with regard to both amount and loss
events. The company has no insurance cover for damage that is not insurable or for which insurance
policies are not available on financially reasonable terms. There can also be no certainty that notice will
not be given to terminate the company's current insurance cover or that it is available on financially
reasonable terms in the future. If assets of the company which it has not insured suffer damage or the
damage caused exceeds the maximum amount indemnified, the company may have to obtain additional
financing to repair or rebuild the damaged asset, or the company may lose the value of the damaged
asset in part or in its entirety.
With regard to specific company functions, the company is dependent on information systems
developed by third parties. In such cases, the company is also dependent on the ability and willingness
of the parties in question to continue developing and maintaining the software and the ability of the
company itself to use the information systems in question efficiently and utilise new technology and
systems, as well as security and backup systems. Such information systems comprise telecommunication systems and software applications which the company uses to control its business
operations, manage its apartment portfolio and risks, prepare operational and financial reports and carry
out cash transactions. If malfunctions appear in the information systems, the company may incur
considerable financial losses and customer liabilities, the company's reputation may be harmed, and the
company may also become subject to measures from the authorities.
The company's ability to attract investors and tenants and implement transactions may decline if the
company's reputation is harmed. If the company is not able, or it appears that it is not able, to solve
problems potentially causing a risk to its reputation, the company's preconditions for conducting its
business may deteriorate materially. A risk to reputation may be caused by conflicts of interest,
legislation and regulation, legal risks related to the company's business operations, credit, liquidity and
market risks, conflicts with ten ants and other contracting parties and similar issues.
Even though the company complies with documented guidelines and procedures in the identification,
supervision and management if risks, these guidelines and procedures do not necessarily recognise all
risks, and the risks may be significantly higher than forecasted. A failure to identify, monitor and manage
these risks may have an adverse impact on the company's business operations, financial position, result
of operations, future outlook and the value of the company's shares.
Risks related to legislation
The company operates in a regulated and supervised industry. Potential changes in regulation that is
material from the company's point of view (such as regulation related to health, safety, the environment,
company law, auditing or taxation), authorities' measures, requirements set by the authorities, the
manner in which the laws, regulations and measures in question are enforced or interpreted and the
application and enforcement of new laws and regulations are beyond the company's control. Potential
changes may have adverse effects on the company's business operations, operational result and/or
financial position. Any changes may require that the company adapt its business operations, assets or
strategy. In addition to regulations that directly influence the company's business operations, the
company's business operations, operational result and/or financial position may be indirectly affected by
additional or stricter regulations that concern the letting of the company's investment properties or the
company's operating environment. Potential amendments to the Tax Exemption Act can be referred to
as an example.
In its operations, the company strives to comply with the Real Estate Funds Act and the rules for real
estate investment operations, as this is a requirement for the tax benefits received by the company.
However, there can be no certainty that the company will be able to comply with the Real Estate Funds
Act and the requirements set in the rules for real estate investment operations in all market situations
the Real Estate Funds Act has as yet been developed in the company's industry.
26
The threat imposed for any neglect of the obligations and limitations set in the Tax Exemption Act is, by
default, elimination from the system, in which case the company would fall within the sphere of normal
income taxation. Elimination from the system would cause additional tax consequences for the
company, as undistributed earnings and amounts transferred from earnings to other equity items during
the tax exemption period less the amount of dividend distributed during the said tax year would be
added to the company's taxable income.
In addition to the threat of being eliminated from the system, the law also includes tax sanctions. The
company may become partially liable to pay tax (i) if the amount of rental income received by the
company from its investment properties during the tax year is less than 80 per cent of the company's
total income, excluding disposal prices of assets in residential use; (ii) if a shareholder's holding in the
company's share capital is at least 10 per cent on the dividend record date (according to the preliminary
ruling issued by the Large Taxpayers' Unit on 5 September 2013, 30 per cent before 31 December
2014); or (iii) if the company disposes of its assets in residential use which the company has owned for
less than five years. The company cannot control its shareholdings because the company's shares are
subject to public trading and it has no information on the holdings of nominee-registered owners. For
this reason, it is possible that the holding of a shareholder exceeds the limit of 10 per cent or that the
holdings of nominee-registered shareholders are interpreted to exceed the limit of 10 per cent, which
may cause erroneous or unfavourable interpretations of the company's tax treatment.
The intention is to implement the Alternative Investment Fund Managers Directive (2011/61/ EU), i.e.
the AFIM Directive, in Finland on estimate in March 2014 through the Alternative Investment Fund
Managers Act ("the AFIM Act"). The AFIM Act lays down provisions on the licences, operating
preconditions and reporting obligations of alternative investment fund managers. It is the intention of the
company's management company to become an alternative investment fund as referred to in the AFIM
Act by applying for the necessary licence from the Financial Supervisory Authority within the time limit
set in the AFIM Act. The requirements of the AFIM Act have not been specified in Finland, and
uncertainty factors associated with the application of the legislation may have a materially detrimental
impact on the operations of the management company and thereby also the company, which may have
to conclude an agreement with a new management company that has the appropriate licence. The
AFIM Act also lays down specific requirements for the organisation of the operations referred to in the
Act, the marketing of the alternative investment fund and the custody of the assets, which may increase
the costs of the management company.
Financing risks
Even though the company has striven to hedge its loans from financial institutions with interest rate
swaps in accordance with its hedging strategy, changes in market interest rates and margins may have
an unfavourable impact on the company's business operations. In addition, as the company loans of
housing companies are not hedged, they are exposed to changes in interest rates. Even though the
company strives to monitor interest rate developments and manage its interest rate risk, the possibility
that the company fails to manage its interest rate risk cannot be excluded.
The company's business operations and the maintenance of its ability to pay its debts require a
sufficient cash flow which is generated by rental operations and the disposal of investment properties.
Even though, at present, the cash flow from operational activities added by the disposal of investment
properties generate sufficient assets for the company to meet its debt servicing requirements and the
company's ability to acquire new financing is sufficient, there can be no certainty that the company can
maintain such cash flow and a sufficient financial structure in the future.
The company's working capital financing is managed through a bank account overdraft facility
agreement of €200,000. The company's valid bank loans are five-year bullet-type loans, the first of
which falls due on 29 March 2016. In accordance with normal financing practice, the company is
negotiating on the refinancing of its loans with providers of financing. However, the company may not
necessarily achieve better terms and conditions or even terms and conditions of the current level in the
27
negotiations concerning refinancing. In addition, the availability of new debt affects the company's ability
to acquire new investment properties.
The company's loan agreements include financial covenants, such as loan to value, loan servicing
margin and equity/assets ratio covenants. Breach of these covenants or inability to achieve the required
financial key figures may lead to a situation where the company neglects its debt obligations. Even
though the company considers that its financial situation is good, breach of the covenants in question
may lead to a situation where the company has to renegotiate its financing, due to which the terms and
conditions of financing may weaken or the availability of financing may become more difficult, and this
may cause the company to incur additional costs.
The loan to value ratio may have a significant impact on the company's business operations, such as (i)
restricting the company's ability to acquire additional financing on corresponding or more favourable
financial and other terms and conditions to finance its future working capital needs, investments or other
general business needs; (ii) restricting refinancing opportunities, which may, in turn, restrict the
company's ability to react to market conditions and economic downturns; (iii) requirements that a
significant portion of the cash flow from the company's operational activities is used for paying loan
capital and interest, which would reduce the funds and cash flow available for business operations and
their development; (iv) exposing the company to unfavourable economic conditions more intensively
than its competitors, which might weaken the company's competitiveness; (v) exposing the company to
an increase in interest rates; and (vi) restricting the company's opportunity to pay dividends.
If any defaults in payment occur, the company's creditors may call in all the company's unpaid debts
with the accrued interest and fees to be repaid immediately. Under these circumstances, the company's
loan creditors also have the right to give notice to terminate the commitments concerning the provision
of additional financing. If the company is unable to pay its debts when they fall due, the creditors have
the right under the loan agreements to realise the collateral lodged with them to repay the debt. If the
company's debt under the loan agreements is called in, there can be no certainty that this collateral is
sufficient to repay the company's debt.
The uncertainty in the financial market and the increasingly strict regulation of banks may mean that the
price of the financing needed for the company's business operations increases and that it is more
difficult to obtain financing..
Risks related to the share and dividends
In 2014, the company's shareholders were distributed a total of EUR 4,824,928.92 in dividends for
2013, which corresponded to an annual dividend income of approximately 10 per cent calculated using
the stock exchange price of 6 February 2014. However, there can be no certainty that the company will
pay similar dividends in the future or that it can comply with its dividend policy. In addition, the company
reports its financial result in accordance with IFRS, but the company's distributable funds are
determined in accordance with Finnish financial statement practice. According to the Tax Exemption
Act, the company shall annually distribute at least 90 per cent of its result for the financial period in
dividends, excluding the unrealised change in value of the investment properties (and comprehensive
income items according to IFRS). Even though the company's financial result showed a profit excluding
the unrealised changes in the value of investment properties, the company may not necessarily be able
to distribute dividends, because under the Real Estate Funds Act the company has to recognise
unrealised changes in value as income or expenses. This may restrict the company's distribution of
dividends, even though the company's business operations otherwise showed a profit, in particular in a
situation where an unrealised decrease in value is recognised as an expense, which thus reduces the
result for the period and the company's ability to pay dividends.
The company's ability to pay dividends is affected by a number factors, such as the current and
forecasted financial situation, working capital needs, cash flows and result, and any potential terms and
conditions of a loan agreement binding on the company or its subsidiaries. Dividend distribution may not
28
jeopardise the company solvency under the Limited Liability Companies Act. The Board of Directors
shall also ensure the preservation of the company's solvency before it decides on the distribution of
dividends. Therefore, there can be no certainty of the amount of dividends or the realisation of dividend
payments.
The market price of the company's listed shares may fluctuate considerably, and it is not certain
whether an active and/or liquid secondary market will be developed for the shares. The market price of
the company's shares may fluctuate significantly due to changes taking place in the attitude of the
market to shares and comparable other securities and due to a number of other factors and events,
such as changes in legislation affecting the company's operations or changes in the result or
development of the company's business. The market price of the company's shares may fall below the
subscription price of the shares. The stock exchange value of the company's shares is affected by the
subjective views of the company's investors of the value of the company. The company gives no
guarantees that, while the public quotation of the shares continues, the market price of the shares will
correspond to the price paid by the investors for the shares or that the secondary market for the shares
on the stock exchange list will be active.
The share prices and turnover on the stock market may occasionally vary considerably regardless of the
development of the company's business or outlook. In addition, the result of the company's business
operations and outlook may sometimes fall below the expectations of the stock market, market analysts
and investors. Any of these factors may lead to a fall in the market prices of the listed shares and other
shares in the company.
The company plans to continue expanding its operations by, for example, organising share issues and
issuing directed convertible bonds, due to which the ownership of current shareholders will become
diluted by the issue of shares subscribed on the basis of convertible bonds and if they do not subscribe
for new shares in future share issues.
Any potential future share issues implemented by the company may have an adverse impact on the
market price of the shares. It is also possible that shares will be used as a means of payment in
property transactions potentially made by the company in the future, which may have a negative impact
on the market price of the shares.
The demand and supply of the share in question have a direct impact on the liquidity of the shares, and
other factors have an indirect impact, such as general stock market conditions and potential market
disruptions. If the liquidity of the shares is low, the company has concluded an agreement with Nordea
Bank Finland Plc on a market guarantee for the share, the aim of which is to increase the liquidity of the
share. Nonetheless, the liquidity of the share may be low, which may have an adverse impact on the
value of the share. Investors' opportunity to sell their holdings in the company may weaken in such a
situation.
The development of share value is affected by, for example, the general development of the market,
information on the company's realised financial development and forecasts on its future development. It
is also possible that share price formation in the market will become disrupted, in which case share
prices will not reflect all the information available in the market.
Significant price and volume fluctuations have historically been related to the share market generally
and the market for shares of smaller companies, in particular, fluctuations that have not always been in
proportion to the performance of the companies. Corresponding price fluctuations may have a negative
impact on the price of the shares regardless of the actual profitability of the company. Investors should
be aware that investing in the company is associated with a high risk and that there can be no certainty
of a positive price development of the shares. In addition to the development of operations, a number of
external factors may affect the stock exchange price. These may be, for example, the prevailing
economic conditions and the market situation.
29
Capital management
The objective of capital management is to secure the Group's capability for continuous operation so that
it can produce income for its owners and benefits for its other stakeholders. Another objective is to
maintain an optimal capital structure, for example, for when interest rates change.
Capital is monitored on the basis of the loan to value ratio in the same manner as in similar companies
where the financing banks require the fulfilment of covenant conditions to be regularly reported. The
loan to value ratio is determined by dividing the Group's outstanding capital of interest-bearing debts
withdrawn from banks, including the Group's share of the company loans allocated to owned housing
company shares, by the debt-free value of housing company shares and other assets. The Group's
strategy is to keep the loan to value ratio between 30 and 60%. On 31 December 2014, the Group's
loan to value ratio was 43,9%.
The company announced in January that it is investigating possibilities for the implementation of a
financing arrangement of an estimated EUR 40 million. The arrangement would consist of a credit
facility of an estimated EUR 15 million, which would be used to finance the acquisition of new
properties, and a covered bond of an estimated EUR 25 million, which would mainly be directed to
domestic institutional investors and the purpose of which would be to refinance the company's existing
loans and promote the expansion of the company's business operations.
Environmental factors
The starting point for the company's environmental work is the legal and operational requirements for its
own and its tenants' operating environments. The management of environmental matters in the Group is
based on the environmental policy, guidelines and environmental systems of Newsec Asset Management Oy and Ovenia Oy, which acts as the property manager.
Company Shares
The shares in Orava Residential REIT were issued in the book-entry system on 28 January 2011. The
trading code for the share is OREIT. According to the Tax Exemption Act, the company may not own its
own shares.
A total of 1,366,558 previously unlisted shares of Orava Residential Real Estate Investment Trust plc
were combined with old shares in the book-entry system and admitted to trading on 3 February 2014.
After this, the total number of the company's shares subject to public trading taking the combination into
account was 4,288,707; the trading code is OREIT and the ISIN code is FI4000068614.
After these shares were listed and admitted to trading, 25,687 shares subscribed in the March 2013
share issue, the dividend rights of which differed from the aforementioned shares, still remained
unlisted. The company applied for them to be admitted to public trading on the stock exchange list of the
Helsinki Stock Exchange after their dividend rights became equal to those of the listed shares in
December 2014.
At the end of June, the company implemented directed issues of 418,923 shares, prepared a
prospectus and applied for the shares to be admitted to trading on the main list of the Helsinki Stock
Exchange (trading code OREITN0114). Trading in the new shares started on 30 June 2014. The
subscription price in the directed issues was EUR 12.82 per share, excluding the 100,000 shares
allocated to the company itself in a charge-free issue. The shares, whose trading code was OREIT0114,
did not entitle their holders to dividends paid in 2014 from the result of 2013.
In the third quarter, the company implemented directed issues of a total of 274,806 shares, and applied
for the shares to be admitted to trading on the main list of the Helsinki Stock Exchange (trading code
OREITN0114) on 8 October 2014. A. Ahlström Real Estate Ltd subscribed for 114,806 shares in a
directed issue at a subscription price of EUR 12.63 per share. In addition, the company allocated
charge-free share issues of 160,000 shares to itself.
30
In the fourth quarter, the company made decisions on directed issues related to a total of 1,056,122
shares. Osuusasunnot Oy was allocated 236,922 shares in a directed issue at a subscription price of
EUR 11.33 per share, Royal House Oy was allocated 368,000 shares in a directed issue at a
subscription price of EUR 10.60 per share, and the company itself was allocated 500,000 shares in a
charge-free issue. The subscription price of the shares was the weighted average price of the share
during the five days of trading on the Helsinki Stock Exchange preceding the day the subscription
commitment was concluded. A prospectus was prepared for the shares, which was published on 23
January 2015.
After the record date, 12 December 2014, of the dividend paid on 30 December, all shares in the
company were combined (ISIN code FI4000068614) and all shares had equal rights to dividends.
Trading with the trading code OREITN0114 on the Helsinki Stock Exchange ended on 12 December
2014. The number of the company's shares in the Trade Register at the end of 2014 was 5,206,123.
During the period under review, the company concluded convertible bond agreements in the amount of
EUR 5.0 million, of which EUR 4.99 million had been converted by 31 December 2014. Under the
terms and conditions of the convertible bonds concluded by the company, the company has assigned a
total of 418,614 of its own shares in conversions of its convertible bonds during the period. At the end of
the period, the company owned 39,386 treasury shares.
The average daily turnover of the company's shares during the financial period was EUR 254,000, and
the weighted average price of the share during the last five days of stock exchange trading was EUR
10.60.
Event
New shares
issued (pcs)
Company
shares after
the event (pcs)
Subscription
price in the
share issue
(EUR)
Share capital
after the event
(EUR)
Registration
date with the
Trade
Register
43,143,940 €
31 Dec 2013
Directed share issue
I/2014 25 Jun 2014
318,923
4,633,317
12.82 €
46,333,170 €
26 Jun 2014
Directed share issue
II/2014 25 Jun 2014
100,000
4,733,317
0.00 €
46,333,170 €
26 Jun 2014
Directed share issue
III/2014 6 Aug 2014
80,000
4,813,317
0.00 €
46,333,170 €
15 Aug 2014
Directed share issue
IV/2014 30 Sep 2014
114,806
4,928,123
12.63 €
47,481,230 €
8 Oct 2014
Directed share issue
V/2014 30 Sep 2014
80,000
5,008,123
0.00 €
47,481,230 €
8 Oct 2014
0
5,008,123
12.69 €
49,057,130 €
8 Oct 2014
Directed share issue
VI/2014 6 Nov 2014
80,000
5,088,123
0.00 €
49,057,130 €
1 Dec 2014
Directed share issue
VII/2014 11 Dec 2014
118,000
5,206,123
0.00 €
49,057,130 €
16 Dec 2014
0
5,206,123
11.72 €
50,337,280 €
23 Dec 2014
500,000
5,706,123
0.00 €
50,337,280 €
5 Jan 2015
Convertable bond
conversion 30 Sep
2014
Convertable bond
conversion
Before 31 Dec 2014
decided share issues
Directed share issue
IX/2014
31
Directed share issue
I/2015
235,922
5,942,045
11.33 €
52,696,500 €
23 Jan 2015
Directed share issue
II/2015
368,000
6,310,045
10.60 €
56,376,500 €
***
The Annual General Meeting of 18 March 2014 decided to distribute a dividend of EUR 0.28 per share
from the profit for 2013 in each quarter of 2014, i.e. in total at most EUR 1.12 per share in 2014 (100%
dividend rights). The dividend was paid on the last weekday of each quarter. The distribution of profit for
2013 was paid in 2014 according to two different dividend rights.
Dividends paid in the reported period, EUR per share
31 Mar 2014 1st dividend
30 Jun 2014 2nd dividend
30 Sep 2014 3rd dividend
30 Dec 2014 4th dividend
Total
FI4000068614
(100 %)
0.28 €
0.28 €
0.28 €
0.28 €
1.12 €
FI4000061072
(75 %)
0.21 €
0.21 €
0.21 €
0.21 €
0.84 €
A total of € 4,884,928.92 was paid in dividends.
Year 2014
The Board of Directors proposes to the Annual General Meeting that a total of EUR 1.20 per share be
paid in dividends from the result for 2014 (EUR 0.30 in each quarter), and that the Board of Directors be
authorised to decide on the amount of dividends to be paid in each quarter.
Osakkeenomistajat
The company had more than 5,800 shareholders 30 January 2015. According to the company’s
shareholder register, the company had 2,306 shareholders on 31 December 2013.
LIST OF OWNERS ON 30 JANUARY 2015, TEN LARGEST
Shareholder
Länsi-Suomen Vuokratalot Oy*
4,72
Osuusasunnot Oy
4,28
Godoinvest Oy**
4,16
Sysmäläntien Kiinteistöt Oy***
3,97
Avaintalot Oy*
2,91
Pakarinen Janne
1,82
Yli-Torkko Erkki
1,81
Livränteanstalten Hereditas
1,47
Maakunnan Asunnot Oy*
1,26
Alte Invest Oy
0,83
Number of shares
260 423
235 922
229 360
218 985
160 456
100 414
100 000
81 000
69 422
45 698
%
32
Yhteensä 10 suurinta
27,23
1 501 680
* Corporations under the control of Board members Tapani Rautiainen and Timo Valjakka. ** Corporation under
the control of Board member Timo Valjakka. *** Corporation under the control of Board member Tapani
Rautiainen.
Authorizations of the Board of Directors
On 18 March 2014, the Annual General Meeting decided to grant a share issue authorisation to the
Board of Directors so that the Board of Directors was authorised to decide on issues of at most
5,000,000 new shares in the company. The Board of Directors used the granted share issue
authorisation with regard to 1,995,651 shares in directed share issues during the period. On 31
December 2014, the unused portion of the share issue authorisation granted by the Annual General
Meeting was 3,004,349 shares.
33
Consolidated financial statements
Consolidated income statement
Note
IFRS
1 Jan - 31
Dec 2014
1 Jan - 31
Dec 2013
EUR 1,000
Revenue
Income from ordinary operations
Gains from disposals and changes in the
fair value of apartments
6
6,532
3,153
6
6
8,794
15,327
6,529
9,682
Maintenance expences
Expenses from rental operations
Administrative expenses
Other operationg income and expenses
Total expenses
7
7
7
7
-2,831
-350
-1,379
-862
-5,422
-1,452
-97
-696
2
-2,243
9,905
7,439
-1,361
-639
8,545
6,801
-94
-48
8,451
6,753
Total revenue
Operating Profit
Finance expenses (net)
8
Profit before taxes
Direct taxes
9
Profit/loss for the period
Profit/loss for the period attributable to
the owners of the parent company
10
8,451
6,753
Earnings per share calculated from the profit
attributable to the owners of the parent company
Earnings per share, EUR
10
1.83
3.19
16
-270
183
0
0
8,181
6,936
8,181
0
6,936
0
Other comprehensive income items
Items that may in the future be
reclassified to profit or loss
Derivatives - interest rate swaps
Items that are not reclassified to profit or
loss
Comprehensive profit/loss for the period
Comprehensive profit/loss for the period attributable to
the owners of the parent company
non-controlling interests
10
10
34
Consolidated statement of financial position
Note
31 Dec 2014
31 Dec 2013
EUR
1,000
ASSETS
Non-current assets
Fair value of investment properties
11
130,668
79,190
Current assets
Trade and other receivables
Cash and cash equivalents
12
13
4,070
1,990
6,059
203
9,134
9,336
136,728
88,526
50,337
7,526
2,260
-493
1,780
8,451
69,860
43,144
0
0
-224
106
6,753
49,780
15
15
58,059
478
58,538
35,592
205
35,797
17
1,931
1,730
17
17
5,906
493
8,330
995
224
2,949
66,868
38,746
136,728
88,526
TOTAL ASSETS
Equity attributable to the owners of the parent company
Share capital
Share issue
Share premium account
Hedge reserve
Retained earnings
Profit for the period
Total equity
14
14
14
Liabilities
Non-current liabilities
Interest-bearing liabilities
Other non-current liabilities
Total non-current liabilities
Current liabilities
Interest-bearing liabilities, borrowings
Trade payables and other current
liabilities
Derivatives
Total current liabilities
Total liabilities
TOTAL EQUITY AND LIABILITIES
35
Consolicated statement of cash flows
1 Jan - 31 Dec
2014
1 Jan - 31
Dec 2013
7,657
-4,406
3,236
-2,425
3,251
-1,990
-72
4,381
5,570
811
-656
-11
3,172
3,316
-13,126
-18,883
-3,833
-2,670
-490
-20,118
-2,564
-178
-187
-21,812
Payments received from share issues
Loan withdrawals
Loan repayments
Dividends paid
Net cash flows used in financing activities
2,750
11,334
-2,079
-4,600
7,405
27,645
7,111
-6,081
-1,347
27,329
Net decrease (-) / increase (+) in cash and cash equivalents
-7,143
8,833
9,134
1,990
300
9,134
EUR 1,000
Cash flows from operational activities
Payments received from sales
Payments of operational costs
Cash flows from operational activities before financial
items
Interest paid and other finance expenses, net
Taxes paid
Income from divestituresof tabgible fixed assets
Net cash flows from operational activities
Cash flows from investment activities
Acquisition of subsidiaries less axquired cash and cash
equivalents
Acquisition of residential apartment shares
Investments in tangible fixed assets
Investments in intangible assets
Net cash flows used in investments
Cash flows from financing activities
Cash and cash equivalents at the beginning of the
period
Cash and cash equivalents at the end of the period
36
Total equity attributable
to the owners of the
parent company
Total equity
15,007
268
780
2,436
26,868
-1,170
-337
-337
-337
-337
6,753
183
268
780
2,436
26,868
-1,170
-337
-337
-337
-337
6,753
183
49,780
49,780
899
302
535
424
4,088
1,450
6,574
2,000
4,088
1,450
6,574
2,000
220
1,500
1,500
-258
-1,206
-1,206
-1,206
-1,206
8,451
1,486
-378
-1,206
-1,206
-1,206
-1,206
8,451
-270
1,486
-378
-1,206
-1,206
-1,206
-1,206
8,451
-270
10,230
69,860
69,860
Hedge reserve
15,007
Reserve for invested
unrestricted equity
1,466
Share capital
Retained earnings
Statement of changes in equity
Equity on 31 Dec 2012
13,666
281
-407
Proceeds from shares issued 25 Mar 2013
Proceeds from shares issued 29 Jul 2013
Proceeds from shares issued 27 Sep 2013
Proceeds from share issued to the public
Costs of listing on the stock exchange
Distribution of divideds 28 Mar 2013
Distribution of divideds 28 Jun 2013
Distribution of divideds 30 Sep 2013
Distribution of divideds 27 Dec 2013
Profit from the period
Comprehensive income items
257
770
2,366
26,085
11
10
70
783
-1,155
Equity on 31 Dec 2013
43,144
0
3,189
1,148
6,039
1,576
1,280
EUR 1,000
Proceeds from shares issued 25 Jun 2014
Proceeds from shares issued 30 Sep 2014
Proceeds from shares issued 30 Dec 2014
Conversion of convertible bond 8 Oct 2014
Conversion of convertible bond 23 Dec
2014
Conversion of convertible bond 30 Dec
2014
Cost to gain equity
Distribution of divideds 28 Mar 2014
Distribution of divideds 30 Jun 2014
Distribution of divideds 30 Sep 2014
Distribution of divideds 30 Dec 2014
Profit from the period
Comprehensive income items
Equity on 31 Dec 2014
-15
-337
-337
-337
-337
6,753
183
-224
6,859
1,486
-120
-270
57,863
2,260
-493
37
Notes to the financial statements
1. Basic details of the group
Orava Residential Real Estate Investment Trust plc ("Orava Residential REIT"), business ID
2382127-4, address Kanavaranta 7, 00160 HELSINKI, Finland) was established on 30
December 2010 as a real estate fund as referred to in the Real Estate Funds Act. Its rules for
real estate investment operations were approved by the Financial Supervisory Authority on 28
January 2011. The up-to-date rules are enclosed as an appendix to the financial statements.
The purpose of the company as a real estate fund under the Real Estate Funds Act
(1173/1997) is to let apartments and real estate which it owns or possesses due to its
shareholding, to engage in ordinary housing management and maintenance focusing on its own
property, to exercise construction contracting on the company’s own behalf and to finance all
these operations. The company aims to take advantage of the Act on the Tax Exemption of
Certain Limited Liability Companies Engaging in Apartment Rental Operations (299/2009) (“the
Tax Exemption Act”) in its operations. The company has been granted an exemption from
income tax. The tax exemption started from the beginning of the first tax year on 30 December
2010.
Orava Residential REIT listed on NASDAQ OMX Helsinki ("the Helsinki Stock Exchange") in
October 2013.
The Board of Directors of Orava Residential REIT has approved these financial statements for
publication at its meeting held on 11 February 2015.
2. The act on the tax exemption of certain limited liability companies
engaging in apartment rental operations (299/2009) (”the Tax
Exemption Act”)
A limited company generally liable for tax in Finland and engaged in the rental of residential
apartments is exempted from paying income tax in the manner prescribed in the Tax Exemption
Act.
The main prerequisites for granting exemption from tax are as follows:
- The company may not be engaged in any other business than that of renting residential
apartments.
- At least 80% of the company's assets shown on the balance sheet is invested in apartments
or real estate primarily intended for residential use.
- The other assets of the company besides the residential assets are compliant with the Real
Estate Funds Act.
- The company's liabilities do not exceed 80% of total assets.
- No individual shareholder holds more than 30% of the company's share capital (less than
10% from 2015).
- The Real Estate Funds Act is applicable to the company.
38
In addition to the above, the prerequisites for maintaining the exemption from tax are broadly as
follows:
- At least 90% of the result must be distributed as dividends every year (excluding any nonrealised change in value).
- The company's shares are listed on the stock exchange on the third year at the latest.
- The company does not distribute its funds in any other manner than as dividends.
The company becomes partially liable for tax:
- to the extent that its rental income is less than 80% of its total income (excluding disposal
prices)
- for capital gains from apartments it has owned for less than five years.
In the initial stage of company operations, residential apartments owned for less than five years
are disposed of, so a liability to pay tax may arise from such disposals.
3. Accounting principles
The consolidated financial statements have been prepared in accordance with the International
Financial Reporting Standards applying the IAS and IFRS standards and SIC and IFRIC
interpretations endorsed for use in the EU and in force on 31 December 2014. The term
"International Financial Reporting Standards" refers to the standards and their interpretations in
the Finnish Accounting Act and provisions based on this endorsed for application in the EU in
accordance with the procedure established in EU Regulation N:o 1606/2002. The notes to the
consolidated financial statements also comply with the provisions of Finnish accounting and
corporate legislation that supplement the IFRS provisions. In addition, Orava Residential REIT
also complies with the recommendations of the European Public Real Estate Association
(EPRA) of August 2011, as applicable.
The consolidated financial statements were prepared in euros, and they are presented in
thousands of euros. All figures have been rounded, so the sum total of the individual figures
may differ from the total amount presented.
3.1
Basis of preparation
The consolidated financial statements are based on the acquisition cost method apart from
investment properties and interest rate swaps used for hedging cash flows, which are
recognised at fair value.
The preparation of IFRS financial statements requires discretion from the management.
Discretion influences the selection and application of accounting principles, the amount of
reported assets, liabilities, income and expenses, as well as the notes presented. When
exercising discretion, the management uses estimates and assumptions based on previous
experience and its best view on the closing date concerning the future development of the
real estate market, in particular. The final outcome may differ from the estimates made. The
use of estimates and assumptions is described in more detail in the section "Accounting
principles requiring management discretion".
3.2
Consolidation principles
Orava Residential REIT consolidates the wholly-owned housing companies in compliance with
IAS 27. Partially owned housing companies are consolidated using the proportionate method in
compliance with IAS 31, in which case only the amount of each income statement and balance
39
sheet item of the subsidiaries corresponding to the holding of the Group is consolidated.
Accordingly, no minority interest is created in the Group consolidation process.
3.3
Segment reporting
The form of segment reporting used by the company is in accordance with the intended use
of the investment properties. According to the Tax Exemption Act, at least 80% of the
company's assets shown on the balance sheet must be invested in apartments or real
estate primarily intended for residential use and rental income from these must account for
at least 80% of the income, excluding the disposal prices of investment properties.
The parent company Board of Directors, which makes strategic decisions, is appointed as
the chief operating decision-maker which is responsible for the allocation of resources to
the operating segments and the assessment of their result. The geographic distribution of
investment properties is also regularly reported to the Board of Directors.
3.4
Investment properties
In accordance with the Tax Exemption Act, Orava Residential REIT does not engage in any
operations other than letting premises which it owns or possesses due to its shareholding,
ordinary housing management and maintenance focusing on such premises, construction
contracting on the company’s own behalf and financing required for these.
Under the Tax Exemption Act, at least 80% of the company's assets shown on the balance
sheet at the end of the tax year shall be made up of such real properties, housing
company shares or shares conferring the right to possess a residential apartment in
another mutual real estate company which only engages in the ownership and
management of the buildings on its real estate which are primarily intended for permanent
residential use. Orava Residential REIT possesses such assets to obtain rental income or
increase in the value of its assets or both.
In the valuation of its investment properties, Orava Residential REIT applies Section 18 of the
Real Estate Funds Act and the fair value model according to IAS 40, Investment Property. Any
profit or loss from changes in fair value is recognised through profit or loss for the period during
which it arises.
Changes in fair value are recognised under revenue. Investment properties are initially
valued at acquisition cost. Fair value is used in the measurement and valuation after the
initial recognition. Fair value is the amount of money for which the assets could be
exchanged between informed parties willing to enter into the transaction and independent
of each other. As of 1 January 2013, fair value has been determined according to IFRS
13, Fair Value Measurement., which entered into force on that date.
Orava Residential REIT possesses investment properties under construction to obtain
rental income or increase in the value of its assets or both in the future. As of 1 January
2013, on the closing date, long-term development and construction projects where a new
building or new apartments are built are measured at fair value. Use of fair value requires
that the percentage of completion of the project can be reliably estimated. Investment
properties under construction also include apartments for which Orava Residential REIT
has signed a construction-stage deed of purchase for a residential apartment.
40
As residential apartments are disposed of individually according to Orava Residential REIT's
strategy, the value of Orava Residential REIT's investment properties is the sum of the
market values of individual apartments calculated using a measure ment model. Investment
properties are disclosed on the statement of financial position at their gross value, in which
case the share of debt related to ownership allocated to the property is presented in Orava
Residential REIT's consolidated statement of financial position as a liability.
Individual apartments are derecognised when they are disposed of. Capital gains and losses
from apartments are presented in the income statement under revenue. Capital gains and
losses from apartments are arrived at by deducting the previous quarter's closing balance
sheet value and the estate agent's commission from the debt-free sales price. The share of
the apartment of the asset transfer tax paid, the cost of repairs of the apartment and capi talised repairs are deducted in full from the change in fair value.
An external expert annually audits the fair value measurement process and determination
method used by Orava Residential REIT. In addition to the audit, an external expert issues a
calculation of value on the values of all Orava Residential REIT's investment properties twice a
year.
3.4.1 Description of the determination of the fair value of investment
properties
Appraisal method
The comparable sales method used by Orava Residential REIT is typically used for appraising
apartments when they are being sold as individual apartments. The fair value of the Residential
REIT's portfolio is determined through a mass appraisal system using multi-variable regression
based on asking price and purchase price material.
Material
The main material used are housing sales advertisements from the Oikotie.fi service included in
the Sanoma Group. The advertisements are received continuously, directly from Oikotie in
electronic format. Oikotie.fi is one of Finland's largest housing sales advertisement portals, and
its service includes advertisements from both estate agents and private individuals. In addition,
the material includes information on realised sales mainly close to the properties owned by the
Residential REIT, delivered by estate agents, and sales information on the apartments sold by
the Residential REIT.
According to the International Valuation Standards, when a market appraisal is made, the
information used should be freely available and generally used in decision -making. The
benefit from using asking price material is that it is up to date and that all market parties can
easily utilise it.
Inspection and enrichment of the material
When the valuation model is prepared, the material is examined and any detected clearly
erroneous information is adjusted by means of manual imputation. If a realised transaction
price is available, the asking price is replaced by the transaction price, which is increased
by the bargaining range estimated for the time of the transaction. The asking prices for the
company's own apartments for sale are not used in the appraisal.
Bargaining range
Apartment asking prices typically include a bargaining range; in other words, sellers set their
asking prices at a level that is higher than the lowest price at which the sell er would be ready
41
to conclude the transaction. The bargaining range must be taken into account in the
determination of the fair value – i.e. the expected transaction price. A typical rule of thumb for
the realised bargaining range is approximately 5–10 per cent. When fair values are
determined for the Residential REIT, the bargaining range is estimated by comparing the
average prices on the Oikotie.fi service and the postcode-specific average prices with
Statistics Finland collected for the latest quarter with each other and taking the arithmetic
average value of these average values separately for cities with more and fewer than 100,000
inhabitants. The asking price material for both city types is postponed by approximately two
months (corresponding to the average marketing period by apartment type) in relation to the
material of Statistics Finland. The estimated bargaining range used in the appraisal for the last
quarter of 2014 was 4.33 per cent for large cities and 6.08 per cent for small cities.
Econometric model
The econometric model explaining the asking prices for apartments is estimated with the least
squares method using Gretl software, the currently used version of which is 1.9.91.
P
ln
a b1 ALA b2 ALA 2 b3 ALA 3 b4 IKA b5 IKA 2 b6 IKA 3
ALA
b7 DKuntoerinomainen b8 DKuntotyydyttävä b9 DKuntohuono,eritt.huono b10 DSauna b11 DTontti
1
n
c TD d ZIP d
t
t 7
t
i
i
n 1
SQKM LAT dn 2 SQKM LON
i1
q
dn 3 KOHDE
d HUONEISTO
j
j
j n 4
P = the debt-free sales price
ALA = the surface area of the apartment
IKÄ = the age of the building (=current year – notified construction year)
D = a dummy variable which receives value 1 when the information indicated in the
subscript is ture and otherwise 0
SAUNA = a dummy variable which receives value 1 when there is a sauna in the
apartment
TONTTI = a dummy variable which receives value 1 when the property is located on a
leased plot (the variable is left out of the model if there are fewer than 15 leased plot
observations or if its coefficient is positive)
TD = a quarterly time dummy (the dummy of the valuation quarter is left out)
ZIP = a location dummy describing the postcode area
SQKM = a dummy variable which receives value 1 when the observation is located within
an area of one square kilometre round the property ( 4 square kilometres if there are
fewer than 15 properties within the area of one square kilometre) – the variable is used
for appraising the impact of the micro location within the postcode area
LAT; LON = the latitude and longitude of the property, which are used to ultiply the 1
2
2
km /4 km dummy; these factors multiplied by the SQKM dummy inclines the plane set
up by the SQKM dummy
KOHDE = a dummy variable which receives value 1 when the observation is located at
the same address with the property being appraised
HUONEISTO = a dummy variable which receives value 1 when the observation
concertns the apartment being appraised
The following delimitations were used:
- building type = apartment block for apartment blocks and all building types for terraced
houses and balcony-access houses
42
-
building class = owner-occupied apartment (i.e. non-rental building) or new property
form of housing = owner-occupied apartment or new property
the advertisement was submitted at most 24 months before the end of the appraisal month
2
2
€350/m < debt-free square metre price < €15,000/m
2
2
10 m < apartment surface area < 300 m
-2.5 years < age of the building < 150 years
The primary criterion for determining the variables, delimitations and functi on form is the
standard deviation of the remainder terms, and attempts are made to minimise it. The
measurement model is being continuously developed.
The model is audited once a year by an external property valuer. Realia Management Oy
audited the model in the autumn of 2014. An English-language audit report dated 27 October
2014 is available at http://www.oravaasuntorahasto.fi/wpcontent/uploads/en/Admin/AuditOfValuationModel2014.pdf. A Finnish-language summary of the
report and audit reports for 2013 are available on the website of the Residential REIT.
3.5
Financial assets
Loans and other receivables
Loans and other receivables are financial assets not included in derivative assets, the
payments related to which are fixed or determinable and which are not quoted on active
markets. They are included in current assets, except if they fall due after more than 12
months from the closing date.
The Group's current assets include rental and other receivables and cash in hand and at
banks. Rental receivables are recognised on the balance sheet at their initial invoiced
value. Rental receivables are regularly reviewed. Reminder and collection letters are sent a t
two-week intervals. An external collection agency manages the collection of rental
receivables. A summons is sent to a district court approximately two months after the first
due date. At the end of every reported period, it is estimated whether there is proof of
impairment of the value of receivables. Impairment of rental receivables is recognised
under other operating expenses during the period it is incurred.
Cash in hand and at banks includes cash, bank accounts and liquid investments whose
investment period is no more than three months at the time they are made. The overdraft
facilities of bank accounts are included in non-current interest-bearing liabilities.
Purchases and sales of financial assets are initially recognised at fair value on the basis of the
transaction date, and the transaction costs are expensed in the income statement. Loans and
other receivables are later valued at amortised cost.
3.6
Interest rate swaps and hedging
Orava Residential REIT may only use derivatives for hedging the interest rate risk within the
limits allowed by the Tax Exemption Act. Through interest rate swaps, variable -rate loans are
changed into fixed-rate loans, so the hedging instruments and the underlying objects are
consistent as to their critical characteristics (amount, maturity).
The bank's charges for the interest rate swaps are expensed during the period they are
incurred.
43
Changes in the fair value of interest rate swaps are recognised under comprehensive
income items and shareholders' equity. The fair values of interest rate swaps are
measured on the basis of the zero-coupon euro swap curve published and calculated by
Deutsche Bundesbank on the basis of market data for the balance sheet day. The cash flows of
each payment transaction of the interest rate swaps are discounted, and the market value of
swaps is calculated by linear interpolation using interest rates determined from the above zerocoupon curve.
3.7
Share capital
Shareholders' equity consists of share capital, the reserve for invested unrestricted equity
and retained earnings. In share issues, €10.00 of the subscription price of the share is
recorded under share capital, while the excess is recognised under the reserve for invested
unrestricted equity. Fees related to an increase in the share capital paid to third parties are
deducted from shareholders' equity. The company may only distribute its funds as dividends.
Under the Tax Exemption Act, acquisition of the company's own shares is prohibited.
3.8
Non-current liabilities
Non-current interest-bearing loans are recognised at fair value less transaction costs at the time
of acquisition. Loan arrangement fees are expensed in the income statement over the loan
period. A loan is classified as a non-current interest-bearing liability insofar as the
amortisation of the loan takes place after more than a year from the closing date. The
overdraft facilities of bank accounts are included in non-current interest-bearing liabilities.
Investment properties are recognised on the statement of financial position at fair value as
a gross value, in which case the share of company loans allocated to the shares related to
the ownership of the shares is presented as a liability on the statement of financial position.
3.9
Cost of liabilities
Costs of liabilities which arise from the acquisition, construction and manufacture of
investment properties the completion of which requires a considerably long period are
added to the acquisition cost of the acquisition in question. Capitalisation is continued until
the asset items are ready to be rented or sold.
Other costs of liabilities are expensed during the period they are incurred.
3.10 Current interest-bearing liabilities
A loan is classified as a current interest-bearing liability insofar as the amortisation of the loan
takes place within a year from the closing date.
Investment properties are recognised on the statement of financial position at fair value as
a gross value, in which case the share of company loans allocated to the shares related to
the ownership of the shares is presented as a liability on the statement of financial position.
3.11 Other current liabilities
Other current liabilities include trade payables and other liabilities. Trade payables are
obligations which result from goods or services acquired from suppliers or service providers in
44
the course of ordinary business operations. If trade payables fall due within over a year, they
are disclosed under non-current liabilities.
3.12 Revenue
At Orava Residential REIT, revenue includes:
- Income from ordinary operations
- Gains from disposals and changes in the fair value of investment properties
Income from ordinary operations is divided into gross rental yield, i.e. income from rental of
apartments and other facilities, and compensation for use and resident services. Income
from ordinary operations is recognised in the income statement in equal instalments on a
monthly basis over the lease period.
Gains include realised capital gains and losses from disposals of apartments, transaction
fees for sales, i.e. estate agents' commissions, and changes in the fair value of apartments
in the reported period. The share of the apartment of the asset transfer tax paid, the cost of
repairs of the apartment and capitalised repairs are deducted in full from the change in fair
value.
3.13 Expences
Expenses include the management, maintenance and annual repair expenses of investment
properties, expenses for rental operations and the administrative expenses of the Residential
REIT. Administrative expenses include the remuneration of the Board of Directors, the fixed fee
of the management company and other administrative expenses.
Land leases are treated as other leases, and the rents paid on their basis are recognised in the
income statement under maintenance expenses in equal instalments over the lease period.
3.14 Other operating income and expences
Other operating expenses include credit losses from rental operations and the performancebased fee of the management company.
The performance-based management fee is twenty per cent (20%) of the annual yield of the
Residential REIT exceeding the hurdle rate of six per cent (6%). The management
company's performance-based fee is recognised at fair value according to the yield
exceeding the hurdle rate during the financial period.
Potential other operating income and expenses include income and expenses which cannot be
considered to be directly related to the real estate investment operations of Orava Residential
REIT.
3.15 Operating profit
The operating profit of Orava Residential REIT is the net sum arrived at by deducting expenses
from revenue, adding other operating income and deducting other operating expenses.
3.16 Taxes of the financial period
45
After Orava Residential REIT met the requirements under the Tax Redemption Act on 31
December 2012, it was released from paying income tax as set out in the Tax Exemption
Act. Under the Tax Exemption Act, the company becomes partially liable to pay tax insofar
as the amount of rental income is less than 80% of income (excluding capital gains) and for
realised capital gains from apartments it has owned for less than five years. Capital gains
and losses may not be offset. Income tax is only recognised if it is known that he company
will become partially liable to pay tax. A deferred tax liability has not been recognised for
potential capital gains from changes in fair value.
3.17 Earnings per share
Earnings per share are calculated by dividing the result for the period attributable to the owners
of the parent company by the weighted average number of shares outstanding.
3.18 Oblication to distribute dividends
Under the Tax Exemption Act, at least 90% of the profit for the period shall be distributed
annually, excluding any unrealised change in the fair value of investment properties. On the
other hand, the Tax Exemption Act restricts the distribution of funds for the dist ribution of
profit only. The dividends that the Board of Directors proposes to be distributed are not
recognised before the General Meeting approves them. Dividend distribution is recorded on
the consolidated statement of financial position for the period during which the dividend is
approved at the General Meeting. If the General Meeting authorises the Board of Directors
to decide on the distribution of dividends, the distribution of dividends is recog nised on the
consolidated statement of financial position for the period during which the dividends are
approved at a Board meeting.
3.19 New IFRS standards and interpretations
Orava Residential REIT used the same accounting principles as in the 2013 financial
statements, except for the application of new or revised standards and interpretations.
The amendment to IAS 1 influenced the presentation of other comprehensive income items
so that items are categorised into those that may be reclas sified subsequently to profit or
loss and those that are not so reclassified.
The amendment to IAS 12, Income Taxes, is related to the recognition of a deferred tax
liability related to an investment property measured at fair value according to IAS 40,
Investment Property. The amendment has no material impact on the consolida ted financial
statements, as the investment properties of Orava Residential REIT can mainly be disposed
of in a tax-free manner after the five-year ownership period entitling to tax exemption.
IASB has published the following new standards, which the Group has not complied with. The
Group will adopt the new standards from the date they enter into force.
An amendment was made to IFRS 10, Consolidated Financial Statements, relating to the
accounting principles applied to the consolidated financial statements for investment entities.
The new amendment to the standard was endorsed in the EU on 22 November 2013, and
according to the transitional provisions, the new provisions shall be applied at the latest
during financial periods beginning on or after 1 January 2014.
46
The standard defines an investment entity and provides for an exception for the
consolidation of certain subsidiaries of the investment entity into the consolidated financial
statements. An investment entity does not need to present consolidated financial statements
if it shall measure all of its subsidiaries at fair value through profit or loss according to
paragraph 31 of IFRS 10. The company will carefully review the requirements of IFRS 10 to
assess the treatment of housing companies in financial statements as of 1 January 2014.
3.20 Accounting principles requiring management discretion
The management of Orava Residential REIT exercises discretion when it makes decisions on
the choice of accounting principles and their application. This concerns cases where the
IFRS norms include alternative recognition, valuation or disclosure methods, in particular.
Any estimates and assumptions are based on earlier experience and the best view on the
closing date. Estimates are always associated with uncertaint y factors, and the final
outcome may differ from the estimates made. The discretion and estimates by the
management of Orava Residential REIT are mainly related to the measurement of
investment properties at fair value.
The fair value of the apartment portfolio of Orava Residential REIT is monthly determined
with a comparable sales multi-variable regression method using asking price material
obtained from the Oikotie.fi service. The bargaining range – i.e. the difference between
asking prices and transaction prices – is estimated using the material of Statistics Finland
as a baseline. The measurement model is continuously developed. The uncertainty in the
appraisal of the fair value of investment properties is reduced by obtaining an appraisal by
an external valuer every six months and by selling apartments.
In the company management's view, every acquisition of an investment property must be
processed,and it must be separately assessed whether the terms and conditions for the
definition of business operations are met or whether the company only presents the part it
manages as an investment property in its consolidated financial statements.
As a rule, Orava Residential REIT consolidates the wholly-owned housing companies in
compliance with IAS 27. Partially owned housing companies are consolidated using the
proportionate method in compliance with IFRS 13, in which case only the amount of each
income statement and balance sheet item of the subsidiaries corresponding to the holding of
the Group is consolidated.
The variable-rate loans of the parent company have all been converted into fixed-rate loans
using interest rate swaps in compliance with the risk management policy approved by the
Board of Directors. The counterparty for the interest rate swaps is Danske Bank Plc. The
critical terms (i.e. amounts and dates) of the hedging instruments and the underly ing objects
are identical. The derivative contracts have been concluded for the purpose of hedging the
loan portfolio, and they are measured at fair value in the financial statements. The fair value
represents the result that would have been created had the derivative positions been closed
on the balance sheet date. The company management measures fair values on the basis
of the zero-coupon euro swap curve published and calculated by Deutsche Bundesbank on
the basis of market data for the balance sheet day. The cash flows of each payment
transaction of the interest rate swaps are discounted, and the market value of the swaps is
calculated by linear interpolation using the interest rates determined from the above zerocoupon curve.
47
3.21 Related parties
According to IAS 24, a party is a related party of a corporation when he or she owns a share
in the corporation that gives him or her significant influence or he or she is a member of the
key management personnel of the corporation or its parent company. Key persons' family
members, corporations under the person's control and corporations where the person has
significant influence are also included in related parties.
Any business transactions implemented with related parties and fees paid to related parties are
presented in the notes.
3.22 Share based payments
The Group has no share-based reward systems directed at personnel, but the management
agreement between the Group and the management company includes a clause about a
performance-based management fee. The performance-based management fee is twenty
per cent (20%) of the annual yield of the Residential REIT exceeding the hurdle rate of six
per cent (6%). Any performance-based fee is recognised during the financial period and
disclosed in the financial statements as a monetary liability. The General Meeting or the
company's Board of Directors, on the basis of an authorisation, may decide to pay at most
half of the performance-based fee in shares in the Residential REIT, in which case that
share of the monetary liability is recognised under shareholders' equity.
4. Management of financing risks
In the course of its normal business, Orava Residential REIT is exposed to various financing
risks. The objective of Orava Residential REIT's risk management is to minimise the negative
effects of changes in financial markets on the company's cash flow, financial result and equity.
The Board of Directors of Orava Residential REIT decides on the objectives of risk
management, determines the risk management policy and is responsible for monitoring risk
management activities. The operational policy observed in financial operations is to avoid taking
risks. The management of financing risks is discussed in more detail in the Board of Director's
report and note 20, Financial instruments.
5. Consolidation
Orava Residential REIT consolidates the wholly-owned housing companies in compliance with
IAS 27. The partially owned companies are consolidated in compliance with IFRS 13 using the
proportionate method.
6. Segment information
The Group's chief operational decision-maker is the Board of Directors. Segment information is
based on the monthly reports which the Board of Directors uses for allocating resources and for
assessing financial performance.
Orava Residential REIT lets apartments and real estate which it owns or possesses due to its
shareholding and engages in ordinary housing management and maintenance focusing on its
own property.
The form of segment reporting used by the company is in accordance with the intended use of
the investment properties. According to the Tax Exemption Act, at least 80% of the assets
48
shown on the company's balance sheet must be invested in apartments or real estate primarily
intended for residential use and rental income from these must account for at least 80% of its
income, excluding the disposal prices of investment properties. The assets shown on the
balance sheet and the income of Orava Residential REIT have consisted of apartments and real
estate primarily intended for residential use, so no segment division has been performed.
The revenue of Orava Residential REIT is presented in compliance with the accounting
principles, divided into income from ordinary operations and capital gains. The capital gains and
losses from apartments are arrived at by deducting the previous quarter's closing balance value
from the debt-free selling price. The transaction fees associated with disposals are deducted
from the revenue. During the period 1 January – 31 December 2014, a total of 29 apartments
were sold.
The apartment's share of the asset transfer tax paid and the apartment repair costs and
capitalised repairs as a whole reduce the change in fair value.
Revenue
Income from ordinary operations
Gross rental yield
Compensarion for use and service income
Gains from disposals and changes in the fair value of apartments
Disposal prices of apartments less the fair
value in the previuos quarter's closing
balance
Brokerage fees for apartments disposed of
Net gains and losses from changes in the
fair alue of investment properties
Total
1 Jan - 31 Dec
2014
1 Jan - 31
Dec 2013
6,302
230
3,054
98
466
-144
-115
-139
8,443
6,812
15,327
9,682
The fair value of investment properties by region and their age distribution are also regularly
reported to the Board of Directors of the Group. The Helsinki Region includes Helsinki, Espoo,
Kauniainen, Vantaa and the surrounding municipalities, while ampere, Turku, Oulu, Jyväskylä
and Lahti are classified as major cities.
Distribution of investment property values by their location, %
Helsinki Region
Major cities
Rest of Finland
Total
31 Dec 2014
43
23
34
100
31 Dec 2013
38
19
43
100
Distribution of investment property values by age group, %
Built in 1989 or earlier
Built in 1990 or later
31 Dec 2014
43
57
100
31 Dec 2013
44
56
100
7. Expenses by type
Personnel expenses
Fixed management fee Orava Funds plc
Other administrative expenses
Property maintenance expenses
1 Jan - 31 Dec
2014
-107
-614
-658
-2,831
1 Jan - 31
Dec 2013
-54
-262
-380
-1,452
49
Expenses from rental operations
Other operating expenses
Total
Personnel expenses, Board of Directors' fees
Jouni Torasvirta
Peter Ahlström
Mikko Larvala
Tapani Rautiainen
Veli Matti Salmenkylä
Timo Valjakka
Total
-350
-862
-5,422
-97
2
-2,243
1 Jan - 31 Dec
2014
-29
-16
-16
-15
-16
-16
-107
1 Jan - 31
Dec 2013
-17
-3
-6
-9
-10
-9
-54
1 Jan - 31 Dec
2014
-46
-21
-67
1 Jan - 31
Dec 2013
-32
-6
-38
1 Jan - 31 Dec
2014
-15
-847
-862
1 Jan - 31
Dec 2013
2
0
2
The Board of Directors convened twentythree times during the
period.
Auditor's fees
Audit, parent company
Audit, subsidiaries
Total
The auditor's fees are included in other administrative expenses.
Ohter operating expenses
Credit losses
Performance-based fee paid to the management company
Total
Credit losses in year 2014 were EUR 15,000 (2013: EUR 0). Based on the payment plans an adjustment
EUR 2,000 has been made into the year 2013 credit losses. Company will allocate shares to cover half
of the performance-based fee. In year 2013 performance-based fee was not paid.
Property maintenance expenses
Property maintenance expenses less compensation for use
Property maintenance expenses less compensation for use as
percentage of market value, p.a.
Average market value of investment
properties during the period, EUR 1,000
1 Jan - 31 Dec
2014
-2,601
1 Jan - 31
Dec 2013
-1,354
-2.5 %
-2.4 %
104,873
55,591
Property maintenance expenses also include the maintenance expenses for residential apartments in the
sales portfolio.
50
8. Finance income and expensed
Interest expenses and fees for loans and interest rate hedges
Change in the capitalised amounts of arrangement fees
Share of the capital charges of associated companies expensed
Other finance expenses
Total finance expenses
Finance income
Total
1 Jan - 31 Dec
2014
-1031
-15
-291
-32
-1369
8
-1361
1 Jan - 31
Dec 2013
-547
-1
-99
-7
-654
15
-639
9. Income taxes
The Large Taxpayers' Office granted the company an exemption from the payment of income
tax on 20 January 2012. According to the decision, the tax exemption started from the
beginning of the first tax year on 30 December 2010.
However, pursuant to the Tax Exemption Act, the company has to pay tax for capital gains from
apartments it has owned for less than five years. Capital losses from apartments may not be
deducted from capital gains.
For taxation purposes, a capital gain is created when the disposal price exceeds the sum total
of the original acquisition price, the asset transfer tax paid, the estate agent's fee and the
apartment repair expenses and capitalised repairs.
The subsidiaries pay the relevant taxes on their result and capital gains.
Taxes for the period
10.
1 Jan - 31 Dec
2014
1 Jan - 31
Dec 2013
-94
-48
Earnings per share
1 Jan - 31 Dec
2014
1 Jan - 31 Dec
2013
8,451
4,622
1.83
6,753
2,118
3.19
(a) Undiluted
Undiluted earnings per share are calculated by dividing
earnings before comprehensive income items attributable to
the company's shareholders by the weighted average number
of shares outstanding during the period.
Profit attributable to the company's shareholders
Weighted average number of outstanding shares, 1,000 shares
Undiluted earnings per share
(b) Adjusted for dilution effect
The company did not had any potentially diluting shares on 31
December
51
11.
Non-current assets
31 Dec 2014
31 Dec 2013
Fair value EUR 1,000
Investment properties
Acquisition cost on 1 Jan
Increases including asset transfer tax
Decreases
Change in fair value during the financial period excluding asset transfer
tax
Fair value on 31 Xxx
79,190
45,099
-2,783
31,992
43,607
-3,429
9,162
130,668
7,020
79,190
The decreases are disposals of residential apartments. A total of 29 apartments were sold during the period 1
January – 31 December 2014.
The change in the value of investment properties included in the investment portfolio throughout the fourth
quarter 2014 was -1.2 % or EUR -1.2 million.
Investment properties
on 31 December 2014
Helsinki region
Asunto Oy Espoon Albert
Asunto Oy Helsingin Koirasaarentie 1
Asunto Oy Kauniaisten Venevalkamantie
Asunto Oy Järvenpään Saundi
Asunto Oy Järvenpään Terho
Asunto Oy Järvenpään Tuohi
Asunto Oy Keravan Ritariperho
Asunto Oy Kirkkonummen Kummihovi
Asunto Oy Kirkkonummen Pomada
Asunto Oy Kirkkonummen Tammi
Asunto Oy Nurmijärven Puurata 15-17
Asunto Oy Nurmijärven Soittaja
Bostads Ab Lindhearst Asunto Oy
Asunto Oy Vantaan Maauunintie 14
Asunto Oy Vantaan Rasinrinne
Asunto Oy Vantaan Rusakko
Major cities
Asunto Oy Härmälänrannan Nalle
Asunto Oy Jyväskylän Ahjotar
Asunto Oy Jyväskylän Kruununtorni
Asunto Oy Jyväskylän Kyläseppä
Asunto Oy Jyväskylän Tukkipoika
Asunto Oy Lahden Helkalanhovi
Asunto Oy Lahden Leinikki
Asunto Oy Lahden Poikkikatu 4
Asunto Oy Lahden Pormestari
Asunto Oy Lahden Vuoksenkatu 4
Asunto Oy Lempäälän Tikanhovi
Asunto Oy Oulun Eveliina
Asunto Oy Oulun Jatulinmetsä
Asunto Oy Oulun Merijalinväylä
Asunto Oy Oulunsalon Poutapilvi
Asunto Oy Oulun Seilitie 1
Registered
office
Espoo
Helsinki
Kauniainen
Järvenpää
Järvenpää
Järvenpää
Kerava
Kirkkonummi
Kirkkonummi
Kirkkonummi
Nurmijärvi
Nurmijärvi
Sipoo
Vantaa
Vantaa
Vantaa
Tampere
Jyväskylä
Jyväskylä
Jyväskylä
Jyväskylä
Lahti
Lahti
Lahti
Lahti
Lahti
Lempäälä
Oulu
Oulu
Oulu
Oulu
Oulu
Construction
year
Holding
2014
2000
2012
2013
2012
2013
2011
1972-73
2012
2013
1974-75
2013
1982
1975
1975
1992
13.02 %
100.00 %
24.70 %
17.57 %
4.90 %
88.20 %
99.90 %
100.00 %
32.50 %
30.51 %
58.10 %
58.90 %
64.90 %
100.00 %
75.50 %
75.00 %
2012
2014
2010
2014
2013
1975
2013
1971
2012
1970
2014
2011
2013
2012
2010
2009
6.98 %
35.18 %
36.00 %
21.01 %
12.30 %
77.20 %
9.00 %
66.10 %
8.00 %
44.30 %
51.73 %
14.10 %
7.70 %
4.60 %
4.10 %
89.10 %
52
Asunto Oy Raision Valonsäde
Asunto Oy Tampereen Professori
Asunto Oy Tampereen Ruuti
Asunto Oy Tampereen Vuoreksen Emilia
Asunto Oy Tampereen Vuorenpeikko
Asunto Oy Turun Michailowinportti
Medium size cities
Asunto Oy Haminan Tervaniemi
Asunto Oy Heinolan Tamppilahdenkulma
Asunto Oy Hämeenlinnan Aulangontie 39
Asunto Oy Kokkolan Luotsi
Asunto Oy Kotkan Alahovintie 7
Asunto Oy Kotkan Alahovintorni
Asunto Oy Kotkan Matruusi
Asunto Oy Kotkan Mällinkatu 6
Asunto Oy Kotkan Vuorenrinne 19
Asunto Oy Lohjan Koulukuja 14
Asunto Oy Lohjan Pinus
Asunto Oy Porin Kommodori
Asunto Oy Porin Pihlavankangas
Asunto Oy Kaivopolku
Kiinteistö Oy Liikepuisto
Asunto Oy Riihimäen Vuorelanmäki I
Asunto Oy Rovaniemen Rekimatka 16-18
Asunto Oy Rovaniemen Rekimatka 29
Asunto Oy Salon Ristinkedonkatu 33
Asunto Oy Savonlinnan Välimäentie 5-7
Asunto Oy Tornion Aarnintie 7
Asunto Oy Tornion Kuparimarkka
Asunto Oy Varkauden Onnela
Asunto Oy Varkauden Parsius
Asunto Oy Varkauden Ahlströminkatu 12
Raisio
Tampere
Tampere
Tampere
Tampere
Turku
2014
2013
2014
2014
2013
2013
Hamina
1999
Heinola
1977
Hämeenlinna
1974
Kokkola
2012
Kotka
1974
Kotka
1973
Kotka
2013
Kotka
1958 ja 1974
Kotka
1973-76
Lohja
1976
Lohja
2012
Pori
2013
Pori
1973
Porvoo
1993
Porvoo
1960
Riihimäki
1956
Rovaniemi
1991
Rovaniemi
1989
Salo
1975-76
Savonlinna
1977
Tornio
1974
Tornio
1975
Varkaus
1920
Varkaus
1973
Varkaus
1954
48.95 %
11.50 %
59.50 %
30.50 %
3.10 %
21.80 %
95.80 %
100.00 %
48.50 %
21.90 %
100.00 %
96.50 %
19.70 %
100.00 %
96.70 %
94.20 %
57.20 %
8.70 %
98.30 %
100.00 %
100.00 %
100.00 %
100.00 %
100.00 %
100.00 %
100.00 %
39.00 %
89.10 %
100.00 %
100.00 %
100.00 %
The companies have been consolidated using the proportional method, whereby only the amount
corresponding to the Group's holding is consolidated for each income statement and balance sheet
item. Accordingly, no minority interests are created in the Group consolidation process.
As Oy Hämeenlinnan Aulangontie underwent a basic renovation in 2003, As Oy Tornion Kuparimarkka
in 2000, As Oy Tornion Aarnintie 7 in 1990, As Oy Nurmijärven Puurata 15-17 in 1999, As Oy Riihimäen
Vuorelanmäki I in 2003, and As Oy Varkauden Ahlströminkatu 12 in 2005 (pipes).
Investment properties on 31 December
2014
Region
Espoo & Kauniainen ***)
Helsinki
Järvenpää ***)
Kerava
Kirkkonummi ***)
Nurmijärvi
No of
properties
2
1
3
1
2
2
Apartments
and
business
facilities
(pcs)
11
24
24
19
104
43
Floor
2
area(m )
703
1,436
1,986
2,071
6,973
3,094
Valuation
3,327
5,204
7,910
6,421
13,834
6,630
53
Sipoo
Vantaa *) ******)
Helsinki region *) ***)
1
3
15
14
113
352
1,140
7,118
24,519
1,848
11,502
56,676
Jyväskylä **)
Lahti
Oulu
Tampere
Turku
Major cities
4
5
5
6
2
22
20
73
25
58
18
194
2,130
4,148
1,538
3,609
1,287
12,712
4,451
5,542
3,842
11,158
4,397
29,391
Hamina
Heinola
Hämeenlinna
Kokkola
Kotka *)
Lohja
Pori
Porvoo ***) ******)
Riihimäki
Rovaniemi
Salo ****)
Savonlinna
Tornio
Varkaus *****)
Medium size cities
1
1
1
1
5
2
2
2
1
2
1
1
2
3
25
16
20
11
4
197
62
58
42
16
80
74
51
65
76
772
1,040
1,164
527
321
10,888
3,892
3,183
2,662
773
4,587
4,518
2,723
3,737
4,915
44,927
1,329
738
1,009
949
8,101
5,719
2,754
7,335
745
5,362
3,240
2,297
2,921
2,103
44,602
Total ***)
62
1,318
82,158
130,668
*) As Oy Vantaan Maauunintie 14 and As Oy Kotkan Alahovintie 7 both have one business facility
(a day care centre).
**) The apartments in As Oy Jyväskylän Kruunutorni were four office facilities and one storage
facility.
***) There are 11 business facilities at Kiint Oy Liikepuisto in Porvoo.
*****) As Oy Salon Ristikedonkatu 33 has one business facility and a day care entre.
*****) As Oy Varkauden Ahlströminkatu 12 has two business facilities.
******) From the sale of plots a total amount of EUR 1.1 million of financial assets is included
The values of the apartments owned by the REIT are measured at least on a monthly basis, and are
published at least on a quarterly basis, and always when a change in the REIT's economic situation
requires it, or when changes in the condition of the real estate have a material impact on the value of
the holdings of the REIT.
Realia Management Oy (31 Dec 2014: apartments in 50 properties) and Turun seudun OPKK
(31.12.2014: apartments in 11 properties), external appraisers, provide calculations of the value of the
investment properties owned by Orava Residential REIT every six months. The appraisal of the external
appraisers on 31 December 2014 was 0.1% higher than the fair value on the balance sheet on 31
December 2014. The valuation certificates for Asunto Oy Rovaniemen Rekimatka 16-18 and
Rovaniemen Rekimatka 29 were unfinished.
54
12.
Trade and other receivables
Rental and trade receivables
Other receivables
Prepaid expenses and accrued income
Total other receivables
31 Dec 2014
138
3,897
35
4,070
31 Dec 2013
106
90
7
203
No credit losses were booked for rental receivables during the period.
13.
Cash and cash equivalents
Cash and cash equivalents held in accounts
Total
31 Dec 2014
1,990
1,990
31 Dec 2013
9,134
9,134
In addition, the company had an overdraft facility of EUR 200,000 at its disposal.
14.
Share capital and share premium account
Share capital on 1 January
Increase in share capital, paid
Share capital on 31 Xxx
Share issue
Share premium account
Total share capital and share premium account
31 Dec 2014
43,144
7,193
50,337
7,526
2,260
60,123
31 Dec 2013
13,666
29,478
43,144
0
0
43,144
The number of share on 31 December 2011 was 1,171,736.
The number of share on 31 December 2012 was 1,366,588.
The number of share on 31 December 2013 was 4,314,394.
The number of share on 31 December 2014 was 5,206,123.
15.
Non-current liabilities
The parent company's loans from financial institutions
Overdraft facility
apitalisation of loan arrangement fees
Long-term security deposits received
Non-current loans from owneers of the parent company
Share of debt attributable to shares held bu the parent company
Total non-current liabilities
31 Dec 2014
32,646
0
-31
478
0
25,445
58,538
31 Dec 2013
23,553
0
-46
251
0
12,039
35,797
Parent company's loans from financial institutions
Danske Bank Plc, transferred 29 Mar 2011
capital repayments for the next 12 months included in current liabilities
Danske Bank Plc, transferred 7 Sep 2011
capital repayments for the next 12 months included in current liabilities
Danske Bank Plc, transferred 21 Jun 2012
capital repayments for the next 12 months included in current liabilities
Danske Bank Plc, transferred 10 Oct 2012
capital repayments for the next 12 months included in current liabilities
Danske Bank Plc, transferred 1 Nov 2012
capital repayments for the next 12 months included in current liabilities
Danske Bank Plc, transferred 27 Sep 2013
capital repayments for the next 12 months included in current liabilities
31 Dec 2014
2,127
-58
1,859
-88
2,451
-65
618
-16
903
-24
800
-21
31 Dec 2013
2,185
-58
3,325
-88
2,515
-65
634
-16
926
-24
820
-21
55
Danske Bank Plc, transferred 17 Dec 2013
capital repayments for the next 12 months included in current liabilities
Danske Bank Plc, transferred 31 Mar 2014
capital repayments for the next 12 months included in current liabilities
Danske Bank Plc, transferred 30 Apr 2014
capital repayments for the next 12 months included in current liabilities
Danske Bank Plc, transferred 25 Jun 2014
capital repayments for the next 12 months included in current liabilities
Limit of the bank account with an overdraft facility
Total loans
2,496
-62
2,280
-57
2,350
-58
1,500
-38
0
16,896
2,560
-64
0
0
0
0
0
0
0
12,631
The main covenants of the loans are tied to the ratio of debt to the value of housing company shares,
the equity-to-assets ratio and the loan servicing margin. In addition, the company had an overdraft
facility of EUR 200,000 at its disposal on 30 September 2014.
16.
Derivatives – interesrate swaps
In accordance with the risk management policy approved by the Board of Directors, the parent
company's variable-rate loans have all been converted into fixed-interest loans using interest rate
swaps. The counterparty of the interest rate swaps is Danske Bank Plc. The critical terms (i.e. amounts
and dates) of the hedging instruments and the underlying objects are identical. The bank's charges for
the derivative contracts are expensed during the period they are incurred.
Instrument
OTC interest rate swap
OTC interest rate swap
OTC interest rate swap
OTC interest rate swap
OTC interest rate swap
OTC interest rate swap
OTC interest rate swap
OTC interest rate swap
OTC interest rate swap
OTC interest rate swap
EUR 1,000
2,127
3,237
2,451
618
903
800
2,496
2,280
2,350
1,500
Fair value
At the end of the period, the fair value of interest rate swaps was
Change in fair value during the period, EUR 1,000
17.
Fixed interest
2.95
1.87
1.13
0.87
0.86
1.15
1.03
0.88
0.88
0.64
Maturity
15 Apr 2016
7 Sep 2016
21 Jun 2017
10 Oct 2017
1 Nov 2017
27 Sep 2018
18 Dec 2018
31 Mar 2018
30 Apr 2018
25 Jun 2019
31 Dec 2014
31 Dec 2013
-493
-270
-224
183
31 Dec 2014
817
295
550
269
128
284
305
5,145
44
493
8,330
31 Dec 2013
334
1,095
0
301
66
84
69
758
18
224
2,949
Lyhytaikainen vieras pääoma
Group's loans from financial institutions
Current loans from related parties
Current loans from other parties
Share of debt attributable to the shares held by the parent company
Advance payments received
Trade payables
Other liabilities
Accrued expensec and deferred income
Interest liabilities
Fair value of interest rate hedges
Total current liabilities
56
18.
Related party transactions in 2014
The company acquired a total of 131 apartments from A. Ahlström Real Estate Ltd and its
subsidiaries through transactions implemented on 25 June 2014. Their aggregate debt-free
purchase price was EUR 4.1 million. The transaction included the assignment of a
contribution in kind of EUR 1.34 million, which was paid with 104,415 new shares issued by
the company and the subscription of 206,708 new shares in a directed issue allocated to
the seller. The subscription price of the new shares, EUR 12.82 per share, was the
average price of the company's share on the Helsinki Stock Exchange during the five
trading days preceding 25 June 2014, the date of implementation of the transaction,
weighted by share turnover, adjusted for the dividends decided by the Annual General
Meeting but not paid (EUR 0.56 per share).
A. Ahlström Real Estate Ltd made a subscription commitment for 114,806 shares at a price
of EUR 12.63 per share in the directed issue in September. The subscription of 114,806
shares was accepted at the meeting of the Board of Directors on 30 September 2014. The
share-specific subscription price of new shares could be paid it is entirety or partly in
subscriptions in kind, instead of cash. The transaction of As Oy Mällinkatu 6 was
implemented in its entirety as a share exchange. The subscription price was the average
stock exchange price on the Helsinki Stock Exchange, weighted by the turnover during the
five trading days preceding the subscription period.
On 31 December 2014, the company concluded a binding agreement on the acquisition of
Asunto Oy Rovaniemen Rekimatka 16–18 and Asunto Oy Rovaniemen Rekimatka 29. The
properties include a total of 80 apartments. The purchase price of EUR 4.0 million was paid
with new shares issued by the company in a directed issue allocated to Royal House Oy.
The subscription price of the shares, EUR 10.60 per share, was the weighted average
price of the share during the five days of trading on the Helsinki Stock Exchange preceding
the date of concluding the agreement.
The fixed management fee of the management company Orava Funds plc was EUR
613,500 and the performance-based management fee was EUR 847,000, of which no
more than half will be paid in shares and approximately half in cash. In addition, Orava
Funds has received EUR 20,000 in share issue management fees.
19.
Collateral and contingent liabilities
31 Dec 2014
31 Dec 2013
Debts for which mortgages to real estate have been pledged
In total
34 523
1 790
Loans for which shares have been pledged
Loans from financial institutions
32 645
14 060
Total fair value of the pledged shares
63 620
As Oy Vantaan Maauunintie 14 and the Porvoo-based Kiint Oy Liikepuisto and As Oy
Kaivopolku in Porvoo sold the plots they owned in October 2014. In the same connection,
they entered into leases of 60 years.
57
20.
Financial instruments
Management of financing risks
The objective of Orava Residential REIT's risk management is to minimise the negative effects of changes in
the financial markets on the company's cash flow, financial result and equity. The Board of Directors of Orava
Residential REIT decides on the objectives of risk management, determines the risk management policy and is
responsible for monitoring risk management activities. The operational policy observed in financial operations
is to avoid risks.
Interest rate risk
Orava Residential REIT uses variable-rate loans from financial institutions to finance its acquisitions. The loans
are hedged with interest rate swaps. On 31 December 2014, the hedging rate of loans was a bit over 100%
(31 December 2013: 100%) because the company shorted one of it's long-term loans by EUR 1.363 million at
the last quarter of year 2014. The derivative contracts have been concluded for the purpose of hedging the
loan portfolio, and they are measured at fair value in the financial statements. The fair value represents the
result that would have been created had the derivative positions been closed on the balance sheet date. The
derivative contracts are measured on the basis of the zero-coupon euro swap curve published and calculated
by Deutsche Bundesbank on the basis of market data for the balance sheet day. The cash flows of each
payment transaction of the interest rate swaps are discounted, and the market value of swaps is calculated by
linear interpolation using the interest rates determined from the above zero-coupon curve and valuation
methods commonly used on the market. The net losses/gains for the financial period, recorded in other
comprehensive income items, are shown under the consolidated statement of comprehensive income. A
change of one percentage point in short market interest rates will not affect the financial result of the company.
Liquidity risk
The Group seeks to constantly assess and monitor the amount of financing required for business operations in
order to ensure that the Group has sufficient liquid funds to finance its operations. The risk regarding the
availability of financing has been mitigated through regular negotiations with several providers of financing.
The company expects to be able to renew the loans maturing in the coming years. On 31 December 2014, the
average maturity of the parent company's bank loans was 3.3 years (31 December 2013: 3.7 years).
Credit risk
Credit risk arises from the possibility that the counterparty to an agreement fails to meet its contractual
obligations. On the balance sheet date, the major credit risks faced by the Group were due to rental
receivables. The Group does not have any significant concentrations of receivable or credit risks. On 31
December 2014, rental receivables totalled EUR 138,000 (31 December 2013: 106,000), of which EUR 83,000
had been referred for debt collection (31 December 2013: EUR 71,000). Receivables in collection less than
two months old amounted to EUR 46,000, and receivables more than two months old to EUR 37,000.
Capital management
The objective of capital management is to secure the Group's capability for continuous operations so that it
can produce income for its owners and benefits for its other stakeholders. Another objective is to maintain an
optimal capital structure, for example when interest rates change.
In order to maintain or change its capital structure, the Group may, within the constraints of the Limited Liability
Companies Act and the Tax Exemption Act, change the amount of dividends payable to its shareholders, issue
new shares or sell apartments it owns in order to reduce its debts. On 31 December 2014, the equity-to-assets
ratio was 51.1 % (31 December 2013: 56.2 %).
58
The Group's bank loans not included in derivative liabilities and other interest-bearing liabilities were as
follows at the end of the period under review, shown by contractual periods of maturity. The amounts disclosed
are non-discounted cash flows of loan repayments based on loan agreements.
December 31 2014
Interest bearing loans, EUR 1,000
21.
less than 1
year
1,931
1-5 years
26,200
over 5
years
31,859
Assesment of fair value
The following table shows assets and liabilities measured at fair value broken down by the valuation method in
thousands of euros. The levels used are defined as follows:
Level 1 Prices of totally identical assets or liabilities quoted on active markets
Level 2 Input information, other than the quoted prices included in Level 1, that is observable for the asset
item concerned
Level 3 Input information regarding the asset item or liability which is not based on any observable market
information
Level 1
Level 2
Level 3
Assets
Investment properties on 31 Dec 2014
Investment properties on 31 Dec 2013
Investment properties on 31 Dec 2012
Investment properties on 31 Dec 2011
-
126,986
76,594
31,992
20,263
3,682
2 596
-
Liabilities
Interest rate hedging contratcs on 31 Dec 2014
Interest rate hedging contratcs on 31 Dec 2013
Interest rate hedging contratcs on 31 Dec 2012
Interest rate hedging contratcs on 31 Dec 2011
-
-493
-223
-407
-164
-
22. Events after reported period
The 500,000 shares allocated to the company itself in a charge-free directed issue on 17
December 2014 were recorded in the Trade Register on 5 January 2015. The company
may use the shares allocated to it to strengthen the capital structure, develop its business
operations and expand its ownership base through both acquiring investment properties
and issuing convertible bonds. After the issue, the number of the company's shares totalled
5,706,123. On 19 January 2015, the company submitted a listing application for 47,800
shares to be admitted to trading on the stock exchange list of the Helsinki Stock Exchange
as of 20 January 2015. After the listing, the total number of the company's listed shares
was 5,253,923.
On 23 January 2015, the company specified the result estimate for the fourth quarter.
Orava Residential REIT estimated in its interim report for the third quarter published on 7
November 2014 that the financial result for the fourth quarter is expected to remain weaker
than that for the third quarter. The comprehensive profit for the third quarter was EUR 1.9
million. The company's further specified estimate of the result for the fourth quarter was
EUR 1.7–2.3 million.
On 23 January 2015, the company announced that it is investigating possibilities for the
implementation of a financing arrangement of an estimated EUR 40 million. The
arrangement would consist of a credit facility of an estimated EUR 15 million, which would
59
be used to finance the acquisition of new properties, and a covered bond of an estimated
EUR 25 million, which would mainly be directed to domestic institutional investors and
whose purpose would be to refinance the company's existing loans and promote the
expansion of the company's business operations.
The Financial Supervisory Authority approved the company's prospectus, which is related
to the listing of a total of 1,056,122 shares, on 23 January 2015. The shares are related to
the directed issue allocated to Osuusasunnot Oy (235,922 shares), communicated by the
company on 28 November 2014, the directed issue allocated to Royal House Oy (368,000
shares), communicated on 31 December 2014, and the charge-free directed issue
allocated to the company itself (500,000 shares). The company also filed an application
with the Helsinki Stock Exchange concerning the admission to trading of the shares
subscribed in the directed issue allocated to Osuusasunnot Oy and the charge-free shares
allocated to the company itself, in total 688,122 shares, on the stock exchange list of the
Helsinki Stock Exchange with the trading code OREIT. Trading in the shares in question
started on 27 January 2015. The ISIN code of the shares listed is FI4000068614.
The 368,000 shares allocated to Royal House Oy were recorded in the Trade Register on
11 February 2015 and applied to be admitted to trading on the Helsinki Stock Exchange in
connection with the finalization of the transaction on 9 February 2015. In addition, the
company allocated a charge-free share issue of 200,000 shares to itself. The shares
allocated to the company itself do not entitle their holders to dividends to be paid from the
result for 2014 in 2015. After the aforementioned shares have been registered, the number
of the company's registered shares totals 6,510,045, and the company's registered share
capital is EUR 56,376,500.
On 10 February 2015, the company implemented a transaction for 22 apartments with
Skanska Rakennus Oy at a debt-free purchase price of EUR 4.6 million. The apartments
purchased are located in two new properties, one in Mikkeli (12 apartments) and the other
in Pori (10). The apartments were without tenants at the time of the acquisition.
At its meeting on 11 February 2015, the Board of Directors allocated 39,952 shares to the
management company Orava Funds plc. The subscription price of the shares was the
weighted average price during the last five days of stock exchange trading in 2014. Orava
Funds plc set off the payment of the subscription price against its performance-based
management fee receivable of EUR 423,491.20 to be paid in shares.
Financial indicators for the group
Revenue, EUR 1,000
Operating profit, EUR 1,000
Financial result for the period, EUR 1,000
Comprehensive profit for the period, EUR
1,000
Earnings per share, EUR
Maximum dividends to be paid during the
financial period per share, EUR
Dividends / Comprehensive profit ratio, %
Return on equity, % p.a. (ROE)
Total return per share, % p.a.
Weighted average number of shares adjusted
1 Jan - 31
Dec 2014
1 Jan - 31
Dec 2013
1 Jan - 31
Dec 2012
15,327
9,905
8,451
9,682
7,439
6,753
3,180
1,884
1,421
8,181
6,936
1,178
1.83
3.19
1.14
1.20
1.12
1.08
87.8 %
14.7 %
13.9 %
4,622,183
69.6 %
33.4 %
14.9 %
2,117,600
114.3 %
10.2 %
9.1 %
1,337,387
60
for share issues
Balance sheet total, EUR 1,000
Equity/assets ratio, %
Loan to value ratio, %
Net asset value per share, EUR, NAV
Adjusted net asset value per share, EUR,
NAV
Net gearing, %
Number of shares 31. Dec
Adjusted number of shares 31 Dec
Market capitalisation 31 Dec, EUR 1,000
Economic occupancyu rate, %, (EUR)
Operational occumancy rate, %, (m2)
Tenant turnover/month
Gross rental yield, %
of fair value
Net rental yield, %
of fair value
EPRA Earnings, EUR 1,000
EPRA Earnings per share, EUR
EPRA Net Asset Value, EUR, 1,000
EPRA Net Asset Value per share, EUR
EPRA Net Initial Yield (NIY), %
EPRA Vacancy Rate
31 Dec 2014
31 Dec 2013
31 Dec 2012
136,728
51.1 %
43.9 %
13.52
88,526
56.3 %
42.2 %
11.54
32,424
46.3 %
51.3 %
10.98
83.0 %
5,206,123
5,810,611
56.6 %
4,314,394
-
53,362
44,345
113.3 %
1,366,588
-
31 Dec 2014
31 Dec 2013
31 Dec 2012
89.4 %
88.7 %
2.1 %
93.8 %
92.5 %
2.3 %
96.7 %
96.5 %
3.0 %
6.7 %
8.0 %
8.0 %
4.0 %
4.5 %
4.8 %
1,972
908
1,115
0.43
0.43
0.90
70,353
50,004
15,413
12.11
11.59
11.28
4.0 %
3.9 %
5.4 %
10.6 %
6.2 %
5.6 %
12.02
Formulas for financial indicators
Earnings per share, EUR
=
Financial result for the period attributable to the shareholders of the
parent company
Weighted average number of shares during the reported period
Return on equity, %
(ROE)
=
Profit/loss for the period x 100
Equity (average during the reported period)
61
Total return per share, %
per year
=
Equity/assets ratio, %
=
Equity x 100
Balance sheet total less advance payments received
Loan to value ratio, %
Loan to Value
=
The Group's share of outstanding capital of interest-bearing loans
Debt-free value of housing company shares and other assets
Net asset value per share, EUR
NAV
=
Equity attributable to the shareholders of the parent company
Number of shares at the end of the reported period
Net gearing, %
=
Interest-bearing liabilities - liquid assets x 100
Equity
economic occupancy rate, %
=
(EUR)
Net assets per share at the end of year + dividends paid per share
Net assets per share at he beginning of the year
Gross rental income for the reported period per the number of
months
Potential gross rental income for the reported period per the number
of months
Square meters let on the last day of the month during the reported
period per the number of months
Operational occupancy rate, %
2
(m )
=
Tenant turnover
=
Expired agreements per month
Number of apartments available for letting on the last day of the month
Gross rental yield, %
=
Gross rental income x 100
Market value of the rent portfolio at the end of the reported period
Square meters available for letting on the last day of the month
during the reported period per the number of months
Calculated on a monthly basis; the figure for the reported period is
the average of the monthly figures
Net rental yield, %
=
Gross rental income less expenses = net income x 100
Market value of the rent portfolio at the end of the reported period
Calculated on monthly basis; value for the period is the average of
monthly values
FORMULAS FOR EPRA INDICATORS
EPRA Earnings
(Operational result)
=
Net rental income
- marketing and administrative expenses
+/- other operating income and expenses included in operations
EPRA Earnings per share
(Operational result per share)
=
EPRA Earnings
Weighted average number of shares during the reported period
EPRA Net Asset Value
(Net assets)
=
Equity attributable to the shareholders of the parent company
- any other equity reserve
-1
x 100
62
EPRA Net Asset Value per share
=
(Net assets per share)
EPRA Net Asset Value
Undiluted number of shares at the end of the reported period
EPRA Net Initial Yield (NIY), %
(Initial yield)
=
Annualised rental income including indexation adjustments on 31
xxxx
Invetment properties less properties under development on 31 xxxx
EPRA Vacancy Rate
=
Potential rent from vacant apartments
Potential rent from apartments available for letting
63
Parent company financial statements 1 Jan – 31 Dec 2014
Parent company income statement
Note
REVENUE
2.1.
Other operating income
1 Jan - 31 Dec
2014
1 Jan - 31 Dec
2013
EUR
EUR
15,383,703.85
9,686,184.76
0.00
0.00
Personnel expenses
2.2.
-107,288.00
-53,599.20
Depreciation an pmpairment losses
2.3.
-253,879.30
-64,562.92
Other operating expenses
2.4.
-5,717,410.42
-2,280,478.32
9,305,126.13
7,287,544.32
-2,091,853.81
0.00
6,201.68
6,201.68
-907,907.19
0.00
16,865.89
16,865.89
0.00
0.00
-454,182.11
-1,643,873.38
-2,098,055.49
-406,442.74
-518,330.34
-924,773.08
Total finance income and expenses
-2,091,853.81
-907,907.19
PROFIT/LOSS BEFORE EXTRAORDINARY ITEMS
7,213,272.32
6,379,637.13
7,213,272.32
6,379,637.13
-42,809.80
-47,517.26
7,170,462.52
6,332,119.87
OPERATING PROFIT/LOSS
Finance income and expenses
Returrn on holdings in Group companies
Other interest and finance income
Impairment losses from investments in fixed assest
Interest expenses and other finance expenses to Group
companies
Interest expenses and other finance expenses
PROFIT/LOSS BEFORE APPROPRIATIONS AND TAXES
Income taxes
PROFIT/LOSS FOR THE PERIOD
2.6.
64
Parent company balance sheet
Note
ASSETS
31 Dec 2014
31 Dec 2013
EUR
EUR
NON-CURRENT ASSETS
Intangible assets
3.1.1.
1,498,677.21
1,361,802.13
Investments
Holdings in group undertakings
Other holdings and shares
3.1.3.
71,011,289.33
63,619,674.46
7,391,614.87
47,061,415.55
43,396,342.81
3,665,072.74
72,509,966.54
48,423,217.68
17,603,603.34
8,465,296.04
4,242,602.17
1,468,940.15
304,805.16
8,809,255.09
23,315,145.66
17,579,356.29
95,825,112.20
66,002,573.97
50,337,280.00
3,535,587.59
7,525,329.93
1,524,467.35
7,170,462.52
70,093,127.39
43,143,940.00
1,155,758.69
17,288.58
6,332,119.87
50,649,107.14
17,387,698.29
16,910,023.07
477,675.22
12,881,802.63
12,631,500.00
250,302.63
TOTAL NON-CURRENT ASSETS
CURRENT ASSETS
Short-term receivables
Cash in hand and at bank
3.1.4.
TOTAL CURRENT ASSETS
TOTAL ASSETS
EQUITY AND LIABILITIES
EQUITY
Share capital
Invested unrestricted equity fund
Retained earnings
Profit (loss) for the financial year
TOTAL EQUITY
3.2.1.
LIABILITIES
Long-term liabilties
Loans from credit institutions
Other liabilities
65
Short-term liabilities
Loans from credit institutions
Deferred income
Accounts payable
Depts to group companies
Other current liabilities
Accrued liabilities
TOTAL LIABILITIES
TOTAL EQUITY AND LIABILITIES
3.2.3.
8,344,286.52
487,250.00
118,549.37
82,371.05
1,255,404.06
1,106,630.20
5,294,081.84
2,471,664.20
334,000.00
61,695.85
2,666.53
227,945.52
1,154,800.47
690,555.83
25,731,984.81
15,353,466.83
95,825,112.20
66,002,573.97
Notes to the income statement of the parent company
2.1 Revenue
Parent company
1 Jan - 31 Dec 2014
Revenue
Rental income
Compensation for use
Capital gains and changes in fair value
Total Revenue
Parent company
1 Jan – 31 Dec 2013
6 266 795,74
204 113,41
8 912 794,70
3 037 542,93
97 453,21
6 551 188,62
15 383 703,85
9 686 184,76
2.2 Notes on personnel
Parent company
1 Jan - 31 Dec 2014
Parent company
1 Jan – 31 Dec 2013
Salaries, remuneration and pension costs for the period
Salaries and remuneration
Pension costs
Salaries, remuneration and pension costs for the period
-107 288,00
0,00
-107 288,00
-53 599,20
0,00
-53 599,20
Management salaries and remuneration
Memebers of the Board of Directors
-107 288,00
-53 599,20
2.3 Other operating expenses
Parent company
1 Jan - 31 Dec 2014
Other operating income
Management fees
Administrative expenses
Property maintenance expenses
Expenses from rental operations
Credit losses
Total other operating income
-1 460 489,00
-614 966,52
-3 285 403,57
-342 102,64
-14 448,69
-5 717 410,42
Parent company
1 Jan – 31 Dec 2013
-261 529,29
-362 326,08
-1 562 366,14
-96 751,51
2 494,70
-2 280 478,32
66
2.5 Auditor’s fees
Authorized Public Accountants
PricwaterhouseCoopers Oy
Audit fees
Total
Parent company
1 Jan - 31 Dec 2014
-45 784,32
-45 784,32
Parent company
1 Jan – 31 Dec 2013
-31 707,89
-31 707,89
1
2.6 Finance income and expenses
Parent company
1 Jan - 31 Dec 2014
Parent company
1 Jan – 31 Dec 2013
Other interest and finance income
From Group companies
From others
Total other interest and finance income
6 201,68
6 201,68
16 865,89
16 865,89
Total finance income
6 201,68
16 865,89
Interest expenses and other finance expenses
To Group companies
To others
Total interest expenses
-454 182,11
-1 643 873,38
-2 098 055,49
-406 442,74
-518 330,34
-924 773,08
Total finance expenses
-2 098 055,49
-924 773,08
Total finance income and expenses
-2 091 853,81
-907 907,19
3. Notes to the balance sheet
3.1.1. Investment properties
Parent
company
31 Dec 2014
Investment properties
31 Dec 2013
89 156 474,20 56 888 513,72
3.1.2 Breakdown of receivables
Current receivables
Parent company
31 Dec 2014
31 Dec 2013
Receivables from Group companies
Maintenance charge receivables and
receivables for compensation for use
193 383,76
97 814,08
Total
193 383,76
97 814,08
67
Receivables from others
Rental receivables
Other receivables
Prepaid expenses and accrued income
Total
Total current receivables
124 001,43
3 901 260,18
23 956,80
4 049 218,41
99 912,74
104 180,68
2 897,66
206 991,08
4 242 602,17
304 805,16
3.2 Notes to equity and liabilities
3.2.1Shareholder’s equity
Parent company
31 Dec 2014
31 Dec 2013
Share capital
Share capital 1.1.
Transfer as an increase in share capital
43 143 940,00
7 193 340,00
13 665 580,00
29 478 360,00
Share capital 31.12.
50 337 280,00
43 143 940,00
Total share capital
50 337 280,00
43 143 940,00
Unrestricted equity
Share issue
7 525 329,93
0,00
1 155 758,69
2 379 828,90
3 535 587,59
280 924,43
874 834,26
1 155 758,69
6 349 408,45
-4 824 941,10
1 524 467,35
1 363 813,69
-1 346 525,11
17 288,58
7 170 462,52
6 332 119,87
Total unrestricted equity
19 755 847,39
7 505 167,14
Total equity
70 093 127,39
50 649 107,14
Reserve for invested unrestricted equity 1.1.
Reserve for invested unrestricted equity, increase
Total other reserves 31.12.
Retained earnings (losses) 1.1.
Distribution of funds from retainded earnings
Retained earning 31.12.
Profit/loss for the period
68
3.2.2 Statement of distributable funds
Parent company
31 Dec 2014
31 Dec 2013
Retained earnings/losses
Decrease in earnings
Profit for the period
Other reserves
Total distributalble funds
6 349 408,45
-4 824 941,10
7 170 462,52
3 535 587,59
12 230 517,46
1 363 813,69
-1 346 525,11
6 332 119,87
1 155 758,69
7 505 167,14
3.2.3 Liabilities
Parent company
31 Dec 2014
31 Dec 2013
Non-current liabilities
Loans from financial institutions
Unused overdraft facility
Other non-current liabilities
Long-term security deposit received
Total non-current liabilities
Current liabilities
Loans from financial institutions
Advance payments received
Trade payables
Liabilities to Group companies
Maintenance charge liabilities to Group
companies
Total liabilities to Group companies
Other liabilities
Accrued expenses and deferred income
Interest liabilities
Total current liabilities
Total liabilities
16 910 023,07
0,00
0,00
477 675,22
17 387 698,29
12 631 500,00
0,00
0,00
250 302,60
12 881 802,60
487 250,00
118 549,37
82 371,05
334 000,00
61 695,85
2 666,53
1 255 404,06
1 255 404,06
1 106 630,20
5 273 130,25
8 344 286,52
227 945,52
227 945,52
1 154 800,47
671 898,18
18 657,65
2 471 664,20
25 731 984,81
15 353 466,80
20951,59
The main covenants of the loans from financial institution are tied to the ratio of debt to the
value of the housing company shares, the equity/assets ratio and the loan servicing margin.
69
The Board of Directors’ proposal for profit distribution
The distributable funds of the parent company in accordance with the Companies Act and the Tax
Exemption Act in the consolidated financial statement amounted to EUR 8,694,929.87, of which profit
for the year is EUR 7,170,462.52.
The Board of Directors proposes that the Board of Directors is authorised to decide on distribution of
profit for 2014 before 31 December 2015 as follows: No more than EUR 1.20 per share will be paid in
dividends for shares (ISIN code FI4000068614) not in the company's possession and issued in the
book-entry system no later than on 19 March 2015 according to the following table.
ISIN code of the share
Dividend right
Shares (pcs)
Dividend/year (EUR)
Total/year (EUR)
FI4000068614
100 %
5,984,262
1.20
7,181,114.40
In addition, according to the possible authorisation in article 15 of the notice of Annual General Meeting
26 February 2015*, the company may also issue shares through directed issues that entitle to dividend
as of the beginning of April 2015.
ISIN code of the share
Dividend right
Shares (pcs)
Dividend/year (EUR)
Total/year (EUR)
FI4000068614
100 % as of 1 April 2015
1,500,000
0,90
1,350,000.00
No more than EUR 8,531,114.40 will be distributed in dividends. The dividends will be paid in four
instalments of EUR 0.30. The dividend payment dates are 31 March 2015, 30 June 2015, 30 September
2015 and 30 December 2015.
A minimum of EUR 163,815.47 to be left in the unrestricted equity.
The Board of Directors will be obligated to supervise solvency before the payment of each dividend and,
as necessary, reduce the amount of dividends to be paid in each quarter if the company's solvency
were to be endangered due to the distribution of dividends. The Board of Directors will be authorised to
decide at its meetings on the dividend record dates, which will be two days from the decision of the
Board of Directors and approximately five days before the payment dates .
70
List of accounting books and voucher types and storage methods
REPORTS OF TIKON FINANCIAL ADMINISTRATION SOFWARE AS COMPUTER
PRINTOUTS
Annual accounts book
General journal
Nominal ledger
Rent ledger invoice and payment journals
bound
digital
digital
digital
VOUCHER TYPES USED
Memorandum vouchers
Bank vouchers
Bank vouchers
Bank vouchers
Fair value change vouchers
Adjustments to subsidiaries’ reports
Rent vouchers
Rent vouchers
Purchase invouces (WorkFlow)
Other purchase invoices
Purchase invoice payments
Changes in debt ratio
IFRS-adjustments
Other adjustments in Group
voucher type
voucher type
voucher type
voucher type
voucher type
voucher type
voucher type
voucher type
voucher type
voucher type
voucher type
voucher type
voucher type
voucher type
9
2-6
13-14
16-17
7
12
11
20
35
32
37
70
85
90
digital
digital
digital
digital
digital
digital
digital
digital
digital
digital
digital
digital
digital
digital
Newsec Asset Management Oy.is responsible for the storage of the accounting
material
STORAGE METHOD OF ACCOUNTING BOOKS AN VOUCERS
Accounting books shall be stored for at least ten years from the end of the financial period and
vouchers for at least six years from the end of the year in shich the financial
period ends.
71
Signatures for Financial statements and Board of Director’s report
Helsinki, 11 February 2015
_________________________________________
Jouni Torasvirta
Chairman of the Board
________________________________________
Veli Matti Salmenkylä
Member of the Board
_________________________________________
Peter Ahlström
Member of the Board
________________________________________
Mikko Larvala
Member of the Board
_________________________________________
Tapani Rautiainen
Member of the Board
________________________________________
Timo Valjakka
Member of the Board
_________________________________________
Pekka Peiponen
CEO
The Auditor’s Note
Our auditors’ report has been issued today.
Helsinki, 26 February 2015
PricewaterhouseCoopers Oy
Authorized Public Accountants
________________________________________
Eero Suomela
KHT
72
AUDITOR'S REPORT
To the General Meeting of Orava Residential Real Estate Investment Trust plc
We have audited the accounting, financial statements, Board of Directors' report and administration of
Orava Residential Real Estate Investment Trust plc for the financial period 1 January – 31 December
2014. The financial statements include the consolidated statement of financial position, income
statement, statement of comprehensive income, statement of changes in equity, cash flow statement
and notes, as well as the parent company balance sheet, income statement, cash flow statement and
notes.
Responsibilities of the Board of Directors and the CEO
The Board of Directors and the CEO are responsible for preparing the financial statements and the
Board of Directors' report and ensuring that the consolidated financial statements provide a true and fair
view in accordance with the International Financial Reporting Standards (IFRS) endorsed for use in the
EU and that the financial statements and the Board of Directors' report provide a true and fair view in
accordance with the provisions concerning the preparation of financial statements and Board of
Directors' report valid in Finland. The Board of Directors is responsible for the appropriate organisation
of the supervision of accounting and financial affairs, and the CEO is responsible for ensuring that the
accounting is in accordance with the law and that the financial affairs are organised in a reliable
manner.
Duties of the auditor
It is our duty to issue an opinion on the financial statements, consolidated financial statements and
Board of Directors' report on the basis of the audit conducted by us. The Auditing Act requires that we
comply with the principles of professional ethics. We have conducted the audit in accordance with the
good auditing practice followed in Finland. Good auditing practice requires that we plan and perform the
audit to acquire reasonable assurance as to whether there are material misstatements in the financial
statements or the Board of Directors' report and whether the members of the parent company Board of
Directors or the CEO are guilty of an act or neglect that may result in a liability to pay damages to the
company or whether they have breached the Limited Liability Companies Act or the Articles of
Association.
The audit includes measures to acquire auditing evidence on the figures included in the financial
statements and the Board of Directors' report and on other information presented in them. The choice of
measures used is based on the auditor's discretion and includes the assessment of the risks of material
misstatement due to malpractice or error. When assessing these risks, the auditor takes into account
internal control, which is significant in the company when examining the preparation of the financial
statements and determining whether the Board of Directors' report provides a true and fair view. The
auditor assesses internal control in order to be able to plan appropriate auditing measures in view of the
73
circumstances, but not for the purpose of giving an opinion on the efficiency of internal control within the
company. The audit also includes the assessment of the appropriateness of the accounting principles
applied, the reasonableness of the accounting estimates made by the operational management and the
general manner of presentation of the financial statements and the Board of Directors' report. In our
view, we have acquired the necessary amount of appropriate auditing evidence to form the basis for our
opinion.
Opinion on the consolidated financial statements
It is our opinion that the consolidated financial statements provide a true and fair view of the financial
position of the Group, the result of its operations and its cash flows in accordance with the International
Financial Reporting Standards (IFRS) endorsed for use in the EU.
Opinion on the financial statements and the Board of Directors' report
It is our opinion that the financial statements and the Board of Directors' report provide a true and fair
view of the operational result of the Group and the parent company and their financial position in
accordance with the provisions concerning the preparation of financial statements and Board of
Directors' report valid in Finland. There are no conflicts between the information in the Board of
Directors' report and the financial statements.
Helsinki, 26 February 2015
PricewaterhouseCoopers Oy
_______________________
Eero Suomela
Authorised Public Accountant


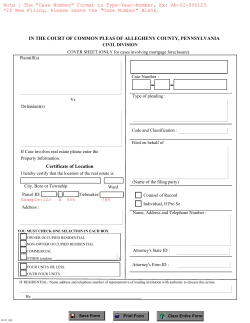


© Copyright 2026