
Supplementary Financial Document for the First Half of the Year
2nd quarter (7. 2014 - 9. 2014)
FIELDS CORPORATION
The Greatest Leisure for All People
FIELDS CORPORATION
(Code:2767)
Supplementary Financial Document
for the First Half of the Year Ending March 31, 2015
FIELDS CORPORATION
The Greatest Leisure for All People
November 4, 2014
The Greatest Leisure for All People
Copyright 2014
FIELDS CORPORATION
All rights reserved.
FIELDS CORPORATION
The Greatest Leisure for All People
Index
1. Highlights for the H1 of the Year Ending March 31, 2015
P.
3
2. Supplementary Data for the H1 of the Year Ending March 31, 2015
P.
7
(Consolidated)
P/L Statement
P.
4
Number of Pachinko/Pachislot Machines Sold
P.
8
(Consolidated)
B/S
P.
5
Change in the Number of
Pachinko/Pachislot Machines Sold (Graph)
P.
9
(Consolidated)
Cash Flows
P.
6
Pachinko/Pachislot Machines’ Titles
from 3.2013 to 3.2015
P. 10
Appendix
3. Appendix I
P. 11
4. Appendix II
Corporate Profile
・Corporate Profile
・Stock Information
P. 28
P. 12
Our Tracks
P. 13
P. 29
Developing Business Model
Main group companies
P. 14
Pachinko/Pachislot Market
・Market Scale of Pachinko/Pachislot Industry
・Change in Pachinko/Pachislot Market Scale
・Change in Number of Pachinko/Pachislot Players
・Income Structure of Pachinko Halls
Business Model (PS Planning, Development and Sales)
FIELDS CORPORATION
Accounting
Method of Pachinko/Pachislot Sales (Image)
P. 15
P. 30
Business Flow and Accounting Method of
Merchandising Rights Regarding Pachinko/Pachislot
Planning and Development
Glossary of Fields’ Pachinko/Pachislot Machine Sales
Players in the Pachinko/Pachislot Industry
Recent Trend of Pachinko/Pachislot Industry
P. 16
The Greatest Leisure for All People
Cumulative Number of Pachinko/Pachislot Series Sold
(by Main IP)
Number of Pachinko/Pachislot Machines Sold (Details)
Titles of Pachinko Machines Sold (3.2002-3.2014)
Titles of Pachislot Machines Sold (3.2001-3.2014)
Change of “Evangelion” Series
Change in Quarterly P/L Statement (Table)
Financial Highlights
Change in Financial Results (Graph) (Consolidated)
Change in Assets/Liabilities, Net Assets (Graph)
(Consolidated)
Change in Selling, General and Administrative Expenses
(Graph) (Consolidated)
Change in Free Cash Flow (Graph)
(Pachinko/Pachislot Market Data)
Number of Pachinko Halls and Change in Number of
Pachinko/Pachislot Machines Installed Per Hall
Number of Installed Pachinko/Pachislot Machines
and Annual Turnover Rate
P. 17
P.
P.
P.
P.
18
19
20
21
P. 31
Unit Sales and Sales Amount of Pachinko/Pachislot
Machines
Market Share by Manufacturers
・Unit Sales Share - Pachinko Machines
・Unit Sales Share - Pachislot Machines
P. 32
Monthly Trends of Pachinko Halls
P. 33
5. Appendix III
P. 34
P. 24
Market Scale of Content Business
Market Scale of Digital Content Business
P. 35
P. 25
Sales Amount of Comic Books and Comic Magazines
Market Scale of Animation Industry
P. 36
Box-Office of Domestic Movie Theaters
Market Scale of Broadcasting Industry
P. 37
Market Scale of Mobile Business
P. 38
Reference: Notification of Our IR Site
P. 39
P. 22
P. 23
CSR Activities
・Fields Topics
・Group Companies Topics
P. 26
Corporate Governance System
Profit Return Policy
P. 27
(Entertainment Market Data Except Pachinko/Pachislot Industry)
Copyright 2014
FIELDS CORPORATION
All rights reserved.
2
FIELDS CORPORATION
The Greatest Leisure for All People
1. Highlights for the First Half of the Year Ending March 31, 2015
FIELDS CORPORATION
The Greatest Leisure for All People
Copyright 2014
FIELDS CORPORATION
All rights reserved.
3
FIELDS CORPORATION
The Greatest Leisure for All People
Highlights for the H1 of the Year Ending March 31, 2015 (Consolidated)
【 P/L Statement 】*The numbers in upper parenthesis is YoY, the numbers in lower parenthesis is ratio to net sales.
Year Ended March 31, 2014
H1
Full-Year
Net sales
(Unit: Millions of yen)
Year Ending March 31, 2015
H1
Full-Year Forecast
(125.0)
(106.3)
(55.9)
36,385
114,904
20,341
[100.0]
[100.0]
[100.0]
(154.7)
(101.6)
(50.7)
Gross profit
13,648
33,812
6,920
[37.5]
[29.4]
[34.0]
(107.4)
(104.6)
(95.9)
SG&A expenses
11,471
24,020
10,998
[31.5]
[20.9]
[54.1]
(-)
(94.9)
(-)
Operating income
2,176
9,791
(4,077)
[6.0]
[8.5]
[-20.0]
(-)
(95.1)
(-)
Ordinary income
2,144
9,765
(4,072)
[5.9]
[8.5]
[-20.0]
(-)
(113.8)
(-)
Net income
1,434
5,370
(2,509)
[3.9]
[4.7]
[-12.3]
100,000
-
-
5,000
5,000
2,500
* “YoY” and “ratio to net sales” are calculated on this sheet above.
FIELDS CORPORATION
The Greatest Leisure for All People
Source: Fields
Copyright 2014
FIELDS CORPORATION
All rights reserved.
4
FIELDS CORPORATION
The Greatest Leisure for All People
【 B/S 】
Highlights for the H1 of the Year Ending March 31, 2015 (Consolidated)
At March
31, 2014
At September
30, 2014
(Unit: Millions of yen)
Increase/
Decrease
Factors
Cash and cash equivalents
29,583
16,178
(13,405)
Notes and accounts
receivable—trade
29,155
5,618
(23,537)
Inventories
3,134
4,147
1,013
Other
5,083
7,837
2,754
(34)
(28)
6
66,921
33,752
Land
7,875
7,737
(138)
Other
4,229
4,577
348
12,104
12,314
210
Goodwill
1,905
1,749
(156)
Other
2,460
2,641
181
Total intangible fixed assets
4,365
4,390
25
15,607
14,096
(1,511)
6,944
6,903
(41)
(1,074)
(1,048)
26
21,477
19,951
(1,526) Decrease in investment securities
37,948
36,656
(1,292)
104,869
70,408
(34,461)
33,105
5,586
(27,519)
Accrued income taxes
1,959
139
(1,820)
Other
6,666
5,517
(1,149)
41,730
11,242
4,386
4,151
46,116
15,394
(30,722)
Common stock
7,948
7,948
0
Capital surplus
7,994
7,994
0
Retained earnings
44,548
41,351
(3,197)
Treasury stock
(1,821)
(1,821)
0
58,670
55,473
(3,197)
(262)
(853)
(591)
(390)
(968)
(578)
473
509
36
58,753
55,014
104,869
70,408
Allowance for doubtful
accounts
Total current assets
Total tangible fixed assets
Investment securities
Other
Allowance for doubtful
accounts
Total investments and other
assets
Total fixed assets
FIELDS CORPORATION
Total
assetsLeisure for All People
The Greatest
Notes and accounts
payable—trade
Total current liabilities
Total fixed liabilities
Total liabilities
Total shareholders’ equity
Unrealized holding gain on
available-for-sale securities
Accumulated other
comprehensive income
Minority interest
Total net assets
Total liabilities and net
assets
(33,169) Decrease in notes and accounts receivable―trade
Decrease in notes and accounts payable—trade and
(30,488) decrease in accrued income taxes
(235) Decrease in net defined benefit liability
(3,739) Decrease in retained earnings
(34,461)
* “Other” and “Increase/Decrease” are calculated on this sheet above.
Source: Fields
Copyright 2014
FIELDS CORPORATION
All rights reserved.
5
FIELDS CORPORATION
The Greatest Leisure for All People
Highlights for the H1 of the Year Ending March 31, 2015 (Consolidated)
【 Cash Flows 】
(Unit: Millions of yen)
Year Ended
March 31, 2014
H1
Full-Year
Year Ending March 31, 2015
H1
Factors
Cash flows from
operating activities
(4,554)
16,322
(11,111)
Cash flows from
investing activities
(1,650)
(8,018)
(1,092)
Cash flows from
financing activities
(1,387)
(2,018)
(1,200)
1
0
0
Increase (decrease) in
cash and cash equivalents
(7,590)
6,284
(13,404)
Cash and cash equivalents
at beginning of period
23,309
23,309
29,583
(10)
(10)
0
15,708
29,583
16,178
Effect of exchange rate changes on
cash and cash equivalents
Increase (decrease) in cash and cash
equivalents resulting from change of
scope of consolidation
Cash
andCORPORATION
cash equivalents
FIELDS
atThe
endGreatest
of period
Leisure for All People
Source: Fields
Loss before income taxes and minority interests
Decrease in notes and accounts receivable—trade
Decrease in notes and accounts payable—trade
Income taxes paid
Expenditures for purchase of tangible fixed assets
Expenditures for purchase of intangible fixed assets
Proceeds from sales of investment securities
Dividends paid
Repayment of short-term borrowings
Copyright 2014
FIELDS CORPORATION
(3,641)
(27,255)
24,190
(1,805)
(828)
(908)
827
(828)
(310)
All rights reserved.
6
FIELDS CORPORATION
The Greatest Leisure for All People
2. Supplementary Data for the First Half of the Year Ending March 31, 2015
FIELDS CORPORATION
The Greatest Leisure for All People
Copyright 2014
FIELDS CORPORATION
All rights reserved.
7
FIELDS CORPORATION
The Greatest Leisure for All People
Number of Pachinko/Pachislot Machines Sold
【 By Pachinko/Pachislot Brand 】
(Unit: Machines)
Year Ended March 31, 2014
Q1
Q2
Q3
Q4
Year Ending March 31, 2015
Q1
Full-Year
Q2
H1
< Pachinko machines >
Bisty
4,254
73,305
19,680
14,629
111,868
3,533
22,023
25,556
OK!!
1,453
19,076
4,359
3,902
28,790
29,830
5,378
35,208
Others
7,135
5,053
4,689
5,344
22,221
5,177
7,969
13,146
12,842
97,434
28,728
23,875
162,879
38,540
35,370
73,910
1,039
25,429
37
-
26,505
-
-
-
161
1,322
23,860
36,419
61,762
20
-
20
1,456
24,941
115
45,573
72,085
4,460
19,941
24,401
-
-
-
54,127
54,127
66
-
66
3,004
4,277
6,991
1,352
15,624
1,111
2,611
3,722
5,660
55,969
31,003
137,471
230,103
5,657
22,552
28,209
18,502
153,403
59,731
161,346
392,982
44,197
57,922
102,119
I) Total number of pachinko
machines sold
< Pachislot machines >
RODEO *
Bisty
Enterrise
Mizuho
Others
II) Total number of pachislot
machines sold
I) + II) Total number of
pachinko/pachislot
machines sold
FIELDS CORPORATION
*The
RODEO
includes
thefor
sales
Greatest
Leisure
All number
People of “Kaiji 3” from GINZA Corporation released in the year ended March 31, 2014.
【 Major Sales Title 】
Release
(Unit: Machines)
Brand
Title
Q1
Q2
H1
■Pachinko machines
2014 Mar. OK!!
Pachinko Onimusha: Dawn of Dreams
29,000
-
33,000
2014 May Bisty
CR TEKKEN LIGHT VERSION
‐
‐
‐
2014 Jun. OK!!
Pachinko Onimusha: Dawn of Dreams Light Version
-
-
-
2014 Jul. Bisty
CR EVANGELION 8 Extreme Battle
20,000
20,000
2014 Oct. Bisty
CR ayumi hamasaki 2
on sale
2014 Dec. Bisty
CR EVANGELION 9
on sale
■Pachislot machines
2014 Aug. Enterrise
Pachislot Sengoku BASARA 3
2015 Jan. RODEO
Salaryman Kintaro
19,000
20,000
on sale
* Regarding the titles of pachinko/pachislot machines for which the number of machines sold was less than 10,000, the number of machines sold is not disclosed.
* Figures have been rounded to the nearest thousand.
* The cumulative number of machines sold is as of October 15, 2014.
Source: Fields
Copyright 2014
FIELDS CORPORATION
All rights reserved.
8
FIELDS CORPORATION
The Greatest Leisure for All People
Change in the Number of Pachinko/Pachislot Machines Sold (Graph)
【 By Pachinko/Pachislot Machines 】
(Unit: Machines)
Pachislot machine
600,000
500,000
Pachinko machine
480,273
449,880
412,390
392,982
400,000
328,110
262,614
300,000
233,223
330,734
162,879
99,993
H1
171,905
200,000
217,659
100,000
230,103
228,117
179,167
Total
102,119
Pachinko
73,910
Pachislot
28,209
119,146
0
3. 2010
3. 2011
3. 2012
3. 2013
3. 2014
H1 3. 2015
FIELDS CORPORATION
Greatest Leisure for All People
【TheBy
Pachinko/Pachislot Brand 】
(Unit: Machines)
600,000
RODEO
Enterrise
OK!!
Mizuho
449,880
55,564
2,498
35,878
16,119
412,390
300,000
392,982
59,776
7,264
328,110
29,143
32,437
306,585
47,889
200,000
Others
480,273
500,000
400,000
Bisty
263,530
363,056
114,092
37,845
54,127
28,790
72,085
H1
171,905
173,630
100,000
121,691
0
Source: Fields
28,762
3. 2010
3. 2011
81,820
3. 2012
Total 102,119
Others
Bisty
Enterrise
OK!!
Mizuho
16,868
25,576
24,401
35,208
66
104,549
26,505
3. 2013
Copyright 2014
3. 2014
FIELDS CORPORATION
H1 3. 2015
All rights reserved.
9
Pachinko/Pachislot Machines’ Titles from 3.2013 to 3.2015
FIELDS CORPORATION
The Greatest Leisure for All People
(Sales units as of September 30, 2014)
Pachinko machine
Launch of 5 pachinko titles
Pachislot machine
Launch of 6 pachislot titles
Bisty 3 titles
RODEO
Bisty
Enterrise
OK!! 2 titles
3. 2013
©カラー ©Bisty ©CAPCOM CO., LTD. ALL RIGHTS RESERVED. ©Bisty
©士郎正宗・Production I.G / 講談社・攻殻機動隊製作委員会 ©オッケー.
©カラー ©Bisty
Launch of 6 pachinko titles
2 titles
3 titles
1 title
©藤沢とおる/講談社 ©Bisty ©倉科遼、井上紀良/集英社(週刊ヤングジャンプ)
©artist house PIRAMID ©Bisty ©CAPCOM CO., LTD. ALL RIGHTS RESERVED.
©宮下あきら/集英社・東映アニメーション ©Sammy ©RODEO
©CAPCOM CO., LTD. ALL RIGHTS RESERVED. ©Sammy ©RODEO
©カラー©Bisty
Launch of 7 pachislot titles
Bisty 4 titles
OK!! 2 titles
RODEO (GINZA)
Bisty
Enterrise
Mizuho
1 title
3 titles
2 titles
1 title
3. 2014
©王欣太・李學仁/講談社 ©Bisty ©カラー ©Bisty ©三浦建太郎(スタジオ我画)・白泉社/BERSERK FILM PARTNERS ©オッケー.
©2013 BANDAI NAMCO Games Inc. ©Bisty ©CAPCOM CO., LTD. ALL RIGHTS RESERVED. ©オッケー.
©福本伸行/講談社・VAP・NTV ©福本伸行/講談社・VAP・マッドハウス・NTV・D.N.ドリームパートナーズ ©Sammy ©RODEO
©CAPCOM CO., LTD. ALL RIGHTS RESERVED ©TSUBURAYA PROD ©創通・サンライズ ©カラー ©Bisty
©UNIVERSAL ENTERTAINMENT ©MIZUHO
[Q1]
[Q1]
[Q2]
[Q2]
FIELDS CORPORATION
The Greatest Leisure for All People
Enterrise
Pachislot Sengoku BASARA 3
Sold: 20,000 machines
©CAPCOM CO., LTD. ALL RIGHTS RESERVED.
[August]
[Q3]
[Q3]
Bisty
CR ayumi hamasaki 2
3. 2015
on sale
[October]
©avex management inc. ©avex music creative inc.
Bisty
CR EVANGELION 9
[December]
[4Q]
on sale
* To be posted in the Q4 of the year ending
March 31, 2015
©カラー ©Bisty
[4Q]
RODEO
Salaryman Kintaro
on sale
[January]
ⓒ本宮ひろ志/集英社/FIELDS ⓒSammy ⓒRODEO.
* Regarding the titles of pachinko/pachislot machines for which the number of machines sold was less than 10,000, the number of machines sold is not disclosed.
* Please refer to pages 18-19 for details on titles launched in the year ended March 31, 2013 and the year ended March 31, 2014.
Source: Fields
Copyright 2014
FIELDS CORPORATION
All rights reserved.
10
FIELDS CORPORATION
The Greatest Leisure for All People
3. Appendix I
FIELDS CORPORATION
The Greatest Leisure for All People
Copyright 2014
FIELDS CORPORATION
All rights reserved.
11
FIELDS CORPORATION
The Greatest Leisure for All People
Corporate Profile
(As of September 30, 2014)
Company name
FIELDS CORPORATION
http://www.fields.biz/
Regional
Offices
and
Branch
Offices
June 1988
(Started business as Toyo Shoji Co., Ltd. in 1983)
Shibuya Garden Tower,
Address of the 16-17 Nampeidai-cho, Shibuya-ku, Tokyo
head office
150-0036, Japan
Common stock ¥7,948 million
Total number of shares issued and outstanding:
Stock
34,700,000
information
(Treasury stock: 1,516,200)
Establishment
Securities
exchange
Tokyo Stock Exchange JASDAQ (Standard)
Code: 2767
Number of
employees
1,678 (Consolidated), 879 (Non-Consolidated)
Main business
activities
Consolidated
Subsidiaries
Equity method
companies
<Regional Offices>
Hokkaido-Tohoku, North Kanto, Tokyo,
Nagoya, Osaka, Chugoku-Shikoku, Kyushu
<Branch Offices>
Sapporo, Sendai, Aomori, Takasaki, Niigata,
Koriyama, Tokyo, West Tokyo, Chiba, Saitama,
Yokohama, Tsukuba, Nagoya, Mie, Shizuoka, Osaka,
Kyoto, Kobe, Kanazawa, Hiroshima, Yamaguchi,
Matsuyama, Fukuoka, Saga, Kumamoto, Kagoshima
Nagoya 4 Branch Offices
Osaka 3 Branch Offices
FIELDS CORPORATION
The Greatest Leisure for All People
Stock Information
(As of September 30, 2014)
Number of
shares held
Percentage
of outstanding
shares held
Hidetoshi Yamamoto
8,675,000
25.00%
SANKYO CO., LTD.
5,205,000
15.00%
Takashi Yamamoto
3,612,800
10.41%
Mint Co.
1,600,000
4.61%
Treasury Stock
1,516,200
4.37%
NORTHERN TRUST CO. (AVFC)
RE NVI01
1,256,500
3.62%
NORTHERN TRUST CO. (AVFC)
RE 15PCT TREATY ACCOUNT
567,400
1.64%
GOLDMAN, SACHS & CO. REG
543,413
1.57%
Takashi Oya
450,000
1.30%
NORTHERN TRUST CO. (AVFC)
SUB A/C NON TREATY
306,800
0.88%
Source: Fields
North Kanto
3 Branch Offices
Tokyo 6 Branch Offices
・HERO’S INC.
・Kadokawa Haruki Corporation
and others total 9 companies.
Shareholders
Hokkaido-Tohoku
3 Branch Offices
Kyushu
4 Branch Offices
Chugoku-Shikoku
3 Branch Offices
Content-related businesses
Planning, development and sales of
pachinko/pachislot machines
・Lucent Pictures Entertainment, Inc.
・FutureScope Corporation
・Digital Frontier Inc.
・BOOOM Corporation
・Tsuburaya Productions Co., Ltd.
and others total 15 companies.
【By type of shareholder】
Financial institutions
1.91%
Securities companies
0.59%
Treasury stock
4.37%
Other Japanese
companies
20.30%
Foreign companies
and others
20.39%
Individuals and others
52.44%
Copyright 2014
FIELDS CORPORATION
All rights reserved.
12
FIELDS CORPORATION
The Greatest Leisure for All People
Our Tracks
From 1988
Seeking to Create New
Entertainment That
Enriches People’s Lives
1988
Toyo Shoji Co., Ltd. established in Nagoya to sell pachinko/pachislot machines
1992
Leisure Nippon News Company acquired; Formulation of a vision for the pachinko industry began
Cutting-edge information service launched
1992
1994
“Hall TV,” a pachinko hall management support system, launched
“Pachinko Information Station,” a direct-to-hall communications satellite broadcast for the pachinko industry, launched
Regional and branch offices throughout Japan were expanded to establish our foundation as a distributor
From 1998
Focusing on Developing Machines
That Provide Greater Entertainment
Value
1999
ISO 9002 certification (Sales Division) obtained to provide superior operational quality to customers
2001
Company name changed from Toyo Shoji Co., Ltd. to Fields Corporation
Alliance with leading manufacturers formed to develop pachinko/pachislot machines utilizing IP
2001
2003
2008
2010
2011
2014
Alliance
Alliance
Alliance
Alliance
Alliance
Alliance
Alliance
with Sammy Corporation formed; Exclusive sales of RODEO brand machines began
with SANKYO CO., LTD. formed; Exclusive sales of Bisty brand machines began
with KYORAKU SANGYO formed; Exclusive sales of OK!! brand began
with Enterrise Co., Ltd. (subsidiary of CAPCOM CO., LTD.) formed; Exclusive sales of Enterrise brand began
with Universal Entertainment Corporation formed
with NANASHOW Corporation
with D-light Co., Ltd.
Sports entertainment field entered to acquire IP rights
2001
2001
2005
2007
2011
2012
2013
From 2003
Toward the Multifaceted Development of IP
2003
Shares listed on the JASDAQ market; New IP core business model announced
The video game field entered as part of multifaceted IP development
2004
2009
2005
Professional Management Co., Ltd. launched; Entertainment production began
Total Workout Corporation established to provide high-quality sports gyms
3 sports-related subsidiaries merged and renamed Japan Sports Marketing Inc. (JSM Inc.)
EXPRESS Inc. made a subsidiary
Total Workout premium management Inc. established
Absorption of JSM Inc.’s fitness club business considering future growth and synergistic effects
Absorption-type merger of EXPRESS Inc. aiming at improving management efficiency
Pachinko/pachislot machine simulator software launched, following investment in D3 Publisher Inc.
D3PUBLISHER INC. shares sold to NAMCO BANDAI Games Inc.;
Relationship with NAMCO BANDAI Games strengthened
The movie field entered to acquire IP and promote multifaceted IP development
FIELDS CORPORATION
The Greatest Leisure for All People
2005
2008
Planning and production of many movies for the theater began,
following investment in Kadokawa Haruki Corporation
Promotion of trend-setting cinema complexes for independent films began,
following investment in SPO Entertainment Inc. (management company of movie theaters)
From 2008
Toward cultivation and commercialization of IP
2006
The cabled and mobile online services field entered for the acquisition, creation and multifaceted development of IP
2007
The animation field entered to acquire and cultivate IP
2008
The video development field entered to enhance the entertainment offered by pachinko and pachislot
2006
2010
2007
The mobile site “Fields Mobile” developed, following investment in FutureScope Corporation
IP Bros. Incorporated jointly established with NHN Japan Corporation;
Pachinko/pachislot-related site “Nanapachi” developed
Operations at Lucent Pictures Entertainment, Inc. began;
Feature-length animation film “BERSERK” planned and produced
2008
Shinnichi Technology Co., Ltd. established
2009
F Corporation (currently BOOOM Corporation) established
2011
MICROCABIN CORP. made a subsidiary
2011
NEX ENTERTAINMENT CO., LTD. made a subsidiary
2013
F Corporation (currently XAAX Inc.) established
The digital comics fields entered as part of multifaceted IP development efforts
2010
2008
Digital comics distribution began, following investment in Bbmf Magazine, inc.
2012
Sold shares in Bbmf Magazine, inc.
The comics field entered to create IP
2010
2011
2012
Publishing company HERO’S INC. jointly established with Shogakukan Creative INC.
Publishing of “HERO’S Monthly” magazine began
Published “HERO’S Comics”
Toward holding/cultivating IP
2010
Tsuburaya Productions Co., Ltd., owner of the “Ultraman” series and other high-quality IP, made a subsidiary
2010
Digital Frontier Inc. made a subsidiary; Provision of high-quality video technology began
The movie production field entered to acquire and cultivate IP
2012
Source: Fields
Announced “Developing Business Model” based on characters and other IP with the aim of maximizing IP value
Copyright 2014
FIELDS CORPORATION
All rights reserved.
13
Developing Business Model
FIELDS CORPORATION
The Greatest Leisure for All People
Animation
Comics
Enhance added value of stories and characters
with cutting-edge technology, for example by
using computer graphics
Acquire and create original works, stories,
and characters
Intellectual Property
(IP)
Create series
Merchandising
Movies/TV
Interactive media
Consumer Products
Pachinko/Pachislot
Distribute animated content around the world,
and expand fan base
Utilize IP in each media to generate revenue
FIELDS CORPORATION
The Greatest Leisure for All People
Main group companies
Company name
HERO’S Properties
Corporation
Comics
Animation
Movies/TV
(As of September 30, 2014)
Holding
ratio
of voting rights
Paid-in
capital
(Million yen)
Address
100.0
10 Shibuya-ku, Tokyo
HERO’S INC.
49.0
10 Shibuya-ku, Tokyo
Kadokawa Haruki Corporation
Consumer Products
Pachinko/Pachislot
Source: Fields
Investment date
Planning, development and sales of character goods and
other copyright goods
Comic magazine and character contents planning, operation
and production
Planning, producing, editing, publishing and selling books
and magazines
Aug. 2011
Apr. 2010
30.0
757 Chiyoda-ku, Tokyo
Lucent Pictures
Entertainment, Inc.
100.0
20 Shibuya-ku, Tokyo
Planning, production and producing of animations
Digital Frontier Inc.
86.9
31 Shibuya-ku, Tokyo
CG planning and production, etc.
Apr. 2010
SPO Entertainment Inc.
31.8
Movie planning, production and distribution, etc.
Mar. 2008
IP Bros. Inc.
85.0
75 Shibuya-ku, Tokyo
Digitization of intellectual properties and Construction and
management of dedicated pachinko/pachislot websites
Dec. 2010
87.7
60 Shibuya-ku, Tokyo
Mobile contents service provider and mail order
Oct. 2006
69.8
92 Shibuya-ku, Tokyo
Computer software planning, production, and sales, etc.
Nov. 2011
95.0
5 Shibuya-ku, Tokyo
Running fitness gym
May 2011
51.0
310 Shibuya-ku, Tokyo
Movie/TV planning and production
Character goods planning, production and sales
Apr. 2010
Fields Jr. Corporation
100.0
10 Shibuya-ku, Tokyo
Pachinko/pachislot machine maintenance, etc.
Mar. 2002
Shinnichi Technology
Co., Ltd.
100.0
50 Shibuya-ku, Tokyo
Development of pachinko/pachislot machine
Jan. 2008
MICROCABIN CORP.
100.0
227 Yokkaichi-shi, Mie
Planning and development of software for commercial-use
machine
Jan. 2011
BOOOM Corporation
51.0
10 Shibuya-ku, Tokyo
Pachinko/pachislot machine planning and development
May 2009
RODEO Co., Ltd.
35.0
100 Toshima-ku, Tokyo
Pachinko/pachislot machine development and manufacturing
Mar. 2002
G&E Corporation
33.3
450 Shibuya-ku, Tokyo
Running business schools focused on entertainment field
May 2005
371 Minato-ku, Tokyo
Merchandising
Interactive Media
Business activities
FutureScope Corp.
NEX ENTERTAINMENT
CO., LTD.
Total Workout premium
management Inc.
Tsuburaya Productions Co., Ltd.
Copyright 2014
FIELDS CORPORATION
Mar. 2005
Oct. 2007
All rights reserved.
14
FIELDS CORPORATION
The Greatest Leisure for All People
Business Model (PS Planning, Development and Sales)
(As of September 30, 2014)
Sammy Group
SANKYO Group
KYORAKU SANGYO Group
RODEO
Bisty
OK!!
Universal
Entertainment Group
NANASHOW
Mizuho
Daiichi Shokai Group
CAPCOM Group
D-light
Enterrise
TV/movies, animation, sports and other
(Rights/Product planning and development)
Development
Manufacturing
Pachislot
From 2000
Development
Manufacturing
Pachinko
Development
Manufacturing
Development
Manufacturing
Pachislot
Pachislot
From 2014
Pachinko
From 2012
From 2003 From 2003
Development
Manufacturing
April 2014
April 2014
Alliance
Alliance
Pachislot
From 2011
(総販売元)
Pachinko Halls
* The Company has held several discussions with Sammy and RODEO regarding the overall approach to the business partnership going forward, including Basic Agreement on Exclusive Sales Agency
Transactions Regarding Sales and Purchases of Pachislot Machines.
FIELDS CORPORATION
The Greatest Leisure for All People
Accounting Method of Pachinko/Pachislot Sales (Image)
<Agency sales>
Manufacturers
Pachinko machine
フィールズ
<Distribution sales>
Manufacturers
Pachislot machine
フィールズ
Commission
payment
Commission
payment
Agency
Commission
sales
Gross
profit
Recorded in the
following month
Manufacturing
cost
Manufacturing
cost
Whole
sales
Machine
sales
Cost of
Machine’s
purchase
Machine
sales
Gross
profit
Commission
payment
Gross
profit
Gross
profit
<Price: ¥250,000 - ¥400,000>
Source: Fields
©CAPCOM CO., LTD. ALL RIGHTS RESERVED. ©Sammy ©RODEO
©カラー ©Bisty
©創通・サンライズ
©CAPCOM CO., LTD. ALL RIGHTS RESERVED.
<Price: ¥350,000 - ¥450,000>
Recorded
in the month
©UNIVERSAL ENTERTAINMENT ©MIZUHO
©CAPCOM CO., LTD. ALL RIGHTS RESERVED. ©オッケー.
Copyright 2014
FIELDS CORPORATION
All rights reserved.
15
Business Flow and Accounting Method of Merchandising Rights
Regarding Pachinko/Pachislot Planning and Development
FIELDS CORPORATION
The Greatest Leisure for All People
Balance Sheet
Licensee
Profit and Loss
MG: Minimum Guarantee
OR: Over Royalty
(2) MG payment
(1) Gaining
merchandising
rights
(6) OR payment
Asset
(Advance payment for
merchandising rights)
Cost
(Merchandising rights cost)
(3) Merchandising rights sales (Sub-licensing)
(4) MG receiving
FIELDS CORPORATION
(Pachinko/Pachislot
Machines Sold)
Decrease in asset
(Advance payment for
merchandising rights)
Partners
Sales/Cost
Pachinko/Pachislot Manufacturers
(Merchandising rights sales/Cost)
(5) OR receiving
Sales
(Merchandising rights sales)
FIELDS CORPORATION
The Greatest Leisure for All People
Glossary of Fields’ Pachinko/Pachislot Machine Sales
Pachinko/Pachislot Manufacturers
*5
Transport of machines
(Direct)
Pachinko Machines (Some Pachislot Machines)
Payment of
commission
Remittance of
sales amount
*1
*5
Transport of machines
Pachislot Machines
(Direct)
*2
Agency sales
Purchase
of machines
Distribution sales
FIELDS CORPORATION
Consignment
*3
Direct sales
Secondary
Agent
Sales
*4
Indirect sales
Pachinko/Pachislot Halls (Pachinko/Pachislot users)
*1 Agency sales
:Sales and profit by commission
*2 Distribution sales
:Sales and profit by purchase of machines
*3 Direct sales
:Direct sales by own sales force
*4 Indirect sales
:Indirect sales through secondary agents
*5 Transport of machines
:Direct transport of machines from
manufacturers to Pachinko halls
□Sales method Both agency and distribution sales activities are the same
Source: Fields
Copyright 2014
FIELDS CORPORATION
All rights reserved.
16
Cumulative Number of Pachinko/Pachislot Series Sold (by Main IP)
FIELDS CORPORATION
The Greatest Leisure for All People
(As of September 30, 2014)
“Evangelion”
series
“Hiroshi Motomiya’s
“Game IP”
series
“Comics, animation IP”
series
works” series
“Live action in Japan”
series
■Major title
Pachinko machines
・The Beginning and the End ・Onimusha: Dawn of Dream
・The Angels Are Back Again ・TEKKEN
・Salaryman Kintaro
・Ore no Sora
・BERSERK
・GHOST IN THE SHELL
Pachislot machines
・Magokoro wo Kimini
・That time has come, they’re
waiting for us
・Salaryman Kintaro
・Ore no Sora
・KAZENOYOUJINBOU
・MOBILE SUIT
GUNDAM
・Onimusha 3
・Pachislot Monster
Hunter
・Seven Samurai
・Shimizu no Jirocho
■Cumulative titles sold
Pachinko machines
8
8
3
12
2
Pachislot machines
8
16
7
21
0
16
24
10
33
2
Pachinko machines
1,439,000
182,000
90,000
171,000
100,000
Pachislot machines
492,000
596,000
360,000
278,000
-
1,931,000
778,000
450,000
449,000
100,000
Total
■Cumulative number of units sold
(unit: machines)
Total
* Pachinko number of titles sold excludes reused machines and machines with specifications changes.
Number of Pachinko/Pachislot Machines Sold (Details)
FIELDS CORPORATION
The Greatest Leisure for All People
(Unit: Machines)
3. 2010
Number of
machines sold
3. 2011
3. 2012
3. 2013
3. 2014
3. 2015
H1
H2
Full
H1
H2
Full
H1
H2
Full
H1
H2
Full
H1
H2
Full
H1
274,144
175,736
449,880
293,128
187,145
480,273
151,254
261,136
412,390
101,103
227,007
328,110
171,905
221,077
392,982
102,119
266,284
64,450
330,734
226,620
35,994
262,614
89,264
143,959
233,223
46,823
53,170
99,993
110,276
52,603
162,879
73,910
97.1%
36.7%
73.5%
77.3%
19.2%
54.7%
59.0%
55.1%
56.6%
46.3%
23.4%
30.5%
64.1%
23.8%
41.4%
72.4%
7,860
111,286
119,146
66,508
151,151
217,659
61,990
117,177
179,167
54,280
173,837
228,117
61,629
168,474
230,103
28,209
2.9%
63.3%
26.5%
22.7%
80.8%
45.3%
41.0%
44.9%
43.4%
53.7%
76.6%
69.5%
35.9%
76.2%
58.6%
27.6%
255,570
67,177
322,747
228,042
40,130
268,172
91,839
148,505
240,344
52,274
57,008
109,282
116,235
55,492
171,727
77,422
93.2%
38.2%
71.7%
77.8%
21.4%
55.8%
60.7%
56.9%
58.3%
51.7%
25.1%
33.3%
67.6%
25.1%
43.7%
75.8%
18,574
108,559
127,133
65,086
147,015
212,101
59,415
112,631
172,046
48,829
169,999
218,828
55,670
165,585
221,255
24,697
6.8%
61.8%
28.3%
22.2%
78.6%
44.2%
39.3%
43.1%
41.7%
48.3%
74.9%
66.7%
32.4%
74.9%
56.3%
24.2%
145,626
367,147
239,336
156,701
396,037
123,142
223,672
346,814
81,336
187,610
268,946
144,481
179,486
323,967
86,597
■Sales ratio
Pachinko
Pachislot
■Agency/Distribution sales ratio
Agency sales
Distribution sales
■Direct/Indirect sales ratio
Direct sales
Indirect sales
Source: Fields
221,521
80.8%
82.9%
81.6%
81.6%
83.7%
82.5%
81.4%
85.7%
84.1%
80.4%
82.6%
82.0%
84.0%
81.2%
82.4%
84.8%
52,623
30,110
82,733
53,792
30,444
84,236
28,112
37,464
65,576
19,767
39,397
59,164
27,424
41,591
69,015
15,522
19.2%
17.1%
18.4%
18.4%
16.3%
17.5%
18.6%
14.3%
15.9%
19.6%
17.4%
18.0%
16.0%
18.8%
17.6%
15.2%
Copyright 2014
FIELDS CORPORATION
All rights reserved.
17
FIELDS CORPORATION
The Greatest Leisure for All People
Titles of Pachinko Machines Sold (3.2002-3.2014)
* The figures are the cumulative number of units sold.
Sammy
(Cumulative total: 378,000)
(Unit: Machines)
Bisty
(Cumulative total: 1,982,000)
Sold
3.2014
Sold
12,000 Pachinko Onimusha: Dawn of Dreams*1
33,000
CR TEKKEN
18,000 New-century Pachinko BERSERK
23,000
CR EVANGELION 8
75,000
-
Evangelion 7 Smile Model
3. 2011
3. 2010
3. 2009 CR Virtua Fighter
11,000
FIELDS CORPORATION
The Greatest Leisure for All People
3. 2008 CR Sakura Taisen
3. 2007 CR SEACOP
CR Salaryman Kintaro 2
CR Gamera Extreme Battle
3. 2006 CR Sakigake!! Otoko Juku
CR Super Jetter
CR Azumi
CR K-1 PREMIUM Dynamite!!
3. 2005 CR Ore no Sora
CR Bakumatsu no kaze
CR LINDA
3. 2004 CR Rikidozan
CR Sonic
CR CITY HUNTER
CR Ume Matsu Paradise
3. 2003 CR GEN JU HAOU
3. 2002 CR Salaryman Kintaro
41,000
28,000
-
New-century Pachinko
GHOST IN THE SHELL:
STAND ALONE COMPLEX
GHOST VERSION
New-century Pachinko
16,000 GHOST IN THE SHELL:
STAND ALONE COMPLEX
16,000
100,000
12,000
CR Sengoku BASARA 3
—The Battle of Sekigahara
3. 2012
Sold
CR EVANGELION 8 Premium Battle
CR Beyond the Heavens
3. 2013
OK!!
(Cumulative total; 90,000)
EVA Light III
CR Evangelion 7
CR The story of ayumi hamasaki
Sweet/Light Version
CR The story of ayumi hamasaki
—introduction
CR Kung Fu Panda
CR Evangelion
—Evangelical of the beginnings Light ver.
CR Shimizu no Jirocho Light ver.
CR Evangelion
—Evangelical of the Beginnings
CR Neon Genesis Evangelion
—The Beginning and the End
CR Iron Chef
CR GTO
CR Neon Genesis Evangelion
—The Angels Are Back Again YF
CR Shimizu no Jirocho
—The Bonds of Life
CR Mystic Blue
CR King Kong
CR Seven Samurai
CRA Morning Musume
CRA Neon Genesis Evangelion Premium
Model
CR Neon Genesis Evangelion
—The Angels Are Back Again
CR Tomb Raider
CRA Felix the Cat
CR The Mask of Zorro
CR LOONEY TUNES BIA
CR Neon Genesis Evangelion
—Kiseki no Kachiwa
CR WINK
CR Aya Matsuura
CR Otoko Ippiki Gaki Daisho
CR Shin Sangoku Musou
29,000 CR Neon Genesis Evangelion: Second Impact
- CR Ashita ga arusa Yoshimoto World
26,000
11,000
72,000
11,000
205,000
230,000
23,000
11,000
21,000
82,000
50,000
200,000
187,000
11,000
40,000
27,000
161,000
38,000
- CR Marilyn Monroe
- CR Iijima Naoko no Casino Bisty
CR Daimajin
30,000 CR Kahara Tomomi to Minashigo Hatchi
13,000 CR Neon Genesis Evangelion
25,000 CR Circuit e ikou!
CR FEVER TWINS
40,000 CR FEVER KUNG-FU GAL
27,000
36,000
24,000
13,000
24,000
39,000
21,000
10,000
41,000
125,000
11,000
14,000
* Regarding the titles of pachinko/pachislot machines for which the number of machines sold was less than 10,000, the number of machines sold was not disclosed.
* Sold Olympia’s pachinko machine “CR PROJECT MINERVA” for the year ended March 31, 2007
*1 To be posted in April 2014
Source: Fields
Copyright 2014
FIELDS CORPORATION
All rights reserved.
18
Titles of Pachislot Machines Sold (3.2001-3.2014)
FIELDS CORPORATION
The Greatest Leisure for All People
* The figures are the cumulative number of units sold.
RODEO
(Cumulative total:
1,364,000)
3. 2014 Kaiji3*
Shin3. 2013 Pachislot
Onimusha Sairin
SAKIGAKE
OTOKOJUKU―TE
NCHO-GORIN THE
FINAL
3. 2012 Pachislot Monster
Hunter
Rahxephon
Kaze no Youjinbou
―Memory of
Butterflies
3. 2011 Gravion
Ore no Sora
―Spirit of Young
Justice
Gamera
3. 2010 Onimusha:
Dawn of Dreams
Hono-no Nekketsu
Kyoshi
3. 2009 Kaiji Act 2
Tenchi wo Kurau
Sonic Live
3. 2008 Tenka Muteki!
Salaryman Kintaro
Bisty
Sold
(Cumulative total:
680,000)
25,000 Evangelion
—Ketsui no Toki
MOBILE SUIT
GUNDAM
PACHISLOT
ULTRAMAN WARS
41,000 EVANGELION
24,000 Yaoh
GTO Limit Break
Evangelion
96,000 —the Heartbeat of
Life
- SAMURAI 7
3. 2006 Ore no Sora
Dokonjo Gaeru
3. 2005 Onimusha 3
Kaiji
Umematsu
Dynamite Wave!
3. 2004 Gamera
-High Grade Vision
WANTOUCHABLE
(Sammy)
JET SET RADIO
Charlie’s Angels FT
Sloter Kintaro
Yajyu
3. 2003 KAZENOYOUJINBOU
SNOW KING
Salaryman Kintaro S
CLUB RODEO T
Ginginmaru
3. 2002 Ichigeki Teio 2
Salaryman Kintaro
DOUBLE
CHALLENGE
Oo-Gamera
3. 2001 INDY JAWS 2
Gamera
13,000
Enterrise
(Cumulative total:
145,000)
Pachislot Monster
Hunter: Gekka Raimei
25,000
Devil May Cry 4
Sold
Sold
(Unit: Machines)
Mizuho
Sold
Sold
(Cumulative total:
54,000)
GOD
54,000
45,000 ANOTHER
HADES
25,000
23,000
Resident Evil 5
57,000
48,000
Street Fighter IV
47,000
-
13,000
23,000
MOBASLO
- Evangelion
—for your own wish
Magical Shopping
38,000 Arcade Abenobashi
Sengoku BASARA 2
78,000
16,000
-
13,000
90,000 Saturday Night Fever
Neon Genesis
Evangelion
- —Die Spur der
SEELE
18,000 KING KONG
Neon Genesis
Evangelion—That
- time has come, now
they’re waiting for us
-
18,000 Beach Club
Neon Genesis
Virtua Fighter
10,000 Evangelion
—‘Magokoro wo
Kimini’
FIELDS
TheCORPORATION
Mask of Zorro
- Morning Musume
The Greatest
Leisure for All People Cream Stew
Devil May Cry 3
48,000
Otoko
3. 2007 Sakigake!!
17,000 SHERLOCK
Juku
HOUND
PREMIUM
- GTO
Dynamite
Dokaben
Olympia
(Cumulative total:
75,000)
- ROCKY BALBOA
Tomb Raider
Lord of the Rings
Neon Genesis
125,000 Evangelion
120,000 Dai Yamato
29,000 Fever Natsumatsuri
- Aim for the Ace!
84,000 I am KONISHIKI
-
90,000
- Shin Sangokumusou
99,000 Kaiketsu Harimau
-
-
- Karate-Baka Ichidai
-
- KING OF MOUSE
LOONEY TUNES:
- BACK IN ACTION
60,000
23,000 Geronimon S
30,000
Mezase
12,000 Dokidoki Zima
-
-
-
36,000
61,000 KAIZOKU
- Ougonshin
13,000
22,000
52,000
14,000
53,000
43,000
31,000
17,000
118,000
31,000
32,000
23,000
29,000
* Regarding the titles of pachinko/pachislot machines for which the number of machines sold was less than 10,000, the number of machines sold was not disclosed.
* RODEO includes the sales number of “Kaiji 3” from GINZA Corporation released in the year ended March 31, 2014.
Source: Fields
Copyright 2014
FIELDS CORPORATION
All rights reserved.
19
FIELDS CORPORATION
The Greatest Leisure for All People
Change of “Evangelion” Series
Pachinko machines
Pachislot machines
Neon Genesis Evangelion
3. 2005
Dec. 2004
125,000 machines
3. 2006
Second Impact
Neon Genesis Evangelion
Feb. 2006
161,000 machines
Sep. 2005
23,000 machines
3. 2007
Kiseki no Kachiwa
Feb. 2007
187,000 machines
The Angels Are Back Again
Jan. 2008
200,000 machines
Type less reliant on
gambling nature/
reused machines
3. 2008
Magokoro wo Kimini
Jul. 2007
99,000 machines
3. 2009
That time has come, they’re waiting for us
Sep. 2008
90,000 machines
Premium Model
May 2008
50,000 machines
The Beginning
FIELDS CORPORATION
andforthe
The Greatest Leisure
All End
People
Apr. 2009
237,000 machines
Evangelical of
the Beginnings
Jun. 2010
205,000 machines
The Angels Are
Back Again YF
Jan. 2010
24,000 machines
3. 2010
Die Spur der SEELE
Mar. 2010
84,000 machines
3. 2011
Evangelical of
the Beginnings
Light ver.
Nov. 2010
9,000 machines
For your own wish
Mar. 2011
78,000 machines
3. 2012
The Heartbeat of Life
Evangelion 7
Jan. 2012
100,000 machines
Feb. 2012
47,000 machines
EVA Light III
May 2012
16,000 machines
EVANGELION 8
Jul. 2013
75,000 machines
EVANGELION7
Smile Model
Dec. 2012
12,000 machines
3. 2013
EVANGELION
Feb. 2013
57,000 machines
3. 2014
Ketsui no Toki
Feb. 2014
13,000 machines
Premium Battle
Jan. 2014
12,000 machines
Extreme Battle
Jul. 2014
on sale
3. 2015
EVANGELION 9
on sale
Source: Fields
©GAINAX/Project Eva.・テレビ東京 ©Bisty
©GAINAX・カラー/Project Eva. ©Bisty
©カラー ©Bisty
©GAINAX・カラー/Project Eva. ©カラー ©Bisty
©GAINAX・カラー/Project Eva. ©カラー
Copyright 2014
FIELDS CORPORATION
All rights reserved.
20
Change in Quarterly P/L Statement (Table)
FIELDS CORPORATION
The Greatest Leisure for All People
【 Consolidated 】
(Unit: Millions of yen)
3. 2013
Q1
Q2
3. 2014
Q3
Q4
Full
Q1
3. 2015
Q2
Q3
Q4
Full
Q1
Q2
Q3
Q4
Full-year
forecast
21,145
7,973
18,627
60,396
108,141
5,748
30,637
17,819
60,700
114,904
7,459
12,882
100,000
5,566
3,258
6,239
18,216
33,279
2,027
11,621
5,709
14,455
33,812
2,790
4,130
-
5,282
5,402
5,535
6,745
22,964
5,856
5,615
5,849
6,700
24,020
5,300
5,698
-
Operating
income
283
(2,142)
703
11,470
10,314
(3,829)
6,005
(140)
7,755
9,791
(2,509)
(1,568)
5,000
Ordinary
income
574
(2,312)
763
11,243
10,268
(3,759)
5,903
(78)
7,699
9,765
(2,254)
(1,818)
5,000
Net income
342
(1,322)
303
5,397
4,720
(2,290)
3,724
(207)
4,143
5,370
(1,502)
(1,007)
2,500
Net sales
Gross profit
SG & A
expenses
3. 2010
Q1
Q2
Q3
3. 2011
3. 2012
Q4
Full
Q1
Q2
Q3
Q4
Full
Q1
Q2
Q3
Q4
Full
16,038
5,406
3,077
41,821
66,342
21,344
21,668
28,421
32,160
103,593
17,635
15,717
9,709
49,134
92,195
12,402
707
888
12,892
26,889
7,663
11,328
7,292
8,846
35,129
5,076
6,907
4,343
15,004
31,330
SG & A
expenses
3,877
3,845
4,906
6,136
18,764
5,314
4,495
5,775
6,409
21,993
5,302
5,099
5,903
6,499
22,803
Operating
income
8,524
(3,138)
(4,018)
6,756
8,124
2,348
6,834
1,517
2,437
13,136
(225)
1,807
(1,560)
8,505
8,527
Ordinary
income
8,519
(3,468)
(3,961)
6,671
7,761
2,518
6,985
1,980
2,201
13,684
(266)
1,979
(1,607)
8,555
8,661
Net income
4,711
(2,530)
(2,454)
3,562
3,289
1,477
3,951
1,043
1,049
7,520
(284)
2,712
(1,296)
4,859
5,991
Net sales
Gross profit
FIELDS CORPORATION
Greatest Leisure for All People】
【TheNon-Consolidated
(Unit: Millions of yen)
3. 2013
Q1
Q2
3. 2014
Q3
Q4
Full
Q1
3. 2015
Q2
Q3
Q4
Full
Q1
Q2
Q3
Q4
Full
19,199
5,590
16,207
56,305
97,301
4,170
28,048
14,456
56,898
103,572
5,431
10,086
-
5,011
2,417
5,367
16,546
29,341
1,403
10,916
4,634
13,639
30,592
2,343
3,329
-
4,406
4,537
4,667
5,707
19,317
4,985
5,012
5,175
5,893
21,065
4,646
5,066
-
Operating
income
605
(2,120)
701
10,837
10,023
(3,582)
5,903
(540)
7,746
9,527
(2,302)
(1,738)
-
Ordinary
income
806
(2,052)
851
10,614
10,219
(3,339)
5,929
(319)
6,975
9,246
(1,879)
(1,781)
-
Net income
452
(1,229)
530
6,330
6,083
(2,004)
3,246
(109)
3,449
4,582
(1,120)
(790)
-
Net sales
Gross profit
SG & A
expenses
3. 2010
Q1
Net sales
Q2
Q3
3. 2012
3. 2011
Q4
Full
Q1
Q2
Q3
Q4
Full
Q1
Q2
Q3
Q4
Full
14,905
4,328
1,739
40,385
61,357
18,310
18,695
25,165
28,801
90,971
15,349
13,132
7,276
44,637
80,394
11,901
332
232
12,028
24,493
6,542
10,137
6,004
7,514
30,197
4,059
6,015
3,249
13,713
27,036
SG & A
expenses
3,277
3,243
4,043
5,312
15,875
4,166
3,316
4,639
5,156
17,277
4,165
4,051
5,065
5,553
18,834
Operating
income
8,623
(2,911)
(3,811)
6,717
8,618
2,375
6,821
1,366
2,358
12,920
(106)
1,964
(1,817)
8,161
8,202
Ordinary
income
8,761
(2,900)
(3,693)
6,662
8,830
2,505
6,911
1,558
2,477
13,451
11
2,128
(1,713)
8,070
8,496
Net income
5,119
(2,064)
(2,107)
3,575
4,538
1,362
3,984
766
714
6,826
(101)
1,221
(938)
4,723
4,905
Gross profit
* Q2-Q4 figures are calculated on this sheet above.
Source: Fields
Copyright 2014
FIELDS CORPORATION
All rights reserved.
21
FIELDS CORPORATION
The Greatest Leisure for All People
Financial Highlights (3.2003-3.2008)
*The numbers in upper parenthesis indicate YoY.
(Unit: Millions of yen)
3. 2003
Net sales
3. 2004
3. 2005
(107.0)
3. 2006
(123.3)
3. 2007
(118.6)
15,992
21,578
9,211
9,711
6,781
11,866
7,022
12,209
3,524
6,620
6,926
7,085
3,710
5,296
Common stock
1,295
1,295
7,948
7,948
7,948
7,948
Net assets
8,752
14,507
33,426
39,411
42,836
46,331
17,090
37,115
72,584
87,556
66,081
69,168
Cash flows from operating activities
3,316
851
2,965
6,164
5,293
11,127
Cash flows from investing activities
(2,253)
(3,190)
(5,257)
(2,224)
(4,772)
(14,604)
Cash flows from financing activities
(2,454)
2,029
10,177
(1,540)
1,488
(1,384)
5,739
5,437
13,326
15,777
17,819
12,693
SG&A expenses
Operating Income
Ordinary income
Net income
Total assets
Cash and cash equivalents
at end of the year
(105.4)
(175.0)
(173.9)
(187.9)
(114.7)
(120.1)
24,752
29,737
(130.3)
(137.4)
12,655
17,389
(101.9)
(102.1)
12,097
12,348
(102.2)
(105.2)
12,480
13,127
(104.6)
(102.3)
85,321
(119.3)
66,211
(134.9)
96,814
(88.1)
61,888
Gross profit
81,658
3. 2008
(98.4)
29,248
(116.8)
20,303
(72.4)
8,944
(70.1)
9,202
(52.4)
(118.1)
34,544
(105.3)
21,385
(147.1)
13,158
(127.2)
11,705
(142.7)
(Unit: Yen)
FIELDS CORPORATION
Indicators
perLeisure
share for All People
The Greatest
101,818
3. 2003
Net assets per share
3. 2004
268,600
3. 2005
89,305
3. 2006
96,026
3. 2007
113,275
3. 2008
118,487
128,201
24,000
4,500
Commemorative
4,000
4,000
4,000 Commemorative
10,000
10,000
500
Interim 10,000 Interim
2,000 Interim
2,000 Interim
2,000 Interim
2,000
Year-end 4,000 Year-end 2,000 Year-end 2,000 Year-end 2,000 Year-end 2,000
Annual dividend per share
Net income per share
117,233
40,465
19,888
20,118
10,692
15,263
(Unit: %)
Management indicators
3. 2003
3. 2004
3. 2005
3. 2006
3. 2007
3. 2008
Shareholders' equity ratio
51.2
39.1
46.0
45.0
62.2
64.3
Return on equity (ROE)
55.9
56.9
28.9
19.5
9.2
12.4
Return on assets (ROA)
39.3
45.0
22.8
16.4
12.0
17.3
20.1
20.7
20.3
37.4
29.5
Payout ratio
7.9
(1)
Other
Total number of shares issued and
outstanding (shares)
Treasury stock (shares)
Number of employees (people)
3. 2003
(3)
(2)
3. 2004
32,300
3. 2005
3. 2006
3. 2007
3. 2008
161,500
347,000
347,000
347,000
347,000
-
-
-
-
-
-
460
651
758
901
1,022
1,077
(3)
(1) Consolidated payout ratio after the year ended March 31, 2007.
(2) Payout ratio for the year ended March 31, 2004 was computed including a commemorative dividend.
(3) January 2003 1:5 stock split/Year ended March 31, 2004 1:2 stock split.
Source: Fields
Copyright 2014
FIELDS CORPORATION
All rights reserved.
22
FIELDS CORPORATION
The Greatest Leisure for All People
Financial Highlights (3.2009-H1 3.2015)
* The numbers in upper parenthesis indicate YoY.
(Unit: Millions of yen)
3. 2009
3. 2010
(71.7)
Net sales
73,035
Gross profit
24,024
SG&A expenses
22,063
Operating Income
(69.5)
(103.2)
(14.9)
1,960
(8.5)
Ordinary income
Net income
991
(-)
3. 2011
(90.8)
66,342
(111.9)
26,889
(85.0)
18,764
(414.5)
8,124
(783.1)
7,761
(-)
(156.1)
103,593
(130.6)
35,129
(117.2)
21,993
(161.7)
13,136
(176.3)
13,684
(228.6)
3. 2012
3. 2013
(89.0)
3. 2014
(117.3)
92,195
108,141
(89.2)
(106.3)
114,904
(106.2)
31,330
(103.7)
33,812
(100.7)
(64.9)
24,020
(121.0)
(63.3)
9,791
(118.6)
(-)
(4,077)
(95.1)
10,268
(79.7)
(95.9)
10,998
(94.9)
10,314
8,661
(50.7)
6,920
(104.6)
22,964
8,527
(55.9)
20,341
(101.6)
33,279
22,803
H1 3. 2015
9,765
(78.8)
(-)
(4,072)
(113.8)
(-)
(1,481)
3,289
7,520
5,991
4,720
5,370
(2,509)
7,948
7,948
7,948
7,948
7,948
7,948
7,948
Net assets*
39,496
41,187
47,021
51,555
55,098
58,753
55,014
Total assets*
52,064
81,329
78,971
93,601
106,628
104,869
70,408
4,147
8,429
8,005
10,015
13,570
16,322
(11,111)
(6,182)
(1,011)
(4,356)
(4,798)
(6,263)
(8,018)
(1,092)
602
(2,687)
(3,915)
(2,565)
(2,277)
(2,018)
(1,200)
11,181
15,906
15,632
18,284
23,309
29,583
16,178
Common stock*
Cash flows
from operating activities
Cash flows
from investing activities
Cash flows
from financing activities
Cash and cash equivalents
at end of the year
FIELDS CORPORATION
The Greatest Leisure for All People
Indicators per share
Net assets per share*
Annual dividend per share
Net income per share
(Unit: Yen)
3. 2009
3. 2010
3. 2011
3. 2012
3.
2013 (4)
3. 2014
H1 3. 2015
117,326
123,645
140,853
153,904
1,644.15
4,500
4,500
5,000
5,000
50
50 (Forecast) 50
25 Interim
25 Year-end
25 Interim
25 Year-end
Interim 2,000 Interim 2,000 Interim 2,500 Interim 2,500 Interim
Year-end 2,500 Year-end 2,500 Year-end 2,500 Year-end 2,500 Year-end
(4,271)
9,796
22,643
18,044
1,756.27
142.27
161.83
(4) The number of shares to constitute a share-trading unit was changed to 100 shares in October 2012.
The figure given for the interim dividend for the year ended March 31, 2013 takes a stock split into account.
Management indicators
3. 2009
3. 2010
3. 2011
3. 2012
1,642.50
25
25
(75.63)
(Unit: %)
3. 2013
3. 2014
H1 3. 2015
Shareholders' equity ratio
75.8
50.5
59.2
54.6
51.2
55.6
77.4
Return on equity (ROE)
(3.5)
8.2
17.1
12.2
8.9
9.5
(4.5)
Return on assets (ROA)
1.6
11.6
17.1
10.0
10.3
9.2
(4.6)
-
45.9
22.1
27.7
35.1
30.9
-
Payout ratio
Other
Total number of shares issued and
outstanding (shares)
Treasury stock (shares)
Number of employees (people)
3. 2009
3. 2010
3. 2011
3. 2012
3. 2013 (4)
3. 2014
H1 3. 2015
347,000
347,000
347,000
347,000
34,700,000
34,700,000
34,700,000
10,643
14,885
14,885
15,162
1,516,200
1,516,200
1,516,200
827
909
1,149
1,324
1,416
1,588
1,677
* For “common stock,” “net assets,” “total assets” and “net assets per share” for the year ending March 31, 2015, the figures as of the second quarter of the year ending March
31, 2015 are given.
Source: Fields
Copyright 2014
FIELDS CORPORATION
All rights reserved.
23
Change in Financial Results (Graph) (Consolidated)
FIELDS CORPORATION
The Greatest Leisure for All People
Net sales
120,000
108,141
103,593
15,000
66,342
43,012
40,000
5,000
33,352
29,118
3. 2010
15,000
20,341
5,386
2,176
0
3.2011
3.2012
3.2013
3.2014
H1 3. 2015
7,761
(5,000)
3. 2010
3.2011
3.2012
3.2013
(4,077)
3.2014
H1 3. 2015
Net income
9,000
13,684
10,000
10,268
9,503
8,661
9,765
7,520
3,000
5,991
5,428
6,000
5,051
3,289
2,184
5,370
4,720
2,428
1,434
2,144
1,713
0
0
(980)
(1,738)
(3,000)
(4,072)
(5,000)
3. 2010
3.2011
3.2012
FIELDS CORPORATION
The Greatest Leisure for All People
3.2013
3.2014
H1 3. 2015
3. 2010
3.2011
3.2012
3.2013
3.2014
(2,509)
H1 3. 2015
Change in Assets/Liabilities, Net Assets (Graph) (Consolidated)
(Unit: Millions of yen)
Change in liabilities/net assets
Change in assets
(1)
(3)
(5)
(1) Investments and other assets
(2) Intangible fixed assets
(3) Tangible fixed assets
(4) Other current assets
(5) Notes and accounts receivable—trade (6) Cash and cash deposits
120,000
Net assets
Other current liabilities
Notes and accounts payable—trade
(2)
(4)
Other fixed liabilities
Interest-bearing liabilities
120,000
106,628
100,000
93,601
81,329
80,000
15,916
78,971
9,721
2,333
29,583
42,017
29,155
7,230
10,089
5,070
81,329
16,178
(6)
10,065
10,980
4,372
7,378
11,151
4,540
8,183
11,955
12,104
12,314
4,365
4,390 (2)
20,000
(4) 40,000
17,939
2,230
8,515
1,834
8,779
3,397
12,760
15,437
18,226
21,477
19,951
3. 2010
3 .2011
3. 2012
3. 2013
3. 2014
H1 3. 2015
104,869
36,604
33,105
1,052
9,818
743
7,933
4,336
29,100
1,660
7,604
3,682
4,055
70,408
(5)
(4)
(3)
(2)
5,586
400
5,279
4,128
2,785
(3)
12,578
Source: Fields
78,971
26,610
60,000
5,618 (5)
106,628
93,601
80,000
70,408
27,948
40,000
7,690
100,000
18,344
34,402
33,088
23,314
104,869
15,873
60,000
0
9,791
8,527
1,582
Ordinary income
20,000
10,314
9,182
(1,859)
0
5,000
8,124
36,385
21,444
■ Full-Year (Unit: Millions of yen)
13,136
10,000
60,000
20,000
114,904
92,195
100,000
80,000
■ H1
Operating income
41,187
47,021
51,555
55,098
58,753
55,014
(1)
(1)
0
3. 2010
3. 2011
Copyright 2014
3. 2012
3. 2013
FIELDS CORPORATION
3. 2014
H1 3. 2015
All rights reserved.
24
Change in Selling, General and Administrative Expenses (Graph) (Consolidated)
FIELDS CORPORATION
The Greatest Leisure for All People
(Unit: Millions of yen)
3. 2010
3. 2011
3. 2012
3. 2013
3. 2014
H1 3. 2015
Advertising expenditures
3,587
4,006
3,644
2,964
4,305
1,229
Salaries
4,652
5,527
5,728
5,569
5,859
3,109
Provision for accrued bonuses
257
290
246
247
285
18
Provision for accrued bonuses to directors and auditors
135
220
240
230
230
141
Outsourcing expenses
1,373
1,553
2,373
2,608
2,451
1,122
Travel and transport expenses
469
551
542
507
551
292
Depreciation and amortization
1,175
1,393
1,431
1,623
1,268
631
Rent
1,475
1,654
1,749
2,249
2,062
1,017
(6)
Provision to allowance for doubtful accounts
249
-
(52)
(56)
(3)
Retirement benefit expenses
68
76
86
92
6
59
Amortization of goodwill
87
366
333
319
323
165
Other
Total SG&A expenses
Advertising expenditures
Salaries
Outsourcing expenses
Advertising (Unit: Millions of yen)
expenditures
25,000
Other 11.2%
20,000
31.2%
Salaries
Amortization
15,000
28.3%
of goodwill
1.5%
Rent
9.2%
5,237
6,357
6,483
6,608
6,683
3,221
18,764
21,993
22,803
22,964
24,020
10,998
* “Other” is calculated on this sheet above.
Depreciation and amortization
Rent
Amortization of goodwill
Travel and transport expenses
21,993
18,764
4,006
3,587
5,527
4,652
Outsourcing
5,000
expenses
10.2%
0
Travel and
transport expenses
2.7%
Depreciation
and amortization
5.7%
FIELDS CORPORATION
The Greatest Leisure for All People
24,020
22,803
22,964
3,644
2,964
4,305
5,728
5,569
5,859
10,998
1,229
3,109
(1)
10,000
3. 2010
3. 2011
Other
3. 2012
3. 2013
3. 2014
H1 3. 2015
Change in Free Cash Flow (Graph)
(Unit: Millions of yen)
* Free Cash Flow: Cash flow from operating activities and investing activities
CF from operating activities
CF from investing activities
CF from financing activities
Free CF
16,322
16,000
13,570
12,000
8,000
11,199
10,160
9,810
8,461
8,429
10,015
8,005
5,217
5,332
7,418
4,000
3,649
0
(350)
(1,199) (1,011)
(2,687)
(4,000)
(2,738) (2,580)
8,304
7,307
2,625
1,070
3,400
(1,932)
(1,241)
(4,356) (3,915)
(1,111)
(2,565)(1,555)
(1,387)
(1,650)
(2,277)
(2,018)
(1,092)
(1,200)
(4,554)
(4,798)
(6,263)
(8,000)
(6,204)
(8,018)
(11,111)
(12,000)
(12,203)
(16,000)
Source: Fields
9. 2009
3. 2010
9. 2010
3. 2011
9. 2011
3. 2012
9. 2012
Copyright 2014
3. 2013
9. 2013
FIELDS CORPORATION
3. 2014
9. 2014
All rights reserved.
25
CSR Activities
FIELDS CORPORATION
The Greatest Leisure for All People
Our corporate activities and CSR should be one and the same
Basic approach to CSR
【 Fields Topics 】
Ongoing implementation of power-saving measures
Topics 1
The Company will continue to comply with
power-saving measures in summer 2014, as in 2013.
Measures related to air conditioning equipment:
・Reduction in hours of operation and thorough management of
air conditioner temperatures
・Use of lighting reduced and light bulbs changed to LED light bulbs
・Energy-saving multi-function machines adopted
Measures related to office equipment:
・Introduction of power-saving office equipment, reductions in
standby power use of computers and other equipment
Measures in compliance with “Cool Biz” program
Description
Charity golf tournament support
Topics 2
“THE LEGEND CHARITY PRO-AM TOURNAMENT”
Date
May 17-18, 2014
Activities
Proceeds from entree fee, charity auction, sale of tickets to the
venue were donated from 2009
Donations
Donated to regions affected by the Great East Japan
Earthquake for reconstruction support
Topics 3
Topics 4
Introduction of the Eco-Car
Object
Sales cars: 256
Duration
September 2009-June 2012
Effect
Reduction in CO2 by 480t a year
(Equivalent to CO2 absorption of 30,000 cedar trees)
Renewed ISO 27001, ISO 9001
Topics 5
Information Security Management System and Quality Management
ISO 27001: 2005
July 2013 Certification renewed
ISO 9001: 2008
June 2014 Certification renewed
Details
Upgrading of information security management system
Continuous improvement of quality management
Topics 6
Establishment of Okinawa working center
Activities
Employs people with disabilities in Okinawa to promote the
employment for people with disabilities
Fulfills the social responsibility through offering employment
opportunities and a comfortable working place to people with
disabilities
Active participation in volunteer activities
Eco-activities through joining Cleanup Campaign
Mar. 2011-
Held a Cleanup at Nampeidai-cho (around the Head Office;
ongoing on a monthly basis)
Establishment Date
April 1, 2010 (Opening ceremony: April 5, 2010)
Jun. 2013
Collected plastic bottle caps and used stamps
Business Activities
Business of data imputing, etc. of office-related matters
Oct. 2013
Support for the Be Smile Project and visits to child welfare
facilities in Nagasaki prefecture
Dec. 2013
Participation in fiscal 2013 mochi-tsuki (rice-cake pounding) festival of
Nampeidai-cho, Shibuya ward neighborhood association
Held a Cleanup at Yoyogi Park (joint activity with ARTNATURE INC.)
Mar. 2014
FIELDS CORPORATION
Joined “Cleanup Campaign Kugenuma Beach” organized by JEAN
Apr. 2014
The Greatest Leisure for All People
Joined the Shibuya Ward Cleanup Day (Shibuya Day, April 28),
Apr. 2014
sponsored by Shibuya ward in Tokyo
Sep. 2014
Joined “Cleanup Campaign Kugenuma Beach” organized by JEAN
Topics 7
Introduction of AED*
(*Automatic External Defibrillator)
Activities
Installed a numbers of AED at visible places in the office
building such as nearby entrance to allow visitors and
neighborhood residents to use, as well as employees.
Employees took instruction course of AED.
Date
From January 7, 2011
Installation
Site
Head office, 7 regional offices, 26 branches
Okinawa working center and Total Workout (gym)
a total of about 52 places
【 Group Companies Topics 】
Tsuburaya Productions Co., Ltd.
Established ULTRAMAN FOUNDATION
Tsuburaya Productions Co., Ltd. and other sponsoring corporate group companies established ULTRAMAN FOUNDATION immediately after the Great East Japan
Earthquake in March 2011 to support the regions affected by the earthquake.
This Foundation provides psychological and material support to children who are the hope for the future and deploys the permanent support activities for children’s future.
Overview of ULTRAMAN FOUNDATION
2011
Name
ULTRAMAN FOUNDATION
Representative
Hidetoshi Yamamoto
(Tsuburaya Productions Co., Ltd. Chairman & CEO)
Establishment
March 2011
Organizer
Tsuburaya Productions Co., Ltd.
2012
URL
http://www.ultraman-kikin.jp/en/
2013
Statement
Ultraman Foundation is a foundation that acknowledges children
are the hope for the future, and will provide everlasting support
in all kinds of ways for the welfare and well being of all children.
It is our mission to bring back the smiles to the faces of each
child as soon as possible, and we pray from our heart that the
children will move on to their bright future.
Slogan
Source: Fields
A Foundation to support the present and future of
the earthquake-affected children
2014
Activities
Visits to provide support to regions affected by the earthquake
Miyagi prefecture: Ishinomaki, Minamisanriku,
Kesennuma, Higashimatsushima, Onagawa
Fukushima prefecture: Sukagawa, Koriyama, Iwaki, Fukushima
Iwate prefecture: Miyako, Otsuchi
Chiba prefecture: Asahi
Gifts of donations and other
30 million yen to Miyagi prefecture
20 million yen to Fukushima prefecture
20 million yen and a microbus to Iwate prefectural office
Visits to provide support to regions affected by the earthquake
Miyagi prefecture: Ishinomaki, Onagawa
Fukushima prefecture: Koriyama, Sukagawa
Visits to provide support to regions affected by the earthquake
Miyagi prefecture: Higashimatsushima
Fukushima prefecture: Tomioka
Gifts of donations and other
25 million yen and a microbus are donated to each Iwate,
Miyagi and Fukushima prefecture
“HERO CARAVAN” started in Tohoku in March, 2013 and visited 78
places affected by the earthquake to bring cheer to children.
By the end of March 2014 the HERO CARAVAN had visited 79 nursery
schools and kindergartens and had touched the lives of over 7,200 children.
Held the Genki Festival 2014, a charity event supporting reconstruction
following the Great East Japan Earthquake, in collaboration with Antonio
Inoki; ULTRAMAN FOUNDATION plans to hold Ultraman Hero shows
at 8 halls in Tohoku.
Copyright 2014
FIELDS CORPORATION
All rights reserved.
26
Corporate Governance System
FIELDS CORPORATION
The Greatest Leisure for All People
Basic Approach to Corporate Governance
FIELDS CORPORATION has identified its corporate philosophy as providing “The Greatest Leisure for All People,” and has
established a basic management policy of continuously enhancing corporate value. To realize this basic policy, enabling
corporate governance system functions is considered to be one of our key management issues. We enhance our corporate
governance system by advancing reforms in our management structures and institutions specifically within the framework of the
Board of Directors, the Board of Statutory Auditors, the Independent Auditors and the Board of Corporate Officers.
General Meeting of Shareholders
Nomination and removal
Nomination and removal
Report
Board of Directors
Report
Report
Nomination and removal
Nomination and removal
Chairman and CEO/
President and COO
Independent Auditors
Board of Statutory Auditors
Audit
Nomination/Rejection of nomination/
Approval of removal/
Confirmation of accounting audit/
Verification of independence
Cooperation
Report
Cooperation
Internal Audit Office
Board of Corporate Officers
Cooperation
Internal audit
Accounting audit
Business Operating Divisions
Profit Return Policy
FIELDS CORPORATION
The Greatest Leisure for All People
Basic policy: Profit-based dividend/Consolidated payout ratio standard: Higher than 20% (Focus on stability)
(Unit: Millions of yen)
3. 2007
3. 2008
3. 2009
3. 2010
3. 2011
3. 2012
3. 2013
3. 2014
3. 2015 E
Net income
3,710
5,296
(1,481)
3,289
7,520
5,991
4,720
5,370
2,500
Total dividend
1,388
1,561
1,534
1,503
1,660
1,659
1,659
1,659
1,659
37.4
29.5
-
45.9
22.1
27.7
35.1
30.9
66.4
347,000
347,000
347,000
347,000
347,000
347,000
34,700,000
34,700,000
34,700,000
347,000
347,000
347,000
336,357
332,115
332,115
331,838
33,183,800
-
347,000
347,000
336,357
332,115
332,115
331,838
33,183,800
33,183,800
-
Payout ratio (%)
Total number of
outstanding common stock
As of 1st Half
(excluding treasury stock)
As of Full-Year
(excluding treasury stock)
(Forecast)
Annual dividend Annual dividend Annual dividend Annual dividend Annual dividend
Dividend per one unit (Yen)
50 yen
50 yen
50 yen
50 yen
50 yen
Interim
dividend
20 yen
Interim
dividend
25 yen
Interim
dividend
25 yen
Interim
dividend
25 yen
Interim
dividend
25 yen
Interim
dividend
25 yen
Year-end
dividend
25 yen
Year-end
dividend
25 yen
Year-end
dividend
25 yen
Year-end
dividend
25 yen
Year-end
dividend
25 yen
Year-end
dividend
25 yen
Annual dividend Annual dividend Annual dividend
45 yen
Annual dividend Commemorative
Dividend 5 yen
40 yen
Interim
dividend
20 yen
Interim
dividend
20 yen
Year-end
dividend
20 yen
Year-end
dividend
20 yen
45 yen
45 yen
Interim
dividend
20 yen
Year-end
dividend
25 yen
*
* Interim dividends have increased as of November 4, 2010.
* A split of common shares was effected at a ratio of 1:100 with a record date of September 30, 2012, and all amounts are indicated taking the share split into account retroactively.
Source: Fields
Copyright 2014
FIELDS CORPORATION
All rights reserved.
27
FIELDS CORPORATION
The Greatest Leisure for All People
4. Appendix II (Pachinko/Pachislot Market Data)
FIELDS CORPORATION
The Greatest Leisure for All People
Copyright 2014
FIELDS CORPORATION
All rights reserved.
28
FIELDS CORPORATION
The Greatest Leisure for All People
Pachinko/Pachislot Market
Market Scale of Pachinko/Pachislot Industry
Change in Pachinko/Pachislot Market Scale
The data is updated every August by “White Paper on Leisure: Japan Productive Center”
FY2013 Japanese Leisure Market
Total Size of ¥65.2 trillion
Total leisure market
90.9 89.2
Sports
¥3.9 trillion
(6.0%)
Sightseeing / Excursion
¥10.0 trillion
Games / Gambling / Eating out
(15.4 %)
¥24.2 trillion
(37.2 %)
Hobby / Creation
¥8.1 trillion
(12.6 %)
Pachinko/Pachislot market
(Unit: Trillions of yen)
87.0 85.5 85.0
82.6 83.2 81.8 81.3 80.2
79.2
30.0 28.4 28.0 28.4 28.6 27.8 29.2 29.6 29.4 28.7 27.4
1996
1998
2000
2002
2004
74.6 72.6
69.4 67.9
64.9 64.7 65.2
22.9 21.7 21.0
19.3 18.8 19.0 18.8
2006
2008
2010
2012
Change in Number of Pachinko/Pachislot Players
Pachinko / Pachislot
¥18.8 trillion
(28.8 %)
The data is updated every August by “White Paper on Leisure: Japan Productive Center”
Entertainment Business Institute
White Paper on Leisure
(Unit: 10 thousand players)
4,423
2,865
2,760
Pachinko/Pachislot is one of the leading forms of leisure in Japan,
being played by about 10% of the population
in pachinko halls of 11,893 venues
2,998
2,819
2,766
2,310
1,980
2,020 1,930
1996
FIELDS CORPORATION
The Greatest Leisure for All People
1998
2,170
2,100
1,860
2000
1,900 1,790
1,823 1,740
1,720 1,670
1,710 1,660
1,580
1,450
1,260
1,110
1,606
970
1,509
1,469
1,345 1,414
2002
2004
2006
2008
2010
2012
*1 Entertainment Business Institute has suspended the survey regarding number of pachinko/pachislot players since 2009.
*2 “White Paper on Leisure” has changed the survey method to internet base survey since 2009.
Income Structure of Pachinko Halls
Pachinko/Pachislot Market Size: ¥18.8 trillion (Total lease amount of pachinko balls)
Gross Profit:
¥2.8 trillion
Premiums: ¥16.2 trillion (Returned to players)
Gross Profit: ¥2.8 trillion
New Machine Installment Costs
(Purchase cost of new machines)
▼
Investment for Customer Expansion
Pachinko Machines: ¥609.9 billion
Pachislot Machines : ¥473.3 billion
■ Costs for constructing new halls and refurbishing
existing halls
■ Advertising, marketing and service expenses
■ Other expenses related to equipment
■ Other expenses
■ Net income
▼
▼
▼
Pachinko/Pachislot Machine Market:
Approximately ¥1083.2 billion
Hall-related Businesses
Net Income
Source: “White Paper on Leisure” by Japan Productive Center,
“Pachinko Participation Fact-Finding Survey” by Entertainment business Institute, National Police Agency’s data,
“Trend and Market Share of Pachinko Related Manufacturers 2012” by Yano Research Institute, and Estimation by Fields
Copyright 2014
FIELDS CORPORATION
All rights reserved.
29
Players in the Pachinko/Pachislot Industry
FIELDS CORPORATION
The Greatest Leisure for All People
Pachinko/Pachislot Hall
Pachinko/Pachislot Manufacturers
Direct sales
(As of March 31, 2014)
■Around 11,893 in Japan
(FY2013)
40% for pachinko and 20% for pachislot
■Neighborhood based
■Large number of small owner operators but
some significant chains
■Constant need to attract and retain players
■‘Fickle’ client base
■High machine turnover (every 12 months)
■On average, each machine pays for itself in
3-6 weeks
■Regulated
Distributors
■Usually paid via a commission
from manufacturers but may
also have a resale model for
pachislot
■Pachinko Manufactures: 35 companies
■Pachislot Manufactures: Over 60 companies
■Network of salesmen
■Regulated
Ex. MARUHAN Corporation
DYNAM Co.,Ltd.
■Not directly regulated
Ex. Sammy Corporation, SANKYO CO., LTD., and
KYORAKU SANGYO
Indirect sales
60% for pachinko and 80% for pachislot
Peripheral Equipment Manufacturers and Others
Parts and Software Manufacturers
• Software for graphics chips and liquid crystal displays
• Parts of pachinko/pachislot machines and other items
• Unit and pachinko hall computers
• Premiums, equipment and other items
Ex. AXELL Corporation and
EIZO NANAO CORPORATION
Ex. DAIKOKU DENKI Co., Ltd.
Japan Cash Machine Co., Ltd.
Mars Engineering Corporation
Recent Trend of Pachinko/Pachislot Industry
FIELDS CORPORATION
The Greatest Leisure for All People
●Jul. Introduction of revised pachinko/
pachislot machines regulation
2004
2005
●May Introduction of revised Entertainment Business Control Law;
restricted pachinko parlor business (Severer penalties)
2006
2007
2008
2010
2011
● Mar. Regulations and interpretations ●Mar. Nikkoso revised internal
were partially revised.
regulation.
Entertainment level is accelerating by Partially self imposed control
the revised technical interpretations.
regarding gambling nature.
[Pachinko Industry Change]
● Jul. Revised regulation → Deregulation Abolition of classification
Nikkoso, an organization of pachinko machine manufacturers
revised internal regulation Lowest bound jackpot: 1/360-1/500
● Oct. Nikkoso revised internal regulation
Lowest bound jackpot: 1/500-1/400 Self-imposed control
● Nov. A new model adapted to
the new regulations was released
“CRF Dai Yamato 2 (SANKYO)”
Jackpot trend
1/400-1/500
2009
●Aug. Strictly restricted pachinko and pachislot advertisement
2012
2013
● Mar. Nikkoso revised
internal regulation.
Partial change regarding
specifications.
● Jan. Nikkoso revised internal regulation.
● Apr. Nikkoso revised internal
Partially self imposed control regarding
regulation.
gambling nature.
Self imposed control regarding the
gambling nature of so called ‘Maximum
spec machine’
● Jul. Nikkoso revised internal regulation.
Partially self imposed control regarding
gambling nature.
2014
● Jun. Nikkoso revised
internal regulation.
Partial change regarding
specifications.
● Dec. Nikkoso revised internal regulation.
Partially self imposed control regarding gambling nature
Jackpot trend
1/300-1/400
Jackpot trend
1/300-1/350
Rise of low playing cost and
MAX type machines
[Pachislot Industry Change]
●Jul. Restraining the nature of gambling, the revised regulations for
pachislot machines were introduced
Setting upper bound jackpot
SECTA’s simulation test introduced
● Mar. Regulations and interpretations were partially revised.
Entertainment level is accelerating by the revised technical
● Sep. Changes to
administration of model
certification tests
The minimum ball
discharge rate is 55%
interpretations
● Oct. The full-scale shift to regulation 5 machines was completed
● Sep. A new model adapted to the
new regulations was released
“Neon Genesis Evangelion (Bisty)”
More entertainment machines from gambling machines
by shifting from regulation 4 to regulation 5
Source: Fields and National Police Agency’s data
©CAPCOM CO., LTD. ALL RIGHTS RESERVED. ©オッケー.
©CAPCOM CO., LTD. ALL RIGHTS RESERVED.
©2002松本零士/ユウガ<「大銀河シリーズ」より>
©GAINAX・カラー/Project Eva. ©Bisty
Regulation 5 era; more gaming and
entertainment machines
Copyright 2014
FIELDS CORPORATION
All rights reserved.
30
Number of Pachinko Halls and Change in Number of
Pachinko/Pachislot Machines Installed Per Hall
FIELDS CORPORATION
The Greatest Leisure for All People
The data is updated every April by “National Police Agency’s data”
Pachinko/Pachislot hall establishment (Unit: Stores)
43000
Pachislot specialty stores (Unit: Stores)
Installed machines per hall (Unit: M achines)
38000
349.8
336.5
284.9
28000
268.0
268.0
270.3
274.3
18,164
17,773
17,426
17,173
279.9
371.9
387.8
400.0
337.9
350.0
323.1
318.2
33000
356.2
365.0
377.2
304.3
294.7
300.0
23000
250.0
18000
16,988
16,801
16,504
16,076
15,617
15,165
14,674
13,585
12,937
12,652
13000
17,594
17,174
16,764
16,413
16,021
15,691
15,255
8000
14,695
13,844
13,163
12,588
12,039
11,800
11,722
12,479
12,323
12,149
11,893
11,576
11,392
11,178
10,873
200.0
150.0
967
1,110
1,249
1,381
1,773
2,002
2000
2001
2002
2003
2004
2005
3000
-2000
570
599
662
760
1996
1997
1998
1999
2,086
2006
1,546
1,137
930
903
931
971
1,020
2007
2008
2009
2010
2011
2012
2013
100.0
Number of Installed Pachinko/Pachislot Machines
and Annual Turnover Rate
FIELDS CORPORATION
The Greatest Leisure for All People
The data of number of installed Pachinko/Pachislot machines is updated every April by “National Police Agency’s data”
The data of annual turnover of pachislot machine is updated every August by “Trend and Market Share of Pachinko Related Manufacturers” by Yano Research Institute
Number of installed pachinko machines (Unit: 10 thousand machines)
Number of installed pachislot machines (Unit: 10 thousand machines)
Annual turnover rate of pachinko machine (Times)
1.30
Annual turnover rate of pachislot machine (Times)
1200
1.37
1.31
1.14
1.01
1000
0.74
0.77
800
600
0.88
0.82
0.98
0.86
0.97
0.89
0.98
1.30
1.11
1.06
0.92
1.07
0.94
0.92
0.89
0.87
0.86
0.85
0.80
0.84
0.82
0.64
466
473
471
470
475
478
486
489
496
489
493
322
293
355
332
296
369
342
307
385
325
390
100
113
132
145
160
166
193
200
88
188
76
1996
1997
1998
1999
2000
2001
2002
2003
2004
2005
2006
0.82
0.70
0.63
0.60
0.55
1.08
1.07
0.68
0.57
0.30
459
452
450
455
458
458
461
295
307
315
316
310
304
300
163
144
134
139
147
154
160
2007
2008
2009
2010
2011
2012
2013
2011
2012
2013
400
-0.20
200
0
-0.70
【 Annual Turnover rate of Total Machine (Times) 】
1995
0.90
1996
0.93
1997
0.71
1998
0.67
1999
0.86
2000
0.95
2001
0.95
2002
0.96
Source: National Police Agency’s data,
“Trend and Market Share of Pachinko Related Manufacturers” by Yano Research Institute
2003
1.13
2004
1.15
2005
1.19
2006
1.11
2007
2008
1.07
Copyright 2014
0.94
2009
0.91
2010
0.85
FIELDS CORPORATION
0.84
0.83
0.75
All rights reserved.
31
Unit Sales and Sales Amount of Pachinko/Pachislot Machines
FIELDS CORPORATION
The Greatest Leisure for All People
The data is updated every August by “Trend and Market Share of Pachinko Related Manufacturers” by Yano Research Institute
Unit sales of pachinko machines (Unit: 10 thousand machines)
Unit sales of pachislot machines (Unit: 10 thousand machines)
Pachinko machine sales amount (Unit: 100 millions of yen)
Pachislot machine sales amount (Unit: 100 millions of yen)
1200
8,699
8,986
8,686
9,213
9,852
7,865
8,267
8,869
9000
7,729
6,720
1000
5,184
5,683
5,691
800
3,623
1,828
600
2,693
2,353
3,145
405
336
393
449
5,263
5,225
5,025
4,909
3,965
3,750
568
424
3000
401
404
383
1000
409
387
385
381
290
260
249
343
317
-1000
333
333
235
284
5000
2,258
547
317
323
4,733
2,867
2,478
582
4,299
7000
491
368
336
5,365
467
452
312
312
200
6,099
552
435
400
3,513
5,615
204
-3000
0
93
113
129
184
52
77
150
42
1996
1997
1998
1999
2000
2001
2002
2003
167
178
2004
2003
11,983
164
174
2005
2006
2004
2005
13,090
14,064
91
76
97
125
132
139
2007
2008
2009
2010
2011
2012
2013
2006
2007
2008
2009
2010
2011
2012
2013
13,895
13,711
11,691
12,110
11,736
12,007
12,028
10,832
-5000
【Pachinko/Pachislot machine total (100 millions of yen) 】
1996
1997
NA
1998
NA
5,976
1999
2000
7,877
2001
8,828
9,204
2002
9,580
Market Share by Manufacturers
FIELDS CORPORATION
The Greatest Leisure for All People
The data is updated every August by “Trend and Market Share of Pachinko Related Manufacturers” by Yano Research Institute
【 Unit Sales Share - Pachinko Machines 】
2008
Ranking
Manufacturer
2009
Market share
Manufacturer
2010
Market share
Manufacturer
2011
Market share
Manufacturer
2012
Market share
Manufacturer
2013
Market share
Manufacturer
Market share
1
SANYO
24.2% SANYO
18.0% SANYO
22.5% KYORAKU
18.7% SANYO
21.8% KYORAKU
17.0%
2
SANKYO
13.5% SANKYO
17.2% SANKYO
14.6% SANKYO
13.9% KYORAKU
20.3% SANYO
15.4%
3
Sammy
11.7% KYORAKU
12.8% Sammy
11.8% Sammy
10.1% SANKYO
14.3%
4
KYORAKU
10.5% Newgin
11.9% KYORAKU
11.1% SANYO
5
Newgin
10.4% Sammy
10.8% Newgin
10.2% Newgin
HEIWA/
12.8%
OLYMPIA
12.8% Newgin
10.0% Sammy
9.8% Sammy
8.7%
9.8%
HEIWA/
OLYMPIA
9.6%
* SANKYO’s sales share includes Bisty
* Sammy’s sales share includes GINZA and TAIYO ELEC
【 Unit Sales Share - Pachislot Machines 】
2008
Ranking
Manufacturer
2009
Market share
Manufacturer
2010
Market share
Manufacturer
2011
Market share
Manufacturer
2012
Market share
Manufacturer
2013
Market share
Manufacturer
Market share
1
YAMASA
18.8% Sammy
21.3% Sammy
30.9% Sammy
23.9% UNIVERSAL
17.8% Sammy
21.7%
2
SANKYO
14.6% SANKYO
13.6% DAITO
11.9% DAITO
15.9% Sammy
15.3% UNIVERSAL
15.5%
11.9% YAMASA
15.6% YAMASA
HEIWA/
14.6%
OLYMPIA
8.6%
11.3% UNIVERSAL
13.7% DAITO
14.0% SANKYO
8.4%
8.3% DAITO
7.3%
3
4
5
Sammy
HEIWA/
OLYMPIA
KITA
DENSHI
13.5% UNIVERSAL
7.4% YAMASA
KITA
6.5%
DENSHI
13.1% SANKYO
9.5%
HEIWA/
OLYMPIA
7.8% UNIVERSAL
10.5% SANKYO
KITA
7.6%
DENSHI
* Sammy’s sales share includes RODEO, IGT, TRIVY, and TAIYO ELEC
* SANKYO’s sales share includes Bisty
* Aruze changed the company name to Universal Entertainment in 2009
* UNIVERSAL’s sales share includes Eleco, Mizuho and Macy
* OLYMPIA’s sales includes HEIWA’s sales; Total sales of all OLYMPIA and HEIWA brands is shown
Source: “Trend and market share of Pachinko related makers” by Yano Research Institute
Copyright 2014
FIELDS CORPORATION
All rights reserved.
32
Monthly Trends of Pachinko Halls -Excerpt from Current Survey of Selected Service Industries-
FIELDS CORPORATION
The Greatest Leisure for All People
The data is updated monthly by “Current Survey of Selected Service Industries: The Ministry of Economy, Trade and Industry”
410
4
Net sales per hall (Unit: 100 millions of yen)
Installed machines per hall (Unit: Machines)
400
390
384
380
385
384
385
384
384
383
385
385
388
387
387
386
389
387
387
394
392
391
387
390
393
391
393
391
391
392
391
391
391
395
394
392
390
397
395
394
395
395
394
401
400
397
396
399
398
400
398
396
399 399
397
3.5
391
387
381
3
370
2.56
2.53
2.44
2.43
2.40
2.37
360
2.22
2.40
2.23
2.41
2.38
2.26
2.25
2.38 2.35
2.32
2.27
2.19
2.17
2.32
2.27
2.14
2.16
2.42 2.43
2.372.34
2.32 2.352.29
2.27
2.23
2.32
2.14
2.10
2.05
350
2.42
2.35
2.47
2.40
2.25
2.21
2.42
2.31
2.22
2.19
2.13
2.04
2.5
2.30
2.21
2.14
2.05
2.13
2.04
1.94
2
340
330
1.5
1. 2010
7. 2010
1. 2011
7. 2011
1. 2012
7. 2012
1. 2013
7. 2013
1. 2014
7. 2014
* Figures are calculated based on data and growth rates released in the “Current Survey of Selected Service Industries,” using January 2001 as the reference point.
* The survey covers approximately 300-400 halls from January 2008 to December 2012 and approximately 1,200 halls from January 2013.
The Ministry of Economy, Trade and Industry outsource to the Zennichiyuren to pick up the hall for survey from 47 prefectures.
FIELDS CORPORATION
The Greatest Leisure for All People
Source: “Current Survey of Selected Service Industries” : The Ministry of Economy, Trade and Industry
Copyright 2014
FIELDS CORPORATION
All rights reserved.
33
FIELDS CORPORATION
The Greatest Leisure for All People
5. Appendix III (Entertainment Market Data Except Pachinko/Pachislot Industry)
FIELDS CORPORATION
The Greatest Leisure for All People
Copyright 2014
FIELDS CORPORATION
All rights reserved.
34
Market Scale of Content Business
FIELDS CORPORATION
The Greatest Leisure for All People
The data is updated every September by “White Paper on Digital Content: Digital Content Association of Japan.”
Still image/Text
120,990
10,474
Animation
123,248
11,043
Music
(Unit: 100 millions of yen)
Games
128,124
129,859
129,962
11,151
12,652
12,344
17,003
16,941
16,441
126,443
11,660
119,155
119,578
118,036
118,623
119,094
10,703
11,675
12,321
13,775
14,819
14,454
13,797
13,341
13,639
13,231
43,982
44,984
44,465
44,303
44,804
15,914
17,056
16,878
45,031
46,153
48,429
49,174
53,419
54,220
54,467
53,200
50,016
49,122
47,909
46,906
46,240
2003
2004
2005
2006
2007
2008
2009
2010
2011
2012
2013
46,710
46,046
46,551
45,669
Market Scale of Digital Content Business
FIELDS CORPORATION
The Greatest Leisure for All People
The data is updated every September by “White Paper on Digital Content: Digital Content Association of Japan.”
Still image/Text
Animation
Music
Games
(Unit: 100 millions of yen)
67,807
59,360
53,723
49,696
45,832
40,657
31,723
35,383
5,914
9,393
42,651
43,348
10,732
12,912
36,746
13,252
29,402
13,272
18,169
12,349
10,340
12,572
11,043
8,415
14,819
11,382
12,652
13,377
13,403
13,775
12,344
11,151
10,474
76,589
11,675
10,703
11,660
75,378
22,082
14,970
2,653
3,780
4,958
6,271
7,409
7,873
8,654
8,612
9,029
1,932
2003
2004
2005
2006
2007
2008
2009
2010
2012
2013
Source: “White Paper on Digital Content” by Digital Content Association of Japan
Copyright 2014
FIELDS CORPORATION
All rights reserved.
35
Sales Amount of Comic Books and Comic Magazines
FIELDS CORPORATION
The Greatest Leisure for All People
The data is updated the end of April every year by “Annual Report of Publishing Indicator: All Japan Magazine and Book Publisher’s Editor’s Association.”
Comic book
5,047
Comic magazine
5,023
4,810
(Unit: 100 millions of yen)
4,699
4,483
4,187
2,549
2,421
2,277
2,204
2,111
4,091
1,914
1,775
3,903
3,766
3,669
1,650
1,564
1,438
2,498
2,602
2,533
2,495
2,372
2,274
2,315
2,253
2,202
2,231
2004
2005
2006
2007
2008
2009
2010
2011
2012
2013
Market Scale of Animation Industry
FIELDS CORPORATION
The Greatest Leisure for All People
The data is updated every April by “Fluctuations in Japan’s animation market: Association of Japanese Animation.”
The data of pachinko/pachislot machines using animation are estimated by Fields. (Except pachinko/pachislot: Calculated according to amount of user’s payment)
TV
Video
Commercialization
Overseas
Theater/Movie
(Unit: 100 millions of yen)
Broadcast
Music
Pachinko/Pachislot 13,499
13,584
13,031
1,528
12,207
11,187
4,827
5,204
5,204
4,212
91
14,068
1,665
4,390
4,137
263
235
120
261
5,049
5,305
6,419
4,337
4,617
10
1,176
196
1,165
18
1,031
380
1,100
41
1,388
84
1,358
178
1,041
284
1,003
98
1,278
213
924
2003
2004
2005
2006
2007
12,825
1,226
2,867
2,544
270
307
5,652
5,881
102
1,113
338
946
2008
Source: “Annual Report of Publishing Indicator” by All Japan Magazine and Book Publisher’s Editor’s Association
“Fluctuations in Japan’s animation market: Association of Japanese Animation" and Estimation by Fields
13,227
13,393
13,721
2,026
2,272
2,669
2,408
297
245
230
6,120
6,421
6,041
123
1,052
299
955
149
1,085
338
895
160
1,067
285
900
272
1,059
409
951
2009
2010
2011
2012
Copyright 2014
FIELDS CORPORATION
All rights reserved.
36
Box-Office of Domestic Movie Theaters
FIELDS CORPORATION
The Greatest Leisure for All People
The data is updated every January by “Statistics of Film Industry in Japan: Motion Picture Producers Association of Japanese, Inc.”
Japanese movies
2,109
Foreign movies
(Unit: 100 millions of yen)
2,207
2,029
1,982
1,984
2,060
1,948
1,952
1,942
1,812
1,319
950
1,164
1,038
1,079
791
818
2004
2005
FIELDS CORPORATION
The Greatest Leisure for All People
670
765
817
946
2006
1,025
887
790
1,159
1,173
1,182
2008
2009
2010
2007
1,282
995
2011
1,176
2012
2013
Market Scale of Broadcasting Industry
The data is updated on September and May of each year
by “Status of Earnings and Expenses of Private Broadcasting Organizations: Ministry of Internal Affairs and Communication,” “Japan Broadcasting Corporation.”
NHK(=Japan Broadcasting Corporation)
Satellite broadcasters
38,356
3,330
2,995
39,580
3,533
3,158
25,229
26,153
6,802
2003
Terrestrial broadcasters
Cable broadcasters
40,422
40,975
3,850
4,050
4,746
3,414
3,525
3,737
40,037
26,138
26,091
6,736
6,635
2004
2005
(Unit: 100 millions of yen)
39,794
4,667
38,957
38,569
38,695
39,081
5,134
5,437
5,177
4,930
5,030
3,887
4,185
4,490
4,509
4,491
22,574
22,655
22,501
22,869
23,215
38,128
3,905
25,848
24,493
6,756
6,644
6,729
6,533
6,680
6,401
6,387
6,345
2006
2007
2008
2009
2010
2011
2012
2013
Sources: “Statistics of Film Industry in Japan: Motion Picture Producers Association of Japanese, Inc.”
“Status of Earnings and Expenses of Private Broadcasting Organizations: Ministry of Internal Affairs and Communications,
Japan Broadcasting Corporation”
Copyright 2014
FIELDS CORPORATION
All rights reserved.
37
Market Scale of Mobile Business
FIELDS CORPORATION
The Greatest Leisure for All People
The data is updated every July by “Mobile Content Forum.”
Mobile commerce market
30,142
Mobile content market (smartphone)
Mobile content market (feature phone)
(Unit: 100 millions of yen)
23,507
19,061
15,206
16,550
14,997
13,524
11,601
11,716
9,307
7,224
3,842
1,709
5,196
2,593
4,074
7,329
19,359
8,689
9,681
10,085
806
5,641
2,133
3,150
3,666
4,272
4,835
5,525
2,603
2003
2004
2005
2006
2007
2008
2009
6,465
2010
6,539
2011
3,717
4,793
2012
8,336
2,447
2013
FIELDS CORPORATION
The Greatest Leisure for All People
Sources: “Results of Survey on Industry Structure of Mobile Content: Ministry of Internal Affairs”
Copyright 2014
FIELDS CORPORATION
All rights reserved.
38
FIELDS CORPORATION
The Greatest Leisure for All People
Reference: Notification of Our IR Site
IR materials are available from our IR website. Please visit us and utilize them.
IR Pages (Japanese)
IR Pages (English)
URL : http://www.fields.biz/ir/j/
URL : http://www.fields.biz/ir/e/
-Company profile
-Data related to financial statements
-Financial presentation
-IR press releases
-Corporate governance/CSR information
-Shareholder and share information
FIELDS CORPORATION
[ Nikko
IR ] Chosen
the “Best Corporate Website award FY2013”
The Greatest
Leisure
for Allfor
People
Ranked No. 1 in the new markets ranking for the fourth consecutive year
and ranked No. 1 by industry for the third consecutive year
Renewed our IR site (English) in July 2014
[ DAIWA IR ]
FY2013
Company of Excellence
[ Gomez ]
FY2014
Silver Prize
[ JASDAQ ]
FY2008
IR Company of Excellence
Analysis Tools
【 Annual Report (Japanese/English) 】Issued annually since the year ended March 31, 2004
[Shaping the FUTURE]
Latest issue: October 28, 2014
-Changes in IP business
-Review of business activities
-CSR
-Financial section
-Corporate data
IR information is also Available on our mobile site
Smart phone
Source: Fields
Copyright 2014
Mobile phone
FIELDS CORPORATION
All rights reserved.
39
FIELDS CORPORATION
The Greatest Leisure for All People
FIELDS CORPORATION
The Greatest Leisure for All People
Disclaimer
The plans, strategies and estimates of the Company indicated in these documents, other than actual results and facts, include potential risks and
uncertainties and cannot be guaranteed.
Potential risks and uncertainties include, but are not limited to, the economic environment, market competition and the products handled by the
Company.
Unauthorized copying and replication of the contents of this document, text and images are strictly prohibited.
Copyright 2014
FIELDS CORPORATION
All rights reserved.


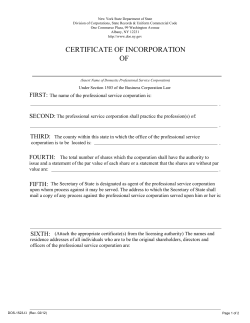
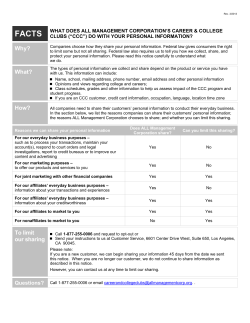
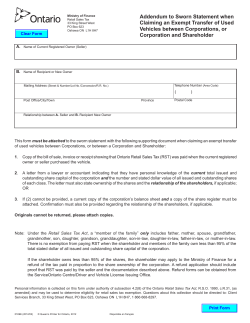


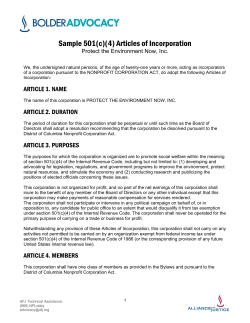
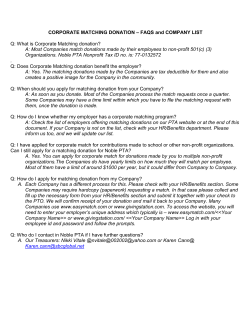
© Copyright 2026