
Ventilator Advisory System Employing Load and Tolerance Strategy Recommends Appropriate Pressure
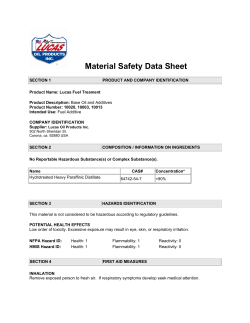
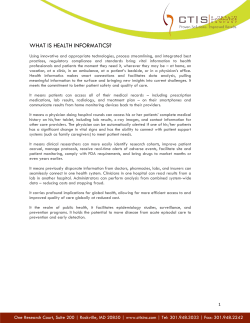
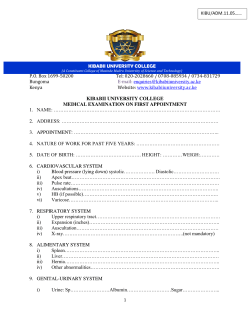
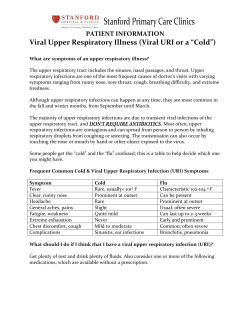
CHEST Original Research CRITICAL CARE MEDICINE Ventilator Advisory System Employing Load and Tolerance Strategy Recommends Appropriate Pressure Support Ventilation Settings* Multisite Validation Study Michael J. Banner, PhD; Neil R. Euliano, PhD; Neil R. MacIntyre, MD; A. Joseph Layon, MD, FCCP; Steven Bonett, RRT; Michael A. Gentile, RRT; Zoheir Bshouty, MD, PhD, FCCP; Carl Peters, MD; and Andrea Gabrielli, MD Background: Loads on the respiratory muscles, reflected by noninvasive measurement of the real-time power of breathing (POBn), and tolerance of these loads, reflected by spontaneous breathing frequency (f) and tidal volume (VT), should be considered when evaluating patients with respiratory failure. Pressure support ventilation (PSV) should be applied so that muscle loads are not too high or too low. We propose a computerized, ventilator advisory system employing a load (POBn) and tolerance (f and VT) strategy in a fuzzy logic algorithm to provide guidance for setting PSV. To validate these recommendations, we performed a multisite study comparing the advisory system recommendations to experienced physician decisions. Methods: Data were obtained from adults who were receiving PSV (n ⴝ 87) at three university sites via a combined pressure/flow sensor, which was positioned between the endotracheal tube and the Y-piece of the ventilator breathing circuit and was directed to the advisory system. Recommendations from the advisory system for increasing, maintaining, or decreasing PSV were compared at specific time points to decisions made by physician intensivists at the bedside. Results: There were no significant differences in the recommendations by the advisory system (n ⴝ 210) compared to those of the physician intensivists to increase, maintain, or decrease PSV (p > 0.05). Physician intensivists agreed with 90.5% of all recommendations. The advisory system was very good at predicting intensivist decisions (r2 ⴝ 0.90; p < 0.05) in setting PSV. Conclusions: The novel load-and-tolerance strategy of the advisory system provided automatic and valid recommendations for setting PSV to appropriately unload the respiratory muscles that were as good as the clinical judgment of physician intensivists. (CHEST 2008; 133:697–703) Key words: acute respiratory failure; mechanical ventilation; pressure support ventilation; respiratory monitoring; work of breathing Abbreviations: Crs ⫽ respiratory system compliance; f ⫽ spontaneous breathing frequency; Fio2 ⫽ fraction of inspired oxygen; FIS ⫽ fuzzy logic inference system; IMV ⫽ intermittent mandatory ventilation; PEEP ⫽ positive end expiratory pressure; Petco2 ⫽ partial pressure end-tidal carbon dioxide; POBn ⫽ real-time measurement of power of breathing; PSV ⫽ pressure support ventilation; Rrs ⫽ respiratory system resistance; Spo2 ⫽ pulse oximetric oxygen saturation; V˙e ⫽ minute ventilation; Vt ⫽ tidal volume on the respiratory muscles of spontaneL oads ously breathing patients with respiratory fail- ure who were receiving ventilatory support may be reflected by the power of breathing (normal in adults, 4 to 8 J/min1). Power of breathing, the rate at which work is done per minute, is a better assessment of respiratory muscle loads than work www.chestjournal.org Downloaded From: http://journal.publications.chestnet.org/ on 11/10/2014 of breathing per breath because it is measured over time, not for an individual breath. Objective measurement of respiratory muscle loads via power of breathing may be useful to determine when loads are appropriate, too high (eg, ⬎ 15 J/min), or too low (eg, totally unloaded at 0 J/min).2 CHEST / 133 / 3 / MARCH, 2008 697 Tolerance of these loads, as reflected by spontaneous breathing frequency (f) and tidal volume (Vt),3 are routinely assessed when observing patientventilator interactions. As response variables to load, f and Vt provide information on a patient’s ability to handle or tolerate some level of load. As the respiratory muscles become loaded from increased elastic loads (ie, decreased lung and/or chest wall compliance) and/or resistive loads (ie, physiologic airways resistance and imposed breathing apparatus resistance), a fatiguing breathing pattern may ensue. To avoid respiratory muscle fatigue, the respiratory center increases f and minimizes the inspiratory contraction time of the respiratory muscles, which decreases Vt. This produces a pattern of rapid and shallow breathing that minimizes the work of breathing and is, thus, the most energy efficient combination of f and Vt.4 Ostensibly, breathing pattern data are thought to provide a useful representation of the patient’s physiologic pulmonary load sensors5–7 and their ability to tolerate loads, and an inference of the patient’s reserve or capability of breathing. At times, however, when applying PSV, a poor relationship between breathing pattern and respiratory muscle workload data has been reported.2,8 To provide a more comprehensive assessment, it may be prudent to consider monitoring both the f and Vt breathing pattern and respiratory workload in a complimentary manner for patients receiving PSV. When spontaneous breathing of a mechanically ventilated patient is possible, pressure support ventilation (PSV) may be applied so that respiratory muscle loads are not too high or too low and they *From the Departments of Anesthesiology, Physiology, and Surgery (Drs. Banner, Layon, Peters, and Gabrielli, and Mr. Bonett), College of Medicine, University of Florida, Gainesville, FL; Convergent Engineering (Dr. Euliano), Gainesville, FL; the Division of Pulmonary and Critical Care Medicine (Dr. MacIntyre and Mr. Gentile), Duke University Medical Center, Durham, NC; and the Department of Medicine (Dr. Bshouty), University of Manitoba, Winnipeg, MB, Canada. This research was presented in part at the 2006 annual meeting of the American College of Chest Physicians. This research was supported by grants from Respironics, Inc, and Convergent Engineering. A patent describing the system used in this study has been submitted. Dr. Euliano is the President of Convergent Engineering, the manufacturer of the software used in this study. Authors Banner, MacIntyre, Layon, Bonett, Gentile, Bshouty, Peters, and Gabrielli have reported to the ACCP that no significant conflicts of interest exist with any companies/organizations whose products or services may be discussed in this article. Manuscript received August 9, 2007; revision accepted December 1, 2007. Reproduction of this article is prohibited without written permission from the American College of Chest Physicians (www.chestjournal. org/misc/reprints.shtml). Correspondence to: Michael Banner, PhD, University of Florida, College of Medicine, Department of Anesthesiology, Box 100254, Gainesville, FL, 32610; e-mail: [email protected] DOI: 10.1378/chest.07-2011 698 Downloaded From: http://journal.publications.chestnet.org/ on 11/10/2014 appropriately unload the respiratory muscles.3 The level of inspiratory pressure with PSV is generally determined clinically by observing the spontaneous breathing pattern (f and Vt), and the patient’s respiratory muscles are generally thought to be appropriately unloaded when a comfortable breathing pattern is present. More sophisticated approaches involve the placement of an esophageal balloon and titration of the PSV inspiratory pressure to the measured loads on the respiratory muscles.2 Under some conditions when managing patients with respiratory failure, respiratory system mechanics and/or neuromuscular capabilities may change, and expert clinical personnel may not always be available to make timely, proper bedside clinical assessments for setting PSV inspiratory pressure levels. For these conditions, we propose a computerized, ventilator advisory system employing a fuzzy logic inference system (FIS) to make continuous real-time recommendations for increasing, maintaining, or decreasing PSV for patients with respiratory failure based on a load (power of breathing)-andtolerance (f and Vt) strategy (Fig 1). Fuzzy logic is a process of using probability distributions instead of simple “yes/no” decisions, as in a simple rule-based system, to drive the ventilator decision making.9 The purpose of this multisite clinical study was to validate recommendations for increasing, maintaining, or decreasing PSV from this advisory system compared to the recommendations of bedside physician intensivists for setting PSV for patients with respiratory failure. We hypothesized that this advisory system would supply comparable recommendations on PSV treatment compared to those chosen by experienced clinicians. Materials and Methods Institutional review board approvals to conduct the study were obtained from three university hospital sites (the University of Florida, Duke University Medical Center, and the University of Manitoba). A total of 87 adults (Table 1) intubated or tracheostomized (internal diameter, 6.5 to 8.5 mm) and with respiratory failure from various etiologies were enrolled into the study. Also listed in Table 1 are the ventilator settings and related data on enrollment into the study. Pneumonia, pulmonary edema, sepsis, congestive heart failure, and subarachnoid hemorrhage were diagnosed in fairly equal numbers of patients from all three sites. Some patients had direct lung injury from penetrating blunt chest trauma (n ⫽ 12), and some had COPD (n ⫽ 16). Combining all sites, 52 patients were treated in medical ICUs and 35 patients were treated in surgical ICUs. Regarding pulmonary mechanics, the values for respiratory system compliance (Crs) ranged from 0.01 to 0.09 L/cm H2O; the values for respiratory system resistance (Rrs) ranged from 5.8 to 17.8 cm H2O/L/s. At the time of study enrollment, most patients were considered to be in the resolving phases of respiratory failure and were receiving ventilatory support. All patients were breathing spontaneously, receiving PSV, and were hemodynamically stable, and provided with Original Research Figure 1. A clinical example of using the ventilator advisory system is shown. Respiratory muscle load, reflected by POBn, and tolerance for that load, reflected by f or Vt, are combined in a FIS to formulate recommendations for increasing, maintaining, or decreasing PSV. In the image, the advisory system determined that because POBn is too high (13 J/min) and the tolerance for that load is inappropriate, as reflected by f being too high (37 breaths/min) and Vt being borderline low (5 mL/kg of ideal body weight), the set level of PSV of 15 cm H2O is insufficient and more PSV is needed. Note in the “FIS Accuracy” section (bottom), the advisory system (“FIS Suggests”) and “Increase” in PSV, and the physician intesivists (“Expert Suggests”) concur by agreeing on the “PSV Action” to increase PSV. MV ⫽ V˙e; PEEPi ⫽ intrinsic PEEP. appropriate sedation and analgesia as needed. Patients who were hemodynamically unstable (eg, mean arterial BP acutely changing from 40 to 80 mm Hg, with irregular changes in heart rate and/or arrhythmias), heavily sedated (eg, high levels of opioids for analgesia, predisposing the patient to acute changes in spontaneous f and Vt), or had irregular breathing patterns (eg, patients with closed-head injuries whose spontaneous f and Vt may acutely increase and decrease over short periods) were excluded from the study. Patients were ventilated with the same type of ventilator (model 840; Puritan-Bennett; Pleasanton, CA), which was set in the PSV mode and positive end-expiratory pressure (PEEP) mode. For some patients, intermittent mandatory ventilation (IMV), with a Vt of 8 mL/kg of ideal body weight and the mandatory ventilation rate at 2 breaths/min, was combined with PSV and PEEP. IMV was used at one site because of the local practice of combining low IMV rate at 2 breaths/min with PSV and PEEP. At the other two sites, IMV at 2 breaths/min was occasionally combined with PSV and PEEP. A constant or square inspiratory flow waveform was applied with the IMV breaths. For PSV, the “% rise” setting on the ventilator (ie, the control to adjust the ventilator flow-rate output during inhalation and, thus, the rate of pressure rise, which results from the interaction of ventilator flow rate output and patient inspiratory flow rate demand10) ranged from 60 to 80%, and the expiratory sensitivity setting (“Esens”) or PSV breath-termination criteria was 25%. The levels of PSV, PEEP, fraction of inspiratory oxygen (Fio2), carbon dioxide elimination, and hemoglobin oxygen saturation were comparable for patients at all sites at the time of enrollment into the study (Table 1). www.chestjournal.org Downloaded From: http://journal.publications.chestnet.org/ on 11/10/2014 The advisory system under investigation consists of the following two components: a commercially available respiratory monitor (NICO; Respironics; Wallingford, CT); and a laptop computer. Data from a combined pressure/flow/carbon dioxide sensor, which was positioned between the endotracheal tube and the Y-piece of the ventilator breathing circuit, were directed to the respiratory monitor for measurements including f, Vt, minute ventilation (V˙e), PSV, PEEP, and partial pressure end-tidal carbon dioxide (Petco2) [Fig 2]. Crs and Rrs were calculated using the least-squares method during PSV breaths.11 Pulse oximetric oxygen saturation (Spo2) was also measured from a finger site with the monitor. Some of these data were then directed to the laptop computer containing special software (Convergent Engineering; Gainesville, FL) for operation of an artificial neural network that allows for the noninvasive (ie, not requiring insertion of an esophageal balloon catheter), real-time measurement of power of breathing (POBn), and operation of the FIS to process POBn, f, and Vt data to recommend an increase, no change, or decrease in PSV. Obviating the need for an esophageal balloon catheter, greatly simplifies the measurement of POBn, especially for prolonged periods such as in patients receiving ventilatory support over many days. Five predictor variables or input elements are used by the artificial neural network to calculate POBn (the methodology describing how these variables are determined has been published elsewhere8), as follows: (1) spontaneous V˙e (not including IMV breaths) correlates directly with power of breathing; (2) increased intrinsic PEEP is associated with increased power of breathing and vice versa; (3) lower inspiratory trigger pressure CHEST / 133 / 3 / MARCH, 2008 699 96.4 ⫾ 2.6 *Values are given as the mean ⫾ SD, unless otherwise indicated. M ⫽ male; F ⫽ female. All patients were hemodynamically stable prior to and throughout the study. ‡p ⬍ 0.05 (University of Florida vs Duke University Medical Center and University of Manitoba). †p ⬍ 0.05 (University of Florida vs Duke University Medical Center). §p ⬍ 0.05 (Duke University Medical Center vs University of Manitoba). 37.4 ⫾ 7 9.7 ⫾ 2.8 0.51 ⫾ 0.21 20 ⫾ 7 0.44 ⫾ 11 6.0 ⫾ 2 12.6 ⫾ 5 17 M/11 F 67 ⫾ 5 61 ⫾ 16 90 ⫾ 24 95.5 ⫾ 3 38.5 ⫾ 8 8.0 ⫾ 2.6 0.46 ⫾ 0.13 19 ⫾ 6 6.5 ⫾ 1.7 12 ⫾ 4.6 66 ⫾ 4 60 ⫾ 16 94 ⫾ 34 10 M/14 F§ 0.33 ⫾ 0.06§ 96.7 ⫾ 2.5 36.7 ⫾ 11 8.7 ⫾ 3 0.52 ⫾ 0.2 17 ⫾ 7 7⫾4 11 ⫾ 4 69 ⫾ 5 University of Florida 35 patients† Duke University Medical Center 24 patients University of Manitoba 28 patients 55 ⫾ 19 83 ⫾ 21 20 M/15 F‡ 0.39 ⫾ 0.08† Spo2, % Petco2, mm Hg V˙e, L/ min Vt, L f, breaths/ min Fio2 PEEP, cm H2O PSV, cm H2O Patients, No. Weight, kg Sites Age, yr Height, inch Table 1—Patient Data From All Sites on Enrollment Into the Study* 700 Downloaded From: http://journal.publications.chestnet.org/ on 11/10/2014 Figure 2. Ventilator advisory system (respiratory monitor plus laptop computer [PC]) employs a load-and-tolerance strategy as described in Figure 1 by combining POBn (load) with f and Vt (tolerance for the load) to determine an appropriate level of PSV. depth (ie, the pressure below the baseline airway pressure just before the ventilator triggers “ON”) pressures are associated with increased power of breathing and vice versa; (4) lower inspiratory flow rise times (ie, how rapidly the inspiratory flow waveform rises during a PSV breath) are associated with increased power of breathing and vice versa; and (5) higher respiratory muscle pressures (based on the equation of motion applied to the respiratory system; ie, pressure ⫽ [Vt/Crs] ⫹ [inspiratory flow rate ⫻ Rrs]1,12) are associated with increased power of breathing and vice versa. POBn has been reported to be highly correlated (r ⫽ 0.91; p ⬍ 0.05) with invasively measured power of breathing (using esophageal pressure measurements) and is considered to be a very good predictor of invasively measured power of breathing for adults treated with PSV.8 POBn reflects the total load on the respiratory muscles, which includes elastic loads of the respiratory system, and resistive loads of the airways, endotracheal tube, and ventilator apparatus. A potential limitation of POBn is that it cannot differentiate these component loads. The advisory system attempts to maintain POBn (ie, f or respiratory rate) and Vt in the center sections or lighter gray ranges shown in Figure 1 by recommending directional changes (ie, increase, maintain, or decrease) in the PSV setting. The ranges used by the advisory system for POBn were derived, in part, from normal values of power of breathing,1,8 a work of Original Research breathing outcome study,2 and our previous clinical experience.8 For adults, the normal range of power of breathing is 4 to 8 J/min.1 Based on measuring the power of breathing in patients receiving ventilatory support for ⬎ 10 years, it appears that adults with respiratory failure who are treated with PSV tolerate a maximum power of breathing up to about 10 to 12 J/min. In a previous study8 of adults receiving PSV, most demonstrated a power of breathing in the range of 2 to 8 J/min. Kirton et al2 reported that respiratory muscle workloads maintained in a fairly normal range using PSV were well tolerated. In our experience, power of breathing values of ⬎ 12 to 15 J/min in adults are not well tolerated, requiring higher levels of PSV. Ranges for f and Vt used by the advisory system are in keeping with those ranges generally applied to adults who are spontaneously breathing with PSV.3,13 We agree with most authorities that the generally established ranges for maintaining f and Vt should be between about 10 to 25 breaths/min and 6 to 8 mL/kg, respectively, when applying PSV. It is also reasonable to apply PSV so that inappropriately low f (eg, 4 to 6 breaths/min) or high f (eg, 30 to 40 breaths/min), and low Vt (eg, ⬍ 4 mL/kg) or high Vt (eg, ⬎ 12 mL/kg) do not occur. Wider ranges for POBn, f, and Vt are indicated in the white and darker gray areas, as shown in Figure 1. The advisory system treats these ranges as cautionary in nature. The advisory system assesses the probability of the load (ie, POBn) and tolerance (ie, f and Vt) parameters varying in relation to one another in all ranges and then makes the most reasonable decision for increasing, maintaining, or decreasing PSV. The PSV was set initially by physician intensivists and was adjusted during the course of treatment, using the traditional approach of assessing spontaneous breathing pattern data (ie, f between 15 and 25 breaths/min, Vt between 6 and 8 mL/kg ideal body weight), the absence of sternocleidomastoid muscle contraction, and the appearance of breathing comfortably. Periodically, the physician intensivist was first asked to evaluate the patient using the aforementioned traditional approach for setting PSV. Next, the physician intensivist was informed of the recommendation of the advisory system to increase, maintain, or decrease PSV and was asked whether he/she agreed or disagreed. The actual PSV settings applied to all patients during the study were always those settings prescribed by the physician intensivists. For all sites, the mean (⫾ SD) PEEP and Fio2 settings, as determined by the physician intensivists, were 6.8 ⫾ 4 cm H2O and 0.38 ⫾ 0.05, respectively, and were held constant during the study period (approximately 4 h). There were no significant differences in PEEP, V˙e, Petco2, and Spo2 prior to beginning the study comparing all sites (Table 1) or during the study, and no clinically significant variations in hemodynamic parameters were observed in all patients throughout the study. The physician intensivists at each site ordered the level of PSV to be used for all patients during the study. It was essential to determine whether there was a correlation between this level of PSV and the PSV level identified by the advisory system as being appropriate for treating the patient. When physicians ordered an increase or decrease in PSV, generally, this was an increase in PSV by 5 cm H2O or a decease by the same amount from the current setting. When the advisory system recommended an increase in PSV, this was interpreted to mean “increase PSV by 5 cm H2O from the current level.” For example, if the PSV was 7 cm H2O, then the recommended PSV setting would be identified to mean an increase in PSV to 12 cm H2O. Likewise, when a decrease in PSV was recommended, this was identified to mean a decrease in PSV by 5 cm H2O from the current setting. With this approach, all physician-ordered PSV settings were regressed with the recommended PSV settings identified by the advisory system. www.chestjournal.org Downloaded From: http://journal.publications.chestnet.org/ on 11/10/2014 Data were analyzed using the 2 test, analysis of variance, regression analysis, and statistic.14 The ␣ level was set at 0.05 for statistical significance. Results Approximately 40% of the patients were from the University of Florida, 30% were from Duke University Medical Center, and 30% were from the University of Manitoba. PSV ranged from 2 to 25 cm H2O during the study when comparing all sites. The mean (⫾ SD) level of PSV for all sites was 12 ⫾ 5 cm H2O. For individual sites, there were no significant differences in the levels of PSV used. A total of 210 recommendations from all sites was made by the advisory system to increase, maintain, or decrease PSV. There was a mean total of 90.5% agreement between all of the recommendations made by the advisory system and those made by the attending physician intensivists, based on their evaluations of the patients (Table 2). The mean (⫾ SE) strength of this agreement ( statistic) was 0.84 ⫾ 0.03 (p ⬍ 0.001). (A value for the statistic between 0.81 to 1.0 is considered to be almost perfect agreement.14) There were no clinically significant differences in the recommendations made by the advisory system compared to those of the attending physician intensivists to increase, maintain, or decrease PSV (p ⬎ 0.05) [Table 2]. At individual sites, there were no significant differences in the recommendations made by the advisory system and the physician intensivists (p ⬎ 0.05). For all sites, compared to increasing the level of PSV, there were about three times as many recommendations to decrease or maintain PSV (p ⬍ 0.05) [Table 2]. Values for POBn from all sites ranged from 2 to 22 J/min during the study. Physician intensivists made the recommendation to “maintain PSV,” implying appropriate respiratory muscle loads, 97 times, and the advisory system agreed 90 times (93% agree- Table 2—Recommendations Made by the Advisory System Compared to Recommendations Made by Physician Intensivists (2 Analysis) Advisory System Physician Intensivists Increase PSV Maintain PSV Decrease PSV Total Increase PSV Maintain PSV Decrease PSV Total 29 3 0 32 1 84 5 90* 1 10 77 88* 31 97† 82† 210 *p ⬍ 0.05 (compared to increasing PSV; 2 ⫽ 0.489; degrees of freedom ⫽ 2; for significance at the 0.05 level, 2 should be ⱖ 5.99). †p ⬍ 0.05 (for all sites compared to increasing PSV). CHEST / 133 / 3 / MARCH, 2008 701 Figure 3. Relationship between recommendations made by the ventilatory advisory system on PSV settings, compare to PSV settings selected by physician intensivists for all sites. The clusters of symbols at 5, 10, and 15 cm H2O, for example, represent considerable overlap of many PSV settings at these levels. There was an excellent and significant correlation between the advisory system and physician intensivists (r ⫽ 0.95) and the advisory system as a very good predictor of an appropriate level of PSV as determined by the physician intensivists (r2 ⫽ 0.90). ment). Combining patients from all sites under this condition, the mean POBn was 8.1 ⫾ 2 J/min (ie, there was no significant differences in POBn between sites). Regarding the relationship between the PSV level ordered by physicians and the PSV level identified by the advisory system, there was an excellent, positive correlation with r values ranging from 0.94 to 0.96 when comparing all sites. The average r2 value for all sites was 0.90. In other words, the advisory system predicted or explained 90% of the variance in the physician’s recommendations for setting PSV (Fig 3). Discussion Valid, clinically appropriate recommendations for increasing, maintaining, or decreasing PSV to unload the respiratory muscles were provided by the advisory system. Considering all sites, 90.5% of the time the advisory system recommended increasing, maintaining, or decreasing PSV in the same manner as determined by attending critical care physician intensivists who were evaluating the patients at the bedside (Table 2). There was minimal variability between different institutions, regardless of whether patients were treated in a surgical ICU (University of Florida) or a medical ICU (Duke University Medical Center and University of Manitoba). A possible explanation for the 9.5% disagreement between the advisory system and the physician intensivists is that, at times, physicians may have decided to either “rest” or “exercise” a patient’s 702 Downloaded From: http://journal.publications.chestnet.org/ on 11/10/2014 respiratory muscles, contrary to advice from the advisory system, based on their knowledge of the patient’s actual clinical condition, weaning process, and overall clinical plan. To rest a patient, a higher level of PSV could be applied (eg, 25 cm H2O) to totally unload the respiratory muscles (POBn, 0 J/min). This can be done at times when physician intensivists determine that it is appropriate to relieve a patient’s respiratory muscles of the breathing workload; for example, immediately following intubation for acute respiratory failure. Conversely, to exercise the respiratory muscles of patients considered to be candidates for weaning, a lower level of PSV may be applied, allowing a higher workload (eg, POBn, ⬎ 10 J/min). This may be done on occasions when physician intensivists determine it appropriate to “push” a patient for a short time, to assess a patient’s reserve to breathe. In one patient (with muscular dystrophy), the advisory system recommended a decrease in PSV while the physician intensivist increased PSV. Previously, PSV had been decreased from 14 to 9 cm H2O, causing Vt to decrease from 0.60 to 0.42 L or 6 mL/kg of ideal body weight (70 kg). Related data at 9 cm H2O were as follows: POBn, 3 J/min; f, 18 breaths/min; Petco2, 40 mm Hg; and Spo2, 97%. Also, the patient’s respiratory efforts appeared to be excessive. The advisory system recommended a decrease in PSV because the respiratory muscle load was low and other parameters were in appropriate ranges. The physician-ordered increase in PSV may, in part, have been based on the 30% acute decrease in Vt and respiratory efforts. As a result of the weakness associated with the patient’s disease, the patient may only have been able to generate a small Vt, despite POBn being in a low range. The physician recommendation to increase PSV to increase Vt to a more appropriate range was, in part, dictated by the patient’s overall clinical state and knowledge of all the patient’s data, which were unknown by the advisory system. There were three times as many recommendations by the advisory system to decrease or maintain PSV than to increase it. These recommendations were in agreement with those of the physician intensivists. The treatment philosophy or method of reasoning employed by physician intensivists the great majority of the time was to wean PSV down or at least maintain the level, rather than to increase PSV and unload the respiratory muscles further. The loadand-tolerance strategy used in the advisory system appears to reflect this approach. The advisory system functions as an open-loop feedback system. Such systems have been used in clinical practice before. Belel et al15 employed an open-loop feedback advisor for ventilating neonates. Original Research Parameters from the bedside (ie, Spo2, respiratory waveforms, heart rate, transcutaneous Po2 and Pco2, arterial BP, and temperature) and ventilator (ie, inspiratory time, expiratory time, peak inflation pressure, PEEP, mean airway pressure, and Fio2) were feedback variables used for formulating the recommendations for setting the ventilator to treat ventilation and oxygenation abnormalities. Clinicians agreed with the ventilation recommendations 91% of the time, and with the oxygenation recommendations 94% of the time. Kwok et al16 described an adaptive neuro-fuzzy inference system, open-loop Fio2 ventilator advisor that estimates intrapulmonary right-to-left shunt by employing a respiratory index, which is derived in part from calculating the alveolar air equation. In turn, clinical advice is given on the Fio2 needed to attain a target Pao2 for patients with compromised pulmonary function. Rutledge et al17 described a qualitative and quantitative ventilator management advisor (VentPlan) to provide recommendations for setting a ventilator that are based on a mathematical model of cardiopulmonary physiology. By applying a patient-specific physiologic model, the advice for ventilator settings was in agreement with the physician preferences for setting the ventilator. When physician intensivists determined it appropriate to maintain a specific level of PSV, the implication was that respiratory muscle loads were optimal at that time. For this clinical condition, the advisory system agreed with the physician intensivists more than 9 times in 10. The POBn for all patients at all sites at that time approximated the upper limit of normal for the power of breathing in adults.1 The potential clinical utility of this advisory system is that it is automatic and continuously operational. This would be important in clinical situations where expert physician intensivists may not always be available for patient assessment and to make timely decisions for setting PSV. Examples of this might include large, multipatient, ventilatory care facilities/nursing homes, battlefield military hospitals, mass-casualty treatment centers, and large ICUs. In such venues with limited manpower, the advisory system may be able to assist in setting an appropriate level of PSV. Although this study was an initial step in validating the advisory system, a possible limitation of this study may be that to fully validate the advisory system a similar study over a wider range of patient conditions may be needed. Also, such a study could be performed over the total duration of ventilatory support up to the point of extubation. In summary, this clinical study compared recommendations from a computerized, ventilator advisory www.chestjournal.org Downloaded From: http://journal.publications.chestnet.org/ on 11/10/2014 system for increasing, maintaining, or decreasing PSV, and demonstrated a significantly high level of agreement with physician intensivists for setting PSV in patients with respiratory failure. Clinical outcome studies evaluating the novel load-and-tolerance strategy of the advisory system as the means of applying PSV are needed. ACKNOWLEDGMENT: The authors thank and acknowledge the registered respiratory therapists from Cardiopulmonary Services at Shands Hospital at the University of Florida for their cooperation and technical support. References 1 Millic-Emilli J: Work of breathing. In: Crystal RG, West JB, eds. The lung. New York, NY: Raven Press, 1991; 1065–1075 2 Kirton OC, DeHaven CB, Hudson-Civetta J, et al. Reengineering ventilatory support to decrease days and improve resource utilization. Ann Surg 1996; 224:396 – 404 3 MacIntyre NR. Respiratory function during pressure support ventilation. Chest 1986; 89:677– 681 4 Otis AB, Fenn WO, Rahn HL. Mechanics of breathing in man. J Appl Physiol 1950; 2:592– 607 5 Barnes PJ. Neural control of airway smooth muscle. In: Crystal RG, West JB, eds. The lung. New York, NY: Raven Press, 1991; 903–916 6 Sant’Ambrogio G, Sant’Ambrogio FB. Reflexes from the airway, in lung, chest wall and limbs. In: Crystal RG, West JB, eds. The lung. New York, NY: Raven Press, 1991; 1383–1395 7 Sant’Ambrogio G. Information arising from the tracheobronchial tree of mammals. Physiol Rev 1982; 62:531–569 8 Banner MJ, Euliano NR, Brennan V, et al. Power of breathing determined non-invasively with use of an artificial neural network in patients with respiratory failure. Crit Care Med 2006; 34:1052–1059 9 MacIntyre NR. Invasive mechanical ventilation in adults: conference summary. Respir Care 2002; 47:508 –518 10 MacIntyre NR, Ho L. Effects of initial flow rate and breath termination criteria on pressure support ventilation. Chest 1991; 99:134 –137 11 Volta CA, Marangoni E, Alvisi V, et al. Respiratory mechanics by least squares fitting in mechanically ventilated patients: application on flow-limited COPD patients. Intensive Care Med 2002; 28:48 –52 12 Jolliet P, Tassaux D. Clinical review: patient-ventilator interaction in chronic obstructive pulmonary disease. Crit Care 2006; 10:236 –242 13 Sottiaux TM. Patient ventilator interactions during volume support ventilation: asynchrony and tidal volume instability; a report of three cases. Respir Care 2001; 46:255–262 14 Ludbrook J. Statistical techniques for comparing measures and methods of measurement: a critical review. Clin Exp Pharmacol Physiol 2002; 29:527–536 15 Belel SY, Taktak AF, Nevill A, et al. An intelligent ventilation and oxygenation management system in neonatal intensive care using fuzzy trend template fitting. Physiol Meas 2005; 26:555–570 16 Kwok HF, Linkins DA, Mahfouf M, et al. Adaptive ventilator Fio2 advisor: use of non-invasive estimates of shunt. Artif Intell Med 2004; 32:157–159 17 Rutledge GW, Thomsen GE, Farr BR, et al. The design and implementation of a ventilator: management advisor. Artif Intell Med 1993; 5:67– 68 CHEST / 133 / 3 / MARCH, 2008 703


© Copyright 2026