
Three and nine months ended September 30, 2014 and 2013
Three and nine months ended September 30, 2014 and 2013
(Expressed in Thousands of United States Dollars)
ENDEAVOUR MINING CORPORATION
Management’s Discussion and Analysis of
Results of Operations and Financial Condition
For the Three and Nine Months ended September 30, 2014
This Management’s Discussion and Analysis (“MD&A”) should be read in conjunction with Endeavour
Mining Corporation’s (“Endeavour” or the “Corporation”) unaudited condensed interim consolidated
financial statements for the three and nine months ended September 30, 2014 and related notes thereto
which have been prepared in accordance with International Financial Reporting Standards (“IFRS” or
“GAAP”) as issued by the International Accounting Standards Board. This Management’s Discussion and
Analysis contains “forward-looking statements” that are subject to risk factors set out in a cautionary note
contained herein. The reader is cautioned not to place undue reliance on forward-looking statements. All
figures are in United States Dollars, unless otherwise indicated. Tabular amounts are in thousands of
United States Dollars, except per share amounts and where otherwise indicated. This Management’s
Discussion and Analysis is prepared as of November 3, 2014. Additional information relating to the
Corporation, including the Corporation’s Annual Information Form, is available on SEDAR at
www.sedar.com.
OVERVIEW
We are a mid-tier Canadian listed gold mining company with four operating mines in West Africa,
currently producing at a combined rate of over 450,000 ounces per year. Our assets are comprised of
the Agbaou Gold Mine in Côte d’Ivoire (the “Agbaou Mine”), the Nzema Gold Mine in Ghana (the “Nzema
Mine”), the Tabakoto Gold Mine in Mali (the “Tabakoto Mine”) and the Youga Gold Mine in Burkina Faso
(the “Youga Mine”). For the nine months ended September 30, 2014, we achieved total gold production
of 346,041 ounces at an all-in sustaining cost (“AISC”)1 of $1,023 per ounce sold and an adjusted
EBITDA of $112.9 million. As of December 31, 2013, we had proven and probable Mineral Resources
and Mineral Reserves totaling approximately 4.1 million ounces.
The Agbaou Mine is our newest mine (commercial production was achieved on January 27, 2014) and
also the lowest cost, highest margin mine in our operating group. The Nzema Mine and Tabakoto Mine
have been our two largest operating mines until 2014 with 103,464 ounces and 125,231 ounces of
production, respectively, for the year ended December 31, 2013 and have each benefited from recent
capital investments in the construction and optimization of these mines. In particular, we are coming to
the end of a significant optimization and investment phase at the Tabakoto Mine with $58.2 million
invested in capital since the acquisition in October, 2012 through December 31, 2013, and $62.3 million
invested in the nine months ended September 30, 2014. The Youga Mine is our most mature mine and
has produced over 85,000 ounces for each of the past three years.
We have advanced the Houndé gold project in Burkina Faso (the “Houndé Project”), which is now in the
mine permitting and optimization stage. The 2013 Houndé Project Feasibility Study demonstrated
average annual gold production of 180,000 ounces per year for an initial eight year mine life. The
Houndé Project is located in a well mineralized Birimian greenstone belt similar to our other mines and
provides significant further exploration potential.
With the arrival of the fourth quarter of 2014, we expect to shift from two years of executing a capital
intensive strategy optimizing our existing assets and building new and higher margin operations, to
managing our existing assets to maximize cash flow and de-leverage our balance sheet. Minimal nonsustaining capital related to our existing operations is expected going forward as we focus on our loan
repayment objectives. Pursuing organic and strategic growth opportunities that benefit from our
management and operational expertise will still continue, but only if it can be shown to be accretive.
Endeavour’s shares are listed on the Toronto Stock Exchange (symbol EDV), the Australian Securities
Exchange (symbol EVR), and quoted in the United States on the OTCQX International (symbol EDVMF).
1
AISC, all-in sustaining costs at the mine level, cash costs, adjusted EBITDA, all-in sustaining margin and adjusted earnings are
non-GAAP financial performance measures with no standard meaning under IFRS, further discussed in the section Non-GAAP
Measures. Throughout this MD&A, the Corporation excludes royalties in its calculation of cash costs.
1|Page
ENDEAVOUR MINING CORPORATION
Management’s Discussion and Analysis of
Results of Operations and Financial Condition
For the Three and Nine Months ended September 30, 2014
The following figure shows the locations of our principal properties and operations in West Africa:
Figure 1: Endeavour’s West African mines and the Houndé project.
2|Page
ENDEAVOUR MINING CORPORATION
Management’s Discussion and Analysis of
Results of Operations and Financial Condition
For the Three and Nine Months ended September 30, 2014
OPERATIONAL HIGHLIGHTS FOR THE THIRD QUARTER 2014
•
Gold production of 117,612 ounces and sales of 114,082 ounces, compared to production of
88,445 ounces and 90,997 ounces sold for the same period in 2013.
•
The recently constructed Agbaou mine continued to perform well and has already exceeded its
full year production guidance producing 99,392 ounces year to date at a mine level all-in
sustaining cost of $590 per ounce.
•
A focused drill program at the Agbaou mine shows encouraging early results, giving confidence of
being able to replace and expand the reserve base and extend the mine life at Agbaou. The
year-end 2014 reserve and resource updates will include the results of this program and the ongoing drilling at the Houndé project.
•
Adjusted EBITDA of $37.6 million was achieved in the quarter compared to $23.2 million
achieved for the same period in the prior year.
•
Endeavour’s $1,000 per ounce AISC target has been achieved, with AISC of $991 per ounce in
the third quarter, which has decreased significantly compared to $1,118 in the third quarter of
2013 and improved compared to $1,021 in the second quarter of 2014.
•
All-in sustaining margin of $32.1 million was achieved in the quarter compared to $19.3 million in
the comparable prior year period and compares favorably with the full year mid-guidance margin
of $95 million.
•
At Tabakoto, the underground mining team continued the ramp up and development of the new
Segala underground mine with stoping production ore achieving the 1,494 tonnes per day level in
September. The ramp up of production from the Segala deposit will continue in the fourth quarter
and positions Tabakoto to have a solid finish to 2014 with improved operating margins. As well,
good progress was made on the road construction towards the Kofi C deposit, and as of the date
of this MD&A, the road alignment survey is complete, the pioneer bush clearing is over 31km
complete, and over 12km of road has been advanced. Site preparation for pre-stripping to start in
December is underway.
The following table summarizes the consolidated operating results for the three and nine months ended
September 30, 2014 and 2013:
Operating Data:
Gold ounces produced1:
Gold ounces sold1:
Three months ended September 30, Nine months ended September 30,
2014
2013
2014
2013
117,612
88,445
346,041
237,520
114,082
90,997
344,533
235,927
1,273
1,330
1,288
1,437
814
869
848
885
7,768
9,199
19,999
25,068
991
1,118
1,023
1,146
Revenues
145,223
121,054
435,832
339,082
Royalties
6,817
6,600
21,650
18,315
15,256
7,235
61,630
30,902
Realized gold price ($/ounce)2
Cash cost per gold ounce sold ($/ounce)3
Sustaining capital (US dollars in thousands)3
All-in sustaining costs per gold ounce sold ($/ounce)3
Financial Data (US dollars in thousands)
Earnings from mine operations
1
Gold ounces produced and sold includes pre-commercial production ounces from the Agbaou mine which achieved commercial
production on January 27, 2014.
2
Throughout this MD&A, the realized price is the realized average gold price received for all ounces sold.
3
Cash cost, AISC, and sustaining capital are non-GAAP financial performance measures with no standard meaning under IFRS.
Refer to the section Non-GAAP Measures.
3|Page
ENDEAVOUR MINING CORPORATION
Management’s Discussion and Analysis of
Results of Operations and Financial Condition
For the Three and Nine Months ended September 30, 2014
FINANCIAL HIGHLIGHTS FOR THE THREE MONTHS ENDED SEPTEMBER 30, 2014
•
A cash balance of $55.4 million at September 30, 2014 compared to $57.1 million at June 30,
2014 and the total working capital of $113.6 million remained in line with $106.4 million at the end
of the prior quarter. The Corporation’s remaining undrawn $50 million credit facility remains fully
available for general corporate purposes.
•
Revenue increased by $24.1 million to $145.2 million from $121.1 million for the same period in
2013, largely driven by the addition of the Agbaou Mine, Endeavour’s fourth operating mine.
•
Earnings attributable to shareholders of Endeavour were $1.9 million, or $0.00 per share,
compared to a net loss of $15.3 million, or $(0.04) per share, for the same period in 2013, while
adjusted net earnings attributable to shareholders of the Corporation were $1.5 million or $0.00
per share compared to an adjusted net loss of $2.0 million or $(0.00) per share for the same
period in 2013.
•
AISC continued to improve, reaching the Corporation’s stated goal of achieving group level AISC
below $1,000 per gold ounce sold.
All-in sustaining cost decreased 12.8%
over the 9 month period
$1,150
$1,137
$1,100
$1,059
$1,050
$1,021
$991
$1,000
$950
$900
Full year 2013
Q1, 2014
Target of below $1,000
Q2, 2014
Q3, 2014
All-in sustaining cost
4|Page
ENDEAVOUR MINING CORPORATION
Management’s Discussion and Analysis of
Results of Operations and Financial Condition
For the Three and Nine Months ended September 30, 2014
OUTLOOK
2014 Corporate Objectives
Endeavour has focused on optimizing current operations, as well as lowering overall costs and improving
cash flows at its producing gold mines. During 2014, the optimization focused on the conversion to owner
mining at Tabakoto, the ramp-up of commercial ore production at the Segala underground operation to
enhance the Tabakoto mill feed, and readying the Kofi C deposit for mining. The investments and focus
on optimizing the operations are well on track and Endeavour plans to become net cash flow positive
during the fourth quarter of 2014. Endeavour is also advancing its Houndé project, which is currently in
permitting. The potential development of Houndé would benefit from Endeavour’s operating experience
in Burkina Faso and recent construction experience in West Africa at Agbaou and Nzema.
The Corporation is on track to achieve its 2014 objectives which include the following:
•
•
•
•
•
•
•
•
Achievement of 2014 gold production and cost guidance;
Successful first year of operations at the Agbaou Mine;
Completion of the access and ramp development for the Segala underground mine at the
Tabakoto complex;
Transition to full owner-mining activities at Tabakoto underground mine, completed in the
second quarter;
Continuing improvement of the purchasing, warehousing and logistics functions at each mine to
realize working capital and purchasing cycle improvements;
Receipt of the mining permit for Kofi Nord, achieved in June 2014, which includes Kofi C
reserves expected to contribute to the 2015 Tabakoto mill processing schedule;
Receipt of the mining permit for Houndé, which is expected in 2014, although recent political
unrest may extend this timeframe; and
Extension of mine lives through exploration and conversion of resources to reserves.
Production, Cost and Investment Guidance for 2014
Guidance as compared to that published in the December 31, 2013 MD&A is being revised upwards due
to the strong performance of the Agbaou Mine, steady performance at Nzema and Youga year to date,
and an improving trend at Tabakoto beginning late in the third quarter and expected to continue into the
fourth quarter and beyond. Endeavour’s 2014 gold production was forecast between 400,000 to 440,000
ounces at an AISC of between $985 and $1,070 per ounce. The Corporation is now expected to exceed
this production range and remain around the mid-point of the AISC guidance range for the full year 2014,
with Agbaou, Youga, and Nzema expected to exceed or meet production guidance. Details of each
mine’s costs are discussed in the section Operations Review, on a mine by mine basis.
Endeavour’s all-in sustaining margin for the nine months ended September 30, 2014 was $89.7 million,
which compares favourably to the original full year mid-point guidance of $95.0 million at a gold price of
$1,250 per ounce. Endeavour now expects to exceed the $95.0 million margin due to production
exceeding the upper end of guidance.
Sustaining and non-sustaining capital expenditure forecasts for the year as compared to those published
in the year-end 2013 MD&A are expected to finish the year below the guidance range despite non-guided
investments being made following the achievement of key milestones in the first half of the year, including
the successful start-up of the Agbaou Mine and the transition to owner mining at the two Tabakoto
underground mines. These further investments include proceeding with the development of the Kofi
deposit (approximately $13.0 million) and drill programs at Houndé and Agbaou (total approximately $6.0
million). Due to the early production of ounces during the ramp up of Segala, some expenditures originally
expected to be classified as non-sustaining capital have been included in operating costs, reducing
5|Page
ENDEAVOUR MINING CORPORATION
Management’s Discussion and Analysis of
Results of Operations and Financial Condition
For the Three and Nine Months ended September 30, 2014
capital and increasing cash costs and AISC. Further decreases in capital are a result of lower than
planned capital developments in the Tabakoto underground mines and lower waste capitalization at
Nzema, offset by additional capitalization of waste at Agbaou.
Our extensive investment phase is coming to an end in the fourth quarter of 2014 and expectations are
for minimal on-going sustaining capital capex to occur after 2014.
Original Production Guidance at mine level
Gold Production (ozs)1
Mine
Agbaou, Côte d’Ivoire2
Nzema,
Ghana3
2011
Actual
2012
Actual
2013
Actual
2014
Guidance Range
-
-
6,132
85,000 - 95,000
90,026
109,447
103,464
110,000 - 120,000
Tabakoto, Mali
91,200
110,301
125,231
140,000 - 155,000
Youga, Burkina Faso
87,264
91,030
89,448
65,000 - 70,000
Total
268,490
310,778
324,275
400,000 - 440,000
1
On a 100% of production basis.
2
Agbaou commercial production was declared on January 27, 2014.
3
Includes purchased ore.
6|Page
ENDEAVOUR MINING CORPORATION
Management’s Discussion and Analysis of
Results of Operations and Financial Condition
For the Three and Nine Months ended September 30, 2014
OPERATIONS REVIEW
Agbaou Gold Mine, Côte d’Ivoire
The following table summarizes the operating results of the newly commissioned Agbaou Gold Mine for
the three and nine months ended September 30, 2014:
Operating Data:
Tonnes of ore mined (000's)
Average gold grade mined (grams/tonne)
Tonnes of ore milled (000's)
Average gold grade milled (grams/tonne)
Gold ounces produced:
Gold ounces sold:
Three months ended September 30,
2014
669
2.28
603
2.23
43,428
Nine months ended September 30,
2014
1,945
1.99
1,612
1.94
99,392
41,919
99,438
Realized gold price ($/ounce)
Cash cost per gold ounce sold ($/ounce)1
1,268
1,287
467
561
Sustaining capital (US dollars in thousands)1
3,330
3,694
53,174
120,080
Financial Data (US dollars in thousands)
Revenues
Royalties
Earnings from mine operations
1,855
4,338
23,335
46,674
1
Cash cost and sustaining capital are non-GAAP financial performance measures with no standard meaning under IFRS. Refer to
the section Non-GAAP Measures.
The highlights for the quarter ended September 30, 2014 at Agbaou are as follows:
•
•
•
•
•
•
•
Gold production of 43,428 ounces was achieved during the third quarter of 2014;
The process plant treated 603,000 tonnes of ore at an average grade of 2.23 g/t;
Gold ounces sold were 41,919 at a realized gold price of $1,268;
Cash costs per ounce sold for the third quarter were $467 and remained attractive and continued
to trend lower from the prior quarter due to robust grades milled, good throughput, and strong
recoveries in the mill leading to record gold production. As well, the effect of capitalizing $3.1
million of waste in line with IFRIC 20 accounting requirements and the Corporation’s accounting
policy further lowered cash costs.
All-in sustaining costs at the mine level of $590 per gold ounce sold (includes capitalized waste);
Agbaou generated $33.6 million of operating cash flow from mine operations in the current
quarter; and
Agbaou generated $23.3 million of earnings from mine operations indicative of another
outstanding quarterly performance.
Agbaou continued to perform well since commercial production was declared in January 2014 after a
short ramp up that started in November 2013. The average annual gold production of approximately
100,000 ounces over an eight year mine life will position Agbaou as a strong cash flow generator for
Endeavour.
The soft nature of the oxide ore continued in the current quarter and allowed above plan ore processing
and recoveries. Cash costs are well below the range of guidance of $730 to $780 per ounce for the year
as a result of improved grade, high mill throughput, strong recoveries, and some waste being capitalized.
The forecast is for cash costs to come in below the lower end of guidance for the full year.
7|Page
ENDEAVOUR MINING CORPORATION
Management’s Discussion and Analysis of
Results of Operations and Financial Condition
For the Three and Nine Months ended September 30, 2014
Agbaou is situated approximately 200 kilometres northwest of the port city of Abidjan. The property
covers 334 square kilometres, giving Endeavour access to the 40 kilometre strike length of the Agbaou
gold belt. The concession is reached by paved highway and gravel roads. Electrical power is supplied
from the national grid with a diesel power plant installed at site for emergency standby purposes.
Currently Agbaou has over 500 people working on site including contractors.
A reverse circulation (“RC”) drilling program commenced at Agbaou in August 2014 and was completed in
October. During the third quarter 172 holes were drilled for a total of 15,386m with the intention of
confirming extensions to the principal mineralized zones in the North, South and West pit areas and to
test targets identified during previous exploration drilling. A total of $1.2 million has been spent at Agbaou
on exploration during the current quarter.
The results received to date have demonstrated a continuity of grades and widths and are currently being
incorporated into the drilling database. This additional data will be used to update resource estimates to
improve classification of portions of the mineral resource from inferred resources to indicated and to
incorporate these in a revised reserve estimate. Some of the ore zones remain open on strike and at
depth, and are being planned for testing in the next drill program. The Corporation released highlights of
the results in a press release on October 9, 2014.
In the third quarter, $3.1 million of waste was capitalized as per the Corporation’s accounting policies and
application of IFRIC 20. These expenditures are included in sustaining capital and a part of the AISC
metric.
Nzema Gold Mine, Ghana
The following table summarizes the operating results of the Nzema Gold Mine for the three and nine
months ended September 30, 2014 and 2013:
Operating Data:
Tonnes of ore mined (000's)
Average gold grade mined (grams/tonne)
Tonnes of ore milled (000's)
Average gold grade milled (grams/tonne)
Gold ounces produced1:
Gold ounces sold:
Three months ended September 30, Nine months ended September 30,
2014
2013
2014
2013
343
462
1,024
1,723
1.53
1.31
1.90
1.30
401
496
1,187
1,533
1.88
2.00
2.58
1.75
24,886
27,894
89,319
74,403
24,231
27,640
88,642
72,382
Realized gold price ($/ounce)
Cash cost per gold ounce sold ($/ounce)2
1,281
1,332
1,290
1,440
917
879
844
984
Sustaining capital (US dollars in thousands)2
1,368
5,100
6,846
8,085
Revenues
31,050
36,805
114,331
104,245
Royalties
1,706
1,842
6,351
5,220
8
3,837
18,465
Financial Data (US dollars in thousands)
Earnings(loss) from mine operations
(636)
1
Includes purchased ore of 8,840 and 28,097 ounces for the three and nine months ended September 30, 2014 and 8,343 and
17,020 ounces in the comparable periods in 2013.
2
Cash cost and sustaining capital are non-GAAP financial performance measures with no standard meaning under IFRS. Refer to
the section Non-GAAP Measures.
The highlights for the third quarter ended September 30, 2014 for Nzema are as follows:
•
Gold production of 24,886 ounces in the third quarter of 2014 compared to gold production of
27,894 ounces in the same period in 2013, due to less tonnes mined and milled in the current
quarter;
8|Page
ENDEAVOUR MINING CORPORATION
Management’s Discussion and Analysis of
Results of Operations and Financial Condition
For the Three and Nine Months ended September 30, 2014
•
•
•
•
•
•
The process plant treated 401,000 tonnes of ore at 1.88 g/t in the third quarter of 2014 compared
to 496,000 tonnes in the same period in 2013 at 2.00 g/t;
Gold ounces sold were 24,231 at a realized average gold price of $1,281 per ounce compared to
27,640 at a realized gold price of $1,332 per ounce for the same period in 2013;
Cash costs per ounce sold for the third quarter of $917 compared to $879 for the same period in
2013;
All-in sustaining costs at the mine level of $1,043 per gold ounce sold;
Nzema used $1.8 million of operating cash flow from mine operations compared to $16.0 million
generated for the same period in 2013; and
Nzema generated $0.0 million earnings from mine operations compared to $3.8 million for the
same period in 2013 primarily due to less gold sold at a higher cash cost per ounce sold.
The Nzema Mine experienced a challenging quarter that saw a decrease in gold production as compared
to the prior quarter and in the comparable period in 2013. The issues during the quarter included
throughput challenges due to the hardness of some of the ore feed from the Adamus pit and grade
variances within the planned mine blocks. Analysis of grade variances indicate higher grades in the mine
blocks planned for the fourth quarter. Furthermore, periodic and heavy rainfall and a higher than
anticipated water table impacted mining from the Aliva pit. Mining during the three month period ended
September 30, 2014 was from the Adamus and Aliva pits with a total of 343,000 tonnes of material mined
in the three months ended September 30, 2014.
Installation of a pebble crusher is underway (85% complete at the end of the third quarter) and is a part of
the optimization of the mine which will assist in processing harder ores in the future. Purchased ore
contributed 8,840 ounces to production in the current quarter and management continues to work to
ensure the continuity of this important source of higher grade feed and contribution to margin.
Tabakoto Gold Mine, Mali
The following table summarizes the operating results of the Tabakoto Gold Mine for the three and nine
months ended September 30, 2014 and 2013:
Operating Data:
Tonnes of ore mined - Open pit (000's)
Average gold grade mined - Open pit (grams/tonne)
Tonnes of ore mined - Underground (000's)
Average gold grade mined - Underground (grams/tonne)
Tonnes of ore milled (000's)
Average gold grade milled (grams/tonne)
Gold ounces produced:
Gold ounces sold:
Three months ended September 30, Nine months ended September 30,
2014
2013
2014
2013
427
409
113
164
3.15
2.70
2.94
3.11
354
142
527
230
4.71
3.58
2.76
4.74
872
391
406
1,114
3.00
3.75
2.55
3.35
96,086
30,866
40,522
100,746
29,434
41,027
99,757
96,061
Realized gold price ($/ounce)
Cash cost per gold ounce sold ($/ounce)1
1,278
1,326
1,288
1,428
1,277
863
1,184
921
Sustaining capital (US dollars in thousands)1
2,871
3,651
8,434
14,532
Revenues
37,614
54,399
128,452
137,148
Royalties
2,254
3,265
7,686
8,219
(13,722)
(2,099)
(20,910)
Financial Data (US dollars in thousands)
Loss from mine operations
(191)
1
Cash cost and sustaining capital are non-GAAP financial performance measures with no standard meaning under IFRS. Refer to
the section Non-GAAP Measures.
9|Page
ENDEAVOUR MINING CORPORATION
Management’s Discussion and Analysis of
Results of Operations and Financial Condition
For the Three and Nine Months ended September 30, 2014
The highlights for the third quarter ended September 30, 2014 for Tabakoto are as follows:
•
•
•
•
•
•
•
Gold production of 30,866 ounces was achieved compared to 40,522 ounces for the same period
in 2013, primarily affected by gold grades milled;
The process plant treated 391,000 tonnes of ore at an average grade of 2.55 g/t, compared to
406,000 tonnes at an average grade of 3.35 g/t;
Gold ounces sold were 29,434 at a realized average gold price of $1,278 compared to 41,027
ounces at a realized gold price of $1,326 in the same period in 2013;
Cash costs per ounce sold for the third quarter of 2014 were $1,277 compared to $863 for the
same period in the prior year;
All-in sustaining costs at the mine level of $1,451 per gold ounce sold. Tabakoto’s cash costs
and all-in sustaining costs have been above the annual guidance range for the first nine months
of 2014 primarily due to the lower grades mined from Segala during the initial ramp up and the
use of low grade stockpile feed during this period of limited operational flexibility. As well, the
overlap of certain owner mining and contractor costs was incurred, some Segala capital costs
anticipated to be classified as non-sustaining in nature were included in operating costs due to
early ore production, and final mining in the Djambaye open pit has been of relatively high cost
ounces. Mill feed grade has started to improve in the latter part of the third quarter and into the
fourth quarter.
Tabakoto used $7.4 million in operating cash outflows from mine operations, compared to a $4.2
million outflow for the same period in 2013; and
Tabakoto incurred a $13.7 million loss from mine operations compared to a $2.1 million loss in
the comparable period of 2013 due to a lower gold price and lower production margins due to
decreased grades.
Tabakoto Mine Optimization
The diagram below illustrates the shift in mill feed to higher grade ore in 2014 and to early 2015 that has
been an important part of the Tabakoto Mine optimization and investment.
The Tabakoto complex currently includes the Tabakoto underground mine, the Djambaye open pit, and
the Segala underground mine, located approximately five kilometres from the Tabakoto mill. These three
deposits contributed to production in the third quarter. The Tabakoto complex also includes the permitted
Kofi C deposit which is now being developed for production, as well as other prospective areas of
interest.
Tabakoto cash costs guidance is from $790 to $840 per ounce for the year, however, cash costs are
expected to improve only in the fourth quarter of 2014 with the ramp up of Segala ore production rates
and the tapering of low grade stockpiles and Djambaye open pit feed.
Tabakoto Underground Mine
After conversion to owner mining in the second quarter of 2014, the operations team has continued to
improve as all the equipment needed for mining has arrived at site. A total of 163,042 tonnes of material
10 | P a g e
ENDEAVOUR MINING CORPORATION
Management’s Discussion and Analysis of
Results of Operations and Financial Condition
For the Three and Nine Months ended September 30, 2014
was mined from the Tabakoto underground mine, of which 111,541 tonnes was ore. Underground mining
of this deposit is by long-hole open stoping with access to several mining areas from two portals at the
bottom of the Tabakoto pit.
Segala Underground Mine
The underground operations team continued to ramp up ore production from the new Segala
underground mine and improve both production tonnages and development rates. Segala production has
ramped up to 1,400 ore tonnes per day and is producing reliably from two stopes with ongoing
development ensuring sustainable stoping production in coming months. Since the conversion to owner
mining in April, the development has increased from 386 metres per month to 508 metres achieved in
September. An increase in ore tonnes from this underground deposit with full production at improved
grades is expected for the fourth quarter. The continuing Segala ramp-up has resulted in higher costs in
the third quarter but will see the impact of improved gold production, productivity, and margins in the
fourth quarter with final mining equipment scheduled for the fourth quarter.
In the current quarter, a total of 200,213 tonnes of material was mined from Segala, of which 118,411
tonnes was ore. The Segala deposit forms just over one third of the total reserves at the Tabakoto
complex. The new underground cement rock fill plant for this deposit is to be commissioned in the first
quarter of 2015.
Djambaye Open Pit
In the current quarter a total of 1,826,025 tonnes of material was mined from the Djambaye open pit,
including 164,098 tonnes of ore. Mining of this deposit is scheduled to end in late 2014.
Kofi Deposits
The Kofi Nord permit was received in the previous quarter and work to access the Kofi C deposit has
commenced. The total known resource of the eight deposits identified to date on the Kofi property is 0.6
million ounces of indicated plus 0.6 million ounces of inferred resources. The Kofi C deposit is the first
deposit that has been added to reserves with 1.55 million tonnes at 4.3 g/t containing 213,000 ounces.
Work continues on the conversion of resources to reserves for the other Kofi deposits and infill drilling on
the Kofi B ore body has been completed with the updated resource and reserve statement expected by
early 2015. Geotechnical and metallurgical drill holes have been part of the drill program. In early 2015,
ore from the Kofi C open pit mine is scheduled to contribute to production.
Tabakoto Mill and Processing Facilities
A pebble crusher was commissioned in the Tabakoto mill at the end of the quarter and will help with
throughput when processing harder ore. A new tailings storage dam raise was also completed and
deposition commenced during the quarter.
Tabakoto Exploration
For 2014, resource conversion drilling of 24,000 meters and exploration drilling of 28,000 meters was
planned for the year. At the end of the third quarter of 2014 approximately 77% of the planned resource
and exploration drilling has been completed. Initial indications confirm that the areas drilled have
demonstrated continuity and potential for increased resources. Additionally much of the inferred resource
drilled to date is being successfully converted to indicated resources and shows potential to add to
reserves after modeling. Shallow reverse circulation (“RC”) exploration drilling at the nearby Moralia target
has been conducted during this quarter. High grade intersections have been encountered and three
mineralized trends have been investigated. Whilst many assay results are outstanding, indications
confirm that mineralization is continuous along several defined North-South trends with increased grade
tenor at the junction with cross cutting structures. The deposit is being evaluated to justify a
comprehensive RC drilling campaign in the future.
11 | P a g e
ENDEAVOUR MINING CORPORATION
Management’s Discussion and Analysis of
Results of Operations and Financial Condition
For the Three and Nine Months ended September 30, 2014
Youga Gold Mine, Burkina Faso
The following table summarizes the operating results of the Youga Gold Mine for the three and nine
months ended September 30, 2014 and 2013:
Operating Data:
Tonnes of ore mined (000's)
Average gold grade mined (grams/tonne)
Tonnes of ore milled (000's)
Average gold grade milled (grams/tonne)
Gold ounces produced:
Gold ounces sold:
Realized gold price ($/ounce)
Cash cost per gold ounce sold ($/ounce)1
Sustaining capital (US dollars in thousands)1
Three months ended September 30, Nine months ended September 30,
2014
2013
2014
2013
239
256
910
763
2.51
3.08
2.45
3.10
237
239
730
748
2.65
2.64
2.66
2.99
18,432
20,029
56,584
67,031
18,498
22,330
56,696
67,484
1,264
1,337
1,287
1,448
729
865
736
727
199
448
1,025
2,451
97,689
Financial Data (US dollars in thousands)
Revenues
23,385
29,850
72,969
Royalties
1,002
1,493
3,275
4,876
Earnings from mine operations
5,661
5,558
17,478
31,907
1
Cash cost and sustaining capital are non-GAAP financial performance measures with no standard meaning under IFRS. Refer to
the section Non-GAAP Measures.
The highlights for the third quarter ended September 30, 2014 for Youga are as follows:
•
•
•
•
•
•
•
Youga mine delivered gold production of 18,432 ounces compared to 20,029 ounces for the
same period in 2013 primarily due to the decrease in gold recovered;
The process plant treated 237,000 tonnes of ore at an average grade of 2.65 g/t compared to
239,000 tonnes of ore at an average grade of 2.64 g/t for the same period in 2013;
Gold ounces sold were 18,498 at a realized average gold price of $1,264 compared to 22,330
ounces at a realized gold price of $1,337 in the same period in 2013;
Cash costs per ounce sold for the third quarter of 2014 were $729 compared to $865 for the
same period in the prior year;
All-in sustaining costs at the mine level of $794 per gold ounce sold;
Youga generated $5.6 million of operating cash flow from mine operations compared to $11.1
million for the same period in 2013; and
Youga generated $5.7 million of earnings from mine operations in line with the $5.6 million for the
same period in 2013.
Youga delivered another solid quarter despite a mill relining being necessary and six days of power
outages during the quarter. Preparations continue for the commencement of mining from the A2NE and
Zergore pits in the first quarter of 2015.
Cash costs in the current quarter continued below the guidance range of $790 to $840 per ounce for the
year. A total of 239,000 tonnes of material was mined during the three month period ended September
30, 2014 compared to 256,000 in the third quarter of the prior year, with the decrease due to mining in
deeper portions of the pits. During the third quarter of 2014, mined volumes were in line with plan and
were primarily from the Main, East, West 3 and West 2 pits. The East and West 3 pits are expected to be
fully depleted in the last quarter of 2014.
12 | P a g e
ENDEAVOUR MINING CORPORATION
Management’s Discussion and Analysis of
Results of Operations and Financial Condition
For the Three and Nine Months ended September 30, 2014
DEVELOPMENT PROJECT REVIEW
Houndé Project, Burkina Faso, Permitting Stage
The Houndé Project is situated in the southwestern region of Burkina Faso just south of Semafo’s Mana
mine and the property totals approximately 1,000 square kilometres. Ownership is currently 100%,
however, at production Endeavour’s ownership would decrease to 90% with the remaining 10%
ownership held as a free carried interest by the Government of Burkina Faso.
On November 6, 2013 Endeavour announced the results of a positive Feasibility Study (“FS”) focused on
the Vindaloo group of deposits. The deposits are approximately 2.7 kilometres from a paved highway
and as close as 100 metres to a 225 kV power line that extends from Côte d’Ivoire through to
Ouagadougou, the capital of Burkina Faso. The nearby town of Houndé has a population of
approximately 22,000 people. A rail line that extends to the port of Abidjan, Côte d’Ivoire, lies
approximately 25 kilometres west of the deposit area. The project will benefit from Endeavour’s
experience operating the Youga Mine, also located in Burkina Faso, and the recent construction
experience at the Agbaou Mine.
The highlights of the Houndé FS, on a 100% basis, include:
•
•
•
•
•
•
Estimated average annual production of 178,000 ounces of gold per year over an 8 year mine
life, with a total proven and probable mineral reserve of 1.55 million ounces and life of mine
production of 1.44 million ounces;
An average 93.3% process recovery at a milling rate of 9,000 tpd (nameplate) through a SAG/ball
mill, gravity, CIL circuit;
Owner operated open pit mining with reserves of 25 million tonnes grading 1.95 g/t Au;
Initial start-up capital is estimated at $315 million (including full mining fleet, working capital,
import duties and contingency) with life of mine sustaining capital estimated at $62 million and
$26 million of rehabilitation and closure costs;
Forecast life of mine direct cash cost of $636 per ounce (excluding royalties) and all-in sustaining
cost of $775 per ounce (including royalties, rehabilitation and closure costs);
Based on a gold price of $1,300 per ounce the project yields after-tax:
o
o
o
Internal rate of return 22.4%
Net present value of $364 million @ 0%
Net present value of $230 million @ 5%
Copies of the FS and environmental and social impact assessments (“ESIA”) were presented to the
Government of Burkina Faso in the fourth quarter of 2013 followed by public meetings and technical
review meetings held in the first quarter of 2014. The permitting process continued with a focus to get the
ESIA report reflecting specific requests arising from the meetings held and was submitted on July 14,
2014. The ESIA report is now accepted and Endeavour will next apply for an Industrial Operating Permit.
Granting of a mine permit would follow with timing dependent on the Mines Ministry. As of the date of this
MD&A, political unrest in the country was present which the Corporation continues to monitor and plans
to be in touch with local governmental authorities to enable the Corporation to manage the development
of the project.
The Houndé project holds good exploration potential that could further improve the project’s economics.
A total of $2.5 million has been spent on a drilling program at the Houndé Project and a total of 25,870
meters have been drilled during this quarter. The program was designed to confirm extensions to the
principal mineralized zones at Vindaloo and also further test targets identified during earlier exploration
drilling.
13 | P a g e
ENDEAVOUR MINING CORPORATION
Management’s Discussion and Analysis of
Results of Operations and Financial Condition
For the Three and Nine Months ended September 30, 2014
QUARTERLY FINANCIAL AND OPERATING RESULTS
The following tables summarize the Corporation’s financial and operational information for the last eight
quarters. The significant factors affecting results in the quarters presented below are; volatility of realized
gold prices, the timing of gold sales, and commencing with the fourth quarter of 2012, quarterly results
include those of the Tabakoto mine acquired with the completion of the Avion Gold Corporation
acquisition on October 18, 2012. Additionally, the Agbaou mine achieved commercial production on
January 27, 2014.
(US dollars in thousands except per share amounts)
Gold revenues
September 30,
2014
$
Gold ounces sold
Cash flows from mine operations
June 30,
2014
March 31,
2014
December 31,
2013
145,223 $
153,398 $
137,211 $
104,232
114,082
118,653
111,798
82,578
22,678
27,647
35,147
3,800
1,859
40
5,027
(74,719)
0.00
0.00
0.01
(0.18)
Net earning (loss) attributable to shareholders
of Endeavour Mining Corporation
Basic earnings (loss) per share
Diluted earnings (loss) per share
Cash and cash equivalents
Total assets
(US dollars in thousands except per share amounts)
Gold revenues
0.00
0.00
0.01
55,358
57,091
67,703
73,324
1,294,135
1,292,545
1,296,265
1,273,993
September 30,
2013
$
121,054 $
June 30, 2
2013
101,104 $
(0.18)
March 31, December 31, 1
2013
2012
116,924 $
117,162
Gold ounces sold
90,997
73,004
71,926
68,721
Cash flows from mine operations
31,300
13,900
38,100
53,100
(15,266)
(257,609)
15,138
(23,065)
Net earning (loss) attributable to shareholders
of Endeavour Mining Corporation
Basic earnings (loss) per share
(0.04)
(0.62)
0.04
(0.01)
Diluted earnings (loss) per share
(0.04)
(0.62)
0.03
(0.01)
Cash and cash equivalents
Total assets
1
2
119,351
62,188
84,880
105,900
1,396,041
1,290,235
1,765,996
1,726,124
Results include the operations of the Tabakoto Gold Mine for the period October 18, 2012 to December 31, 2012.
The cash flow includes approximately $8.5 million of gold proceeds (related to three lots from March production) received in the
first few days of April 2013.
Three months ended September 30, 2014 compared to the three months ended September 30, 2013
Net earnings attributable to shareholders were $1.9 million, or $0.00 per share, compared to a net loss of
$15.3 million, or $(0.04) per share, in the same period in 2013, attributable to the following components:
•
Revenue for the third quarter of 2014 increased by $24.1 million to $145.2 million from $121.1
million in the same period in 2013. The increase was a result of higher gold sales compared to
the prior year. Gold ounces sold increased from 90,997 ounces in 2013 to 114,082 ounces for
the third quarter of 2014. The realized price of gold per ounce for the third quarter of 2014 was
$1,273 compared to $1,330 per ounce in the same period in 2013.
14 | P a g e
ENDEAVOUR MINING CORPORATION
Management’s Discussion and Analysis of
Results of Operations and Financial Condition
For the Three and Nine Months ended September 30, 2014
•
Operating expenses for the third quarter of 2014 increased by $10.4 million to $95.9 million
predominantly due to the inclusion of Endeavour’s fourth mine, Agbaou, since commercial
production was achieved on January 27, 2014.
•
Depreciation and depletion for the third quarter of 2014 was $27.3 million compared to $21.8
million for the same prior year period in 2013. This is driven as a result of additional ounces being
produced and sold subsequent to commercial production being declared by the Agbaou
operations offset by reduced depreciation resulting from lower carrying values of certain mining
assets following impairment charges that occurred in 2013.
•
Earnings from mine operations for the third quarter of 2014 were $15.3 million compared to $7.2
million for the same period in 2013. This variance was predominantly driven by the Agbaou
operations and the additional ounces contributed at a lower operational cost in the current
reporting period.
•
Corporate costs for the third quarter of 2014 were $4.1 million compared to $3.9 million for the
same period in 2013.
•
Gains on financial instruments for the third quarter of 2014 were $4.7 million compared to losses
of $14.8 million for the same period in 2013, primarily attributable to the change in the gold price
trend.
•
Finance costs for the third quarter of 2014 were $7.6 million compared to $3.9 million for the
same period in 2013. The finance costs relate primarily to the commitment fees on the undrawn
portion and interest on the drawn portion of the $350 million corporate facility, which was
increased from $200 million to $350 million in the third quarter of 2013.
•
The current income and other tax expense for the third quarter of 2014 was $1.7 million
compared to $3.1 million for the same period in 2013.
•
Deferred income tax expense for the third quarter of 2014 was $1.7 million compared to a $12.5
million deferred tax recovery for the same period in 2013.
Net change in cash position from June 30, 2014 was a reduction of $1.7 million, attributable to the
following components of the consolidated cash flow statement and discussed in more detail in the section
Liquidity and Capital Resources:
•
Operating activities generated $22.6 million in comparison to $25.1 million generated in the same
period of the previous year primarily due to changes in non-cash working capital. In the current
quarter, normal course timing induced changes in working capital balances consumed $8.8
million of cash versus $5.8 million generated in the third quarter of 2013.
•
Investing activities used $20.0 million in comparison with $46.3 used in the same period of the
previous year as Endeavour’s capital expansion program drew to a close. The current period
outflow consisted primarily of $7.8 million of sustaining capital and $15.1 million of non-sustaining
capital primarily invested at the Tabakoto mine as discussed earlier offset by proceeds of
miscellaneous asset sales. In the comparable period, the primary investment was in the
construction of the Agbaou mine of $31.4 million.
•
Financing activities used cash of $3.9 million in comparison to $78.3 million cash inflow in the
prior period due to the receipt of $100.0 million of proceeds from the corporate loan facility.
15 | P a g e
ENDEAVOUR MINING CORPORATION
Management’s Discussion and Analysis of
Results of Operations and Financial Condition
For the Three and Nine Months ended September 30, 2014
Nine months ended September 30, 2014 compared to the nine months ended September 30, 2013
Net earnings attributable to shareholders were $6.9 million, or $0.02 per share, compared to a net loss of
$257.7 million, or $(0.62) per share, in the same period in 2013, attributable to the following components:
•
Revenue for the first nine months of 2014 increased by $96.7 million to $435.8 million from
$339.1 million in the same period in 2013. The increase was a result of higher gold sales
compared to the prior year. Gold ounces sold increased from 235,927 ounces in 2013 to 344,533
ounces for the first nine months of 2014. The realized price of gold per ounce for the first nine
months of 2014 was $1,288 compared to $1,437 per ounce in the same period in 2013.
•
Operating expenses for the first nine months of 2014 increased by $65.1 million to $284.9 million
predominantly due to the inclusion of Agbaou since commercial production was achieved on
January 27, 2014.
•
Depreciation and depletion for the first nine months of 2014 was $67.6 million compared to $70.0
million for the same prior year period in 2013. Despite additional ounces being produced and sold
subsequent to commercial production being declared by the Agbaou operations, lower
depreciation resulted from lower carrying values of certain mining assets following impairment
charges that occurred in 2013.
•
Earnings from mine operations for the first nine months of 2014 were $61.6 million compared to
$30.9 million for the same period in 2013, this variance was predominantly driven by the Agbaou
operations and the additional ounces contributed at a lower operational cost in the current
reporting period.
•
Corporate costs for the first nine months of 2014 were $14.2 million compared to $13.8 million for
the same period in 2013.
•
Losses on financial instruments for the first nine months of 2014 were $10.3 million compared to
a gain of $34.5 million for the same period in 2013. The prior year’s quarter gain was mainly
driven by a substantial decrease in the gold price used to fair value the Corporation’s derivative
financial liabilities.
•
Finance costs for the first nine months of 2014 were $21.3 million compared to $8.6 million for the
same period in 2013. The 2014 finance costs relate primarily to the commitment fees on the
undrawn portion and interest on the drawn portion of the $350 million corporate facility, with a
greater balance drawn in 2014.
•
The current income and other tax expense for the first nine months of 2014 was $6.4 million
compared to $8.2 million for the same period in 2013.
•
Deferred income tax recovery for the first nine months of 2014 was $5.7 million compared to a
recovery of $113.3 million for the same period in 2013. The significant variance was purely
driven by the non-cash $432.3 million impairment charge incurred during the same period in
2013.
16 | P a g e
ENDEAVOUR MINING CORPORATION
Management’s Discussion and Analysis of
Results of Operations and Financial Condition
For the Three and Nine Months ended September 30, 2014
Net change in cash position from December 31, 2013 was a reduction of $18.0 million, attributable to the
following components of the consolidated cash flow statement and discussed in more detail in the section
Liquidity and Capital Resources:
•
Operating activities generated $69.4 million in the nine month period ended September 30, 2014
in comparison to $55.6 for the same period of the previous year primarily due to the increased
operating margin.
•
Investing activities used $69.9 million in comparison with $117.9 million used in the same period
of the previous year, as previously discussed capital expansion programs reduced significantly in
the current year. The current period outflow consisted primarily of $19.9 million of sustaining
capital and $50.9 million of non-sustaining capital primarily invested at the Tabakoto mine in the
conversion to owner-mining and development in preparation for increased underground
extraction. In the comparable period, the primary investment was in the construction of the
Agbaou mine of $100.4.
•
Financing activities used cash of $17.4 million in comparison to $76.1 million cash inflow in the
prior year comparable period due to the receipt of $100.0 million of proceeds from the corporate
loan facility.
LIQUIDITY AND CAPITAL RESOURCES
At September 30, 2014, Endeavour had cash of $55.4 million (December 31, 2013 – $73.3 million). In
addition, at September 30, 2014, Endeavour held $1.2 million of marketable securities (December 31,
2013 – $1.7 million) and $4.6 million in restricted cash, unchanged from the prior year end. Total working
capital as at September 30, 2014 was $113.6 million (December 31, 2013 - $90.3 million).
The reconciliation for the cash movement during the first nine months of 2014, highlighting the significant
movements, is as follows:
Nine months ended
September 30, 2014
(US dollars in millions)
Opening balance at January 1, 2014
All-in sustaining margin
Non-sustaining investments in new mines and developments
Settlement of gold hedge program
Change in working capital and other
Taxes and finance costs
Closing balance at September 30, 2014
$
$
73.3
89.7
(50.9)
(10.2)
(25.6)
(20.9)
55.4
The $50.9 million of non-sustaining investments primarily relates to owner mining equipment at Tabakoto
and the pre-commercial production underground development at Segala. Additionally, a significant
investment in working capital has also been made with operating supplies taken on to support the owner
mining transition and the increase in working capital due to Agbaou coming online.
On July 24, 2013 the Corporation signed a $350 million amended senior secured revolving corporate loan
facility (the “Facility”) with UniCredit Bank AG, BNP Paribas, ING Bank NV, Société Générale and
Deutsche Bank AG. With the completion of the Agbaou construction and commercial start up, the full
$350 million is available for general corporate purposes (previously up to $300 million of the Facility could
be used for general corporate purposes), and thus provides $50 million of additional liquidity with $300
17 | P a g e
ENDEAVOUR MINING CORPORATION
Management’s Discussion and Analysis of
Results of Operations and Financial Condition
For the Three and Nine Months ended September 30, 2014
million of the Facility drawn to date. The Facility is secured by shares of Endeavour’s material gold
mining subsidiaries and certain material assets of those subsidiaries.
The key terms of the Facility include:
•
•
•
Maturity date is five years from signing or July 24, 2018, and the available Facility amount
declines with six equal semi-annual reductions of $58.3 million commencing January 1, 2016;
The Facility incorporates standard corporate financial covenants, including:
o Interest Cover shall not be less than 3 to 1, calculated on a rolling 12 month basis
o Net Debt to EBITDA shall not exceed 3.25 times, calculated on a rolling 12 month basis
o Minimum tangible net worth of $600 million; and
Interest is based on LIBOR plus a margin ranging between 3.75% and 5.5% per annum (sliding
scale based on the actual Net Debt to EBITDA ratio).
In the opinion of management, Endeavour’s cash position and working capital at September 30, 2014,
together with anticipated cash flows from operations, are sufficient to support the Corporation’s on-going
operational requirements, planned sustaining investments, and commitments.
FINANCIAL INSTRUMENTS
Endeavour believes the best long term risk management is achieved through lower, sustainable, cost
management activities. The Corporation has two legacy gold price protection programs that were
acquired in past acquisitions.
On July 29, 2013 Endeavour re-distributed a portion of the then remaining 96,163 ounces of forward
contracts to several new lenders. The amended strike price increased from $1,061 per ounce to a
weighted average strike price of $1,332 per ounce. On the close out of the former hedge, a $300 per
ounce increase in the strike price gave rise to a crystallized loss; this crystallized loss is being allocated
and paid over the remaining hedge deliveries, resulting in the net proceeds to be received of $1,032 per
ounce ($1,332 per ounce less the loss of $300 per ounce). As at September 30, 2014, 69,512 ounces
(5,349 ounces in 2014, 32,000 in 2015 and 32,163 in 2016) of these gold forward contracts remain
outstanding with a fair value of $11.9 million (December 31, 2013, $15.6 million) as illustrated in the
following table.
Period
2014
2015
2016
Forward
contracts
(ounces)
5,349
32,000
32,163
69,512
$
$
$
$
Price per
Ounce
1,332
1,332
1,332
1,332
$
$
Fair
Value
946
5,504
5,442
11,893
Additionally, under a second legacy program, 9,099 ounces (to be settled by 3,033 ounces in 2014 and
6,066 ounces in 2015) of $900 strike price gold call options remain outstanding with a fair value of $2.8
million (December 31, 2013, $5.3 million).
At September 30, 2014, these derivative financial liabilities had an aggregate fair value of $14.7 million
(December 31, 2013 - $ 20.9 million).
18 | P a g e
ENDEAVOUR MINING CORPORATION
Management’s Discussion and Analysis of
Results of Operations and Financial Condition
For the Three and Nine Months ended September 30, 2014
CONTRACTUAL OBLIGATIONS AND COMMITMENTS
The following table summarizes the contractual maturities of the Corporation’s financial liabilities at
September 30, 2014:
Within 1
year
Trade and other payables
$
Long-term debt
Finance lease obligations
Minimum operating lease payments
Derivative financial liabilities
$
98,492 $
4,246
338
7,729
110,805 $
2 to 3
years
$
116,600
14,621
45
6,929
138,195 $
4 to 5
years
183,400
-
Over 5
years
Total
$
-
$
183,400 $
-
$
98,492
300,000
18,867
383
14,658
432,400
The Corporation has commitments in place at its operations for drill and blasting services, load and haul
services, and the supply of explosives and hydrocarbon services with varying terms, and is subject to
operating and finance lease commitments in connection with the purchase of mining equipment, light duty
vehicles, operational building facilities and rented office premises. Additionally, the Corporation has at
times contracts in place at the Nzema mine to purchase higher grade ore from third parties. The above
table does not include the Corporation’s environmental rehabilitation provision which is in place at each of
the operating mines, the majority of which is expected to be incurred concurrent with the end of mining
operations at each of the mines.
On March 7, 2014, the Corporation’s Malian subsidiary entered into a five year, $18 million equipment
lease financing facility. The equipment lease was used to purchase a portion of the owner-operated
mining equipment for the Tabakoto and Segala underground developments. The lease terms have a fixed
rate of 9.5% per annum to amortize the principal and there exists a purchase option to buy the equipment
outright at the end of the lease life for 0.5% of cost. The equipment lease is treated as a finance lease.
CONTINGENCIES
The Corporation is, from time to time, involved in various claims, legal proceedings and complaints arising
in the ordinary course of business. The Corporation cannot reasonably predict the likelihood or outcome
of these actions. The Corporation does not believe that adverse decisions in any other pending or
threatened proceedings related to any matter, or any amount which may be required to be paid by reason
thereof, will have a material effect on the financial condition or future results of operations.
The Corporation’s mining and exploration activities are subject to various laws and regulations governing
the protection of the environment. These laws and regulations are continually changing and are generally
becoming more restrictive. The Corporation believes its operations are materially in compliance with all
applicable laws and regulations. The Corporation has made, and expects to make in the future,
expenditures to comply with such laws and regulations.
19 | P a g e
ENDEAVOUR MINING CORPORATION
Management’s Discussion and Analysis of
Results of Operations and Financial Condition
For the Three and Nine Months ended September 30, 2014
OUTSTANDING SHARE DATA
Endeavour’s authorized capital is US$20,000,000 divided into 1,000,000,000 ordinary shares with a par
value of US $0.01 each and 1,000,000,000 undesignated shares; no undesignated shares have been
issued. The table below summarizes Endeavour’s share structure at September 30, 2014.
Shares issued and outstanding
413,143,668
Stock options
30,801,435
As at November 3, 2014, the date of this MD&A, the Corporation has 413,143,668 shares issued and
outstanding, as well as 25,970,935 stock options outstanding.
The following table summarizes share option details outstanding as at September 30, 2014:
Exercise
Prices (C$)
Outstanding
$0.80 - $1.50
$1.51 - $2.00
$2.01 - $2.50
$2.51 - $3.00
$3.01 - $4.00
$4.01 - $44.96
7,622,920
10,411,350
4,645,716
5,814,312
80,300
2,226,837
30,801,435
Weighted average
Weighted average
remaining
Exercisable exercise price (C$)
contractual life
767,921 $
10,411,350
4,037,383
5,814,312
80,300
2,226,837
23,338,103
$
1.15
1.76
2.29
2.67
3.70
5.05
3.55 years
1.01 years
3.17 years
2.10 years
1.62 years
1.72 years
2.38
1.81 years
20 | P a g e
ENDEAVOUR MINING CORPORATION
Management’s Discussion and Analysis of
Results of Operations and Financial Condition
For the Three and Nine Months ended September 30, 2014
NON-GAAP MEASURES
All-in sustaining margin and adjusted EBITDA
The Corporation believes that, in addition to conventional measures prepared in accordance with GAAP,
certain investors use the all-in sustaining margin and adjusted earnings before interest, tax, depreciation
and amortization (“EBITDA”) to evaluate the Corporation’s performance and ability to generate cash flows
and service debt. Accordingly, these do not have a standard meaning and it is intended to provide
additional information and should not be considered in isolation or as a substitute for measures of
performance prepared in accordance with GAAP.
The following tables provide the illustration of the calculation of this margin and EBITDA, as adjusted and
calculated by the Corporation, for the three and nine months ended September 30, 2014 and 2013:
Three months ended September 30, Nine months ended September 30,
2014
2013
2014
2013
(US dollars in thousands)
Revenues
Less: royalties
Less: cash costs of ounces sold (see table that follows)
$
145,223 $
(6,817)
(92,871)
121,054 $
(6,600)
(79,039)
Less: corporate G&A
(4,120)
(3,917)
(14,220)
Subtotal
41,415
31,498
112,961
98,212
Less: sustaining capital (see table that follows)
(7,768)
(9,199)
(19,999)
(25,068)
Less: sustaining exploration
All-in sustaining margin
$
435,832 $ 339,082
(21,650)
(18,315)
(208,777)
(287,001)
(13,778)
(1,514)
(2,960)
(3,264)
(4,360)
32,133 $
19,339 $
89,698 $
68,784
Three months ended September 30,
2014
Nine months ended September 30,
2013
2014
2013
(US dollars in thousands)
Earnings(loss) before tax 1
$
Add back: Depreciation and depletion1,2
Add back: Impairment and write-downs 1,2
Deduct: Non-recurring mineral property and other asset sales
Add back: Finance costs 1
Add back: Losses (gains) on financial instruments 1
Adjusted EBITDA
$
(1,735) $
12,596 $
27,278
5,400 $
21,779
67,628
70,038
-
-
-
429,361
2,093
(15,504)
1,107
(10,041)
7,557
3,932
21,261
8,609
(4,724)
14,763
10,302
(34,522)
37,604 $
23,235 $
112,894 $
(390,601)
72,844
1
As found on the unaudited interim consolidated statement of comprehensive income.
2
Sum of depreciation, depletion and impairment of mining interests and goodwill as found on the unaudited interim consolidated
statement of comprehensive income.
Cash cost per ounce of gold sold
The Corporation reports cash costs on the basis of ounces sold. In the gold mining industry these are
common performance measures but do not have any standardized meanings. The Corporation follows
the recommendation of the Gold Institute Production Cost Standard. The Corporation believes that, in
addition to conventional measures prepared in accordance with GAAP, certain investors use this
information to evaluate the Corporation’s performance and ability to generate cash flows. Accordingly, it is
intended to provide additional information and should not be considered in isolation or as a substitute for
measures of performance prepared in accordance with GAAP.
21 | P a g e
ENDEAVOUR MINING CORPORATION
Management’s Discussion and Analysis of
Results of Operations and Financial Condition
For the Three and Nine Months ended September 30, 2014
The following table provides a reconciliation of cash costs per ounce of gold sold (including the ounces
sold from ore purchased), for the three and nine months ended September 30, 2014 and 2013:
Three months ended September 30, Nine months ended September 30,
2014
2013
2014
2013
(US dollars in thousands except ounces sold)
Operating expenses from mine operations
Non-cash adjustments included in operating expenses
Cash cost
$
95,872 $
(3,001)
92,871
Divided by ounces of gold sold
114,082
Total cash cost per ounce of gold sold
$
814 $
85,440 $
(6,401)
79,039
284,924 $
2,076
287,001
219,827
(11,050)
208,777
90,997
338,401
235,927
869 $
848 $
885
All-in sustaining costs
The Corporation is reporting all‐in sustaining costs per ounce sold. The methodology for calculating all‐in
sustaining costs per ounce was developed internally and is calculated below, and readers should be
aware that this measure does not have a standardized meaning. This non‐GAAP measure provides
investors with transparency to the total period‐attributable cash cost of producing an ounce of gold, and
may aid in the comparison with other gold mining peers. Accordingly, it is intended to provide additional
information and should not be considered in isolation or as a substitute for measures of performance
prepared in accordance with GAAP.
Three months ended September 30, Nine months ended September 30,
Year ended
2014
2013
2014
2013 December 31, 2013
(US dollars in thousands except ounces)
Cash cost for ounces sold
Royalties
Corporate G&A
Sustaining capital1
Sustaining exploration
All-in sustaining costs
Divided by gold ounces sold
All-in sustaining cost per ounce sold
$
$
92,871 $
6,817
4,120
7,768
1,514
113,090
114,082
991 $
79,039 $
6,600
3,917
9,199
2,960
101,715
90,997
1,118 $
287,001 $ 208,777 $
21,650
18,315
14,220
13,778
19,999
25,068
3,264
4,360
346,134
270,298
338,401
235,927
1,023 $
1,146 $
283,542
24,001
21,451
27,363
5,737
362,094
318,505
1,137
1
2013 sustaining capital is restated from $5.4 million to $9.2 million as compared to that presented in the prior year which did not include sustaining capital at Tabakoto due to
the Corporation acquiring the mine in the fourth quarter of 2012 and concurrently the Corporation has also adopted a revised sustaining capital definition to include underground
sustaining capital in 2014. Additionally, in 2013, 25% of Corporate Costs were allocated to construction activity associated with the Agbaou Mine whereas in 2014 the
Corporation is calculating AISC with 100% of the Corporate Cost for all periods.
Additionally, the year-ended December 31, 2013 is presented for comparative purposes and is presented as per the definition of calculating AISC in 2014 which is different from
that used in 2013.
Three months ended September 30, Nine months ended September 30,
2014
2013
24,350 $
(8,523)
(1,514)
(3,503)
(3,042)
7,768
50,346 $
(3,202)
(2,960)
(33,781)
(1,204)
9,199
2014
Year ended
2013 December 31, 2013
(US dollars in thousands)
Investments in capital projects and capitalized exploration1 $
Non-sustaining capital at Tabakoto
Sustaining exploration
Project capital spend predominantly at Agbaou and Houndé
Other non-sustaining capital at Nzema
Sustaining Capital
74,162 $ 165,774 $
(38,198)
(18,204)
(4,360)
(3,264)
(5,052) (108,124)
(7,649)
(10,018)
19,999
25,068
213,560
(28,084)
(5,737)
(143,562)
(8,814)
27,363
1 As found on the unaudited interim consolidated statement of cash flows.
22 | P a g e
ENDEAVOUR MINING CORPORATION
Management’s Discussion and Analysis of
Results of Operations and Financial Condition
For the Three and Nine Months ended September 30, 2014
Cash costs and all-in sustaining costs on mine by mine basis
The following table provides additional detail as to how cash costs and all-in sustaining costs at the mine
site level are calculated on a mine by mine basis for the current quarter.
Agbaou
Mining Physicals
Total tonnes mined - Open pit
Total ore tonnes - Open pit
Total ore tonnes - Underground
Total tonnes milled
Gold sold
000t
000t
000t
000t
ozs
Nzema
5,481
669
603
41,919
2,243
342
401
24,231
Tabakoto
Youga
1,826
164
230
390
29,434
1,349
239
236
18,498
Total
114,082
Unit cost analysis
Mining costs - Open pit1
$/t mined
2.96
4.30
4.56
4.06
Mining costs - Underground1
Processing and maintenance
Site G&A
$/t ore
$/t milled
$/t milled
7.74
3.70
18.89
7.63
57.36
28.84
15.41
25.58
9.87
Cash cost details
Mining costs - Open pit
Mining costs - Underground
Processing and maintenance
Site G&A
Purchased ore at Nzema
Inventory adjustments
Cash costs for ounces sold
$000s
$000s
$000s
$000s
$000s
$000s
$000s
$13,182
4,666
2,227
(507)
$19,567
$9,199
7,571
3,059
3,457
(1,077)
$22,209
$8,323
11,526
11,251
6,013
470
$37,583
$5,478
6,047
2,333
(369)
$13,490
36,181
11,526
29,536
13,633
3,457
(1,483)
$92,849
Royalties
Sustaining capital
$000s
$000s
$1,856
$3,330
$1,706
$1,368
$2,254
$2,871
$1,002
$199
$6,817
$7,768
Cash cost per ounce sold
Mine-level AISC per ounce sold
$/oz
$/oz
$467
$590
$917
$1,043
$1,277
$1,451
$729
$794
$814
$942
$3,055
$439
$1,665
Other costs used to derive unit mining cost
Capitalized mining costs
$000s
1
Includes capitalized mining costs
23 | P a g e
ENDEAVOUR MINING CORPORATION
Management’s Discussion and Analysis of
Results of Operations and Financial Condition
For the Three and Nine Months ended September 30, 2014
Adjusted net earnings and adjusted net earnings per share
Adjusted net earnings and adjusted net earnings per share are financial measures with no standard
meaning under IFRS. Net earnings have been adjusted for items considered exceptional in nature and
not related to Endeavour’s core operating of mining assets and Endeavour uses this measure for its own
internal purposes. The presentation of adjusted net earnings may enable investors and analysts to better
understand the underlying operating performance of our core mining business through the eyes of
management. Management periodically evaluates the components of adjusted net earnings based on an
internal assessment of performance measures that are useful for evaluating the operating performance of
our business and a review of the non‐GAAP measures used by mining industry analysts and other mining
companies. The following items are excluded from net earnings:
•
•
•
•
•
•
•
•
•
•
•
•
•
•
Realized and unrealized gain / loss – gold price protection programs
Change in unrealized gain – C$ share purchase warrants
Non-cash impairment charges
Gain / loss on financial instruments
Imputed interest on promissory note
Gains / losses on foreign currency
Losses associated with gold bullion
Losses associated with Namibia Rare Earths Inc.(“NREI”)
Gains / losses on sale of subsidiaries and joint ventures
Loss on change of ownership
Stock-based payments
Finance costs (incurred for the amended Facility)
Deferred income taxes
Other non-operating and exceptional items
Adjusted net earnings are intended to provide additional information only and do not have any
standardized definition under IFRS; they should not be considered in isolation or as a substitute for
measures of performance prepared in accordance with IFRS. The measures are not necessarily
indicative of operating profit or cash flow from operations as determined under IFRS. Other companies
may calculate these measures differently.
The following table reconciles these non‐GAAP measures to the most directly comparable IFRS measure.
24 | P a g e
ENDEAVOUR MINING CORPORATION
Management’s Discussion and Analysis of
Results of Operations and Financial Condition
For the Three and Nine Months ended September 30, 2014
Adjusted Net Earnings
Three months ended September 30,
2014
2013
(US dollars in millions except per share and share amounts)
Net earnings (loss) and total comprehensive earnings (loss)
Net non-cash impairment charges
Loss (gain) on derivative instruments and marketable securities
Imputed interest on promissory note
Loss on foreign currency
Losses associated with gold bullion
Losses associated with NREI
Loss (gain) on sale of subsidiaries and joint ventures
Loss on change of ownership
Stock-based payments
Amortized financing costs
Deferred income taxes (recovery)
Adjusted net earnings(loss) after tax
Attributable to non-controlling interests
Attributable to shareholders of the Corporation
Weighted average number of outstanding shares
Adjusted net earnings(loss) per share (basic)
$
2.1
(7.3)
(0.5)
3.1
2.1
0.5
1.7
$
1.7
$
(0.2)
$
1.5
413,143,668
0.00
$
$
$
$
(17.4)
15.1
(0.6)
0.3
(15.5)
0.8
0.7
12.5
(4.1)
2.1
(2.0)
412,493,944
(0.00)
Nine months ended September 30,
2014
2013
$
12.0
6.7
(1.4)
5.0
1.1
0.9
(5.7)
$
18.6
$
(5.0)
$
13.5
413,110,978
0.03
$
$
$
$
(285.5)
432.3
(35.5)
(1.8)
2.7
7.6
1.3
(15.5)
0.6
4.2
0.7
(113.3)
(2.1)
27.8
25.6
412,406,360
0.06
HEALTH, SAFETY AND CORPORATE SOCIAL RESPONSIBILITY
Endeavour emphasises employee and affected stakeholders’ health and safety and puts the highest
priority on safe, healthy and environmentally sound work practices and systems. The Corporation’s
values and business principles on safety and health underpin its safety and health policy and represent
the minimum guidelines for the Corporation and its employees in this respect. The Corporation has a Zero
Harm policy which is applied at all sites, and continuous efforts are made to reduce the lost time injury
frequency rate (“LTIFR”) at all the operations. The following table shows the safety statistics for the most
recent full year period, 2013.
1
2
Incident Category
Tabakoto
Agbaou1
Nzema
Youga
Total
Fatality
0
0
0
0
0
Lost Time Injury (LTI)
3
1
2
1
7
Total Man Hours
3,452,248
2,084,408
3,422,338
2,604,154
11,563,148
LTIFR2
0.87
0.48
0.58
0.38
0.61
Ontario Mining
Industry
2.00
For the period March to December 2013
Lost Time Injury Frequency Rate= (Number of LTIs in the Period X 1,000,000)/ (Total man hours worked for the period)
The Corporation notes that the LTIFR at Tabakoto is higher than the Corporation’s other mines, reflecting
the higher risk associated with underground mining operations. The aggregate LTIFR for the mining
industry in the province of Ontario, Canada in 2012 was 2.0, for which data was available. This is
provided as a benchmark, which suggests that the Corporation is applying an effective Health and Safety
program.
Endeavour sees itself as an integral part of the communities in which it operates, as well as a responsible
development partner. Endeavour works in collaboration with and engages government, local communities
and outside organizations to ensure it supports economic sustainability and social development, with
projects including skills training and educational scholarships, healthcare, water and sanitation, public
infrastructure maintenance, institutional capacity building and livelihood programs.
25 | P a g e
ENDEAVOUR MINING CORPORATION
Management’s Discussion and Analysis of
Results of Operations and Financial Condition
For the Three and Nine Months ended September 30, 2014
CRITICAL ACCOUNTING POLICIES AND ESTIMATES
The Corporation’s management has made critical judgments and estimates in the process of applying the
Corporation’s accounting policies to the consolidated financial statements that have significant effect on
the amounts recognized in the Corporation’s consolidated financial statements. The most critical
accounting policies follow:
(a)
Commencement of commercial production
Prior to a mine being capable of operating at levels intended by management, costs incurred are
capitalized as part of the costs of related mining properties and proceeds from mineral sales are
offset against costs capitalized. Commercial production at the Agbaou Mine was declared on
January 27, 2014 (accounting for commercial production commenced on February 1, 2014).
Commercial production is deemed to have commenced when a mining interest is capable of
operating at levels intended by management. This is achieved when management determines
that the operational commissioning of major mine and plant components is complete, operating
results are being achieved consistently for a period of time and that there are indications that
these operating results will continue.
The Corporation determines commencement of commercial production based on the following
factors:
•
•
•
•
All major capital expenditures to bring the mine to the condition necessary for it to be
capable for operating in the manner intended by management have been completed;
The completion of a reasonable period of testing of the mine plant and equipment;
The mine or mill has reached a pre-determined percentage of design capacity; and
The ability to sustain ongoing production of ore.
The list is not exhaustive and each specific circumstance is taken into account before making the
decision.
(b)
Share-based payment arrangements
Performance share units (“PSUs”) can be settled in cash or, upon shareholder approval, in
shares of the Corporation. The fair value of the estimated number of PSUs that will
eventually vest, determined at the date of grant, is recognized as share-based
compensation expense over the vesting period, with a corresponding amount recorded as a
liability. Until the liability is settled, the fair value of the PSUs is re-measured at the end of
each reporting period and at the date of settlement, with changes in fair value recognized as
share-based compensation expense or recovery over the vesting period. The fair value of
the PSUs is estimated using the market value of the underlying shares at the date of grant
and at the end of each reporting period.
(c)
Determination of economic viability
Management has determined that exploratory drilling, evaluation, development and related costs
incurred which have been capitalized are economically recoverable. Management uses several
criteria in its assessments of economic recoverability and probability of future economic benefit
including geologic and metallurgic information, history of conversion of mineral deposits to proven
and probable reserves, scoping and feasibility studies, accessible facilities, existing permits and
life of mine plans.
26 | P a g e
ENDEAVOUR MINING CORPORATION
Management’s Discussion and Analysis of
Results of Operations and Financial Condition
For the Three and Nine Months ended September 30, 2014
(d)
Functional currency
The functional currency for each of the Corporation’s subsidiaries, and investments in associates,
is the currency of the primary economic environment in which the entity operates. The
Corporation has determined the functional currency of each entity is the US dollar. Determination
of functional currency may involve certain judgments to determine the primary economic
environment and the Corporation reconsiders functional currency of its entities if there is a
change in events and conditions which determine the primary economic environment.
(e)
Business combinations
Determination of whether a set of assets acquired and liabilities assumed constitute a business
may require the Corporation to make certain judgements, taking into account all facts and
circumstances. If an acquired set of assets and liabilities includes goodwill, the set is presumed to
be a business.
(e)
Exchangeable shares
As part of the acquisition of Avion Gold Corporation certain eligible Avion shareholders could
elect to receive their consideration in the form of exchangeable shares in lieu of Endeavour
common shares. These exchangeable shares participate equally in voting and dividends with the
shareholders of Endeavour and the exchangeable shares are considered the economic
equivalent of the common shares. The Corporation has presented these exchangeable shares
as a part of shareholders’ equity within these consolidated financial statements due to (i) the fact
that they are economically equivalent to the common shares and (ii) the holders of the
exchangeable shares can only dispose of the exchangeable shares by exchanging them for
common shares of the Corporation. Changes in these assumptions would affect the presentation
of the exchangeable shares from shareholders’ equity to non-controlling interests; however, there
would be no impact on earnings per share.
(f)
Capitalization of waste in open pit operations
Capitalization of waste stripping requires the Corporation to make judgments and estimates in
determining the amounts to be capitalized. In open pit mining operations, it is necessary to incur
costs to remove overburden and other mine waste materials in order to access the ore body
(“stripping costs”). During the development of a mine, stripping costs are capitalized and included
in the carrying amount of the related mining property and depleted over the productive life of the
mine using the unit-of-production method. During the production phase of a mine, stripping costs
incurred to provide access to sources of reserves that will be produced in future periods that
would not have otherwise been accessible are capitalized and included in the carrying amount of
the related mining property. Stripping costs incurred and capitalized during the production phase
are depleted using the unit-of-production method over the reserves and a portion of resources
that directly benefit from the specific stripping activity. Costs incurred for regular waste removal
that do not give rise to future economic benefits are considered as costs of sales and included in
operating expenses.
27 | P a g e
ENDEAVOUR MINING CORPORATION
Management’s Discussion and Analysis of
Results of Operations and Financial Condition
For the Three and Nine Months ended September 30, 2014
NEWLY ADOPTED AND ISSUED BUT NOT YET EFFECTIVE ACCOUNTING STANDARDS
The following standards became effective for annual periods beginning on or after January 1, 2014, with
earlier application permitted. The Corporation adopted these standards and they did not have a material
impact on its consolidated financial statements.
•
•
IAS 32, Offsetting Financial Assets and Financial Liabilities (Amendments to IAS 32): On
December 16, 2011, the IASB published amendments to IAS 32, Financial Instruments:
Presentation to clarify the application of the offsetting requirements. The Corporation
adopted this standard as of January 1, 2014, and determined its impact not to be
significant.
IFRIC 21 Levies: In May 2013, the IASB issued IFRIC 21 on the accounting for levies
imposed by governments. The Corporation adopted this standard as of January 1, 2014,
and determined its impact not to be significant.
The Corporation has not early adopted the following new and revised Standards, Amendments
and Interpretations that have been issued but are not yet effective. The Corporation is
currently assessing the impact they will have on the consolidated financial statements.
•
IFRS 15, Revenue from Contracts with Customers: IFRS 15 introduces a new framework
for determining the nature, amount, timing and uncertainty of revenues and cash flows
arising from a contract with a customer. The standard is effective for annual period
beginning on or after January 1, 2017, with early adoption permitted. The Corporation is
currently evaluating the potential impact of the new standard on its consolidated financial
statements.
•
IFRS 9, Financial Instruments: IFRS 9 introduces the new requirements for the
classification, measurement and de-recognition of financial assets and financial liabilities.
Specifically, IFRS 9 requires all recognized financial assets that are within the scope of
IAS 39 Financial Instruments: Recognition and Measurement to be subsequently
measured at amortized cost or fair value, and all financial liabilities classified as
subsequently measured at amortized cost except for financial liabilities measured at fair
value through profit and loss. In July 2014, the IASB issued the final version of IFRS
9 Financial Instruments bringing together the classification and measurement, impairment
and
hedge
accounting
phases
of
the
IASB’s
project
to replace IAS 39 Financial Instruments: Recognition and Measurement. The mandatory
effective date of IFRS 9 would be annual periods beginning on or after January 1, 2018,
with early adoption permitted. The Company is currently assessing the impact of adopting
IFRS 9 on its consolidated financial statements.
KEY SOURCES OF ESTIMATION UNCERTAINTY
The preparation of consolidated financial statements in conformity with IFRS requires the Corporation’s
management to make judgments, estimates and assumptions that affect the amounts reported in the
consolidated financial statements and related notes to the consolidated financial statements. Estimates
and assumptions are continually evaluated and are based on management’s experience and other
factors, including expectations of future events that are believed to be reasonable under the
circumstances.
The significant assumptions about the future and other major sources of estimation uncertainty as at the
end of the reporting period that have a significant risk of resulting in a material adjustment to the carrying
amounts of the Corporation’s assets and liabilities are as follows:
28 | P a g e
ENDEAVOUR MINING CORPORATION
Management’s Discussion and Analysis of
Results of Operations and Financial Condition
For the Three and Nine Months ended September 30, 2014
(a)
Value Added Tax (“VAT”)
Included in trade and other receivables are recoverable VAT balances owing by the fiscal
authorities in Burkina Faso, Ghana, Cote d’ Ivoire, and Mali. The Corporation is following the
relevant process in each country to recoup the VAT balances owing and continues to engage with
authorities to accelerate the repayment of the outstanding VAT balances.
(b)
Impairment of mining interests and goodwill
The Corporation considers both external and internal sources of information in assessing whether
there are any indications that mining interests and goodwill are impaired. External sources of
information the Corporation considers include changes in the market, economic and legal
environment in which the Corporation operates that are not within its control and affect the
recoverable amount of mining interests and goodwill. Internal sources of information the
Corporation considers include the manner in which mining properties and plant and equipment
are being used or are expected to be used and indications of economic performance of the
assets.
In determining the recoverable amounts of the Corporation’s mining interests and goodwill, the
Corporation’s management makes estimates of the discounted future cash flows expected to be
derived from the Corporation’s mining properties, costs to sell the mining properties and the
appropriate discount rate. The projected cash flows are significantly affected by changes in
assumptions about gold’s selling price, future capital expenditures, reductions in the amount of
recoverable reserves, resources, and exploration potential, production cost estimates, discount
rates and exchange rates. Reductions in gold price forecasts, increases in estimated future costs
of production, increases in estimated future non-expansionary capital expenditures, reductions in
the amount of recoverable reserves, resources, and exploration potential, and/or adverse current
economics can result in a write-down of the carrying amounts of the Corporation’s mining
interests and/or goodwill. These factors moving in the opposite direction could result in full or
partial reversals of previous write-downs to mining interests.
(c)
Estimated recoverable ounces
The carrying amounts of the Corporation’s mining interests are depleted based on recoverable
ounces. Changes to estimates of recoverable ounces and depletable costs including changes
from revisions to the Corporation’s mine plans and changes in gold price forecasts can results in
a change to future depletion rates.
(d)
Fair values of assets and liabilities acquired in business combinations
In a business combination, it generally takes time to obtain the information necessary to measure
the fair values of assets acquired and liabilities assumed and the resulting goodwill, if any.
Changes to the provisional measurements of assets and liabilities acquired including the
associated deferred income taxes and resulting goodwill may be retrospectively adjusted when
new information is obtained until the final measurements are determined (within one year of
acquisition date). The determination of fair value as of the acquisition date requires management
to make certain judgments and estimates about future events, including, but not restricted to,
estimates of mineral reserves and resources acquired, exploration potential, future operating
costs and capital expenditures, future metal prices, long-term foreign exchange rates, and
discount rates.
29 | P a g e
ENDEAVOUR MINING CORPORATION
Management’s Discussion and Analysis of
Results of Operations and Financial Condition
For the Three and Nine Months ended September 30, 2014
In determining the amount for goodwill, the Corporation’s management makes estimates of the
discounted future after-tax cash flows expected to be derived from the acquired business based
on estimates of future revenues, expected conversions of resources to reserves, future
production costs and capital expenditures, based on a life of mine plan. To estimate the fair value
of the exploration potential, a market approach is used which evaluates recent comparable gold
property transactions. The excess of acquisition cost over the net identifiable assets acquired
represents goodwill.
(e)
Mineral reserves
Mineral reserves and mineral resources are determined in accordance with Canadian Securities
Administrator’s national Instrument 43-101 Standards of Disclosure for Mineral Projects. Mineral
reserve and resource estimates included numerous estimates. Such estimation is a subjective
process, and the accuracy of any mineral reserve or resource estimate is a dependent on the
quantity and quality of available data and of the assumptions made and judgments used in
engineering and geological interpretation. Differences between management’s assumptions
including economic assumptions such as gold prices and market conditions could have a material
effect in the future on the Corporation’s financial position and results of operation.
(f)
Environmental rehabilitation costs
The provisions for rehabilitation of mine and project sites and the related accretion expense are
based on the expected costs of environmental rehabilitation and inputs used to determine the
present value of such provisions using the information available at the reporting date. To the
extent the actual costs differ from these estimates, adjustments will be recorded and the profit or
loss may be impacted.
(g)
Deferred income taxes
In assessing the probability of realizing income tax assets recognized, management makes
estimates related to expectations of future taxable income, applicable tax opportunities, expected
timing of reversals of existing temporary differences and the likelihood that tax positions taken will
be sustained upon examination by applicable tax authorities.
In making its assessments, management gives additional weight to positive and negative
evidence that can be objectively verified. Estimates of future taxable income are based on
forecasted cash flows from operations and the application of existing tax laws in each jurisdiction.
Forecasted cash flows from operations are based on life of mine projections internally developed
and reviewed by management. Weight is attached to tax planning opportunities that are within the
Corporation’s control, and are feasible and implementable without significant obstacles. The
likelihood that tax positions taken will be sustained upon examination by applicable tax authorities
is assessed based on individual facts and circumstances of the relevant tax position evaluated in
light of all available evidence. Where applicable tax laws and regulations are either unclear or
subject to ongoing varying interpretations, it is reasonably possible that changes in these
estimates can occur that materially affect the amounts of income tax assets recognized. At the
end of each reporting period, the Corporation reassesses unrecognized and recognized income
tax assets.
30 | P a g e
ENDEAVOUR MINING CORPORATION
Management’s Discussion and Analysis of
Results of Operations and Financial Condition
For the Three and Nine Months ended September 30, 2014
(h)
Share-based payments
Significant assumptions are made when accounting for share-based payments. Changes to these
assumptions may alter the resulting accounting and ultimately the amount charged to profit or
loss.
RISK FACTORS
Readers of this Management’s Discussion and Analysis should give careful consideration to the
information included or incorporated by reference in this document and the Corporation’s audited
consolidated financial statements and related notes for the year ended December 31, 2013. Significant
risk factors for the Corporation are metal prices, government regulations, foreign operations,
environmental compliance, dependence on management, title to the Corporation’s mineral properties and
litigation. For details of risk factors, please refer to the 2013 year-end audited consolidated financial
statements, Management’s Discussion and Analysis and Annual Information Form filed on SEDAR at
www.sedar.com.
FINANCIAL AND RELATED RISKS
The Corporation’s activities expose it to a variety of risks that may include currency risk, credit risk,
liquidity risk, interest rate risk and other price risks, including equity price risk. The Corporation examines
the various financial instrument risks to which it is exposed and assesses any impact and likelihood of
those risks.
(i)
Credit risk
Credit risk is the risk that the counterparty to a financial instrument will cause a financial loss
for the Corporation by failing to discharge its obligations. There has been no change in the
Corporation’s objectives and policies for managing this risk in the three and six months
ended September 30, 2014.
The Corporation’s maximum exposure to credit risk is as follows:
September 30,
2014
December 31,
2013
(US dollars in thousands)
Cash and cash equivalents
$
$
73,324
4,517
4,517
Marketable securities
1,195
1,731
53,437
38,662
Trade and other receivables
Long-term receivable
4,274
4,274
Promissory note and other assets
9,123
10,197
Derivative Financial Asset
56
$
(ii)
55,358
Cash - restricted
127,960
1,888
$
134,593
Liquidity risk
Liquidity risk is the risk that the Corporation will encounter difficulty in meeting obligations
associated with its financial liabilities that are settled by delivering cash or another financial asset.
31 | P a g e
ENDEAVOUR MINING CORPORATION
Management’s Discussion and Analysis of
Results of Operations and Financial Condition
For the Three and Nine Months ended September 30, 2014
The Corporation has a planning and budgeting process in place to help determine the funds
required to support the Corporation’s normal operating requirements.
(iii)
Currency risk
Currency risk relates to the risk that the fair values or future cash flows of the Corporation’s
financial instruments will fluctuate because of changes in foreign exchange rates. Exchange rate
fluctuations may affect the costs that the Corporation incurs in its operations. There has been no
change in the Corporation’s objectives and policies for managing this risk during the three and
nine months ended September 30, 2014.
The Corporation has not hedged its exposure to foreign currency exchange risk.
The table below highlights the net assets denominated in foreign currencies:
Canadian dollar
CFA Francs
Other currencies
September 30,
2014
December 31,
2013
$
$
$
(iv)
816
25,109
(3,035)
22,890
$
3,153
15,460
4,433
23,046
Interest rate risk
Interest rate risk is the risk that future cash flows from, or the fair values of, the Corporation’s
financial instruments will fluctuate because of changes in market interest rates. The Corporation
is exposed to interest rate risk primarily on its long-term debt. Since marketable securities and
government treasury securities held as loans are short term in nature and are usually held to
maturity, there is minimal fair value sensitivity to changes in interest rates,. The Corporation
continually monitors its exposure to interest rates and is comfortable with its exposure given the
relatively low short-term US interest rates and LIBOR.
(v)
Price risk
Price risk is the risk that future cash flows primarily from gold sales, or the fair value of the
Corporation’s financial instruments, will fluctuate because of changes in market prices.
Profitability of the Corporation depends on metal prices, primarily gold. Metal prices are affected
by numerous factors such as the sale or purchase of gold by various central banks and financial
institutions, interest rates, exchange rates, inflation or deflation, fluctuations in the value of the US
dollar and foreign currencies, global and regional supply and demand, and the political and
economic conditions of major producing countries throughout the world.
The Corporation is exposed to other price risk including equity price risk in trading its marketable
securities and unfavorable market conditions could result in dispositions of marketable securities
at less than favorable prices. Additionally, the Corporation marks its investments to market at
each reporting period. This process could result in write-downs of the Corporation’s investments
over one or more reporting periods, particularly during periods of declining resource equity
markets.
32 | P a g e
ENDEAVOUR MINING CORPORATION
Management’s Discussion and Analysis of
Results of Operations and Financial Condition
For the Three and Nine Months ended September 30, 2014
CONTROLS AND PROCEDURES
Disclosure controls and procedures
Disclosure controls and procedures are designed to provide reasonable assurance that all relevant
information is gathered and reported on a timely basis to senior management, including the Chief
Executive Officer (CEO) and the Chief Financial Officer (CFO), so that appropriate decisions can be
made regarding public disclosure. As at the end of and for the year ended December 31, 2013,
management evaluated the effectiveness of the Corporation’s disclosure controls and procedures as
required by Canadian Securities Law.
Based on that evaluation, the CEO and CFO concluded that as of December 31, 2013, the disclosure
controls and procedures were effective in providing reasonable assurance that information required to be
disclosed in the Corporation’s annual and interim filings (as such terms are defined under National
Instrument 52-109 Certification of Disclosure in Issuers’ Annual and Interim Filings) and other reports filed
or submitted under Canadian securities law is recorded, processed, summarized and reported within the
time periods specified by those laws, and that material information is accumulated and communicated to
management including the CEO and CFO as appropriate to allow timely decisions regarding required
disclosure.
Internal controls over financial reporting
The Corporation’s management, with the participation of its CEO and CFO, is responsible for establishing
and maintaining adequate internal controls over financial reporting. Under the supervision of the CFO,
the Corporation’s internal controls over financial reporting are designed to provide reasonable assurance
regarding the reliability of financial reporting and the preparation of financial statements for external
purposes in accordance with IFRS.
All internal control systems, no matter how well designed, have inherent limitations. Therefore, even
those systems determined to be effective can provide only reasonable assurance with respect to financial
statement preparation and presentation. As at December 31, 2013, management evaluated the
effectiveness of the Corporation’s internal control over financial reporting as required by Canadian
securities laws.
Based on that evaluation, the CEO and CFO have concluded that, as at December 31, 2013, the internal
controls over financial reporting were effective and able to provide reasonable assurance regarding the
reliability of financial reporting and the preparation of financial statements for external purposes in
accordance with IFRS.
There have been no material changes in the Corporation’s internal controls over financial reporting since
the year ended December 31, 2013 that have materially affected, or are reasonably likely to materially
affect, the Corporation’s internal controls over financial reporting.
Additional information relating to the Corporation is available on the Corporation’s web site at
www.endeavourmining.com and in the Corporation’s Annual Information Form for the year ended
December 31, 2013 on SEDAR at www.sedar.com.
33 | P a g e
ENDEAVOUR MINING CORPORATION
Management’s Discussion and Analysis of
Results of Operations and Financial Condition
For the Three and Nine Months ended September 30, 2014
CAUTIONARY NOTE REGARDING FORWARD-LOOKING STATEMENTS
Certain statements in this MD&A and certain information incorporated herein by reference constitute
forward-looking statements. Forward-looking statements include, but are not limited to, statements with
respect to the Corporation’s plans or future financial or operating performance, the estimation of mineral
reserves and resources, the realization of mineral reserve estimates, conclusions of economic
assessments of projects, the timing and amount of estimated future production, costs of future production,
future capital expenditures, costs and timing of the development of new deposits, success of exploration
activities, permitting time lines, requirements for additional capital, sources and timing of additional
financing, realization of unused tax benefits and future outcome of legal and tax matters. Generally, these
forward-looking statements can be identified by the use of forward-looking terminology such as “plans”,
“expects” or “does not expect”, “is expected”, “budget”, “scheduled”, “estimates”, “forecasts”, “intends”,
“anticipates” or “does not anticipate”, “will continue” or “believes”, or variations of such words and phrases
or state that certain actions, events or results “may”, “could”, “would”, “might” or “will be taken”, “occur” or
“be achieved”. The material factors or assumptions used to develop material forward-looking statements
are disclosed throughout this document.
Forward-looking statements, while based on management’s best estimates and assumptions, are subject
to known and unknown risks, uncertainties and other factors that may cause the actual results, level of
activity, performance or achievements of Endeavour to be materially different from those expressed or
implied by such forward-looking statements, including but not limited to: risks related to the successful
integration of acquisitions; risks related to international operations; risks related to joint venture
operations; risks related to general economic conditions and credit availability, actual results of current
exploration activities, unanticipated reclamation expenses; changes in project parameters as plans
continue to be refined; fluctuations in prices of metals including gold; fluctuations in foreign currency
exchange rates, increases in market prices of mining consumables, possible variations in ore reserves,
grade or recovery rates; failure of plant, equipment or processes to operate as anticipated; accidents,
labour disputes, title disputes, claims and limitations on insurance coverage and other risks of the mining
industry; delays in obtaining governmental approvals or financing or in the completion of development or
construction activities, changes in national and local government regulation of mining operations, tax
rules and regulations, and political and economic developments in countries in which the Corporation
operates, actual resolutions of legal and tax matters, as well as those factors discussed in the section
entitled “Description of the Business – Risk Factors” in Endeavour’s annual information form for the year
ended December 31, 2013, available on SEDAR at www.sedar.com. Although Endeavour has attempted
to identify important factors that could cause actual results to differ materially from those contained in
forward-looking statements, there may be other factors that cause results not to be as anticipated,
estimated or intended. There can be no assurance that such statements will prove to be accurate, as
actual results and future events could differ materially from those anticipated in such statements.
Accordingly, readers should not place undue reliance on forward-looking statements. The Corporation’s
management reviews periodically information reflected in forward-looking statements. The Corporation
has and continues to disclose in its Management’s Discussion and Analysis and other publicly filed
documents, changes to material factors or assumptions underlying the forward-looking statements and to
the validity of the statements themselves, in the period the changes occur.
CAUTIONARY NOTE REGARDING RESERVES AND RESOURCES
Readers should refer to the annual information form of Endeavour for the year ended December 31, 2013
and other continuous disclosure documents filed by Endeavour available at www.sedar.com, for further
information on mineral reserves and resources, which is subject to the qualifications and notes set forth
therein.
34 | P a g e
ENDEAVOUR MINING CORPORATION
Condensed Interim Consolidated Statements of Financial Position
(Expressed in Thousands of United States Dollars)
(Unaudited)
September 30,
2014
ASSETS
Current
Cash
Cash - restricted (Note 3)
Marketable securities
Trade and other receivables
Income taxes receivable
Inventories (Note 4)
Prepaid expenses and other
Current portion of derivative financial asset (Note 8)
$
Mining interests (Notes 5)
Long-term receivable
Deferred income taxes
Promissory note and other assets
Derivative financial asset (Note 8)
$
LIABILITIES
Current
Trade and other payables
Current portion of finance lease obligations (Note 6)
Current portion of derivative financial liabilities (Note 8)
Income taxes payable (Note 12)
Finance lease obligations (Note 6)
Long-term debt (Note 7)
Derivative financial liabilities (Note 8)
Provisions
Deferred and performance share unit liability (Note 9)
Deferred income taxes
EQUITY
Share capital (Note 9)
Equity reserve
Retained earnings
Equity attributable to shareholders
of the Corporation
Non-controlling interests (Note 10)
Total equity
$
December 31,
2013
55,358
4,517
1,195
53,437
116
97,206
20,072
56
231,957
73,324
4,517
1,731
38,662
218
62,354
24,251
1,658
206,715
1,033,198
4,274
15,583
9,123
1,294,135
1,037,249
4,274
15,328
10,197
230
1,273,993
$
98,492
2,938
7,729
9,175
118,334
94,180
1,148
8,850
12,214
116,392
12,275
289,923
6,929
29,759
572
53,227
511,019
70
286,855
12,019
28,315
152
58,684
502,487
991,569
39,550
(286,602)
991,320
39,265
(293,528)
744,517
38,599
783,116
1,294,135
$
737,057
34,449
771,506
1,273,993
COMMITMENTS AND CONTINGENCIES (NOTE 16)
Approved by the Board: November 3, 2014
"Neil Woodyer" Director
"Wayne McManus" Director
The accompanying notes are an integral part of these condensed interim consolidated financial statements
35 | P a g e
ENDEAVOUR MINING CORPORATION
Condensed Interim Consolidated Statements of Comprehensive Earnings (Loss)
(Expressed in Thousands of United States Dollars)
(Unaudited)
Three months ended September 30, Nine months ended September 30,
2014
2013
2014
2013
Revenues
Gold revenue
$
145,223
Cost of sales
Operating expenses
Depreciation and depletion
Royalties
Earnings from mine operations
95,872
27,278
6,817
15,256
Corporate costs
Impairment of mining interests and goodwill
Share-based payments (Note 9 (c))
Exploration
Earnings (loss) earnings from operations
4,120
487
323
10,326
Other income (expense)
Gains (losses) on financial instruments (Note 11)
Finance costs
Other income (expense)
4,724
(7,557)
(2,093)
$
121,054
$
$
339,082
284,924
67,628
21,650
61,630
219,827
70,038
18,315
30,902
14,220
929
1,215
45,266
13,778
432,307
4,172
3,194
(422,549)
(14,763)
(3,932)
15,504
(10,302)
(21,261)
(1,107)
34,522
(8,609)
6,035
(4,926)
(3,191)
(32,670)
31,948
5,400
(1,735)
12,596
(390,601)
(1,665)
(1,679)
(3,148)
(12,504)
(6,351)
5,712
(8,170)
113,282
Net earnings (loss) and total comprehensive earnings (loss)
2,056
(17,387)
11,957
(285,489)
Attributable to:
Shareholders of Endeavour Mining Corporation
Non-controlling interests (Note 10)
1,859
197
(15,266)
(2,121)
6,926
5,031
(257,737)
(27,752)
Net earnings (loss) and total comprehensive earnings (loss) $
2,056
$
(17,387)
$
11,957
$
(285,489)
0.00
0.00
$
$
(0.04)
(0.04)
$
$
0.02
0.02
$
$
(0.62)
(0.62)
Earnings (loss) earnings before taxes
Current income tax expense
Deferred income tax (expense) recovery
Net earnings (loss) per share (Note 9 (d))
Basic earnings (loss) per share
Diluted earnings (loss) per share
$
$
85,440
21,779
6,600
7,235
435,832
3,917
756 T
1,106
1,456
The accompanying notes are an integral part of these condensed interim consolidated financial statements
36 | P a g e
ENDEAVOUR MINING CORPORATION
Condensed Interim Consolidated Statements of Cash Flows
(Expressed in Thousands of United States Dollars)
(Unaudited)
Three months ended September 30, Nine months ended September 30,
2014
2013
2014
2013
Operating Activities
Earnings (loss) before taxes
Adjustments for:
Depreciation and depletion
Impairment of mining interests and goodwill
Accretion of reclamation and other closure
Amortization of financing costs
Loss on marketable securities
Imputed interest on promissory note
Share-based payments
Unrealized (gain) loss on derivative financial instruments
Realized (gain) loss on derivative financial instruments
Loss on sale and write-down of gold bullion
Loss (gain) on sale of joint venture and subsidiaries
Loss on associates, net of taxes
Interest expense
$
5,400
$
(1,735)
$
12,596
$
(390,601)
27,278
481
1,071
1,074
(460)
487
(10,925)
2,610
2,093
3,697
21,779
140
686
137
(601)
756
44,211
(29,259)
(15,504)
2,661
67,628
1,444
3,177
972
(1,379)
929
(4,380)
10,189
1,107
10,568
70,038
432,307
450
686
6,281
(1,807)
4,172
(12,385)
(29,259)
7,551
(15,504)
1,943
5,779
Income and other taxes paid
Operating cash flows before non-cash working capital
(1,441)
31,365
(4,002)
19,270
(8,404)
94,447
(14,542)
65,110
Changes in non-cash working capital:
Trade and other receivables
Prepaid expenses and other
Inventories
Trade and other payables
Long-term receivable and other
Cash generated from operating activities
(1,060)
(7,597)
155
1,282
(1,558)
22,587
(4,801)
(3,872)
13,764
(4,352)
5,107
25,116
(17,322)
6,029
(14,107)
2,157
(1,783)
69,421
(3,631)
(13,483)
20,232
(18,708)
6,051
55,571
(24,350)
3,381
1,000
(19,969)
(50,346)
54
703
3,265
(46,324)
(74,162)
(436)
3,381
1,288
(69,929)
(165,774)
894
43,696
3,317
(117,867)
(2,610)
(380)
(846)
(3,836)
6
100,000
(15,415)
(3,481)
(1,248)
(1,213)
(318)
78,331
73
(10,189)
(881)
2,035
(7,184)
(1,281)
(17,427)
2,541
100,000
(15,415)
(3,481)
(1,248)
(4,739)
(1,571)
76,087
(515)
42
(31)
(341)
(1,733)
57,091
55,358
57,164
62,188
119,351
Investing Activities
Expenditures and prepayments on mining interests
Cash flows from sale and disposal of marketable securities
Proceeds from sale of gold bullion, assets held for sale and subsidiaries
Proceeds from distribution of promissory note
Proceeds from insurance and disposal of mining interests
Cash (used in) investing activities
Financing Activities
Received from the issue of common shares
Settlement of gold hedge program (Note 8)
Proceeds from long term debt
Payment of financing and other fees
Purchase of gold put options
Dividends paid to minority shareholders
Finance lease proceeds (Note 6)
Interest paid
Repayment of finance lease obligation
Cash (used in) generated from financing activities
Effect of exchange rate changes on cash
Increase (decrease) in cash
Cash, beginning of period
Cash, end of period
$
$
$
(17,966)
73,324
55,358 $
13,449
105,902
119,351
The accompanying notes are an integral part of these condensed interim consolidated financial statements
37 | P a g e
ENDEAVOUR MINING CORPORATION
Condensed Interim Consolidated Statements of Changes in Equity
(Expressed in Thousands of United States Dollars)
(Unaudited)
At January 1, 2013
Exchangeable shares exchanged into
common shares
Shares issued to purchase concessions
Share based payments
Dividends
Net loss and total comprehensive loss
At September 30, 2013
At January 1, 2014
Exchangeable shares exchanged into
common shares
Share options exercised
Share based payments
Dividends (Note 10)
Net earnings and total comprehensive earnings
At September 30, 2014
Share Capital
Additional
Number of
Total
NonNumber of
Par
Par
Additional Paid Total Number of Total Share
Equity
Retained Attributable to Controlling
Paid
Exchangeable
Common Shares Value
Value
in Capital
Shares
Capital
Reserve
Earnings Shareholders Interests
in Capital
Shares
391,355,765 $ 3,908 $ 931,410
19,366,979 $
194 $
49,322
410,722,744 $ 984,834 $ 38,677 $ 38,928 $ 1,062,439 $ 74,956
Total
1,137,395
18,653,997
187
1,776,159
18
411,785,921 $ 4,113 $
47,507
5,017
983,934
(18,653,997)
712,982 $
(187)
7 $
(47,507)
1,815
1,776,159
412,498,903 $
5,035
989,869 $
(2,494)
3,896
(257,737)
40,079 $ (218,809) $
2,541
2,541
3,896
3,896
(1,248.49)
(1,248)
(257,737)
(27,752)
(285,489)
811,139 $ 45,955 $ 857,094
412,341,795 $ 4,118 $
985,409
701,498 $
7 $
1,786
413,043,293 $
991,320 $
39,265 $ (293,528) $
737,057 $ 34,449
771,506
34,839
100,375
1
412,477,009 $ 4,119 $
89
248
985,746
(34,839)
666,659 $
7 $
(89)
1,697
100,375
413,143,668 $
249
991,569 $
(176)
461
6,926
39,550 $ (286,602) $
73
461
(881)
6,926
5,031
744,517 $ 38,599 $
73
461
(881)
11,957
783,116
-
The accompanying notes are an integral part of these condensed interim consolidated financial statements
38 | P a g e
ENDEAVOUR MINING CORPORATION
Notes to the Unaudited Condensed Interim Consolidated Financial Statements
(Expressed in Thousands of United States Dollars, except per share amounts)
1.
DESCRIPTION OF BUSINESS AND NATURE OF OPERATIONS
Endeavour Mining Corporation (“Endeavour” or the “Corporation”) is a publicly listed gold mining company that
operates four mines in West Africa in addition to having project development and exploration
assets. Endeavour is focused on effectively managing its existing assets to maximize cash flows as well as
pursuing organic and strategic growth opportunities that benefit from its management and operational
expertise.
Endeavour’s corporate office is in Vancouver, Canada and its shares are listed on the Toronto Stock Exchange
(“TSX”) (symbol EDV) and the Australian Securities Exchange (“ASX”) (symbol EVR) and quoted in the United
States on the OTCQX International under the symbol ‘EDVMF’. The Corporation is incorporated in the Cayman
Islands and its registered office is located at 190 Elgin Avenue, George Town, Grand Cayman, Cayman Islands.
2.
BASIS OF PRESENTATION AND SIGNIFICANT ACCOUNTING POLICIES
(a)
Statement of compliance
These condensed interim consolidated financial statements have been prepared in accordance with
International Accounting Standards (“IAS”) 34, Interim Financial Reporting, using the accounting
policies consistent with International Financial Reporting Standards (“IFRS”) as issued by the
International Accounting Standards Boards.
These condensed interim consolidated financial statements should be read in conjunction with the
most recently issued annual consolidated financial statements of the Corporation, which include
information necessary or useful to understanding the Corporation’s business and financial statement
presentation. In particular, the Corporation’s significant accounting policies were presented as Note 2
to the consolidated financial statements for the fiscal year ended December 31, 2013, and have been
consistently applied in the preparation of these interim financial statements, except as noted below.
(b)
Basis of preparation
These condensed interim consolidated financial statements have been prepared on the historical cost
basis, except certain financial instruments that are measured at revalued amounts or fair value at the
end of each reporting period, as explained in the accounting policies below. The Corporation’s
accounting policies have been applied consistently in preparing these condensed interim consolidated
financial statements; with the exception of certain comparative figures that have been adjusted to
correct the presentation of revenue and royalties to a gross basis. In 2013, the Corporation had netted
royalties against revenues and is now presenting gross revenues of $121.1 million and $339.1 million
and royalties of $6.6 million and $18.3 million for the three and nine months ended September 30,
2013, comparative statements of comprehensive earnings, respectively. The Company has
presented, for the three and nine months ended September 30, 2013, respectively, its loss on the sale
of gold bullion (nil and $5.5 million), write-down of gold bullion ($nil and $2.1 million), write down of
investment in associate on reclassification to asset held for sale ($nil and $0.9 million), losses related
to Endeavour Capital (nil and $1.1 million, in total), gain on sale of a joint venture ($13.4 million and
$13.4 million), and gain on sale of subsidiaries ($2.1 million and $2.1 million), as Other Income
(Expense). There is no net impact on the consolidated statement of comprehensive earnings or
earnings from mine operations and no impact on the consolidated statements of financial position, the
consolidated statements of cash flows or basic or diluted earnings per share in 2013.
39 | P a g e
ENDEAVOUR MINING CORPORATION
Notes to the Unaudited Condensed Interim Consolidated Financial Statements
(Expressed in Thousands of United States Dollars, except per share amounts)
(c)
Commencement of commercial production
Prior to a mine being capable of operating at levels intended by management, costs incurred are
capitalized as part of the costs of related mining properties and proceeds from mineral sales are offset
against costs capitalized. Commercial production at the Agbaou Mine was declared on January 27,
2014 (accounting for commercial production commenced on February 1, 2014).
Commercial production is deemed to have commenced when a mining interest is capable of operating
at levels intended by management. This is achieved when management determines that the
operational commissioning of major mine and plant components is complete, operating results are
being achieved consistently for a period of time and that there are indications that these operating
results will continue.
The Corporation determines commencement of commercial production based on the following factors:
• All major capital expenditures to bring the mine to the condition necessary for it to be capable
for operating in the manner intended by management have been completed;
• The completion of a reasonable period of testing of the mine plant and equipment;
• The mine or mill has reached a pre-determined percentage of design capacity; and
• The ability to sustain ongoing production of ore.
The list is not exhaustive and each specific circumstance is taken into account before making the
decision.
(d)
Capitalization of waste in open pit operations
Capitalization of waste stripping requires the Corporation to make judgments and estimates in determining
the amounts to be capitalized. In open pit mining operations, it is necessary to incur costs to remove
overburden and other mine waste materials in order to access the ore body (“stripping costs”). During the
development of a mine, stripping costs are capitalized and included in the carrying amount of the related
mining property and depleted over the productive life of the mine using the unit-of-production method.
During the production phase of a mine, stripping costs incurred to provide access to sources of reserves
that will be produced in future periods that would not have otherwise been accessible are capitalized and
included in the carrying amount of the related mining property. Stripping costs incurred and capitalized
during the production phase are depleted using the unit-of-production method over the reserves and a
portion of resources that directly benefit from the specific stripping activity. Costs incurred for regular waste
removal that do not give rise to future economic benefits are considered as costs of sales and included in
operating expenses.
(e)
Share-based payment arrangements
Performance share units (“PSUs”) can be settled in cash or, upon shareholder approval, in shares of
the Corporation. The fair value of the estimated number of PSUs that will eventually vest, determined
at the date of grant, is recognized as share-based compensation expense over the vesting period,
with a corresponding amount recorded as a liability. Until the liability is settled, the fair value of the
PSUs is re-measured at the end of each reporting period and at the date of settlement, with changes
in fair value recognized as share-based compensation expense or recovery over the vesting period.
The fair value of the PSUs is estimated using the market value of the underlying shares at the date of
grant and at the end of each reporting period.
40 | P a g e
ENDEAVOUR MINING CORPORATION
Notes to the Unaudited Condensed Interim Consolidated Financial Statements
(Expressed in Thousands of United States Dollars, except per share amounts)
(f)
Newly adopted accounting standards
The following standards became effective for annual periods beginning on or after January 1, 2014,
with earlier application permitted. The Corporation adopted these standards and they did not have a
material impact on its consolidated financial statements.
•
•
(g)
IAS 32, Offsetting Financial Assets and Financial Liabilities (Amendments to IAS 32): On
December 16, 2011, the IASB published amendments to IAS 32, Financial Instruments:
Presentation to clarify the application of the offsetting requirements. The Corporation adopted
this standard as of January 1, 2014, and determined its impact not to be significant.
IFRIC 21 Levies: In May 2013, the IASB issued IFRIC 21 on the accounting for levies imposed
by governments. The Corporation adopted this standard as of January 1, 2014, and
determined its impact not to be significant.
Accounting Standards issued but not yet effective
The Corporation has not early adopted the following new and revised Standards, Amendments and
Interpretations that have been issued but are not yet effective. The Corporation is currently assessing
the impact they will have on the consolidated financial statements.
3.
•
IFRS 15, Revenue from Contracts with Customers: IFRS 15 introduces a new framework for
determining the nature, amount, timing and uncertainty of revenues and cash flows arising
from a contract with a customer. The standard is effective for annual period beginning on or
after January 1, 2017, with early adoption permitted. The Corporation is currently evaluating
the potential impact of the new standard on its consolidated financial statements.
•
IFRS 9, Financial Instruments: IFRS 9 introduces the new requirements for the classification,
measurement and de-recognition of financial assets and financial liabilities. Specifically, IFRS
9 requires all recognized financial assets that are within the scope of IAS 39 Financial
Instruments: Recognition and Measurement to be subsequently measured at amortized cost
or fair value, and all financial liabilities classified as subsequently measured at amortized cost
except for financial liabilities measured at fair value through profit and loss. In July 2014, the
IASB issued the final version of IFRS 9 Financial Instruments bringing together the
classification and measurement, impairment and hedge accounting phases of the IASB’s
project to replace IAS 39 Financial Instruments: Recognition and Measurement. The
mandatory effective date of IFRS 9 would be annual periods beginning on or after January 1,
2018, with early adoption permitted. The Company is currently assessing the impact of
adopting IFRS 9 on its consolidated financial statements.
CASH - RESTRICTED
The Corporation has a facility agreement that provides a bank guarantee to enable the Corporation to fulfill
certain reclamation obligations in respect of disturbed mining lands at its operations. Under the guarantee the
Corporation has provided $3.3 million in cash collateral plus $1.2 million by way of security to satisfy the
mandated requirements, comprising its restricted cash balance of $4.5 million.
41 | P a g e
ENDEAVOUR MINING CORPORATION
Notes to the Unaudited Condensed Interim Consolidated Financial Statements
(Expressed in Thousands of United States Dollars, except per share amounts)
4.
INVENTORIES
September 30,
2014
Doré bars (1)
Gold in circuit (2)
Ore stockpiles (3)
Spare parts and supplies
$
$
(1)
(2)
(3)
5.
7,287
10,852
23,856
55,211
97,206
December 31,
2013
$
$
2,728
8,670
14,296
36,660
62,354
Includes a charge of $0.2 million to reduce the costs of inventory to net realizable value at the Tabakoto mine (December 31, 2013,
$nil) and $0.5 million at the Nzema mine (December 31, 2013, $nil).
Includes a charge of $0.2 million to reduce the costs of inventory to net realizable value at the Tabakoto mine (December 31, 2013,
$nil) and $1.4 million at the Nzema mine (December 31, 2013, $nil).
Includes a charge of $1.6 million to reduce the costs of inventory to net realizable value at the Tabakoto mine (December 31, 2013,
$11 million).
MINING INTERESTS
Mining Properties
Non
Assets under Plant and
Depletable depletable construction equipment
Cost
Balance as at January 1, 2014
Expenditures/additions
Transfer
Transfer to inventory recognized on commercial
production
Disposals
Balance as at September 30, 2014
(13,866)
(2,757)
$ 788,409 $ 409,303 $
-
Accumulated depreciation
Balance as at January 1, 2014
Depreciation/depletion
Depreciation charge captured in inventory
Balance as at September 30, 2014
$ 365,739 $ 126,383 $
36,286
3,397
$ 405,422 $ 126,383 $
-
Carrying amounts
At December 31, 2013
At September 30, 2014
$ 344,847 $ 464,344 $
$ 382,987 $ 282,920 $
$ 710,585 $ 590,728 $
31,982
8,318
62,465 (189,743)
910 $
(910)
Corporate
assets
382,286 $
47,099
128,188
1,867 $
-
Total
1,686,376
87,399
-
(316)
557,257 $
(4)
1,863 $
(13,866)
(3,077)
1,756,832
$
155,529 $
31,265
3,482
190,276 $
1,476 $
77
1,553 $
649,127
67,628
6,879
723,634
910 $
$
226,757 $
366,981 $
391 $
310 $
1,037,249
1,033,198
$
$
-
42 | P a g e
ENDEAVOUR MINING CORPORATION
Notes to the Unaudited Condensed Interim Consolidated Financial Statements
(Expressed in Thousands of United States Dollars, except per share amounts)
A summary by property of the carrying value is as follows:
Development Projects
Tabakoto
Mine
Nzema
Mine
Youga
Mine
Agbaou
Mine1
Houndé
Project
Ouaré
Project
Assets
Exploration
Corporate
under
Properties construction assets
Cost
Balance as at January 1, 2014
Expenditures/additions
Transfer to inventory recognized on commercial
production
Disposals
Balance as at September 30, 2014
$ 589,699 $ 604,174 $ 161,936 $ 190,804 $
62,319
13,047
1,059
5,834
122,394 $
5,052
11,422 $
88
3,170 $
-
910 $
-
910
(13,866)
(27)
(2,757)
(289)
$ 652,901 $ 614,464 $ 162,995 $ 182,483 $
127,446 $
11,510 $
3,170 $
(910)
$
Accumulated depreciation
Balance as at January 1, 2014
Depreciation/depletion
Depreciation charge captured in inventory
Balance as at September 30, 2014
106,429
418,234
115,944
27,310
13,030
10,494
16,717
2,654
702
729
2,794
$ 136,393 $ 431,966 $ 127,167 $ 19,511 $
-
$
3,874
3,874 $
3,170
3,170 $
Carrying amounts
At December 31, 2013
At September 30, 2014
$ 483,270 $ 185,940 $ 45,991 $ 190,805 $
$ 516,508 $ 182,498 $ 35,828 $ 162,972 $
122,394 $
127,446 $
7,548 $
7,636 $
1
-
$
$
1,867 $
-
1,686,376
87,399
(4)
1,863 $
(13,866)
(3,077)
1,756,832
$
1,476
77
1,553 $
649,127
67,628
6,879
723,634
910 $
$
391 $
310 $
1,037,249
1,033,198
-
-
Total
Commercial production at the Agbaou Mine was declared on January 27, 2014 (accounting for commercial production commenced on February 1, 2014).
43 | P a g e
ENDEAVOUR MINING CORPORATION
Notes to the Unaudited Condensed Interim Consolidated Financial Statements
(Expressed in Thousands of United States Dollars, except per share amounts)
6.
FINANCE LEASE OBLIGATIONS
On March 7, 2014, the Corporation’s Malian subsidiary entered into a five year, $18 million equipment lease
financing facility. The equipment lease was used to purchase a portion of the owner-operated mining equipment
for the Tabakoto and Segala underground developments. The lease terms have a fixed rate of 9.5% per annum to
amortize the principal and there exists a purchase option to buy the equipment outright at the end of the lease life
for 0.5% of cost. The equipment lease is treated as a finance lease.
The finance leases were composed of the following obligations:
Equipment lease obligations
Less: current portion
Long-term equipment lease obligations
September 30,
2014
December 31,
2013
$
$
15,213
(2,938)
12,275
$
Present value
of minimum lease payments
Minimum lease payments
September 30,
2014
$
Not later than one year
Later than one year and not later than five years
Less future finance charges
Present value of minimum lease payments
7.
$
December 31,
2013
4,246 $
14,621
18,867
(3,653)
15,214 $
$
1,218
(1,148)
70
September 30,
2014
1,198
70
1,268
(50)
1,218
$
$
2,938
12,275
15,213
15,213
December 31,
2013
$
$
1,148
70
1,218
1,218
LONG-TERM DEBT
Corporate loan facility (a)
Deferred financing costs (a)
Corporate loan facility
Mali Government interest bearing loan (b)
Total debt
(a)
September 30,
2014
December 31,
2013
$
$
300,000
(10,634)
289,366
557
289,923
300,000
(13,811)
286,189
666
286,855
On July 24, 2013, the Corporation signed a $350 million amended senior secured revolving corporate
loan facility (the “Facility”) with UniCredit Bank AG, BNP, Paribas, ING Bank NV, Société Générale
and Deutsche Bank AG. The full $350 million is available for general corporate purposes. During the
second quarter of 2014, the lenders made the remaining $50 million of the Facility available for general
corporate purposes and it is no longer subject to conditions precedent. The Facility is secured by
shares of Endeavour’s material gold mining subsidiaries and certain material assets of those
subsidiaries.
44 | P a g e
ENDEAVOUR MINING CORPORATION
Notes to the Unaudited Condensed Interim Consolidated Financial Statements
(Expressed in Thousands of United States Dollars, except per share amounts)
The key terms of the Facility include:
•
•
•
(b)
8.
Maturity date is five years from signing, July 24, 2018, and the available Facility amount declines
with six equal semi-annual reductions of $58.3 million commencing January 1, 2016;
The Facility requires standard corporate financial covenants, including:
o Interest Cover shall not be less than 3 to 1, calculated on a rolling 12 month basis;
o Net Debt to EBITDA shall not exceed 3.25 times, calculated on a rolling 12 month basis;
o Minimum tangible net worth of $600 million; and
Interest is based on LIBOR plus a margin ranging between 3.75% and 5.5% per annum (sliding
scale based on the actual Net Debt to EBITDA ratio).
The Corporation, through its Malian subsidiaries, carries a liability payable to the Government of Mali
in relation to their 20% ownership of Segala Mining Co S.A. The balance of this liability at September
30, 2014 is $0.6 million or CFA 280.5 million (December 31, 2013, was $0.7 million or CFA 371.1
million), including accrued interest. This loan bears an interest rate at LIBOR plus 2%, and is calculated
semi-annually. This loan will be paid with priority over shareholder dividends from the Malian
subsidiaries.
DERIVATIVE FINANCIAL INSTRUMENTS
Derivative financial assets
On July 11, 2013, the Corporation purchased, for $3.5 million, 54,000 ounces of gold put options at a strike
price of $1,150 with eighteen equal monthly settlements from August 2013 to January 2015. This period
corresponds to the higher capital expenditure timeframe while the Agbaou mine construction and ramp up was
being completed and the Segala underground mine at Tabakoto is being brought into commercial production.
As at September 30, 2014, 12,000 ounces (9,000 in 2014 and 3,000 in 2015) of gold put options remain
outstanding with a fair value of $0.06 million (December 31, 2013, $1.9 million). During the nine-month period,
27,000 ounces of gold put options expired, and an unrealized loss of $1.8 million was incurred on the mark to
market of the outstanding put options ($2.2M in 2013).
Derivative financial liabilities
The following table summarizes the derivative financial liabilities:
September 30,
2014
Gold price protection programs (a)
Less: current portion
Derivative financial liabilities
$
$
December 31,
2013
14,658 $
(7,729)
6,929 $
20,869
(8,850)
12,019
45 | P a g e
ENDEAVOUR MINING CORPORATION
Notes to the Unaudited Condensed Interim Consolidated Financial Statements
(Expressed in Thousands of United States Dollars, except per share amounts)
The following table summarizes the gain (loss) on derivative financial liabilities that have been recognized
through the consolidated statements of comprehensive earnings (loss):
Three months ended September 30, Nine months ended September 30,
2014
2013
2014
2013
Realized (loss) gain - gold price
protection programs
Change in unrealized gain (loss)
gold price protection programs
Change in fair value of share purchase
warrants (b)
Total gain (loss) on the gold price protection
programs and share purchase warrants
(a)
$
(2,610) $
29,259
10,909
(42,196)
$
8,299
$
224
$
(12,713) $
(10,189) $
29,259
6,211
2,292
-
12,332
(3,978) $
43,883
Gold price protection programs
(i) Options
Prior to Endeavour’s acquisition, Avion sold twelve call options that entitle the buyer to purchase
36,396 ounces of gold (3,033 ounces per call option) at strike price of $900 over twelve
consecutive quarters from September 1, 2012 to June 1, 2015. In exchange, Avion received cash
consideration of $25.0 million.
The settlement of the call options are in cash as there is no exchange of physical gold. During
the three and nine months ended September 30, 2014, the Corporation settled 3,033 ounces and
9,099 ounces of gold resulting in a realized loss of $1.2 million and $3.6 million, respectively.
As at September 30, 2014, 9,099 ounces (3,033 ounces in 2014 and 6,066 ounces in 2015) of
gold call options remain outstanding with a fair value of $2.8 million (December 31, 2013, $5.3
million).
(ii) Forward contracts
Prior to Endeavour’s acquisition, Adamus implemented a gold price protection program as part of
the initial project financing of the Nzema Gold Mine. The gold price protection program consisted
of gold forward contracts initially covering 290,000 ounces at a forward price of $1,075 per ounce
and subsequently amended to $1,061 per ounce. The program required no cash or other margin.
On July 29, 2013 Endeavour re-distributed a portion of the 96,163 ounces of remaining forward
contracts to several new lenders. The amended strike price has increased from $1,061 per ounce
to a weighted average strike price $1,332 per ounce. On the close out of the former hedge under
the Nzema project financing, a $300 per ounce increase in the strike price gave rise to a
crystallized loss; this crystallized loss will be allocated and paid over the remaining hedge
deliveries, resulting in the net proceeds to be received of $1,032 per ounce ($1,332 per ounce
less the loss of $300 per ounce). Other terms and conditions remain the same.
The settlements of the forward contracts are in cash as there is no exchange of physical gold
between the Corporation and the buyer. During the three and nine months ended September 30,
46 | P a g e
ENDEAVOUR MINING CORPORATION
Notes to the Unaudited Condensed Interim Consolidated Financial Statements
(Expressed in Thousands of United States Dollars, except per share amounts)
2014, the Corporation settled 7,813 and 26,651 ounces of gold resulting in a realized loss of $ 1.4
million and $6.6 million, respectively.
As at September 30, 2014, 69,512 ounces (5,349 ounces in 2014, 32,000 in 2015 and 32,163 in
2016) of gold forward contracts remain outstanding with a fair value of $11.9 million (December
31, 2013, $15.6 million).
(b)
Share purchase warrants
The 32,487,501 Endeavour warrants with an exercise price of C$2.50 (Note 10(b)) expired on
February 24, 2014.
9.
SHARE CAPITAL
(a)
Voting shares
Authorized
1,000,000,000 voting shares of $0.01 par value
1,000,000,000 undesignated shares
(b)
Warrants
A summary of the changes in warrants is presented below:
Warrants
outstanding
At December 31, 2012
Exercised
At December 31, 2013
Expired
At September 30, 2014
(c)
33,031,891
(544,390)
32,487,501
(32,487,501)
-
Weighted average
exercise price (C$)
$
2.46
0.34
2.46
2.46
-
$
$
Share-based compensation
The following table summarizes the share-based compensation:
Three months ended September 30, Nine months ended September 30,
2013
2014
2013
2014
Amortization of option grants
Total expense recognized on grant and change in fair
value of DSUs
Total expense recognized on grant and change in fair
value of PSUs
Total share-based expense
$
$
$
$
335 $
25
127
487 $
672
$
84
756
461 $
341
$
127
929 $
3,896
276
4,172
.
47 | P a g e
ENDEAVOUR MINING CORPORATION
Notes to the Unaudited Condensed Interim Consolidated Financial Statements
(Expressed in Thousands of United States Dollars, except per share amounts)
(i)
Options
A summary of the changes in share options is presented below:
At December 31, 2012
Granted
Cancelled
Exercised
Expired
At December 31, 2013
Granted
Exercised
Expired
At September 30, 2014
Options
outstanding
Weighted average
exercise price
(C$)
25,874,818
4,214,969
(183,333)
(1,776,159)
(3,569,943)
24,560,352
7,155,000
(100,375)
(813,542)
30,801,435
2.46
2.26
2.26
1.42
3.29
2.38
0.93
0.80
2.00
2.06
$
$
On May 13, 2014, the Corporation issued 900,000 options with a strike price of $0.81 and a
fair value of $0.3 million, to be expensed over the 2-year vesting period. The options were
valued using the Black-Scholes option pricing model. Assumptions used were a dividend yield
of nil, expected volatility of 68.0%, risk free rate of 1.16% and expected life of 3 years.
On July 18, 2014, the Corporation issued 6,255,000 options with a strike price of $0.95 and a
fair value of $2.0 million, to be expensed over the 2-year vesting period. The options were
valued using the Black-Scholes option pricing model. Assumptions used were a dividend yield
of nil, expected volatility of 75.8%, risk free rate of 1.08% and expected life of 2 years.
The following table summarizes information about the outstanding and exercisable share options
outstanding as at September 30, 2014:
Weighted average
Exercisable exercise price (C$)
Weighted average
remaining
contractual life
Exercise
Prices (C$)
Outstanding
$0.80 - $1.50
$1.51 - $2.00
$2.01 - $2.50
$2.51 - $3.00
$3.01 - $4.00
$4.01 - $44.96
7,622,920
10,411,350
4,645,716
5,814,312
80,300
2,226,837
767,921 $
10,411,350
4,037,383
5,814,312
80,300
2,226,837
1.15
1.76
2.29
2.67
3.70
5.05
3.55 years
1.01 years
3.17 years
2.10 years
1.62 years
1.72 years
30,801,435
23,338,103
2.38
1.81 years
$
The Corporation has established a share option plan whereby the Corporation’s directors may
from time to time grant options to directors, employees or consultants. The maximum term of
any option is ten years. The exercise price of an option is not less than the volume weighted
average trading price of the shares traded on the exchange for the five trading days
immediately preceding the grant date. At September 30, 2014, there were 41,314,367
48 | P a g e
ENDEAVOUR MINING CORPORATION
Notes to the Unaudited Condensed Interim Consolidated Financial Statements
(Expressed in Thousands of United States Dollars, except per share amounts)
(December 31, 2013 – 41,304,329) options available for grant under the plan, of which
10,512,932 (December 31, 2013 – 16,743,977) are still available to be granted.
(ii)
Deferred share units
On January 26, 2013, the Corporation established a deferred share unit plan (“DSU”) for the
purposes of strengthening the alignment of interests between non-executive directors of the
Corporation and shareholders by linking a portion of the annual director compensation to the
future value of the Corporation’s common shares. Upon establishing the DSU plan for nonexecutive directors, the Corporation no longer grants options to non-executive directors.
The DSU allows each non-executive director to choose to receive, in the form of DSUs, all or
a percentage of the director’s fees, which would otherwise be payable in cash. Compensation
for serving on committees must be paid in the form of DSUs. The plan also provides for
discretionary grants of additional DSUs by the Board. Each DSU fully vests upon award, but
is distributed only when the director has ceased to be a member of the Board. Vested units
are settled in cash based on the common share price at that time.
In the nine months period ended September 30, 2014, 411,388 DSUs were granted and
53,333 DSUs were exercised.
At September 30, 2014, 695,049 (December 31, 2013 - 336,994) DSUs were held by
participating directors with a fair value of $0.4 million (December 31, 2013 – $0.2 million). The
fair value of the DSUs was recognized as share-based payments totaling $0.02 million and
$0.3 million for the three and nine months ended September 30, 2014 (a recovery of $0.1
million and expense of $0.3 million for the three and nine months ended September 30, 2013,
respectively) with a corresponding amount recorded as a deferred share unit liability in the
consolidated statement of financial position.
(iii)
Performance share units
In March 2014, following a comprehensive review of its executive compensation programs
and pay practices, the Corporation introduced a change in its long term incentive plan (“LTI
Plan”) to include a portion of performance-linked share unit awards (“PSUs”). The new PSU
program is intended to increase the pay mix in favour of long-term equity-based compensation
with 3 year cliff-vesting to serve as an employee retention mechanism. On July 18, 2014,
2,627,000 PSUs were granted under this LTI Plan to certain employees of the Corporation.
The fair value of the PSUs was recognized as share-based payment expense totaling $0.1
million for the three and nine months ended September 30, 2014 (2013: $nil), with a
corresponding amount recorded as a preferred share unit liability in the consolidated
statement of financial position.
(d)
Diluted earnings per share
The following table summarizes the stock options and share purchase warrants excluded from the
computation of diluted loss per share because the exercise prices exceeded the daily weighted
average market values of the common shares for the three and nine months ended September 30,
2014, of C$0.86 and C$0.81, respectively (C$0.68 and C$1.03 for the three and nine months ended
September 30, 2013).
49 | P a g e
ENDEAVOUR MINING CORPORATION
Notes to the Unaudited Condensed Interim Consolidated Financial Statements
(Expressed in Thousands of United States Dollars, except per share amounts)
Three months ended September 30,
2014
2013
Stock options
Share purchase warrants
28,877,450
-
30,719,030
32,487,501
Nine months ended September 30,
2014
2013
Stock options
Share purchase warrants
25,745,400
-
30,475,138
32,487,501
Diluted net earnings per share were calculated based on the following:
Three months ended September 30, Nine months ended September 30
2014
2013
2014
2013
Basic and diluted weighted average
number of shares outstanding
Effect of dilutive securities
Stock options
Share purchase warrants
Diluted weighted average number of
shares outstanding
10.
413,143,668
412,493,944
413,110,978
49,614
-
4,078
275,337
2,157
-
413,193,282
412,773,359
413,113,135
412,406,360
412,406,360
NON-CONTROLLING INTERESTS
The composition of the non-controlling interests is as follows:
Segala Mining
Corporation SA
(Tabakoto Mine)
At January 1, 2013
Net loss
Dividend distribution
At January 1, 2014
Net earnings (loss)
Dividend distribution
At September 30, 2014
$
$
41,204 $
(9,154)
32,050
(3,702)
28,348 $
Adamus
Resources
Limited
(Nzema Mine)
Burkina Mining
Company SA
(Youga Mine)
22,992 $
(26,615)
(3,623)
473
(3,150) $
Agbaou Gold
Operations SA
(Agbaou Mine)
10,760 $
(3,490)
(1,248)
6,022
1,329
(881)
6,470 $
Total
$ 74,956
(39,259)
(1,248)
34,449
5,031
6,931
(881)
6,931 $ 38,599
During 2013, Endeavour’s 90% owned Burkina Faso subsidiary, Burkina Mining Corporation, declared a $12.4
million dividend based on its 2012 results. The payment of the dividend resulted in a cash payment of $1.2
million (inclusive of withholding taxes) to the Burkina Faso Government.
50 | P a g e
ENDEAVOUR MINING CORPORATION
Notes to the Unaudited Condensed Interim Consolidated Financial Statements
(Expressed in Thousands of United States Dollars, except per share amounts)
During the period ended September 30, 2014, Burkina Mining Corporation declared an $8.8 million dividend
based on its 2013 results. The payment of the dividend resulted in a cash payment of $0.9 million (inclusive
of withholding taxes) to the Burkina Faso Government.
11.
GAINS (LOSSES) ON FINANCIAL INSTRUMENTS, NET
Gain (loss) on marketable securities
Imputed interest on promissory note
Interest income
Gain (loss) on derivative financial
assets (Note 8)
Gain (loss) on derivative financial
liabilities (Note 8)
Gain (loss) on foreign exchange
12.
Three months ended September 30,
2014
2013
Nine months ended September 30,
2014
2013
$
$
$
$
$
$
$
$
(1,074)
460
46
$
17
8,299
(3,024)
4,724
$
(137)
601
7
(972)
1,379
66
$
(6,281)
1,807
94
(2,239)
(1,831)
(2,239)
(12,713)
(282)
(14,763)
(3,978)
(4,966)
(10,302)
43,883
(2,742)
34,522
$
$
INCOME TAXES
The Corporation operates in numerous countries and, accordingly, it is subject to, and pays annual income
taxes under, the various income tax regimes in the countries in which it operates. From time to time the
Corporation is subject to a review of its income tax filings and in connection with such reviews, disputes can
arise with the taxing authorities over the interpretation or application of certain rules to the Corporation’s
business conducted within the country involved.
The Corporation’s Burkina Faso subsidiary, Burkina Mining Corporation SA (“BMC”), was audited by the
Direction Généralé Des Impots (“DGI”) for its fiscal taxation years December 31, 2010 and December 31,
2011, and received a final tax assessment amounting to approximately $7.5 million, a reduction from the initial
amount assessed of approximately $27.9 million. During the fourth quarter of 2013 the Corporation paid
installments totaling approximately $3.1 million towards the assessed amount. As at September 30, 2014, $3.4
million (December 31, 2013 - $4.4 million) of the remaining assessed amount has been accrued in the financial
statements and BMC and the DGI have agreed on a payment schedule, which will result in BMC paying
approximately $1.8 million in 2014 and $2.6 million in 2015. In the three and nine months period ended
September 30, 2014, BMC made a payment of $0.5 million and $1 million, respectively, in accordance with
the schedule.
13.
SEGMENTED INFORMATION
IFRS 8 requires operating segments to be identified on the basis of internal reports that are regularly reviewed
by the chief operating decision-maker to allocate resources to the segments, as disclosed in the table below,
and to assess their performance.
The following is an analysis of the Corporation’s revenue and results by reportable segment.
51 | P a g e
ENDEAVOUR MINING CORPORATION
Notes to the Unaudited Condensed Interim Consolidated Financial Statements
(Expressed in Thousands of United States Dollars, except per share amounts)
Three months ended September 30, 2014
Nzema
Mine
Ghana
Tabakoto
Mine
Mali
Revenue
Gold revenue
$
Youga
Mine
Burkina Faso
Agbaou
Mine
Côte d’Ivoire
Exploration
Non-Mining
37,614 $
31,050 $
23,385 $
53,174 $
-
Cost of sales
Operating expenses
Depreciation and depletion
Royalties
Earnings (loss) from mine operations
38,742
10,340
2,254
(13,722)
24,072
5,264
1,706
8
13,490
3,232
1,002
5,661
19,568
8,416
1,855
23,335
-
Corporate costs
Share-based payments
Exploration
Earnings (loss) from operations
(13,722)
-
5,661
23,335
(3,461)
(385)
-
516
(248)
(2,754)
80
(39)
-
(3,846)
(2,486)
41
(17,568)
(292)
(3,926)
(2,478)
(22)
2,389
Other income (expense)
Gains (losses) on financial instruments
Finance costs
Other income (expense)
Earnings (loss) before taxes
Current income taxes expense
Deferred income taxes (expense) recovery
Net earnings (loss) and total comprehensive
earnings (loss)
$
8
(21,786) $
(111) $
$
Total
-
$
145,223
$
26 $
$
(26)
95,872
27,278
6,817
15,256
323
(323)
4,120 $
487 $
$
(4,633)
4,120
487
323
10,326
47
(48)
-
(30)
661
7,572
(6,837)
-
4,724
(7,557)
(2,093)
(1)
631
5,702
(959)
499
23,334
(586)
308
-
(3,898)
(392)
(55)
5,400
(1,665)
(1,679)
5,242 $
22,748 $
308 $
(4,345) $
2,056
-
735
(4,926)
Three months ended September 30, 2013
Tabakoto
Mine
Mali
Revenue
Gold revenue
$
54,399
Nzema
Mine
Ghana
$
36,805
Youga
Mine
Burkina Faso
$
29,850
Exploration
$
-
Non-Mining
$
Total
$
-
121,054
Cost of sales
Operating expenses
Depreciation and depletion
Royalties
Earnings from mine operations
37,978
15,255
3,265
(2,099)
27,602
3,524
1,842
3,837
19,860
2,939
1,493
5,558
-
(61)
85,440
21,779
6,600
7,236
Corporate costs
Share-based payments
Exploration
Earnings (loss) from operations
(2,099)
3,837
5,558
1,106
(1,106)
3,917
756
(4,734)
3,917
756
1,106
1,456
4
15,504
15,508
(6,698)
(3,463)
(10,161)
(14,763)
(3,932)
15,504
(3,191)
14,402
(988)
(21)
(14,895)
3
-
(1,735)
(3,148)
(12,504)
(14,892) $
(17,387)
Other (expenses) income
Gains (losses) on financial instruments
Finance costs
Other income (expense)
Earnings (loss) before taxes
Current income recovery (taxes)
Deferred income recovery (taxes)
Net earnings (loss) and total
comprehensive earnings (loss)
$
388
(59)
329
(8,904)
(400)
(9,304)
447
(10)
437
(1,770)
223
1,999
(5,467)
(11,562)
5,995
(2,386)
(2,920)
452
$
(17,029) $
689
$
13,393
61
$
55 | P a g e
ENDEAVOUR MINING CORPORATION
Notes to the Unaudited Condensed Interim Consolidated Financial Statements
(Expressed in Thousands of United States Dollars, except per share amounts)
Nine months ended September 30, 2014
Tabakoto
Mine
Mali
Revenue
Gold revenue
$
Nzema
Mine
Ghana
128,452 $
Youga
Mine
Burkina Faso
114,331 $
Agbaou
Mine
Côte d’Ivoire
72,969 $
Exploration
Non-Mining
120,080 $
-
Cost of sales
Operating expenses
Depreciation and depletion
Royalties
Earnings (loss) from mine operations
114,366
27,310
7,686
(20,910)
76,485
13,030
6,351
18,465
41,723
10,493
3,275
17,478
52,350
16,718
4,338
46,674
-
Corporate costs
Impairment of mining interests and goodwill
Acquisition costs
Share-based payments
Exploration
Earnings (loss) from operations
(20,910)
18,465
17,478
46,674
(5,057)
(702)
(5,759)
278
(745)
(2,754)
(3,221)
302
(117)
185
(26,669)
(1,197)
5,729
15,244
(51)
40
(22,137) $
15,233 $
Other income (expense)
Gains (losses) on financial instruments
Finance costs
Other income (expense)
Earnings (loss) before taxes
Current income and other taxes (expense) reco
Deferred income taxes (expense) recovery
Net earnings (loss) and total comprehensive
earnings (loss)
$
$
Total
-
$
435,832
77
(77)
284,924
67,628
21,650
61,630
1,215
(1,215)
14,220
929
(15,226)
14,220
929
1,215
45,266
(76)
(145)
(221)
(781)
1,647
866
(4,968)
(19,552)
(24,520)
(10,302)
(21,261)
(1,107)
(32,670)
17,663
(3,838)
352
46,453
(478)
(349)
-
(39,746)
(1,265)
69
12,596
(6,351)
5,712
14,177 $
45,975 $
(349) $
(40,942) $
11,957
Nine months ended September 30, 2013
Tabakoto
Mine
Mali
Revenue
Gold revenue
$
Cost of sales
Operating expenses
Depreciation and depletion
Royalties
Earnings from mine operations
Corporate costs
Impairment of mining interests and goodwill
Share-based payments
Exploration
Earnings (loss) from operations
Other (expenses) income
Gains (losses) on financial instruments
Finance costs
Other income (expense)
Earnings (loss) before taxes
Current income (taxes) recovery
Deferred income recovery
Net earnings (loss) and total
comprehensive earnings (loss)
$
137,148
Nzema
Mine
Ghana
$
104,245
96,161
32,959
8,219
(191)
74,197
25,464
5,220
(636)
(191)
Youga
Mine
Burkina Faso
$
97,689
Exploration
$
-
Non-Mining
$
-
Total
$
339,082
49,469
11,437
4,876
31,907
-
386,868
(387,504)
38,396
(6,489)
7,043
3,194
(10,237)
13,778
4,172
(18,128)
13,778
432,307
4,172
3,194
(422,549)
(1,153)
(551)
27,418
(560)
(166)
(31)
(231)
-
8,654
(7,467)
34,522
(8,609)
(1,704)
26,858
(197)
(9,469)
(8,282)
6,035
31,948
(1,895)
(221)
4,561
(360,646)
101,416
(6,686)
(7,377)
5,853
5,036
(988)
1,450
(26,410)
416
2
(390,601)
(8,170)
113,282
(259,230) $
(8,210) $
5,498
(25,992) $
(285,489)
2,445
$
178
(178)
15,504
15,273
$
219,827
70,038
18,316
30,902
55 | P a g e
ENDEAVOUR MINING CORPORATION
Notes to the Unaudited Condensed Interim Consolidated Financial Statements
(Expressed in Thousands of United States Dollars, except per share amounts)
Segment revenue reported represents revenue generated from external customers. There were no intersegment sales during the three and nine months ended September 30, 2014 and 2013.
Geographical information
The Corporation operates in four principal geographical areas: Burkina Faso, Côte d’Ivoire, Ghana and Mali.
The Corporation’s revenue from continuing operations from external customers by location of operations is
presented above and information about its non-current assets by location is detailed below:
Non-current Assets
September 30,
2014
Burkina Faso
Côte d’Ivoire
Ghana
Mali
Other
$
$
170,910
162,972
198,081
520,782
9,434
1,062,179
December 31,
2013
$
$
175,933
190,805
201,268
488,454
10,818
1,067,278
Information about major customers
Each segment has only one customer which accounts for all of its revenues.
The Corporation is not economically dependent on a limited number of customers for the sale of gold because
gold can be sold through numerous commodity market traders worldwide.
Total assets and liabilities
September 30, 2014
Total
Total
assets
liabilities
Tabakoto Mine
Nzema Mine
Youga Mine
Agbaou Mine
Houndé Project
Ouaré Project
Exploration
Non-mining
$
$
14.
629,134
231,811
80,484
197,177
127,446
7,636
1,245
19,202
1,294,135
$
$
101,844
39,418
17,505
19,784
20,751
311,718
511,020
December 31, 2013
Total
Total
assets
liabilities
$
$
571,563
243,411
78,327
195,311
122,394
7,548
1,004
54,435
1,273,993
$
$
111,411
41,683
19,101
10,356
6,983
312,953
502,487
CAPITAL MANAGEMENT
The Corporation’s objectives of capital management are to safeguard the entity’s ability to support the
Corporation’s normal operating requirements on an ongoing basis, continue the development and exploration
of its mineral properties and support any expansionary plans.
55 | P a g e
ENDEAVOUR MINING CORPORATION
Notes to the Unaudited Condensed Interim Consolidated Financial Statements
(Expressed in Thousands of United States Dollars, except per share amounts)
In the management of capital, the Corporation includes the components of equity, short-term borrowings and
long-term debt, net of cash and cash equivalents, restricted cash and marketable securities.
Capital, as defined above, is summarized in the following table:
Equity
Current and long-term debt
September 30,
2014
December 31,
2013
$
$
Less:
Cash
Cash - restricted
Marketable securities
$
783,116
289,923
1,073,039
(55,358)
(4,517)
(1,195)
1,011,969
771,506
286,855
1,058,361
$
(73,324)
(4,517)
(1,731)
978,789
The Corporation manages its capital structure and makes adjustments to it in light of changes in its
economic environment and the risk characteristics of the Corporation’s assets. To effectively manage the
entity’s capital requirements, the Corporation has in place a planning, budgeting and forecasting process to
help determine the funds required to ensure the Corporation has the appropriate liquidity to meet its
operating and growth objectives.
15.
FINANCIAL INSTRUMENTS
Financial assets and liabilities
The Corporation’s financial instruments consist of cash, marketable securities, trade and other receivables,
promissory note and other assets, long-term receivable, derivative financial assets, trade and other payables,
derivative financial liabilities and current and long-term debt. The fair value of these financial instruments
approximates their carrying value, unless otherwise noted.
The Corporation has certain financial assets and liabilities that are held at fair value. The fair value hierarchy
establishes three levels to classify the inputs to valuation techniques to measure fair value:
Classification of financial assets and liabilities
Level 1 – quoted prices (unadjusted) in active markets for identical assets or liabilities;
Level 2 – inputs other than quoted prices included within level 1 that are observable for the asset
or liability, either directly (that is, as prices) or indirectly (that is, derived from prices); and
Level 3 – inputs for the asset or liability that are not based on observable market data (that is,
unobservable inputs).
55 | P a g e
ENDEAVOUR MINING CORPORATION
Notes to the Unaudited Condensed Interim Consolidated Financial Statements
(Expressed in Thousands of United States Dollars, except per share amounts)
At September 30, 2014, the levels in the fair value hierarchy into which the Corporation’s financial assets and
liabilities measured and recognized in the statement of financial position at fair value are categorized are as
follows:
September 30, 2014
Level 1
Input
Assets:
Cash
Cash - restricted
Marketable securities
Derivative financial asset
$ 55,358
4,517
1,089
$ 60,964
Liabilities:
Derivative financial liabilities
$
-
Level 2
Input
$
$
106
56
162
$
14,658
14,658
Level 3
Input
Aggregate
Fair Value
$
-
$ 55,358
4,517
1,195
56
$ 61,126
$
-
14,658
$ 14,658
$
At December 31, 2013, the levels in the fair value hierarchy into which the Corporation’s financial assets and
liabilities are measured and recognized in the statement of financial position at fair value are categorized as
follows:
December 31, 2013
Level 1
Input
Assets:
Cash
Cash - restricted
Marketable securities
Derivative financial asset
$ 73,324
4,517
1,552
$ 79,393
Liabilities:
Derivative financial liabilities
$
-
Level 2
Input
$
$
179
1,888
2,067
$
20,869
20,869
Level 3
Input
$
Aggregate
Fair Value
$
-
$ 73,324
4,517
1,731
1,888
$ 81,460
$
-
20,869
$ 20,869
There were no transfers between level 1 and 2 in the period.
Financial instrument risk exposure
The Corporation’s activities expose it to a variety of risks that may include credit risk, liquidity risk, currency
risk, interest rate risk and other price risks, including equity price risk. The Corporation examines the various
financial instrument risks to which it is exposed and assesses any impact and likelihood of those risks.
57 | P a g e
ENDEAVOUR MINING CORPORATION
Notes to the Unaudited Condensed Interim Consolidated Financial Statements
(Expressed in Thousands of United States Dollars, except per share amounts)
(i)
Credit risk
Credit risk is the risk that the counterparty to a financial instrument will cause a financial loss for the
Corporation by failing to discharge its obligations. There has been no change in the Corporation’s
objectives and policies for managing this risk in the three and nine months ended September 30, 2014.
The Corporation’s maximum exposure to credit risk is as follows:
Cash
Cash - restricted
Marketable securities
Trade and other receivables
Long-term receivable
Promissory note and other assets
Derivative financial asset
September 30,
2014
December 31,
2013
$
$
$
(ii)
55,358
4,517
1,195
53,437
4,274
9,123
56
127,960
73,324
4,517
1,731
38,662
4,274
10,197
1,888
134,593
$
Liquidity risk
Liquidity risk is the risk that the Corporation will encounter difficulty in meeting obligations associated
with its financial liabilities that are settled by delivering cash, physical gold or another financial asset.
The Corporation has a planning and budgeting process in place to help determine the funds required
to support the Corporation’s normal operating requirements.
The following table summarizes the contractual obligations at September 30, 2014:
Within 1
year
Trade and other payables
$
Long-term debt
Finance lease obligations
Minimum operating lease payments
Derivative financial liabilities
$
98,492 $
4,246
338
7,729
110,805 $
2 to 3
years
$
116,600
14,621
45
6,929
138,195 $
4 to 5
years
183,400
-
Over 5
years
Total
$
-
$
183,400 $
-
$
98,492
300,000
18,867
383
14,658
432,400
Market risk
(i)
Currency risk
Currency risk relates to the risk that the fair values or future cash flows of the Corporation’s financial
instruments will fluctuate because of changes in foreign exchange rates. Exchange rate fluctuations
may affect the costs that the Corporation incurs in its operations. There has been no change in the
Corporation’s objectives and policies for managing this risk during the three and nine months ended
September 30, 2014.
57 | P a g e
ENDEAVOUR MINING CORPORATION
Notes to the Unaudited Condensed Interim Consolidated Financial Statements
(Expressed in Thousands of United States Dollars, except per share amounts)
The Corporation has not hedged its exposure to foreign currency exchange risk.
The table below highlights the monetary net assets denominated in foreign currencies (in $US):
Canadian dollar
CFA Francs
Other currencies
September 30,
2014
December 31,
2013
$
$
$
(ii)
816
25,109
(3,035)
22,890
$
3,153
15,460
4,433
23,046
Interest rate risk
Interest rate risk is the risk that future cash flows from, or the fair values of, the Corporation’s financial
instruments will fluctuate because of changes in market interest rates. The Corporation is exposed to
interest rate risk primarily on its long-term debt. Since marketable securities and government treasury
securities held as loans are short term in nature and are usually held to maturity, there is minimal fair value
sensitivity to changes in interest rates,. The Corporation continually monitors its exposure to interest rates
and is comfortable with its exposure given the relatively low short-term US interest rates and LIBOR.
(iii)
Price risk
Price risk is the risk that the fair value or future cash flows of the Corporation’s financial instruments
will fluctuate because of changes in market prices. There has been no change in the Corporation’s
objectives and policies for managing this risk and no significant changes to the Corporation’s exposure
to price risk during the three and nine months ended September 30, 2014.
The Corporation is also exposed to other price risk or equity price risk in trading its marketable
securities and unfavorable market conditions could result in dispositions of marketable securities at
less than favorable prices.
16.
COMMITMENTS AND CONTINGENCIES
Contracts and Leases
(i)
The Corporation has commitments in place at all four of its mines for drill and blasting services, load
and haul services and supply of explosives and supply of hydrocarbon services.
(ii)
The Corporation has various contracts in place at Nzema mine to purchase higher grade ore from third
parties for processing that typically do not extend to more than one year.
(iii)
The Corporation is subject to operating and finance lease commitments in connection with the
purchase of mining equipment, light duty vehicles and workshop and rented office premises.
(iv)
The Corporation is, from time to time, involved in various claims, legal proceedings and complaints
arising in the ordinary course of business. The Corporation cannot reasonably predict the likelihood
or outcome of these actions. The Corporation does not believe that adverse decisions in any other
pending or threatened proceedings related to any matter, or any amount which may be required to be
58 | P a g e
ENDEAVOUR MINING CORPORATION
Notes to the Unaudited Condensed Interim Consolidated Financial Statements
(Expressed in Thousands of United States Dollars, except per share amounts)
(v)
paid by reason thereof, will have a material effect on the financial condition or future results of
operations.
(vi)
The Corporation’s mining and exploration activities are subject to various laws and regulations
governing the protection of the environment. These laws and regulations are continually changing and
are generally becoming more restrictive. The Corporation believes its operations are materially in
compliance with all applicable laws and regulations. The Corporation has made, and expects to make
in the future, expenditures to comply with such laws and regulations.
59 | P a g e

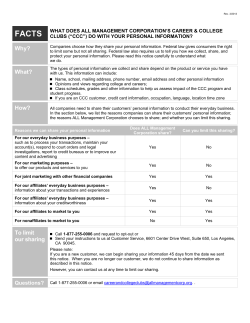


© Copyright 2026