
ASSESSMENT OF AMBIENT AIR QUALITY OF LUCKNOW CITY
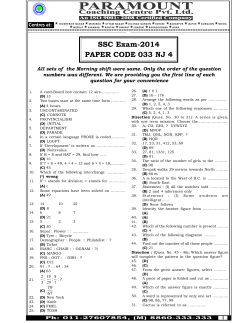
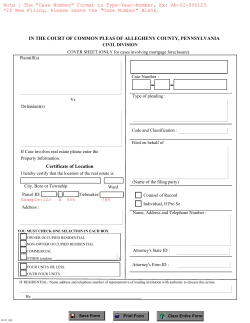
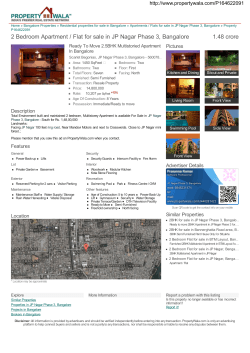
ASSESSMENT OF AMBIENT AIR QUALITY OF LUCKNOW CITY (POST- MONSOON 2014) FINDINGS OF A RANDOM SURVEY PRESENTED ON 49th IITR FOUNDATION DAY CSIR- INDIAN INSTITUTE OF TOXICOLOGY RESEARCH Mahatma Gandhi Marg, Lucknow – 226001 Web: http://www.iitrindia.org November, 2014 PERSONNEL Team Leader : Co-Team Leaders : Dr. S. C. Barman Dr. G. C. Kisku Er. A. H. Khan Other Participants : (Technical) Mr. Tajuddin Ahmed Mr. Pradeep Shukla Mr. Khalil Ahmed Other Participants (Project Fellows) : Ms. Pushpanjali Dubey Ms. Sukirti Singh Mr. Mohit Gupta Mr. Rohit Yadav i CONTENTS Salient Features of the Study 1 SUMMARY 2 1.1 INTRODUCTION 3 1.2 MONITORING LOCATIONS AND METHODOLOGY 7 1.3 RESULTS 1.3.1 Respirable Suspended Particulate Matter (RSPM) 1.3.2 Sulphur dioxide (SO2) 1.3.3 Oxides of Nitrogen (NOx) 1.3.4 Trace Metal (Ni and Pb) in Ambient Air 1.3.5 Noise 8 8 9 9 9 12 1.4 TRENDS OF AMBIENT AIR QUALITY IN LUCKNOW CITY 1.4.1 Respirable Suspended Particulate Matter 1.4.2 Sulphur dioxide (SO2) 1.4.3 Oxides of Nitrogen (NOx) 1.4.4 Noise Level 13 13 13 17 1.5 HEALTH EFFECTS OF AIR POLUTANTS 20 1.6 CONCLUSIONS 21 1.7 RECOMMENDATIONS 22 Acknowledgements 22 ii Salient Features of the Study GGGGGGGlanceGArea Glance Geographical Position : 26o 52' N Latitude 80o 56' E Longitude 128 m above Sea Level Area : 310 sq. km. Population : 28,15033 as per 2011 Census Climate : Subtropical climate, cool dry winter (Dec. - Feb.) & summer (Mar - Jun.). Temperature about 450C in summer to 30C in winter. Average annual rainfall about 100 cm. Total Vehicular Population in Lucknow city as on 31/03/2014 : 15,52,695 Growth of Vehicle over 2012-2013 : 9.0% Total No. of Filling Stations : 100 (Petrol/Diesel/CNG) Consumption of Petrol : 1,38,755 KL Consumption of Diesel : 1,55,226 KL Consumption of CNG : 2,62,55,742 Kg Major Source of Pollution : Automobiles, D. G. sets, Civil Constructions Parameters Monitored : PM10, SO2, NOX, Trace metals and Noise Study Conducted by : Environmental Monitoring Division CSIR-IITR, Lucknow 1 ASSESSMENT OF AMBIENT AIR QUALITY OF LUCKNOW CITY DURING POST-MONSOON, 2014 Environmental Monitoring Division CSIR- Indian Institute of Toxicology Research M.G. Marg, Lucknow 1.0 SUMMARY The study was carried out during the month of October, 2014 to see the status of air quality by monitoring and assessment of some selected air pollutants namely Respirable Particulate Matter (RSPM or PM10), Sulphur dioxide (SO2), Oxide of Nitrogen (NOx) and noise level at 9 representative locations, categorized as residential (four), commercial (four) and industrial (one) areas in Lucknow city. The results revealed the 24 hours concentration of PM10 to be in the range of 123.5 to 342.7 µg/m3 with an average of 202.9 µg/m3. The average values of PM10 irrespective of the locations were found to be above the permissible limit (PM10 =100 µg/m3) prescribed by MoEF. 24 hours concentration of SO2 and NOx were found in the range of 8.4 to 25.5 and 39.9 to 108.3 µg/m3 with an average concentration of 17.3 and 61.2 µg/m3 respectively and all the values were below the permissible limits (80 µg/m)3 except for one location. The trace metals Ni & Pb which are associated with PM10, 24 hours concentration were found to be in the range of 20.6 to 68.2 with an average of 31.1 ng/m3 for Ni and all the Ni values were found to be above the permissible limit of annual average (20 ng/m3) and 48.4 to 1161.5 with an average of 298.5 ng/m3 for Pb and was found to be within the permissible limit (1000 ng/m3) except for one location. Noise levels during day and night time were found in the range of 66.1 to78.8 dB(A) and 54.6 to 72.5 dB(A) which were above the respective permissible limits (day and night time noise levels in residential area are 55 and 45 dB(A) and corresponding values for commercial area are 65 and 55 dB(A) respectively except in industrial area which is 67.6 and 66.7 dB(A) during day and night time respectively. . 2 1.1 INTRODUCTION Today, adverse health effect of air pollution is a serious issue in urban areas particularly in developing countries like India. In general, some criteria pollutants like particulate matter, SO2, NOx are quantified for the assessment of ambient air quality and the major source of these pollutants are burning of fossil fuels. In urban areas, mainly gasoline, diesel and CNG are used by vehicles which are the major sources of air pollutants. Epidemiological studies suggest that air pollutants like Particulate matter, SO2 and NOx are significantly co related with cardiovascular morbidity and mortality. The effect of air pollutants depends on the concentration, chemical and physical characters of pollutants. The particulate matter (PM) is a carrier of number of pollutants like trace elements, Poly aromatic hydrocarbons etc. Inhalation of these pollutants with particulate matter is a matter of serious concern as most of the big cities particularly in India including Lucknow reported higher than permissible limit of PM specified by Ministry of Environment & Forests, Govt. India. Violation of traffic rules and unnecessary use of vehicle horn is responsible for elevated noise levels in urban area. The elevated noise levels have been associated with adverse impact on human health, ranging from minor annoyance to physiological damage. As such, traffic noise has become a major environmental concern and a source of an ever-increasing level of discomfort particularly in urban areas with high traffic congestion. The sources of vehicular engines, exhaust systems, aerodynamic noise in the urban settings are friction, and tyre-pavement interaction. Traffic noise is affected by factors such as traffic volume and speed, pavement type and vehicle conditions. Lucknow, the capital city of Uttar Pradesh, also figures in the list of most polluted cities and presently, faces the twin challenge of managing the demands of a growing city while still maintaining the quality of the environment. As per records, the area of the city is about 310 km2, which is projected to be increased up to 1000 km2 as per planned development of the city. Lucknow has witnessed rapid development during the last decade. Large monument such as Ambedkar Park, Ramabai Smriti Sthal, Ambedkar Maidan, Jyotiba Phule Park, Janeshwar Mishra Park etc. have come up in the city. The construction work has continued for over the years. The approach roads these places are either newly built or has been widened. Real estate development in the outskirt, and vacant area was taken up in a big way. These areas are connected to 3 the old city by new roads. A number of flyovers have also been constructed on existing as well as new roads. Under JNNURM yojna, sewage pipe lines were laid down across the city for which roads were dug-up and remained unpaved for quite some time before it was again re-constructed. LDA and private developers have built a number of multi storied apartments across the city. The extensive construction activity generated a lot of dust across the city. The increased vehicular movement for supply of material and other commercial activities has also contributed to the particulates and gaseous pollutants. The average growth rate (near about 10%) in registered vehicles clearly indicates that the vehicular pollution is the major cause of air pollution in the city. Some studies on air pollution sources in Lucknow have estimated about 60-70% contribution from transport sector in air pollution load of city. Every year on Dhanteras/Diwali large number of vehicles are purchased by residents of Lucknow city. More vehicles per unit area on road results in crawling traffic jams on most of the major crossings of the city which also adds to the city air pollution. The areas developed in the outskirts have four lane roads. In the absence of suitable public transport systems in newly developed areas, people staying there mostly use their own vehicles (car/bikes). This also adds vehicular load on the main city roads, as well as adding more air pollution to the city levels. In view of the above facts, it is the need of the hour to look into the air quality of our city Lucknow, the capital of Uttar Pradesh which has a population of 28.15 Lakh (Municipal corporation + Cantonment) as per 2011 census and an area of 310 sq. km. Vehicular traffic is the main source of particulate air pollution in Lucknow city. Continuous emission of pollutants from vehicular traffic adversely affects the ambient air quality as well as the health of human being. The number of different categories of vehicles registered with RTO (Regional Transport Office) Lucknow is 15,52,695 as on 31.03.2014 which is 9.0% higher over the last year (Table 1). Uttar Pradesh State Road Transport Corporation (UPSRTC) introduced bus services under the banner “Lucknow Mahanagar Parivahan Sewa” on different routes of Lucknow city. The details of bus routes and number of buses plying as on 31.03.2014 are given 4 in Table 2. In Lucknow city there are 100 filling stations for petrol, diesel and CNG operated by different oil companies (Table 3). As per Indian Oil Corporation (IOC), the consumption/sale of petrol and diesel was 1,38,755 and 1, 55,226 KL as on 31-03-2014. It is observed that petroleum sale has increased by 8.03% whereas sale of diesel has increased by 13.41%. (Table 4). In Lucknow there are six CNG filling stations and consumption of CNG during last year was approximately 2,62,55,742 Kg (2013-14) which was 10.26% higher than the previous year (2012-13) (Green Gas Limited, Lucknow). Distribution and number of CNG vehicles in Lucknow is summarized in Table 5. Considering the above, assessment of ambient air quality of Lucknow city was carried out at 9 locations during post monsoon (October), 2014 with respect to PM10, SO2, NOx and Noise level with the following aims and objectives. To assess the ambient air quality with respect to PM10, SO2 , NOx. Trace metals and Noise. To study trends of pollutants over a period of time. To assess day and night time noise to ensure compliance of permissible noise levels To create a database for future use. To create public awareness about environmental pollution Table 1. Vehicles registered with R.T.O. Lucknow during 2012-13 and 2013-14 Sl. No. Number of Registered Vehicles on 31st March 2012-13 2013-14 2770 2974 Type of Vehicle 1 Multi Articulated Light, Medium and Heavy weight 2 Vehicles (Four wheeler) Light commercial vehicles 3 (Three wheeler) 4 Buses 5 Taxi 6 Light Motor Vehicles (Passenger) 7 Two wheelers 8 Car 9 Jeep 10 Tractor 11 Trailors 12 Others Total Source: RTO, Lucknow 5 % Change 7.36 17142 18430 7.51 3170 3181 7089 7246 1136822 201628 19612 20417 1421 3980 1424478 3225 3249 7797 7743 1238691 221019 22175 22010 1469 3913 1552695 1.73 2.13 9.98 6.85 8.96 9.61 13.06 7.80 3.37 -1.68 9.0 Table 2. Details of Lucknow City Bus Service, 2014 Sl. No. 1 Route No. 11 2 12 3 13 4 23 5 24 6 31 7 33 8 45 No. Frequency of Buses To and From BBD -Chinhat-Gomti Nagar-Lohiya Park- Tikonia parkDainik Jagran – Sikendrabagh Jaharbhavan – GPOHussainganj- KKC-Charbagh BBD- Chinhat- Polytechnic-Bhoothnath –BadshanagarNioshatganj- Sikendrabagh- G.P.O- HussainganjCharbagh- Alambagh- Avadh hospital. Charbagh –Mobaiya-Alambagh thana-TeriphuliaAlambagh-bus stand-Awadth Hospital-KrishnagarthanaNatherganj –Sccoter India-Koti Bagia. Behta- Integral University-Gudamba – VikasnagarNishatganj-Sikendrabagh-G.P.O.-Hussainganj-Chargbagh Alambagh- Avadh hospital-Rajnikhand Munshiphulia-Bhootnath Indiranagar – NishatganjHazratganj-Hussainganj –Charbagh-AlambaghKrishnagagar-Parag diary- Paasi Kila IIM - P &T - Purania- Kapoorthala - Goal MarketNishatganj_Sikendrabagh-Shakti Bhavan - HussainganjCharbagh-Alambagh Engineering College- Purania- Kapoorthala - Goal Market-Nishatganj-Sikendrabagh-Shakti Bhavan Hussainganj-Charbagh-Alambagh-Avadh hospital. Virajkhand-Gomtinagar- Lohiya hospital-Polytechnic – Lekraj-Nishatganj- Sikendrabagh-Shakti Bhavan Hussainganj-Charbagh-Alambagh-Avadh hospital Krishnagar –Parag diary- Passi Kila-Shahid path Total 19 9 10 minutes interval 15 minutes interval 10 12 minutes interval 21 10 minutes interval 10 15 minutes interval 2 60 minutes interval 20 10 minutes interval 16 15 minutes interval 107 Source: UPSRTC, Lucknow Table 3. Fuel Outlets in Lucknow City Sl. No. 1 2 3 4 Agency Indian Oil Corporation (IOC) Bharat Petroleum Corporation Ltd. (BPCL) Hindustan Petroleum Corporation Ltd. (HPCL) Compressed Natural Gas Stations (CNG) Total Source: Indian Oil Corporation (IOC), Lucknow 6 Number of outlets 31st March 2014 47 22 25 6 100 Table 4. Consumption of Fuel (in KL) in Lucknow Sl. Agency No. 1 2 3 IOC BPCL HPCL Green 4 Gas Total Petrol (Unleaded) Apr. Apr. 13 12 to % to Mar. Change Mar. 14 13 71217 77693 9.09 33172 34178 3.03 24051 26884 11.77 -- -- 128440 138755 -- High Speed Diesel Apr. 12 to Mar. 13 Apr. 13 to Mar. 14 75456 28234 33180 88234 31497 35495 -- -- 8.03 136870 *CNG % Change 16.93 11.56 6.97 -- 155226 13.41 % Change Apr. 12 to Mar. 13 Apr. 13 to Mar. 14 ---2,38,11,473 ------2,62,55742 10.26 23811473 26255742 10.26 Source: Indian Oil Corporation (IOC), Lucknow, * CNG in Kg, CNG Source: Green Gas Limited, Lucknow Table 5. Distribution of CNG vehicles Sl. Vehicles No. Number % of change 2012-2013 2013-14 1 Auto Rickshaws 4343 4343 0.0 2 Tempo Taxi 2534 2575 1.61 3 Buses (UPSRTC) 260 260 0.0 4 Buses (Private) 36 36 0.0 5 School Buses 878 985 12.18 6 School Van 753 962 27.75 7 Private Vehicles 83 205 146.98 8 Private Cars 5788 7943 37.23 14675 17309 17.94 Total Source: Green Gas Limited, Lucknow 1.2 MONITORING LOCATIONS AND METHODOLOGY Nine air quality monitoring locations representing different activities/areas i.e., four in residential, four in commercial cum traffic and one industrial area were selected for the study as summarized in Table 6 ( brief description of each location is given in our earlier reports (Pre and Post monsoon, 2010) and parameters along with methodology is given in Table 7. 7 Table 6. Monitoring Locations Sl . No. 1 2 3 4 5 6 7 8 9 Locations Activities Aliganj Vikas Nagar Indira Nagar Gomti Nagar Charbagh Alambagh Aminabad Chowk Amausi Residential Residential Residential Residential Commercial cum traffic Commercial cum traffic Commercial cum traffic Commercial cum traffic Industrial Table 7. Parameters and Methodology for Air Quality Monitoring Sl. No. 1 2 3 4. 1.3 Parameters Particulate MatterPM10 Sulphur dioxide (SO2) Nitrogen Dioxide(NO2) Noise Level Time Weighted average 24 hours Methods of Measurement 24 hours Improved West Gaeke 24 hours Modified Jacob & Hochhesier (Na-Arsenite) The measurement of noise level was carried out during the day (6 AM to 10 PM) and night time (10 PM to 6 AM) by Noise level Meter 1 hour Gravimetric RESULTS The detailed results of air quality monitoring are presented in Table 8 and Fig. 1. 1.3.1 Respirable Suspended Particulate Matter (RSPM or PM10) In residential areas (Aliganj, Vikas Nagar, Indira Nagar and Gomti Nagar), the 24 hours average concentrations of PM10 were in the range of 169.2 to 234.2 µg/m3 with an average of 192.4 µg/m3. In commercial areas (Charbagh, Alambagh, Aminabad and Chowk) the average concentrations of PM10 were in the range of 177.1 to 260.6 µg/m3 with an average of 217.5µg/m3 respectively. In industrial area (Amausi), the average concentrations of PM10 were 186.6 µg/m3. 8 The maximum 24 hours mean concentration of PM10 was observed in Indira Nagar (234.2 µg/m3) in residential area and Chowk (260.6 µg/m3) in commercial area. All the values of PM10 were above the prescribed National Ambient Air Quality Standard (NAAQS) of 100 µg/m3 for industrial, residential, rural and other area respectively. 1.3.2 Sulphur dioxide (SO2) In residential area (Aliganj, Vikas Nagar, Indira Nagar and Gomti Nagar) the mean levels of SO2 were in the range of 13.8 to 17.9 µg/m3 with an average of 16.0 µg/m3. In commercial area (Charbagh, Alambagh, Aminabad and Chowk) the average concentrations of SO2 were in the range of 15.5 to 20.8 µg/m3 with an average of 18.5 µg/m3. In industrial area (Amausi) the average concentration of SO2 was 17.3 µg/m3. All the values of SO2 were well below the prescribed NAAQS of 80 µg/m 3 for all the locations. 1.3.3 Oxides of Nitrogen (NOx) In residential areas (Aliganj, Vikas Nagar, Indira Nagar and Gomti Nagar) the 24 hours average concentrations of NOX were found in the range of 50.9 to 56.2 µg/m3 with an average of 53.3 µg/m3. In commercial areas (Charbagh, Alambagh, Aminabad and Chowk) the average concentrations of NOX were found in the range of 42.3 to 86.4 µg/m3 with an average of 66.8 µg/m3. In industrial areas (Amausi) the average concentration was 70.6 µg/m3 All the values of NOx were within the prescribed NAAQS of 80 µg/m3 for all the monitoring locations except one commercial (Charbagh). 1.3.4 Trace Metals in Ambient Air (RSPM or PM10) The trace metals (Ni and Pb) were estimated in ambient air associated with PM10 at 9 monitoring locations. The results are present in Table 9. The 24 hr mean concentration of metals were found to be Ni = 31.14, (20.63-68.22) ng/m3 and Pb = 298.52 (48.43- 1161.53) ng/m3. 9 Table 8. Concentration (µg/m3) of RSPM, SO2 and NOx during Post monsoon 2014 RSPM (PM10) Location SO2 NOx Min Max Avg Min Max Avg Min Max Avg Aliganj 123.5 296.6 169.2 8.4 17.6 13.8 43.7 63.1 50.9 Vikas Nagar 128.5 252.4 193.9 8.6 21.4 15.8 46.4 62.4 52.3 Indira Nagar 169.0 289.0 234.2 13.6 21.3 17.9 46.5 66.5 56.2 Gomti Nagar 149.2 210.4 172.3 12.8 17.8 16.5 44.8 65.6 53.6 Charbagh 169.2 302.8 221.7 14.8 24.7 20.0 51.8 108.3 86.4 Alambagh 130.8 224.7 177.1 11.9 24.1 17.8 64.5 80.3 69.1 Aminabad 146.9 274.6 210.5 10.5 20.0 15.5 39.9 48.2 42.3 Chowk 172.9 342.7 260.6 16.0 25.5 20.8 55.7 79.4 69.5 141.1 245.4 186.6 10.1 21.4 17.3 58.3 95.7 70.6 Residential Commercial Industrial Amausi NAAQS 100 80 80 WHO Guidelines 50 20 40* N=4, *= Annual average and rest 24 hours, NAAQS=National Ambient Air Quality Standards 10 Fig 1: Concentration (μg/m3) of PM10, SO2 and NOx in different areas of Lucknow city during post monsoon season (2014) and compared with prescribed National Ambient Air Quality Standard (NAAQS) 11 Table 9. Metal Concentration in ng/m3 associated with PM10 Location Residential Area Aliganj Vikas Nagar Indira Nagar Gomti Nagar Average Commercial Area Charbagh Alambagh Aminabad Chowk Average Industrial Area Amausi NAAQS ` Pb Ni 95.13 185.29 48.43 68.33 99.29 27.70 36.79 33.72 29.59 31.95 1161.53 218.95 203.03 556.21 534.93 40.71 22.36 21.27 68.22 38.14 149.78 *1000.0 20.63 ** 20 N= 1, NAAQS **Ni=Annual Average; *Pb=24 hrs Average 1.3.5 Noise The monitoring data recorded during the post monsoon period (October, 2014) is presented in Table 10. In residential areas, the day and night time noise levels were recorded between 66.1 to 69.6 and 54.6 to 61.2 dB(A) respectively. All the values were higher than the prescribed limit of 55 and 45 dB (A) for day and night time respectively. In commercial and heavy traffic area, the day and night time noise level were recorded between 72.5 to 78.8 and 55.9 to 72.5 dB(A) respectively. Noise level at all the commercial sites during day and night time were found above the prescribed limit of 65 and 55 dB (A) respectively. In industrial area, Amausi the day and night time noise levels were recorded 67.6 and 66.7 dB (A) respectively. Noise levels at all industrial locations in the day and night time was found below the prescribed limit of 75.0 and 70.0 dB(A) respectively. 12 Table 10 : Noise Level dB (A) during Day and Night Time Sl. No. 1 2 3. 1.4 Area Residential Commercial and Traffic Industrial Location Aliganj Vikas Nagar Indira Nagar Gomti Nagar Standard Charbagh Alambagh Aminabad Chowk Standard Amausi Standard Noise level dB(A) Day Night 66.5 57.2 66.3 54.6 69.6 61.2 66.1 55.6 55.0 45.0 78.8 72.5 74.4 66.2 72.5 55.9 73.8 60.2 65.0 55.0 67.6 66.7 75.0 70.0 TRENDS OF AMBIENT AIR QUALITY IN LUCKNOW CITY The observed PM10, SO2 and NOx for 3 years data have been compared to find out the prevailing trend of air pollution in Lucknow city (Fig.2-4). The slight decrease or increase in the values may be attributed to some local environmental and climatic factors. 1.4.1 Respirable Suspended Particulate Matter (RSPM or PM10) In all the locations in residential areas, higher values were found compared to the previous year except Gomti Nagar. Among the commercial areas, PM10 values were found to be higher than the previous year except Alambagh. Amausi under industrial area showed lower value over the last year. All the values are higher than the NAAQS (Fig. 2). 1.4.2 Sulphur dioxide (SO2) Lower concentration was found compared to the previous year at all the residential commercial and industrial areas except Aminabad and Chowk in commercial. All the values were found to be lower than the NAAQS (Fig. 3). 1.4.3 Oxides of Nitrogen (NOx) The level of NOx during post monsoon since 2011 is presented in Fig. 4. In residential area showed higher values than the previous year except Vikas Nagar and Indira Nagar. In commercial and industrial areas all the values showed higher values except Aminabad in commercial area. All the values of the present study were found to be lower than the NAAQS (Fig.4) except Charbagh . 13 Fig 2: Concentration (μg/m3) of PM10 (RSPM) in Residential, Commercial and Industrial areas of Lucknow city during 2011 to 2014 and compared with prescribed National Ambient Air Quality Standard (NAAQS) 14 Fig 3: Concentration (μg/m3) of SO2 in Residential, Commercial and Industrial areas of Lucknow city during 2011 to 2014 and compared with prescribed National Ambient Air Quality Standard (NAAQS) 15 Fig 4: Concentration (μg/m3) of NOx in Residential, Commercial and Industrial areas of Lucknow city during 2011 to 2014 and compared with prescribed National Ambient Air Quality Standard (NAAQS) 16 1.4.4 Noise Level Current year’s noise data has been compared with the corresponding data of the previous three years and is presented in Fig. 5 and 6. The comparative noise level in residential, commercial and industrial areas are described below: 1.4.4.1 Day time Noise Level In residential areas all the locations showed slightly increasing trend over the previous year. In commercial cum traffic areas, noise level was slightly on the higher side at all the locations compared to the previous year. In industrial area, Amausi the noise level was slightly lower than the previous year. The comparative data are presented in (Fig.5.). 1.4.4.2 Night time Noise Level Residential and Commercial areas showed slightly higher trend than the last year level except Aliganj and Vikas Nagar in residential area and Aminabad in commercial area. The industrial areas also showed slightly higher than the previous year. The comparative data is presented in (Fig. 6). 17 Fig 5: Comparison of day time Noise Level dB (A) in different areas of Lucknow city (2011-2014) 18 Fig 6: Comparison of night time Noise Level dB (A) in different areas of Lucknow city (2011-2014) 19 1.5 HEALTH EFFECTS At elevated levels, all the pollutants including metals have adverse effects on human and environmental health. Accumulation of pollutants in the human body through inhalation of air is an important route. Results of the present study revealed that higher level of particulate matter especially the PM10 at all the monitoring locations are more dangerous for human health and responsible for several cardiovascular and respiratory diseases such as asthma, bronchitis, reproductive development, increased risk of preterm birth and even mortality and morbidity rate. It is reported that the total daily mortality increased by approximately 1% for every 10 µg/m3 increase in PM10 concentration. Human exposure to particulate air pollution has been identified as a risk factor for human mortality and morbidity and many countries have revised the limits for PM10 as previously defined and set up new quantitative standards for PM2.5. Nevertheless, PM threshold levels to which exposure does not lead to adverse effects on human health have not yet been clearly identified and hence there is a substantial interindividual variability in exposure and in the response and it difficult to establish a standard or guideline value that will lead to complete protection of every individual against all possible adverse health effects of particulate matter. The effect of PM depends on the mass and number concentration, shape and size and the composition and concentration of other inorganic and organic pollutants associated with it. In the present study, the concentration of SO2 and NOx were found to be below permissible limit (80 µg/m3) of NAAQS (MoEF 2009), but there are several reports that gaseous pollutants are related with respiratory diseases and reproductive and developmental effect even at low concentration. Vehicular traffic and NO2 are associated with significantly higher risk of lung cancer. Noise pollution is now worldwide recognized as a major problem for the quality of life in urban areas. Noise pollution can have adverse effects varying from hearing loss to annoyance. Noise produces both temporary (short period) and permanent 20 hearing loss (long period). Damages caused by noise pollution can range from the bursting of the eardrum, permanent hearing loss, cardiac and cardiovascular changes, stress fatigue, dizziness, lack of concentration, cause of accident, irritation, inefficiency, nausea, interference with tasks, headaches, insomnia and loss of appetite etc. It also adversely affects future generations and has sociocultural, aesthetic, and economic effects. 1.6 CONCLUSION We have monitored air pollutants such as PM10, SO2 and NOx for assessment of ambient air quality. Besides, we also monitored noise level during day and night time at 9 locations during post monsoon (October), 2014 and our data revealed the following salient points The RSPM (PM10) level at all the monitoring locations of residential, commercial and industrial areas were higher than the National Ambient Air Quality Standard (NAAQS). The concentration of gaseous pollutants, SO2 and NOx were well below the prescribed NAAQS (80 µg/m3) at all the locations. Increasing trend for the PM10 was found at all the commercial and industrial areas when compared to the previous year data post monsoon The noise level at all the locations except in industrial area during day and night time showed higher level than the respective permissible limits. Rapid growth of number of vehicles, their technological development and release of invisible tailpipe pollutants emission are serious debatable issues even for the policy makers. Use of different types of fuels namely petrol, diesel and CNG make the environment more complex regarding the air quality and their possible synergistic effects on the human health. Overall, continuous accumulation of different types of pollutants and their exposure to human being needs emergency attention of the policy maker, researchers and regulatory agencies. The latest development, introduction of metro rail in the city in the near future, is a positive step towards reducing the air pollution, through the decrease in the vehicular density is a clear indication of the severity of the traffic and air pollution. The state 21 government has a plan to start the Lucknow metro in 2017. The necessary official procedures are under progress, Lucknow Metro Rail Company (LMRC) has come in to existence and construction of one segment from Alambagh to Charbagh is under progress. LMRC has counted the number of vehicles and studied the transport pattern. Accordingly diversion for traffic has been may last for a year or two. During this period the dust and gaseous pollutant in this segment may remain at a higher level. This will add to the air pollution level of the segment and nearby locality. As the construction of metro rail progresses further, other areas may also be affected. Thus there is a possibility of increase in existing air pollution of city for the time being. The present study suggests that it is necessary to monitor the air quality as well as the health effects at regular intervals at strategic locations. Our post monsoon monitoring survey might be of help to focus on the pollution level in Lucknow city and its probable consequences. Our database since 1997 will help the planners for sustainable development of the city. 1.7 RECOMMENDATIONS Subsidized public mass transport must be strengthened to minimize use of personal vehicles. Improvement in the traffic management. Encroachment should be removed for smooth flow of traffic. Public awareness programme for harmful effects of vehicular/ air pollution Pressure horns to be removed from all vehicles and avoid use of horn. Government should increase the parking charges on hourly basis to discourage the use of personal vehicles. Restore foot path for pedestrians. Acknowledgements: We the Members of Environmental Monitoring Division are grateful to Dr. C. S. Nautiyal Director, IITR, Dr. Mukul Das, Chief Scientist, IITR, B. D. Bhattacharji, Senior Principal Scientist, IITR for permission to conduct this study and continuous encouragement. We express our sincere thanks to Mr. B. K. Singh, Regional Transport Officer, and Mr. A. K. Tripathi Assistant Regional Transport Officer, Transport Nagar, Lucknow, Mr. Aditya Kumar, Regional Manager, UPSRTC, Gomti Nagar, Lucknow, Mr. Sunil Vikram Singh, Dy. Manager, Indian Oil Corporation, Lucknow and Mr Surya Prakash Gupta, Manager, Green Gas Limited, Lucknow for providing us necessary vehicular and oil consumption data. We also express our sincere thanks to all who provided necessary facilities at different monitoring locations. 22


© Copyright 2026