
Document 4095
Preface
This research project was performed for the fulfilment of Master’s of Science program in
Radioecology at the Norwegian University of Life Sciences (UMB), Ås, Norway. I would
like to give my sincere thanks to Dr. Lindis Skipperud, Associate Professor and main
supervisor of this project, for her encouraging scientific guidance throughout the project.
Similarly, this assignment would not have been accomplished without the continuous kind
help and apt advices from Jelena Mrdakovic Popic, Research Fellow at UMB and also a cosupervisor of this thesis. I would also like to acknowledge Professors Deborah H. Oughton,
Brit Salbu and Per Strand for being my co-supervisors and for providing such a great and
stimulating scientific environment to work with this project. Furthermore, I am indebted to
Basant Malla, Marit Nandrup Pettersen, Merethe Kleiven and Nenad Popic for their help
while carrying out the field study. In addition, I feel thankful to all the friends who supported
me and shared wonderful moments during my study period at UMB. Last but not the least, I
would like to express my sincere gratitude to my family and relatives for their unabated
encouragement, support and love without which my sound academic mind would not have
been possible.
Ås, May 2011
Chhavi Raj Bhatt
This thesis is dedicated to “space-time” and nature that enabled me to enjoy my/their
existence with unabated curiosity.
1
SUMMARY
Introduction: This work was carried out in a thorium rich region, Fen Complex (FC),
located in Telemark County, Norway. The area has been well recongised as a high natural
radiation area in Norway due to the presence of considerable amount of thorium (along with
relatively higher uranium) in the unique rocks of the area. In addition, the area also includes
the sites, where iron and niobium mining was carried out during the past centuries.
Objectives: The objectives were to measure outdoor radon and thoron concentrations as well
as gamma dose rates/doses, to estimate public annual effective doses from gamma, radon and
thoron exposures in the five selected areas of the complex (Bollodalen, Fengruve,
Gruvehaugen, Rullekoll and Søve). The risk of human cancers (Solid cancers, leukaemia and
lung cancer) from the estimated doses were also evaluated.
Materials and Methods: The absorbed gamma dose rates in air were measured during
different months (May 2008, September and November 2009 and June 2010) with automess.
Absorbed gamma doses in air were also measured in the area during summer 2010 with
thermo luminescent dosimeters (TLDs). In addition, simultaneous outdoor radon and thoron
measurements were conducted in the different locations of the region during autumn 2009
and summer 2010 with radon-thoron discriminative detectors. All the measurements were
performed at the distance of one meter above the ground level. The TLD gamma doses were
read at Jožef Stefan Institute, Ljubljana, Slovenia, and radon and thoron concentrations were
measured at National Institute of Radiological Sciences, Chiba, Japan. All the data were
entered and analyzed using Windows Office EXCEL 2007 and Minitab 16. For all analyses,
p-values <0.05 were considered statistically significant. Annual average effective doses were
estimated by extrapolating the absorbed doses in air of the measured period (2 months) and
using the conversion factor 0.7 SvGy-1. In case of radon and thoron doses, Equilibrium
Equivalent Concentrations (EEC in Bqm-3) were calculated using equilibrium factors (Feq);
0.7 for radon, and 0.003 and 0.1 for thoron. The EECs and doses from radon isotopes were
derived using the relationships between EECs and Working Levels as well as Working Level
Months (WLMs) and equivalent doses; 1 Bqm-3 of EEC=0.27 mWL (for radon) and 3.64
mWL (for thoron), and conversions; 10 mSvWLM-1 for radon and 3.4 mSvWLM-1 for thoron.
The outdoor occupancy factor of 0.2 (=1752 hrsyr-1) for gamma as well as radon and thoron
doses were taken into account while estimating their respective doses. The gamma dose risks
2
were estimated assuming the excess relative risks of solid and leukaemia mortality of 0.4Sv-1
and 4.0Sv-1 respectively. Similarly, mean excess relative risk for lung cancer from radon and
thoron exposures were estimated using 0.26%WLM-1.
Results: The dose rates were found to be varied in all the areas during the studied months;
Bollodalen (1.62-4.47 µGy/h), Fengruve (0.77-4.06 µGy/h), Gruvehaugen (1.57-9.17 µGy/h),
Rullekoll (0.48-5.53 µGy/h) and Søve (1.03-11.05 µGy/h). The mean annual effective doses
due to gamm at different areas were ; Bollodalen (1.76 + 0.69 mSv), Fengruve (2.48 +
0.54mSv), Gruvehaugen (2.02 + 0.61mSv), Rullekoll (1.17 + 0.19 mSv) and Søve (0.36 +
0.38 mSv). The mean radon concentration of the FC region in autumn (4.5 + 5 Bqm-3) was
significantly lower (p<0.05) than that in summer (56+50 Bqm-3). Based on the summer radon
concentrations measured, ANOVA General Linear Model did not showed any significant
difference in radon concentration (p>0.05) of the FC areas. The mean thoron concentration of
the region in autumn (691+367 Bqm-3) was significantly lower (p<0.05) than that in summer
(1593+797 Bqm-3). The mean thoron concentration of the complex during the autumn ranged
from 7+2 Bqm-3 to 1000+137 Bqm-3, and that in summer ranged from 91+90 Bqm-3 to
1786+860 Bqm-3. ANOVA General Linear Model showed statistically significant different
thoron concentrations measured different areas (p<0.05). Søve area had a significantly lower
(p<0.05) thoron concentration than the other areas. A moderate strong correlation also
observed between radon and thoron measured in summer (r= 0.697, p<0.05). The regression
analyses of gamma dose and radon and thoron showed that gamma dose line is better fitted
with the measured thoron concentration data (R2=40.7%, p<0.05) than that with radon
concentration (R2=31.7%, p<0.05) data. The mean effective doses due to outdoor radon
exposures at the FC areas were; Bollodalen (1.55+0.7 mSv), Fengruve (1.78+1 mSv),
Gruvehaugen (1.22+0.5 mSv), Rullekoll (1.05+ 0.3 mSv), and Søve (0.6+ 0.1 mSv).
Similarly, the mean effective doses due to outdoor thoron (with Feq 0.003) exposures at the
FC areas were; Bollodalen (0.52+0.3 mSv), Fengruve (0.6+0.5 mSv), Gruvehaugen (0.7+0.2
mSv), Rullekoll (0.5+0.1 mSv), and Søve (0.03+0.01 mSv). The thoron doses were estimated
33 times greater with the larger Feq value of 0.1 than that estimated with Feq 0.003. The mean
risks of solid cancers and leukaemia from gamma doses were estimated to be in the range of
0.0001-0.001 and 0.001-0.01 respectively. The excess relative risks of lung cancer from
radon exposures ranged 0.0001-0.0004, and that from and thoron were 0.00002-0.0004 (Feq
0.003) and 0.0007-0.019 (Feq 0.01).
3
Conclusion: The present study found that the FC region has high outdoor natual gamma dose
rates (1.16-8.43 µGy/h)
as well as radon (7-210 Bqm-3) and thoron (7-4996 Bqm-3)
concentrations. All of these values are considerably higher than global and Norwegian
average corressponding values. Radon and thoron showed significantly lower air
concentrations in the autumn than that in the summer. The estimated range of mean annual
effective doses due to the natural radiation in the FC areas were also found remarkebly high;
gamma (0.36-2.48 mSv), radon (0.6-1.78 mSv) and thoron (0.03-0.7 mSv). The risk of
leukaemia from gamma doses was estimated to be higher (0.001-0.01) than that of solid
cancer (0.0001-0.001), and lung cancer (0.00002-0.0005) from radon isotopes.Therefore, on
the basis of the findings from this study, it can be recommended that the high dose areas in
the FC require interventions in order to minimize the likelihood of human stochastic effects
by limiting public doses as low as resonably achievable.
4
CONTENTS
1. INTRODUCTION…………………………………………………………...6
2. LITERATURE/THEORY…………………………………………………...10
2.1. Natural Background Radiation…………………………………………....10
2.2. NORM………………………………………………………………….....10
2.3. TENORM………………………………………………………………....12
2.4. Uranium and Thorium Characteristics…………………………………....13
2.5. Radon: An Invisible Monster…………………………………………......14
2.5.1. Indoor Radon……………………………………………….....15
2.5.2. Outdoor Radon……………………………………………......16
2.5.3. Radon in Norway……………………………………………...17
2.5.4. Thoron: A Neglected Issue…………………………………....17
3. MATERIALS AND METHODS…………………………………………… 18
3.1. Field-work Description………………………………………………….....18
3.2. Radiation Measurements………………………………………………......21
3.3. Instruments………………………………………………………………...23
3.4. Dose Calculations……………………………………………………….....25
3.5. Data Analysis (Statistics)……………………………………………….....26
4. RESULTS AND DISCUSSION...................................................................29
5. CONCLUSIONS.......................................................................................49
REFERENCES…………………………………………………………………50
APPENDIX………………………………………………………………………64
5
1. INTRODUCTION
Our earth has been radioactive since its birth, and the inescapable radioactivity that we are
exposed today comes from various natural and anthropogenic sources. Thorium and uranium
in the nature have very long half lives and they eventually disintegrate into stable lead viz.
Pb-206 and Pb-208 respectively (Pfennig et al. 1998). During the process of disintegration,
they and their progeny emit numerous gamma rays, beta rays and alpha rays with different
energies giving rise to variety of daughter products including radon isotopes. Radon is a
naturally occurring inert radioactive gaseous atom in our environment, and the exposure to it
is a continuous phenomenon for all of us. The two isotopes of radon; radon-222, radon-220
are the daughter products of uranium (U-238) and thorium (Th-232) respectively. The term
“radon” denotes all the radon isotopes in general, but more specifically, radon denotes Rn222 whereas thoron denotes Rn-220. According to the United Nations Scientific Committee
on the Effects of Atomic Radiation (UNSCEAR), of the total global average public exposure
to natural radiation, radon inhalation makes up at least 50% of the dose (UNSCEAR, 2000a;
UNSCEAR, 2010). Moreover, the other sources of natural exposure to general public are
earth gamma radiation (20%), cosmic radiation (18%), and radiation exposure from the
radionuclides present in water and food (12%) (UNSCEAR, 2000a). Of the total annual per
caput effective dose (1.25 mSv) due to both of the radon isotopes, inhalation of Rn-222 alone
is responsible for 92% of it or 1.15 mSv (UNSCEAR, 2010). It is also interesting to note that
the respective dose contribution by the radon isotopes and their progeny largely varies
according to the local geology or ratios of U-238 and Th-232 concentrations in the soil.
According to the UNSCEAR (2010), the average global concentration of these radionuclides
is; 33 Bqkg-1 for U-238 and 45 Bqkg-1 for Th-232. The global distribution of U-238 and Th232 in the soil is illustrated by figures 1 and 2 respectively. Potassium-40 (K-40), another
naturally occurring radionuclide in soil (Conc.=412 Bqkg-1), is not considered in this thesis
despite its significant gamma radiation dose to human population (UNSCEAR, 2010).
6
Figure 1. The global concentration of U-238 distribution in the soil (UNSCEAR, 2010).
Figure 2. The global concentration of Th-232 distribution in the soil (UNSCEAR, 2010).
7
The risk from radon exposure is basically understood through the studies performed
worldwide; mostly in mines or dwellings (UNSCEAR, 2006a; WHO, 2009). However, a few
studies are also carried out in caves (e.g. Wiegand et al. 2000; Tokonami et al. 2004; Lario et
al. 2005; Kávási et al. 2010). In addition, there are also a few studies published which
describe outdoor radon and/or thoron in different countries; China (Iida et al. 1996; Zhang et
al. 2004), Japan (Iida et al. 1996; Oikawa et al. 2003; Hosoda et al. 2007; Hosoda et al.
2009), India (Singh et al. 2005), Hong Kong (Man & Yeung, 1998; Chan et al. 2010),
Romania (Baciu, 2005), Serbia (Žunić et al. 2009), Slovenia (Humar et al. 1992), Germany
(Winkler & Aehlig, 1998), Canada (Grasty, 1994) and South Korea (Chung et al. 1998). It is
fair to say that numerous studies on radon exist with much attention (Zielinski & Chambers,
2008) unlike that on thoron (Akiba et al. 2010). One of the reasons for this might be thoron’s
perceived low radiological importance in the past (Tokonami, 2010; Zhuo et al. 2010). Also,
there exist numerous difficulties in thoron measurement and calibration, and the lack of
epidemiological data on thoron exposures (Tokonami, 2010). Therefore, it is important to
note that current knowledge about the contribution of thoron to the radon measurement is
insufficient (Chambers, 2010). It is also emphasised that doses from thoron and its progeny
should no longer be considered as negligible (McLaughlin, 2010; Ramola et al. 2010).
The need of further studies on thoron is necessary both to understand the sources and
behavior of thoron, as well as to better estimate the actual doses from radon and its decay
products (Chambers, 2010). It has also been suggested that the public exposure to thoron and
its progeny should be considered in the areas where the concentration of Th-232 is high
(UNSCEAR, 2000a). Lately, the awareness of radiological impact of thoron along with that
of radon has increased and this, in turn, will further boost attention of stakeholders and
general public towards thoron (McLaughlin, 2010; Tokonami et al. 2010). There are many
areas worldwide with higher level of Th-232 and such areas are of interest both from the
thoron exposure and gamma exposure view points.
The world’s third largest Th-232 reservoir has been estimated in Norway (US Geological
Survey, 2007), with its largest amount located in Telemark County (Thorium report, 2008),
120 km southwest of Oslo. The location, called the Fen Complex (FC), lies close to a small
town, Ulefoss, and lake Norsjø. It is reported that some of the people in the FC area are likely
to receive elevated radiation doses (Stranden, 1985; Sundal & Strand, 2004). Due to the
excessive concentration of Th-232 in the rocks found in the FC (Sundal & Strand, 2004;
8
Thorium report, 2008), a possibility of future Th-232 mining in the area remains open
(Thorium report, 2008). In fact, the FC was explored for various mining resources in the past
(Solli et al. 1985; Stranden, 1985; Sundal & Strand, 2004); iron mining during 1650-1930,
Søvite mining for fertilizers from 1900, and for niobium during 1953-1965. The tailings in
the FC area, containing Th-232 and U-238, are reported to contribute high gamma doses
(Stranden, 1985).
With this knowledge, it becomes relevant to carry out a study at the FC region to describe
outdoor radon, thoron and natural gamma exposures, which could estimate health and/or
environmental risks thereof. Therefore, this study was performed in the region with the
following objectives;
Ø To measure outdoor radon and thoron air concentrations at the different locations of
the FC.
Ø To measure outdoor gamma absorbed dose rates at the corresponding areas.
Ø To estimate annual effective doses to public from gamma, radon and thoron
exposures.
Ø To assess the risk for possible cancers among human population in the FC region due
to the doses.
9
2. THEORY
2.1.
Natural Background Radiation
The UNSCEAR broadly classifies public exposures into two groups; natural and man-made
exposures (UNSCEAR, 2010). Of all sources of radiation exposure to human population,
natural radiation makes up more than half of the total exposure. The world average annual
effective dose from natural background radiation is ~2.4 mSv (UNSCEAR, 2000a;
UNSCEAR, 2010). The annual effective doses arising from different sources and pathways
are; inhalation exposure to U-238 and Th-232 series elements 1.26 mSv, external terrestrial
(outdoor and indoor) 0.48 mSv, cosmic 0.38 mSv, ingestion of K-40 as well as U-238 and
Th-232 series elements 0.29 mSv and cosmogenic 0.01 mSv (UNSCEAR, 2010).
Radiation exposure is a well known contributing factor for mutagenesis and carcinogenesis in
both animals and humans (UNSCEAR, 2006b). It is believed that there is no threshold
radiation dose below which we can guarantee that human carcinogenesis is impossible
(UNSCEAR, 2000b; Brenner & Sachs, 2006). However, the linear no-threshold model of
cancer risk estimation, for low or/and very low dose exposure, is not without a controversy
(Kellerer & Nekolla, 2000; Tubiana et al. 2009). Similarly, ionizing radiation exposure is also
of concern for non-human organisms and environment, and the radiation protection of the
same has also become equally relevant (Holm et al. 2002; Oughton & Strand, 2004; ICRP,
2009). The high background natural radiation poses risk to the ecological receptor in the
region (Meyers-SchÖne, 2003). The exposure effects on biota range from the impacts on the
individual to the population levels (Arkhipov et al. 1994; Kovalchuk et al. 2000; Geras'kin, et
al., 2005; Salbu et al., 2005; Geras' kin et al. 2009).
2.2.
NORM (Naturally Occurring Radioactive Material)
NORM is defined as “Materials which may contain any of the primordial radionuclides or
radioactive elements as they occur in nature, such as radium, uranium, thorium, potassium,
and their radioactive decay products, that are undisturbed as a result of human activities”
(U.S. Environmental Protection Agency, 2006). NORM amplifies radiation exposure to
human population or workers, which cannot be ignored (El Afifi et al. 2006). One of the main
examples of NORM is radon (Soharabi, 1998). There are numerous areas worldwide with an
elevated level of NORM. Of them, the most interesting areas are located in Brazil, China,
India, and Iran where high levels of terrestrial radiation are reported (Hendry et al. 2009). In
10
addition, the FC in Norway also comprises elevated NORM and TENORM sites (Sundal &
Strand, 2004; Thorium report, 2008), which come under a Medium Level Natural Radiation
Area (MLNRA) according to the classification proposed by Soharabi (1998). It has been
realised that there is a need to study elevated NORM sites to understand human risk from
direct observations. The classification of the sites as per the annual effective dose received by
public living in such areas was proposed as follows (Ibid);
a) A Low/Normal Level Natural Radiation Area (LLNRA/NLNRA); area of dwelling where
the public would get background annual effective dose of < 5 mSv from the exposure to
cosmic radiation, terrestrial radionuclides in soil, water, air, food etc. Such areas require no
intervention.
b) A Medium Level Natural Radiation Area (MLNRA); the annual effective background dose
should be more than upper level of LLNRA/NLNRA, i.e. 5 mSv but < 20 mSv (preestablished dose limit for radiation workers). An intervention is needed in such areas.
c) A High Level Natural Radiation Area (HLNRA); the annual effective background dose
should be between 20 and 50 mSv. An intervention with remedial action is necessary for such
areas.
d) A Very High Level Natural Radiation Area (VHLNRA); the annual effective background
dose should be > 50 mSv, and evacuation of people from such areas is recommended.
There is a need for having the criteria more dependent on unified system of limitation of
annual effective dose and experience gained with high NORM areas, and the classification
described above is in agreement with that of ICRP system (ICRP Publication 60, 1991). The
same classification is also discussed by Hendry et al. (2009). The radiation levels at NORM
sites could reach significantly higher due to anthropogenic activities, e.g. mining of ores. The
individual effective dose and recommended action levels is proposed by the ICRP (2005),
which suggests that any planned exposure that gives annual dose more than 1 mSv besides
the background dose should need intervention depending on the dose levels (Figure 3).
11
Figure 3. An illustration of natural background radiation levels and corresponding intervention
needed (ICRP, 2005).
2.3.
TENORM (Technologically Enhanced Naturally Occurring Radioactive
Material)
TENORM is defined as a material that “contains radionuclides that are present naturally in
rocks, soils, water and minerals, and that have become concentrated and/or exposed to the
accessible environment as a result of human activities such as manufacturing, water
treatment, or mining operations” (U.S. Environmental Protection Agency, 2000).
The human activities, in fact, enhance and/or alter the radiological, physical, and chemical
properties of the NORM giving rise to human and/or environmental exposures (U.S.
Environmental Protection Agency, 2006). With such alterations, the NORM is much more
available for transfer to humans via some pathways like the food chain e.g. Po-210 in fishes
or mussels (Heaton & Lambley, 1995). TENORM is the consequence of extraction,
processing, treatment and purification of minerals, petroleum products, or other substances
obtained from NORM containing parent materials. Several hundred million metric tons of
TENORM is produced annually through the industrial processes mining industries (U.S.
Environmental Protection Agency, 2006). Similarly, fossil fuel extraction and combustion,
manufacture of building materials, thorium compounds, commercial aviation, and scrap metal
processing industries give rise to TENORM. The elevated gamma radiation and radon levels
are always found at TENORM sites (U.S. Environmental Protection Agency, 2006).
Therefore, increased exposure of workers and general public is likely from them. In Europe,
NORM operations like uranium mining and milling, metal mining and smelting, and
12
phosphate industry are of prime concern with regards to radiation exposure to the public from
such industries (UNSCEAR, 2010). The FC region has both NORM (Rullekoll) and
TENORM (Bollodalen, Fengruve, Grauvahaugen and Søve) sites characterizing both an
unexplored Th-232 reserve and the residue of past iron and niobium minings. Th-232 activity
with niobium mining could be significant, and the primary public exposure pathways include
groundwater contamination with radium-228 and external exposure to elevated concentration
of Th-232 present in the slag (UNSCEAR, 2010).
2.4.
Uranium and Thorium Characteristics
Uranium (Z=92) gives low levels of natural background radiation in the environment. There
are three isotopes of uranium found in nature; U-238 (99.27%), U-235 (0.7%) and U-234
(0.005%) (Choppin et al. 2002). Uranium is chemotoxic and is present in large number of
minerals, mostly in tetravalent state. Uranium mining is a very important mining industry of
today’s world, as enriched U-235 is used as a fuel material both for civil and military nuclear
purposes.
Th-232 (Z=90) is more common in nature than uranium, existing exclusively in the form of
Th-232 (Choppin et al. 2002). A trace amount of Th-232 permeates nearly all soils and
rocks, partly due to the influence of ground water from which Th-232 can precipitate over
geological time scales (Ramachandran & Sahoo, 2009). Generally, it exists in plus four
valence state. It is not highly soluble as such; however, it forms more soluble complex ions
(Langmuir & Herman, 1980). Therefore, proper conditions of acidity (pH) and oxidation
potential can provide the circumstances for it to leach out from primary source like rocks, and
then carried away by water in solution. Rocks made up of granite or black shale, monazite
and zircon sands characterize high Th-232 content. Th-232 incurs both external gamma and
internal alpha particle exposures (Pfennig et al. 1998). Generally, Th-232 is present together
with U-238 and rare earth elements in various rock types (Heincke et al. 2008; Mrdakovic
Popic et al. 2011).
13
2.5.
Radon: An Invisible Monster
Radon and thoron are the main subjects of this dessertion, therefore, much of the discussion
will be focussed on them. Radon atoms in air spontaneously decay into other atoms, despite
being chemically inert. Radon and thoron are the immediate daughter products of Ra-226 and
Ra-224 respectively. Radon and thoron decay scheme is shown in the figures 4 and 5
respectively. The half-lives of U-238, Th-232, Rn-222 and Rn-220 are 4.46x10⁹ years,
1.41x10¹⁰ years, 3.82 days and 55.6 seconds, respectively (Pfennig et al. 1998). The radon
progeny can attach themselves to small dust particles in air and can then be inhaled and
deposited on the lining of the lung or airway. Inhalation of the short-lived radon progeny (Po218, Pb-214, Bi-214/Po-214) and the decay products of thoron (Pb-212, Bi-212/Po-212)
actually give the largest amount of natural radiation exposure to human population
(Porstendörfer, 2001). Radon decay progeny can be divided into two fractions; attached and
unattached. The attached progeny is attached to the dust particle’s surface of a micron size or
larger in the air, whereas the unattached progeny is just carried along by ultrafine aerosol
particles with size 10 nm or less (United States Patent US4847503, 1989). It is suggested that
much of the radon dose to the general population is contributed by the inhalation of
unattached radon progeny (El-Hussein et al. 1998; Akiba et al. 2010). There is a greater risk
to the public from the unattached radon progeny as they have higher mobility than the
attached progeny and are more easily deposited on the human respiratory system (EI-Hussein
et al. 1998).
Radon is one of the most studied human carcinogens (BEIR VI, 1999). The dose-response
relationship (of radon and lung cancer) is linear without any threshold (Darby et al. 2005).
The daughter progeny (Po-218 and Po-214) emit alpha particles and damage the DNA of the
lung cells that could induce lung cancer (WHO, 2009). It should be noted that smoking and
radon exposure have synergistic effects in the lung cancer incidence (Barros-Dios et al.
2002). The doses received by airway or lung due to exposure to radon and its progeny depend
on various factors viz. radon activity concentration, equilibrium factor, potential alpha
particle energy exposure, aerosol size distribution, amount of unattached progeny, breathing
type (nose or mouth breathing and rate and depth of respiration) and fractional deposition in
the airway, and breathing clearance (UNSCEAR, 2006a).
14
Figure 4. Radon decay scheme illustration (Kendall & Smith, 2002).
Figure 5. Thoron decay scheme illustration (Mc Laughlin et al. 2010).
2.5.1. Indoor Radon
Radon isotopes in the earth migrate in the soil layers, penetrate the soil-air interface and then
diffuse in the atmosphere (Baciu, 2005). The concentration of indoor radon varies according
to the geological location and the room ventilation of dwellings. In the areas with elevated
radon in air, its principal entry mechanism into the dwellings is a pressure-driven flow of soil
gas through cracks in the floor. In addition, the use of radon-rich groundwater for domestic
purposes could also enhance indoor radon exposure (Chambers, 2010). Indoor radon requires
a special attention because of its high dose contribution (ICRP Publication 60, 1991). Various
studies confirm the fact that residential radon is a risk factor for lung cancer (Pershagen et al.
15
1994; Barros-Dios et al. 2002; Krewski et al. 2005). It alone contributes to 3-14% of lung
cancer incidence worldwide (WHO, 2009), and to 9% and 10% of the lung cancer mortality
in Europe (Darby et al. 2005) and in the Nordic countries respectively (NRPA, 2011a). New
studies have revealed that nearly two thirds of radon induced lung cancers are attributed to
radon exposure to less than 200 Bqm-3, the level under which no measures were
recommended in the past (NRPA, 2011a). Indoor radon levels are also shown to be highest in
winter while lowest in summer season (Pinel et al. 1995; Baysson et al. 2003; Abd El-Zaher,
2011).
2.5.2. Outdoor Radon
The relative concentrations of radon and thoron also vary on the magnitude of the exhalation
rates and atmospheric mixing phenomena (UNSCEAR, 2000a). Generally, the outdoor
concentrations are not significant and the associated doses are not taken into account (Kávási
et al. 2010). The concentrations could vary diurnally by a factor of as high as ten
(UNSCEAR, 2000a). The highest concentration of radon is found in the early morning, while
the lowest values in the afternoon (e.g. Singh et al., 2005; Chan et al., 2010). This is because
in the morning, the earth is cooler than the higher air layers. After sunrise, solar radiation
warms up the earth surface faster than the air layers above it, which results in the process of
heat transfer. Eventually, the air closer to the earth goes up whilst cold air comes down to
replace the lifted air (Baciu, 2005). This all makes radon being readily transported upwards
and away from the ground during the day time. Similarly, during the night time, radon tends
to be trapped closer to the ground.
During the condition of strong winds, diffusion rates of radon, thoron and their progeny are
high resulting in their much lower concentrations near the ground level. On contrary to this,
during light winds, their accumulation occurs near the ground (Baciu, 2005). A high relative
humidity increases the attachment rates of radon progeny to the aerosol particles (El-Hussein
et al. 2001). The wind speed and atmospheric stability seem to be the most important factors
affecting radon and thoron progeny concentrations near the ground (Baciu, 2005). Radon
concentration also varies with seasons, and this issue is described in the results and
discussion section.
16
2.5.3. Radon in Norway
According to the survey carried out in 114 municipalities in Norway, annual mean indoor
radon concentration in the Norwegian dwellings was 89 Bqm-3, and 9 % and 3 % of the
dwellings were reported to have radon levels more than 200 and 400 Bqm-3 respectively
(Strand et al. 2001). Most of the Norwegians are exposed to low to moderate indoor radon
levels (Standring et al. 2010). Moreover, it is estimated that nearly 70 % of radon-induced
lung cancer mortality occurs due to the indoor radon exposures below 200 Bqm-3(Ibid). To
reduce the radon level as low as reasonably achievable, a new radon strategy has been
formulated in Norway. According to that, the action and maximum recommended indoor
radon levels are 100 Bqm-3 and 200 Bqm-3 respectively (Ibid). It is reported that about 1300
Nordic citizens die (10% of lung cancer mortality) from lung cancer each year due to
exposure to indoor radon (NRPA, 2011a). The radon levels in the Norwegian dwellings are
said to be among the highest in the world (Geological Survey of Norway, 2011). Indoor
radon has even been called “a national challenge” for Norway as it claims nearly 300 lung
cancer deaths annually (NRPA, 2011b). Indoor radon levels in the FC area were reported
higher; average 204 Bq m-3 and range 10-1250 Bq m-3 (Sundal & Strand, 2004).
2.5.4. Thoron: A Neglected Issue
It can be seen from the pooled analyses of radon assay carried out in the Europe and North
America that most of the indoor radon and thoron dosimetry are overlapped (Akiba et al.
2010). The data about thoron is limited and hence effects of thoron inhalation are largely
ignored (Tokonami, 2009; Ramachandran, 2010) and even underestimated in some situations
(Wiegand & Feige, 2002). Without the discriminative measurements of radon/thoron, the
uncertainty exists in radon measurements and its risk estimations (Tokonami et al. 2004;
Yamada et al. 2006; Tokonami, 2010). Therefore, it becomes vital that the exposures to
radon, thoron and their short-lived progeny should be dealt with separately. Due to the short
half-life of thoron, the top soil (few centimetres) is responsible for its exhalation (Winkler &
Aehlig, 1998) and it is difficult for thoron to travel from its production site to the immediate
environment of human beings (UNSCEAR, 2000a). Thoron concentrations are highly
dependent on the distance from the source term (Urosevic et al. 2008; Chen et al. 2009). In
some situations, the (indoor) doses from thoron are comparable to radon doses (Guo et al.
1992) or even higher than radon doses (Stranden, 1984; Tokonami et al. 2004; Mc Laughlin
et al. 2010). Therefore, thoron exposures should be taken into account while assessing doses
in situations where thoron levels are expected higher (Tokonami et al. 2004).
17
It can be assumed that thoron has more or less similar exposure pathways and effects as that
of radon. Unlike radon progeny that typically deposit their dose in the lung tissues, Pb-212,
the longer-lived decay product of thoron (half life= 10.6 hr), deposits dose to the lung
initially and then a large portion of it is deposited to other organs or tissues (Porstendörfer,
1994; Mohammed et al. 2000). Due to a short half life of thoron, a major dose to the lung is
delivered by its progeny not by thoron itself. Most of the thoron progeny are attached to
aerosol particles in the air as they have relatively long half-lives than that of the radon
progeny (Akiba et al. 2010). Because of this, it is unlikely that thoron progeny would give a
significant dose to bronchial mucosa (Ishikawa et al. 2007). However, a thoron progeny, Po216 (t1/2=0.15 s), the alpha emitter could be present in the unattached form in the air but it is
still unclear if this deposits a significant dose to bronchial mucosa (Akiba et al. 2010). So,
thoron progeny should be taken into account while assessing the possible lung cancer risk due
to thoron exposure (Ibid).
3. MATERIALS AND METHODS
3.1.
Field-work Description
The present work was carried out in the FC, which houses the largest amount of Th-232 in
Norway (Thorium report, 2008). The complex consists of a central intrusion and other
numerous satellite intrusions (Bergstøl & Svinndal, 1960). The complex has been described
for its unique geology with carbonate rocks of magmatic origin (Heincke et al. 2008). The
surface areas of the central complex are mainly occupied with rocks; sövite, rauhaugite,
rödberg and fenite (Sundal & Strand, 2004). The highest Th-232 levels were measured in
rödberg e.g. average level was 3100 Bq kg-1 (Ibid). In contrast, the Nordic rock types
typically contain Th-232 levels in range from 0.5-350 Bq kg-1(Nordic, 2000). Therefore, Th232 content of the rocks in the FC area has gained much interest lately (Thorium report,
2008). At the same time, radiological interest in the area has increased too. According to the
ICRP’s situation-based approach of classifying NORM/TENORM exposure sites (Valentin,
2007), radiation exposure in the FC can be called “existing exposure situation”.
The aim of this study was to assess the FC region in order to investigate ambient (outdoor)
gamma doses as well as radon and thoron concentrations. A radiation map (Figure 6) and
geographical location of the study sites (Figure 7) are shown below. In figure 6, the big
18
circled area is Fen and the small circled area at top left corner is Søve. Only five areas viz.
Bollodalen, Fengruve, Gruvehaugen, Rullekoll and Søve were included in the study since the
other neighboring sites (Fen school, Søve road, Ulefoss rest area, Skippervold, Torsness,
Rauhaugittvegen, Capelan Hydro) were observed with relatively lower mean ambient dose
rates (range; 0.09-0.37 µGy h-1). The study was a part of the project that had been undergone
in the FC region to monitor human and environmental risks of high radiation. The principal
investigator, along with other researchers in the Isotope Laboratory, UMB (Norwegian
University of Life Sciences), worked out the field study plan in detail. It was decided that the
study would be conducted in two seasons; autumn/winter and summer to perform ambient
(outdoor) radon/thoron and gamma absorbed dose rate measurements. The idea was to obtain
data from both seasons’, making it possible for a comparative approach to be used when
describing the results. The first study-season was planned to be carried out during September
to November (Autumn-Winter) 2009. Similarly, the other field study was planned to be
carried out during June-September (Summer-Autumn) 2010. In the first phase of the study,
many high gamma dose rate sites were recognized; dose rate values and Global Positioning
System (GPS) coordinates were recorded. The GPS coordinates of the region ranged more or
less from N59º16.40´; E09º18.40´ to N59º16.90´; E09º17.16´. The GPS used was Garmin
Zumo 10R-023626 GPS-software version 4.00.
In addition, some radon as well as radon-thoron detectors were also placed for continuous
measurements. In fact, five closed alpha track detectors were initially used to measure radon
over the different sites of the FC during the period of two months (September-November,
2009). These detectors reported radon concentration of 120-150 Bqm-3. Since these detectors
were said to be designed especially for indoor radon, they were discontinued in summer
surveys and their results are not further discussed in the present study. In the second phase of
the study, based on the autumn-winter gamma survey and available radon as well as thoron
results by then and the GPS coordinates, more number of radon-thoron detectors, along with
thermo luminescent dosimeters (TLDs) were planned to be set up at the FC sites. The GPS
coordinates were very helpful to maximize the reproducibility of the corresponding
measurement sites throughout the study period. Each of the the TLD as well as radon-thoron
detector had its unique code, which was recorded so that their spatial placement could be
recognized while interpreting the corresponding sites and doses.
19
Figure 6. Natural background radiation map of Fen Complex (source: Dahlgren, 1983).
Figure 7. A map of the Fen Complex with marked studied areas (source: www.finn.no).
20
3.2. Radiation Measurements
The measurements carried out in the study sites consisted of ambient gamma absorbed dose
rates as well as simultaneous radon and thoron concentrations. Some of the on-site glimpses
of dosimetric activities in the FC site are shown in the figure 8. The absorbed dose rates
(µGy/h) were measured with hand held Automess, Radiacmeter 6150 AD 4 LF, Serial no.
75859 (Automation und Messtechnik GmbH), which was calibrated with Cs-137 at Automess
GmbH. The measurements were carried out during the autumn (November 2009) and
summer (July 2010). The principle of an automess is described briefly in the next section. At
least 10 measurements were taken at the distance of one meter above the ground level of each
site, which was divided into a 10x10 m2 grid for the convenience. The similar grid system
was used for radiation surveys; in White Oak Lake Bed, USA, an experimental disposal site
for radioactive waste (Auerbach & Reichle, 1999) as well as in one of the highest background
radiation sites in India (Kerala) (Paul et al. 1998). All gamma absorbed dose rates in air at the
different measured sites were recorded. The average values of the dose rates (µGy/h) were
later calculated for each site for further dose calculations.
In addition, fifty IJS TLDs (thermo luminescent dosimeters) were used at the study sites
along with radon-thoron dosimeters for the period of two months (June-September, 2010).
The TLDs were tied to the branches/stems of the trees with a common strip that also held
radon-thoron detector one meter above the ground. The purpose of this was to achieve more
accurate gamma dose measurements that could exactly match with spatial and temporal
exposure scenarios of radon-thoron exposures. In addition, it was assumed that gamma
exposure and radon-thoron exposures could be examined with better accuracy. The type of
the TLDs used were TLD-IJS-05[CaF2: Mn], developed by Jožef Stefan Institute (JSI),
Ljubljana, Slovenia. The exposed TLDs were later mailed to JSI laboratory for dose readings.
TLDs are, in fact, widely used for occupational dose monitoring of radiation workers (Olko,
2010). Also, they can be used for environmental radiation monitoring (Arvela et al. 1995).
The IJS TLDs can read wide range of the radiation doses from 5 µSv-5 Sv (Zorko et al.
2005). The working principle of the TLD system is discussed briefly under the instruments
section.
Simultaneous outdoor radon and thoron measurements were conducted in the different sites
during autumn-winter (September-November, 2009) and summer-autumn 2010 (June 09September 07, 2010). Most of the sites were in the forest area. Eleven passive integrated
radon-thoron discriminative detectors (Raduet®) were placed for two months during the
21
period between September and November, 2009. But, a larger number (n=74) of the detectors
were placed for 2-3 months during the summer, 2010. All the detectors during the both
seasons were tied to the branches/stems of the trees lying one meter from the ground surface.
Only 72 radon-thoron detectors, of the summer measurements, were recovered from the study
sites for radon-thoron concentration readings.
The radon-thoron discriminative detectors were developed at the National Institute of
Radiological Sciences (NIRS), Japan and are well suitable for carrying out a large scale
survey (Tokonami et al. 2005). All the detectors, after having collected them, were mailed to
the NIRS for radon and thoron air concentration calculations. These detectors have already
been used in different countries (Tokonami et al. 2005; Chen et al. 2009; Ramola et al. 2010;
Mc Laughlin et al. 2010; Žunić, et al. 2010) to assess simultaneous radon and thoron
concentrations. Such simultaneous radon and thoron measurements are also necessary to
assess public exposure to radon precisely (Zhuo et al. 2002).
Figure 8. The glimpses of the on-site dosimetric activities in Fen Complex sites.
22
3.3. Instruments
The different instruments used in the study for gathering the radiometric data (of gamma,
radon and thoron) were automess, TLDs and radon-thoron discriminative dosimeters (Raduet
detectors). Their working principles are briefly described below.
3.3.1. Automess
An automess has an inbuilt Geiger-Müller Counter (GMC). GMCs are used to detect ionizing
radiation; typically gamma and beta radiation, but some models can detect alpha radiation
too. A GMC generally detects the presence and intensity of radiation (particle frequency,
rather than energy). The counter has a tube, the principal organ, which is a gas filled ion
chamber with a hollow cylindrical cathode and a thin central wire anode (Figure 9). When a
gas (e.g. Argon) is hit by an ionizing radiation through the chamber’s window, the ion pairs
are produced in the gas and get attracted by the opposite charge electrodes, which generate an
electrical signal (Choppin et al. 2002). The anode transfers the pulses of current through a
resistor in order to convert them into pulses of voltage. Then, the voltage pulses are recorded
by a counting device and eventually, an oscilloscope, LED screen, or other display conveys
the particle count to the user. The response range of the automess used in this study was 0.01
µGyh-1 - 9.99 mGyh-1.
Figure 9. An illustration of Geiger-Müller tube (Khandpur, 2008).
23
3.3.2. TLD
A TLD has a sensitive crystalline thermoluminiscent material (phosphor) such as lithium
fluoride (LiF), CaF2 etc. to absorb ionizing radiation (Attix, 2004). The absorption of ionizing
radiation causes some of the electrons in the molecules of the phosphor to absorb energy and
rise to higher energy levels or bands. When the irradiated crystals are heated, they
subsequently emit visible light. The intensity of this light is proportional to the amount of
radiation the crystal has absorbed, which is measured with a photomultiplier tube (Attix,
2004). TLDs are passive detectors that can integrate absorbed dose over a period of time so
that effective or equivalent dose can be calculated (Olko, 2010).
3.3.3. Raduet detector
Raduet® detector is cheap, compact and easy to handle. It eliminates thoron contamination
from radon detection response, and covers the upper detection limit up to at least 200–600 Bq
m−3 with a six month exposure, the reference level of the ICRP (Tokonami et al. 2005).
Moreover, it is efficient in measuring radon and thoron concentrations simultaneously with
its lower and higher detection limits of 5-1000 Bqm-3 and 15-1000 Bqm-3 respectively
(Tokonami et al. 2005). Figure 10 illustrates an overview of the detector. It has two different
diffusion chambers made of an electro-conductive plastic with cylindrical inner volume (~30
cm3). The detecting material used with it is CR-39, which is placed at the bottom of the
chamber with sticky clays. Radon can penetrate into the chamber via an invisible air gap
between its lid and bottom through diffusion. The air gap acts like a high diffusion barrier.
Thoron can barely get into the chamber with such a small pathway due to its very short halflife (55.6 s) compared with that of radon (3.82 days). To detect thoron more effectively, six
holes of 6 mm in diameter are opened at the side of the other chamber and are covered with
an electro-conductive sponge. In order to determine conversion factors of radon and thoron
concentrations, these detectors were placed into the radon and thoron chambers at NIRS
respectively (Tokonami et al., 2005). Following the exposure tests, CR-39 plates were taken
out of the chamber and chemically etched with a 6.25 M NaOH solution at 90 °C over 6 h,
and alpha tracks were counted with a track reading system (Tokonami et al. 2005). Then,
using two alpha track densities of low and high air-exchange rate chambers, radon and thron
concentrations could be obtained with the help of certain mathematical equations (Ibid).
24
Figure 10. An illustration of Raduet detector (Tokonami et al. 2005).
3.4. Dose Calculations
3.4.1. Gamma absorbed doses rates and doses
The gamma absorbed dose rates in air (µGyh-1) recorded over the each site (10mx10m grid
area) were averaged to get a representative value for that particular site. These dose rates are
also compared with the dose rates that were measured at the FC sites during summer (May)
and autumn (September) 2008 by a researcher at UMB. The contribution of cosmic radiation,
0.032 µSvh-1(UNSCEAR, 2000a), was subtracted from the measured dose rates. Annual
average effective dose for each area of the FC were estimated from the TLD read ambient
gamma absorbed doses by extrapolating the doses of measured period (63 days) during
summer 2010 and using the conversion factor 0.7 SvGy-1. This was used to calculate effective
dose with an outdoor occupancy of 20% (UNSCEAR, 1993). The occupancy factor
determines public doses from the radiation exposures (Arogunjo et al. 2004).
1.
Operational definitions
Absorbed dose: A physical dose quantity, which is a measure of mean energy absorbed per unit mass of a
matter (UNSCEAR, 2006a). SI unit = Joule kg-1 or Gy
Equivalent dose: It is the multiplication of absorbed dose in an organ or tissue and radiation-weighting factor
(UNSCEAR, 2000c). SI unit = Sievert (Sv)
Effective dose: It is the weighted sum of equivalent doses of organ or tissues in human body (UNSCEAR, 2006a).
SI unit = Sv
25
3.4.2. Radon/thoron doses
Radon and thoron doses were calculated from the outdoor radon-thoron concentrations
measured during summer 2010. The dose and risk estimation for radon and thoron are not
straightforward and simple. Annual effective doses and risk of lung cancer at each area of the
FC were estimated using different conversion factors available from epidemiological and
dosimetric studies. See the results and discussion section for the radon and thoron dose
estimation descriptions.
3.5.
Data Analysis (Statistics)
All the data were entered and analyzed using Windows Office EXCEL 2007 and Minitab 16.
Descriptive analyses were performed to explain the mean absorbed gamma dose/dose rates,
as well as mean (and range) of radon and thoron air concentrations measured during two
different seasons at five main areas of the FC. For all analyses, p-values <0.05 were
considered statistically significant.
3.5.1. Gamma absorbed dose rates and effective doses
1. The mean values of absorbed ambient dose rates for each area were calculated by
averaging the values of dose rates observed at measuring sites of the particular area.
ANOVA-Tukey test was performed to examine the mean dose rate variation in different
months of the measured areas.
2. Similarly, the mean annual effective doses for each area were compared using ANOVAtest. The comparison among the group of the areas was done using ANOVA-Tukey test.
3.5.2. Radon and thoron analysis
1. Mean concentrations of radon and thoron of each area were calculated based on the
measurements observed at various sites of the area.
2. Based on the closest GPS coordinates of the 11 locations, radon and thoron
concentrations of autumn and summer were compared.
3. T- tests for radon (autumn) and radon (summer) concentrations as well as for thoron
(autumn) and thoron (summer) concentrations were performed to examine any seasonal
differences.
4. ANOVA General Linear Models (with Tukey's test) for radon and thoron concentrations
vs. areas were also explored to see if their mean values were significantly different from
26
one another. Only summer data was considered for this since it accumulated larger data
set.
5. Pearson correlation between summer radon and thoron air concentrations was examined.
Similarly, a linear regression model was also explored.
6. Pearson correlations between radon concentration and gamma dose (mGy), and thoron
concentration and gamma dose were also examined. The concentrations of radon and
thoron and gamma doses considered were of summer only. Also, linear regression models
for gamma dose (mGy) with radon, and with thoron (Bq/m3) were explored.
3.5.3. Risk analysis of exposures
The public risk of cancers was estimated from the outdoor doses. The gamma doses were
assessed for the possible solid cancers and leukaemia while radon and thoron doses were
assessed for lung cancer.
3.5.3.1.
Risks from gamma exposures
According to the ICRP, a directly proportional relationship can be assumed in the low dose range
(below ~ 100 mSv) between the incidence of cancer or heritable effects and the increase in the
equivalent dose in the relevant organs and tissues (Valentin, 2007). It can be assumed that
protracted x-ray and gamma dose more than 50-100 mSv or acute dose 10-50 mSv increases
the likelihood of some cancers (Brenner et al., 2003). Therefore, it would be interesting to
estimate human risk for solid cancers and leukemia for each area in the FC. The risk of
cancers from gamma doses was calculated assuming that excess relative risks (ERRs) for
solid cancers and leukemia mortality are 0.4Sv-1 and 4.0Sv-1 respectively (UNSCEAR,
2006b). Since the concept of “relative risk” conceals background risk, ERR is preferred for
risk comparisons where unexposed reference group is included besides exposures, which
removes background risk (Suissa, 1999).
3.5.3.2.
Risks from radon and thoron exposures
There are two approaches for risk estimations from radon doses; “dosimetric approach”
where dose is estimated on the basis of deposition of radon decay products in the air
way/lung, and “epidemiological approach” which takes conversion factors into account from
the epidemiological studies on underground miners or residential radon (UNSCEAR, 2006a).
27
The concentration of potential alpha energy of short-lived decay products of radon/thoron are
estimated by assuming a state of equilibrium between the parent and daughter nuclides. The
concentration is expressed in terms of potential alpha energy concentration, PAEC, (in Jm-3)
or Working Levels (WLs), and Equilibrium Equivalent Concentration (EEC in Bq/m3)
(UNSCEAR, 2006a). The potential alpha-energy of an atom in the decay series is the total
alpha-energy emitted from the decay of parental atom until the stability is achieved. Hence,
the PAEC of any mixture of radon/thoron progeny in air would be the sum of the alpha
energies of these atoms present per unit volume of air (Winkler & Aehlig, 1998). In practice,
an equilibrium factor, Feq characterizes the state of equilibrium. Feq is defined as the ratio of
the actual PAEC to the PAEC that would exist if all the daughter products in each series were
in equilibrium with parent radon/thoron (UNSCEAR, 2006a).
In the present risk assessment, the epidemiological approach was used for estimating the risk
for radon exposure. However, in case of thoron, the dosimetric model is recommended to use
for risk assessment since there is paucity of the thoron epidemiological studies (UNSCEAR,
2006a; Chambers, 2010). It is emphasised here that both of the methods would be the
conservative and indirect approaches of risk estimation for the FC areas. In case of radon
exposure risk, it is assumed that people spent 20% of their time outdoor (ICRP, 1993; Abd
El-Zaher, 2011). To estimate the realistic risk from radon/thoron doses, it is important to
know the exact ambient concentrations of their progeny, which can be further related to other
dosimetric conversion factors like, working level (WL) and working level month (WLM)
(UNSCEAR, 2006a). The later values could thereafter be related to the doses to lung.
Considering the whole body’s tissue weighting factor of 1, equivalent doses from radon and
thoron were treated as effective doses. The WL and WLM are related to occupational
exposure of miners from radon/radon daughters. As a result, radon risk is estimated based on
a direct relationship of lung cancer incidence among miners and exposure expressed in WLM
(Lopez et al. 2004). A similar approach could be applied in understanding exposure from
radon and thoron (UNSCEAR, 2006a). Further risk estimation approach followed in this
study is explained in the related topic below.
2. Operational definitions
Working levels (WL): It is the any combination of short lived radon decay products (through Pb-214) per
liter of air that will result in the emission of 1.3 x 10⁵ MeV of potential alpha energy (UNSCEAR, 2006a).
Working level month (WLM): It is the exposure of 1 WL for the reference working during of one month
i.e. 170 hours (Lopez et al. 2004).
Equilibrium Equivalent Concentration (Bq m-3): The activity concentration of radon in equilibrium with its
progeny that has the same PAEC as the actual non-equilibrium mixture (UNSCEAR, 2006a).
28
4. RESULTS AND DISCUSSION
4.1.
Gamma dose rates
The five areas of the FC; Rullekoll (NORM) and Bollodalen, Fengruve, Grauvahaugen and
Søve (TENORM) areas showed a range of ambient absorbed dose rates. Of the four months’
measurements, the dose rate varied as; Bollodalen (1.62-4.47 µGy/h), Fengruve (0.77-4.06
µGy/h), Gruvehaugen (1.57-9.17 µGy/h), Rullekoll (0.48-5.53 µGy/h) and Søve (1.03-11.05
µGy/h). The mean values of the dose rates measured during different months/year at FC areas
are shown (Table 1 and Figure 11).
Table 1. Gamma ambient absorbed dose rates (µGy/h) in Fen Complex areas (mean+ SD)
Areas
May 2008
Sept. 2009
Nov.2009
Bollodalen
3.86 +0.42
3.84 +0.39
2.53+0.22
2.57+0.58
Fengruve
2.26 +1.24
3.42 +0.34
2.40+0.25
3.20+0.38
Gruvehaugen
6.12 +1.93
4.62 +0.49
2.34+0.51
3.14+0.16
NA
3.68 +1.22
1.47+0.60
1.16+0.46
3.00 +0.81
8.43 +2.46
3.72+0.42
2.45+1.14
Rullekoll
Søve
June 2010
NA: Not available, SD: Standard deviation
All the surveyed areas showed considerably higher ambient gamma absorbed dose rates,
compared with the average outdoor natural gamma dose rate for Norway 0.073 µGy/h
(Stranden & Strand, 1986), Finland 0.071 µGy/h (Arvela et al. 1995) and worldwide 0.058
µGy/h (UNSCEAR, 2010). The present findings can also be compared with the previous
results (Stranden & Strand, 1986) where mean outdoor gamma dose rates near the dwellings
of the FC were in the range of 0.15-2.0 µGy/h. Surprisingly, at Søvegruve (the past niobium
mining site) a few hot spots were noticed with the ambient gamma dose rates up to 11 µGy/h.
Though most of the Søve area was covered to reduce background radiation from the tailings
containing Th-232 and U-238 (Stranden, 1985), few hot spots were discovered during this
study.
29
Therefore, it is fair to assume that high dose rates are mainly due to Th-232 content of the
rock in the FC region. Rödberg rock in the area is reported of giving the highest gamma dose
rate of 2.7 µGy/h, and 97% of it is due to Th-232 alone (Stranden & Strand, 1986). In
contrast to this, only 32% of outdoor dose rate can be assumed due to Th-232 in the average
Norwegian situation (Ibid). According to the UNSCEAR (2010), the areas exceeding dose
rates of 0.3 µGyhr-1 are referred as Enhanced Natural Radiation Area (ENRA). This makes
all of the studied sites in the FC to be ENRAs.
4.2.
Variation of gamma dose rates
The bar diagram (Figure 11) shows the variation of ambient absorbed dose rates measured at
the five areas of the FC. ANOVA-Tukey analyses showed the monthly variation of mean dose
rates for all the areas. The mean dose rate measured in September at Søve was significantly
higher (p<0.05) than that measured in the other months. Gruvehaugen had a varying dose
rates; the mean dose rate in June and November were significantly lower (p<0.05) than that in
May and September. Similarly, in Rullekoll, mean dose rate in September was significantly
higher (p<0.05) than that in June and November. Bollodalen showed significantly lower
(p<0.05) mean dose rates in June and November than that in May and September. In
Fengruve area, the mean dose rates in November and May were found significantly lower
(p<0.05) than that in September and June.
ANOVA-Tukey tests were also performed to test if the mean dose rates at different areas
during spring (May and June) and autumn (November) make any variation. In Søve, the mean
dose rate in the autumn was found significantly higher (p<0.05) than that in the spring. The
spring mean dose rate in Gruvehaugen was significantly higher (p<0.05) than that in the
autumn. However, the mean dose rate in Rullekoll in the spring (of June) was observed
significantly lower (p<0.05) than that in the autumn. The mean dose rate of Bollodalen in the
spring was noticed significantly higher (p<0.05) than that in the autumn. In Fengruve, the
mean dose rates in the spring and autumn showed no significant difference (p>0.05).
The dose rate variation in the different months observed in this study are also in line with the
variation trends reported elsewhere, like in Sweden (see Almgren & Isaksson, 2009). The
dose rate variation observed in this work can be attributed to the content of Th-232 and U238 and their gamma emitting progeny. The contribution of K-40 gamma from the soil/rock
of the area should also be responsible for that.The possible gamma contribution from Cs-137
30
(from the fallout of Chernobyl) and U-235 (naturally present) in the background soil/rock is
assumed negligible.
Figure 11. Mean absorbed gamma ambient dose rates at the Fen Complex areas.
4.3.
Effective gamma doses
The doses were found to be significant in the FC areas. Table 2 shows mean and range of
estimated annual effective doses (mSv) assuming that people in the area would spend 20% of
their time (1752 hours per year) outdoor in these particular areas. The results of this study
showed that, except for Søve, all studied areas had mean effective gamma doses in range
1.17–2.48 mSv, exceeding the mean annual effective dose value in Norway due to the natural
external gamma radiation, and the average value of annual effective dose from external
natural gamma radiation as given by Stranden & Strand (1986) is 0.5 mSv. The
corresponding average value for global is 0.48 mSv (UNSCEAR, 2010). The high gamma
doses at the FC areas are due to the different rocks in the area which contain excessive Th232 concentration (along with considerable U-238), which are the progenitors of gamma
radiation. Stranden & Strand (1986) reported the annual gamma effective doses for public in
Fen area; 2.1 mSv (for wooden house residents) and 2.6-4.8 mSv (for rock house residents),
which were the sum of both indoor and outdoor gamma doses. Comparable mean annual
effective doses due to external background radiation, from both indoor and outdoor
31
occupancy (100%), similar to this study results were reported for a few high NORM sites
worldwide: 6 mSv in Iran, 3.1 mSv in India and 2.1 mSv in China (Hendry et al. 2009). It is
highlighted that the results of the present study are exclusively of outdoor exposure situations
(20% occupancy) unlike mentioned above.
The box plot with mean connecting lines below (Figure 12) further illustrates the variation of
estimated annual effective doses at the different FC areas. Even though, there are few people
living near to some of the high gamma dose sites, their possible time spent perticularly
at/around these high dose areas could be interesting to examine. If we assume that mean
annual gamma effective dose received by an individual spending his/her 50 % (4380 hrs per
year or 12 hours per day) of time in Bollodalen area would be 4.4 mSv. Similarly, at the
same area, lets say, spending three hours per day would result the effective annual dose of 1.1
mSv. These estimatuions reinforce the fact that the likely doses are unignorable.
Table 2. Annual effective gamma doses in the Fen Complex areas
Areas
Doses (mean+SD)
Range
Bollodalen (N=10)
1.76 +0.69 mSv
0.98-3.16 mSv
Fengruve (N=8)
2.48+0.54mSv
1.58-3.22 mSv
Gruvehaugen (N=12)
2.02+0.61mSv
1.31-3.25 mSv
Rullekoll (N=10)
1.17 +0.19 mSv
0.88-1.58 mSv
Søve (N=10)
0.36+0.38 mSv
0.12-1.43 mSv
N: Number of TLDs placed
32
A boxplot of annnual e ffe ctive dos e s at Fe n Comple x are as
3.5
Annual eff.doses (mSv)
3.0
2.5
2.0
1.5
1.0
0.5
0.0
Bollodalen
Fengruve
Gruvehaugen
Rullekol
Søve
Figure 12. A box plot of annual effective gamma doses at Fen Complex areas.
The mean annual effective doses were compared for any significant differences in radiation
levels for the measured areas. The difference in the effective doses at the FC areas are mostly
due to the corresponding Th-232, U-238 and K-40 contents of the soil. The global average
contribution annual effective dose due to K-40 ingestion is 0.17 mSv (UNSCEAR, 2010).
ANOVA-test showed a statistically significant difference (p<0.05) among the areas studied.
Furthermore, the group comparison among the areas using ANOVA-Tukey test showed that
mean effective dose in Fengruve was significantly higher (p<0.05) than that in Bollodalen,
Rullekoll and Søve. Similarly, the mean effecive dose in Søve was significantly lower
(p<0.05) than that estimated for the other areas. Søve area had lower dose compared to the
other areas becuase the ground of Søve was covered in order to attenuate background gamma
radiation (Stranden, 1985).
4.4.
Radon and thoron measurements
The study showed that thoron concentrations were much higher than the radon concentrations
at all of the sites except for the value of Søve area in the autumn. The concentrations of radon
in the FC areas were recorded from upto 13 Bqm-3 in the autumn and upto 210 Bqm-3 in the
summer. Similarly, thoron concentrations were recorded up to 1156 Bqm-3 in the autumn and
up to 4996 Bqm-3 in the summer. The seasonal radon and thoron variation during summer
and autumn were examined. Table 3 and 4 show the measured radon and thoron
33
concentrations at the five areas during autumn 2009 and summer 2010 respectively. The
concentrations during the autumn and summer were compared for 11 locations that had the
closest GPS co-ordinates. Even though the number of locations compared were not many, it
still makes sense to compare the results.
Table 3. Radon and thoron air concentrations (Bqm-3) in the Fen Complex areas (Autumn 2009)
Areas
Radon
Thoron
*Mean Min. Max.
Bollodalen (N=3)
*Mean
Min.
Max.
7+ 2
5
9
608+ 325
339
969
Fengruve (N=2)
-
ND
ND
445 +259
262
628
Gruvehaugen (N=2)
-
ND
ND
942+ 122
855
1029
Rullekoll (N=3)
7 +5
4
11
1000+137
896
1156
Søve (N=1)
13+ 1
ND
13
7 +2
ND
7
*Mean+SDs, N: Number of detectors placed, ND: Not Detected
Table 4. Radon and thoron air concentrations (Bqm-3) in the Fen Complex areas (Summer 2010)
Areas
Radon
Thoron
*Mean
Min.
Max.
*Mean
Min.
Max.
Bollodalen (N=12)
67+44
ND
157
1294+863
284
2821
Fengruve (N=12)
62+60
ND
210
1442+115
765
4996
Gruvehaugen (N=21)
52+36
ND
120
1786+860
495
3495
Rullekoll (N=14)
40+26
ND
72
1231+339
709
2047
Søve (N=13)
24+12
ND
38
91+90
24
362
*Mean+SDs, N: Number of detectors placed, ND: Not Detected
4.4.1. Radon variation
The mean value of radon for all measured locations in autumn (4.5+5 Bqm-3) was
significantly lower (p<0.05) than that in summer (56+50 Bqm-3). During the autumn, Søve
area showed the highest mean radon concentration (13 Bqm-3) and Fengruve and
Gruvehaugen areas had the concentrations below the detection limit. However, mean summer
34
radon concentration in Søve area recorded the lowest (24 Bqm-3). One of the reasons of this
could be the placement of greater of number of detectors over larger area during the summer,
which brings down the mean value lower. Of total measured locations (N=72), the highest
value of radon (210 Bqm-3) was recorded at one of the locations in Fengruve area. Figure 13
below further illustrates the comparison of autumn and summer radon concentrations. Based
on the summer radon concentrations, ANOVA General Linear Model (Figure 14) showed no
statistically significant difference (p>0.05) in the radon levels of the measured areas.
It is also relevant to compare the mean concentrations of outdoor radon reported in different
countries; Hong Kong 9.3 Bqm-3 (Chan et al. 2010), Korea ~17 Bqm-3 (Chung et al.1998),
New Mexico 12.5 Bqm-3 (Wasiolek & Schery, 1993), Taiwan 10 Bqm-3 (Iimoto et al. 2001),
Japan 6.1 Bqm-3 (Oikawa et al. 2003), China 9 Bqm-3 (Iida et al. 1996) and global 10 Bqm-3
(UNSCEAR, 1993, UNSCEAR; 2006a). The FC region showed higher radon levels than the
global value and the reported values of the countries, which is because of the higher uranium
content in rocks of the region (Heincke et al. 2008).
Outdoor radon levels during different seasons of the year have been studied in different
places and it was mostly found that the levels are lower during summer and higher during
autumn-winter seasons (Iida et al. 1996; Oikawa et al. 2003; Sesana et al. 2003; Chan et al.
2010), which is the opposite of the findings in this study. It should be acknowledged that the
Norwegian soil and weather parameters (like soil and air humidity, air turbulance,
temperature etc.) are not similar to that of above studied countries. Soil humidity/moisture
content affects radon exhalation rates (Baciu, 2005; Hosoda et al. 2007). It is reported that
with soil moisture content up to 8%, the measured radon and thoron exhalation rates tended
to increase but with the higher soil moisture content, the rates would decreased steadily
(Hosoda et al. 2007). In the FC, soil moisture during autumn is supposed to be higher that
subsequently gave rise to lower radon exhalation.
35
Figure 13. Radon concentrations in the Fen Complex sites during autumn and summer.
ANOVA General Linear Model for Radon vs. Areas
Mean radon concentrations (Bq/m3)
70
Fitted Means (p>0.05)
60
50
40
30
20
Bollodalen
Fengruve
Gruvehaugen
Sites
Rullekol
Søve
Figure 14. A General Linear Model for radon at Fen Complex areas.
36
4.4.2. Thoron variation
The mean value of thoron for all measured locations in autumn (691+367 Bqm-3) was
significantly lower (p<0.05) than that in summer (1593+797 Bqm-3). It should be kept in
mind that autumn and summer concentrations of both radon and thoron might make some
realistic discrepancies while comparing the mean values for any particular area because the
compared locations (N=11) might have little mismatchings in the geographic locations
despite the investigator’s serious attempts to maximize the spatial reproducibility of GPS
coordinates of the locations. Therefore, the results should be acknowledged accordingly.
In the autumn, Søve area showed the lowest mean thoron concentration (7 Bqm-3), while
Rullekoll area showed the highest mean (1000 Bqm-3) and maximum value (1156 Bqm-3)
among all surveyed sites. Of all sites, one of the sites in Fengruve area recorded thoron
concentration of 4996 Bqm-3 during the summer. Table 3 and 4 show the thoron
concentrations recorded at the five areas during autumn and summer respectively. Figure 15
further illustrates a comparison of autumn and summer concentrations of thoron.
The average values of outdoor thoron elsewhere were reported; global 10 Bqm-3(UNSCEAR,
2006a), for a few places in the USA, Canada, Thailand and Finland 12 Bqm−3 (Harley et al.
2005), New Jersey, USA 15 Bqm-3 (Harley et al. 2010) and Japan 9.5 Bqm-3 (Doi &
Kobayashi, 1994). In the dwellings located in the elevated Th-232 in Sweden, mean value of
thoron concentration was found to be 30 Bqm-3 (max. 430 Bqm-3) (Mjönes et al. 1995).
While comparing these values with the results of the present study, it is clear that high thoron
concentration in the FC region is due to high Th-232 bearing rocks in the area.
ANOVA General Linear Model (Figure 16) showed statistically significant different thoron
concentrations at different areas (p<0.05). ANOVA-Tukey test confirmed that the
concentration of thoron at Søve area was significantly lower than the rest of the areas
(p<0.05). This is obviously due to the covered ground surface of Søve that reduces thoron
exhalation.
The atmospheric thoron concentration decreases much more rapidly with height than the
concentration of the longer-lived radon (Jacobi, 1972). Outdoor thoron is reported of showing
a significant difference in its vertical concentration distribution (within 1 meter distance from
the ground) unlike outdoor radon (Doi & Kobayashi, 1994). These facts make sense that
thoron concentrations at the immediate vicinity of the ground level of the FC areas would
have been recorded much more higher than the concentrations measured in the present
37
studies. It is also interesting to mention the findings of a study carried out in a semi-natural
location in the southern Germany, which continuously measured thoron progeny for seven
years (Winkler & Aehlig, 1998). They reported high average thoron daughter concentrations
during May and August-October, and low concentrations during November-February.
Winkler & Aehlig (1998)
also suggest that the possible reasons for the low thoron
concentration during the winter could be due to the limited exhalation of thoron because of
snow cover and/or frozen soil. But, to the surprise, radon progeny concentration was not
found distinctly lower in winter than in summer, and this could be because the longer-lived
radon could be able to diffuse from a greater depth of soil and has time to diffuse through
snow cover and/or frozen soil layers (Ibid, 1998).
Like radon, thoron exhalation rates are also affected by soil humidity/moisture content
(Hosoda et al. 2007). With the higher water content in the soil of the FC during the autumn,
water might have retained more thoron giving rise to its lower exhalation. Since radon-thoron
was measured until the second week of November while some snow coverage was there,
above statement makes sense. The snow layer could hamper thoron exhalation rates in air
(Baciu, 2005). Baciu’s study in Romania noted thoron (progeny) concentrations to be highest
in autumn and lowest in winter (Ibid). The above findings cannot be directly compared with
the present study due to different type of seasonal variations in the both of countries.
Figure 15. Thoron concentrations at Fen Complex areas during autumn and summer.
38
ANOVA General Linear Model for Thoron vs. Areas
Mean thoron concentrations (Bq/m3)
2000
Fitted Means (p<0.05)
1500
1000
500
0
Bollodalen
Fengruve
Gruvehaugen
Sites
Rullekol
Søve
Figure 16. A General Linear Model for thoron at Fen Complex areas.
4.5. Radon and thoron concentration-relationship
Since radon and thoron exist in atmosphere together due to their co-existing parental nuclides
(U-238 and Th-232) in the rock/soil, the examination of their correlation makes sense. A
moderate correlation was observed between radon and thoron since Pearson correlation
coefficient (r) was found to be 0.697 (p<0.05). Moreover, a linear regression model for radon
and thoron concentrations was also established (Figure 17);
Thoron=426.3+16.53 Radon (p<0.05 and R2=48.6%)
The regression equation could help estimate the concentration of one of them (e.g. thoron)
when the other’s concentration (e.g. radon) is known.
39
Linear Regression Model
Thoron = 426.3 + 16.53 Radon
S
R-Sq
R-Sq(adj)
5000
681.098
48.6%
47.9%
Thoron (Bq/m3)
4000
3000
2000
1000
0
0
50
100
Radon (Bq/m3)
150
200
Figure 17. A Linear Regression Model of radon and thoron air concentrations.
Pearson correlations of both summer radon and thoron concentrations with summer gamma
doses were examined, and they showed a moderate positive correlation between both of the
groups (radon and gamma; r=0.56, p<0.05, and thoron and gamma; r=0.63, p<0.05). These
results were so since gamma doses are also dependent on the activity of K-40 besides Th-232
and U-238 activities. Clouvas et al. (2006) and Almgren et al. (2008) did not find any
significant correlation between indoor radon/thoron concentrations and gamma dose rates.
Similarly, the regression analyses of both of the groups gave the equations;
i) Gamma dose=1.29+0.000693 Thoron (R2=40.7%, p<0.05)
ii) Gamma dose = 1.10+0.0172 Radon (R2=31.7%, p<0.05).
Linear Regression Models for gamma doses vs. radon and thoron concentrations are shown in
figures 18 and 19 respectively. They were examined because radon progeny (Pb-214 and Bi214) and thoron progeny (Pb-212, Bi-212 and Tl-208) give off gamma radiations of various
energies (Pfennig et al. 1998). It is noted that the regression line in case of gamma-thoron
analysis is better fitted as expected (higher R2 value), which could be due to more number of
gamma rays by its progeny. Nevertheless, in both of the cases, gamma dose may not be solely
40
related to the presence of radon/thoron in air. It is because the measured gamma doses are
also contributed by the presence of other nuclides in the area.
Linear Regression Model
Gamma dose = 1.103 + 0.01722 Radon
5
S
R-Sq
R-Sq(adj)
0.905849
31.7%
30.2%
Gamma dose (mGy)
4
3
2
1
0
0
50
100
150
200
Radon (Bq/m3)
Figure 18. A Linear Regression Model of gamma dose and radon at Fen Complex areas.
Linear Regression Model
Gamma dose = 1.292 + 0.000693 Thoron
5
S
R-Sq
R-Sq(adj)
0.844060
40.7%
39.4%
Gamma dose (mGy)
4
3
2
1
0
0
1000
2000
3000
4000
5000
Thoron (Bq/m3)
Figure 19. A Linear Regression Model of gamma dose and thoron at Fen Complex areas.
41
4.6. Radon and thoron doses
It is believed that organs other than lung like stomach, intestinal organs, skin, gonads etc. also
get small doses from radon progeny (Kendall & Smith, 2002). The organs/tissues containing
higher fat are considered more radon-sensitive (Ibid). The doses to organs except the
respiratory tract depend on the rate of radon/radon progeny clearance by the blood (Ibid).
Nonetheless, there seems a consensus that the doses to the other tissues or organ can be
regarded as nearly negligible (ICRP, 1981; UNSCEAR, 2006a).
The EECs (and, doses) of both radon and thoron progeny were estimated using equilibrium
factor (Feq). Firstly, the EECs of ambient radon/thoron for each FC locations were calculated
using the relationship, EEC (Bq m-3) = Feq x (Conc. of radon/thoron in Bqm-3) (Lopez et al.
2004). Then the EECs were related to WL as; 1 Bqm-3 of EEC=0.27 mWL (for radon) and
3.64 mWL (for thoron) (UNSCEAR, 2006a). Temporal (time spent) and spatial factors
(extent of human contact) in relation to the source of exposures are important to consider
while estimating doses. For the present dose estimations, it is assumed that the concentrations
of radon/thoron would be the same throughout the year, which, of course, is not true. The
outdoor occupancy factor of 0.2 (Winkler & Aehlig, 1998) was also considered while
estimating the doses. The doses for members of the public from radon/thoron were estimated
using the conversions; 3.4 mSvWLM-1 and 10 mSvWLM-1 for thoron and radon progeny
respectively (ICRP, 1993). The same dose conversion method was also used for workers in
the FC mines by Solli et al. (1985).
The value of indoor radon Feq is 0.4 (UNSCEAR, 2006a; Abd El-Zaher, 2011), and 0.66 for
outdoor radon progeny (Wasiolek & Schery, 1993). Ramola et al. (2003) reported Feq values
for radon and thoron for the Indian houses; 0.28 for radon is and 0.09 for thoron. It is noted
that Feq value for radon/thoron varies according to their content in air (e.g. for indoor; room
ventilation) during different seasons (Ibid). Since there is a large spatial variation of thoron
concentration in a room or atmosphere, the use of a Feq value gives large variations. In
Sweden, indoor thoron Feq was reported 0.005 suggesting the practical limitation of thoron Feq
factor usage, and thoron progeny concentration should be more homogeneous than that of thoron
(Mjönes et al. 1995). The UNSCEAR (2006a) continues endorsing outdoor and indoor thoron
Feq values of 0.003 and 0.02 respectively. The Feq values for the same entities reported by
Harley et al. (2010) are 0.004 and 0.04 respectively. Ramachandran (2010) and Kant et al.
(2009) suggest the outdoor thoron Feq of 0.1. Despite the different Feq values of outdoor
42
radon/thoron in the available literatures (Ramola et al. 2003), the value of 0.7 (for radon) and,
0.003 (UNSCEAR, 2006a) and 0.1 (Kant et al. 2009) for thoron were used for the present
dose estimations. This would also provide readers the comparative results from both (high
and low) thoron Feq values. To estimate the accurate doses, the measurement of radon/thoron
progeny concentrations in the area is mandatory. Table 5 summarizes the mean annual
effective doses from radon and thoron in the FC areas.
It is emphasized that the estimated effective doses due to gamma, radon and thoron in the FC
area are only outdoor doses. It is generally believed that indoor doses are much more higher
than outdoor doses because of the longer time spent inside dwellings by the people and the
higher radon concentrations therein. Besides radon, higher indoor thoron concentration could
also be the case where the rocks/soils in the dwelling area has higher Th-232 levels. It was
estimated that annual effective dose to the average Swede from indoor thoron exposure is 0.1
mSv, while corresponding radon value is 2 mSv (Mjönes et al. 1995). In many countries, thoron
account for 5-10 % of the annual dose received by the public (McLaughlin, 2010). The
findings of the present study suggest that all of the thoron doses (with Feq=0.003) at the FC
areas (except Søve) are much higher than the above mentioned Swedish indoor thoron dosevalue, and radon doses (outdoor) are comparable with global average indoor radon dose of
1.15 mSv (UNSCEAR, 2010). Furthermore, thoron doses reported in this study (with
Feq=0.01) are suprisingly higher. There is paucity of information about the indoor thoron
doses in the FC dwellings and their close vicinities. Stranden (1984) estimated that the
effective dose at the previous iron mine of the FC due to thoron daughter inhalation was 10
times higher than that of radon daughter inhalation. Fengruve, the site for iron mining, was
estimated to show the mean thoron dose more than 11 times higher (with Feq=0.1) than the
radon doses, however, it becomes nearly three times lower than radon doses with the lower
thoron Feq value (0.003). It should also be noted the dose estimated in our study and that in
Stranden’s study might not represent the exact locations.
43
Table 5. EECs (Bqm-3), annual effective doses (mSv) due to radon and thoron exposures in Fen
Complex.
Areas
Radon
*EECs2
Thoron
*Doses1
*EECs
*Doses
*EECs1
*Doses2
Bollodalen
56+25
1.55+0.7
4.11+2.8
137+93
0.52+0.3
17.5+11.9
Fengruve
64+37
1.78+1
4.73+4.2
157+141
0.6+0.5
20+18
Gruvehaugen
44+18
1.22+0.5
5.82+2
194+70
0.7+0.2
24.7+8.8
Rullekoll
38+11
1.05+ 0.3
3.96+1
132+34
0.5+0.1
16.8+4.4
Søve
20+3
0.6+ 0.1
0.22+ 0.1
7.5+4
0.03+0.01
0.95+0.5
*mean+SDs, 1Estimations with Feq=0.003, 2Estimations with Feq=0.1
4.7. Human risk assessment
The radiation exposures in the FC area were found to be considerable, therefore, the risk
assessment for the human in the area is important. Cancers viz. solid cancers and leukaemia
for gamma doses, and lung cancer for radon and thoron doses, were considered as the
assessment end points in the present risk analyses.
4.7.1. Risk from gamma doses
The risk estimation of cancers was performed on the basis of calculated annual effective
doses in the areas and the recommendations of the UNSCEAR (2006b). The ERRs for soild
cancers and leukaemia were estimated and summarized (Table 6). The present study
estimated the ERR of leukaemia to be ten times higher (0.001-0.01) than that of solid cancers
(0.0001-0.001). Of all the studied areas, Gruvehaugen was estimated for the highest ERRs of
solid cancers (0.0008) and leukemia mortality (0.008).
44
Table 6. Mean annual excess relative risks (ERR) of cancers due to gamma doses at the Fen Complex
areas
Areas
Gamma ERRs
Solid Cancers
Leukaemia
Bollodalen
0.0007
0.007
Fengruve
0.001
0.01
Gruvehaugen
0.0008
0.008
Rullekoll
0.0004
0.004
Søve
0.0001
0.001
It is important to consider that these risk estimates are not factual since they were derived
from the extrapolation of cancer risks observed from the life span study of survivors of
atomic bombings in Hiroshima and Nagasaki. The exposure situation in Hiroshima and
Nagasaki was of acute high-dose type, however, the situation in the FC is of chronic lowdose type, therefore, the above risk estimates should be interpreted accordingly.
The evidences from the HLNRAs in Yangjiang, China, and Kerala, India, with average annual
effective doses are 6.4 mSv and 5.5 mSv (including internal exposure) respectively (Hendry
et al. 2009) are relevant to discuss. Those evidences provide realistic assessments of the
health effects from the chronic natural radiation exposure to humans. It is very important that
the results of these studies should not be over-interpreted due to the limitations associated
with them (Hendry et al. 2009). The Chinese study, which was followed for 16 years with a
cohort of 125,079 residents (Tao et al. 2000; Sun et al. 2000) and an Indian study, which was
followed for 10.5 years with a cohort of 385,103 residents (Nair et al. 2009) in those HBRAs
were interesting. Both of the studies did not show any increased risks from the radiation
exposures compared to control population (Hendry et al. 2009; Nair et al. 2009). Similarly,
no increased cancer incidence was reported in the VHLNRA in Iran, where radiation dose of
up to 260 mSvyr-1 plus radon exposure up to 3700 Bqm-3 exists (Mortazavi et al. 2005a;
Mortazavi et al. 2005b)
It has been argued that chronic exposure to very high natural background radiation levels
could contradict our present conservative radiation protection regulations (Mortazavi et al.
2002). Interestingly, it is suggested that inhabitants of high natural radiation area might
develop cytogenetic radioadaptive response (Monfared et al. 2003; Mohammadi et al. 2006).
It is the resistance shown by the cells towards higher radiation doses (acute) when they have
45
been already exposed to lower amount of doses (chronic). Therefore, it is reasonable to hope
that similar response among the inhabitants of the FC region can be expected. The
radioadaptive response would not necessarily protect from the induction of cancers or genetic
mutations since cancers/mutations can be caused by the other carcinogens or mutagens.
4.7.2. Risk from radon and thoron
The ERRs of lung cancer, in this study, were estimated using the two assumptions;
a) 1 WLM gives dose equals to 10 mSv for radon, or 3.4 mSv for thoron (ICRP, 1993).
b) Mean excess relative risk for lung cancer is 0.0026WLM-1 (UNSCEAR, 2006a).
The estimates derived here are non-realistic since all the conversion factors were adopted
from different kinds of exposure situations unlike that of the FC. The mean annual excess
relative risk of lung cancers from radon and thoron doses were estimated (Table 7).
Table 7. Excess relative risks (ERRs) of lung cancer due to radon and thoron doses in Fen Complex
areas
Areas
ERRs (Radon)
ERRs1 (Thoron)
ERRs2 (Thoron)
Bollodalen
0.0004
0.0004
0.013
Fengruve
0.0005
0.0004
0.015
Gruvehaugen
0.0003
0.0005
0.019
Rullekoll
0.0003
0.0004
0.0128
Søve
0.0001
0.00002
0.0007
1
Estimations with Feq=0.003, 2Estimations with Feq=0.1
According to a study performed among niobium miners of the FC, an association between
radon/thoron exposure and lung cancer was observed (Solli et al. 1985). Even though radon is
most important for lung cancer risk, there are a few studies that showed its risk for nonmelanoma skin cancers (Eatough & Henshaw, 1995), myeloid leukemia, cancer of kidney,
melanoma and some childhood cancers (Henshaw et al., 1990), and other non-cancerous
diseases like multiple sclerosis (Bølviken et al., 2003; Gilmore & Grennan, 2003) or motor
neuron disease mortality (Neilson et al. 1996). However, the report on biological effects of
ionizing radiation (BEIR VI, 1999), unequivocally, suggests that no excess cancer risk other
than lung cancer can be attributed to radon exposure so far (BEIR VI, 1999). Amid the
different findings on the radon exposure risks, it has also been estimated that 1-10% of non46
melanoma skin cancers in the UK might be caused due to exposure to radon concentration at
20 Bqm-3 (Eatough & Henshaw, 1995). Besides, indoor radon in the UK (average conc. of 20
Bqm-3) is estimated to cause 5 % childhood leukaemia and 4% of adult leukaemia (Henshaw
& Allen 2001).
There is little known about the effects of the chronic low-dose exposures to humans like the
situation in the FC. But, the knowledge about the risks arising from such chronic low-dose
scenerios has relevance from the societal perspective (Brenner et al. 2003). The natural
background radiation in Great Britain is said to be causing 15-20% of childhood leukaemia
(Little et al. 2009). The average annual natural background radiation dose of the UK
population is 2.2 mSv (Environmental Agency, 2011). The above findings (Little et al. 2009;
Henshaw & Allen, 2001) can be relevant to relate with the possible risks for the FC
population too. In addition, it can also be questioned if the exposures in the FC could also
have any environmental implications. The preliminary results have indicated that impacts on
non-human biota might be likely in the area (Mrdakovic Popic et al. 2011).
The behavior of public in the NORM/TENORM areas largely determines the extent of
exposure people are likely to receive. It is essential to notice that all of the high level
radiation areas of the FC are in the distance of 1.12 to 2.23 kilometres from the nearest town,
Ulefoss. Ulefoss, at present, has 2700 inhabitants (Nome Kommune, 2011), while 350
dwellings within the FC area were reported in the year 2004 (Sundal & Strand, 2004).
Gruvehaugen, which is located ~ 0.3 km from Fen School was noted with the highest mean
thoron dose (0.7 mSvyr-1), second highest mean gamma dose (2.2 mSvyr-1) and considerable
mean radon dose (1.22 mSvyr-1). Similarly, the other high gamma exposure sites like
Bollodalen, Rulekoll and Gruvehaugen are also not far away from human settlements.
Moreover, Bollodalen, Rulekoll and Gruvehaugen (high dose sites) are very close to the
houses, public risk in these sites should not be overlooked as the cumulative risk would be
from the combined exposures of radon, thoron and gamma rays. A summary table (Table 8)
of mean annual effective doses from gamma, radon and thoron is given. A bar diagram
(Figure 20) also illustrates means of effective doses due to gamma, radon and thoron at the
FC areas. The high radiation sites in the forest area of the FC should also be important to
consider since the public utilization of those areas/sites for recreational activities like picnic
etc. could pose the risks. Therefore, the concern authority in the areas should think to apply
necessary interventions to limit the public exposures. According to the ICRP’s
47
recommendation (ICRP, 2005), the area would need action to keep the public radiation
exposures as low as reasonably achievable, which in turn, could reduce the likelihood of any
stochastic effects like causation of cancers or mutations.
Table 8. A summary of mean annual effective doses (mSv) from outdoor gamma, radon and thoron at
Fen Complex areas.
Areas
Gamma doses
Radon doses
*Thoron doses
Bollodalen
1.76 +0.69
1.55+0.7
0.52+0.3
Fengruve
2.48+0.54
1.78+1
0.6+0.5
Gruvehaugen
2.02+0.61
1.22+0.5
0.7+0.2
Rullekoll
1.17 +0.19
1.05+ 0.3
0.5+0.1
Søve
0.36+0.38
0.6+ 0.1
0.03+0.01
Mean+SD, *Doses estimated with Feq=0.003
Figure 20. Mean annual effective doses due to gamma, radon and thoron in the Fen Complex areas.
48
It is observed that gamma dose seems the largest dose contributor in all the areas (except
Søve). The cumulative doses from the table 8 can be compared with the mean annual
effective dose to the Norwegian population (2.9 mSv) from natural background radiation
(Sundal & Strand, 2004).
5.
CONCLUSIONS
The present study estimated that the FC areas have both high natural background out door
gamma dose rates (1.16-8.43 µGy/h) as well as high out door radon (7-210 Bqm-3) and thoron
(7-4996 Bqm-3) concentrations. All of these values are noticeably higher than the average
corressponding global values. The concentrations of both radon and thoron were measured
considerably lower during the autumn than that in the summer. Similarly, the estimated
ranges of mean annual effective doses due to the natural radiation in the FC areas were also
observed remarkebly high; gamma (0.36-2.48 mSv), radon (0.6-1.78 mSv) and thoron (0.030.7 mSv). The TENORM areas (except Søve), showed higher dose values than the NORM
area in the region.It is also noted that the estimated doses in all areas, except Søve, exceeded
the ICRP’s recommended annual dose limit of 1 mSv to the general public. Similarly, the
cumulative outdoor annual effective doses at all the FC areas (except Søve and Rullekoll)
already exceeded the Norwegian average annual effective dose value (2.9 mSv) that includes
both indoor and outdoor doses.
The stochastic health risks (like cancer and genetic mutation) among the population of the FC
region might be elevated, however, the realistic risk estimation for the same is not simple and
without limitations. The excess relative risk of leukaemia from gamma doses was estimated
to be higher (0.001-0.01) than that of solid cancer (0.0001-0.001), and lung cancer (0.000020.0005) from radon isotopes. Therefore, on the basis of the findings from this study, it can be
recommended that the high dose areas in the FC require interventions in order to minimize
the likelihood of human stochastic effects by limiting public doses as low as resonably
achievable.
49
REFERENCES
Abd El-Zaher, M. 2011. Seasonal variation of indoor radon concentration in dwellings of Alexandria
city, Egypt. Radiat. Prot. Dosimetry 143 (1): 56-62.
Akiba, S., Tokonami, S., Bochicchio, F., McLaughlin, J., Tommasino, L. & Harley, N. 2010. Thoron:
Its metrology, health effects and implications for radon epidemiology: A summary of roundtable
discussions. Radiat. Prot. Dosimetry 141 (4): 477-481.
Almgren, S., Isaksson, M. & Barregard, L. 2008. Gamma radiation doses to people living in Western
Sweden. J. Environ. Radioactivity 99 (2): 394-403.
Almgren, S. & Isaksson, M. 2009. Long-term investigation of anthropogenic and naturally occurring
radionuclides at reference sites in western Sweden. J. Environ. Radioactivity 100 (7): 599-604.
Arkhipov, N. P., Kuchma, N. D., Askbrant, S., Pasternak, P. S. & Musica, V. V. 1994. Acute and
long-term effects of irradiation on pine (Pinus silvestris) stands post-Chernobyl. Sci. The Total
Environ. 157: 383-386.
Arogunjo, A. M., Ohenhen, H. O. & Olowookere, S. P. 2004. A re-evaluation of the occupancy
factors for effective dose estimate in tropical environment. Radiat. Prot. Dosimetry 112 (2): 259-265.
Arvela, H., Hyvönen, H., Lemmelä, H. & Castrén, O. 1995. Indoor and Outdoor Gamma Radiation in
Finland. Radiat. Prot. Dosimetry 59 (1): 25-32.
Attix, F.H. 2004. Introduction to Radiological Physics and Radiation Dosimetry. Strauss GmbH:
Mörlenbach, Wiley-VCH publication. Accessed on 27. March 2011 (online)
Auerbach, S. I. & Reichle, D. E. 1999. History of the Atomic Projects, the 50s Years: Sociopolitical,
Environmental, and Engineering Lessons Learned. SIA/DER HISAP Paper: pp 1-26. Accessed on 28.
March 2011 (online).
Baciu, A. C. 2005. Radon and thoron progeny concentration variability in relation to meteorological
conditions at Bucharest (Romania). J. Environ. Radioactivity 83 (2): 171-189.
50
Barros-Dios, J. M., Barreiro, M. A., Ruano-Ravina, A. & Figueiras, A. 2002. Exposure to residential
radon and lung cancer in Spain: a population-based case-control study. Am. J. Epidemiol. 156: 548555.
Baysson, H., Billon, S., Laurier, D., Rogel, A. & Tirmarche, M. 2003.Seasonal correction factors for
estimating radon exposure in dwellings in France. Radiat. Prot. Dosimetry 104 (3): 245-252.
BEIR VI, 1999. The health effects of exposure to indoor radon. Biological Effects of Ionizing
Radiation (BEIR) VI Report. Washington, DC USA: The National Academies Press.
Bergstol, S. & Svinndal, S. 1960. The carbonatite and per-alkaline rocks of the Fen area, Petrology.
Norges Geol. Unders. 208: 99-105.
Bølviken, B., Celius, E., Nilsen, R. & Strand, T. 2003. Radon: a possible risk factor in multiple
sclerosis. Neuroepidemiology 22 (1): 87-94.
Brenner, D. J., Doll, R., Goodhead, D. T., Hall, E. J., Land, C. E., Little, J. B., Lubin, J. H., Preston,
D. L., Preston, R. J., Puskin, J. S., Ron, E., Sachs, R. K., Samet, J. M., Setlow, R. B. & Zaider, M.
2003. Cancer risks attributable to low doses of ionizing radiation: Assessing what we really know.
Proc. Natl. Acad. Sci. USA 100 (24): 13761-13766.
Brenner, D. J. & Sachs, R. K. 2006. Estimating radiation-induced cancer risks at very low doses:
rationale for using a linear no-threshold approach. Radiat. Environ. Biophys. 44 (4): 253-256.
Chambers, D. B. 2010. Thoron and decay products, beyond UNSCEAR 2006 Annex E. Radiat. Prot.
Dosimetry 141 (4): 351-356.
Chan, S. W., Lee, C. W. & Tsui, K. C. 2010. Atmospheric radon in Hong Kong. J. Environ.
Radioactivity 101 (6): 494-503.
Chen, J., Schroth, E., MacKinlay, E., Fife, I., Sorimachi, A. & Tokonami, S. 2009. Simultaneous
222
Rn and 220Rn measurements in Winnipeg, Canada. Radiat. Prot. Dosimetry 134 (2): 75-78.
Choppin, G.R., Liljenzin, J.O. & Rydberg, J. 2002. Radiochemistry and Nuclear Chemistry (3rd
Edition). Woburn: MA, Butterworth-Heinemann publication.
51
Chung, W. H., Tokonami, S. & Furukawa M. 1998. Preliminary Survey on Radon and Thoron
Concentrations in Korea. Radiat. Prot. Dosimetry 80 (4): 423-426.
Clouvas, A., Xanthos, S. & Antonopoulos-Domis, M. 2006. Simultaneous measurements of indoor
radon, radon–thoron progeny and high-resolution gamma spectrometry in Greek dwellings. Radiat.
Prot. Dosimetry 118 (4): 482-490.
Dahlgren, S. 1983. Naturlig radioaktivitet i berggrunnen, gammastrålingskart, Fensfeltet, Telemark,
scale 1:10000, Prosjekt temakart, Telemark.
Darby, S., Hill, D., Auvinen, A., Barros-Dios, J., Baysson, H., Bochicchio, F., Deo, H., Falk, R.,
Forastiere, F. & Hakama, M. 2005. Radon in homes and risk of lung cancer: collaborative analysis of
individual data from 13 European case-control studies. B.M.J. 330 (7485): 223.
Doi, M. & Kobayashi, S. 1994. Vertical distribution fo outdoor radon and thoron in Japan using a new
discriminative dosimeter. Health Phys. 67(4):385-92.
Eatough, J. P. & Henshaw D. L. 1995. The theoretical risk of non-melanoma skin cancer from
environmental radon exposure. J. Radiol. Prot. 15 (1): 45-51.
El Afifi, E. M., Hilal, M. A., Khalifa, S. M. & Aly, H. F. 2006. Evaluation of U, Th, K and emanated
radon in some NORM and TENORM samples. Radiat. Measurements 41 (5): 627-633.
El-Hussein, A., Ahmed, A. & Mohammed, A. 1998. Radiation dose to the human respiratory tract
from inhalation of radon-222 and its progeny. Appl. Radiat. Isot. 49 (7): 783-790.
El-Hussein, A., Mohamemed, A., El-Hady, M. A., Ahmed, A. A., Ali, A. E. & Barakat, A. 2001.
Diurnal and seasonal variation of short-lived radon progeny concentration and atmospheric temporal
variations of 210Pb and 7Be in Egypt. J. Atmospheric Environ. 35: 4305-4313.
Environmental Agency, 2011. United Kingdom. Accessed on 04. May. 2011 via
http://publications.environment-agency.gov.uk/pdf/GEHO0409BPPE-e-e.pdf
Geological Survey of Norway, 2011. Accessed on 06. Feb. 2011 (online).
52
Geras' kin, S. A., Kim, J. K., Dikarev, V. G., Oudalova, A. A., Dikareva, N. S. & Spirin, Y. V. 2005.
Cytogenetic effects of combined radioactive (137Cs) and chemical (Cd, Pb, and 2, 4-D herbicide)
contamination on spring barley intercalar meristem cells. Mutat. Res. 586 (2): 147-159.
Geras' kin, S., Oudalova, A., Dikareva, N., Mozolin, E., Vanina, J., Baykova, T. & Dikarev, V. 2009.
Effects of radioactive contamination on plant populations and radiological protection of the
environment. Radioprotection 44 (5): 389-394.
Gilmore, M. & Grennan, E. 2003. A Pilot Study of the Relationship Between Multiple Sclerosis and
the Physical Environment in Northwest Ireland. Environ. Geochem. Health 25 (1): 157-163.
Grasty, R. L. 1994. Summer Outdoor Radon Variations in Canada and Their Relation to Soil
Moisture. Health Phys. 66 (2): 185-193.
Guo, Q., Shimo, M., Ikebe, Y. & Minato, S. 1992. The Study of Thoron and Radon Progeny
Concentrations in Dwellings in Japan. Radiat. Prot. Dosimetry 45 (1-4): 357-359.
Harley, N., Chittaporn, P., Heikkinen, M., Merrill, R. & Medora, R. 2005. Outdoor radon and thoron
in the USA, Canada, Finland and Thailand. Radioactivity in the Environment 7: 670-677.
Harley, N., Chittaporn, P., Medora, R. & Merrill, R. 2010. Measurement of the indoor and outdoor
220Rn (thoron) equilibrium factor: application to lung dose. Radiat. Prot. Dosimetry 141 (4): 357362.
Heaton, B. & Lambley, J. 1995. TENORM in the oil, gas and mineral mining industry. Appl. Radiat.
Isot. 46 (6-7): 577-581.
Heincke, B. H., Smethurst, M. A., Bjørlykke, A., Dahlgren, S., Rønning, J. S. & Mogaard, J. O. 2008.
Airborne gamma-ray spectrometer mapping for relating indoor radon concentrations to geological
parameters in the Fen region, southeast Norway. In Slagstad, T. (ed.) Geology for Society, Geological
Survey of Norway Special Publication 11: 131-143.
Hendry, J. H., Simon, S. L., Wojcik, A., Sohrabi, M., Burkart, W., Cardis, E., Laurier, D., Tirmarche,
M. & Hayata, I. 2009. Human exposure to high natural background radiation: what can it teach us
about radiation risks? J. Radiol. Prot. 29: A29-A42.
53
Henshaw, D.L., Eatough, J.P. & Richardson, R.B. 1990. Radon as a causative factor in induction of
myeloid leukemia and other cancers. The Lancet 335 (8696): 1008-12.
Henshaw, D. L. & Allen, J. E. 2001. Is indoor radon linked to leukaemia in children and adults? - A
review of the evidence. In: Proc. Symposium Norwegian Academy of Science & Letters, Oslo, edited
by B. Bølviken, p. 127.
Holm, L. E., Hubbard, L., Larsson, C. M. & Sundell-Bergman, S. 2002. Radiological protection of the
environment from the Swedish point of view. J. Radiol. Prot. 22: 235-247.
Hosoda, M., Shimo, M., Sugino, M., Furukawa, M. & Fukushi, M. 2007. Effect of soil moisture
content on radon and thoron exhalation. J. Nuclear Sci. Tech. 44 (4): 664-672.
Hosoda, M., Sorimachi, A., Yasuoka, Y., Ishikawa, T., Sahoo, S. K., Furukawa, M., Hassan, N. M.,
Tokonami, S. & Uchida, S. 2009. Simultaneous measurements of radon and thoron exhalation rates
and comparison with values calculated by UNSCEAR equation. J. Radiat. Res. 50: 333–343.
Humar, M., Sutej, T., Skvarc, J., Mljac, L., Radez, M. & Ilic, R. 1992. Indoor and Outdoor Radon
Survey in Slovenia by Etched Track Detectors. Radiat. Prot. Dosimetry 45 (1-4): 549-552.
ICRP, 1981. Limits for inhalation of radon daughters by workers (publication 32). Ann. ICRP 6(1): 124.
ICRP Publication 60, 1991. 1990 Recommendations of the International Commission on Radiological
Protection Ann. ICRP 21(1-3): 1-201.
ICRP, 1993. Protection against Radon-222. Ann. ICRP 23(2): 1-45.
ICRP, 2005. Draft For Consultation. Accessed on 28. March.2011 (online).
ICRP, 2009. Environmental protection: The Concept and Use of Reference Animals and Plants. Ann.
ICRP 38 (4-6).
Iida, T., Ikebe, Y., Suzuki, K., Ueno, K., Wang, Z. & Jin, Y. 1996. Continuous measurements of
outdoor radon concentrations at various locations in East Asia. Environ. International 22 (Suppl. 1):
139-147.
54
Iimoto, T., Kosako, T. & Sugiura, N. 2001. Measurements of summer radon and its progeny
concentrations along with environmental gamma dose rates in Taiwan. J. Environ. Radioactivity 57
(1): 57-66.
Ishikawa, T., Tokonami, S. & Nemeth, C. 2007. Calculation of dose conversion factors for thoron
decay products. J. Radiol. Prot. 27: 447-456.
Jacobi, W. 1972. Activity and potential alpha-energy of
222
Rn and
220
Rn daughters in different air
atmospheres. Health Phys. 22: 441-450.
Kant, K., Sonkawade, R., Sharma, G., Chauhan, R. & Chakarvarti, S. 2009. Seasonal variation of
radon, thoron and their progeny levels in dwellings of Haryana and Western Uttar Pradesh. Iranian J.
Radiat. Res. 7 (2): 79-84.
Kávási, N., Somlai, J., Szeiler, G., Szabó, B., Schafer, I. & Kovács, T. 2010. Estimation of effective
doses to cavers based on radon measurements carried out in seven caves of the Bakony Mountains in
Hungary. Radiat. Measurements 45 (9): 1068-1071.
Kellerer, A. M. & Nekolla, E. A. 2000. The LNT-Controversy and the Concept of "Controllable
Dose". Health Phys. 79 (4): 412-418.
Kendall, G. M. & Smith, T. J. 2002. Doses to organs and tissues from radon and its decay products. J.
Radiat. Prot. 22: 389-406.
Khandpur, R. S. 2008. Handbook of Analytical Instruments. (2nd Edition). Tata McGraw-Hill
Professional Engineering Series. New Delhi: Tata McGraw-Hill Publishing Company Limited.
Accessed on 28. March. 2011 (online).
Kovalchuk, O., Arkhipov, A., Barylyak, I., Karachov, I., Titov, V., Hohn, B. & Kovalchuk, I. 2000.
Plants experiencing chronic internal exposure to ionizing radiation exhibit higher frequency of
homologous recombination than acutely irradiated plants. Mutat. Res. 449 (1-2): 47-56.
55
Krewski, D., Lubin, J. H., Zielinski, J. M., Alavanja, M., Catalan, V. S., Field, R. W., Klotz, J. B.,
Létourneau, E. G., Lynch, C. F., Lyon, J. I., Sandler, D. P., Schoenberg, J. B., Steck, D. J., Stolwijk, J.
A., Weinberg, C & Wilcox, H. B. 2005. Residential Radon and Risk of Lung Cancer: A Combined
Analysis of 7 North American Case-Control Studies. Epidemiology 16 (2): 137-145.
Langmuir, D. & Herman, J. S. 1980. The mobility of thorium in natural waters at low temperatures
Geochim. Cosmochim. Acta. 44 (11):1753-1766.
Lario, J., Sánchez-Moral, S., Cañaveras, J. C., Cuezva, S. & Soler, V. 2005. Radon continuous
monitoring in Altamira Cave (northern Spain) to assess user's annual effective dose. J. Environ.
Radioactivity 80 (2): 161-174.
Little, M. P., Wakeford, R. & Kendall, G. M. 2009. Updated estimates of the proportion of childhood
leukaemia incidence in Great Britain that may be caused by natural background ionising radiation. J.
Radiol. Prot. 29: 467-482.
Lopez, M. A., Currivan, L., Falk, R., Olko, P., Wernli, C. & Castellani, C. M. 2004. Workplace
monitoring for exposures to radon and to other natural sources in Europe: integration of monitoring
for internal and external exposures. Radiat. Prot. Dosimetry 112 (1): 121-139.
Man, C. K. & Yeung, H. S. 1998. Variations of outdoor radon concentrations in Hong Kong. J.
Environ. Radioactivity 40 (2): 137-145.
McLaughlin, J. 2010. An overview of thoron and its progeny in the indoor environment. Radiat. Prot.
Dosimetry 141 (4): 316-321.
Mc Laughlin, J., Murray, M., Currivan, L., Pollard, D., Smith, V., Tokonami, S., Sorimachi, A. &
Janik, M. 2010. Thoron and its airborne progeny in Irish dwellings. In: Proc. the third European
IRPA congress, 14-18 June 2010, Helsinki, Finland. Accessed on 14.Feb.2011 (online).
Meyers-Schone, L., Fischer, N. T. & Miller, M. L. 2003. Consideration of background radiation in
ecological risk assessments. Human Ecol. Risk Assess. 9 (7): 1633-1638.
Mjönes, L., Falk, R., Mellander, H., Nyblom, L. & Nilsson, I. 1995. Thoron in Swedish Buildings. In:
Int. Radon Symposium. Accessed on 6.May.2011 (online)
56
Mohammed, A., El-Hussein, A. & Ali, A. 2000. Measurements of thorium-B (212Pb) in the outdoor
environment and evaluation of equivalent dose. J. Environ. Radioactivity 49 (2): 181-193.
Mohammadi, S., Taghavi-Dehaghani, M., Gharaati, M. R., Masoomi, R. & Ghiassi-Nejad, M. 2006.
Adaptive Response of Blood Lymphocytes of Inhabitants Residing in High Background Radiation
Areas of Ramsar-Micronuclei, Apoptosis and Comet Assay. J. Radiat. Res. 47: 279-285.
Monfared, A., Mozdarani, H. & Amiri, M. 2003. Natural background radiation induces cytogenetic
radioadaptive response more effectively than occupational exposure in human peripheral blood
lymphocytes. Czechoslovak J. Phys. 53 (Suppl.1): A791-A795.
Mortazavi, S.M.J., Ghiassi-Nejad, M. & Ikushima, T. 2002. Do the findings on the health effects of
prolonged exposure to very high levels of natural radiation contradict current ultra-conservative
radiation protection regulations? Int. Congress Series 1236: 19-21.
Mortazavi, S.M.J., Abbasi, A., Asadi, R. & Hemmati, A. 2005a. The need for considering social,
economic, and psychological factors in warning the general public from the possible risks due to
residing in HLNRAs. Int. Congress Series 1276: 440-441.
Mortazavi, S.M.J., Ghiassi-Nejad M. & Rezaiean, M. 2005b. Cancer risk due to exposure to high
levels of natural radon in the inhabitants of Ramsar, Iran. Int. Congress Series 1276: 436-437.
Mrdakovic Popic, J., Salbu, B., Strand, T. & Skipperud, L. 2011. Assessment of radionuclide and
metal contamination in a thorium rich area in Norway. J. Environ. Monit. DOI: 10.1039/c1em10107b
(in press).
Nair, R. R. K., Rajan, B., Akiba, S., Jayalekshmi, P., Nair, M. K., Gangadharan, P., Koga, T.,
Morishima, H., Nakamura, S. & Sugahara, T. 2009. Background Radiation and Cancer Incidence in
Kerala, India-Karanagappally Cohort Study. Health Phys. 96 (1): 55-66.
Neilson, S., Robinson, I. & Rose, F. C. 1996. Ecological correlates of motor neuron disease mortality:
a hypothesis concerning an epidemiological association with radon gas and gamma exposure. J.
Neurol. 243 (4): 329-336.
Nome Kommune, 2011. Accessed on 30. May.2011 via
http://nome.kommune.no/artikkel.aspx?MId1=0&MId2=0&MId3=0&AId=2805&Back=1
57
Nordic, 2000. Naturally occurring radioactivity in the Nordic countries—recommendations. The
Radiation Protection Authorities, Denmark, Finland, Iceland, Norway and Sweden, (80 pp). Accessed
on 16. March.2011(online).
NRPA, 2011a. New recommendations for radon in dwellings in the Nordic countries 2009. Accessed
on 25. March.2011 (online).
NRPA, 2011b. Strategy for the reduction of radon exposure in Norway. Accessed on 25. March.2011
(online).
Oikawa, S., Kanno, N., Sanada, T., Ohashi, N., Uesugi, M., Sato, K., Abukawa, J. & Higuchi, H.
2003. A nationwide survey of outdoor radon concentration in Japan. J. Environ. Radioactivity 65 (2):
203-213.
Olko, P. 2010. Advantages and disadvantages of luminescence dosimetry. Radiat. Measurements 45
(3-6): 506-511.
Oughton, D. H. & Strand, P. 2004. The Oslo consensus conference on protection of the environment.
J. Environ. Radioactivity 74: 7-17.
Paul, A. C., Pillai, P. M. B., Haridasan, P. P., Radhakrishnana, S. & Krishnamony, S. 1998.
Population Exposure to Airborne Thorium at the High Natural Radiation Areas in India. J. Environ.
Radioactivity 40 (3): 251-259.
Pershagen, G., Akerblom, G., Axelson, O., Clavensjo, B., Damber, L., Desai, G., Enflo, A., Lagarde,
F., Mellander, H., Svartengren, M. & Swedjemark, G. A. 1994. Residential Radon Exposure and Lung
Cancer in Sweden. N. Engl. J. Med. 330: 159-164.
Pfennig, G., Klewe-Nebenius, H. & Seelmann-Eggebert, W. 1998. Chart of the Nuclides. 6th edition,
Institut fur Instrumentelle Analytik. ISBN 3-92-1879-18-3.
Pinel, J., Fearn, T., Darby, S. C. & Miles, J. C. H. 1995. Seasonal correction factors for indoor radon
measurements in the United Kingdom. Radiat. Prot. Dosimetry 58: 127-132.
Porstendörfer, J. 1994. Properties and behavior of radon and thoron and their decay products in the
air. J. Aerosol Sci. 25: 219-263.
58
Porstendörfer, J. 2001. Physical Parameters and Dose Factors of the Radon and Thoron Decay
Products. Radiat. Prot. Dosimetry 94 (4): 365-373.
Ramachandran, T. V. & Sahoo, B. K. 2009. Thoron (220Rn) in the indoor environment and work
places. Indian J. Phys. 83 (8): 1079-1098.
Ramachandran, T.V. 2010. Environmental thoron (220Rn): A review. Iran. J. Radiat. Res. 8 (3): 129147.
Ramola, R., Negi, M. & Choubey, V. 2003. Measurement of Equilibrium Factor” F” between Radon
and its Progeny and Thoron and its Progeny in the Indoor Atmosphere Using Nuclear Track
Detectors. Indoor Built Environ. 12 (5): 351-355.
Ramola, R. C., Prasad, G., Gusain, G. S., Rautela, B. S., Choubey, V. M., Sagar, D. V., Tokonami, S.,
Sorimachi, A., Sahoo, S. K., Janik, M. & Ishikawa T. 2010. Preliminary indoor thoron measurements
in high radiation background area of southeastern coastal Orissa, India. Radiat. Prot. Dosimetry 141
(4): 379-382.
Salbu B., Rosseland B. O. & Oughton D. H. 2005. Multiple stressors – a challenge for the future. J.
Environ. Monit. 7: 1-2.
Sesana, L., Caprioli, E. & Marcazzanet, G. M. 2003. Long period study of outdoor radon
concentration in Milan and correlation between its temporal variations and dispersion properties of
atmosphere. J. Environ. Radioactivity 65 (2): 147-160.
Singh, K., Singh, M., Singh, S., Sahota, H. & Papp, Z. 2005. Variation of radon (222Rn) progeny
concentrations in outdoor air as a function of time, temperature and relative humidity. Radiat.
Measurements 39 (2): 213-217.
Soharabi, M. 1998. The State-of-the art on Worldwide Studies in some Environments with Elevated
Naturally Occurring radioactive Materials (NORM). Appl. Radiat. Isot. 49 (3):169-188.
Solli, H. M., Andersen, A., Stranden, E. & Langård, S. 1985. Cancer incidence among workers
exposed to radon and thoron daughters at a niobium mine. Scand J. Work Environ. Health 1: 7-13.
59
Strand, T., Ånestad, K., Ruden, L., Ramberg, G. B., Jensen, C. L., Wiig, A. H. & Thommesen, G.
2001. Indoor radon survey in 114 municipalities. Short presentation of results. StrålevernRapport
2001:6.Østerås: Norwegian Radiation Protection Authority.
Stranden, E. 1984. Thoron (220Rn) daughter to radon (222Rn) daughter ratios in thorium-rich areas.
Health Phys. 47: 784-785.
Stranden, E. 1985. The Radiological Impact of Mining in a Th-rich Norwegian Area. Health Phys.
48(4): 415-20.
Stranden, E. & Strand, T. 1986. Natural Gamma Radiation in A Norwegian Area Rich in Thorium.
Radiat. Prot. Dosimetry 16 (4): 325-328.
Standring, W., Hassfjell, C., Seyersted, M., Olsen, B., Rudjord, A. L. & Strand, P. 2010. Norway’s
new national radon strategy. Proceedings of Third European IRPA Congress 2010 June 14-16,
Helsinki, Finland. Accessed on 26. March.2011 (online).
Sun, Q., Akiba, S., Tao, Z., Yuan, Y., Zou, J., Morishima, H., Kato, H., Zha, Y., Sugahara, T. & Wei,
L. 2000. Excess relative risk of solid cancer mortality after prolonged exposure to naturally occurring
high background radiation in Yangjiang, China. J. Radiat. Res. 41 (Suppl.): 43-52.
Sundal, A.V. & Strand, T. 2004. Indoor gamma radiation and radon concentrations in a Norwegian
carbonatite area. J. Environ. Radioactivity 77: 175-189.
Suissa, S. 1999. Relative excess risk: an alternative measure of comparative risk. Am. J.
Epidemiology 150 (3): 279-282.
Tao, Z., Zha, Y., Akiba, S., Sun, Q., Zou, J., Li, J., Liu, Y., Kato, H., Sugahara, T. & Wei, L. 2000.
Cancer mortality in the high background radiation areas of Yangjiang, China during the period
between 1979 and 1995. J. Radiat. Res. 41 (Suppl.): 31-41.
Thorium Report, 2008.Thorium as an Energy Source - Opportunities for Norway. Accessed on 28.
March.2011 (online).
Tokonami, S., Sun, Q., Akiba, S., Zhuo, W., Furukawa, M., Ishikawa, T., Hou, C., Zhang, S.,
Narazaki, Y. & Ohji, B. 2004. Radon and thoron exposures for cave residents in Shanxi and Shaanxi
provinces. Radiat. Res. 162: 390-396.
60
Tokonami, S., Takahashi, H., Kobayashi, Y., Zhuo, W. & Hulber, E. 2005. Up-to-date radon-thoron
discriminative detector for a large scale survey. Rev. Sci. Instrum. 76: 113505-113509.
Tokonami, S. 2009. Thoron in the environment and its related issues. Indian J. Phys. 83 (6): 777-785.
Tokonami, S., McLaughlin, J., Tommasino, L. & Harley, N. 2010. International workshop on
environmental thoron and related issues. Radiat. Prot. Dosimetry 141 (4): 315.
Tokonami, S. 2010. Why is
220
Rn (thoron) measurement important? Radiat. Prot. Dosimetry 141(4):
335-339.
Tubiana, M., Feinendegen, L. E., Yang, C. & Kaminski, J. M. 2009. The Linear No-Threshold
Relationship Is Inconsistent with Radiation Biologic and Experimental Data. Radiology 251 (1): 1322.
UNSCEAR, 1993. United Nations Scientific Committee on the effects of Atomic Radiation. Report to
the General Assembly. ANNEX A. Accessed on 02. Feb.2011 (online).
UNSCEAR, 2000a. Sources and Effects of Ionizing Radiation. Volume I, Annex B. Sources and
Effects of Ionizing Radiation. Accessed on 28. March.2011 (online).
UNSCEAR, 2000b. Sources and Effects of Ionizing Radiation. Volume II, Annex G. Sources and
Effects of Ionizing Radiation. Accessed on 28. March.2011 (online).
UNSCEAR, 2000c. Sources and Effects of Ionizing Radiation. Volume I, Annex A. Dose Assessment
Methodologies. Accessed on 11. April.2011 (online).
UNSCEAR, 2006a. Effects of ionizing radiation. Volume 2, Annex E. Sources-to-effects assessment
for radon in homes and workplace. Accessed on 28. March.2011 (online).
UNSCEAR, 2006b. Effects of ionizing radiation. Volume 1, Annex A. Epidemiological studies of
radiation and cancer. Accessed on 28. March.2011 (online).
UNSCEAR, 2010. Sources and Effects of Ionizing Radiation. UNSCEAR 2008 report to general
assembly. Vol 1, Annex B. Exposures of the public and workers from various sources of radiation.
Accessed on 28. March.2011 (online).
61
United States Patent US4847503, 1989. U. S. Patent Documents. Accessed on 14. March. 2011
(online).
Urosevic, V., Nikezic, D. & Vulovic, S. 2008. A theoretical approach to indoor radon and thoron
distribution. J. Environ. Radioactivity 99 (12): 1829-1833.
U.S. Environmental Protection Agency, 2000. Evaluation of EPA’s Guidelines on Technologically
Enhanced Naturally Occurring Radioactive Material (TENORM). Accessed on 30. March. 2011
(online).
U.S. Environmental Protection Agency, 2006. Technical Report on Technologically Enhanced
Naturally Occurring Radioactive Materials from Uranium Mining Volume 1: Mining and Reclamation
Background. Accessed on 30. March. 2011 (online).
US Geological Survey, 2007. Mineral Commodity Summaries, 2007: U.S. Geological Survey, 171 p.
Accessed on 06. Feb.2011 (online).
Valentin, J. 2007. P103: The 2007 Recommendations of the International Commission on
Radiological Protection. Ann. ICRP 37 (2-4): 1-332.
Wasiolek, P. T. & Schery, S. D. 1993. Outdoor Radon Exposure and Doses in Socorro, New Mexico.
Radiat. Prot. Dosimetry 46 (1): 49-54.
WHO, 2009.WHO Handbook on Indoor Radon. Accessed on 06. Feb.2011 (online).
Wiegand, J., Feige, S., Quingling, X., Schreiber, U., Wieditz, K., Wittmann, C. & Xiarong, L. 2000.
Radon and thoron in cave dwellings (Yan'an, China). Health Phys. 78 (4): 438-344.
Wiegand, J. & Feige, S. 2002.Thoron: ignored and underestimated in the big shadow of radon-an
example from China. Geofis. Int. 41: 261–264.
Winkler, R. & Aehlig, K. 1998. Temporal variation of thoron decay product concentration in the
atmosphere and comparison with radon decay product concentration. Radiat. Environ. Biophys. 37:
35-39.
62
Yamada, Y., Sun, Q., Tokonami, S., Akiba, S., Zhuo, W., Hou, C., Zhang, S., Ishikawa, T., Furukawa,
M. & Fukutsu, K. 2006. Radon-thoron discriminative measurements in Gansu Province, China, and
their implication for dose estimates. J. Toxicol. Environ. Health A. 69: 723-734.
Zhang, L., Guo, Q. & Iida, T. 2004. Atmospheric radon levels in Beijing, China. Radiat. Prot.
Dosimetry 112 (3): 449-453.
Zielinski, J. M. & Chambers, D. B. 2008. Mapping of residential radon in the world. The 12th Int.
Congress of the Int. Radiat. Prot. Assoc., 19-24 October 2008, Buenos Aires, Argentina.
Zhuo, W., Tokonami, S., Yonehara, H. & Yamada, Y. 2002. A simple passive monitor for integrating
measurements of indoor thoron concentrations. Rev. Sci. Instrum. 73: 2877.
Zhuo, W., Chen, B. & Wei, M. 2010. Estimation Of Indoor 220Rn Progeny Concentrations With 220Rn
Measurements. Radiat. Prot. Dosimetry 141(4): 408–411.
Zorko, B., Jezeršek, D., Štuhec, M. & Gobec, S. 2005. Energy Dependence of TL Dosemeters using
Ca F2.: Mn Pellets. Accessed on 02. March. 2011 (online).
Žunic´, Z. S., Janik, M., Tokonami, S., Veselinovic´, N., Yarmoshenko, I. V., Zhukovsky, M.,
Ishikawa, T., Ramola, R. C., Ciotololi, G., Jovanovic´, P., Kozak, K., Mazur, J., Celiković, I., Ujić, P.,
Onischenko, A., Sahoo, S. K. & Bochicchio, F. 2009. Field Experience with Soil Gas Mapping Using
Japanese Passive Radon/Thoron Discriminative Detectors for Comparing High and Low Radiation
Areas in Serbia (Balkan Region). J. Radiat. Res. 50: 355-361.
Žunic´, Z. S., Celikovic´, I., Tokonami, S., Ishikawa, T., Ujic´, P., Onischenko, A., Zhukovsky, M.,
Milic´, G., Jakupi, B., C´uknic, O., Veselinovic´, N., Fujimoto, K., Sahoo, S. K. & Yarmoshenko, I.
2010. Collaborative investigations on thoron and radon in some rural communities of Balkans. Radiat.
Prot. Dosimetry 141(4): 346-350.
63
APPENDIX
ABBREVIATIONS USED
EEC: Equilibrium Equivalent Concentration
ENRA: Enhanced Natural Radiation Area
ERR: Excess Relative Risk
FC: Fen Complex
GMC: Geiger Müller Counter
GPS: Global Positioning System
HLNRA: High Level Natural Radiation Area
ICRP: International Commission on Radiological Protection
JSI: Jožef Stefan Institute
LLNRA: Low Level Natural Radiation Area
MLNRA: Medium Level Natural Radiation Area
NIRS: National Institute of Radiological Sciences
NLNRA: Normal Level Natural Radiation Area
NRPA: Norwegian Radiation Protection Authority
NORM: Naturally Occurring Radioactive Material
PAEC: Potential Alpha Energy Concentration
SD: Standard Deviation
TENORM: Technologically Enhanced Naturally Occurring Radioactive Material
TLD: Thermo Luminescent Dosimeter
UNSCEAR: United Nations Scientific Committee on the Effects of Atomic Radiation
VHLNRA: Very High Level Natural Radiation Area
UMB: Universitetet for miljø- og biovitenskap (Norwegian University of Life Sciences)
WHO: World Health Organization
WL: Working Level
WLM: Working Level Month
64


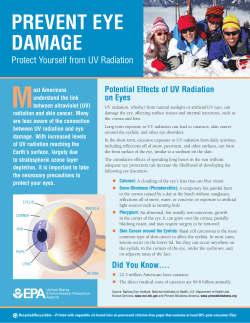
© Copyright 2026