
1. How Globalized is the World? 10 1. How Globalized is the World?
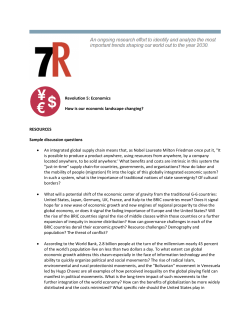
10 1. How Globalized is the World? 1. How Globalized is the World? DHL Global Connectedness Index 2014 For most of the period since World War II, globalization posted steady increases. But today, we find ourselves in an age of ambiguity. Some exult about “hyperglobalization,”1 with one source predicting that global flows could triple by 2025.2 But others worry that the “age of globalization” that defined the last few decades may have ended and started going into reverse. 3 This ambiguity adds to the importance of measuring globalization. Depth measures how much of an economy’s activities or flows are international versus domestic by comparing the size of its international flows (and stocks cumulated from prior year flows) with relevant measures of its domestic activity. For example, to assess the depth of Hong Kong SAR 5 (China)’s merchandise exports, its exports are compared to its GDP: Hong Kong’s merchandise exports-toGDP ratio is 196%, the highest in the world and 50 times higher than Burundi’s (the lowest—only 4%). The DHL Global Connectedness Index—the most up-todate of the established globalization indexes—reveals a more nuanced reality. During 2013, the depth of globalization resumed its upward march as international flows grew faster, on average, than their domestic counterparts. The breadth of globalization, however, continued its multiyear slide as the changing geographic distributions of advanced economies’ international flows lagged the shift of economic activity to emerging economies. 4 This chapter begins by explaining how the DHL Global Connectedness Index measures globalization—what we summarize as a 3-D approach, focused on depth, distribu- Breadth complements depth by looking at how broadly the international component of a given type of activity is distributed across countries. To illustrate the importance of incorporating breadth into assessments of global connectedness, consider inbound tourism in the Bahamas. While the Bahamas ranks second in the world in terms of the number of inbound tourists per capita (a depth metric), more than 80% of those tourists come from the United States. Thus, while depth of inbound tourism in the Bahamas is high, its breadth is limited, especially when one notes that less than 10% of outbound international tourists worldwide come from the United States. tion, and directionality—and how that relates to theoretical discussions of the phenomenon. It then describes the current state of globalization and trends since 2005. Finally, the trends revealed by the DHL Global Connectedness Index are contrasted with findings from other research on the topic to highlight the distinctive features of this index. Measuring Globalization in 3-D Global connectedness is defined in this report as the depth and breadth of a country’s integration with the rest of the world as manifested by its participation in international flows of products and services, capital, information, and people. The DHL Global Connectedness Index measures breadth, as suggested by the example of tourism in the Bahamas, by comparing the distribution of a country’s international flows (inbound tourists in this example) with the global distribution of the same flow in the opposite direction (outbound tourists). If the Bahamas attracted tourists from all around the world in proportion to where all of the world’s outbound tourists come from, the Bahamas would have the highest possible breadth score. In contrast, if all of the Bahamas’s tourists came from just one country that sends tourists nowhere else, it would receive the lowest possible breadth score. This method of measuring breadth is an attractive basis for comparing countries because scores are not biased by 11 12 1. How Globalized is the World? Information Capital Trade Figure 1.1 Global Depth Ratios, 2013 or most recent year available6 Trade (Gross Exports % of GDP) FDI Flows (% of Gross Fixed Capital Formation) Portfolio Equity Stocks (% of Mkt Cap) Internet Traffic (Int’l % of Total) Telephone Calls (Int’l % of Total) People Migrants (% of Population) Students (Int’l % of Univ. Students) Tourists (Int’l % of Total Arrivals) 0% 10% 20% 30% 40% 50% 60% 70% 80% 90% 100% Global depth ratios show that far more of every type of activity studied that could take place either within or across national borders is domestic, not international. In most cases, the international share of total activity is less than 10%–20%. where countries are located. However, breadth is just one way of summarizing the distribution of countries’ international interactions. Such distributions can be summarized in multiple ways, with those summary measures sometimes moving in different directions. We therefore supplement our breadth measure with alternate measures of distribution: concentration of interactions in a small number of partners, average distance traversed by international interactions, and regionalization (as in the intra-regional share of international interactions). 6 When a country, for example, has much higher inward than outward depth, it may make more sense to focus on boosting depth on the outward direction. In addition to depth and distribution/breadth, the third D underlying our “3-D” approach to measuring globalization is directionality. Inbound and outbound flows may differ qualitatively in their significance. Consider international education, which is where we observe the largest differences between countries’ inward and outward flows. Compare, for example, Australia, where 22% of university students come from abroad but less than 1% have left to study overseas with Botswana where 50% of students are studying abroad but only 4% of students in domestic universities come from outside the country. Those data clearly paint very distinct pictures of the two countries’ tertiary education systems. The DHL Global Connectedness Index looks along these dimensions at 12 types of interactions that can be grouped into four pillars. The trade pillar covers flows of goods and services.7 The capital pillar focuses on equity capital: flows and stocks of foreign direct investment and portfolio equity. Debt capital is excluded because of the dangers associated with high levels of international indebtedness—the inclusion of flows whose risks might outweigh their benefits would cloud the orienting function (higher better than lower) of the depth dimension of the index.8 The information pillar incorporates data on international internet bandwidth, international telephone calls, and trade in printed material.9 The people pillar measures people movements across three time-horizons: migration (long-term), university students pursuing degrees abroad (medium-term), and tourism (short-term).10 We do not fold directionality into our aggregate measures of global connectedness. Rather, we report it alongside depth and breadth (in the country profiles at the end of this report) to call attention to the kinds of distinctions highlighted by the preceding comparison of Australia and Botswana. Reporting directionality separately also lets us use it as a diagnostic in relation to depth and breadth. It is worth adding that the dimensions of depth, distribution, and directionality build on, but also depart significantly from, widely-used theoretical definitions of globalization (see the boxed insert, “Defining Globalization”). So while our objectives in this report are primarily empirical, it has significant theoretical implications as well. Global Connectedness in 2013 This section summarizes the depth and breadth of global connectedness in 2013, and the next section tracks how they have evolved since 2005. Directionality will be DHL Global Connectedness Index 2014 Defining Globalization Defining Globalization Globalization is a widely-used term but different ago. Thus, the transatlantic telegraph cable reduced people mean different things by it. Probably the the time that it took for information to travel from most widely-cited definition is due to David Held et New York to London from three weeks to a few al., who conceive of globalization as a “transforma- hours in the 1860s, and to one minute by 1914.13 tion in the spatial organization of social relations and transactions—assessed in terms of their extensity, intensity, velocity and impact—generating transcontinental or interregional flows…”11 —and insist that a satisfactory definition must capture each of these four elements. The definition of globalization in the DHL Global Connectedness Index (GCI) follows this theoretical definition in some respects but departs from it in others. The fourth element highlighted by Held et al., the impact of globalization, is crucially important, but— in our view—should not be mixed up with measures of globalization itself. In order to analyze the links between globalization and other phenomena of interest, we must have separate measures of them. That is why GCI scores and ranks focus exclusively on measures of actual international interactions that take place between countries. They exclude—unlike The GCI’s focus on depth coincides with what Held some other globalization indexes—the effects of et al. refer to as intensity. And its focus on breadth, globalization as well as its enablers. or more broadly distribution, resembles what they refer to as extensity, but with a difference. Our analysis reveals that, on average, more than half of international flows and stocks measured in the GCI take place within rather than between regions. While Held et al. suggest excluding such flows, doing so within, say, Europe (where the intra-regional average is 69%),12 would yield a severely incomplete picture of countries’ international interactions. Finally, the perspective on globalization underlying the GCI also calls attention to directionality, which is missing from Held et al.’s definition even though it seems both theoretically and empirically important. Inbound versus outbound flows may be qualitatively different in their significance. Think, for example, about many countries’ focus on mercantilist trade policies that favor exports over imports. And empirically, the other flows and stocks measured in the Velocity, as defined by Held et al., is largely a result GCI are (even) more unbalanced than merchandise of developments in transportation and communi- trade—and in most instances, imbalances have in- cation technologies. We exclude it from the GCI creased rather than decreased since 2005. because it does not exhibit sufficient variation over the time frame we analyze—since 2005—or, given limitations in data availability, across countries. In terms of communications technologies, time lags seem to have asymptoted towards zero a long time brought back into the discussion in the final section. Let’s start with the collection of global depth measures presented in Figure 1.1. It turns out that the international proportion of these activities—which can take place either domestically or internationally—represents a small fraction of the total, typically less than 20% and often less than 10%. For only two of the variables—trade and portfolio equity stocks—do internationalization levels exceed 30%—and one of them (trade) is inflated by double-counting when products cross borders multiple times during their production processes. Removing such double counting brings the share of value added around the world that gets exported down from 32% to about 23%. And while the value of international portfolio equity stocks has reached 39% of stock In summary, the definition of globalization underlying the GCI builds on but also adapts and, in some respects, goes beyond previous definitions of globalization. market capitalization, research still indicates a very high level of home bias in investors’ portfolios. These levels of globalization are much lower than the levels one would expect to see if borders and distance had ceased to matter (which would typically imply values of 85% or more). They are also significantly lower than most people’s intuitions. In an online survey conducted by the Harvard Business Review, respondents pegged international phone calls at 29% of the total, immigrants at 22% of the world’s population, and foreign direct investment (FDI) at 32% of total fixed capital formation—an average estimate of 27%, or more than five times the actual average.14 (CEOs, interestingly enough, overestimated by a factor of nearly seven!) 13 14 1. How Globalized is the World? Information Capital Trade Figure 1.2 Global Intra-regional Share of International Interactions, 2013 or most recent year available15 Merchandise Trade Foreign Direct Investment Stocks Portfolio Equity Stocks Telephone Calls Printed Publications Trade People Migrants Students Tourists 0% 10% 20% 30% 40% 50% 60% 70% 80% 90% 100% More than 40% of all of the international interactions studied except portfolio equity investment take place within roughly continent-sized regions. Over half of merchandise trade and telephone calls are intra-regional, as are over 70% of international tourist arrivals. We refer to the widespread overestimation of the extent of globalization as “globaloney.”16 15 A common counterargument—especially before the crisis—was that even if the extent of globalization is small today, a borderless world may be just around the corner. Looking back in history, however, reveals that the changes that have occurred are rather mixed, as examined in the next section of this chapter. The percentage of the world’s population composed of immigrants, for example, is about the same now as it was in 1910!17 Believers in a flat world also often point to the internet and, more broadly, to the fact that in the last few decades, the cost of communication has plummeted and the richness of what can be transmitted has exploded, in support of their views. But the portion of internet traffic that crosses international borders is actually about 17%—five times as high as telephone calls, but far below the level one would expect in a flat world. Similarly, an estimated 16% of people’s friends on Facebook are foreign,18 as are 25% of the people that individuals follow on Twitter.19 Just because we are able to befriend anyone living anywhere on Facebook doesn’t mean that we will—there is an important distinction between potential connectivity and actual connectedness. Turning from depth to the geographic distribution of international interactions, Figure 1.2 displays the intraregional shares of a set of international interactions. It shows that even the small fraction of activities that do take place across borders (as indicated by depth ratios) tend to be more regional than global. More than 40% of all of the international interactions shown on the chart except portfolio equity investment take place within the roughly continent-sized regions listed in Appendix B. More than half of international trade and telephone calls are intraregional as are over 70% of international tourist arrivals. Figure 1.3 measures the average distance traversed by the same international interactions whose regionalization was displayed on Figure 1.2. The weighted average distance traversed by these interactions was 4,904 kilometers (3,047 miles). That may seem like a long distance, but when compared to the average distance between any two randomly selected countries around the globe of roughly 8,500 kilometers, it provides another indicator of the limited extent of globalization. Global Connectedness Trends Contrary to the popular pre-crisis view that globalization involves the “inexorable integration of markets, nationstates and technologies,”20 globalization can indeed both rise and fall. Global connectedness was hit hard by the financial crisis in 2008 and 2009. It has since recovered most of its losses but has yet to surpass its 2007 peak, as shown on Figure 1.4. Over the past year, depth resumed its upward march, while breadth continued to trend downward. That depth began growing again during 2013, after its recovery stalled during 2012, is good news. Higher depth scores on the DHL Global Connectedness index are correlated with faster economic growth rates and higher human development levels as measured on the United Nations’ Human Development Index.21 Globalization’s limited DHL Global Connectedness Index 2014 Average Distance Between Randomly Selected Countries Information Capital Trade Figure 1.3 Global Average Distance (kilometers) Traversed by International Interactions, 2013 or most recent year available22 Merchandise Trade Foreign Direct Investment Stocks Portfolio Equity Stocks Telephone Calls Printed Publications Trade People Migrants Students Tourists 0 1,000 2,000 3,000 4,000 5,000 6,000 7,000 8,000 9,000 10,000 The weighted average distance traversed by interactions covered by the index was 4,904 kilometers (3,047 miles) in 2013, about half the distance between two randomly selected countries. current depth also implies very significant room for deeper global connectedness that could accelerate growth. The potential gains add up to trillions of dollars.23 Depth trends along all of the pillars and components of the index are covered in Chapter 3 of this report. 22 Declining breadth at the global level is neither necessarily positive nor negative. It is natural and efficient for countries’ international interactions to be somewhat focused on partners with which they share cultural, administrative/ political, geographic, and economic (“CAGE”) proximity and similarity. However, such focus can be either overdone or underdone, and so must be analyzed on a country-bycountry basis. Further examination of the breadth trends, covered in Chapter 4, shows the decline in global breadth to be driven by falling breadth in advanced economies: the breadth of emerging economies’ international interactions continues to rise (albeit from significantly lower levels). In other words, the international interactions of advanced economies are not keeping up with the big shift of economic activity to emerging economies. This is consistent with mounting evidence that advanced economies—at both the country and company levels—have faced significant challenges in tapping into growth opportunities in emerging economies. Changing this will require advanced economies to boost their capacities to bridge the CAGE distances that separate them from emerging economies. Figure 1.5 breaks down the combined breadth-and-depth trends since 2005 pillar by pillar (separate depth and breadth trends by pillar are covered in Chapters 3 and 4). The information pillar continues to scale new heights: it is the only pillar that has risen monotonically since it was first measured. Its rise has been driven, in particular, by the rising depth of international internet bandwidth and international telephone calls—although the depth data presented above remind us that this expanded technological connectivity is still primarily used for domestic, not international, communication. Trade was the most volatile pillar over the period studied, and its gyrations were driven by depth rather than breadth. Global connectedness on the trade pillar collapsed in the aftermath of the financial crisis, partially recovered by 2011, and then went back into decline. The growth of trade depth was held back by the slow pace of recovery across many advanced economies and decelerating growth in many emerging economies—and, probably, protectionism (as elaborated in Chapter 3). The capital pillar also exhibited significant volatility over 2005–2013, and had capital flows not been smoothed out by being averaged over three years, this would have been the most volatile pillar of all. The capital pillar was hit hard, like trade, by the crisis but has grown since 2010—particularly in 2013, when the depth of the world’s FDI and portfolio equity stocks recorded their highest levels over the period studied. The growth of international portfolio equity investment stocks has been particularly dramatic, soaring from 25% of world stock market capitalization in 2005 to 39% in 2013. Looking across breadth and depth, however, capital flows remain below their pre-crisis peaks. 15 16 1. How Globalized is the World? Figure 1.4 Global Connectedness, Depth, and Breadth 2005 –2013 Figure 1.5 Global Connectedness Pillars, 2005 –2013 125% 110% 120% 105% 115% 110% 100% 105% 100% 95% 95% 2005 2006 2007 2008 Global Connectedness 2009 2010 2011 Depth 2012 2013 2005 Breadth 2006 2007 2008 2009 Trade Capital Information People 2010 2011 2012 2013 Global connectedness was hit hard by the financial crisis in 2008 and Global connectedness on the information pillar continues to scale new 2009, but has since recovered most of its losses. It has, however, not yet heights. The capital pillar also turned in a notable increase during 2013, surpassed its 2007 peak. along with a more modest rise on the people pillar. Global connectedness on the trade pillar declined during 2012 and 2013. The people pillar, in contrast, is more stable than the other pillars, partly because migration and international education are measured based on the number of people outside of their countries of origin at a given time (stocks) rather than people who moved in a given year (flows). Its growth is also restrained by visa and work permit requirements that curb international mobility. That said, the depth and breadth of the people pillar both exhibit modest rising trends. E&Y, and MGI all focus on depth, but basically missed out on what many observers regard as the biggest drop-off in the intensity of globalization in the last few decades, raising questions about the methodologies that underlie them. In regard to distribution/breadth, E&Y added one simple measure—the share of main trading partners in total trade—in its 2012 edition, but the other two indexes incorporate no such measures at all. And directionality is entirely ignored. Consider these points in a bit more detail. Comparisons with Other Globalization Indexes Depth Increasing attention to globalization has led to the development of several globalization indexes that aggregate across multiple variables to calculate summary measures of countries’ globalization levels that are then used to rank them. The first such analysis to attract significant attention was produced by the consulting firm A.T. Kearney in collaboration with Foreign Policy magazine, and was released in 2001.24 But since that index has not been released since 2007, it will not be addressed further here. Rather, this section will focus primarily on comparisons between the DHL Global Connectedness Index and the three other globalization indexes that have been published more than once and continue to be updated: the KOF Index of Globalization, 25 the Ernst & Young (E&Y) Globalization Index (generated in cooperation with the Economist Intelligence Unit), 26 and the Maastricht Globalization Index (MGI).27 Does it matter which globalization index you use? We would argue that it does, for reasons best explained in terms of the 3-D approach to measuring globalization that underlies the DHL Global Connectedness Index. KOF, Figure 1.6 compares trends in the depth of globalization reported by the DHL Global Connectedness Index and globalization trends based on the other indexes.28 Before the onset of the financial crisis in 2007, when globalization was unequivocally rising and the only question of interest was “by how much?” the differences between indexes were less striking. But the DHL Global Connectedness Index was the only index to register a significant drop in overall globalization when the crisis hit. KOF registered a brief pause in 2008 and the other two indexes only registered slower rates of increase.29 The general sense of a significant drop-off— former US deputy treasury secretary Roger C. Altman, for example, penned a 2009 article in Foreign Affairs entitled “Globalization in Retreat”—raises questions about the relevance of indexes that merely stagnated or continued to rise throughout the post-crisis period. We also checked that this difference is not due to differences in the schemes employed to aggregate data across countries. Global trends reported by the other indexes reflect DHL Global Connectedness Index 2014 Figure 1.6 Globalization Trend Comparison: GCI Depth versus Other Indexes, 2005 –2013 125% 120% 115% 110% 105% 100% 2005 DHL GCI Depth 2006 2007 2008 DHL GCI Depth Simple Average 2009 2010 KOF 2011 E&Y 2012 2013 E&Y Forecast MGI The DHL Global Connectedness Index is the only one of the established globalization indexes to register a significant drop in its overall results during the global financial crisis. simple averages across countries’ scores. However, given the tremendous variation across countries in terms of size and participation in international interactions, the DHL Global Connectedness Index (starting in its 2012 edition) adopted a system that permits the calculation of weighted averages at a global level as well as at intermediate levels of aggregation (regions and advanced versus emerging economies). To check that the differences are not driven by this focus on weighted versus simple averages, we recomputed our depth trends using simple averages (the dotted line in Figure 1.6). Even with this alternate averaging method, the DHL Global Connectedness Index remains the only index to register a significant drop in the wake of the crisis. Apart from differences in the averaging scheme employed, the reasons for differences in depth as analyzed by the DHL Global Connectedness Index versus the other indexes seem to relate, in large part, to the inclusion of enablers in some of the other indexes as well as differences in the weights attached to specific variables, as elaborated at the end of Chapter 5. Distribution While the DHL Global Connectedness Index devotes considerable attention to distribution, other indexes do not—with the sole exception of the trade concentration measure in the 2012 E&Y index—and it would be hard for them to do so without a fundamental transformation of their datasets and calculation methodologies. The analysis of distribution in the DHL Global Connectedness Index vastly expands the data required—more than a hundredfold with more than 100 countries—since we need to know not just how much stuff crosses the border but where it goes (as illustrated in Figure 1.7). Over the nine-year period covered in this report, the breadth analysis alone requires more than 1 million data points. But once compiled, that large dataset also lets one look at many other ways of slicing the data beyond calculating countries’ breadth scores— average kilometers traveled, the split between intra-regional versus inter-regional, and the split between emerging versus advanced economies. The size and complexity of the resultant data motivated the application of new visualization techniques developed for “big data,” some results of which are shown in Part II of this report. The statistical relationships among the different indexes underscore the extent to which breadth analysis differentiates the DHL Global Connectedness Index from the others.30 Starting with any one of the three other indexes (KOF, MGI, or E&Y), one can predict more than two-thirds (69% to 77%) of the variation in countries’ ranks on either of the other two. The GCI depth ranks are a bit less closely correlated with the other indexes but nevertheless, if you know countries’ ranks on KOF, MGI, or E&Y, you can predict 64% to 68% of the variation in GCI depth ranks. Where the GCI departs from the other three is in terms of breadth analysis. Countries’ ranks on the other indexes can only predict 11% to 22% of variation in GCI’s breadth ranks. 17 18 1. How Globalized is the World? Figure 1.7 Data Requirements for GCI versus Other Indexes, Merchandise Trade Illustration Data in GCI Data in Other Indexes The DHL Global Connectedness Index is calculated based on more than 1 million data points. It requires far more data than other globalization indexes because it must capture international interactions by origin and destination, and separately track outward versus inward flows and stocks. The importance of incorporating distribution measures into a globalization index is enhanced by the rising share of economic activity taking place in emerging economies and how it is reshaping international flows. Without these changes, breadth and other measures of distribution would likely have been more static—and arguably less important to track. DHL Global Connectedness Index 2014 Table 1.1 Weighted Average Imbalances by Component, 2005 vs. 201331 2005 2013 Weighted Average Imbalance Change From 2005 to 2013 Weighted Average Imbalance Weighted Average Imbalance 1 Students 63% 1 Students 58% 1 Printed Publications Trade 8% 2 Migrants 51% 2 Migrants 54% 2 Portfolio Equity Flows 6% 3 Portfolio Equity Flows 48% 3 Portfolio Equity Flows 53% 3 Services Trade 4% 4 International Phone Calls 38% 4 International Phone Calls 39% 4 Migrants 4% 5 Tourists 34% 5 FDI Flows 36% 5 FDI Flows 3% 6 FDI Flows 33% 6 Printed Publications Trade 36% 6 International Phone Calls 2% 7 Printed Publications Trade 27% 7 Tourists 32% 7 FDI Stocks 0% 8 Portfolio Equity Stocks 25% 8 Portfolio Equity Stocks 22% 8 Tourists -2% 9 FDI Stocks 22% 9 FDI Stocks 21% 9 Merchandise Trade -3% 10 Services Trade 13% 10 Services Trade 17% 10 Portfolio Equity Stocks -3% 11 Merchandise Trade 13% 11 Merchandise Trade 11% 11 Students -5% While trade surpluses and deficits are the international imbalances that attract the most attention, imbalances on other components of the index are as much as five times larger, and imbalances on more components increased than decreased since 2005. Directionality Directionality imposes another doubling of data requirements and, probably more significantly, would require a second structural change in other indexes, alongside attention to entire distributions rather than one summary statistic. We have just begun to explore the implications of directionality in our own work so the principal point to be made for now is that data on directionality need to be collected before one can even start addressing the issues that it raises. Our preliminary analysis of directionality, however, already points to two interesting findings, illustrated in Table 1.1. First, while most of the attention to imbalances in international interactions focuses on trade, imbalances on the other components of the index are all larger, up to five times as much. Second, that imbalances on more components of the index increased than decreased over 2005–2013 underscores the value of tracking them. 31 A final reason why it is important to incorporate directionality into discussions of globalization is that it is a matter of great concern to policymakers. Many adopt mercantilist policies, favoring exports over imports, even against the advice of some economists who emphasize that imports can also contribute to growth. Most countries also place far more emphasis on attracting tourists than on encouraging their citizens to go abroad, and there is a great deal of concern in many countries’ about the directionality of information flows and their cultural implications.32 19 20 1. How Globalized is the World? Conclusion The upward sweep of globalization for about 50 of merchandise exports. If you are thinking of years, until the global financial crisis, meant that investing in the media sector, look at inward FDI and different globalization indexes would tend to march information flows. And so on. in lockstep—upward—albeit maybe at different rates. The sharp declines in trade and capital flows since the financial crisis provide a sterner test of what the different indexes are made of. The DHL Global Connectedness Index is the only one of the established four to pick up on the drop-off in depth after the global financial crisis, the only one to look at distribution—by measuring the breadth as well as depth of globalization—and the only one to also report information about directionality. Chapter 2 shifts the focus from global levels of globalization to individual countries and regions and presents this year’s global connectedness, depth, and breadth rankings. Policymakers can use the country rankings—and supporting details provided in the country profiles—to identify and prioritize opportunities to strengthen global connectedness that are appropriate to their unique national contexts. And business executives can use the country-level results of the DHL Global Connectedness Index as Compare Depth Scores and Trends: For doing business across borders, countries with deeper connectedness generally present lower barriers to entry, easing your access to the market. However, such countries also welcome your rivals, implying a greater need to worry about tough competition. And countries that have relatively lower scores but are rising quickly in the rankings can also be particularly attractive. Compare Breadth Scores and Trends: Countries with high scores on depth but low scores on breadth are connected only to a narrow set of partner countries. Depending on where you are coming from, think carefully about whether to enter these countries directly or via one of their key trading partners. Countries that lead in terms of both depth and breadth are often good candidates to serve as regional hubs. Consider Directionality: Take note if a country’s inputs to prioritize international markets, investment connectedness is biased toward inward or outward destinations, and sourcing locations, as follows: directionality. For example, South Korea’s rapid Identify What Types of Connectedness Matter Most For Your Company: In cross-country comparisons, overall ranks and scores always dominate the headlines, but practical business insight requires focusing on the specific aspects of connectedness that matter most to your company’s success. Start by thinking through what kinds of connectedness growth might lead one to think it is an easy country to invest in, but a more careful look at its FDI depth scores will reveal a strong bias toward outward investment, reflecting the much greater prevalence of Korean companies investing abroad relative to foreign companies investing in Korea. Account for Distance Effects and Company matter most in your industry, and then from there, Capabilities: As you think about the connectedness identify what is most relevant for your company profiles of countries where you might want to in light of the strategy it is pursuing. If you are do business, keep in mind that the relative ease planning to source manufactured products for or difficulty with which you can access foreign global markets, look at the depth and breadth countries depends not only on their connectedness, DHL Global Connectedness Index 2014 but also on how far or different they are from their countries had too much immigration, simply your home base or other countries where you are telling the respondents the true depth of immigration comfortable operating, as well as your company’s (immigrants as a percentage of total population) in capabilities to bridge such distances. The CAGE their countries cut the share answering “yes” by nearly Distance Framework can help identify and prioritize one-half in the United States and one-third in Europe!34 the relevant types of distance and difference. 33 The declining breadth of advanced economies’ Furthermore, the DHL Global Connectedness Index can international interactions—even as they stretch also be a useful input to competitive analysis. Review over greater geographic distances—reflects those the connectedness profile of your company’s home economies’ international interactions lagging the big country and compare it to the profiles of your major shift of economic activity to emerging economies. That competitors’ home bases. What do such patterns imply finding—based on our country-level analysis—accords about the relative strengths and weaknesses that each with research by others, showing how multinationals company inherits from its national context? Do they from advanced economies are falling behind new rivals suggest strengths to exploit or weaknesses to remedy? from emerging economies. To offset limited depth and A useful rule of thumb is that companies from countries falling breadth, companies—and countries—will need with higher depth scores are typically more adept at to strengthen their capacity to bridge multiple types of adapting to cross-country differences. distance to tap into faraway growth. Chapters 3 and 4 will pick up where this chapter’s The DHL Global Connectedness Index was designed to analysis of the globalization trends at the global be much more than a periodic ranking that celebrates level left off, focusing, respectively, on depth and on the world’s most connected countries. From its careful breadth. The depth of globalization can be a powerful tracking of actual interactions as distinct from their lever to expand prosperity—with the potential to add enablers and impacts—to its exclusive reliance on hard trillions of dollars to global GDP. That depth is rising data—to the weights it assigns to different aspects of again is a positive development, but its limited current globalization, it is meant to serve as a practical tool to level today points to far more room for it to boost help countries and companies connect more effectively growth than many realize. to opportunities beyond their own borders. Its Depth statistics such as those presented in this report can also help dispel globaloney-induced fears that block progress toward deeper global connectedness and the prosperity that it could create. When Americans and Europeans were surveyed as to whether they thought performance through the global financial crisis provides encouraging evidence of its value for business leaders and policymakers. 21 22 1. How Globalized is the World? 1. How Globalized is the World? – Notes 1 Arvind Subramanian and Martin Kessler. “The Hyperglobalization of Trade and Its Future.” Peterson Institute for International Economics Working Paper, no. No. 13-6 (July 24, 2013). Available at SSRN: http://ssrn. com/abstract=2297994 or http://dx.doi.org/10.2139/ssrn.2297994. 2 James Manyika, Jacques Bughin, Susan Lund, Olivia Nottebohm, David Poulter, Sebastian Jauch, and Sree Ramaswamy. “Global Flows in a Digital Age: How Trade, Finance, People, and Data Connect the World Economy.” McKinsey Global Institute (MGI) (April 2014). http://www.mckinsey.com/ insights/globalization/global_flows_in_a_digital_age. 3 Joachim Fels, head of global economics at Morgan Stanley, issued the following warning in a note to his clients in 2013: “In short, I wonder whether just as 1913 marked the end of first Golden Age of globalization that had begun in 1870, 2013 may mark the end of our age of globalization, which accelerated since the 1980s and 1990s after many emerging markets opened up to international trade and capital flows…To be sure, I’m not predicting the world wars, mass sufferings and economic depressions of the three dark decades following 1913, but I do worry about a creeping trend towards a de-globalization of economic activity and capital flows.” 4 Unless otherwise stated, advanced economies throughout this report refer to economies classified as advanced in the IMF’s World Economic Outlook and emerging economies refer to economies classified as emerging and developing in the same source. 5 The Hong Kong Special Administrative Region (SAR) of the People’s Republic of China, as well as Taiwan (China), are treated as separate economic areas from Mainland China. China, throughout this report, refers to Mainland China. This treatment reflects the way data on these areas are covered in our primary data sources, i.e., with data for Hong Kong SAR and Taiwan reported separately from Mainland China in light of their maintenance of distinct economic systems and economic statistics, separate customs areas, separate immigration controls, etc. These territories were also deemed important to include in the index due to the sizes of their economies: Taiwan ranks 27th globally on GDP at market exchange rates (between Belgium and Austria) and Hong Kong ranks 39th (between Chile and the Philippines). For compactness, the term “countries” as used throughout this report is meant to refer to countries as well as other territories that are included in the index, thus encompassing also Hong Kong and Taiwan. 6 Trade (gross exports of goods and commercial services as percentage of world GDP, 2013) comes from World Trade Organization and World Development Indicators; FDI (Outward Foreign Direct Investment Flows as percentage of Gross Fixed Capital Formation, 2013) comes from UNCTAD World Investment Report 2014; Portfolio equity stocks (inward portfolio equity stock as percent of market capitalization of listed companies, weighted average across available countries, 2013) comes from IMF Balance of Payment Statistics and Euromonitor Passport; Internet traffic (international share of total Internet traffic, 2012) is an estimate based on data from Cisco Visual Networking Index and Telegeography; Telephone calls (international share of total telephone call minutes, including calls placed over the Internet, 2013 estimate) is based on data from International Telecommunication Union and Telegeography (note that this estimate includes calls between telephones using voice over IP technology, calls between telephones and computers, and calls directly between computers via Skype but does not include calls directly between computers using other services); Migrants (immigrants’ share of total world population, 2013) is based on data from United Nations Department of Economic and Social Affairs, “Trends in International Migrant Stock: Migrants by Destination and Origin,” 2013 (United Nations database, POP/DB/MIG/Stock/Rev.2013) and World Development Indicators; Students (university students enrolled in degree programs outside their home countries as share of total tertiary education enrollment, 2012) is based on data from Euromonitor Passport, UNESCO Institute for Statistics, and Ministry of Education of the Republic of China (Taiwan); Tourists (international share of total international and domestic tourist arrivals, 2013) taken from United Nations World Tourism Organization, “UNWTO Tourism Highlights,” 2014 edition. 7 We measure the depth of trade in both goods and services but the breadth only of trade in goods, due to insufficient data on services trade at the country-pair level. 8 For a review of benefits and risks associated with multiple forms of international equity and debt flows, see M. Ayhan Kose, Eswar Prasad, Kenneth Rogoff, and Shang-Jin Wei. “Financial Globalization: A Reappraisal.” IMF Working Paper, no. WP/06/189 (August 2006). http://www.imf.org/ external/pubs/ft/wp/2006/wp06189.pdf. 9 International internet bandwidth, like services trade, is excluded from the breadth analysis due to data limitations. 10 These distinct time frames and their implications for the selection of measures on the people pillar are elaborated in Chapter 5. 11 David Held, Anthony G. McGrew, David Goldblatt, and Jonathan Perraton. Global Transformations: Politics, Economics and Culture (Stanford, CA: Stanford University Press, 1999), Introduction, pp. 32–86. 12 Weighted average by across countries within Europe (according to the region classifications provided in Appendix B), aggregated again as a weighted average using DHL Global Connectedness Index pillar and component weights (enumerated in Chapter 5). 13 Kevin H. O’Rourke, and Jeffrey G. Williamson. Globalization and History: The Evolution of a Nineteenth-Century Atlantic Economy (Cambridge, Mass.: MIT Press, 1999), p. 220. 14 Harvard Business Review online globalization survey launched on April 25, 2007. 15 The regionalization calculations shown on this figure, for consistency with regionalization charts displayed in Part II, were generated based on combined flow values, where available, from both outward and inward directions. If the same flow was reported in both directions, the two reported values were averaged. 16 This term was reportedly first used by US Representative Clare Booth Luce in 1943. 17 According to the 2009 UN Human Development Report, “A report by the ILO counted 33 million foreign nationals in 1910, equivalent to 2.5% of the population covered by the study (which was 76% of the world population at the time).” 18 Johan Ugander, Brian Karrer, Lars Backstrom, and Cameron Marlow. “The Anatomy of the Facebook Social Graph.” arXiv:1111.4503 [cs.SI] (November 2011). http://arxiv.org/abs/1111.4503. DHL Global Connectedness Index 2014 19 Yuri Takhteyev, Anatoliy Gruzd, and Barry Wellman. “Geography of Twitter Networks.” Social Networks 34, no. 1 (January 2012): 73–81. doi:http:// dx.doi.org/10.1016/j.socnet.2011.05.006. 20 Thomas L. Friedman, The Lexus and the Olive Tree: Understanding Globalization. (New York: Farrar, Straus, Giroux, 2000), p. 8. 21 See Chapter 4 of the DHL Global Connectedness Index 2011 for an extended discussion of this topic and specific statistical analyses. 22 The distance calculations shown on this figure, for consistency with distance charts displayed in Part II, were generated based on combined flow values, where available, from both outward and inward directions. If the same flow was reported in both directions, the two reported values were averaged. 23 For a summary of how the gains can exceed 8% of world GDP, see Pankaj Ghemawat, “Quantifying the Gains from Increased Global Integration,” Blog Post, March 5, 2012, available at http://www.ghemawat.com/Blog/ post/2012/03/05/Quantifying-the-Gains-from-Increased-Global-Integration.aspx. Additional details are described in Pankaj Ghemawat. World 3.0: Global Prosperity and How to Achieve It (Boston, Mass.: Harvard Business Review Press, 2011). 24 A.T. Kearney Inc., and Foreign Policy Magazine. “Measuring Globalization.” Foreign Policy, no. 122 (2001): 56-65. doi:10.2307/3183226, Available at: http://www.jstor.org/stable/3183226. 25 See http://globalization.kof.ethz.ch/. 26 See http://www.ey.com/gl/en/issues/driving-growth/globalization---looking-beyond-the-obvious---2012-index. 27 Lukas Figge, and Pim Martens. “Globalisation Continues: The Maastricht Globalisation Index Revisited and Updated.” Globalizations (2014). http:// dx.doi.org/10.1080/14747731.2014.887389. 28 The trend data shown for KOF are taken from the KOF index website. E&Y included overall global trend charts in its 2009, 2010, and 2011 reports, but its latest (2012) edition contained only pillar level trend charts. Therefore, the trend shown is based on country-level data reported on the E&Y index website, and the calculation method has been checked for consistency versus trends reported in E&Y reports. MGI provides a textual description of trends in globalization but not a graphical or numerical summary. The trend shown for MGI is therefore constructed based on MGI country-level data and is consistent with the qualitative pattern described in the MGI’s text. 29 Trend charts in E&Y’s 2009, 2010, and 2011 reports did reflect a significant drop-off around the crisis, but that disappeared with E&Y’s latest (2012) methodological revision. 30 This analysis is based on correlations of ranks among the 56 countries covered in common on the GCI as well as KOF, E&Y, and MGI. 31 International internet bandwidth is excluded from this analysis because— as a (non-directional) connectivity measure—it does not permit analysis of imbalances. Imbalances were calculated for this table by first calculating, for each country and each index component, the ratio of the absolute value of the difference between outward and inward flows or stocks divided by the absolute value of outward flows or stocks plus the absolute value of inward flows or stocks. Those country-level ratios were then aggregated up to the world level using weighted averages with weights set according to countries’ shares of world total flows or stocks on each index component. 32 Our directionality measures on the information pillar, however, should not be viewed as reflecting countries’ projection of influence abroad (or absorption of foreign influences). The larger part of the weight among the directional measures on the information pillar is allocated to telephone calls (rather than trade in printed publications), and which party places (and pays for) a telephone call may not be indicative of the direction of the information actually communicated. 33 Refer to Pankaj Ghemawat, Redefining Global Strategy (Boston, Mass.: Harvard Business School Press, 2007) for more details on the CAGE Framework. The online CAGE ComparatorTM can also help facilitate the process of ranking and mapping countries in terms of their CAGE Distance from your home base. 34 The German Marshall Fund of the United States. “Transatlantic Trends: Mobility, Migration, and Integration.” (2014). http://trends.gmfus.org/ files/2014/09/Trends_Immigration_2014_web.pdf. 23


© Copyright 2026