
10 November 2014 REGULATORY RELEASE
Lonmin Plc
4 Grosvenor Place
London SW1X 7YL
United Kingdom
T: +44 (0)20 7201 6000
F: +44 (0)20 7201 6100
www.lonmin.com
REGULATORY RELEASE
10 November 2014
2014 Final Results Announcement
Lonmin Plc, (“Lonmin” or “the Company”), one of the world’s largest primary Platinum producers, today publishes its Final
Results for the year ended 30 September 2014.
HIGHLIGHTS
Results dominated by strike impact
• Regrettably one fatality on 26 October 2013
• Improved Lost Time Injury Frequency Rate (LTIFR) by 4.6% to 3.34
• Lost 391,000 platinum saleable ounces due to five month strike
• Industry leading safe and exceptional ramp up in a record two months
• Operational flexibility maintained with available ore reserves at an average of 21 months production
• Exceptional instantaneous recovery rates improved to 86.2%
• Platinum sales of 441,684 ounces
Financial Results
• Underlying profit before tax $46 million ($158 million in 2013)
• Net debt of $29 million with available committed facilities of $575 million (Net cash of $201 million in 2013)
• Costs of idle production during the strike resulted in the cost of production per PGM ounce increasing by 47%
• Capital expenditure $93 million carefully managed through the strike
•
Underlying earnings per share of 5.4 cents versus 20.5 cents in prior year
FY2015 Guidance
• Platinum saleable metal in concentrate production in the region of 750,000 ounces
• Sales of around 730,000 Platinum ounces
• Unit costs of production around R10,800 per PGM ounce
• Capital expenditure of around $250 million
• Stable operating environment is key
Medium-term Outlook
• Expect to maintain sales of circa 750,000 Platinum ounces supported by capital expenditure of around $250 million
to $350 million per annum
• Contain future unit cost increases below wage inflation
• Cost reduction and productivity improvement programmes in place to ensure business is sustainable through all
cycles – value benefits of more than R2.0 billion have been identified and will be targeted over the next three years
Lonmin Chief Executive Officer Ben Magara said: “This year has been unique, with a strike of unprecedented length halting
production for five months. Notwithstanding that, we have made progress in a number of areas. Our ramp-up exceeded all
expectations and we are renewing our operational credibility. Our business review has surfaced real opportunities to
reduce costs, improve productivity and capital efficiency and we are seeing increasingly encouraging results in these areas.
We have made significant management and operating model changes as we take Lonmin to the next level.”
FINANCIAL HIGHLIGHTS
30 September
2014
30 September
2013
$965m
$52m
$(255)m
$46m
$(326)m
5.4c
(33.0)c
$1,520m
$164m
$147m
$158m
$140m
20.5c
31.2c
Trading cash (outflow) / inflow per share iii
Free cash outflow per share iv
(20.4)c
(43.2)c
3.0c
(28.9)c
Net (debt) / cash as defined by the Group v
$(29)m
$201m
4.0x
16.4x
-
Revenue
Underlying i operating profit
Operating (loss) / profit ii
Underlying i profit before taxation
(Loss) / profit before taxation
Underlying i earnings per share
(Loss) / earnings per share
Interest cover (times) vi
Gearing vii
0.6%
Footnotes:
i
Underlying results and (loss) / earnings per share are based on reported results and (loss) / earnings per share excluding the effect of
special items as disclosed in note 3 to the financial statements.
ii
Operating (loss) / profit is defined as revenue less operating expenses before impairment of available for sale financial assets, finance
income and expenses and before share of (loss) / profit of equity accounted investments.
iii
Trading cash flow is defined as cash flow from operating activities.
iv
Free cash flow is defined as trading cash flow less capital expenditure on property, plant and equipment and intangibles, proceeds
from disposal of assets held for sale and dividends paid to non-controlling interests.
v
Net (debt) / cash as defined by the Group comprises cash and cash equivalents, bank overdrafts repayable on demand and interest
bearing loans and borrowings less unamortised bank fees, unless the unamortised bank fees relate to undrawn facilities in which case
they are treated as other receivables.
vi
Interest cover is calculated on the underlying operating (loss) / profit divided by the underlying net bank interest payable excluding
exchange differences.
vii
Gearing is calculated as the net debt attributable to the Group divided by the total of the net debt attributable to the Group and
equity shareholders’ funds.
2
ENQUIRIES
Investors / Analysts:
Lonmin
Tanya Chikanza
Floyd Sibandze
+27 11 218 8300 / +44 20 7201 6007
+27 11 218 8300
Media:
Cardew Group
Anthony Cardew / James Clark
Sue Vey
+44 20 7930 0777
+27 72 644 9777
Notes to editors
Lonmin, which is listed on both the London Stock Exchange and the Johannesburg Stock Exchange, is one of the world's
largest primary producers of PGMs. These metals are essential for many industrial applications, especially catalytic
converters for internal combustion engine emissions, as well as their widespread use in jewellery.
Lonmin's operations are situated in the Bushveld Igneous Complex in South Africa, where nearly 80% of known global PGM
resources are found.
The Company creates value for shareholders through mining, refining and marketing PGMs and has a vertically integrated
operational structure - from mine to market. Underpinning the operations is the Shared Services function which provides
high quality levels of support and infrastructure across the operations.
For further information please visit our website: http://www.lonmin.com
CONTENTS
This document contains the following sections:
• Chief Executive Officer’s Review;
• Operational Review;
• Market Review;
• Reserves & Resources;
• Financial Review;
• Responsibility Statement of the Directors;
• Operating Statistics – 5 Year Review; and
• Financial Statements
3
CHIEF EXECUTIVE’S REVIEW
The Business
The huge impact of a strike of unprecedented length across the South African Platinum Group Metals (PGM) sector
resulted in Lonmin losing 391,000 equivalent saleable Platinum ounces
Our majority union AMCU downed tools on 23 January 2014, demanding a basic wage of R12,500 from the three largest
PGM producers in South Africa, including Lonmin. The three affected producers were clear that such demands were
impossible to meet if they were to remain viable companies and protect jobs and investment. Lonmin negotiated and
communicated collectively with its two peers. That was the right thing to do, but it did not stop us working towards
building better relationships with AMCU and our employees.
On 24 June 2014 an agreement was reached for a return to work. We believe we can have real confidence in this three
year agreement, as there is an undertaking that there would be no industrial action in its duration, in respect of the issues
covered by the wage agreement. We also concluded agreements with our minority unions to ensure that every employee
can be heard. Behind the scenes much was being done. We took early, decisive action during the strike to protect the
business.
Firstly, we anticipated the end of the strike and we planned and prepared. We also made important operational decisions
early and applied a disciplined approach to monitoring and securing our operations during the strike to position ourselves
well for a re-start when the time came. Secondly, we resumed our processing operations in May using the knowledge we
had to judge the strike was close to coming to an end.
Finally, we were bold in our approach to re-starting all our shafts. We prioritised shafts which would generate cash early,
even though they may have been amongst our smaller and older shafts, before moving to our newer, bigger shafts some of
which are higher cost assets. Without the strike we may have chosen to prioritise differently, but we were clear that we
needed to be generating cash as early as possible.
The combination of all this early planning and hard work on relationships meant that we saw 85% of employees return on
day one, June 25th. The huge logistics operation we put in place around key areas such as medical health, strike-related
poverty and transport proved invaluable.
The end result was an industry leading ramp up, achieving full production safely within two months. We optimised the
immediately available ore reserves and built on a rapidly established team ethos at the shafts. We did so with impressive
safety numbers and with equally impressive (and at Saffy, record) tonnages. Shortly after achieving full production we
reported to the market the first fatality-free year in Lonmin’s history. In mining, moving from dormancy to production is
perhaps the most dangerous of times, so despite the lengthy strike the fact that we were able to ramp up so fast, and so
safely, is a huge achievement.
Combined with this, the decisive cash conservation measures we put in place to minimise cash burn, together with the
effective management of our stock pipeline drawdown, resulted in much improved financial flexibility as we ramped up.
All these measures have resulted in our small net debt position of $29 million as at 30 September 2014, leaving significant
headroom to the $575 million in banking facilities available to the Company. In all this our management, from the
reconfigured executive leadership team (described further below) down through the tiers, has performed well, and is
delivering.
In addition, we committed last year to explore our options around reducing costs and improving profitability. This work has
been completed and we have identified value benefits of more than R2 billion over three years.
4
Strategic Priorities
In 2013 we began a fundamental review of our business. Throughout and after the subsequent five month strike in 2014
we took the opportunity to adapt our thinking. This has developed into the strategy, which takes into account the Board
initiatives laid out in early 2013 around social and community issues as well as operational ones and comprises the
following four pillars:
•
•
•
•
Operational Excellence
Enhance Balance Sheet Strength
Our People and Relationships
Corporate Citizenship Agenda
1. Operational Excellence
1.1 Safety
We strive to be the industry leader in safety and we believe that “Zero Harm” is achievable. This starts with the safety and
wellbeing of our employees and extends to everything we do including minimising the environmental impact of our
operations. We believe that integrating our operational and sustainability strategies will enable us to deliver on our goal of
zero harm.
1.2 Priorities
Our highest short term priority is our excellent Marikana operations which are some of the best in the industry in terms of
quality, safety and performance. We are also the industry leader in UG2 mining and processing technology, an increasingly
important part of the ore mix in the industry.
Within our mining operations, we will strive to achieve balance between our eleven shafts. Some are smaller, older, in the
latter stages of their operational life and highly cash generative whilst some are larger, newer, still ramping-up to full
potential and are therefore not currently at premium efficiency and operating cost.
As we told the market we would at this time last year, we launched a comprehensive review of our assets and operations
to address asset utilisation, reduce the total cost of ownership (TCO), improve capital efficiency and productivity and,
therefore, profitability and cash flow and increase potential for paying dividends as the markets improve. All of this aims to
ensure that Lonmin becomes a superior low cost PGM operator in the medium term, whilst prudently managing risk
through all cycles.
As a result of the review, we concluded that our Marikana portfolio utilisation can be further optimised and our return on
the limited capital invested, enhanced. Utilisation of shaft hoisting capacity is too low and our concentrator, smelting and
refining capacity is greater than required for the volume of output from mining. This coupled with low productivity and a
high fixed cost base presents an opportunity for Lonmin to improve profitability.
We are actively pursuing a process of allocating capital to projects that we believe will provide no less than 15% returns,
taking account of risk, and we are reducing capital expenditure in line with cash generation
1.3 Actions
In light of priorities set out above the actions being taken will fall under the following headings:
•
•
•
Marikana asset flexibility
Cost savings
Additional Projects
5
1.3.1 Marikana asset flexibility
We have instituted new operating philosophies at old shafts in decline to maximize cash generation and minimise
expenditure, specifically at East 1, East 2, East 3 and Newman.
We are accelerating improvement initiatives through theory of constraints at our big, low cost shafts of the future to
increase and sustain shaft hoisting performance and improve capital efficiency. It is expected that K3, 4B/1B, Rowland,
Saffy and Hossy shafts will benefit from this.
Saffy ramp-up profile was delivered in line with 2013 promises despite the strike. We have driven the optimal ramp-up of
the shaft by maintaining 18 months of available ore reserve to support the required extraction rate, putting stoping crews
in place ahead of schedule and improving crew efficiencies. We have deployed a highly skilled business improvement team
to identify and eliminate bottlenecks and improved infrastructure to support planned production levels.
Hossy’s long term plan has been adversely impacted by numerous capital deferrals over its life resulting in increased unit
costs. We had already identified it as a high-cost marginal shaft. As we resumed operations following the strike, it was
important to safely ramp up as quickly as possible. The significant attendance we saw across the entire business enabled us
to restart all the shafts. However, we also discussed with the unions the fact that Hossy was at risk in view of its high cost
nature and productivity issues. The excellent rate of production we have demonstrated illustrates the success of the
collaborative effort.
The additional capital required to develop the Hossy shaft to the level where we would see costs come down significantly is
currently unaffordable and must rank behind other projects in attractiveness. As our highest cost and therefore most
vulnerable shaft, Hossy has been the focus of our efforts to reduce costs and we are carrying out a full technical review of
the shaft’s long term prospects while instituting targeted interventions to reduce real unit costs as follows: discarding the
XLP mining method and continuing with hybrid mining whilst increasing the volume of production; reviewing the
contractor model at the shaft; driving efficiency improvement projects and reviewing shaft overheads and right sizing the
operation to 100,000 tonnes per month from a name plate capacity of 120,000 tonnes per month.
K4 shaft offers the best brownfield replacement and growth optionality for Lonmin. We placed it on care and maintenance
in 2012 as market conditions deteriorated but in line with Saffy and Hossy, K4 will be the next shaft to benefit from our
new approach. We are now placing a dedicated team into K4 to look at how we can begin to prepare K4 for an effective
ramp up in due course without requiring excessive capital. We will use the excess productive labour from other shafts. It is
likely that we will see some preparation activity at K4 during the 2015 financial year.
We will continue to mine our opencast pit as long as this makes economic sense and it is likely to deplete by December
2015 at current extraction rates.
We decided to defer the restart of the Number One UG2 concentrator in order to match concentrator capacity to mining
output.
1.3.2 Value Benefits
The value benefits we anticipate, denominated in Rand, as most of our expenses are incurred in Rand, are targeted over
the next three years and amount to more than R2 billion.
Operating Model Cost Savings
We anticipate cost savings of around R600 million to come from a review of our contractor model; redeployment of
employees and contractors; freezing some recruitment; and natural attrition. Additionally we expect continuous
procurement cost savings through the Total Cost of Ownership project.
6
Productivity and Efficiencies
We expect value benefits arising from productivity and efficiencies improvements. This includes half level optimisation of
key shafts and our focus on stoping crew efficiencies.
Process Operations
We have a number of initiatives within our processing operations which are anticipated to yield benefits. This includes
reducing our metals in process pipeline and continued processing recovery improvements through the bulk tailing
treatment project. This project which was delayed as a result of the impact of the strike on capital spend, is progressing
and is anticipated to deliver near term returns.
In addition we intend to leverage customer relationships to optimise revenues generated from our basket and pursue
collaboration in market development.
2. Enhance Balance Sheet Strength
We plan to preserve a conservative balance sheet with access to sufficient funds to finance both ongoing operations and
prudent and efficient capital expenditure.
Our excellent project pipeline should not be funded by bank debt which should be used sparingly, principally to fund
working capital fluctuations. Our ability to re-invest in our asset base is therefore contingent on our own profitability.
Importantly part of our savings from cost and capital efficiency has to go into social investment as this has proven a
business imperative. Going forward we recognise that there will be a need to balance our shareholders’ need to receive a
dividend and the need for capital and social spend.
3. Our People and Relationships
The unprecedented five month strike has refocused our energy on rebuilding relations with employees and their
representative trade unions. In the wake of the strike we have continued to reach out to our employees and all unions,
through meetings and structured workshops aimed at ensuring that any issues can be dealt with swiftly and without
recourse to industrial action. The relationships with our employees and their representative trade unions are critical to our
success. They form the central part of how we conduct our business and an acknowledgement of their respective roles in
ensuring a sustainable operating environment.
We are increasing our efforts to communicate directly with employees and to reclaim our role as the primary source of
communication. This direct engagement with employees through the existing line management structures and the periodic
communication forums, forms part of the way we work and the basis of creating empowered, high performance teams.
Through the leadership development and team effectiveness training programmes, we continue to develop our managers’
capacity to manage this new form of direct engagement.
In addition we have initiated a relationship building programme. This programme has culminated in the Relationship
Charter, which outlines our aspirations of the nature of relationship that will be built with the unions and measures that
are being implemented to give effect to the Charter. The Charter presents a real opportunity to strengthen relations with
trade unions inter alia through constructive and regular engagements.
Management has begun to drive through the strategic actions from the asset review and we are seeing encouraging
results. The solid ground-work that we have done over recent months underpins the excellent traction we have gained and
will enable us to realise future opportunities.
We have made major changes to our top team in order to create a cohesive business with empowered operating teams.
We have experienced and skilled middle management teams and they now have been given a greater say and control over
their various areas which is already bearing fruit. The reshaped management team is now more focused on value and
delivery.
7
The new structure will enable us to utilise the skilled resources we have across the mining and processing operations and
develop a common culture. This provides for our employees’ growth and development with great benefits to Lonmin. Our
new approach is also improving our ability to attract, develop and retain the best talent.
More information around the relationship charter we have developed to guide this process can be found under the
Operational Review of this report.
4. Our Corporate Citizenship Agenda
4.1 Stakeholder Engagement
The importance of genuine and robust stakeholder engagement and relationship building has become increasingly
apparent over the past decade, given the need to understand stakeholder expectations and communicate on key issues
transparently, consistently and in a timely manner. We have identified and prioritised our stakeholder groups and
individuals and allocated relationship “owners” to each grouping. Our aim is to rebuild and protect Lonmin’s relationships
with all and critical stakeholders who have a significant ability to impact Lonmin’s operations and investment case. The
renewed focus and energy on stakeholder engagement acknowledges the role of partnerships in confronting the
challenges plaguing the industry. Functional partnerships between Government, organised labour and community leaders
are essential if we are to create the necessary environment for a sustainable future.
4.2 Corporate Communications and Reputation Management
The role of communications has been critically examined, specifically with respect to rebuilding trust externally as well as
internally between management and employees, and creating an environment of peace and tolerance. This renewed focus
on communication, transparency and genuine engagement led to several structural changes in a bid to align the Company
and our stakeholders to a shared vision of a sustainable and profitable Lonmin through all cycles and minimise business
interruptions.
4.3 Social licence to Operate
Maintaining our social license to operate through securing the trust and acceptance of communities and stakeholders is
material as they host our operations. This is achieved through:
-
stakeholder engagement to ensure social expectations are understood and managed
community upliftment initiatives to address social issues
transformation initiatives to meet the government’s social and economic development goals
ethical business practices that include a commitment to upholding human rights
corporate and community partnerships
Lonmin is supportive of and commits to participate in the South African government’s National Development Plan.
4.4 BEE ownership
The new year is also vital for our BEE responsibilities. We concluded a historic deal with the Bapo community in 2014, and
we must maintain this momentum as we approach various deadlines.
Lonmin was one of the first mining companies to conclude a BEE transaction, transferring 18% of the operations to HDSAs
in 2004. Lonmin was subsequently unable to finalise the last 8% and, even though this has been challenging in this deadline
year, I am confident that the transactions will be completed within the required time frame.
4.5 Living Conditions and Completion of Hostel Conversion
Housing for employees is one of the areas which goes to the heart of our licence to operate, both in terms of the Mining
Charter, and in terms of our relationship with our employees.
8
Whilst it requires significant investment to achieve, a successful housing policy and plan brings long-term benefits in
terms of increased productivity and reduced absenteeism.
In our Social and Labour Plan, we originally committed to convert 128 traditional single-sex blocks into a mixture of family
and bachelor units. We will complete the conversion by the end of December 2014. Upon completion, the 128 converted
hostel blocks will yield 796 family units and 1,868 single units.
Acknowledgements
We have now put the top team in place for the challenges and plans ahead. I expect a step change, given the focus on
operational delivery created by the reconfigured structure and team. I would like to take this opportunity to welcome
Johan Viljoen, who brings industry-leading expertise and experience to his position as Chief Operating Officer. We also
welcome back Ben Moolman, a Lonmin and Platinum stalwart, who will run the Business Support Office (BSO) we
established this year. The BSO is the conscience of the business ensuring we get value from every Dollar and every ounce
and also deliver on our social commitments.
We saw three senior colleagues leave us this year, Albert Jamieson, Natascha Viljoen and Mark Munroe and furthermore,
Barnard Mokwena will be leaving us at the end of December. They have all given great service to this Company. They leave
with our high praises. I know you will join me in wishing them all the best for their future, and in welcoming our new
colleagues, who form part of an Exco which is driving Lonmin to the next level.
Conclusion
The long term fundamentals of the PGM market remain solid and Lonmin is well positioned for improvement when it
comes. We have put a bold cost reduction and productivity improvement programme in place to ensure the business is
sustainable through all cycles and profitable in the near term.
We will mine for value, not just for volume. We will continue to rebuild our relationships with our employees and develop
our relationship with all the unions that represent our employees, building on the Relationship Charter we agreed in early
August this year. We will also use the advantages our new senior management structure gives us to empower our skilled
and experienced middle management tier. Where we have done this already, at Saffy and Hossy, we see encouraging
traction on the ground which contribute to creating a sustainable Lonmin.
Guidance
2015 Financial year
For 2015 we expect platinum metal in concentrate (MIC) production in the region of 750,000 ounces and, after re-stocking
the pipeline, sales are guided to be around 730,000 Platinum ounces. We expect to maintain sales of around 750,000
platinum ounces thereafter with the flexibility to increase or reduce sales dependent on market outlook. As a result of the
continued suppressed market conditions and capital discipline, capital spend on growth ounces has been deferred and
capital expenditure for 2015 reduced from previous guidance of around $400 million to around $250 million. This will be
predominantly focused on Rowland, the K3 incline and Saffy as well as on the bulk tailings project. We will also spend
limited capital on K4 shaft as we begin to prepare this shaft for its eventual restart in 2017, subject to favourable market
conditions.
Taking into account cost savings, productivity initiatives, increased production profile for 2015 and the increase in wages,
we anticipate the unit cost of production to be around R10,800 per ounce.
Medium term outlook
For the medium term, we expect to maintain sales of around 750,000 platinum ounces. This will be supported by capital
expenditure of between $250 million and $350 million per annum. We will continue to manage a balance between capital
investment and maintaining a sound balance sheet. Consequently, capital spend in any year will be subject to prevailing
9
market conditions. Despite the significant inflationary pressures we face, we would expect to contain increases in unit costs
to below wage inflation.
Thank you
Every employee matters greatly to me – Lonmin is not shafts and machines, it is people. That is why safety is our first
priority and everything I have mentioned above must be seen in this context.
I am grateful to our banking syndicate, our core advisors and customers for their continued support but my greatest thanks
as always goes to our employees. I am also appreciative of Brian and his Board for their support and guidance in such a
challenging year. I appreciate the continued commitment of our shareholders and I remain conscious of the need to pay
dividends to shareholders at the earliest appropriate time.
Yours faithfully
Ben Magara
Chief Executive Officer
9 November 2014
10
OPERATIONAL REVIEW
Safety
Whilst the Company can be proud of its safety record, Zero Harm remains the goal. Safety is a journey which does not end.
We are never complacent and we are greatly saddened by the death of our colleague, Mr Siyabonga Sibango who lost his
life in a tragic accident at East 3 shaft on 26 October 2013. He is survived by his wife Ms Nolusindiso Sibango and their two
children Qhama and Lungako.
At Lonmin, we believe that Zero Harm is achievable, every day for everybody and everywhere. We are proud to have
achieved one year fatality free on 27 October 2014, acknowledging the five month strike. The same day, mining operations
achieved six million fatality free shifts.
In 2014 our safety record showed another year on year improvement continuing the impressive trend of recent years. The
LTIFR decreased by 4.6% to 3.34 notwithstanding the impact of the strike. This is particularly pleasing given the heightened
safety risk when operations resume after a standstill.
The manner in which we were able to efficiently, rapidly and safely return to work is testimony of our ability to operate
according to a set of systems and procedures that enable Zero Harm. The prolonged strike had a potential negative impact
on safety at Lonmin. Firstly, prolonged work stoppages such as the five months protected strike, negatively impact on the
integrity of mining geology, infrastructure and equipment. For this reason, Lonmin continued running maintenance and
performance checks on all active shafts and plants throughout the duration of the strike. Secondly, safe behaviour is
habitual and easily unlearned over long periods away from work. As such, employees required extensive re-training before
they were cleared to safely return underground or to the plants after the strike.
Achievements
•
•
•
•
Our Karee 4B/1B shaft has been recognised this year with the JT Ryan award for Safest Mine in South Africa for the
third year in a row at the annual MineSafe Conference held in August 2014. This shaft is the industry leader in
safety with more than eight million fatality free shifts. This conference is collaborative and is supported by mining
companies, industry bodies, employee representative organisations and government.
Smelting and Refining recorded a major safety achievement of a lost time injury (LTI) free year on 4 September
2014.
Lonmin Group achieved one year without a fatality on 27 October 2014 which is an industry record for hard rock
mining in South Africa.
Finally, we appreciate that an individual’s safety and health are affected as much by issues outside the workplace
as within it and we continue to work with all stakeholders to extend our safety awareness and healthcare
programmes to all communities in the Greater Lonmin Community.
Mining Division
Overview
The 2014 financial year was one of the most challenging periods experienced by the Marikana operations in recent history.
The year began with a disappointing first quarter where performance was negatively affected by an unusually high number
of safety stoppages as well as go slow activity associated with the wage negotiations that were taking place at the time.
The five month AMCU led strike, which started on 23 January and was eventually resolved on 24 June, was the dominant
event for the year and accounted for almost all of the underperformance for the year.
Following the strike, production was safely and successfully ramped up and the operations were able to reach normal
production during August. This is testament to the good operational fundamentals of the business, an improving safety
11
outlook, a well-executed care and maintenance strategy during the strike period as well as thorough planning and well
controlled execution of the ramp up process.
Given the challenging and disruptive environment outlined above, tonnes mined at 6.4 million tonnes were 47.3% less than
in 2013.
It is estimated that the impact of the strike on tonnes mined, including disruptions during the wage negotiations leading up
to the strike, was 6.4 million tonnes. Tonnes lost due to Section 54 stoppages are estimated to be 0.3 million tonnes with a
further 0.1 million tonnes lost due to management induced safety stoppages.
Marikana Ore Reserves
The ore reserve position remained largely unchanged when compared to 2013 at 3.7 million square meters, an average of
21 months of production. This level provides the flexibility required to ensure a consistent production output from the
operations.
Productivity
Productivity measured as square meters per total mining employee was 2.57. This is a deterioration of 50.5% when
compared to 2013 as would be expected given the strike impacted total production. However, productivity in August and
September 2014 exceeded the same period in the prior year.
Business Improvement Initiatives
Half Level Optimisation
Half levels across our operations are currently at varying levels of optimisation. The greater the proportion of optimised
half levels on an operation, the smaller the operating footprint and the better the efficiencies. This initiative seeks to
increase the proportion of optimised half levels mined at each operation by:
• Developing a simulation tool to assist operations management to analyse half level performance and to perform a
diagnostic to determine the reasons as to why a particular half level is not optimised
• Operations management will develop action plans to address the issues that are causing sub optimal performance
• These actions will be tracked and updated on a monthly basis
• Half level optimisation status has been introduced as a key performance management area for senior operations
management and a system has been developed to monitor progress quarterly
Improved output per stoping crew
Our objective is to improve stope crew output steadily over the medium term. The primary focus is to increase the number
of times that a stoping crew achieves a production blast during the month. This is to be achieved by:
• Ensuring that there is sufficient mineable face length to provide the requisite flexibility for crews to move without
delay when they encounter problems.
• Line of sight system: Improved short interval control focused on the interrogation of reasons for lost blasts and the
implementation of corrective measures to prevent similar losses in the future
• Interventions aimed at improving the performance of the bottom 20% of performers significantly. These include
deployment of best practice teams to assist with diagnostics and corrective action plans, weekly monitoring by
senior operations management and on-the-job training for supervisors.
Integrating Theory of Constraints philosophy into operating practices
After the successful integration of the philosophy into the Rowland shaft operating practices, a decision has been made to
roll the integration process out to all of the operating units at Marikana. Our Best Practice teams have been trained in the
operating practices and they will be used to conduct the roll out to all operations. The roll out is already underway at Saffy
shaft.
12
Overview of Marikana mines
Karee
Karee operations, comprised of K3, 4B/1B and K4, experienced the brunt of the disruptions related to the slow down
during wage negotiations during the first quarter of the financial year. This together with the full impact of the strike
period was the cause of the significant under performance. Tonnes mined of 2.4 million were down 52.0% on the prior
year. The hoisted 6E mill grade of 4.13 g/t was 4.2% lower in 2014 than in 2013 as a result of the increased proportional
mix of Merensky to UG2 ore as well as some build-up of stocks in the concentrator at the year end. K3 and 4B/1B have
successfully ramped up after the strike and are currently operating close to full capacity. K4 remained on care and
maintenance during the year under review.
Westerns
Westerns operations comprising Rowland, Newman, Hossy, West 1 and East 1 mined 2.2 million tonnes during the year, a
decrease of 48.2% when compared to 2013. The under performance is purely as a result of the strike. Production at
Rowland shaft improved significantly during the first quarter of the year and the excellent performance has been resumed
following the strike with the shaft delivering a fast ramp up to be operating at planned capacity during September.
Newman shaft has recovered well after the strike and is currently operating at planned output levels.
Production output at Hossy shaft improved steadily during the first quarter of the year. This improvement has continued
following the resumption after the strike, with the shaft ramping up to planned production levels very quickly and
delivering the best ever production output of just under 112,000 tonnes during September. The outcome of the Asset
Review regarding this shaft can be found in the CEO review.
West 1 and East 1 have effectively reached the end of their lives and contract mining is being employed to extract the last
remaining pillars and ore accumulations. Grade has remained constant throughout the period under review.
Easterns
The Easterns operations comprising Saffy shaft, East 2 and East 3 (Lonmin) mined 1.1 million tonnes during 2014. This
equates to a 34.8% decrease when compared to FY13. The deterioration in performance is related mainly to the effects of
the five month strike but was also impacted by a very challenging first quarter that was marred by incessant safety
stoppages at Saffy shaft and East 3 shaft. Easterns operations have ramped up well following the strike, with East 2 and
East 3 returning to planned output levels during September.
Notwithstanding the disruption caused by the strike, the production build up at Saffy shaft has been exceptional and ahead
of plan. Good momentum has been achieved during the ramp up with the shaft achieving its best ever monthly output of
just under 163,000 tonnes in September. Saffy has now reached 80% of its nameplate capacity compared to 48% in 2013.
The ore reserve has been developed to a healthy position of 0.6 million square meters which is in excess of 18 months at a
full production stoping rate. Investments have been made to upgrade and de-bottleneck infrastructure and further work in
this regard has been planned with the roll out of the Theory of Constraints management philosophy to the shaft. With the
required face length available, it is expected that the stoping crews will show steady progress in building up their
performance output so that the shaft achieves planned production in 2015.
The 2014 hoisted 6E mill grade for Saffy of 4.62g/t is 2.4% higher than the previous year. This is mainly due to the
proportion of stoping ore increasing relative to reef development ore.
Opencast
The opencast operations operated throughout the strike, albeit at a reduced level of output. Immediately after the
conclusion to the strike, production was restored to pre-strike levels. Tonnes mined of 0.3 million were down 36.8% on the
prior year. The delivered 6E mill grade of 3.11g/t is 6.2% improved on the previous year due to less dilution through
13
improved operational controls. There are only limited ore reserves remaining at this operation and it is anticipated that
they will be completely mined out by December 2015.
Pandora Joint Venture
Tonnes mined at the joint venture for 2014 were 47.7% less than during 2013 and this reflects the difficult first quarter
where production was interrupted on a number of occasions by safety stoppages that were related to the fatal accident
that occurred during October. The five month strike also took its toll on the operation but recovery post the strike has been
good and normal planned production levels were restored during August.
Capital Spend
Of the limited capital expenditure incurred by the Group of $93 million, $64 million was incurred in the mining operations
as a result of the cash conservation measures adopted during the strike period. The majority of the limited capital was
spent on sustaining capital across the various shafts and central engineering. The majority of the project capital funds were
allocated to the K3 UG2 decline project, Saffy shaft and Rowland shaft to continue with ore reserve development projects
that are currently in execution.
Process Operations
During the financial year our total tonnes milled decreased by 48.2% to 6.1 million tonnes. This reflects the production loss
due to the protracted strike. The total milled head grade declined to 4.39 grammes per tonne or 3.4% lower than the prior
year period. The decline in head grade is directly attributable to the ore mix milled which was dictated by the strike, with
the amount of lower-grade opencast Merensky ore increasing from 3.3% to 6.9% when compared to the prior year period.
The planned start-up of the Number One UG2 concentrator was delayed to reduce costs and this plant will now be
commissioned in Q2 of 2015.
For the financial year, we achieved 380,359 saleable ounces of Platinum in concentrate; down 49.3% from the previous
year, as a result of the extended strike. Refined production was higher than concentrate produced as a result of stock
releases across the processing value chain. We are looking to reduce our working capital requirements by running at lower
stock levels and we will not necessarily need to refill the pipeline in 2015 to the same extent.
Platinum sales of 441,684 ounces were achieved during 2014.
The new design on Number One furnace, the design changes implemented on Number Two furnace and a combination of
operational excellence and an experienced workforce assisted in keeping both furnaces idling during the strike period. This
in turn led to a smooth ramp up at the end of the strike.
PGM ounces produced of 882,094 were down 34.0% compared to the prior year period.
The instantaneous recovery rate achieved in 2014 of 86.2% is outstanding and represents a 1.2 percentage point increase
on the prior year despite operations being heavily impacted by the strike. The continuous year on year improvements are a
result of extensive optimization and improvement plans across our processing operations that continue to yield positive
results.
Capital Spend
In 2014, the Process operations spent $21 million on capital compared to $52 million in 2013. The 2014 expenditure included
the completion of the feasibility studies for the bulk tailings project and start-up of the PMR other precious metals circuit upgrade
which is due to be completed by December 2015 and sustaining capital.
14
Other Assets
Limpopo
The deadline for Shanduka to exercise its option over Limpopo remains 31 March 2015. In the interim, a number of
conditions precedent to the completion of the transaction need to be satisfied. The conditions include completion of a
bankable feasibility review, the securing of funding and obtaining all necessary approvals. Shanduka is reworking certain
areas of the bankable feasibility study prior to completion thereof. In the interim, a detailed programme and budget has
been completed for submission to the Shanduka Board that would form the basis of potential renegotiation around the
transaction completion date of 31 March 2015. Feedback is expected from Shanduka once their Board has considered the
programme and budget.
Akanani
Akanani offers the prospect of a large, long life, low cost and highly mechanised mine and a decision has been taken to
compile and submit a Mining Right Application. A Concept Study has commenced and is expected to be completed in the
next six months. Akanani provides us with options in the long-term.
Exploration
Americas
Lonmin is exploring for PGM deposits around the Sudbury Basin in Ontario, Canada in joint ventures with Wallbridge
Mining Company Limited and Vale S.A. Drilling is being undertaken on the Vale JV for further geotechnical studies and to
better define the potential PGM resource.
Europe
Lonmin signed a memorandum of understanding to work with a joint venture partner on two of our Northern Ireland
licences for gold and silver. Subsequent to the year-end we have entered into a joint venture agreement.
Greenfields exploration, geophysical surveys and drilling continued to generate targets for follow up in the coming year
both in Canada and Northern Ireland.
South Africa
An application for renewal of Vlakfontein’s prospecting right has been submitted to the DMR and we await their response.
Lonmin has a joint venture with Boynton in the eastern Bushveld but has held arbitration proceedings against Boynton on
the basis that it failed to comply with its promise to deliver an unencumbered asset to the joint venture. We are
currently awaiting the arbitrator’s decision. In the interim, Boynton awaits a response from the DMR on whether
its application for renewal of prospecting right has been successful.
People
Engaging with Employees and Unions
We launched the relationship building programme with AMCU immediately after the end of the strike in an endeavour to
rebuild our relations. The relationship building programme entailed a series of 2-day break-away sessions across all levels
within Lonmin and AMCU structures aimed at having honest and frank conversations about the state of our relationship
and agreeing measures to bolster the relationship. These break-away sessions have culminated in a relationship charter,
which outlines our desired relationship and the specific measures that will be implemented to ensure that this is achieved.
Similar session will also be held with minority unions.
Our managers have also increased their efforts to communicate directly with employees. This direct engagement and
communication with employees forms part of our drive to reclaim our role as managers and an employer.
Wage agreement: key facts
15
•
•
•
•
•
•
•
A 3-year agreement which enables stabilisation of our operations
The agreement is effective from 1 October 2013 until 30 June 2016
Within a week of the settlement agreement, all employees received back pay from the increase date of 1 October
2013 to 22 January 2014, the day before the start of the industrial action
An annual basic salary increase of R1,000 per month for A-band employees
All other employees, particularly those in the bargaining unit, will receive an 8% increase for the first year and 7.5%
for the next two years
Benefits (including medical aid and pension fund contribution) and allowances (including living out allowance,
annual leave allowance and attendance allowance) will increase by amounts linked to the inflation rate
Associated increased labour costs to the Company were 12.9% for 2014, 8.8% for 2015 and 8.2% for 2016
Workforce Profile
Our total workforce at end September was 38,292 compared to 38,421 in September 2013 of which 28,276 were
permanent employees and 10,016 were contractors. 83% of the overall workforce is South African, with 17% still being
migrant. 8.2% are women.
Employment Equity
Transformation is a key element of how we work and empowerment is important to Lonmin. Transformation imperatives
are entrenched in policies within our recruitment, succession planning and talent management functions that enable
opportunities for Historically-Disadvantaged South Africans (HDSAs).
Community Relations and Our Corporate Citizenship Agenda
Community Value Proposition (CVP)
Contributing to a long-term social, economic and infrastructural development is a direct investment in the sustainability of
the mines as well as that of communities affected by mine activities. The CVP project that we commenced in 2013 is aimed
at better understanding the impact and community development needs to deliver focused social investment that is
impactful and sustainable. The Company’s objective is to make a social investment that has lasting impact beyond the life
of the mines.
Our corporate citizenship agenda
We engage in a range of activities aimed at uplifting our communities. These include education, health and social
infrastructure projects.
Social and Labour Plan (SLP)
Social and Labour Plans (SLPs) required by Mineral and Petroleum Resources Development Act (MPRDA) are submitted to
Department of Mineral Resources for approval on a five-year basis. These plans include a number of initiatives that Lonmin
delivers as part of its legal and social licence to operate. To this end the new SLPs for the coming years will be focused on
accelerating transformation and implementing measures to significantly improve the living conditions of our employees,
host communities and major labour sending communities
BEE Equity Ownership
The Company is required to increase HDSA ownership in its prospecting and mining ventures by 31 December 2014 from its
current holding of 18% to at least 26% as required under the Mining Charter.
As flagged to shareholders in the regulatory release of July 2014, Lonmin announced that it had entered into binding
agreements with the Bapo ba Mogale Traditional Community (the Bapo) in relation to a series of transactions which will
enable Lonmin to meet its Black Economic Empowerment (BEE) targets. Lonmin also stated its intention to implement an
Employee Share Ownership Plan (ESOP) and a Community Share Ownership Trust (CSOT) (for the benefit of the local
communities on the western portion of our Marikana operations). All three transactions will collectively provide the
16
additional 8% equity empowerment which Lonmin requires to achieve the 26% effective BEE equity ownership target by 31
December 2014.
•
Bapo Transaction
The Bapo Transaction involved a royalty for equity swap and the sale of the Bapo 7.5% stake in the Pandora Joint
Venture to a Lonmin subsidiary. This transaction provided the Bapo Community with equity participation of circa
2.25% at Plc level, a deferred royalty payment of R20 million per annum payable by Lonplats (Eastern and Western
Platinum combined) in each of the five years following completion of the transaction, and a minimum procurement
spend of R200 million over the 18 months following the completion of the transaction. Whilst binding legal
agreements were signed in July 2014, two conditions precedent remain to be satisfied and are expected to be
satisfied during November 2014 at which stage the transaction will be complete and implemented. Certain
members of the Bapo Community have indicated that they may institute legal action challenging, amongst other
things, the authority of the Bapo to enter into this transaction. These threats to institute legal action have not been
acted upon at this stage.
•
Employee Share Ownership Plan
Whilst engagements between Lonmin and unions continue as regards the nature of the ESOP to be implemented at
Lonmin the ESOP proposed by Lonmin (which is based on a profit-sharing scheme) will be implemented before the
end of 2014. The ESOP will result in economic participation and ownership by our employees and sharing the
responsibilities and involvement that, that ownership brings. This implementation will ensure that Lonmin receives
HDSA equity accreditation of 3.8%.
•
Community Trusts
Two separate community trusts are being established - one for the Bapo Community and other for the
communities on the western side of our operations. Each community trust will hold Lonplats shares and will be
entitled to dividend payments to be used for the upliftment of the respective communities. To the extent that the
dividend payable in a particular year is less than R5 million, each community trust will be entitled to a minimum
annual payment of R5 million escalating in line with CPI each year. The two community trusts will entitle Lonmin to
an HDSA equity accreditation of 1.8%.
At this stage, the Company expects that completion of all of these arrangements should be achieved by December 2014.
Judicial Commission of Inquiry
The process of giving evidence at the Commission has concluded and all parties are scheduled to complete the
presentation of final arguments by 15 November 2014. Judge Farlam is required to compile a report by 30 March 2015
setting out his findings and recommendation. This report is required to be handed to the President who will have
discretion as to when and the extent to which the contents of the report are made available to the public.
Once Judge Farlam delivers his report we will engage publically on some of these issues and provide a balanced perspective
of events and circumstances that is currently missing, particularly from media reports
17
MARKET REVIEW
Overview
During the year under review the platinum price has fallen short of market expectations. Significant destocking by mining
companies during the longest strike in platinum’s history, not to mention the growth of platinum ETF products in South
Africa, should have led to higher prices than prevail today.
However, speculative investment positions have been long for some time constraining upward price movement leaving
platinum largely range bound throughout most of 2014. During the last two weeks of September a strengthening dollar
combined with uneven global economic trends resulted in significant liquidation and price depreciation.
Nonetheless, as investors have shifted from relatively overweight to underweight in platinum, the health of market
fundamentals is expected to exert greater influence on future price recovery.
Sales
In 2014 Lonmin sold 441,684 ounces of Platinum into the market. Platinum sales contributed 64% of our turnover.
Palladium was the second highest contributor to the revenue basket with the 212,500 ounces sold constituting 17% of
Lonmin’s income. Combined sales of rhodium, ruthenium and iridium contributed a further 11% and Gold and Base Metals
made up the balance.
PGM Prices
Despite the five month strike experienced by the three largest PGM producers both platinum and rhodium prices are lower
in Dollar terms compared to the same period under review in 2013.
The average price of platinum was $1,426 per ounce in the year to September compared to $1,537 per ounce (7% lower)
for 2013, while rhodium lost just $7 on average. Palladium grew by 11%.
Market Outlook 2015
The platinum-group metals continue to offer solid, captive demand through increasing global vehicle sales and tighter
emissions standards, not to mention robust demand in industrial applications and strong emerging growth in platinum
jewellery in India. Therefore, as the market continues to destock, platinum prices are expected to begin to appreciate and
the platinum market to recover. The market and prices remain vulnerable to asynchronous global economic growth and
further Rand weakness.
Supply in 2014
Mine supply from South Africa contracted by 1.3 million ounces year on year mostly due to the prolonged strike. However,
sales for the year are expected to reduce the loss to around 0.8 million ounces as producers destocked the pipeline during
this time. Outside of South Africa supply remained mostly flat with a decline in Zimbabwe due to the temporary closure of
Bimha mine as a result of ground conditions. Recycling in automotive grew by 3.2% but was offset by the decline in
jewellery recycling. Net recycling is estimated to come in at around 1.0% growth year on year. The reduction in metal
prices in calendar Q4 is expected to act as a reduced incentive to recycle platinum.
Demand in 2014
Automotive catalyst demand continues to dominate the end uses of the three primary PGM’s. The recovery of this sector
remains ahead of global GDP growth in most geographies and coupled with ever tightening tailpipe emissions legislation
has underpinned the fundamentals of the metals. In addition, platinum jewellery and other industrial sector demands have
remained relatively supportive.
18
Strengthening Collaboration on Market Development
During 2014 the industry continued with its collaborative effort to promote the use of platinum in jewellery. The significant
growth in India can be ascribed to the perseverance of select South African mining industry participants including Lonmin
and the vision of committed jewellery partners in the region. Further, more intensified efforts should see the Indian
jewellery market grow from strength to strength in the near term. In addition, the industry has also comprehensively
joined forces and are working together to establish and launch a new industry body that will focus on educating and
promoting the market on the value of holding platinum as an investment
MINERAL RESOURCES AND MINERAL RESERVES
2014 Mineral Resources
The main features of the Lonmin Mineral Resources as at 30 September 2014 are:
• Attributable Mineral Resources were 179.1 million ounces of 3PGE+Au in 2014, unchanged with 2013.
• Revisions to the South African Mineral Resource estimates were confined to the Marikana and Pandora properties.
The Mineral Resources at Marikana (excluding tailings) were unchanged in 2014. This is attributed to the net effect of
an increase in the Merensky Mineral Resources being offset by a decrease of the UG2 Mineral Resources. The
Merensky Measured and Indicated Mineral Resources increased by 0.8 million ounces whereas Inferred Mineral
Resources increased by 0.2 million ounces due to re-evaluation after depletion. The decrease in UG2 Mineral
Resources of 1.0 million ounces is the result of mining depletion (0.6 million ounces) and loss on evaluation (0.4
million ounces).
• The Pandora Mineral Resource decreased by 20,000 ounces of 3PGE+Au, the net result of mining depletion partially
offset by reduced geological losses.
• The Marikana Tailings, Akanani, Limpopo and Loskop Mineral Resources were unchanged during 2014.
• The Mineral Resources for the Denison 109 Deposit in Canada have been reported unchanged.
• Revisions to the non-South African Mineral Resources have been reported for the Bumbo base metal and gold deposit
in Kenya. Changes to the Mineral Resource classification was made by converting 28.2 kilo tonnes of Cu-equivalent
metal from Inferred to the Indicated confidence category.
2014 Mineral Reserves
The main features of the Lonmin Mineral Reserves as at 30 September 2014 are:
• Revisions to the South African Mineral Reserves were confined to Marikana. There were no changes to the Limpopo
Reserves.
• The attributable total Mineral Reserves for Marikana were 35.5 million ounces of 3PGE+Au in 2014, compared with
36.0 million ounces in 2013.
• The Proved Mineral Reserves increased by 0.1 million ounces 3PGE+Au in 2014. This is the nett effect of depletion (0.5
million ounces) offset by the conversion of Probable to Proved Mineral Reserves (0.6 million ounces).
• No changes occurred with respect to the operating shaft boundaries at Marikana during the period.
• There were no fundamental changes in the Lonmin life of business plan from the 2013 reporting period. Considering
the disruptions experienced during 2014, the original 2013/2014 LTP plan was applied for the purposes of quantifying
the Mineral Reserves for 2014.
19
PGE Mineral Resources (Total Measured, Indicated & Inferred)1,4
30-Sep-2014
3PGE+Au
Pt
Mt
Mt
g/t
Moz
Moz
751.9
4.87 117.8
71.0
Area
Marikana
Limpopo
2
30-Sep-2013
3PGE+Au
g/t
Moz
755.4
4.85 117.8
Pt
Moz
71.0
128.8
4.07
16.8
8.4
128.8
4.07
16.8
8.4
46.1
3.91
5.8
3.0
46.1
3.91
5.8
3.0
216.0
3.84
26.7
10.9
216.0
3.84
26.7
10.9
Pandora JV
65.8
4.65
9.8
6.0
65.9
4.65
9.8
6.0
Loskop JV3
10.1
4.04
1.3
0.8
10.1
4.04
1.3
0.8
0.4
6.30
0.07
0.04
0.4
6.30
0.07
0.04
22.5
1 241.4
1.10
4.49
0.8
179.1
0.5
100.5
22.5
1.10
0.8
0.5
4.48 179.1
100.5
Limpopo Baobab shaft
Akanani
Sudbury PGM JV3
Tailings Dam3
Total Resource
1 245.1
Notes
1)
All figures are reported on a Lonmin Plc attributable basis, the relative proportions of ownership are per operation
or project. Resources are reported Inclusive of Reserves.
2)
Limpopo2 excludes Baobab shaft.
3)
Loskop and Sudbury PGM JV exclude Rh, due to insufficient assays, and therefore 2PGE+Au are reported. Tailings
Dam exclude Au, due to assay values below laboratory detection limit, and therefore are reported as 3PGE.
4)
Quantities and grades have been rounded to one or two decimal places, therefore minor computational errors may
occur.
PGE Mineral Reserves (Total Proved & Probable)1,3
Area
30-Sep-2014
3PGE+Au
g/t
Moz
Mt
Marikana
Pt
Moz
30-Sep-2013
3PGE+Au
g/t
Moz
Mt
Pt
Moz
277.5
3.98
35.5
21.7
281.2
3.98
36.0
21.9
42.4
3.20
4.4
2.2
42.4
3.20
4.4
2.2
Limpopo Baobab shaft
9.4
3.16
1.0
0.5
9.4
3.16
1.0
0.5
Pandora JV
6.0
4.11
0.8
0.5
6.1
4.11
0.8
0.5
21.1
1.10
0.7
0.5
21.1
1.10
0.7
0.5
356.4
3.70
42.4
25.3
360.2
3.70
42.9
25.6
Limpopo
2
Tailings Dam
4
Total Reserve
Notes
1)
All figures are reported on a Lonmin Plc attributable basis, the relative proportions of ownership are per operation
or project.
2)
Limpopo excludes Baobab shaft.
3)
Quantities have been rounded to one decimal place and grades have been rounded to two decimal places,
therefore minor computational errors may occur.
4)
Tailings Dam exclude Au, due to assay values below laboratory detection limit, and therefore are reported as 3PGE.
20
FINANCIAL REVIEW
Overview
While the impact of the longest strike in the history of the South African platinum sector is a dominant feature of our
financial performance during the year ended 30 September 2014, the balance sheet strength displayed by our ability to
absorb the financial impact of the business disruption and fund a successful ramp up demonstrates the flexibility and
resilience we have built into our capital structure since the events of 2012.
The depressed PGM pricing environment experienced in the first half of the financial year continued in the second half
despite significant supply side constraints due to the strike action. As a result revenue was severely impacted by reduced
production as well as subdued metal prices.
On the cost side, we have separately accounted for idle production costs incurred during the strike for which there was no
associated production output as well as additional costs arising directly as a result of the strike action. These have been
disclosed as special costs to assist in understanding the financial performance achieved by the Group on a comparable
basis with prior years. As a result, our underlying performance excludes the impact of the strike action. Other than the
impact of the strike, movements in underlying costs were driven primarily by the release of stock locked up at end of the
previous financial year and utility and labour escalations (including above inflation wage rate increases), somewhat
mitigated by favourable exchange movements. The cost of production per PGM ounce for 2014, including the adverse
impact of the strike action, was R13,538 compared to R9,182 for 2013. The wage agreement signed at the end of the strike
continues the trend of above inflation wage increases which will impact unit costs going forward.
Despite a decrease in capital expenditure during the period, the declining profitability on the back of the strike action
impacted the Group’s ability to generate cash. However, we put in place measures to conserve cash and protect our
balance sheet position during the strike while maintaining our ability to ramp up the business. As a result of these
measures, coupled with our balance sheet strength, we were able to fund a successful ramp up to full production in the
last quarter and end the year with net debt of just $29 million.
From a tax point of view, our philosophy is to comply with the tax legislation of all the countries in which we operate by
paying all taxes due and payable in those countries in terms of the applicable tax laws. Transactions entered into by the
Group are structured to follow bona fide business rationale and tax principles. We recognise that in order to be a
sustainable and responsible business, the Group must have appropriate tax policies that are adhered to and managed
properly. We seek to maintain a proactive and cooperative relationship with local tax authorities in all our business and tax
transactions and conduct all such transactions in a transparent manner.
21
Income Statement
The $112 million movement between the underlying operating profit of $52 million for the year ended 30 September 2014
and that of $164 million for the year ended 30 September 2013 is analysed below.
Year to 30 September 2013 reported operating profit
Year to 30 September 2013 special items
Year to 30 September 2013 underlying operating profit
$m
147
17
164
PGM volume
PGM price
PGM mix
Base metals
Revenue changes
Cost changes (including positive foreign exchange impact of $170m)
(442)
(56)
(22)
(35)
(555)
443
Year to 30 September 2014 underlying operating profit
Year to 30 September 2014 special items
Year to 30 September 2014 reported operating loss
52
(307)
(255)
Revenue
Total revenue for the year ended 30 September 2014 decreased by 37% (or $555 million) to $965 million compared to prior
year revenue of $1,520 million.
The strike impact on production saw PGM sales volume for the year decreasing by 31% compared to the volume sold in the
prior year which contributed $442 million to the total decline in revenue. The impact of the strike was partially diluted by
the release of inventory locked up at the end of the 2013 financial year as a result of the smelter incident and the reduction
of stock in the pipeline during the latter half of the year.
PGM prices weakened during the year under review as the metal pricing environment remained subdued despite the
longest strike in the platinum industry’s history. The impact on the Group’s average prices achieved on the key metals sold
is shown below:
Year ended 30 September
2014
2013
$/oz
$/oz
Platinum
1,403
1,517
Palladium
775
715
Rhodium
1,050
1,097
PGM basket (excluding by-product revenue)
1,013
1,100
The US Dollar PGM basket price (excluding base metals) was 8% down compared to the 2013 average prices. This resulted
in a $56 million reduction in revenue. The Rand basket price (excluding by-products) increased by 4% as a result of the
relatively weaker Rand.
The mix of metals sold resulted in a negative impact of $22 million mainly due to a lower proportion of platinum sold
compared to other refined metals. Base metal revenue was down $35 million mainly as a result of lower volumes sold.
22
Operating costs
As explained in the financial overview, the impact of the disruptions caused by the strike action has been reported as
special costs. Total underlying operating costs for the year decreased by $443 million mainly due to the impact of
decreased production levels and positive foreign exchange movements resulting from the weaker Rand partially offset by
adverse metal stock movements. A track of these changes is shown in the table below.
Year ended 30 September 2013 – underlying cost
$m
1 356
Increase / (decrease):
Marikana underground mining
Marikana opencast mining
Limpopo mining
Concentrating and processing
Overheads
Idle fixed production costs excluded from underlying costs
Operating costs
Ore, concentrate and other purchases
Metal stock movement
Foreign exchange
Depreciation and amortisation
Cost changes (including positive foreign exchange impact)
Year ended 30 September 2014 – underlying costs
(189)
(26)
(3)
(62)
(5)
(287)
(572)
(21)
336
(170)
(16)
443
913
Marikana underground mining costs decreased by $189 million or 22%, as wage and utility escalations were more than
offset by the impact of reduced production and withholding of wages as a result of the strike action. Marikana opencast
mining costs decreased by $26 million or 52% as operations have been scaled back as a result of the subdued price
environment.
Concentrator and processing costs reduced by $62 million or 20% compared to the prior year, as the impact of reduced
production as a result of the strike was partially offset by cost escalations and an increase in maintenance during plant idle
time.
Ore, concentrate and other purchases also reduced by $21 million or 33% as volume produced was impacted by the strike
action. The subdued price environment has also resulted in a decrease in ore purchase costs.
The year under review saw a release of stock in process locked up following last year’s smelter incident as well as a general
reduction in inventory as a result of lower production due to the strike and a drawdown of the processing pipeline during
the second half of the year. This has resulted in a $336 million negative impact on operating profit, excluding exchange
impacts, arising from metal stock movements. The $336 million comprises of a $133 million stock decrease in 2014 and a
$203 million increase in stock in 2013.
The Rand weakened against the US Dollar during the year averaging ZAR10.55 to USD1 compared to an average of ZAR9.24
to USD1 in the 2013 financial year resulting in a $170 million positive impact on operating costs.
Depreciation is calculated on a unit of production basis, spreading costs in relation to proven and probable reserves. Due to
reduced production levels, depreciation and amortisation decreased by $16 million compared to the 2014 financial year.
23
Cost of production per PGM Ounce
The loss in production as a result of the five month strike and lower production in the first quarter due to increased section
54 stoppages as well as production disruptions leading up to the strike impacted negatively on the cost of production per
PGM ounce. The cost of production per PGM ounce for the 2014 financial year, which includes idle production costs
reported as special costs, increased by 47% to R13,538 compared to R9,182 for the year ended 30 September 2013.
Further details of unit costs can be found in the Operating Statistics.
Special operating costs
Special operating costs for the year ended 30 September 2014 are made up as follows:
Idle fixed production costs
Security costs
Contractors’ claims
Other costs
$m
287
10
3
7
307
As mentioned above, idle production overheads incurred during the strike period for which there was no associated
production output as well as costs arising directly as a result of the strike action have been classified as special items. The
total of these strike related costs amounted to $307 million. The major portion of the costs comprised idle fixed production
costs incurred during the strike period which totalled $287 million. The cost of additional security amounted to $10 million.
Costs relating to contractors not being able to fulfil their obligations as a result of the disruption amounted to $3 million.
Other costs include legal, communication, medical and various other start-up costs.
For the year ended 30 September 2013, special costs totalled $17 million. This included an amount of $7 million consisting
of communication costs for reputational rebuild as a result of the August 2012 events at Marikana, as well as costs incurred
on the Farlam Commission. An additional amount of $10 million was incurred on the management restructuring exercise
during the 2013 financial year.
Net Finance costs
Net bank interest and fees
Capitalised interest payable and fees
Foreign exchange gains on net (debt)/cash
Dividends received from investment
Unwinding of discount on provision
Underlying net finance costs
HDSA receivable
Fair value movements in cash flow hedges
Exchange loss in respect of Rights Issue
Unwinding fees relating to the interest rate swap
Net finance costs
Year ended 30 September
2014
2013
$m
$m
(25)
(20)
13
11
10
8
10
(10)
(9)
(2)
(10)
(62)
18
7
(10)
(14)
(64)
(9)
Total net finance costs increased by $55 million to $64 million for the year ended 30 September 2014 compared to $9
million incurred in the prior year.
24
Net bank interest and fees incurred in the 2014 financial year were $25 million which was 25% or $5 million higher than the
$20 million incurred during the year ended 30 September 2013. This was largely as a result of an increase in average drawn
facilities during the year as we sought to protect liquidity during the strike period. Interest totalling $13 million was
capitalised to assets (2013 - $11 million). Dividends received relate to arrear dividends accruing from our investment in
Petrozim Line (Private) Limited which were remitted during the year.
The Historically Disadvantaged South Africans (HDSA) receivable, being the Sterling loan to Shanduka Resources
(Proprietary) Limited (Shanduka) decreased by $62 million during the year as a result of an impairment charge of $80
million partially offset by interest accrued of $18 million. The impairment charge arose as the value of the security for the
loan (being the value of Shanduka’s shareholding in Incwala calculated based on discounted cash flows of Incwala’s
underlying investments in WPL, EPL and Akanani) had fallen below the carrying amount of the receivable, largely driven by
a decline in long term PGM price assumptions applied in the valuation models. The net movements in exchange rates
during the year did not have a significant impact on the loan. The $62 million movement compares to a movement of $18
million in the prior year which consisted of foreign exchange gains of $1 million and accrued interest of $17 million. At 30
September 2014 the balance of the receivable was $337 million (2013 - $399 million).
Taxation
Reported tax for the current financial year was a credit of $123 million compared to $58 million in the 2013 period. The
underlying tax charge of $5 million in the 2014 period becomes a $123 million tax credit after taking into account exchange
gains on the retranslation of Rand denominated deferred tax liabilities ($42 million) and the tax impact of special items
($86 million). These gains are treated as special. In the prior year comparative period exchange gains had an effect of $80
million on the tax charge.
Our philosophy on taxation is to comply with the tax legislation of all the countries in which we operate by paying all taxes
due and payable in those countries in terms of the applicable tax laws. Transactions entered into by the Group are
structured to follow bona fide business rationale and tax principles. We recognise that in order to be a sustainable and
responsible business, the Group must have appropriate tax policies that are adhered to and managed properly. We seek to
maintain a proactive and cooperative relationship with local tax authorities in all our business and tax transactions and
conduct all such transactions in a transparent manner.
With the Group’s primary operations being in South Africa, the tax liability follows such activity which has the effect that
the majority of the Group’s taxes are paid in that country. Following the financial crisis of 2008 and other more recent
events including the events at Marikana of 2012, lethargic global growth which has impacted PGM markets and more
recently the five month industry-wide strike which have impacted profitability, the level of corporate tax has reduced.
However, the Group continues to pay significant amounts in respect of other forms of tax including:
•
•
•
•
Employee taxes
Customs and excise duties
Value Added Tax
State royalties
Our philosophy on transfer pricing is that related party transactions should be charged at arm’s length prices. Transfer
pricing studies were performed by transfer pricing specialists on all our related party transactions and such transactions
were found to be within acceptable norms compared to comparable transactions in similar companies. Lonmin inherited a
number of companies in tax haven jurisdictions from previous unbundling and acquisition transactions. These companies
are dormant entities and therefore do not receive any income. Furthermore, Lonmin does not pay any of its income to any
of the dormant tax haven companies in these inherited structures.
25
Cash Generation and Net (Debt)/Cash
The following table summarises the main components of the cash flow during the period:
Operating (loss)/profit
Depreciation, amortisation and impairment
Changes in working capital
Other non-cash movements
Cash flow (utilised in)/generated from operations
Interest and finance costs
Tax paid
Trading cash (outflow)/inflow
Capital expenditure
Dividends paid to minority shareholders
Free cash outflow
Net proceeds from equity issuance
(Contribution to)/distribution from joint venture
Issue of other ordinary share capital
Cash (outflow)/inflow
Opening net cash/(debt)
Foreign exchange
Unamortised fees
Closing net (debt)/cash
Trading cash flow (cents per share)
Free cash flow (cents per share)
Year ended 30 September
2014
2013
$m
$m
(255)
147
142
157
18
(246)
(5)
(5)
(100)
53
(16)
(33)
(4)
(116)
16
(93)
(159)
(37)
(11)
(246)
(154)
767
(1)
1
1
1
(246)
615
201
(421)
13
13
3
(6)
(29)
201
(20.4)c
(43.2)c
3.0c
(28.9)c
Cash flow utilised in operations in the year ended 30 September 2014 increased by $153 million from an inflow of $53
million in the prior year to an outflow of $100 million in the year under review. The cash outflow for the 2014 financial year
is largely driven by the operating loss as result of the strike action partially offset by positive working capital movements
which comprised mainly of stock released during the period. In 2013 the cash outflow was largely as a result of working
capital movements, a significant portion of which was attributed to the replenishment of the metal in process pipeline
following the production stoppage of 2012.
Trading cash outflow for the year increased by $132 million to $116 million compared to the prior year trading cash inflow
of $16 million. The cash outflow on interest and finance costs decreased by $17 million largely due to the timing of
payments over the two periods under review. The trading cash outflow per share was 20.4 cents compared to a cash inflow
of 3.0 cents in the prior year.
Capital expenditure cash flow at $93 million was $66 million (or 42%) below the prior year spend because the Group’s
capital investment programme was impacted by the strike. In Mining the majority of the project capital funds were
allocated to the K3 UG2 decline project, Saffy shaft and Rowland shaft to continue with ore reserve development projects
that are currently in execution. In 2014, the Process operations spent $21 million on capital compared to $52 million in
2013. The 2014 expenditure included completion of the feasibility studies for the Bulk Tailings project and startup of the
PMR OPM circuit upgrade which is due to be completed by December 2015 and sustaining capital.
During the 2013 financial year, the Group undertook a successful Rights Issue which was completed in December 2012 and
raised total net proceeds of $767 million after costs and foreign exchange charges. The balance sheet strength attained
26
following this equity issuance coupled with cash conservation measures resulted in the Group absorbing the operational
disruption caused by the strike. This has allowed the Group to fund the production ramp up following the strike from
current cash resources, limiting net debt at 30 September 2014 to just $29 million.
Key Financial Risks
The Group faces many risks in the operation of its business. The Group’s strategy takes into account known risks, but risks
will exist of which we are currently unaware. The financial review focuses on financial risk management.
Financial Risk Management
The main financial risks faced by the Group relate to the availability of funds to meet business needs (liquidity risk), the risk
of default by counterparties to financial transactions (credit risk) and fluctuations in interest, foreign exchange rates and
commodity prices (market risk). Factors which are outside the control of management which can have a significant impact
on the business remain, specifically, the fluctuations in the Rand/US Dollar exchange rate and PGM commodity prices.
These are the critical factors to consider when addressing the issue of whether the Group is a Going Concern.
Liquidity Risk
The policy on liquidity is to ensure that the Group has sufficient funds to facilitate all on-going operations. The Group funds
its operations through a mixture of equity funding and borrowings. The Group’s philosophy is to maintain an appropriately
low level of financial gearing given the exposure of the business to fluctuations in PGM commodity prices and the Rand /
US Dollar exchange rate. We ordinarily seek to fund capital requirements from equity.
As part of the annual budgeting and long-term planning process, the Group's cash flow forecast is reviewed and approved
by the Board. The cash flow forecast is amended for any material changes identified during the year, for example material
acquisitions and disposals or changes in production forecasts. Where funding requirements are identified from the cash
flow forecast, appropriate measures are taken to ensure these requirements can be satisfied. Factors taken into
consideration are:
•
•
•
•
the size and nature of the requirement;
preferred sources of finance applying key criteria of cost, commitment, availability, security / covenant conditions;
recommended counterparties, fees and market conditions; and
covenants, guarantees and other financial commitments.
The Group’s current debt facilities are summarised as follows:
•
•
Revolving Credit Facility of $400 million at a Lonmin Plc level which matures in May 2016; and
Three bilateral facilities of R660 million each at a Western Platinum Limited (WPL) level, each consisting of a R330
million five year committed component which matures in June 2016 and a R330 million one year committed
component that can be rolled annually.
The following financial covenants apply to these facilities:
•
•
•
consolidated tangible net worth will not be less than $2,250 million;
consolidated net debt will not exceed 25 per cent of consolidated tangible net worth; and
if:
o in respect of the amended US Dollar Facilities Agreement, the aggregate amount of outstanding loans
exceeds $75 million at any time during the last six months of any test period; or
o in respect of both the amended US Dollar Facilities Agreement and the amended Rand Facilities
Agreements, consolidated net debt exceeds $300 million as of the last day of any test period,
27
the capital expenditure of the Group must not exceed the limits set out in the table below, provided that, if 110 per
cent of budgeted capital expenditure for any test period ending on or after 30 September 2013 is lower than the
capital expenditure limit set out in the table below for that test period, then the capital expenditure limit for that
test period shall be equal to 110 per cent of such budgeted capital expenditure.
Test Period
1 October 2012 to 31 March 2013 (inclusive) . . . . . . . . . . . . . . . . . . . . .
1 October 2012 to 30 September 2013 (inclusive) . . . . . . . . . . . . . . . . . .
1 April 2013 to 31 March 2014 (inclusive) . . . . . . . . . . . . . . . . . . . . . . . .
1 October 2013 to 30 September 2014 (inclusive) . . . . . . . . . . . . . . . . . .
1 April 2014 to 31 March 2015 (inclusive) . . . . . . . . . . . . . . . . . . . . . . . .
1 October 2014 to 30 September 2015 (inclusive) . . . . . . . . . . . . . . . . . .
1 April 2015 to 31 March 2016 (inclusive) . . . . . . . . . . . . . . . . . . . . . . . .
1 October 2015 to 30 September 2016 (inclusive) . . . . . . . . . . . . . . . . . .
Capital expenditure limit (ZAR)
800,000,000
1,600,000,000
1,800,000,000
2,000,000,000
3,000,000,000
4,000,000,000
4,000,000,000
4,000,000,000
Credit Risk
Banking Counterparties
Banking counterparty credit risk is managed by spreading financial transactions across an approved list of counterparties of
high credit quality. Banking counterparties are approved by the Board and consist of the ten banks that participate in
Lonmin’s bank debt facilities. These counter-parties comprise: BNP Paribas S.A., Citigroup Global Markets Limited,
FirstRand Bank Limited, HSBC Bank Plc, Investec Bank Limited, J.P. Morgan Limited, Lloyds TSB Bank Plc, The Royal Bank of
Scotland N.V., The Standard Bank of South Africa Limited and Standard Chartered Bank.
Trade Receivables
The Group is exposed to significant trade receivable credit risk through the sale of PGMs to a limited group of customers.
This risk is managed as follows:
•
•
•
•
aged analysis is performed on trade receivable balances and reviewed on a monthly basis;
credit ratings are obtained on any new customers and the credit ratings of existing customers are monitored on an ongoing basis;
credit limits are set for customers; and
trigger points and escalation procedures are clearly defined.
It should be noted that a significant portion of Lonmin’s revenue is from two key customers. However, both of these
customers have strong investment grade ratings and their payment terms are very short, thereby reducing trade receivable
credit risk significantly.
HDSA Receivables
HDSA receivables are secured on the HDSA’s shareholding in Incwala Resources (Pty) Limited. Refer to note 8 in the
financial statements for details on the valuation of this security and the resulting impairment charge.
Interest Rate Risk
Although the Group is in a net debt position, this risk is not considered to be high at this point in time. The interest position
is kept under constant review in conjunction with the liquidity policy outlined above and the future funding requirements
of the business.
28
Foreign Currency Risk
The Group’s operations are predominantly based in South Africa and the majority of the revenue stream is in US Dollars.
However, the bulk of the Group’s operating costs and taxes are paid in Rands. Most of the cash received in South Africa is
in US Dollars. Most of the Group’s funding sources are in US Dollars.
The Group’s reporting currency is the US Dollar and the share capital of the Company is based in US Dollars.
During the year under review Lonmin did not undertake any foreign currency hedging.
Commodity Price Risk
Our policy is not to hedge commodity price exposure on PGMs, excluding gold, and therefore any change in prices will have
a direct effect on the Group’s trading results.
For base metals and gold, hedging is undertaken where the Board determines that it is in the Group’s interest to hedge a
proportion of future cash flows. The policy allows Lonmin to hedge up to a maximum of 75% of the future cash flows from
the sale of these products looking forward over the next 12 to 24 months. The Group did not undertake any hedging of
base metals under this authority in the period under review and no forward contracts were in place in respect of base
metals at the end of the period.
In respect of gold, Lonmin entered into a prepaid sale of 75% of its current gold production for the next 54 months in
March 2012. In terms of this contract Lonmin will deliver 70,700 ounces of gold over the period with delivery on a quarterly
basis and in return received an upfront payment of $107 million. The upfront receipt was accounted for as deferred
revenue on our balance sheet and is being released to profit and loss as deliveries take place at an average price of $1,510
per ounce delivered.
Contingent Liabilities
The Group provided third party guarantees to Eskom as security to cover estimated electricity consumption for three
months. At 30 September 2014 these guarantees amounted to $9 million (2013 - $10 million).
Simon Scott
Chief Financial Officer
9 November 2014
29
RESPONSIBILITY STATEMENT OF THE DIRECTORS IN RESPECT OF THE ANNUAL REPORT AND ACCOUNTS
We confirm that to the best of our knowledge:
•
the financial statements, prepared in accordance with the applicable set of accounting standards, give a true and fair
view of the assets, liabilities, financial position and profit or loss of the Company and the undertakings included in the
consolidation taken as a whole; and
•
the Directors’ report and Strategic report include a fair review of the development and performance of the business
and the position of the Company and the undertakings included in the consolidation taken as a whole, together with a
description of the principal risks and uncertainties that they face.
Brian Beamish
Chairman
Simon Scott
Chief Financial Officer
9 November 2014
30
OPERATING STATISTICS - 5 year review
Tonnes mined
Marikana
Pandora (100%)
3
Limpopo
Lonmin (100%)
2
2
Lonmin (attributable)
Ounces mined 4
Lonmin excluding Pandora
Pandora (100%)
Limpopo
Lonmin
Lonmin excluding Pandora
Pandora (100%)
Limpopo
Lonmin
5
Tonnes milled
Marikana
Pandora (100%)
7
Limpopo
Lonmin Platinum
6
Milled head grade
Lonmin Platinum
Units
kt
kt
kt
kt
kt
kt
kt
kt
kt
kt
kt
kt
kt
kt
kt
kt
kt
kt
kt
2014
1,484
891
2,375
1,005
428
609
102
104
2,249
782
279
28
1,090
5,713
333
6,046
299
6
2013
3,101
4
1,845
4,950
1,781
948
1,051
170
390
4,339
1,150
426
94
1,671
10,960
528
11,487
571
-
kt
6,351
12,058
%
74.1
73.9
71.7
73.2
kt
6,180
11,730
10,413
11,718
11,304
Platinum
Platinum
Platinum
Platinum
oz
oz
oz
oz
371,651
20,327
255
392,233
717,882
40,917
758,799
635,346
30,714
666,060
695,474
25,342
720,816
686,108
25,670
711,778
Total PGMs
Total PGMs
Total PGMs
Total PGMs
oz
oz
oz
oz
707,913
40,044
572
748,529
1,340,678
78,353
1,419,032
1,174,776
58,300
1,233,076
1,306,082
48,420
1,354,501
1,297,452
49,227
1,346,679
Underground
Opencast
Total
Underground
Underground
Underground
Opencast
Total
kt
kt
kt
kt
kt
kt
kt
kt
5,389
422
5,810
281
27
5,696
422
6,118
10,854
393
11,248
574
11,428
393
11,822
9,936
450
10,386
432
10,367
450
10,817
10,896
748
11,643
394
11,290
748
12,037
10,655
129
10,784
391
11,046
129
11,176
Underground
Opencast
Total
g/t
g/t
g/t
4.48
3.20
4.39
4.60
2.92
4.54
4.56
3.01
4.49
4.54
2.23
4.40
4.67
2.25
4.65
Underground
Opencast
Total
%
%
%
87.0
84.5
86.9
87.0
85.3
87.0
86.1
85.9
86.1
85.4
81.6
85.3
84.8
63.8
84.7
K3 shaft
K4 shaft
4B/1B shaft
Karee
Rowland shaft
Newman shaft
Hossy shaft
W1 shaft
1
East 1 shaft
Westerns
Saffy shaft
East 2 shaft
East 3 shaft
Easterns
Underground
Opencast
Total
Underground
Underground
Total Tonnes
mined
% tonnes mined
from UG2 reef
(100%)
Underground &
Opencast
2012
2,646
117
1,622
4,384
1,599
919
864
126
496
4,003
898
397
104
1,399
9,786
443
10,229
435
10,663
2011
2,750
45
1,643
4,438
2,082
1,197
793
154
536
4,764
1,110
484
153
1,748
10,949
601
11,550
394
11,994
2010
2,498
7
1,610
4,115
2,099
1,502
801
93
524
5,019
1,117
422
136
1,675
10,809
329
11,137
391
11,529
76.1
8
Concentrator recovery rate
Lonmin Platinum
9
31
OPERATING STATISTICS - 5 year review
Metals-in-concentrate
Marikana
Limpopo
Pandora
Lonmin Platinum before
Concentrate Purchases
Concentrate purchases
Lonmin Platinum
10
Platinum
Palladium
Gold
Rhodium
Ruthenium
Iridium
Total PGMs
Platinum
Palladium
Gold
Rhodium
Ruthenium
Iridium
Total PGMs
Platinum
Palladium
Gold
Rhodium
Ruthenium
Iridium
Total PGMs
Platinum
Palladium
Gold
Rhodium
Ruthenium
Iridium
Total PGMs
Platinum
Palladium
Gold
Rhodium
Ruthenium
Iridium
Total PGMs
Platinum
Palladium
Gold
Rhodium
Ruthenium
Iridium
Total PGMs
11
Nickel
11
Copper
Units
oz
oz
oz
oz
oz
oz
oz
oz
oz
oz
oz
oz
oz
oz
oz
oz
oz
oz
oz
oz
oz
oz
oz
oz
oz
oz
oz
oz
oz
oz
oz
oz
oz
oz
oz
oz
oz
oz
oz
oz
oz
oz
MT
MT
2014
355,926
164,960
9,879
49,908
81,693
16,143
678,508
1,121
974
93
114
161
44
2,508
18,913
8,960
54
3,226
5,168
916
37,237
375,960
174,894
10,026
53,248
87,022
17,103
718,253
4,398
1,242
14
531
546
224
6,955
380,359
176,136
10,040
53,779
87,567
17,327
725,208
2,092
1,314
2013
706,012
323,622
17,664
95,241
144,304
33,059
1,319,902
41,117
19,190
315
6,563
9,764
1,773
78,721
747,129
342,812
17,979
101,803
154,067
34,832
1,398,623
3,813
1,132
14
421
428
172
5,980
750,942
343,944
17,993
102,225
154,495
35,004
1,404,603
3,743
2,340
2012
646,393
295,409
16,925
83,144
127,269
27,610
1,196,750
30,625
14,261
228
4,743
7,135
1,195
58,188
677,019
309,670
17,153
87,886
134,404
28,805
1,254,938
2,802
973
10
329
404
129
4,647
679,821
310,643
17,163
88,216
134,808
28,934
1,259,585
3,489
2,226
2011
694,149
324,655
17,471
91,659
144,369
31,294
1,303,597
25,241
11,847
179
3,865
6,070
996
48,199
719,390
336,502
17,650
95,524
150,439
32,290
1,351,796
719,390
336,502
17,650
95,524
150,439
32,290
1,351,796
3,537
2,223
2010
668,620
313,590
14,969
93,043
144,913
31,432
1,266,566
25,756
12,108
176
4,036
6,228
1,041
49,345
694,376
325,698
15,145
97,079
151,141
32,473
1,315,911
694,376
325,697
15,144
97,079
151,141
32,473
1,315,911
2,972
1,824
32
OPERATING STATISTICS - 5 year review
Refined production
Lonmin refined metal
production
Toll refined metal production
Total refined PGMs
Base metals
Sales
Refined metal sales
Concentrate and other
Lonmin Platinum
13
Platinum
Palladium
Gold
Rhodium
Ruthenium
Iridium
Total PGMs
Platinum
Palladium
Gold
Rhodium
Ruthenium
Iridium
Total PGMs
Platinum
Palladium
Gold
Rhodium
Ruthenium
Iridium
Total PGMs
12
Nickel
12
Copper
Platinum
Palladium
Gold
Rhodium
Ruthenium
Iridium
Total PGMs
Platinum
Palladium
Gold
Rhodium
Ruthenium
Iridium
Total PGMs
Platinum
Palladium
Gold
Rhodium
Ruthenium
Iridium
Total PGMs
12
Nickel
12
Copper
12
Chrome
Units
oz
oz
oz
oz
oz
oz
oz
oz
oz
oz
oz
oz
oz
oz
oz
oz
oz
oz
oz
oz
oz
MT
MT
oz
oz
oz
oz
oz
oz
oz
oz
oz
oz
oz
oz
oz
oz
oz
oz
oz
oz
oz
oz
oz
MT
MT
MT
2014
431,683
208,756
12,299
76,940
107,166
27,991
864,835
4,501
1,765
116
1,546
7,417
1,914
17,259
436,184
210,521
12,415
78,486
114,583
29,905
882,094
2,387
1,480
441,684
212,500
13,100
81,120
121,904
29,778
900,087
2013
707,665
319,841
18,676
79,124
171,052
28,068
1,324,426
1,364
662
289
1,837
6,519
1,012
11,683
709,029
320,503
18,965
80,961
177,571
29,081
1,336,109
3,532
2,168
695,803
313,030
18,423
77,625
168,266
28,828
1,301,973
2012
648,414
310,558
18,398
110,896
153,394
32,844
1,274,503
38,958
21,043
729
4,717
7,907
1,944
75,299
687,372
331,601
19,128
115,613
161,300
34,788
1,349,802
3,786
2,153
701,831
335,849
19,273
119,054
170,751
37,187
1,383,945
2011
686,877
323,907
18,013
86,702
164,374
26,337
1,306,210
44,396
49,119
2,879
14,402
24,408
5,249
140,453
731,273
373,026
20,892
101,103
188,782
31,586
1,446,662
4,188
2,454
720,783
372,284
19,417
102,653
187,189
33,603
1,435,929
2010
607,794
303,748
15,284
94,690
147,854
36,073
1,205,443
77,571
15,274
1,100
5,411
8,278
1,695
109,328
685,365
319,022
16,383
100,100
156,133
37,768
1,314,772
3,475
2,091
681,424
315,515
16,289
98,657
153,865
34,790
1,300,540
441,684
212,500
13,100
81,120
121,904
29,778
900,087
2,251
1,448
747,881
695,803
313,030
18,423
77,625
168,266
28,828
1,301,973
3,586
2,130
1,388,761
701,831
335,849
19,273
119,054
170,751
37,187
1,383,945
3,843
2,197
1,209,643
720,783
372,284
19,417
102,653
187,189
33,603
1,435,929
4,180
2,448
730,278
24,850
24,850
706,274
315,515
16,289
98,657
153,865
34,790
1,325,390
3,033
2,169
684,654
33
OPERATING STATISTICS - 5 year review
Average prices
Platinum
Palladium
Gold
Rhodium
Ruthenium
Iridium
14
Basket price of PGMs
15
Full Basket price of PGMs
14
Basket price of PGMs
15
Full Basket price of PGMs
12
Nickel
12
Copper
12
Chrome
Units
$/oz
$/oz
$/oz
$/oz
$/oz
$/oz
$/oz
$/oz
R/oz
R/oz
$/MT
$/MT
$/MT
2014
1,403
775
1,509
1,050
57
521
1,013
1,072
10,654
11,277
13,053
6,810
18
2013
1,517
715
1,508
1,097
74
946
1,100
1,167
10,291
10,921
12,772
7,113
19
2012
1,517
630
1,597
1,274
103
1,042
1,095
1,163
8,807
9,304
14,330
7,201
20
2011
1,769
752
1,405
2,145
168
938
1,299
1,389
9,109
9,716
21,009
8,612
27
2010
1,525
448
1,153
2,308
173
520
1,139
1,195
8,375
8,790
18,569
6,623
5
Footnotes:
1
2
3
4
5
6
7
8
9
10
11
12
13
14
15
East 1 shaft is now reported under Westerns in-line with changes in management structure. Prior years have been adjusted accordingly.
Pandora underground and opencast tonnes mined represents 100% of the total tonnes mined on the Pandora joint venture of which 42.5% is attributable to Lonmin.
Limpopo underground tonnes mined represents low grade development tonnes mined whilst on care and maintenance.
Ounces mined have been calculated at achieved concentrator recoveries and as from 2014 with Lonmin standard downstream processing recoveries to present produced
saleable ounces.
Tonnes milled excludes slag milling.
Lonmin purchases 100% of the ore produced by the Pandora joint venture for onward processing which is included in downstream operating statistics.
Limpopo tonnes milled represents low grade development tonnes milled.
Head Grade is the grammes per tonne (5PGE + Au) value contained in the tonnes milled and fed into the concentrator from the mines (excludes slag milled).
Recovery rate in the concentrators is the total content produced divided by the total content milled (excluding slag).
As from 2014, metals-in-concentrate have been calculated at Lonmin standard downstream processing recoveries to present produced saleable ounces.
Corresponds to contained base metals in concentrate.
Nickel is produced and sold as nickel sulphate crystals or solutions and the volumes shown correspond to contained metal. Copper is produced as refined product but
typically at LME grade C. Chrome is produced in the form of chromite concentrate and volumes shown are in the form of chromite.
Concentrate and other sales have been adjusted to a saleable ounce basis using industry standard recovery rates.
Basket price of PGMs is based on the revenue generated in Rand and Dollar from the actual PGMs (5PGE + Au) sold in the period based on the appropriate Rand / Dollar
exchange rate applicable to each sales transaction.
As per footnote 14 but including revenue from base metals.
34
OPERATING STATISTICS - 5 year review
Capital
1
Expenditure
Employees and
contractors
Exchange rates
R/$
£/$
R/$
£/$
2014
992
93
28,276
10,016
10.55
0.60
11.29
0.62
2013
1,500
159
28,379
10,042
9.24
0.64
9.99
0.62
2012
3,296
408
28,230
8,293
8.05
0.63
8.30
0.62
2011
2,907
410
27,796
9,564
6.95
0.62
8.05
0.64
2010
1,989
267
23,915
9,131
7.45
0.64
6.92
0.64
$m
$m
$m
$m
(622)
(107)
(106)
(74)
(919)
(159)
(133)
(101)
(877)
(168)
(147)
(100)
(995)
(187)
(172)
(97)
(811)
(153)
(156)
(79)
$m
(24)
(26)
(35)
(32)
(31)
Ore, concentrate and other
purchases
Limpopo mining
$m
$m
(38)
(3)
(64)
(7)
(48)
(9)
(46)
(7)
(42)
(5)
Special item adjustment
Royalties
Shared based payments
Inventory movement
FX and Group Charges
$m
$m
$m
$m
$m
287
(5)
(15)
(79)
25
(6)
(13)
203
44
121
(8)
(12)
(140)
14
(12)
(13)
(12)
5
(6)
(12)
111
(43)
Evaluation – excluding FX
Exploration – excluding FX
Corporate – excluding FX
FX
$m
$m
$m
$m
$m
(761)
(6)
(2)
(1)
(1,181)
1
(4)
(10)
(4)
(1,412)
2
(5)
(4)
(2)
(1,567)
(1)
4
6
(1,226)
(6)
(1)
(3)
$m
(771)
(1,199)
(1,421)
(1,559)
(1,235)
Rm
Rm
Rm
Rm
(6,556)
(1,121)
(1,119)
(786)
(8,545)
(1,469)
(1,235)
(928)
(7,079)
(1,346)
(1,183)
(805)
(7,002)
(1,297)
(1,203)
(679)
(6,026)
(1,142)
(1,161)
(586)
Rm
(256)
(243)
(287)
(217)
(227)
Rm
Rm
(402)
(31)
(597)
(61)
(385)
(76)
(318)
(50)
(315)
(37)
Rm
Rm
Rm
Rm
Rm
Rm
3,028
(52)
(148)
(480)
(1,117)
(9,040)
(55)
(121)
2,145
(1,247)
(12,356)
966
(68)
(99)
(842)
(218)
(11,424)
(82)
(87)
(119)
(517)
(11,572)
(40)
(87)
649
(53)
(9,025)
Units
Rm
$m
Employees
Contractors
2
Average rate for period
Closing rate
Underlying cost
of sales
PGM operations
segment
Mining
Concentrating
3
Smelting and refining
Shared services
Management and marketing
services
Total PGM operations segment
Total underlying
cost of sales
PGM operations
segment
Mining
Concentrating
3
Smelting and refining
Shared services
Management and marketing
services
Ore, concentrate and other
purchases
Limpopo mining
Special item adjustment
Royalties
Shared based payments
Inventory movement
FX and Group Charges
35
OPERATING STATISTICS - 5 year review
2014
2013
2012
2011
2010
Rm
Rm
Rm
Rm
(6,556)
(1,121)
(1,119)
(786)
(8,545)
(1,469)
(1,235)
(928)
(7,079)
(1,346)
(1,183)
(805)
(7,002)
(1,297)
(1,203)
(679)
(6,026)
(1,142)
(1,161)
(586)
Rm
Rm
(256)
(9,838)
(243)
(12,420)
(287)
(10,701)
(217)
(10,399)
(227)
(9,142)
oz
707,913
1,340,678
1,174,776
1,306,082
1,297,452
oz
oz
715,746
882,094
1,398,623
1,336,109
1,254,938
1,349,802
1,351,796
1,446,662
1,315,911
1,314,772
oz
722,701
1,404,603
1,259,585
1,351,796
1,315,911
R/oz
R/oz
R/oz
R/oz
(9,261)
(1,567)
(1,269)
(1,087)
(6,373)
(1,051)
(925)
(661)
(6,026)
(1,073)
(877)
(639)
(5,361)
(960)
(832)
(503)
(4,644)
(868)
(883)
(446)
R/oz
R/oz
(355)
(13,538)
(173)
(9,182)
(228)
(8,843)
(161)
(7,815)
(173)
(7,013)
%
%
%
%
(45.3)
(49.2)
(37.3)
(64.5)
(5.8)
2.1
(5.4)
(3.3)
(12.4)
(11.8)
(5.4)
(27.2)
(15.4)
(10.6)
5.8
(12.8)
(0.9)
(6.4)
(11.8)
28.3
%
%
(104.9)
(47.4)
24.1
(3.8)
(41.9)
(13.1)
7.0
(11.4)
27.7
0.8
Units
Cost of production
(PGM operations
4
segment)
Cost
PGM Saleable
ounces
Cost of production
% increase in cost
of production
Mining
Concentrating
3
Smelting and refining
Shared services
Management and marketing
services
Mined ounces excluding ore
purchases
Metals-in-concentrate before
concentrate purchases
Refined ounces
Metals-in-concentrate
including concentrate
purchases
Mining
Concentrating
3
Smelting and refining
Shared services
Management and marketing
services
Mining
Concentrating
3
Smelting and refining
Shared services
Management and marketing
services
Footnotes:
1
Capital expenditure is the aggregate of the purchase of property, plant and equipment and intangible assets (includes capital accruals and excludes capitalised interest).
2
Exchange rates are calculated using the market average daily closing rate over the course of the period.
3
Comprises of Smelting and Refining costs as well as direct Process Operations shared costs.
4
It should be noted that with the restructuring of the business and reporting changes in 2010, and 2011 and 2014 the cost allocation between business units has been changed
and, therefore, whilst the total is on a like-for-like basis, individual line items are not totally comparable.
36
Consolidated income statement
for the year ended 30 September
Note
Revenue
2
2014
i
Underlying
$m
965
Special
items
(note 3)
$m
-
2014
Total
$m
965
2013
i
Underlying
$m
1,520
Special
items
(note 3)
$m
-
2013
Total
$m
1,520
194
(307)
(113)
321
(17)
304
(142)
(157)
-
(157)
ii
(LBITDA) / EBITDA
Depreciation, amortisation and
impairment
iii
Operating (loss) / profit
Impairment of available for sale
financial assets
Finance income
Finance expenses
Share of (loss) / profit of equity
accounted investments
(Loss) / profit before taxation
iv
Income tax credit
(Loss) / profit for the year
(142)
4
4
5
Attributable to:
- Equity shareholders of Lonmin Plc
- Non-controlling interests
(Loss) / earnings per share
v
Diluted (loss) / earnings per share
-
52
(307)
(255)
164
(17)
147
26
(28)
(1)
18
(80)
(1)
44
(108)
9
(19)
(2)
26
(25)
(2)
35
(44)
(4)
46
(5)
41
(2)
(372)
128
(244)
(6)
(326)
123
(203)
4
158
(27)
131
(18)
85
67
4
140
58
198
31
10
(219)
(25)
(188)
(15)
109
22
57
10
166
32
6
6
(33.0)c
(33.0)c
31.2c
31.1c
Consolidated statement of comprehensive income
for the year ended 30 September
(Loss) / profit for the year
Items that may be reclassified subsequently to the income statement
- Change in fair value of available for sale financial assets
- Changes in settled cash flow hedges released to the income statement
- Foreign exchange loss on retranslation of equity accounted investments
Total other comprehensive expense for the period
Total comprehensive (loss) / income for the period
Attributable to:
- Equity shareholders of Lonmin Plc
- Non-controlling interests
2014
Total
$m
(203)
2013
Total
$m
198
(1)
(3)
(4)
(207)
8
(9)
(1)
197
(192)
(15)
(207)
166
31
197
Footnotes:
i
Underlying results and (loss) / earnings per share are based on reported results and (loss) / earnings per share excluding the effect of special items as defined in note 3.
ii
(LBITDA) / EBITDA is operating (loss) / profit before depreciation, amortisation and impairment of goodwill, intangibles and property, plant and equipment.
iii
Operating (loss) / profit is defined as revenue less operating expenses before impairment of available for sale financial assets, finance income and expenses and share of
(loss) / profit of equity accounted investments.
iv
The income tax credit substantially relates to overseas taxation and includes net exchange gains of $42 million (2013 - $80 million) as disclosed in note 5.
v
Diluted (loss) / earnings per share is based on the weighted average number of ordinary shares in issue adjusted by dilutive outstanding share options.
37
Consolidated statement of financial position
as at 30 September
2014
$m
2013
$m
40
457
2,882
28
27
3,434
40
462
2,908
36
430
3,876
373
76
2
337
143
931
449
86
4
201
740
(244)
(86)
(27)
(357)
574
(295)
(23)
(318)
422
Net assets
(86)
(376)
(23)
(141)
(626)
3,382
(501)
(47)
(140)
(688)
3,610
Capital and reserves
Share capital
Share premium
Other reserves
Retained earnings
Attributable to equity shareholders of Lonmin Plc
Attributable to non-controlling interests
Total equity
570
1,411
88
1,164
3,233
149
3,382
569
1,411
88
1,341
3,409
201
3,610
Note
Non-current assets
Goodwill
Intangible assets
Property, plant and equipment
Equity accounted investments
Other financial assets
Current assets
Inventories
Trade and other receivables
Tax recoverable
Other financial assets
Cash and cash equivalents
Current liabilities
Trade and other payables
Interest bearing loans and borrowings
Deferred revenue
8
8
9
9
Net current assets
Non-current liabilities
Interest bearing loans and borrowings
Deferred tax liabilities
Deferred revenue
Provisions
9
The financial statements of Lonmin Plc, registered number 103002, were approved by the Board of Directors on
9 November 2014 and were signed on its behalf by:
Brian Beamish Chairman
Simon Scott Chief Financial Officer
38
Consolidated statement of changes in equity
for the year ended 30 September
Called up
share
capital
$m
Share
premium
account
$m
Equity interest
Other
reserves i
$m
Retained
earnings ii
$m
Total
$m
Noncontrolling
interests iii
$m
Total
equity
$m
At 1 October 2012
Profit for the year
Total other comprehensive expense:
- Changes in settled cash flow hedges released to
the income statement
- Foreign exchange loss on retranslation of equity
accounted investments
Transactions with owners, recognised directly in
equity:
- Share-based payments
- Incwala equity accounting adjustment
- Share capital and share premium recognised on
Rights Issue
- Rights Issue costs charged to share premium
- Shares issued on exercise of share options
- Dividends
203
-
997
-
80
8
1,208
166
(8)
2,488
166
-
257
32
(1)
2,745
198
(1)
-
-
8
-
8
-
8
-
-
-
(8)
(8)
(1)
(9)
366
-
414
-
-
(25)
14
(39)
755
14
(39)
(87)
(76)
668
14
(115)
365
1
-
459
(45)
-
-
-
824
(45)
1
-
(11)
824
(45)
1
(11)
At 30 September 2013
569
1,411
88
1,341
3,409
201
3,610
Called up
share
capital
$m
Share
premium
account
$m
Equity interest
Other
reserves i
$m
Retained
earnings ii
$m
Total
$m
Noncontrolling
interests iii
$m
Total
equity
$m
At 1 October 2013
Loss for the year
Total other comprehensive expense:
- Change in fair value of available for sale financial
assets
- Foreign exchange loss on retranslation of equity
accounted investments
Transactions with owners, recognised directly in
equity:
- Share-based payments
- Shares issued on exercise of share options iv
- Dividends
569
-
1,411
-
88
-
1,341
(188)
(4)
3,409
(188)
(4)
201
(15)
-
3,610
(203)
(4)
-
-
-
(1)
(1)
-
(1)
-
-
-
(3)
(3)
-
(3)
1
1
-
-
-
15
15
-
16
15
1
-
(37)
(37)
(21)
15
1
(37)
At 30 September 2014
570
1,411
88
1,164
3,233
149
3,382
Footnotes:
i
Other reserves at 30 September 2014 represent the capital redemption reserve of $88 million (2013 - $88 million).
ii
Retained earnings include $4 million of accumulated credits in respect of fair value movements on available for sale financial assets (2013 - $5 million accumulated
credits) and a $9 million debit of accumulated exchange on retranslation of equity accounted investments (2013 - $6 million debit).
iii
Non-controlling interests represent a 13.76% shareholding in each of Eastern Platinum Limited, Western Platinum Limited and Messina Limited and a 19.87%
shareholding in Akanani Mining (Proprietary) Limited.
iv
During the year 1,206,465 share options were exercised (2013 – 900,000) on which $1 million of cash was received (2013 - $0.9 million).
39
Consolidated statement of cash flows
for the year ended 30 September
Note
(Loss) / profit for the year
Taxation
Share of loss / (profit) of equity accounted investments
Finance income
Finance expenses
Impairment of available for sale financial assets
Non-cash movement on deferred revenue
Depreciation, amortisation and impairment
Change in inventories
Change in trade and other receivables
Change in trade and other payables
Change in provisions
Share-based payments
Loss on disposal of property, plant and equipment
Cash (outflow) / inflow from operations
Interest received
Interest and bank fees paid
Tax paid
Cash (outflow) / inflow from operating activities
5
4
4
3
Cash flow from investing activities
(Contribution to) / distribution from joint venture
Purchase of property, plant and equipment
Purchase of intangible assets
Cash used in investing activities
Cash flow from financing activities
Dividends paid to non-controlling interests
Proceeds from current borrowings
Repayment of current borrowings
Proceeds from non-current borrowings
Repayment of non-current borrowings
Proceeds from equity issuance
Costs of issuing shares
Loss on settlement of forward exchange contracts on equity issuance
Issue of other ordinary share capital
Cash inflow from financing activities
Decrease in cash and cash equivalents
Opening cash and cash equivalents
Effect of foreign exchange rate changes
Closing cash and cash equivalents
9
9
9
9
9
9
9
9
2014
$m
(203)
(123)
6
(44)
108
1
(20)
142
76
7
(51)
(14)
15
(100)
15
(31)
(116)
2013
$m
198
(58)
(4)
(35)
44
2
(24)
157
(189)
(2)
(32)
(23)
14
5
53
1
(34)
(4)
16
(1)
(91)
(2)
(94)
1
(156)
(3)
(158)
(37)
605
(518)
88
1
139
(71)
201
13
143
(11)
257
(380)
369
(988)
823
(45)
(11)
1
15
(127)
315
13
201
40
Notes to the accounts
1. Statement on accounting policies
Basis of preparation
The financial information presented has been prepared on the basis of International Financial Reporting Standards (IFRSs)
as adopted by the EU.
Going concern
In determining the appropriate basis of preparation of the financial statements, the Directors are required to consider
whether the Group can continue in operational existence for the foreseeable future.
The debt facilities currently available to the Group are summarised as follows:
• Revolving Credit Facility of $400 million at a Lonmin Plc level; and
• Three bilateral facilities of R660 million each at a Western Platinum Limited (WPL) level.
This capital structure places the Group in a strong position to ride the normal working capital cycles while providing a buffer
to withstand the effects of operational shocks that the business may face. One such operational shock manifested in 2014 in
the form of AMCU’s protected strike action in the South African Platinum sector which commenced on 23 January 2014. The
strike had a significant financial impact as fixed production overheads continued to be incurred with no associated production
output. The strike ended after five months with the signing of a three year wage agreement to 30 June 2016. One of the key
terms of the agreement was that the employees would not strike over wage negotiations for those three years. On 24 June
2014 an agreement was reached for a return to work and 85% of our striking employees returned to work on 25 June 2014
and the safe ramp up of operations exceeded expectations and industry peers. The business was back up to full production
during August with tonnes mined in August and September 2014 exceeding August and September 2013.
The capital structure referred to above allowed the business to absorb the financial impact of the strike. This combined with
the successful ramp of the business has seen the Group end the year in a net debt position of just $29 million at 30
September 2014.
The financial performance of the Group is also dependent upon the wider economic environment in which the Group
operates. Factors exist which are outside the control of management which can have a significant impact on the business,
specifically, volatility in the Rand / US Dollar exchange rate and PGM commodity prices.
In assessing the Group’s ability to continue as a going concern, the Directors have prepared cash flow forecasts for a period
in excess of 12 months. Various scenarios have been considered to test the Group’s resilience against operational risks
including:
• Adverse movements in the Rand / US Dollar exchange rate and PGM commodity prices or a combination
thereof.
• Failure to meet forecast production targets.
The Directors have concluded that the Group’s capital structure provides sufficient head room to cushion against downside
operational risks and minimises the risk of breaching debt covenants.
As a result, the Directors believe that the Group will continue to meet its obligations as they fall due and comply with its
financial covenants and accordingly have formed a judgement that it is appropriate to prepare the financial statements on a
going concern basis. Therefore, these financial statements do not include any adjustments that would result if the going
concern basis on preparation is inappropriate.
41
Notes to the accounts (continued)
1. Statement on accounting policies (continued)
New standards and amendments in the year
The following revised IFRS’s have been adopted in these financial statements. The application of these IFRS’s did not have
any material impact on the amounts reported for the current and prior years:
•
IFRIC 20 - Stripping costs in the production phase of a surface mine (effective 1 January 2013 ) requires that stripping
costs incurred, which provide improved access to the ore, be recognised as a non-current asset (“stripping activity
asset”) when certain criteria are met. The principles of IFRIC 20 were adopted by the Group in 2012.
•
Amendment to IAS 16 - Property, plant and equipment (effective 1 January 2013) clarifies the accounting for spare
parts, stand-by equipment and servicing equipment.
•
Amendment to IAS 34 - Disclosure of segment assets and segment liabilities (effective 1 January 2013) aligns the
disclosure requirements for segment assets and segment liabilities in interim financial reporting with IFRS 8 Operating
segments.
•
IFRS 13 - Fair value measurement (effective 1 January 2013) defines fair value, establishes a framework for measuring
fair value and sets out disclosure requirements for fair value measurements.
•
Amendments to IAS 36 - Recoverable amount disclosures for non-financial assets (effective 1 January 2014, but early
adopted by the Group) reverses the unintended requirement in IFRS 13 Fair Value Measurement to disclose the
recoverable amount of every cash-generating unit to which significant goodwill or indefinite-lived intangible assets have
been allocated. Under the amendments, recoverable amount is required to be disclosed only when an impairment loss
has been recognised or reversed.
There were no other new standards, interpretations or amendments to standards issued and effective for the year which
materially impacted the Group’s financial statements.
42
Notes to the accounts (continued)
2. Segmental analysis
The Group distinguishes between three reportable operating segments being the Platinum Group Metals (PGM) Operations
segment, the Evaluation segment and the Exploration segment.
The PGM Operations segment comprises the activities involved in the mining and processing of PGMs, together with
associated base metals, which are carried out entirely in South Africa. These operations are integrated and designed to
support the process for extracting and refining PGMs from underground. PGMs move through each stage of the process and
undergo successive levels of refinement which result in fully refined metals. The Chief Executive Officer, who performs the
role of Chief Operating Decision Maker (CODM), views the PGM Operations segment as a single whole for the purposes of
financial performance monitoring and assessment and does not make resource allocations based on margin, costs or cash
flows incurred at each separate stage of the process. In addition, the CODM makes his decisions for running the business
on a day to day basis using the physical operating statistics generated by the business as these summarise the operating
performance of the entire segment.
The Evaluation segment covers the evaluation through pre-feasibility of the economic viability of newly discovered PGM
deposits. Currently all of the evaluation projects are based in South Africa.
The Exploration segment covers the activities involved in the discovery or identification of new PGM deposits. This activity
occurs on a worldwide basis.
No operating segments have been aggregated. Operating segments have consistently adopted the consolidated basis of
accounting and there are no differences in measurement applied. The Other segment covers mainly the results and
investment activities of the corporate Head Office. The only intersegment transactions involve the provision of funding
between segments and any associated interest.
Year ended 30 September 2014
Revenue (external sales by product):
Platinum
Palladium
Gold
Rhodium
Ruthenium
Iridium
PGMs
Nickel
Copper
Chrome
PGM
Operations
Segment
$m
Evaluation
Segment
$m
Exploration
Segment
$m
Other
$m
Intersegment
Adjustments
$m
Total
$m
620
165
21
85
7
15
913
29
10
13
-
-
-
-
620
165
21
85
7
15
913
29
10
13
965
-
-
-
-
965
43
Notes to the accounts (continued)
2. Segmental analysis (continued)
Year ended 30 September 2014
PGM
Operations
Segment
$m
Evaluation
Segment
$m
Exploration
Segment
$m
204
5
(6)
(9)
-
194
(142)
62
15
(19)
5
-
(6)
-
(9)
21
(19)
(10)
10
(142)
52
26
(28)
(4)
54
(5)
5
-
(6)
-
(7)
-
-
(4)
46
(5)
49
(181)
(132)
5
5
(6)
(6)
(7)
(63)
(70)
-
41
(244)
(203)
3,767
(1,940)
1,827
277
(185)
92
1
(48)
(47)
1,546
(36)
1,510
(1,226)
1,226
-
4,365
(983)
3,382
28
-
-
-
-
28
109
2
-
-
-
111
14
-
-
1
-
15
Other
$m
Intersegment
Adjustments
$m
Total
$m
i
Underlying :
ii
EBITDA / (LBITDA)
Depreciation, amortisation and
impairment
ii
Operating profit / (loss)
Finance income
Finance expenses
Share of loss of equity accounted
investments
Profit / (loss) before taxation
Income tax expense
Underlying profit / (loss) after
taxation
iii
Special items (note 3)
(Loss) / profit after taxation
iv
Total assets
Total liabilities
Net assets
Share of net assets of equity
accounted investments
Additions to property, plant,
equipment and intangibles
Material non cash items – sharebased payments
44
Notes to the accounts (continued)
2. Segmental analysis (continued)
Year ended 30 September 2013
Revenue (external sales by product):
Platinum
Palladium
Gold
Rhodium
Ruthenium
Iridium
PGMs
Nickel
Copper
Chrome
PGM
Operations
Segment
$m
Evaluation
Segment
$m
Exploration
Segment
$m
Other
$m
Intersegment
Adjustments
$m
Total
$m
1,055
224
28
85
13
27
1,432
46
15
27
-
-
-
-
1,055
224
28
85
13
27
1,432
46
15
27
1,520
-
-
-
-
1,520
i
Underlying :
ii
EBITDA / (LBITDA)
Depreciation, amortisation and
impairment
ii
Operating profit / (loss)
Finance income
Finance expenses
Share of profit of equity accounted
investments
Profit / (loss) before taxation
Income tax expense
Underlying profit / (loss) after
taxation
iii
Special items (note 3)
Profit / (loss) after taxation
iv
Total assets
Total liabilities
Net assets
Share of net assets of equity
accounted investments
Additions to property, plant,
equipment and intangibles
Material non cash items – sharebased payments
339
8
(4)
(22)
-
321
(157)
182
8
(4)
(22)
-
(157)
164
13
(25)
-
-
14
(12)
4
174
(27)
8
-
(4)
-
(20)
-
-
4
158
(27)
147
68
215
8
8
(4)
(4)
(20)
(1)
(21)
-
131
67
198
3,899
(1,909)
1,990
276
(187)
89
(42)
(42)
1,603
(30)
1,573
36
-
-
-
-
36
174
7
-
-
-
181
13
-
-
1
-
14
(18)
18
(1,162)
1,162
-
9
(19)
4,616
(1,006)
3,610
45
Notes to the accounts (continued)
2. Segmental analysis (continued)
Revenue by destination is analysed by geographical area below:
The Americas
Asia
Europe
South Africa
Year ended
30 September
2014
$m
118
247
426
174
965
Year ended
30 September
2013
$m
411
461
451
197
1,520
The Group's revenue is all derived from the PGM Operations segment. This segment has two major customers who
contributed 60% ($580 million) and 25% ($241 million) of revenue in the year (2013 - 62% ($937 million) and 30% ($459
million)).
Metal sales prices are based on market prices which are denominated in US Dollars. The majority of sales are also invoiced
in US Dollars with the exception of certain sales in South Africa which are invoiced in South African Rand based on
exchange rates determined in accordance with the contractual arrangements.
Non-current assets, excluding financial instruments, of $3,407 million (2013 - $3,446 million) are all situated in South Africa.
Footnotes:
i
Underlying results are based on reported results excluding the effect of special items as defined in note 3.
ii
(LBITDA) / EBITDA and operating (loss) / profit are the key profit measures used by management.
iii
The impairment of the HDSA receivable to the value of $80 million (2013 - $nil) is included under special items in the segmental analysis. The HDSA receivable forms
part of the “Other” segment.
iv
The assets under "Other" include the HDSA receivable of $337 million (2013 - $399 million) and intercompany receivables of $1,226 million (2013 - $1,162 million).
46
Notes to the accounts (continued)
3. Special Items
‘Special items’ are those items of financial performance that the Group believes should be separately disclosed on the face
of the income statement to assist in the understanding of the financial performance achieved by the Group and for
consistency with prior years.
2014
$m
Operating loss:
i
- Strike related costs
Idle fixed production costs
Security costs
Contractors’ claims
Other costs
ii
- Restructuring and reorganisation costs
Impairment of available for sale financial assets
iv
Share of loss of equity accounted investments
iii
Net finance (expenses) / income:
v
- Interest accrued from HDSA receivable
v
- Foreign exchange gain on HDSA receivable
v
- Impairment of HDSA loan receivable
- Net change in fair value of settled cash flow hedges
- Unwinding fees relating to early settlement of interest rate swap
- Foreign exchange gain on holding Rights Issue proceeds received in advance
- Loss on forward exchange contracts in respect of Rights Issue
Loss on special items before taxation
Taxation related to special items (note 5)
Special (loss) /gain before non-controlling interest
Non-controlling interests
Special (loss) / gain for the year attributable to equity shareholders of Lonmin Plc
2013
$m
(307)
(17)
(287)
(10)
(3)
(7)
-
(7)
(10)
(1)
(2)
(2)
-
(62)
18
(80)
-
1
17
1
7
(14)
1
(11)
(372)
128
(244)
25
(219)
(18)
85
67
(10)
57
Footnotes:
i
Fixed production overheads incurred during the protected strike period for which there was no associated revenue and costs arising directly as a result of the strike action
have been classified as special items. The total of these strike related costs amounted to $307 million. Idle fixed production costs incurred during the strike period
amounted to $287 million. These costs largely consist of salaries, utility costs and depreciation. Additional security costs of $10 million were incurred. Costs relating to
contractors not being able to fulfil their obligations as a result of the disruption amounted to $3 million. Other costs include legal, communication, medical and various
other start-up costs incurred.
ii
These costs relate to the management restructuring exercise completed during 2013.
iii
The $1 million (2013 - $2 million) impairment of available for sale financial assets represents the loss in value below the original cost price of one of our investments.
iv
The Pandora Joint Venture was also impacted by the strike. These costs relate to idle production costs incurred for which there was no associated production output.
v
During the year ended 30 September 2010 the Group provided financing to assist Lexshell 806 Investments (Proprietary) Limited, a subsidiary of Shanduka Resources
(Proprietary) Limited (Shanduka) to acquire a majority shareholding in Incwala, Lonmin’s Black Economic Empowerment partner. This financing gave rise to foreign
exchange movements and the accrual of interest. Refer to note 8 for details regarding the impairment of the HDSA receivable.
47
Notes to the accounts (continued)
4. Net finance expenses
2014
$m
2013
$m
26
6
10
10
9
1
8
Finance expenses:
- Interest payable on bank loans and overdrafts
- Bank fees
- Unamortised bank fees realised on settlement of old loan facility
iii
- Capitalised interest
- Unwinding of discount on provisions
(28)
(19)
(12)
13
(10)
(19)
(11)
(7)
(3)
11
(9)
Special items (note 3):
- Interest on HDSA receivable (note 8)
- Foreign exchange gain on HDSA receivable (note 8)
- Impairment of HDSA loan receivable (note 8)
- Net change in fair value of settled cash flow hedges
- Unwinding fees relating to early settlement of interest rate swap
- Foreign exchange gain on holding Rights Issue proceeds received in advance
- Loss on forward exchange contracts in respect of Rights Issue
(62)
18
(80)
-
1
17
1
7
(14)
1
(11)
Net finance expenses
(64)
(9)
Finance income:
- Interest receivable on cash and cash equivalents
i
- Dividend received from investment
ii
- Foreign exchange gains on net (debt) / cash
Footnotes:
i
Dividends received relate to arrear dividends accruing from our investment in Petrozim Line (Private) Limited which were remitted during the year. The investment in
Petrozim Line (Private) Limited has a $nil carrying value.
ii
Net (debt) / cash as defined by the Group comprises cash and cash equivalents, bank overdrafts repayable on demand and interest bearing loans and borrowings less
unamortised bank fees, unless the unamortised bank fees relate to undrawn facilities in which case they are treated as other receivables.
iii
Interest expenses incurred have been capitalised on a Group basis to the extent that there is an appropriate qualifying asset. The weighted average interest rate used by
the Group for capitalisation is 3.0% (2013 – 5.9%).
48
Notes to the accounts (continued)
5. Taxation
2014
$m
2013
$m
Current tax charge (excluding special items):
United Kingdom tax expense
i
Current tax expense at 22% (2013 – 23.5%)
Less amount of the benefit arising from double tax relief available
-
-
Overseas current tax expense at 28% (2013 – 28%)
Corporate tax expense – current year
Adjustment in respect of prior years
2
1
1
2
3
(1)
Deferred tax charge (excluding special items):
Deferred tax expense - UK and overseas
Origination and reversal of temporary differences
Adjustment in respect of prior years
3
3
-
25
26
(1)
Tax credit on special items – UK and overseas (note 3):
ii
Foreign exchange on current taxation
ii
Foreign exchange on deferred taxation
Tax on special items impacting profit before tax
(128)
(42)
(86)
(85)
1
(81)
(5)
Actual tax credit
(123)
(58)
5
Tax charge excluding special items (note 3)
27
Effective tax rate
38%
(41%)
Effective tax rate excluding special items (note 3)
11%
17%
A reconciliation of the standard tax (credit) / charge to the actual tax credit was as follows:
2014
%
28
Tax (credit) / charge on (loss) / profit at standard tax rate
Tax effect of:
iii
(2)
- Unutilised losses
7
- Foreign exchange impacts on taxable profits
- Adjustment in respect of prior years
(6)
- Disallowed expenditure
(2)
- Expenses not subject to tax
13
Special items as defined above
38
Actual tax credit
2014
$m
(91)
2013
%
28
2013
$m
39
7
(21)
19
5
(42)
(123)
4
(17)
(1)
1
5
(61)
(41)
5
(23)
(2)
1
7
(85)
(58)
The Group's primary operations are based in South Africa. The South African statutory tax rate is 28% (2013 - 28%).
Lonmin Plc operates a branch in South Africa which is also subject to a tax rate of 28% on branch profits (2013 - 28%). The
aggregated standard tax rate for the Group is 28% (2013 - 28%). The dividend withholding tax rate is 15% (2013 - 15%).
Dividends payable by the South African companies to Lonmin Plc are subject to a 5% withholding tax benefitting from double
taxation agreements.
Footnotes:
i
Effective from 1 April 2014 the United Kingdom tax rate changed from 23% to 21% and will change from 21% to 20% from 1 April 2015. This does not materially impact
the Group's recognised deferred tax liabilities.
ii
Overseas tax charges are predominantly calculated based in Rand as required by the local authorities. As these subsidiaries’ functional currency is US Dollar this leads to
a variety of foreign exchange impacts being the retranslation of current and deferred tax balances and monetary assets, as well as other translation differences. The Rand
denominated deferred tax balance in US Dollars at 30 September 2014 is $268 million (30 September 2013 - $388 million).
iii
Unutilised losses reflect losses generated in entities for which no deferred tax is provided as it is not thought probable that future profits can be generated against which a
deferred tax asset could be offset or previously unrecognised losses utilised.
49
Notes to the accounts (continued)
6. (Loss) / earnings per share
(Loss) / earnings per share ((LPS) / EPS) has been calculated on the loss attributable to equity shareholders amounting to
$188 million (2013 – profit of $166 million) using a weighted average number of 569,649,750 ordinary shares in issue (2013
– 532,130,347 ordinary shares).
Diluted (loss) / earnings per share is based on the weighted average number of ordinary shares in issue adjusted by dilutive
outstanding share options in accordance with IAS 33 - Earnings Per Share. In the year to 30 September 2014 outstanding
share options were anti-dilutive and so were excluded from diluted loss per share.
2014
Basic (LPS) / EPS
Share option schemes
Diluted (LPS) / EPS
Loss for
the year
$m
(188)
(188)
Underlying EPS
Share option schemes
Diluted Underlying EPS
Profit for
the year
$m
31
31
Number of
shares
569,649,750
569,649,750
2013
Per share
amount
cents
(33.0)
(33.0)
Profit for
the year
$m
166
166
Per share
amount
cents
5.4
5.4
Profit for
the year
$m
109
109
2014
Number of
shares
569,649,750
5,917,508
575,567,258
Number of
shares
532,130,347
2,105,203
534,235,550
Per share
amount
cents
31.2
(0.1)
31.1
2013
Number of
shares
532,130,347
2,105,203
534,235,550
Per share
amount
cents
20.5
(0.1)
20.4
Underlying earnings per share has been presented as the Directors consider it important to present the underlying results of
the business. Underlying earnings per share is based on the earnings attributable to equity shareholders adjusted to exclude
special items (as defined in note 3) as follows:
2014
Basic (LPS) / EPS
Special items (note 3)
Underlying EPS
(Loss) /profit
for
the year
$m
(188)
219
31
Number of
shares
569,649,750
569,649,750
2013
Per share
amount
cents
(33.0)
38.4
5.4
Profit for
the year
$m
166
(57)
109
Number of
shares
532,130,347
532,130,347
Per share
amount
cents
31.2
(10.7)
20.5
50
Notes to the accounts (continued)
6. (Loss) / earnings per share (continued)
Headline (loss) / earnings and the resultant headline (loss) / earnings per share are specific disclosures defined and required
by the Johannesburg Stock Exchange. These are calculated as follows:
(Loss) / earnings attributable to ordinary shareholders (IAS 33 earnings)
Add back loss on disposal of property, plant and equipment
Add back impairment of assets (note 3)
Tax related to the above items
Non-controlling interests
Headline (loss) / earnings
Year ended
30 September
2014
$m
(188)
1
(187)
2014
Headline (LPS) / EPS
Share option schemes
Diluted Headline (LPS) / EPS
Loss for
the year
$m
(187)
(187)
Number of
shares
569,649,750
569,649,750
Year ended
30 September
2013
$m
166
5
2
(1)
(1)
171
2013
Per share
amount
cents
(32.8)
(32.8)
Profit for
the year
$m
171
171
Number of
shares
532,130,347
2,105,203
534,235,550
Per share
amount
cents
32.1
(0.1)
32.0
51
Notes to the accounts (continued)
7. Dividends
No dividends were declared by Lonmin Plc for the financial years ended 30 September 2014 and 30 September 2013.
A subsidiary of Lonmin Plc, WPL, made advance dividend payments of $37 million (R408 million) (2013 - $11 million (R110
million)) to Incwala Platinum (Proprietary) Limited (IP). IP is a substantial shareholder in the Company’s principal operating
subsidiaries. Total advance dividends made between 2009 and 2014 amount to R901 million. IP has authorised WPL to
recover these amounts by reducing future dividends that would otherwise be payable to all shareholders.
8. Other financial assets
Restricted
cash
$m
Available for
sale
$m
HDSA
receivable
$m
Total
$m
At 1 October 2013
Interest accrued
Movement in fair value
Foreign exchange differences
Impairment loss
14
1
(3)
-
17
(1)
(1)
399
18
(80)
430
19
(1)
(3)
(81)
At 30 September 2014
12
15
337
364
Restricted
cash
$m
Available
for sale
$m
HDSA
receivable
$m
Total
$m
At 1 October 2012
Interest accrued
Foreign exchange differences
Impairment loss
18
1
(5)
-
19
(2)
381
17
1
-
418
18
(4)
(2)
At 30 September 2013
14
17
399
430
2014
$m
2013
$m
Current assets
Other financial assets
337
-
Non-current assets
Other financial assets
27
430
Restricted cash deposits are in respect of rehabilitation obligations.
Available for sale financial assets include listed investments of $11 million (2013 - $13 million) held at fair value using the
market price on 30 September 2014.
The $1 million (2013 - $2 million) impairment of available for sale financial assets represents the loss in value below the
original cost price of one of our investments.
On 8 July 2010, Lonmin entered into an agreement to provide financing of £200 million to Lexshell 806 Investments
(Proprietary) Limited, a subsidiary of Shanduka Resources (Proprietary) Limited, to facilitate the acquisition, at fair value, of
50.03% of shares in Incwala Resources (Proprietary) Limited from the original HDSA shareholders. The terms of the financing
provided by Lonmin Plc to the Shanduka subsidiary include the accrual of interest on the HDSA receivable at fixed rates
based on a principal value of £200 million which is repayable after 5 years including accrued interest, or earlier at the
Shanduka subsidiary's discretion. The HDSA receivable is repayable on 8 July 2015.
52
Notes to the accounts (continued)
8. Other financial assets (continued)
The HDSA receivable is secured on shares in the HDSA borrower, Lexshell 806 Investments (Proprietary) Limited, a
subsidiary of Shanduka Resources (Proprietary) Limited. The HDSA borrower's only asset of value is its ultimate
shareholding in Incwala. As Incwala's principal assets are investments in WPL, EPL and Akanani, all subsidiaries of
Lonmin Plc, the value in use models for the Marikana and Akanani CGU's as described in note 10 are applied to
determine the value of Incwala and in turn, the value of the HDSA borrower (the security). The value of the security is
$337 million at 30 September 2014. Key assumptions to the value in use models are described in note 10. At 31 March
2014, the carrying amount of the HDSA receivable was impaired by $160 million to bring it down to its recoverable
amount. The impairment review performed at 30 September 2014 resulted in an impairment reversal of $80 million
largely as a result of the weaker Rand and improved metal price assumptions applied to the valuation models. Any
movements in the key assumptions would affect the value of the security which would lead to further impairment or
reversal of previous impairment of the receivable as follows:
Assumption
Metal prices
ZAR:USD exchange rate
Discount rates
Production
Movement in assumption
Reversal of impairment /
(further impairment) of the
receivable
+/- 5%
+/- 5%
-/+ 100 basis points
+/- 5%
$61 m / ($61 m)
$42 m / ($47 m)
$46 m / ($39 m)
$60 m / ($61 m)
53
Notes to the Accounts (continued)
9. Net (debt) / cash as defined by the Group
Cash and cash equivalents
Current borrowings
Non-current borrowings
ii
Unamortised bank fees
Net cash / (debt) as defined by the
i
Group
Cash and cash equivalents
Current borrowings
Non-current borrowings
ii
Unamortised bank fees
Net (debt) / cash as defined by the
i
Group
Transfer of
unmortised
bank fees to
other
receivables
$m
As at
1 October
2013
$m
Cash
flow
$m
Foreign
exchange and
non cash
movements
$m
201
-
(71)
(87)
(88)
-
13
-
3
143
(87)
(88)
3
201
(246)
13
3
(29)
As at
1 October
2012
$m
Cash
flow
$m
Foreign
exchange and
non cash
movements
$m
Transfer of
unmortised bank
fees to other
receivables
$m
As at
30 September
2013
$m
315
(123)
(619)
6
(127)
123
619
(3)
13
2
(5)
201
-
(421)
612
15
(5)
201
As at
30 September
2014
$m
Footnotes:
i
Net (debt) / cash as defined by the Group comprises cash and cash equivalents, bank overdrafts repayable on demand and interest bearing loans and borrowings less
unamortised bank fees, unless the unamortised bank fees relate to undrawn facilities in which case they are treated as other receivables.
ii
As at 30 September 2014 unamortised bank fees of $3 million relating to drawn facilities were offset against net debt (30 September 2013 - $5 million of unamortised
bank fees relating to undrawn facilities were included in other receivables).
54
Notes to the Accounts (continued)
10. Impairment of Non-financial assets (excluding Inventories and deferred tax)
The Group’s principal non-financial assets (excluding inventories and deferred tax assets) are property, plant and equipment,
intangibles and goodwill associated with mining and processing activities. For the purpose of assessing recoverable amount,
these assets are grouped into cash generating units (CGUs). The Group’s two key CGU’s are:
-
Marikana, which includes Western Platinum Limited (WPL) and Eastern Platinum Limited (EPL). The Marikana CGU
mines and processes substantially all of the ore produced by the Group; and
Akanani Mining (Proprietary) Limited (Akanani), an exploration and evaluation asset located on the Northern Limb of the
Bushveld Complex in South Africa.
Recoverable amount is the higher of fair value less costs to sell and value in use. At each financial reporting date, the Group
assesses whether there is any indication that those assets are impaired. If any such indication exists, the recoverable
amount of the assets is estimated in order to determine the extent of the impairment (if any).
Goodwill and intangible assets with an indefinite useful life are tested for impairment annually regardless of whether an
indication of impairment exists.
Items of property, plant and equipment that are not in use are reviewed annually for impairment on a fair value less costs to
sell basis.
If the recoverable amount of an asset (or CGU) is estimated to be less than its carrying amount, the carrying amount of the
asset (or CGU) is reduced to its recoverable amount. Any impairment is recognised immediately as an expense.
Value in use
In assessing value in use, the estimated future cash flows, based on the most up to date business forecasts or studies for
exploration and evaluation assets, are discounted to their present value using a pre-tax discount rate that reflects current
market assessments of the time value of money and the risks specific to the assets for which estimates of future cash flows
have not been adjusted.
The key assumptions contained within the business forecasts and management’s approach to determine appropriate values
are set out below:
Key Assumption
PGM prices
Production volume
Production costs
Capital expenditure requirements
Foreign currency exchange rates
Reserves and resources of the CGU
Management Approach
Projections are determined through a combination of the views of the Directors,
market estimates and forecasts and other sector information. The Platinum price is
projected to be in the range of $1,545 to $2,035 (2013: $1,600 to $2,100) per ounce
in real terms over the life of the mines. Palladium and Rhodium prices are expected to
range between $859 and $1,290 (2013: $750 to $1,200) and $1,372 and $2,531
(2013: $1,000 to $2,000) respectively per ounce in real terms over the same period.
Projections are based on the capacity and expected operational capabilities of the
mines, the grade of the ore, and the efficiencies of processing and refining operations.
Projections are based on current cost adjusted for expected cost changes as well as
giving consideration to specific issues such as the difficulty in mining particular
sections of the reef and the mining method employed.
Projections are based on the operational plan, which sets out the long-term plan of
the business and is approved by the Board.
Spot rates as at the end of the reporting period are applied.
Projections are determined through surveys performed by Competent Persons and
the views of the Directors of the Company.
Management uses past experience and assessment of future conditions, together with external sources of information in
order to assign values to the key assumptions.
55
Notes to the Accounts (continued)
10. Impairment of Non-financial assets (excluding Inventories and deferred tax) (continued)
Management has projected cash flows over the life of the relevant mining operation which is significantly greater than 5 years.
For the Marikana CGU a life of mine spanning until 2058 was applied. For the Akanani CGU the life of mine spans until 2049.
Projecting cash flows over a period longer than 5 years is in line with industry practice and is supported by the Group's history
of the resources expected to be found being proven to exist. Management does not apply a growth rate because a detailed
life of mine plan is used to forecast future production volumes.
For each CGU a risk-adjusted pre-tax discount rate is used for impairment testing. The key factors affecting the risk premium
applied are the relevant stage of the development of the asset in the CGU (extensions to existing operations having
significantly lower risk than evaluation projects for example), the level of knowledge and consistency of the ore body and
sovereign risk. The rate applied in the Marikana CGU for 2014 was 11.8% real (2013 – 11.8% real). The rate applied for the
exploration and evaluation asset in the Akanani CGU for 2014 was 16.5% nominal (2013 – 14.8% nominal).
In preparing the financial statements, management has considered whether a reasonably possible change in the key
assumptions on which management has based its determination of the recoverable amounts of the CGUs would cause the
units’ carrying amounts to exceed their recoverable amounts. For the Marikana CGU management do not believe that a
reasonably possible change in any of the key assumptions would lead to impairment. The Akanani CGU was impaired in
2012, and as such a change to any of the key assumptions would lead to further impairment or reversal of the previous
impairment. The approximate effects on impairment of the Akanani CGU of movements in three key assumptions would be as
follows:
Assumption
Metal prices
ZAR:USD exchange rate
Discount rates
Movement in assumption
Reversal of impairment/(Further
impairment)
+/-5%
+/-5%
-/+ 100 basis points
$37m/($28m)
$31m/($25m)
$73m/($51m)
Fair value less costs to sell
Fair value less costs to sell has been determined by reference to the best information available to reflect the amount that the
Group could receive for the CGU in an arm’s length transaction.
When comparable market transactions or public valuations of similar assets exist these are used as a source of evidence.
However, the Group believes that mining CGUs tend to be unique and have their value determined largely by the nature of
the underlying ore body. The fair value therefore is typically determined by calculating the value of the CGU using an
appropriate valuation methodology such as calculating the post-tax net present value using a discounted cash flow forecast
(as described in value in use).
Exploration and evaluation assets
Under IFRS 6 exploration and evaluation assets are assessed for impairment when facts and circumstances suggest that
the carrying amount of the assets may exceed their recoverable amount. When this occurs, any impairment loss is
immediately charged to the income statement.
Akanani exploration and evaluation asset
The Akanani CGU is currently at pre-feasibility study level and value in use calculations for the CGU are calculated using
cash flows derived from the results of the latest study. Given the Akanani CGU is at the exploration and evaluation stage it is
reasonably possible that the completion of that stage will result in changes to indicated and inferred reserves of PGM ounces
and a further refinement of capital and operating expenses. In addition the quantity of resources is also sensitive to the longterm metal prices. Adverse changes in reserves and resources, capital and operating expenses, and long-term metal prices
might cause the recoverable amount to fall below the carrying amount of the CGU. As mentioned above, the Akanani CGU
was impaired in 2012, and given any reasonably possible change in assumptions could have an impact on the carrying
amount, a formal impairment assessment was performed again in 2014.
56
Notes to the Accounts (continued)
10. Impairment of Non-financial assets (excluding Inventories and deferred tax) (continued)
Goodwill
The recoverable amount of goodwill, as allocated to relevant CGUs, has been tested for impairment annually, or when such
events or changes in circumstances indicate that it may be impaired.
Any impairment is recognised immediately in the income statement.
Impairment losses within a CGU are allocated first to goodwill and then to reduce the carrying amounts of the other assets in
the unit on a pro-rata basis.
Reversal of impairment
At each financial reporting date, the Group assesses whether there is any indication that a previously recognised
impairment loss has reversed. An impairment loss is reversed if there has been a change in the estimates used to
determine the recoverable amount. An impairment loss is only reversed to the extent that the asset’s carrying amount
does not exceed the carrying amount that would have been determined, net of depreciation and amortisation, had the
impairment not been made. A reversal of impairment is recognised as income immediately except for previously impaired
goodwill which is never reversed.
11. Events after the financial reporting period
The Company is required to increase HDSA ownership in its prospecting and mining ventures by 31 December 2014
from its current holding of 18% to at least 26% as required under the Mining Charter.
As flagged to shareholders in the regulatory release of July 2014, Lonmin announced that it had entered into binding
agreements with the Bapo ba Mogale Traditional Community (the Bapo) in relation to a series of transactions which will
enable Lonmin to meet its Black Economic Empowerment (BEE) targets. Lonmin also stated its intention to implement
an Employee Share Ownership Plan (ESOP) and a Community Share Ownership Trust (CSOT) (for the benefit of the
local communities on the western portion of our Marikana operations). All three transactions will collectively provide the
additional 8% equity empowerment which Lonmin requires to achieve the 26% effective BEE equity ownership target
by 31 December 2014.
Bapo Transaction
The Bapo Transaction involved a royalty for equity swap and the sale of the Bapo 7.5% stake in the Pandora Joint
Venture to a Lonmin subsidiary. This transaction provided the Bapo Community with equity participation of circa 2.25%
at Plc level, a deferred royalty payment of R20 million per annum payable by Lonplats (Eastern and Western Platinum
combined) in each of the five years following completion of the transaction, and a minimum procurement spend of
R200 million over the 18 months following the completion of the transaction. Whilst binding legal agreements were
signed in July 2014, two conditions precedent remain to be satisfied and are expected to be satisfied during November
2014 at which stage the transaction will be complete and implemented. Certain members of the Bapo Community have
indicated that they may institute legal action challenging, amongst other things, the authority of the Bapo to enter into
this transaction. These threats to institute legal action have not been acted upon at this stage.
Employee Share Ownership Plan
Whilst engagements between Lonmin and unions continue as regards the nature of the ESOP to be implemented at
Lonmin, the likelihood is that the ESOP proposed by Lonmin (which is based on a profit-sharing scheme) will be
implemented before the end of 2014. The ESOP will result in economic partnership and ownership by our employees
and sharing the responsibilities and involvement that this ownership brings. This implementation will ensure that
Lonmin receives HDSA equity accreditation of 3.8%. However, the intention is that the parties continue to engage on
the details of the ESOP even post implementation so that it is capable of future amendment should it be in the interests
of Lonmin and its employees to do so.
Community Trusts
Two separate community trusts are being established – one for the Bapo Community and other for the communities on
57
Notes to the Accounts (continued)
the western side of our operations. Each community trust will hold Lonplats shares and will be entitled to dividend
payments to be used for the upliftment of the respective communities. To the extent that the dividend payable in a
particular year is less than R5 million, each community trust will be entitled to a minimum annual payment of R5 million
escalating in line with CPI each year. The two community trusts will entitle Lonmin to an HDSA equity accreditation of
1.8%.
At this stage, the Company expects that completion of all of these arrangements should be achieved by 31 December
2014.
12. Statutory Disclosure
The financial information set out above does not constitute the Company’s statutory accounts for the years ended 30
September 2014 and 2013 but is derived from those accounts. Statutory accounts for 2013 have been delivered to the
Registrar of Companies, and those for 2014 will be delivered in due course. The auditors have reported on those
accounts; their report was (i) unqualified, (ii) did not include a reference to any matters to which the auditors drew
attention by way of emphasis without qualifying their report and (iii) did not contain a statement under Section 498 (2) or
(3) of the Companies Act 2006.
58


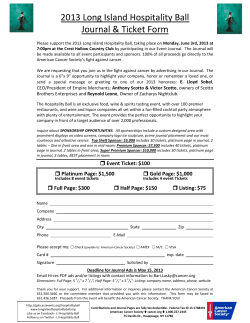


© Copyright 2026