
Soil information system: use and potentials in humid and semi-arid tropics
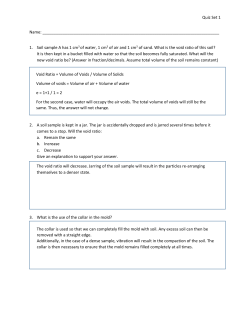
Special section: Soil information system: use and potentials in humid and semi-arid tropics T. Bhattacharyya1,*, D. Sarkar1 , S. K. Ray1, P. Chandran1 , D. K. Pal2 , D. K. Mandal1 , J. Prasad1, G. S. Sidhu3 , K. M. Nair4, A. K. Sahoo5, T. H. Das 5, R. S. Singh6 , C. Mandal1 , R. Srivastava1, T. K. Sen1, S. Chatterji1 , N. G. Patil1 , G. P. Obireddy 1, S. K. Mahapatra3 , K. S. Anil Kumar4 , K. Das5, A. K. Singh6 , S. K. Reza7 , D. Dutta5, S. Srinivas 4 , P. Tiwary1, K. Karthikeyan1 , M. V. Venugopalan8 , K. Velmourougane8 , A. Srivastava9, Mausumi Raychaudhuri10 , D. K. Kundu10, K. G. Mandal10, G. Kar10, S. L. Durge1, G. K. Kamble1 , M. S. Gaikwad1 , A. M. Nimkar1 , S. V. Bobade1, S. G. Anantwar1 , S. Patil1 , V. T. Sahu1 , K. M. Gaikwad1 , H. Bhondwe1 , S. S. Dohtre1, S. Gharami1 , S. G. Khapekar1 , A. Koyal4, Sujatha4 , B. M. N. Reddy4, P. Sreekumar4 , D. P. Dutta7 , L. Gogoi7, V. N. Parhad1 , A. S. Halder5 , R. Basu5, R. Singh6 , B. L. Jat6, D. L. Oad6, N. R. Ola6, K. Wadhai1 , M. Lokhande1 , V. T. Dongare1, A. Hukare1 , N. Bansod1 , A. Kolhe1 , J. Khuspure1 , H. Kuchankar1 , D. Balbuddhe1 , S. Sheikh1 , B. P. Sunitha4 , B. Mohanty3 , D. Hazarika7 , S. Majumdar5 , R. S. Garhwal6 , A. Sahu8 , S. Mahapatra10 , S. Puspamitra10, A. Kumar9 , N. Gautam1 , B. A. Telpande1 , A. M. Nimje1 , C. Likhar1 and S. Thakre1 1 Regional Centre, National Bureau of Soil Survey and Land Use Planning, Nagpur 440 033, India International Crops Research Institute for the Semi-Arid Tropics, Patancheru 502 324, India 3 Regional Centre, National Bureau of Soil Survey and Land Use Planning, New Delhi 110 012, India 4 Regional Centre, National Bureau of Soil Survey and Land Use Planning, Bangalore 560 024, India 5 Regional Centre, National Bureau of Soil Survey and Land Use Planning, Kolkata 700 091, India 6 Regional Centre, National Bureau of Soil Survey and Land Use Planning, Udaipur 313 001, India 7 Regional Centre, National Bureau of Soil Survey and Land Use Planning, Jorhat 785 004, India 8 Central Institute for Cotton Research, Nagpur 440 010, India 9 National Bureau of Agriculturally Important Microorganisms, Mau 275 101, India 10 Directorate of Water Management, Bhubaneswar 751 023, India 2 The articles presented in this special section emanated from the researches of consortium members of the National Agricultural Innovative Project (NAIP, Component 4) of the Indian Council of Agricultural Research (ICAR), New Delhi. These researches have helped develop a soil information system (SIS). In view of the changing scenario all over the world, the need of the hour is to get assistance from a host of researchers specialized in soils, crops, geology, geography and information technology to make proper use of the datasets. Equipped with the essential knowledge of data storage and retrieval for management recommendations, these experts should be able to address the issues of land degradation, biodiversity, food secu- rity, climate change and ultimately arrive at an appropriate agricultural land-use planning. Moreover, as the natural resource information is an essential prerequisite for monitoring and predicting global environmental change with special reference to climate and land use options, the SIS needs to be a dynamic exercise to accommodate temporal datasets, so that subsequently it should result in the evolution of the soil information technology. The database developed through this NAIP would serve as an example of the usefulness of the Consortium and the research initiative of ICAR involving experts from different fields to find out the potentials of the soils of humid and semi-arid bioclimatic systems of the country. Keywords: Agricultural land-use planning, humid and semi-arid tropics, soil information system, soil information technology, temporal datasets. collected and collated from primary and secondary sources. This organized information forms a basis for storing soil and land information for the implementation and monitoring of soil and land quality, to evaluate land for planning and suggesting appropriate land use in terms of various crops. In view of huge demands on natural resources like soil and water, constrained by environment and its protection, there is a need for better information on spatial variation and trends in the condition of soils and landscapes. It suggests the necessity to have a clear view of the status of information on various natural Soil information system T HE soil information system (SIS) provides datasets on soils, landscapes and various parameters at different scales, *For correspondence. (e-mail: [email protected]) 1550 CURRENT SCIENCE, VOL. 107, NO. 9, 10 NOVEMBER 2014 Georeferenced SIS for agricultural LUP Table 1. AESR 14.3 14.4 14.5 16.1 16.2 17.1 17.2 19.1 19.2 19.3 Distribution of humid rainfed zones in India MAR (mm) Area (m ha; of TGA) Himachal Pradesh (Part) Uttar Pradesh (Part) Uttar Pradesh (Part) 2000–2500 2000–2500 2000–2600 1.0 (0.3) 0.5 (0.1) 0.9 (0.3) West Bengal (Part) 2600–3000 0.3 (0.09) Sikkim, West Bengal (Part) Arunachal Pradesh, Meghalaya, Assam, Nagaland Manipur, Tripura, Mizoram 2500 2500 1.1 (0.3) 4.1 (1.3) 3000 5.5 (1.7) Maharashtra, Gujarat, UTs of Daman and Diu, and Dadar and Nagar Haveli Maharashtra, Karnataka, Goa, Kerala 2000 2.2 (0.7) 2000–3000 6.9 (2.1) 3000 2.0 (0.6) Description Location (state) Himalayas, warm humid to perhumid Kumaon, warm humid to perhumid Foothills of Kumaon Himalayas, sub-humid warm humid, perhumid Foothills of Eastern Himalayas (Bhutan Hills), warm to hot, perhumid terrain region Darjiling and Sikkim Himalayas, warm, perhumid Meghalaya Plateau and Nagaland Hills, warm to hot, moist humid to perhumid Purvachal (Eastern Range), warm to hot, perhumid ecosubregion North Sahyadris and Konkan coast, hot, humid Central and South Sahyadris, hot moist sub-humid to humid Koumaon, Karnataka coastal plain, hot humid to perhumid Kerala, Karnataka, Maharashtra, Goa MAR, Mean annual rainfall. Table 2. Old AESR (LGP, in days) Revised AESR Area (m ha) 13.1 (180–210) 13.1 a 6.12 Distribution of humid irrigated areas of the Indo-Gangetic Plains Criteria for modificationa Soils MAR (mm) Bioclimateb 13.1 b 2.82 Imperfectly to poorly drained, loamy (at places clay) soils, pockets of moderate flooding and slight salinity Well-drained, loamy soils 13.2 (180–210) 13.2 1.33 Well-drained, loamy soils No changes were made 1400–1500 15.1 (210–240) 15.1 a 4.32 Soils and drainage 1300–1600 SHm–H 15.1 b 0.44 Imperfectly to poorly drained, loamy/clay soils with moderate flooding Poorly drained, loamy soils with severe flooding 18.5 a 0.83 Soils and drainage 1800–2100 H 18.5 b 0.36 Poorly drained, clay loamy soils, severe loamy, severe flooding, salinity Imperfectly to poorly drained loamy/clay soils with moderate flooding and salinity 15.3 a 0.57 Soils and drainage 2000–3200 H–PH 15.3 b 0.79 Poorly to imperfectly drained soils with occasional flooding Well-drained with patches of poorly drained soils 18.5 (240–270) 15.3 (270–300) a Soils and drainage 1200–1500 SHm SHm LGP, Length of growing period. Criteria as soils indicate various soil properties, viz. colour, texture, depth, soil drainage, LGP, etc. SHm, Sub-humid moist; H, Humid; PH, Perhumid. b resources, with special reference to soils. Such information would not only store the datasets for prosperity, but will also improve our understanding of biophysical processes in terms of cause–effect relationship in the pedo-environment. Information on soils and land resources is thus fundamental, where the SIS plays a pivotal role1,2. ala and West Bengal) (Table 1). The mean annual rainfall (MAR) ranges from 2000 to 3000 mm and in spite of such high rainfall, these areas cannot hold enough moisture in the soils to support rabi crops, due to terrain conditions effecting huge run-off loss. Such areas, therefore, also require conservation agriculture for which the SIS plays an important role in determining the agricultural prosperity of these areas. Humid rainfed zones – defined Humid irrigated zones In India, 24.5 m ha is humid to perhumid rainfed area covering most of the northeastern region (including Sikkim) and other states (Uttarakhand, Himachal Pradesh and parts of Maharashtra, Gujarat, Karnataka, Goa, KerCURRENT SCIENCE, VOL. 107, NO. 9, 10 NOVEMBER 2014 Many areas in the lower Indo-Gangetic Plains (IGP) experience sufficient rainfall to be classified as humid zones. Table 2 shows these areas which are being studied, 1551 Special section: as illustrated in the following sections. These areas are under intensive agricultural land use and often support more than two crops in a year with canal/well irrigation. This agricultural practice has caused secondary salinization of soils with soluble carbonate and bicarbonate ions. Such soils have become saline–sodic in nature3. Semi-arid tropics defined Despite increase in food production due to modern agricultural management, many parts of the world continue to face food insecurity. About 60% of the world’s population facing food insecurity resides in South Asia and subSaharan Africa. Most of these areas are rainfed and there are several challenges in terms of area, extent and future prospects to improve the livelihood. Rainfed areas vary from region to region, and yet these are the zones where food is produced mostly for the poor communities. Rainfed agriculture in the semi-arid tropics (SAT) area is fragile, in view of spatial and temporal variation of rainfall. The total rainfall in these areas is received within a short span of three to five months4. Besides, as the rainfall is of high intensity and of short duration, huge amount of soil erosion and often flash flooding occurs in SAT. It has been established that SAT conditions induce formation of pedogenic calcium carbonate (PC) with concomitant subsoil sodicity, making the soil extremely impervious to air and rainwater, which in turn leads to flooding5–7. It is reported that there is an increase in the frequency of extreme events like drought, floods and hurricanes due to climate change. Many scenarios indicate loss of rainfed production areas (10–20%), which expectedly will affect nearly 1.2 billion people by 2080 (ref. 8). Climate change has been reported to adversely affect the water availability and food production. As a consequence land degradation, poverty and food insecurity are expected to grow to menacing proportions9,10. Hunger, poverty and vulnerability of livelihood in response to natural and other disasters will continue to be extremely important factors in the rural tropical areas of Africa and Asia. These challenges are further influenced by climatic aberration, population growth, degrading natural resources, poverty and other health-related problems11. Majority of the poor in developing countries live in rural areas. Their livelihood depends on agriculture and over-exploitation of the natural resource base, making the situation even worse. The rainfed agriculture is also associated with disproportionate food distribution between men and women 12. It has been reported that every 1% increase in agricultural yield translates to a 0.6–1.2% decrease in the population of the absolute poor13. On an average, sub-Saharan (Africa) agriculture constitutes 35% of the Gross Domestic Product (GDP) and employs 70% of the total population and more than 95% of the agriculture area is in rainfed region 10. 1552 In Africa and South Asia, agriculture will continue to remain the backbone of the economy in future. Most of the poor people are farmers and landless labourers. Therefore, strategies have to focus on generating more income to reduce poverty and its related problems. Substantial gains in land, water and labour productivity along with the careful natural resource management are essential to combat soil degradation, maintain sustainable crop production and ultimately to bring better lifestyle to the rural poor. Out of 142 m ha of the net sown area in India, irrigated (rainfed) agriculture is practised in over 90 m ha. Nearly 67 m ha of rainfed area falls in the sector with mean annual precipitation in the 500–1500 mm range. Productivity and stability in rainfed areas are low. Although rainfed agriculture occupies about 63% of the total cropped area in India, it contributes only 45% of the country’s agricultural production. Major rainfed crops grown in India comprise coarse grains, particularly pearl millet and sorghum, pulses, oilseeds and cotton. Not only the yields of these crops are low (average yield of coarse grains being just about 880 kg ha–1 ), but also the technology transfer gap is wide. The region is characterized by erratic and often low rainfall, low soil fertility and harsh temperature regime14. Later estimates showed that the area under dry land agriculture in India is 100–105 m ha, of which Alfisols, Vertisols and Entisols occupy 30%, 35% and 10%, respectively15 ; besides some areas are under Inceptisols. In India, rainfed areas include part of sub-humid dry (SHd), semi-arid moist (SAm), semi-arid dry (SAd) and arid bioclimatic systems (Table 3). Recent studies indicate that nearly 155.8 m ha of the country requires priority for better natural resources management in the form of organic carbon sequestration to bring back the soils to normal state16. Earlier, arid and semi-arid areas were designated as dry lands17. Our recent observation indicates that there are areas under sub-humid bioclimatic systems which also experience drought and should therefore be included in the dry tracts of the country16,18. In India, out of 60 agro-ecological sub-regions (AESRs)19, 29 represent relatively dry tracts, showing arid, semi-arid, sub-humid bioclimates and cover an area of 168.1 m ha (nearly 56% total geographical area (TGA) of the country) (Table 3). In the dry ecosystem, climatic variability [in terms of MAR and mean annual temperature (MAT)] results in the regressive pedogenic processes6,7,20 which modify the physical, chemical and biological properties of soils to affect crop performance. The water deficiency in the soils is unfavourable for growth and development of rainfed crops and often leads to low crop yield21. The effective cropping season is restricted, both by the quantity and distribution of rainfall, thereby, setting the limits on the choice of crops, cultivars and cropping systems. Besides, knowledge on the soils and their modifiers (zeolites, CURRENT SCIENCE, VOL. 107, NO. 9, 10 NOVEMBER 2014 Georeferenced SIS for agricultural LUP Table 3. AESR no. Areas showing AESRs in rainfed semi-arid tropics of India Description Location (state) Area (m ha; % of TGA) 2.1 2.3 3.1 Marusthali plains, hot hyper-arid, very low AWC, LGP < 60 days Kachch Peninsula, hot hyper-arid Karnataka Plateau, hot arid with moderately well-drained, clayey mixed black and red soils, LGP 90–120 days Punjab, Rajasthan Punjab, Haryana Karnataka 3.2 Karnataka Plateau, hot arid with moderately well-drained, loamy mixed red soils, LGP < 90 days Karnataka, Andhra Pradesh 4.1 North Punjab Plain, Ganga–Yamuna Doab, hot semi-arid, medium Moga, Faridkot and Ferozepur, AWC, LGP 90–120 days Punjab, Haryana, Uttar Pradesh 11.8 (3.5) 4.2 North Gujarat Plain (inclusive of Aravalli range and Eastern Rajasthan Uplands) hot, dry semi-arid eco-subregion Gujarat, Rajasthan 7.6 (2.3) 4.3 Ganga–Yamuna Doab, Rohilkhand and Avadh Plain, hot moist semi-arid, medium to high AWC, LGP 120–150 days Uttar Pradesh, Madhya Pradesh 6.9 (2.0) 4.4 Madhya Bharat Pathar and Bundelkhand Uplands, hot, moist semi-arid eco-subregion Uttar Pradesh, Madhya Pradesh 5.9 (1.7) 5.1 5.2 Central Kathiwar Peninsula, hot, dry semi-arid eco-subregion Madhya Bharat Plateau, Western Malwa Plateau, Eastern Gujarat Plain, Vindhyan and Satpura range and Narmada valley, hot, mosit semi-arid ecoregion Gujarat Madhya Pradesh 2.7 (0.8) 14.0 (4.3) 5.3 6.1 Coastal Kathiwar Peninsula, hot, moist semi-arid eco-subregion Southwestern Maharashtra and North Karnatak Plateau, hot, dry, semi-arid ecosubregion Gujarat Maharashtra, Karnataka 0.9 (0.3) 7.6 (2.3) 6.2 Central and westrn Maharashtra Plateau and North Karnataka Plateau and North Western Telangana Plateau, hot, moist semi-arid ecoregion Maharashtra, Andhra Pradesh 12.6 (3.8) 6.3 6.4 Eastern Maharashtra Plateau, hot, moist semi-arid eco-subregion North Sahyadris and Western Karnataka Plateau, hot, dry sub-humid eco-subregion Maharashtra Maharashtra, Karnataka 5.4 (1.6) 5.4 (1.6) 7.1 South Telangana Plateau (Rayalseema) and Eastern Ghats, hot, dry semi-arid eco-subregion Andhra Pradesh 3.9 (1.2) 7.2 7.3 8.1 North Telangana Plateau, hot, moist semi-arid eco-subregion Eastern Ghat (South), hot, moist semi-arid/dry-subhumid eco-subregion Tamil Nadu Uplands and Leeward Flanks of South Sahyadris, hot, dry semi-arid eco-subregion Andhra Pradesh Andhra Pradesh Tamil Nadu 9.2 (2.8) 3.4 (1.0) 3.7 (1.1) 8.2 8.3 9.1 Central Karnataka Plateau, hot, moist semi-arid eco-subregion Tamil Nadu Uplands and Plains, hot, moist semi-arid eco-subregion Punjab and Rohilkhand Plains, hot/dry moist sub-humid transition, medium AWC and LGP 120–150 days 6.5 (2.0) 8.9 (2.7) 3.9 (1.2) 9.2 Rohilkhand, Avadh and south Bihar Plains, hot dry sub-humid, medium to high AWC and LGP 150–180 days Karnataka Andhra Pradesh, Tamil Nadu Jammu & Kashmir, Himachal Pradesh, Punjab, Haryana, Uttar Pradesh Uttar Pradesh, Bihar 10.1 Malwa Plateau, Vindhyan Scarpland and Narmada valley, hot dry subhumid eco-subregion Madhya Pradesh 8.1 (2.5) 10.2 10.3 Satpura and Eastern Maharashtra Plateau, hot dry sub-humid eco-subregion Vindhyan Scarpland and Bagelkhand Plateau, hot, dry sub-humid ecosubregion Madhya Pradesh, Maharashtra Madhya Pradesh 2.8 (0.8) 5.8 (1.8) 10.4 Satpura range and Wainganga Valley, hot, moist sub-humid eco-subregion Madhya Pradesh, Maharashtra 5.6 (1.7) gypsum, calcium carbonate, palygorskite) for each AESR is necessary, because the presence of modifiers immensely affects the soil–water relations5,7,22–26, especially in post-rainy season, which in turn influences the crops that are grown on conserved rainwater. CURRENT SCIENCE, VOL. 107, NO. 9, 10 NOVEMBER 2014 12.3 (3.7) 2.79 (0.9) 2.11 8.3 (2.5) Role of soils and SIS in humid areas of India As shown in Table 1, most of the northeastern region and the Himalaya experience heavy to very heavy rainfall. These areas are generally under monocrop and agriculture 1553 Special section: is practised under rainfed conditions. The lower IGP is humid, but practices irrigated agriculture. Therefore, humid areas under both rainfed and irrigated ecosystems are important and require detailed information on soils. SIS in humid rainfed ecosystems Case studies of Tripura: Soils of Tripura and their usefulness indicate the application of SIS in soil degradation, conservation measures, suitability of different land uses, crop suitability and soil health2. The SIS of Tripura integrates outputs from various sources and is useful for monitoring natural resources, modelling soil physiographic relation, finding crop suitability, modelling of soil carbon and crop performance to comprehend the soil health27–29. All this information in combination, provides a meaningful tool to address various issues detailed in Figure 1. Case studies of the lower IGP: The AESRs 13.1, 13.2, 15.1, 15.3 and 18.5 are characterized by imperfectly to poorly drained soils due to occasional to severe flooding in the low-lying areas. These AESRs (except 13.2) were revisited to modify their boundaries, as shown in Table 2. Since most of the areas is under irrigation, the concept of length of growing period (LGP), does not hold good for these areas30,31. The physiography, soils and their parameters were utilized to revise the AESR boundaries. For this purpose, the most important source was soil resource map of West Bengal, Bihar and Uttar Pradesh at 1 : 250,000 scale32–34. The hierarchy for the entire IGP is shown in Table 4. Soil information is documented from different sources and at various scales. The earlier attempts to collect datasets of the IGP were through GEFSOC project 28,35. The hierarchy of land units and description of legends at various scales of soil, and land use survey efforts made so far, are shown in Table 4. The SIS IGP is routed through level 1 starting from 1 : 7 million to the revised soil map of IGP in 1 : 1 million through this project. The level-2 information reported earlier36 will be Figure 1. Schematic diagram showing steps to arrive at the threshold values of land quality parameters. 1554 revised after the land resource inventory of the IGP is developed at 1 : 10,000 scale. Level-1 SIS distinguishes major physiography, agroecological regions (AERs) and AESRs in the IGP. It provides information on selected climatic parameters such as temperature and rainfall and a few soil properties. The climate and soil data also estimate the length of growing period in each region to select crops26. Role of soil and SIS in SAT The black soils in the central, western and southern parts of the country are generally rainfed and represent SAT. Besides, the upper and part of middle IGP also represent SAT, but are mostly irrigated. We present SIS of these two regions representing irrigated and rainfed dry areas in the following. Case studies from upper and middle IGP (irrigated dry areas) The AESRs 2.1, 2.3, 4.1, 4.3, 9.1 and 9.2 are characterized by relatively low rainfall and are designated as relatively dry compared to the humid part of the IGP (Table 5). SIS generated through the NAIP project was used to revise the AESR boundaries. The soil resource maps of Uttar Pradesh, Punjab, Haryana and Rajasthan at 1 : 250,000 scale were used to generate SIS of these regions34,37–39. A comparative status shows the datasets in the present effort for generating IGP soil map (Table 6). The hierarchy of land units and description of legends at various scales are shown in Table 4. Details of the soil information are given elsewhere40,41. Case studies from the black soil region (BSR) Black soils are common in SAT in India, although their presence is reported in the humid and arid bioclimatic systems also16,21. These soils are spatially associated with red soils and thus form a major soil group of India, occurring on various parent materials and in different climate zones. They have been reported in various physiographic positions as, for example, red soil on the hills and black soils in the valleys42. Interestingly, these soils have also been reported in juxtaposition in Tamil Nadu, Maharashtra and Andhra Pradesh under similar topographic conditions43–45. Reports indicate presence of Ca-rich zeolites in basaltic landscape7,22,23,46,47. Zeolites have the ability to hydrate and dehydrate reversibly and to exchange some of their constituent cations to influence the pedochemical environment during the formation of soils. Significance of these zeolites has been realized in the formation of the soils and also in controlling soil moisture retention48. Table 7 details the spatial hierarchy in BSR. Earlier CURRENT SCIENCE, VOL. 107, NO. 9, 10 NOVEMBER 2014 Georeferenced SIS for agricultural LUP Table 4. Level Land unit Available soil and land information system – spatial hierarchy in IGP Descriptive legends Soil unit Description of map unit+ Map scale (million) Source/comments 1 2 Country State Order + Suborder + Suborders Soil suborders Inceptisols, Entisols 1 : 25 1:7 NRCS63 NBSS&LUP64 (map printed by NBSS&LUP, Nagpur) 3 State Old soil classification Traditional soil names Red and yellow soils, red loamy soils, mixed red and black soils 1:4 Govinda Rajan65 4 State (region) – Agro-ecological region (AER) Bengal plains, hot sub-humid to humid LGP 210–300 days (AER 15) 1 : 4.4 Sehgal et al.66 (map printed by NBSS&LUP, Nagpur) 5 State (sub-region) – Agro-ecological sub-region Bengal basin and north Bihar plains, hot moist sub-humid with medium to high AWC ++ and LGP (210–300 days) (AER 15.1) 1 : 4.4 Velayutham et al.19 (map printed by NBSS&LUP, Nagpur); Govinda Rajan65 6 Country Soil great group Soil great group association Total 1649 units in the country – the IGP had 74 no. of units 1:1 NBSS&LUP67 (printed by NBSS&LUP) 7. Sub-country (the IGP) Soil sub-group+ Soil sub-group association Total 74 no. of units for the IGP 1 : 1 (based on 1 : 250,000 m scale information) Bhattacharyya et al.5,28 , Batjes et al.35 8. Sub-country level (the IGP) Soil sub-group+ Soil sub-group association Total 122 no. of units for the IGP 1.1 GeoSIS, NAIP soil map of the IGP, India 68 (draft prepared) + USDA Soil Taxonomy69 ; ++ AWC, Available water holding capacity. Source: Revised from Bhattacharyya and Mandal 36 . Table 5. Old AESR (LGP, in days) Agro-ecological sub-regions in the semi-arid irrigated areas in IGP Revised AESR Area (m ha) 2.1 (<60) 2.3 (60–90) – 2.3 a 2.3 b 0.13 2.49 0.16 Well to excessively drained sandy soil Well-drained to excessively drained sandy soil Highly calcareous sandy soils 4.1 (90–120) 4.1 a 4.08 4.1 b 2.83 4.1 c 2.54 4.3 (120–150) 4.3 a 4.3 b 9.1 (120–150) 9.2 (150–180) MAR (mm) Bioclimatec b Soils and drainage 100–300 300–450 Arid Arid Well-drained with pockets of imperfectly drained soils Well-drained loamy soils with salinity and sodicity Well-drained sandy soils Soils/drainage/salinity/ sodicity 600–800 SAd 0.79 6.32 Dominantly black soils, well-drained Well-drained loamy soils, at places imperfectly drained Soils 700–900 SAd 9.1 a 9.1 b 2.10 0.55 Soils and drainage 700–1000 SHd 9.1 c 1.66 Well-drained, loamy soils Loamy, well-drained with pockets of imperfectly drained soils Sandy, well-drained soils 9.2 a 9.2 b 9.2 c 15.3 b 2.09 4.17 2.64 0.79 Well-drained, loamy, alluvial soils Well-to-imperfectly drained, loamy alluvial soils Imperfectly to poorly drained, alluvial soils Well-drained with patches of poorly drained soils Soils and drainage 1000–1200 SHd Soils Criteria for modificationa a Criteria as soils indicate various soil properties, viz. colour, texture, depth, soil drainage, LGP, etc. For these AESRs boundaries of the polygons were revised keeping in view the administrative boundaries and at places physiography. Lack of enough soil data these AESRs were not further subdivided. c SAd, Semi-arid dry; SHd, Sub-humid dry. b CURRENT SCIENCE, VOL. 107, NO. 9, 10 NOVEMBER 2014 1555 Special section: Table 6. Comparison of two levels of datasets generated to produce soil map IGP Particulars IGP map (1988)* Map scale (m) Total area (m ha) No. of soil associations No. of polygons Soil classification Mapping legend No. of benchmark spots Frequency of observation (per m ha) Soils IGP map (2014)** 1.1 43.7 74 – Soil subgroup Soil depth Slope Texture Erosion Salinity Sodicity Flooding 40 0.9 Entisols Alfisols Inceptisols 1 : 1 (based on 1 : 250,000 scale input) 52.01 122 349 Soil subgroup Soil depth Slope Texture Erosion Salinity Sodicity Flooding 417 8.1 Entisols Alfisols Inceptisols Vertisols *Bhattacharyya et al.5,28 ; Batjes et al.35 . **NBSS&LUP68 . Table 7. Level Land unit Available soil and land information system – spatial hierarchy in the black soil regions Soil unit Descriptive legends 1 Country Order+ Suborders 2 State Suborder+ Soil suborders 3 State Old soil classification Traditional soil names 4 State (region) – 5 State (subregion) – 6 Description of map unit+ Map scale (million) Source/ comments 1 : 25 NRCS63 1:7 NBSS&LUP64 (map printed by NBSS&LUP, Nagpur) Red and yellow soils, red loamy soils, mixed red and black soils 1:4 Govinda Rajan65 Agro-ecological region Bengal plains, hot subhumid to humid LGP 210–300 days (AER 15) 1 : 4.4 Sehgal et al.66 (map printed by NBSS&LUP, Nagpur) Agro-ecological sub-region Bengal basin and north Bihar plains, hot moist sub-humid with medium to high AWC and LGP (210–300 days) (AER 15.1) 1 : 4.4 Velayutham et al.19 (map printed by NBSS&LUP, Nagpur); Govinda Rajan65 Country Soil great group+ Soil great group association Total 1649 units in the country 1:1 NBSS&LUP67 (printed by NBSS&LUP) 7 Sub-country (BSR) Soil great group+ Soil great group association Total 53 no. of units for the BSR 1:1 (based on 1 : 250,000 m scale information) Sehgal et al.70 8. Sub-country (BSR) Soil great group+ Total 50 no. of units for the BSR 1:1 (based on 1 : 1 m scale information) NBSS&LUP Nagpur; BSR, India71 (draft prepared) + Soil great group association Inceptisols, Entisols USDA Soil taxonomy43 ; Source: Revised from Bhattacharyya and Mandal36 . 1556 CURRENT SCIENCE, VOL. 107, NO. 9, 10 NOVEMBER 2014 Georeferenced SIS for agricultural LUP Table 8. Comparison of two levels of datasets generated to develop the revised BSR map Particulars BSR map (1988)* BSR map (2014)** Map scale Total area (m ha) No. of soil associations No. of polygons Soil classification Mapping legend 1 : 4 million (based on 1 : 1 m map) 70.0 50 – Great group association Soil depth Slope No. of benchmark spots Frequency of observation Soils Vertisols Inceptisols Entisols Alfisols (others) 33 0.47 per m ha 1 : 1 (based on 1 : 250,000 scale) 76.4 53 282 Great group association Soil depth Texture Soil erosion Flooding Salinity Sodicity Drainage Slope 425 5.6 per m ha 26.3 28.2 14.2 1.3 27.4 39.8 4.3 4.9 *Sehgal et al.70 ; **NBSS&LUP71 . attempts to prepare the black soil map in India have been revised taking into account the occurrence of black soils in non-traditional areas49 through this project31. A relative comparison of these two efforts is shown in Table 8. In BSR, the soils were selected from the established benchmark (BM) sites, the reason being that each soil would cover an extensive area in the landscape and monitoring these BM soils would be easy. In order to make meaningful comparison, the soils were chosen such that their substrate quality remains similar. Therefore, the study area and the soil series were selected mostly from the cultivated fields represented by Vertisols and their verticinter grades. Revised estimation indicates that black soils occupy nearly 76.4 m ha mostly in Maharashtra, Madhya Pradesh, Gujarat31 and other states. Reports also show the presence of Vertisol in the IGP50. Black soils are also reported from Kerala, Jammu and Kashmir and Andaman and Nicobar Islands49. Discussion SIS stored in SOTER framework can be used for monitoring the quality of soil and land resources by different stakeholders to address the issues of environment with special reference to climate change and global warming28,35,51, refining AESR boundaries to focus on agriculture land-use planning31,48,52. Revised agro-ecological map is a useful tool for crop planning31. SIS has been successfully used to evaluate potentiality of land53 using principal component analysis to arrive at minimum datasets and threshold values of the land quality parameters (Figure 1). Crop yield of cotton and soybean in the BSR CURRENT SCIENCE, VOL. 107, NO. 9, 10 NOVEMBER 2014 and rice and wheat in the IGP have been simulated using InfoCrop model54 (Figure 2). Georeferenced soil information system (GeoSIS) is structured for monitoring soil and land quality and to assess the impact of land-use changes (Figure 3). The baseline data generated through this project40,41 permits to use changes in soil quality parameters in terms of soil organic carbon (SOC), soil inorganic carbon (SIC), bulk density (BD) and saturated hydraulic conductivity (sHC). It is realized that a few selected dynamic properties of soil such as SOC, SIC, BD and sHC change depending on the land use system and time. There is an increasing concern about the declining soil productivity and impoverishment of soil nutrients caused by intensive agriculture. Earlier, the National Bureau of Soil Survey and Land Use Planning (Indian Council of Agricultural Research), through organized research initiative, developed two time series datasets for 1980 and 2005 to assess changes in the levels of carbon in soils in IGP and BSR55 (Table 9). Soil carbon stock depends largely on the areal extent besides other factors such as carbon content, depth and BD of the soil. Even with a small amount of SOC (0.2–0.3%), the arid and semi-arid tracts show high SOC stock due to large area of these two bioclimatic systems18. To avoid such illusion, we express the changes in carbon stock per unit area (Table 9), to interpret the influence of soil and/or management parameter for sequestration of both SOC and SIC in the soil55. In the semi-arid bioclimatic system of the IGP, SOC stock is increased with Zarifa Viran as an exception; in sub-humid bioclimate a marginal increase indicates attainment of a near quasi equilibrium (QE) of SOC 55. In humid climate a marginal decrease in SOC stock during 2010 over 1980, also 1557 Special section: Table 9. Three different time series data to show the changes in soil organic (SOC) and soil inorganic (SIC) carbon stock in soils of the IGP and BSR SOC stock (Tg/lakh ha) Bioclimatic systems Soil series Indo-Gangetic Plains Semi-arid Zarifa Viran Fatehpur Sakit Sub-humid Humid Haldi Madhpur Black Soil Regions Arid Sokhda Semi-arid Teligi SIC stock (Tg/lakh ha) 1980* 2005* 2010 SOC change over 1980 (%) 4.13 1.11 4.05 5.38 5.50 8.55 3.24 4.44 8.10 –22 300 100 22.36 0 51.03 16.98 58.30 5.37 15.69 3.33 5.18 –30 – –90 8.55 3.99 6.28 4.97 9.48 3.67 11 –8 0 4.03 2.84 15.98 4.19 4.13 – 3 11.19 7.41 9.20 15.20 9.24 13.31 –17 80 23.63 21.01 60.92 29.60 53.13 28.45 125 35 1980* 2005* 2010 SIC change over 1980 (%) *Bhattacharyya et al.55 . Figure 2. Figure 3. 1558 Simulation of yields of different crops grown in the IGP and BSR using the InfoCrop model. Schematic diagram showing steps for assessment of impact of land use change in IGP and BSR. CURRENT SCIENCE, VOL. 107, NO. 9, 10 NOVEMBER 2014 Georeferenced SIS for agricultural LUP Table 10. Three different time series data to show the changes in bulk density (BD) and saturated hydraulic conductivity (sHC) in soils of IGP and BSR (0–150 cm) BD (Mg m–3 ) Bioclimatic systems Soil series Indo-Gangetic Plains Semi-arid Zarifa Viran Fatehpur Sakit Sub-humid Humid Haldi Madhpur Black Soil Regions Arid Sokhda Semi-arid Teligi sHC (cm h–1 ) 1980 2005 2010 sHC change over 2005 (%) 0 –13 –19 0.001** 1.497 0.001** 2.030 2.190 0.230 0.390 2.100 0.020 –81 –4 –91 1.47 1.53 –8 –18 0.001** 0.001** 3.770 1.550 0.680 0.080 –82 –95 1.54 1.74 –13 22 0.001** 0.001** 2.58 0.55 2.39 0.07 –7 –87 1980 2005 2010 1.50 1.40 1.62* 1.66 1.71 1.70 1.66 1.48 1.38 1.51 1.73 1.60 1.86 1.40 1.40 1.76 1.43 BD change at 2010 over 2005 (%) *Derived from PTF52 . **Very high ESP values produce (–ve) values of sHC when PTFs are used 52 so we presented a value of 0.001. Figure 4. Schematic diagram showing an overview of the georeferenced soil information system (GeoSIS). suggests a quasi equilibrium stage of SOC, after the lapse of 30 years. In BSR, a marginal decrease in arid and 80% increase in semi-arid bioclimatic system is observed. It is interesting to note that when we compare SOC stock in 2005 and 2010 at seven BM spots, we find, most of them show a tendency towards quasi equilibrium of SOC, with few exceptions. It has been earlier reported that in agriCURRENT SCIENCE, VOL. 107, NO. 9, 10 NOVEMBER 2014 culture systems the SOC values tend to attain QE over a period of 30–50 years56,57. The SIC stock generally shows a decreasing trend in the IGP, with Madhpur as an exception. The increasing trend in SIC stock in the BSR is a warning signal for potential soil degradation in spite in increase in SOC stock (Table 9) 36. Table 10 shows changes in BD and sHC in seven BM spots in the IGP 1559 Special section: Figure 5. Schematic diagram showing soil information system and its usefulness for natural resources management. Figure 6. Schematic diagram showing web-based georeferenced soil information system and its structural framework. and BSR. Compared to 2005, BD shows a lower value in most of the soils, with Zarifa Viran and Teligi as exceptions. It may be mentioned that increase in BD with depth below the surface layer has been reported from the IGP as well as in BSR58,59. Table 10 shows the changes of weighted mean averages of BD and sHC. Interestingly, 1560 soil drainage is affected in all the soils, within IGP soils being the worst affected. Sidhu et al. 59 indicated various factors which control increase in BD value. Decrease in sHC values indicates that these soils are gradually becoming less porous and require immediate attention. An overview of GeoSIS is shown in Figure 4, which shows interface between GeoSIS, land evaluation and threshold limits of the land quality index that ultimately culminates in a SIS structure to store various reports, tools and utilities (Figure 5). The present SIS is characterized by the introduction of soil microbiological information60,61. An effort has been made through this project to study depth-wise distribution and factors influencing the urease, dehydrogenase, microbial biomass carbon and microbial activity and their diversity in the soils of the selected BM spots representing the IGP and BSR. The information generated on the soil biological properties will improve Indian SIS, which will be useful for the assessment of soil/land quality and changes in the soil quality indicators for sustainable land resource management. The major deliverables of the present project are GeoSIS through SOTER GIS, land quality indices, threshold values of the datasets important for soil and land quality, revised maps of IGP and BSR soils and IGP and BSR AESR maps (Table 11). CURRENT SCIENCE, VOL. 107, NO. 9, 10 NOVEMBER 2014 Georeferenced SIS for agricultural LUP Table 11. Deliverables and innovations through soil information system in IGP and BSR Deliverables Innovations Georeferenced Soil Information System (GeoSIS) GeoSIS of ~ 900 soil profiles having information on physical, chemical and microbiological properties of soil at three depths (0–30, 0–50 and 0–100 cm) in SOTER-GISa. Datasets on land quality indicators and land quality indices Included microbiological and hydrological properties to develop soil quality indicesb. Improved methodology to estimate land quality indices Modified land evaluation method is used to identify the land soil quality parametersc. Yield gap in dominant cropping system For yield-gap analysis, InfoCrop model is being used. The soil information as input parameter is arranged in two formats. Also, InfoCrop model is being improvized to include some important soil informationd. Threshold values and classes of land quality indices Threshold values of sHC have been fixed for soils of the BSR in computation of plant available water content e. Pedotransfer functions for saturated hydraulic conductivity, bulk density and water retention Pedotransfer functions were developed considering ESP, ECP and EMP, which are the important parameters influencing sHC and water retention–release behaviour f . New set of length of growing period values Antecedent moisture content is being considered for LGP calculationg. Improved boundaries of agro-ecological sub-regions map Based on LGP, total 17 AESRs were modified to 29 in the IGP and 27 modified to 45 in BSR h. a Chandran et al.72 ; bVelmourougane et al.60 ; cRay et al.73 ; dVenugopalan et al.54 ; e,g,hMandal et al.31 ; fTiwary et al.52 . Figure 7. Graphic user interface of web-GeoSIS. a, Home page; b, GeoSIS–IGP; c, GeoSIS–BSR. CURRENT SCIENCE, VOL. 107, NO. 9, 10 NOVEMBER 2014 1561 Special section: Way forward Web publication GeoSIS developed for the IGP and BSR is presented, discussed and disseminated through different means in the form of hard copy publications62 (www.geosis-naipnbsslup.org). Such publications have their own value as well as limitations. Since most of these datasets are available as hard copy (maps), the stakeholders, users and readers are unable to understand these maps and extract the auxiliary information, viz. soil, landscape, land use and climatic parameters from them. This necessitated to adopt more user-friendly approach to publish the information that could be interactive, more visible and easy to understand. The advent of modern information and web-based technology has made it easier to bring out web-based publication of georeferenced soil and other information. The project output is being showcased in the website of NAIP as web GeoSIS (Figure 6). Through web-based GeoSIS, the datasets – information on soil, land use, crop, climate, physiography, SOTER, etc. along with the associated maps can be accessed from any webenabled equipment (Figure 7). Maps on the web provide a new paradigm to access and use soil information by the stakeholders at any time and from anywhere. This will enable the users to access information/datasets for various purposes, including land resources inventory and management. Query-based information (e.g. soils of IGP with BD more than 1.6) on soil, land use, etc. along with their spatial distribution can also be accessed for a specific purpose. Web GeoSIS can enable collaboration between different agencies, facilitating better communication and can save time to stop repetition of research activities. This exercise can open a new vista for participatory research programmers using common people and other organizations, and can therefore provide scope for revising the database for monitoring soil health and changing land use pattern. 1. ASRIS, Australian Soil Resource Information, Technical specifications Version 1.5, 2005; www.asris.esiro.au 2. Bhattacharyya, T., Sarkar, D., Pal, D. K., Mandal, C., Baruah, U., Telpande, B. and Vaidaya, P. H., Soil information system for resource management – Tripura as a case study. Curr. Sci., 2010, 99, 1208–1217. 3. Pal, D. K., Bhattacharyya, T., Srivastava, P., Chandran, P. and Ray, S. K., Soils of the Indo-Gangetic Plains: their historical perspective and management. Curr. Sci., 2009, 9, 1193–1201. 4. Wani, S. P. et al., Combating drought through integrated watershed management for sustainable dryland agriculture. In Regional Workshop on Agricultural Drought Monitoring and Assessment using Space Technology, National Remote Sensing Agency, Hyderabad, 4 May 2004, pp. 39–48. 5. Bhattacharyya, T., Pal, D. K., Chandran, P., Mandal, C., Ray, S. K., Gupta, R. K. and Gajbhiye, K. S., Managing soil carbon stocks in the Indo-Gangetic Plains, India. In Rice–Wheat Consortium for the Indo-Gangetic Plains, New Delhi, 2004, p. 44. 1562 6. Pal, D. K., Dasog, G. S., Vadivelu, S., Ahuja, R. L. and Bhattacharyya, T., Secondary calcium carbonate in soils of arid and semi-arid regions of India. In Global Climate Change and Pedogenic Carbonates (eds Lal, R. et al.), Lewis Publishers, Boca Raton, Florida, USA, 2000, pp. 149–185. 7. Pal, D. K., Bhattacharyya, T., Ray, S. K., Chandran, P., Srivastava, P., Durge, S. L. and Bhuse, S. R., Significance of soil modifiers (Ca-zeolites and gypsum) in naturally degraded Vertisols of the Peninsular India in redefining the sodic soils. Geoderma, 2006, 136, 210–228. 8. IIASA, Climate change and agricultural vulnearability. Special Report for the UN World Summit on Sustainable Development, Johannesburg, 2002; http://www.iiasa.ac.at/Research/LUC/JBReport.pdf 9. Wani, S. P., Sreedevi, T. K. and Rockstrom, J., Rainfed agriculture – past trend and future prospects. In Rain-fed Agriculture: Unlocking the Potential (eds Wani, S. P., Rockstrom, J. and Oweis, T.), Comprehensive Assessment of Water Management in Agriculture Series, CAB International, Wallingford, UK, 2009, pp. 1–35. 10. Wani, S. P., Rockstrom, J., Venkateswarlu, B. and Singh, A. K., New paradigm to unlock the potential of rainfed agriculture in the semi-arid tropics. In World Soil Resources and Food Security (eds Lal, R. and Stewart, B. A.), CRC Press, Boca Raton, FL, USA, 2011, pp. 419–470. 11. Welter, T., Challenges and opportunities for agricultural R&D in the semi-arid tropics. Internal document for strategic planning, ICRISAT, Patancheru, 2010. 12. World Health Organization, Gender, health and poverty. Factsheet no. 25, 2000; http://www.who.int.int/mediacenter/factsheets/fs251/ enl 13. Thirtle, C. et al., The impact of changes in agricultural producitivity on the incidence of poverty in developing countries. DFID Report No. 7946. Department of International Development, London, 2002. 14. Kaul, G. L. and Mittal, J. P. (eds), National Agricultural Technology Project, Main Document. Indian Council of Agricultural Research, New Delhi, 1998. 15. Virmani, S. M., Pathak, P. and Singh, R., Soil-related contraints in dry land crop production in Ultisols, Alfisols and Entisols of India. Indian Soc. Soil Sci., 1991, 15, 80–95. 16. Bhattacharyya, T., Pal, D. K., Chandran, P., Ray, S. K., Mandal, C. and Telpande, B., Soil carbon storage capacity as a tool to prioritise areas for carbon sequestration. Curr. Sci., 2008, 95, 482–494. 17. Sehgal, J. L. and Sharma, J. P., Soil and climatic resource characterization of dryland eco-system in India for sustainable agriculture. Bulletin no. 6. In Soil Management for Sustainable Agriculture in Dryland Areas, Indian Society of Soil Science, 1994, pp. 12–25. 18. Bhattacharyya, T., Pal, D. K., Velayutham, M., Chandran, P. and Mandal, C., Total carbon stock in Indian soils: issues, priorities and management. In Special Publication of the International Seminar on Land Resource Management for Food, Employment and Environmental Security, New Delhi, 8–13 November 2000, pp. 1–46. 19. Velayutham, M., Mandal, D. K., Mandal, C. and Sehgal, J., Agroecological Subregions of India for Development and Planning, NBSS&LUP, Nagpur Publication 35, 1999, p. 452. 20. Pal, D. K., Bhattacharyya, T. and Wani, S. P., Formation and management of cracking clay soils (vertisols) to enhance crop productivity: Indian experience. In World Soil Resources (eds Lal, R. and Sewart, B. A.), Francis and Taylor, 2011, pp. 317–343. 21. Singh, R. P. and Subba Reddy, G., In Drought Research Priorities for the Dryland Tropics (eds Bidinger, F. R. and Johansen, C.), ICRISAT, Patancheru, 1988. 22. Bhattacharyya, T., Pal, D. K. and Deshpande, S. B., Genesis and transformation of minerals in the formation of red (Alfisols) and CURRENT SCIENCE, VOL. 107, NO. 9, 10 NOVEMBER 2014 Georeferenced SIS for agricultural LUP 23. 24. 25. 26. 27. 28. 29. 30. 31. 32. 33. 34. 35. 36. 37. 38. black (Inceptisols and Vertisols) soils on Deccan basalt. J. Soil Sci., 1993, 44, 159–171. Bhattacharyya, T., Pal, D. K. and Srivastava, P., Role of zeolites in persistance of high altitude ferruginous Alfisols of the Western Ghats, India. Geoderma, 1999, 90, 263–276. Bhattacharyya, T., Pal, D. K., Lal, S., Chandran, P. and Ray, S. K., Formation and persistence of Mollisols on Zeolitic Deccan basalt of humid tropical India. Geoderma, 2006, 136, 609–620. Bhattacharyya, T. et al., Soil resource information of different agro-eco subregions of India for crop and soil modelling. National Project on Climate Change (ICAR Network Project), National Bureau of Soil Survey and Land Use Planning, Nagpur, 2011, p. 302. Bhattacharyya, T., Carbon capture and storage: role of soil as substrate. Indian Society of Soil Science Newsletter No. 31, 2011, pp. 1–2; www.isss.india.org Bhattacharyya, T., Sehgal, J. and Sarkar, D., Soils of Tripura for optimising land use: their kinds, distribution and suitability for major field crops and rubber. NBSS Publ. 65 a and c (Soils of India series 6). NBSS&LUP, Nagpur, 1996, p. 154. Bhattacharyya, T. et al., Evaluating the century C model using long-term fertilizer trials in the Indo-Gangetic Plains, India. Agric. Ecosyst. Environ., 2007, 122, 73–83. Bhattacharyya, T. et al., Evaluating the century C model using two long-term fertilizer trials representing humid and semi-arid sites from India. Agric. Ecosyst. Environ., 2010, 139, 264–272. Sehgal, J., Saxena, R. K. and Pofali, R. M., Soil degradation map of India (human-induced). In Soil Degradation in India: Status and Impact (eds Sehgal, J. and Abrol, I. P.), Oxford and IBH, New Delhi, 1994, p. 80. Mandal, C. et al., Revisiting agro-ecological sub-regions of India – a case study of two major food production zones. Curr. Sci., 2014, 107(9), 1519–1536. West Bengal Soils, Scale 1 : 500,000, 1 cm = 5 km, 4 Sheets, Prepared and Published by National Bureau of Soil Survey and Land Use Planning (ICAR), Nagpur, Regional Centre, Kolkata. In cooperation with Department of Agriculture, Government of West Bengal, Kolkata. Bihar Soils, Scale 1 : 500,000, 1 cm = 5 km, 4 Sheets, Prepared and published by National Bureau of Soil Survey and Land Use Planning (ICAR), Nagpur, Regional Centre, Kolkata; In cooperation with Soil Survey and Land Use Planning, Rajendra Agricultural University, Sabour, 1998. Uttar Pradesh Soils, Scale 1 : 500,000, 1 cm = 5 km, 6 Sheets, Prepared and published by National Bureau of Soil Survey and Land Use Planning (ICAR), Nagpur, Regional Centre, New Delhi, in cooperation with Department of Agriculture, Lucknow, 1999. Batjes, N. H. et al., Preparation of consistent soil datasets for modelling purposes: secondary SOTER data for four case study areas. Agric. Ecosyst. Environ., 2007, 122, 26–34. Bhattacharyya, T. and Mandal, B., Soil information system of the Indo-Gangetic Plains for resource management. ISSS special session on land use planning. J. Indian Soc. Soil Sci., Platinum Jubilee Symp. – Proc., 2009, 1–19. Punjab Soils, Scale 1 : 500,000, 1 cm = 5 km, 2 Sheets, Prepared and published by: National Bureau of Soil Survey and Land Use Planning (ICAR), Nagpur, Regional Centre, New Delhi; In Cooperation with Department of Soil Conservation and Engineering, Chandigarh; NBSS&LUP, Regional Centre, New Delhi; Gill, S. S., Gill, J. S. and Sood, Y. P., Department of Soils, PAU, Ludhiana; Sidhu, P. S., Sharma, P. K., Meelu, O. P. and Bajwa, M. S., Department of Soil Conservation and Engineering, Chandigarh; Sehgal, J., Chief Coordinator and National Project Leader, NBSS&LUP, Nagpur. Haryana Soils, Scale 1 : 500,000, 1 cm = 5 km, 2 Sheets, Prepared and published by National Bureau of Soil Survey and Land Use Planning (ICAR), Nagpur, Regional Centre, New Delhi; In coop- CURRENT SCIENCE, VOL. 107, NO. 9, 10 NOVEMBER 2014 39. 40. 41. 42. 43. 44. 45. 46. 47. 48. 49. 50. 51. 52. 53. 54. 55. eration with Department of Agriculture, Chandigarh, 1994; Contributors: Sachdev, C. B., Rana, K. P. C., Jain, S. P., NBSS&LUP, Regional Centre, New Delhi; Malik, Ram Pal and Lohan, H. S., Department of Agriculture, Soil Survey Staff, Haryana and Sehgal, J., Chief Coordinator & National Project Leader, NBSS&LUP, Nagpur. Rajasthan Soils, Scale 1 : 500,000, 1 cm = 5 km, 6 Sheets, Prepared and published by: National Bureau of Soil Survey and Land Use Planning (ICAR), Nagpur, Regional Centre, Udaipur; In cooperation with CAZRI, Jodhpur and Department of Watershed Development and Soil Conservation, Rajasthan. Ray, S. K. et al., Baseline Data Indo-Gangetic Plains (IGP) Part I. Working Report No. 1, NAIP Component-4 Project on ‘Georeferenced soil information system for land use planning and monitoring soil and land quality for agriculture’, Lead Center, NBSS&LUP, Nagpur, 2013, pp. 1–686. Ray, S. K. et al., Baseline Data Indo-Gangetic Plains (IGP) Part II. Working Report No. 1, NAIP Component-4 Project on Georeferenced soil information system for land use planning and monitoring soil and land quality for agriculture. Lead Center, NBSS& LUP, Nagpur, 2013, pp. 687–1290. Bhuse, S. R., Vaidya, P. H., Bhattacharyya, T. and Pal, D. K., An improvised method to determine clay smectite in Vertisols. Clay Res., 2002, 20, 65–72. Bhuse, S. R., Genesis and classification of spatially associated ferruginous red and black soils developed in basaltic terrain of Andhra Pradesh. M Sc in Land Resource Management from Dr Panjabrao Deshmukh Krishi Vidyapith, Akola, 2000, p. 102. Pal, D. K. and Deshpande, S. B., Genesis of clay minerals in a red and black complex soils of southern India. Clay Res., 1987, 6, 6–13. Pal, D. K., On the formation of red and black soils in southern India. In Transactions of the International Workshop on SwellShrink Soils (eds Hirekerur, L. R. et al.), Oxford University Press, Oxford & IBH, New Delhi, 1988, pp. 81–82. Jeffery, K. L., Henderson, P., Subbarao, K. V. and Walsch, J. N., The zeolites of Deccan basalts – a study of their distribution. In Deccan Flood Basalts (ed. Subbarao, K. V.), Geological Society of India, Bangalore, 1988, pp. 151–162. Sabale, A. B. and Vishkarma, L. L., Zeolites and associated secondary minerals in Deccan volcanics: study of their distribution, genesis and economic importance. National Symposium on Deccan Flood Basalts, India. Gondwana Geol. Mag., 1996, 2, 511–518. Pal, D. K., Mandal, D. K., Bhattacharyya, T., Mandal, C. and Sarkar, D., Revisiting the agro-ecological zones for map evaluation. Indian J. Genetics (Spec. Issue), 2009, 69, 315–318. Bhattacharyya, T. et al., Soils of India: their historical perspective, classification and recent advances in knowledge: a review. Curr. Sci., 2013, 104, 1308–1323. Ray, S. K. et al., Formation of landscape and its effect on clay mineral variability at Dharwarcan formation. Clay Res., 2006, 25, 141–152. Milne, E. et al., National and sub national assessments of soil organic carbon stocks and changes: the GEFSOC modelling system. Agric. Ecosyst. Environ., 2007, 122, 3–12. Tiwary, P. et al., Pedotransfer functions: a tool for estimating hydraulic properties of two major soil types of India. Curr. Sci., 2014, 107(9), 1431–1439. Chatterji, S. et al., Land evaluation for major crops in the IndoGangetic Plains and black soil regions using fuzzy model. Curr. Sci., 2014, 107(9), 1502–1511. Venugopalan, M. V. et al., InfoCrop-cotton simulation model – its application in land quality assessment for cotton cultivation. Curr. Sci., 2014, 107(9), 1512–1518. Bhattacharyya, T., Chandran, P., Ray, S. K., Pal, D. K., Venugopalan, M. V., Mandal, C. and Wani, S. P., Changes in levels of carbon in soils over years of two important food production zones of India. Curr. Sci., 2007, 93, 1854–1863. 1563 Special section: Georeferenced SIS for agricultural LUP Special section: 56. Batjes, N. H., Options for increasing carbon sequestration in west African soils: an exploratory study with special focus on Senegal. Land Degrad. Dev., 2001, 12, 131–142. 57. Naitam, R. and Bhattacharyya, T., Quasi-equilibrium of organic carbon in swell–shrink soils of sub-humid tropics in India under forest, horticulture and agricultural system. Aust. J. Soil Res., 2003, 42, 181–188. 58. Bhattacharyya, T. and Pal, D. K., Carbon sequestration in soils of the Indo-Gangetic Plains. In RWC-CIMMYT. Addressing Resource Conservation Issues in Rice–Wheat Systems of South Asia. A Resource Book, Rice–Wheat Consortium for Indo-Gangetic Plains, International Maize and Wheat Improvement Centre, New Delhi, 2003, pp. 68–71. 59. Sidhu, G. S. et al., Impact of management levels and land-use changes on soil properties in rice–wheat cropping system of the Indo-Gangetic Plains. Curr. Sci., 2014, 107(9), 1487–1501. 60. Velmourougane, K. et al., Impacts of bio-climates, cropping systems, land-use and management on the cultural microbial population in black soil regions of India. Curr. Sci., 2014, 107(9), 1452– 1463. 61. Srivastava, A. K. et al., Impacts of agro-climates and land use systems on culturable microbial population in soils of the IndoGangetic Plains, India. Curr. Sci., 2014, 107(9), 1464–1469. 62. NAIP, GeoSIS–SIS, 2009; http://geosis-naip-nbsslup.org 63. NRCS, Global soil regions, United States Department of Agriculture, Natural Resources Conservation Service, Soil Survey Division, World Soil Resources, 1996. 64. NBSS&LUP, Soils of India (suborder association 1 : 7 M), National Bureau of Soil Survey and Land Use Planning, Nagpur, 1985. 65. Govinda Rajan, S. V., Soil map of India. In Review of Soil Research in India (eds Kanwar, J. S. and Raychaudhuri, S. P.), 1971. 1564 66. Sehgal, J., Mandal, D. K., Mandal, C. and Vadivelu, S., AgroEcological Regions of India, Technical Bulletin No. 24, NBSS&LUP, Nagpur, 1992, 2nd edn, p. 130. 67. NBSS&LUP, Soils of India (family association 1 : 1 M), National Bureau of Soil Survey and Land Use Planning, Nagpur, 2002. 68. NBSS&LUP–CICR–NBAIM–DWM, Revised AESR map, IGP, Part of NAIP (ICAR) C-4-GeoSIS Project Output, NBSS&LUP, Nagpur, 2013. 69. Soil Survey Staff, Keys to Soil Taxonomy, United States Department of Agriculture, Natural Resources Conservation Service, Washington, DC, 2006, 10th edn. 70. Sehgal, J. L., Lal, S., Srivastava, R., Bhattacharyya, T. and Prasad, J., Benchmark Swell–Shrink Soils of India – Morphology, Characteristics and Classification. NBSS Publ. No. 19, 1988, p. 166. 71. NBSS&LUP–CICR–NBAIM–DWM, Revised AESR map, BSR, Part of NAIP (ICAR) C-4-GeoSIS Project Output, NBSS&LUP, Nagpur, 2013. 72. Chandran, P. et al., Development of soil and terrain digital database for major food-growing regions of India for resource planning. Curr. Sci., 2014, 107(9), 1420–1430. 73. Ray, S. K. et al., Soil and land quality of the Indo-Gangetic Plains of India. Curr. Sci., 2014, 107(9), 1470–1486. ACKNOWLEDGEMENTS. The present study was carried out by the National Agricultural Innovative Project (Component 4), sponsored research on ‘Georeferenced soil information system for land use planning and monitoring soil and land quality for agriculture’ through Indian Council of Agricultural Research, New Delhi. The financial assistance is gratefully acknowledged. CURRENT SCIENCE, VOL. 107, NO. 9, 10 NOVEMBER 2014


© Copyright 2026