
Determination of Naturally Occurring Radioactive Elements and
Determination of Naturally Occurring Radioactive Elements and
Radiation Exposure Levels in the Soapstone Quarries of Tabaka
Region of Kisii District, Kenya
Vincent Otwori Atambo
A thesis submitted in partial fulfillment for the Degree of Master of
Science in Physics in the Jomo Kenyatta University of Agriculture and
Technology
2011
DECLARATION
This thesis is my original work and has not been presented for a degree in any other
university.
Signature: …………………………
Date: …………………
Vincent Otwori Atambo
This thesis has been submitted for examination with our approval as University
supervisors.
Signature: ……………………….
Date: ……………………….
Dr. Robert Kinyua
JKUAT, Kenya
Signature…………………………..
Dr. Richard M Ongeri
JKUAT, Kenya
Date:……………………….
DEDICATION
I dedicate this work to my dear wife Lillian, my daughters Angela and Michelle, my son
Victor, my dear parents, brothers and sisters for their support, encouragement and
patience during the study period.
ii
ACKNOWLEDGEMENT
I sincerely thank my supervisors, Dr. Robert Kinyua and Dr. Richard Ongeri for the
great effort they put in guiding me throughout my work. My thanks also go to the
Teachers Service Commission (TSC) for granting me a study leave with pay that
facilitated my upkeep throughout the study period.
I greatly thank Dr. Githiri, Dr. Ngaruiya (Chairman Physics Department), Dr. Kihara
and all members of the Physics Department of JKUAT for their moral support and
encouragement. I also thank the staff of the Civil Engineering Department of JKUAT for
allowing me to use their equipment during sample preparation.
I am also much indebted to the Chief Radiation Protection Officer, Mr Joel Kamande,
radiophysicist Alice Karigi and the technical staff of National Radiation Protection
Board where all the laboratory experiments were conducted, for their support and
positive criticism during my study period.
Above all, my sincere thanks go to the Almighty God without whom I would not have
had the strength to carry out and complete my studies.
iii
TABLE OF CONTENTS
DECLARATION…………………………………………………………………….......i
DEDICATION………………………………………………………………………......ii
ACKNOWLEDGEMENT……………………………………………………………..iii
TABLE OF CONTENTS……………………..……………………………………….iv
LIST OF TABLES……………………………………………………………………viii
LIST OF FIGURES ……………………………………………………………………x
LIST OF PLATES …………………………………………………………………….xii
LIST OF APPENDICES……………………………………………………………..xiii
LIST OF ABBREVIATIONS AND ACRONYMS…………………………………xiv
LIST OF SYMBOLS ………………………………………………………………...xvii
ABSTRACT………………………………………………………………………….xviii
CHAPTER ONE ………………………………………………………………………..1
1.0 INTRODUCTION AND LITERATURE REVIEW…………………………………1
1.1 INTRODUCTION …………………………………………………………………...1
1.2 LITERATURE REVIEW………………………………………………………….…3
1.2.1 Earlier Studies on Terestrial Radionuclides………………………………………..3
1.2.2 Soapstone………………………………………………...………………….…….15
1.3 GEOLOGY OF TABAKA REGION……………………………………………….16
1.4 PROBLEM STATEMENT…………………..……………………………………..17
1.5 OBJECTIVES……………………………………………………………………….17
1.5.1 Main Objective……………………………………………………………...…….17
1.5.2 Specific Objectives………………………………………………………………..18
iv
1.6 JUSTIFICATION……………...………………………………………………...….18
CHAPTER TWO ……..……………………………………………………………….19
1.0 NATURAL RADIOACTIVITY………………….…………...…………………..19
2.1 THEORY OF NATURAL RADIOACTIVITY.……………………………………19
2.2 RADIOACTIVE EMISSIONS ……………………………………………………..22
2.2.1 Gamma Ray Production…………...……………………………………………...25
2.2.2 Units of Measurement and Exposure….………..………………..…………….....26
2.2.3 Interaction of Gamma Rays with Matter…………………………………….…....26
2.2.3.1 Photoelectric Absorption………………………………………………………..28
2.2.3.2 Compton Scattering……………………………………………………………..30
2.2.3.3 Pair Production………………………………………………………………….32
2.3 EFFECTS OF IONIZING RADIATION ON CELLS …………………………..…33
2.3.1 Health Effects of Gamma Rays…..……………………………………………….37
2.4 GAMMA RAY DETECTORS…………………………………………………...…39
2.4.1 Energy Resolution...………………………………………………………………43
2.4.2 Detector Efficiency ……………………………………………………………….44
CHAPTER THREE……..……………………………………………………………..46
2.0 MATERIALS AND METHODS…….…………………………………………....46
3.1 SAMPLE COLLECTION…………………………………………………………..46
3.2 SAMPLE PREPARATION…………………………………………………………49
3.3 ACTIVITY CONCENTRATION MEASUREMENTS…………………………….51
v
3.4 RADIONUCLIDE IDENTIFICATION REPORTS………………………………..53
3.5 ABSORBED DOSE………………………………………………………………...54
3.5.1 Measurement of Absorbed Dose Rates In Air………………………………….…54
3.5.2 Calculation of Absorbed Dose Rates………………………………………….…..55
3.5.3 Calculation of Annual Effective Dose……………………………………….……55
3.5.4 External Hazard Index………………………………………………….................56
3.5.5 Internal Hazard Index……………………………………………………..………57
CHAPTER FOUR………..……………………………………………………………58
4.0 RESULTS AND DISCUSSION…………………..……………………………….58
4.1 SPECTRA FOR VARIOUS SAMPLES…………………………………...……….58
4.2 ACTIVITY CONCENTRATIONS OF RADIONUCLIDES IN THE SAMPLES...59
4.3 ABSORBED DOSE RATES………………………………………………………..62
4.3.1 Measured Absorbed Dose Rates…………………………………………………..62
4.3.2 Calculated Absorbed Dose Rates…………………………………………………62
4.4 EXTERNAL HAZARD INDEX AND INTERNAL HAZARD INDEX………… 67
4.5 ANNUAL EFFECTIVE DOSE RATE……………………………………………..69
CHAPTER FIVE…..……………...…………………………………………………...71
5.0 CONCLUSIONS AND RECOMMENDATIONS…...…………………………..71
5.1 CONCLUSION.…………………………………..………………………………...71
5.2 RECOMMENDATIONS……………………..…………………………………….72
vi
REFFERENCES…………………..…...………………………………………………74
APPENDICES…...…………...………………………………………………………...84
vii
LIST OF TABLES
Table 3.1: Quarry identity and sample type collected…………………………...….....46
Table 3.2: Identified radionuclides for IAEA – 365 soil sample…………...……….....53
Table 3.3: Spectroscopic parameters employed for quantification of activity
levels……………………………………….……………………………..54
Table 4.1: Activity of radionuclides 232Th, 226Ra and 40K in the measured rock/soil
samples from Tabaka soapstone quarries in Kenya………...…..………….59
Table 4.2: Comparison between average activities of radionuclides in each quarry
and the world average activities of the radionuclides……………………..61
Table 4.3: Absorbed dose rates measured 1 m above the surface at each quarry…..…62
Table 4.4: Calculated absorbed dose rates (nGyh-1) of the soil and rock samples from
Tabaka soapstone quarries…………………………………………………63
Table 4.5: Comparison of absorbed dose rates in Tabaka soapstone quarries with other
areas of the world…………………………………………………………66
Table 4.6: Comparison of calculated average absorbed dose rates and measured dose
rates………………………………………………….…………………...67
Table 4.7: External and Internal hazard indices…………………………………….....68
viii
Table 4.8: Annual effective dose rates due to extraction of soapstone at Tabaka
quarries…………………………………………………………………….69
ix
LIST OF FIGURES
Figure1.1: Percentage contribution of ionizing radiation to humans by
various sources…………………...…………………………………………2
Figure 2.1: Illustration of a decay scheme of 226Ra ………………………...………….25
Figure 2.2: The relative dominance of the photon interaction processes in matter…….27
Figure 2.3: Illustration of the photoelectric absorption process……………………….29
Figure 2.4: Illustration of the Compton effect………………………………….…….. 31
Figure 2.5: Illustration of the pair production process………………………………...32
Figure 2.6: Illustration of germanium detectors in liquid nitrogen dewars……………43
Figure 3.1: The occurrence of Kisii Soapstone in Tabaka area……………...………...47
Figure 3.2: Block diagram illustrating gamma-ray detection system………………....51
Figure 4.1: Typical gamma-ray spectrum of a soil sample measured using HPGe
detector………………………………………………………....................58
Figure 4.2: Figure 4.2: Comparison the mean absorbed dose rate for each
quarry to the world average absorbed dose rate.……………...…………...64
Figure 4.3: The percentage contributions to the total absorbed dose rates due to
232
Th and 226Ra decay products and 40K for rock and soil samples
x
from Tabaka soapstone quarries………………………………………...…65
xi
LIST OF PLATES
Plate 3.1: Four selected quarries………………..………………………………………48
Plate 3.2: The order of preparation of the rock and soil samples………………………50
Plate 3.3: Model 2000 Canberra radiagem that was used to measure absorbed dose rates
in air…............................................................................................................55
xii
LIST OF APPENDICES
Appendix A1: Thorium series………………………..………………………………..84
Appendix A2: The uranium series…………………………………………...………...85
Appendix A3: Nuclide identification reports table……………………………………86
xiii
LIST OF ABBREVIATIONS AND ACRONYMS
CSI
Container Security Initiative
CT
Computer Tomography
DNA
Deoxyribonucleic acid
EURATOMEC
European Atomic Energy Community
eV
Electron volt
HBRA
High Background Radiation Areas
HPGe
Hyper Pure Germanium
HLNRAs
High Level Natural Radiation Areas
IAEA
International Atomic Energy Agency
ICRP
International Commission on Radiological Protection
keV
Kilo electron volt
Linacs
Linear Accelerators
MAD
Maximum Annual Effective Dose
MeV
Mega electron volt
NaI(TI)
Sodium Iodide Thallium Activated Detector
NORE
Naturally Occurring Radioactive Elements
rad
Radiation absorbed dose
REE
Rare Earth Elements
rem
Roentgen equivalent in mammals
TENORE
Technologically Enhanced Naturally Occurring
Radioactive Elements
xiv
TLD
Thermoluminescent Dosimeter
UNSCEAR
United Nations Scientific Committee on the Effects of
Atomic Radiation
Bqkg-1
Becquerel per kilogram
SvGy-1
Sieverts per gray
mSvy-1
Milli sievert per year
nGyh-1
Nano gray per hour
µgg-1
Micro gram per gram
µSvy-1
Micro sievert per year
Ac
Actinium
Bi
Bismuth
Cd
Cadmium
Co
Cobalt
Cs
Cesium
Cu
Copper
Fe
Iron
K
Potassium
Mn
Manganese
Na
Sodium
Pa
Protactinium
Pb
Lead
Po
Polonium
xv
Ra
Radium
Rb
Rubidium
Rn
Radon
Th
Thorium
U
Uranium
Zn
Zinc
Me
Electronic mass
Hex
External hazard index
Hin
Internal hazard index
xvi
LIST OF SYMBOLS
α
Alpha particle
β
Beta particle
γ
Gamma ray
λ
Wavelength
ε
Epsilon (Efficiency)
σ
Conversion coefficient
θ
Scattering angle
h
Planck’s constant
c
Speed of light in a vacuum
xvii
ABSTRACT
A radiological study was carried out in the soapstone quarries of Tabaka region of Kisii
district in the Southern Nyanza province, Kenya, where soapstone is mined and used as
a carving medium. In this study, 14 soil and rock samples collected from five quarries
were analyzed using high-resolution gamma-ray spectroscopy. The absorbed dose rates
were measured 1metre above the ground at each quarry using a model 2000 Canberra
radiagem. Various radionuclides were identified in the samples. The activity
concentrations of radionuclides
232
Th,
40
K and
226
Ra in the samples as well as other
232
radiological parameters were determined. The activity concentrations for
Th ranged
from 38.60 to 271.70 Bqkg-1, 226Ra ranged from 43.10 to 360.00 Bqkg-1 and 40K ranged
from 245.00 to 1780.00 Bqkg-1. The average absorbed dose rate for the five quarries
measured 1metre above the ground was 541.40 nGyh-1. The calculated absorbed dose
rates were found to be in the range of 87.49 to 356.77 nGyh -1, with an overall average
value of 183.79 nGyh-1 which was 4 times higher than the world average
The corresponding annual effective dose rates due to the radionuclides
40
(43 nGyh-1).
232
Th,
226
Ra and
K in the quarries ranged from 0.22 to 0.88 mSvy-1, with a mean of 0.44 mSvy-1,
assuming a 40% occupancy factor. Both the internal and external hazard indices were
found to be more than unity (1.02 and 1.28 respectively), hence exceeding the
permissible limits set by International Commission on Radiological Protection, 2000.
The annual effective dose in the quarries was less than 1 mSvy-1, the limit acceptable for
the public.
xviii
xix
CHAPTER ONE
1.0 INTRODUCTION AND LITERATURE REVIEW
1.1 INTRODUCTION
Human beings have always been exposed to ionizing radiations of natural origin, namely
terrestrial and extra-terrestrial radiation. Extra-terrestrial exposure results from high
energy cosmic ray particles while terrestrial exposure is due to the presence of naturally
occurring radionuclides, mainly 40K, 87Rb, 7Be, 210Pb and the radionuclides in the decay
chains of
232
Th and
238
U found in soils, rocks, building materials, air, water, foodstuffs
etc. The natural radioactivity in geological materials, mainly rocks and soil, come from
232
Th and 238U series and natural 40K. Artificial radionuclides such as 137Cs which result
from weapon testing and the Chernobyl nuclear accident can also be present
(UNSCEAR, 2000). Fear of radioactivity is focused on artificial radiation sources,
especially from nuclear facilities. The greatest exposure to the population is caused by
natural radiation sources as shown in Figure 1.1.
1
Figure1.1: Percentage contribution of ionizing radiation to humans by various sources
[UNSCEAR, 2000].
The growing worldwide interest in natural radiation exposure has lead to extensive
surveys in many countries. To evaluate the terrestrial gamma dose rate for outdoor
occupation, it is important to estimate the natural radioactivity levels in various samples.
The natural radioactivity of soil samples is usually determined from the 226Ra, 232Th and
40
K contents (NCRP, 1993). Naturally occurring radioactive elements (NORE) including
uranium and thorium are found in traces in almost all types of rocks, soil, sands and
waters. NORE mineral deposits can be found in geological environments as
metamorphic rocks such as gneiss, quartzfeldspathic and enderbites with interlaid mafic
2
horizons. From UNSCEAR (2000) reports, the greatest contribution to human exposure
comes from natural background radiation, and the worldwide average annual effective
dose is 2.4mSv.
1.2 LITERATURE REVIEW
1.2.1 Earlier Studies on Terrestrial Radionuclides
98.5% of the radiological effects of the uranium series are produced by radium and its
daughter products. Extensive surveys have been carried out to determine the radium
equivalent activity of soil samples in many countries (Singh et al., 2003; Ibrahim., 1999;
Ibrahiem et al., 1993; Xinwei, 2005). Radiological studies have been made in sand
beach locations, mainly in India, because along its coastline there are quite a few
monazite sand bearing placer deposits causing natural high background radiation areas
in Kerala and Tamilnadu, in Kalpakam and in the coast of Orissa.
The activity concentrations of
226
Ra,
232
Th and
40
K in collected soil samples have been
estimated mainly by gamma ray spectrometry, although the fission track registration
technique has also been used for the analysis of uranium concentration in these samples
(Singha et al., 2005). They found the absorbed dose rates in air, calculated the gamma
dose rate from the concentration of radio-nuclides of 226Ra, 232Th and 40K hence deduced
the annual effective dose the inhabitants receive.
3
Radon (222Rn), a decay product of radium (226Ra) in the naturally occurring uranium
series, is an inert gas and can diffuse through the soil, rocks and building materials. The
half-life of
222
Rn (3.8 days) is long enough for much of the radon formed in building
materials or in the ground within approximately a meter of building understructures to
reach the indoor environment (Mujahid et al., 2005). It decays into a series of short-lived
daughter products, out of which 218Po and 214Po emit high energy α-particles. Radon and
its progeny, when inhaled during breathing, enter the human lungs and may lead to
serious diseases such as lung cancer. Since radon is a health hazard many indoor
national surveys in temperate countries such as Austria, France, Russia and United
States of America have been carried out to determine the level of radon and its progeny
in the dwellings (Ansoborlo et al., 2002, UNSCEAR; 2000). Similar studies have also
been carried out in some tropical countries such as Egypt, Mexico, Latin America,
Brazil, Bangladesh and Hong-Kong (Canoba et al., 2001). In India many researchers are
engaged in measurement of indoor radon levels in dwellings for health risk assessment
and its control (Singh et al., 2003).
Uranium and radium present in the soil, rocks and building materials are the main
sources of indoor radon. This has brought about the need for estimation of uranium and
radium content along with the radon exhalation rate in the soil (Singha et al., 2005).
Singha also reported that the annual effective dose in the study area varied from 1.63 to
3.45 mSv with a mean value of 2.62 mSv. Survey results have proved useful to mappers
and mineral explorers and have led to additional surveys in subsequent years when new
4
knowledge is acquired (McCall, 1958; Patel, 1991). Anthropomorphic enhancements of
the NORE, e.g. due to discharges from phosphoric factories, increases
concentrations in sediments. Although activity concentrations of
226
Ra activity
226
Ra in environmental
and geological samples are usually determined by α- or γ- spectrometry, these methods
have some drawbacks, mainly due to time and sample sizes, and hence β- spectrometry
complements α- or γ- spectrometry when short time is required and small samples have
to be analyzed.
Studies in Canada, the United States of America, Sweden and Great Britain have shown
that the ground concentration of uranium determined using an airborne gamma-ray
spectrometer provides a qualitative, first-order approximation of regional variation in
indoor radon levels and can be used to identify and outline high risk areas (Jackson
1992; Akerblom 1995).
In Kenya, McCall (1958) analyzed radioactive iron stone from parts of Kenya but did
not report viable deposits of radioactive mineral. Mangala (1987) performed elemental
analysis of sediment samples from Mrima hills and found high concentration of thorium
and rare earth metals. Patel (1991) in follow up studies established that the area is
composed of weathered carbonatite rock. Otwoma and Mustapha (1998) tested drinking
water and building materials from soils and rock samples across seven provinces in
Kenya and established presence of elevated levels of radioactivity. Against a
background of growing concern over the health risk associated with exposure to natural
sources of radiation, Mustapha et al., (1997) analyzed the activity concentrations of
5
major radionuclides in some natural building materials, different types of rock and soil
samples in Kenya using a gamma-ray spectrometer. The external gamma ray absorbed
doses in indoor air, and the corresponding effective dose equivalents in a typical
dwelling were presented. Exposures to various components of natural background
radiation in Kenya were estimated using measured activity concentrations of natural
radionuclides and conversion factors. Contributions to the effective dose included: 0.1 to
0.2 mSvy-1 from terrestrial gamma radiation; 0.2 to 0.7 mSvy-1 and a per capita of 0.4
mSvy-1 from cosmic radiation; and 0.4 to 6.0 mSvy-1 from inhalation of radon. Radon
concentrations ranged from 5 to 1200 Bqm-3 in indoor air and from 1 to 410 Bql-1 in
drinking water. At Buru hill carbonatite, east of Kisumu, Japanese exploration
companies have prospected for rare earth elements (REE). Among such, Ohde (2004)
used instrumental neutron activation analysis to determine twenty eight elements
including REE from samples of carbonatite rocks from Homa mountain.
Terrestrial natural sources of radiations vary greatly from place to place. Around the
world though, there are some areas with sizable populations that have high background
radiation levels. The highest are found primarily in Brazil, India and China (Canoba et
al., 2001). The higher radiation levels are due to high concentrations of radioactive
minerals in soil. One such mineral, Monazite, is a highly water insoluble rare earth
mineral that occurs in beach sand. The principal radionuclides in monazite are from the
232
Th series, but there is also some uranium and its progeny, 226Ra.
6
In Brazil, the monazite sand deposits are found along certain beaches. The external
radiation levels on these black sands range up to 50 µGyh-1, which is almost 400 times
normal background in the US. Some of the major streets of the surrounding cities have
radiation levels as high as 1.3 µGyh-1. Another high background area in Brazil is due to
deposits of large rare earth ore that form a hill that rises about 250 meters above the
surrounding area. An ore near the top of the hill is very near the surface, and contains an
estimated 30,000 tons of thorium and 100,000 tons of rare earth elements (Viegaa et al.,
2006). The radiation levels near the top of the hill are 0.01 to 0.02 mGyh-1 over an area
of about 30,000 m2. The plants found there have absorbed so much
228
Ra, that they can
produce a self "x-ray" if placed on a sheet of photographic paper (Srivastava et al.,
2002). On the Southwest coast of India, the monazite deposits are larger than those in
Brazil. The dose from external radiation is on average similar to the doses reported in
Brazil, 5-6 mGyy-1, but individual doses up to 32.6 mGyy-1 have been reported. An area
in China, has dose rates that are about 3-4 mGyy-1. This is also from monazite that
contains thorium, uranium and radium.
Achola (2009) carried out a radiological survey in various parts of Lambwe east
location (South western Kenya) whose results indicated that the mean estimated annual
external effective dose rate due to radionuclides in the rocks and soil was 5704.78
µSvy-1. The average specific activity concentrations of potassium-40, Radium-226
(uranium-238 equivalent) and thorium-232 in rock and soil samples from these areas
were measured using gamma-ray spectrometry and found to be 508.67 BqKg-1, 178.69
BqKg-1 and 1396.85 BqKg-1 respectively. The study indicated that the source of
7
enhanced level of natural radioactivity in the sample was mainly carbonatite rocks.
Based on the higher levels of gamma-absorbed dose rates in air (5.705 mSvy-1) as
compared to the global mean of 0.46 mSvy-1, this region was considered as high natural
background radiation area (HBRA) (Achola, 2009). Similar results were reported in
other parts of Kenya such as Mrima hill (Mangala, 1987; Patel, 1991; Mustapha, 1999),
Ruri hills, Rangwa ring complex, Soklo point and Kuge (Tuinge), in Gwasi, Suba
district. (McCall, 1958; Mangala, 1987) conducted a multi-elemental X-ray fluorescence
analysis of soil and rock samples from the Mrima hills. Thorium, lead, strontium and
zinc were found to be at high concentration in the soil and rock samples. Thorium traces
of rare earth metals were also found in high concentrations (>1000 µgg-1) (Mangala,
1987). Testing of Water samples from some public wells in Mrima showed radon
activity levels to be around 100 kBqm-3 (Mustapha, 1999). This was attributed to
occurrences of thorium enriched carbonates in the area.
In areas of high natural background radiation, an increased frequency of chromosome
aberrations has been noted repeatedly (Achola, 2009). The increases are consistent with
those seen in radiation workers and in persons exposed to high dose levels, although the
magnitudes of the increases are somewhat higher than predicted. No increase in the
frequency of cancer is documented in populations residing in areas of high natural
background radiation (Kurnaz et al 2007).
Mining activities are known for their deleterious effects on the environment due to
deposition of large amounts of wastes on the soil. These negative effects on the
8
environment caused by mining activities are mainly due to presence of high volumes of
tailings. These tailings which include acidity (Wong, 1998), high concentrations of
heavy toxic metals (Norland and Veith, 1995), low water retention capacity (Henriques
and Fernandes, 1991) and low levels of plant nutrients (Wong, 2003) usually have
unfavorable conditions to natural vegetation growing. All these factors make mine
tailings sources of pollution to surface waters and soil in their vicinity (Conesa et al.,
2006).
A study of heavy metal concentration in growth bands of corals showed higher levels of
Cu, Zn, Mn and Fe derived from mine tailings in Merinduque Island (David, 2003).
Heavy metal toxicity assessment using biotest in south Morocco showed very high
heavy metal concentration with Zn concentration (38,000-10,800 mgKg-1), Pb (20,41230,000 mgKg-1), Cu (2,019-8,635 mgKg-1) and Cd (148-228 mgKg-1). The soil pH
values also had wide variations (2.6-8.8), (Boularbah, 2006). A study on distribution of
heavy metals from mine wastes from an old Pb-Zn mine in Spain showed very high
concentrations of metal ions: 28,453.50 mgKg-1 for Pb; 7,000.44 mgKg-1 for Zn; 20.87
mgKg-1 for Cd and 308.48 mgKg-1 for Cu. High concentrations of Pb, Zn and Cd were
found in many of the samples taken from surrounding arable and pasture land, indicating
a certain extent of spreading of heavy metal pollution.
The existence of high-level natural radiation areas (HLNRAs) is attributed to the
availability of certain radioactive minerals or elements embedded in the continental rock
systems of these areas (Achola, 2009). All mineral ores contain radionuclides of natural
9
terrestrial origin commonly referred to as primodial radionuclides. The activity
concentrations of radionuclides in normal rocks and soils are variable but generally low.
However, some commercially exploited minerals contain high levels of radionuclides
(Odumo, 2009).
Work activities associated with extraction, processing and use of minerals have the
potential to increase exposure to radiation to members of the general public and workers.
This is due to the enhanced levels of the natural radionuclides in the processed ore,
depending on the type of the industrial process used in the milling of the main ore and
the presence of some radionuclides associated to the main ore. This is the so called
Technologically Enhanced Naturally Occurring Radioactive Elements (TENORE).
Zircon is a mineral that is widely used in the ceramic industry. A radiological study on a
Zircon milling plant showed total effective dose rates that were nearly the maximum
acceptable value of 1 mSvy-1 for the members of public. Due to this the authors
recommended careful monitoring and control of the industry (Ballesteros et al., 2008).
Ilmenite and amang have also been assessed for their radioactive materials content. A
radiological impact assessment on effects on the environment in an amang processing
plant at Dengkil and Selengor, Malaysia on doses received by the public as well as
occupational doses was done with the assumption that the area would be converted to a
residential or industrial region once the plant was closed. The predicted maximum
annual effective dose rates for residents and industrial workers were 1.94 mSvy-1 and
35.00 mSvy-1 respectively. Each of them exceeded the maximum acceptable values
10
(Azlina et al., 2003). The activity concentration of
238
U and
232
Th in soils and mineral
sands from the Nigerian tin mine of Bisichi area located in Jos plateau and from two
control areas in Nigeria (Jos city and Akure) were done using HpGe detector. The
activity concentrations in Bisichi ranged from 8.7 kBqKg-1 to 51.0 kBqKg-1 and 16.8
kBqKg-1 to 98.0 kBqKg-1 for
238
U and
232
Th respectively. These values were
significantly high as compared to the results from the control areas and even exceeding
concentrations reported for areas of high natural radioactive background. The
radionuclide concentrations in foodstuffs and water in samples collected from Bisichi
were found to exceed the UNSCEAR, reference values.
Funtua and Elegba (2005) estimated the radiological impact of the processing of
cassiterite and Columbite from different mills of Jos Plateau (central Nigeria). The
results indicated that the average dose rate at different processing points and locations at
the mills had values ranging from 5 µSvh-1 for the background in the premises to 80
µSvh-1 for that of processed zircon. Assuming a 2,000 hours working year, workers in
the processing mills were exposed to an annual dose of about 10 mSv for the
background and an average of 160 mSv for processed zircon, far above the 20 mSv
annual dose limit. The dose rates of about 25 µSvh-1 measured for the tailings gave an
annual dose of about 50 mSv for a non radiation worker in the vicinity of the milling
plant, exceeding the 1 mSvy-1 dose limit for the members of the public. (Funtua and
Elegba, 2005).
11
In Egyptian pyramids and tombs in the Saggara area, measurements of
progeny, as well as
232
222
Rn and its
Th progeny were made and the results used in calculation of the
maximum annual effective dose (MAD) and other important occupational radiation
exposure variables. It was found that for the limited time to which occupational workers
and visitors were exposed, their respective MAD values were lower than those accepted
by the Regulatory Agency (i.e., 20 mSv per year for occupational workers and 1 mSv in
a year for the public). However, it was shown that if the exposure times for occupational
workers at three archaeological sites were to increase to normal working schedules their
MAD would be exceeded. Implementation of improved ventilation practices was
recommended in those sites to reduce the exposure to occupational workers (Bigu et al.,
2000).
Mbuzukongira, (2006) analyzed coltan samples from Congo using Gamma-ray
spectrometry for activity concentration of
most of the samples
40
226
Ra and
232
Th in each coltan ore sample. In
K was below detection limit of the gamma spectrometer, which
was calculated to be 0.141 Bqg-1 considering a counting time of 20 hours (72,000
seconds). All the coltan samples contained activity concentrations of 226Ra and 232Th (i.e
average activity concentration ranging from 0.32 to 1.56 Bqg-1 for
13.45 Bqg-1 for
Th and 3.87 to
226
Ra) that were much higher than the normal concentrations found in
typical soil and rock samples (0.01 to 0.05 Bqg-1 for
232
232
226
Ra and 0.007 to 0.05 Bqg-1 for
Th). Effective dose from digging and the total dose to miners who dig coltan were
calculated
(Mbuzukongira,
2006).
The
12
calculated
values
varied
widely
(from 0.007 to 18.1 mSvy-1) depending on the work activity performed by the artisans,
but crushing and sieving coltan in the mills resulted in the highest dose.
The level of radiation exposure to which an average individual in the population is
subjected is estimated by assuming the effective doses from all the relevant exposure
pathways. Some of the inputs in the exposure assessments depend on living habits of
people, e.g rate of water consumption, and fraction of time spent indoors (occupancy
factor). Such inputs are estimated from available records or from experience through
observations. Other inputs, either that could not be easily estimated or that do present
spatial variability, are adopted from recommendations of the United Nations Scientific
Committee on the Effects of Atomic Radiation (UNSCEAR) and International
Commission on Radiological Protection (ICRP). Examples of the latter include the
fraction of radionuclide intake that gets into the blood stream and the quality factors of
different types of radiation. Doses from external exposures to cosmic radiation have
been estimated from measured and calculated ionization density and neutron flux
density. Shamos et al., (1966) measured ionization density of cosmic rays at sea level to
be 2.18 ion pairs per second per cm3, while Lodwer and Beck (1966) obtained 2.1 ion
pairs per second per cm3. O’Brien used specially designed computer codes and obtained
2.16 ion pairs per second per cm3. UNSCEAR adopted 2.1 ion pairs per second per cm3
and assuming a mean energy per ion pair formation in air of 33.7 eV, estimated the
annual effective dose in air at sea level to be 0.24 mSv.
13
Biehl et al., (1998) studied the effects of geomagnetic latitudes on the total cosmic ray
found that the ratio of latitude effects at low geomagnetic latitudes to those at higher
latitudes is roughly 65:100. Spatial variations of cosmic rays with altitude and latitude
have also been reported in the works of and Merker et al., (1973). The annual effective
dose due to neutron component at sea level was estimated to be 0.021 mSv (UNSCEAR
Report; 1998). This value was arrived at by adopting a neutron flux density at sea level
of 0.008 cm-2s-1, a conversion factor for the neutron flux density to the dose rate of
5 × 10⁻⁸ Gyh-1cm2, and a quality factor of 6 for neutrons. The neutron component was
reviewed to 0.036 mSv (UNSCEAR Report; 1998) in accordance with changes in the
radiation weighting factor of neutron.
Doses received from external exposure to terrestrial gamma-rays have been estimated
using different techniques. Some of the earliest in-situ measurements include the use of
gross gamma-ray counting and use of gamma-ray spectrometry by Lowder et al., (1966).
Solon et al., (1980) measured the same quantity with thermoluminescent dosimeters
(TLD).
In order to estimate internal dose caused by intake of a particular radionuclide, the level
and distribution of the activity in the body (body burden) must be known. One of the
methods that have been used to determine body burden of gamma emitters is in vitro
whole-body gamma-ray counting or spectrometry. Levels and distribution of
radionuclides in the body have also been determined in vitro by assaying samples of
organs; tissues; body wastes like urine, faeces and breath; and environmental materials
like food, water and air (Mustapha A.O 1999). Internal doses estimated from
14
concentrations of radionuclides in materials have some inherent limitation. The accuracy
depends on the preliminary efforts made to ensure that the materials being monitored are
the only route of intake of the radionuclide concerned.
1.2.2 Soapstone
Soapstone is a metamorphic rock largely composed of the mineral talc and is rich in
magnesium. It is produced by dynamothermal metamorphism and metasomatism which
occurs at areas where tectonic plates are subducted, changing rocks by heat and pressure,
with influx of fluids but without melting. The rock may feel soapy when touched, hence
the name soapstone. Soapstone has been a medium for carving for thousands of years
(Wikipedia.org/wiki/soapstone. 2009).
Soapstone is mined in Kenya at the Tabaka hills of Kisii district in South western
Kenya. The district is mostly hilly and is dissected by rivers flowing west into lake
Victoria. Most of the mining is done by men. These men are paid per kilogram of rock
that is removed. The stone is mined using hoes, pangas, pick axes, shovels and iron rods.
The men essentially dig pits of approximately 5 m to 30 m deep and diameter 50 m to 75
m into the ground to excavate the soapstone. No machinery is used. Once excavated, the
pits are refilled by manual labour so that new soapstone begins to form and can again be
excavated after 5-10 years.
15
Once excavated, the soapstone is mainly used in carving. Its softness makes it ideal for
this purpose. Carving is done using chisels and hand tools such as hoes and knives. After
curving the product is polished using sand papers of different grades to achieve a smooth
surface that is ready to be painted and dyed. The coloring and dyeing is usually done by
women. The porous nature of the stone allows it to easily accept dyes and colors. The
product is then incised with the patterns that the individual artists wish to obtain.
1.3 GEOLOGY OF TABAKA REGION
Tabaka soapstone quarries are located along Itumbe ridge and also on Sameta hill, some
ten kilometers south-east of Itumbe. On the north side of Sameta hill, the white
soapstone grades upwards through pale slaty-grey to dark blue-grey or almost black
material at the base of the quartzite where it is slabby, with a fair development of white
mica on the parting planes. In the coarse-grained quartzite immediately overlying the
soapstone deposit near Kamagambo on the Kamagambo-Machoge road, there is an
intense development of small pyrite cubes, up to 6mm across. In the same locality, the
basalts bounding the soapstone laterally appear to have been almost completely replaced
by red oxides of iron. On the North side of Itumbe hill, the white soapstone grades
upwards through pale gray to dark blue material at the base of the quartzite. The normal
soapstone is white and often iron stained particularly along irregular cracks and joint
planes, and is soft, dense and extremely fine grained. Certain types have a pale greenish
tinge.
16
Generally the area under investigation is characterized by a rugged topography due to
the presence of several mountains of different elevation above sea level. The younger
granites represent the highest elevation while the older rocks are relatively low.
Climatically the area receives a good amount of rain well distributed throughout the
year. It has fertile soils which the locals have put into subsistence farming (Huddleston,
A 1951).
1.4 PROBLEM STATEMENT
Mining has always been associated with the exposure of radionuclides and heavy toxic
elements contained in the mineral ores to the surface of the earth due to disposal of a
large amount of tailings (Dudka and Adriano, 1997). At Tabaka soapstone quarries, the
mined rock may expose radionuclides and heavy toxic elements. This could expose
soapstone quarry workers to health effects caused by terrestrial ionizing radiation
sources in the rocks. There is therefore a need to carry out a radiological study at the
quarries.
1.5 OBJECTIVES
1.5.1 Main Objective
The main objective was to investigate naturally occurring radioactive elements and
exposure levels to ionizing radiation at the Tabaka soapstone quarries in Kisii district of
Kenya.
17
1.5.2 Specific Objectives
The specific objectives were to:
1. determine the levels of naturally occurring radio-nuclides (40K,
226
Ra and
232
Th)
and their activity concentrations in soapstone quarries of Tabaka in Kisii district.
2. measure the absorbed dose rate in air at the Tabaka quarries.
3. determine the absorbed dose in air and the effective dose rate to workers at the
soapstone quarries.
4. determine the internal and external hazard indices.
1.6 JUSTIFICATION
No research has been done on the presence and distribution of radionuclides in Tabaka
soapstone quarries. The results of this research are expected to form a data bank for
exposure levels to the quarry workers and to the public within the vicinity of the
soapstone quarries. This will generate a baseline database for future researchers in
naturally occurring radioactive elements. It will also provide useful information for
national and local authorities for decision making. This will boost the ongoing collection
of relevant data required for setting up local radiological standards, guidelines and if
need be legal notices. The study will also shed light on the health implications of chronic
exposures to high background radiation by the soapstone artisans and inhabitants of
quarry neighbourhoods.
18
CHAPTER TWO
2.0 NATURAL RADIOACTIVITY
2.1 THEORY OF NATURAL RADIOACTIVITY
Radionuclides are found naturally in air, water and soil. Every day, we ingest and inhale
radionuclides in air, food and water. Natural radioactivity is common in the rocks and
soil that make up the planet, in water and oceans, and in building materials. There is
nowhere on earth that natural radioactivity cannot be found (Al-Sulait, et al., 2008).
Radioactive elements are often called radioactive isotopes or radionuclides or just
radionuclides. There are over 1,500 different radioactive nuclides. The most commonly
encountered radionuclides are
238
U,
235
U, and their subsequent decay products and
40
K
(Matiullah, et al., 2004: Ahmad, et al., 1997).
Human activities such as mining, medical diagnostic and therapeutic procedures,
mineral processing, nuclear power generation etc, may lead to increased exposure to
naturally occurring radioactive elements called Technologically Enhanced Naturally
Occurring Radioactive Elements (TENORE) (Juhaŝz et al., 2005). TENORE is defined
as exposures to truly natural sources of radiation which could not occur without some
technological activities not originally designed to produce radiation. These activities
have led to a large number of workers being exposed to ionizing radiations. According
to (UNSCEAR, 2008) report, about 22.8 million workers are exposed to ionizing
radiation with about 13 million being exposed to natural sources and about 9.8 million to
19
artificial sources. However due to the rapid increase in human activities this number is
tremendously increasing.
International guidelines and directives for dealing with exposure due to naturally
occurring radioactive elements exist though only a few countries have adopted them and
made regulations for the acceptable limits of exposure for workers and the general
public (ICRP, 2000; NCRP, 1993). The European Atomic Energy Community
(EURATOMEC, 2002) and International Atomic Energy Agency (IAEA, 2004) also
recommended exemption levels in activity concentrations for substances containing
NORE. Based on the risk factors the ICRP has published recommendations for dose
limits for the general public. For the general public, the acceptable annual effective dose
limit is 1mSv per year (ICRP, 2000).
The other natural components of background radiation include cosmic rays and radiation
from cosmogenic radionuclides. Cosmic radiation is divided into two types, primary and
secondary. Primary cosmic radiation is made up of extremely high energy particles
(above 1018 eV), and are mostly protons, with some larger particles. A large percentage
of it comes from outside of the solar system and is found throughout space. Some of the
primary cosmic radiation is from the sun, produced during solar flares. Little of the
primary cosmic radiation penetrates the earth's surface, the vast majority of it interacts
with the atmosphere. When it does interact, it produces the secondary cosmic radiation
that gets to the earth. These reactions produce other lower energy radiations in the form
20
of photons, electrons and neutrons that make it to the earth’s surface. The atmosphere
and the earth's magnetic fields act as shields against cosmic radiation, reducing the
amount that reaches the earth's surface.
The annual dose received from cosmic radiation depends partly on latitude and altitude.
The latitude effect is due to the charged particle nature of the primary cosmic rays.
When the primary cosmic rays come near the earth, its magnetic field tends to deflect
the rays away from the equator and lower latitudes and the deflection reduces toward the
poles (UNSCEAR, 2000; Rasolonjatovo et al., 2002). For example at latitudes lower
than 480 51’ 29’’ North or South of the equator, the average external dose from cosmic
radiation is 305 μSvy-1 and approximately greater than 350 μSvy-1 at latitudes higher
than 480 51’ 29’’ North and South of the equator. The average values also increase from
340 μSvy-1 at sea level to 460 μSvy-1 at
1000 m above sea level (UNSCEAR, 2000;
Rasolonjatovo et al., 2002). From cosmic radiation in the U.S, the average person will
receive a dose of 27 mrem per year and this roughly doubles every 2,000 m increase in
elevation. There is only about a 10% decrease at sea level in cosmic radiation rates when
going from pole to the equator, but at 18,000 m the decrease is 75%. This is because of
the effect of the earth's and the Sun's geomagnetic fields on the primary cosmic
radiations. Flying can add a few extra mrem to the annual dose, depending on the
frequency, duration and height of flying.
Terrestrial radionuclides, are believed to have been produced when matter of which the
universe is formed came into existence several billion years ago (Cox, 1995). The earth
then, probably contained a large number of radioactive elements than they are at present.
21
The short-lived radioactive elements decayed leaving only those with half-lives
comparable to the estimated age of the earth (4.6 billion years) (AGI/NAGT, 1990). The
most important of these are 40K (half-life = 1.28 × 10⁹y), 87Rb (half-life = 4.7 × 10¹⁰y),
232
Th (half-life = 1.41 × 10¹⁰y) and
238
U (half-life = 4.47 × 10⁹y). The terrestrial
component of the natural background radiation is dependent on the composition of soils
and rock which typically contain natural radionuclides. Determination of soil
radioactivity is essential for understanding changes in the natural radiation background
(Tzortzis et al., 2004). Soil generally contains small quantities of the radioactive
elements, uranium and thorium along with their progeny. Primodial radionuclides of
external radiation are
238
U and
232
Th series and
40
K. Although
235
U exists in soils, it
accounts for very small quantities in the human body.
2.2 RADIOACTIVE EMISSIONS
During radioactive decay, three ionizing radiations namely alpha particles, beta particles
and gamma rays are emitted. An alpha particle is essentially a helium nucleus, which
consists of two neutrons and two protons, giving it a net positive charge. Due to its
relatively high mass, alpha particles are the most destructive form of ionizing radiation,
but penetration is low. A piece of paper stops alpha particles, whereas the lighter beta
particles require an aluminum barrier. Alpha particles are emitted from various
radioactive substances. Because alpha particles have such low penetrating force, they are
stopped by human skin, presenting little danger unless the source is swallowed. Other
known alpha emitters include americium, radium, radon gas, and uranium. When
22
coupled together with certain other radioactive substances, alpha emitters can agitate
neutron emitters to release the neutrons. Neutron emission is a critical part of nuclear
reactor and nuclear weapons design.
The beta particle is a high-speed electron or positron released from a degenerating
radioactive nucleus. Beta particles are caused by emission of excess neutrons in the
atomic nucleus. When there are significantly more neutrons than protons in a nucleus,
the neutrons degenerate into protons and electrons, which are ejected from the nucleus at
high speeds. This increases the atomic number of the atom and also its stability. Beta
emitters include strontium-90, potassium-40, technetium-99, tritium, and carbon-14.
Beta particles have equivalent properties to electrons, but much higher energies than
typical electrons orbiting the nucleus. Though beta particles are not themselves
radioactive, they cause damage by breaking chemical bonds and creating ions which do
damage to tissues. Being of medium-energy and low mass, beta particles are one of the
least damaging forms of radiation. Like other radioactive substances, beta particle
emitters are used in radioisotope thermoelectric generators, used to power space probes.
Gamma rays (denoted as γ) are electromagnetic radiation of high frequency. Gammarays have the smallest wavelengths and the most energy of any other wave in the
electromagnetic spectrum. They are produced by sub-atomic particle interactions such as
electron-positron annihilation, neutral pion decay, radioactive decay, fusion, fission or
inverse Compton scattering in astrophysical processes. Gamma rays typically have
frequencies above 1019 Hz, and therefore have energies above 100 keV and wavelength
23
less than 10 picometers, often smaller than an atom. Gamma radioactive decay photons
commonly have energies of a few hundred keV, and are almost always less than 10 MeV
in energy. Because they are a form of ionizing radiation, gamma rays can cause serious
damage when absorbed by living tissue and, are therefore a health hazard.
In the past, the distinction between X-rays and gamma rays was based on energy (or
equivalently frequency or wavelength), the latter being considered a higher-energy
version of the former. However, high-energy X-rays produced by linear accelerators
("linacs") and astrophysical processes now often have higher energy than gamma rays
produced by radioactive gamma decay. In fact, one of the most common gamma-ray
emitting isotopes used in nuclear medicine, technetium-99m, produces gamma radiation
of about the same energy (140 KeV) as produced by a diagnostic X-ray machine, and
significantly lower energy than the therapeutic treatment X-rays produced by linac
machines in cancer radiotherapy. Because of this overlap in energy ranges, the two types
of electromagnetic radiation are now usually defined by their origin: X-rays are emitted
by orbital electrons, while gamma rays are specifically emitted by the nucleus (that is,
produced by gamma decay). In certain fields such as astronomy, gamma rays and X-rays
are still sometimes defined by energy, as the processes which produce them may be
uncertain (Frank, H. 2004).
24
2.2.1 Gamma Ray Production
Gamma rays are often produced alongside other forms of radiation such as alpha or beta
particles. When a nucleus emits an α-particle or β-particle, the daughter nucleus is
sometimes left in an excited state. It can then jump down to a lower energy state by
emitting a gamma ray as illustrated in Figure 2.1, in much the same way that an atomic
electron can jump to a lower energy state by emitting infrared, visible, or ultraviolet
light.
226
Ra
4.59 MeV α- particle
222
Rn*
0.19 MeV γ-ray
222
Rn
Figure 2.1 Illustration of a decay scheme of 226Ra
Gamma rays, x-rays, visible light, and radio waves are all forms of electromagnetic
radiation. The difference is the frequency and hence the energy of the photons. Gamma
rays are the most energetic.
25
2.2.2 Units of Measurement and Exposure
Measurement of gamma rays' ionizing ability is called the exposure. The effects of
gamma rays and other ionizing radiation on living tissue are more closely related to the
amount of energy deposited. This is called the absorbed dose.
The gray (Gy), which has units of (J/kg), is the SI unit of absorbed dose, and is the
amount of radiation required to deposit 1 joule of energy in 1 kilogram of any kind of
matter. The rad is the corresponding traditional unit (obsolete), equal to 0.01 J deposited
per kg. 100 rad = 1 Gy.
The equivalent dose is the measure of the biological effect of radiation on human tissue.
For gamma rays it is equal to the absorbed dose. The sievert (Sv) is the SI unit of
equivalent dose, which for gamma rays is numerically equal to the gray (Gy). The rem is
the traditional unit of equivalent dose. For gamma rays it is equal to the rad or 0.01 J of
energy deposited per kg. 1 Sv = 100 rem.
2.2.3 Interaction of Gamma Rays with Matter
Detection of gamma rays cannot occur until they interact with matter. There are several
mechanisms by which gamma rays interact with matter. However, only three of these
processes play an important role in radiation measurement and dosimetry: photoelectric
absorption, Compton or inelastic scattering and pair production. All these result to either
partial or complete transfer of the photon energy to electron energy leading to either
complete disappearance of the gamma ray or it is scattered through a significant angle
26
(Knoll, 1988). Figure 2.2 shows the relative dominance of the photon interaction
processes in matter.
Figure 2.2: The relative dominance of the photon interaction processes in matter
(Frank, H. 2004).
When a gamma ray passes through matter, the probability for absorption in a thin layer
is proportional to the thickness of that layer. This leads to an exponential decrease of
intensity with thickness. The exponential absorption holds only for a narrow beam of
gamma rays. If a wide beam of gamma rays passes through a thick slab of concrete the
scattering from the sides reduces the absorption.
(1)
27
Here μ = nσ is the absorption coefficient, measured in cm−1, n the number of atoms per
cm3 in the material, σ the absorption cross section in cm2 and d the thickness of material
in cm.
2.2.3.1 Photoelectric Absorption
When a surface is exposed to electromagnetic radiation above a certain threshold
frequency (typically visible light for alkali metals, near ultraviolet for other metals, and
extreme ultraviolet for non-metals), the radiation is absorbed and electrons are emitted.
Photoelectric absorption takes place with photons with energies from about a few
electron volts to over 1 MeV.
A gamma ray may interact with a bound electron in such a way that it looses all its
energy to the target electron and the electron is ejected from the atom as illustrated in
Figure 2.3.
28
K - shell
An electron falls to occupy
the vacancy left in the
K-shell
Ejected electron
vacancy
Incident γ -ray
M- shell
Orbital electron
L - shell
Figure 2.3: Illustration of the photoelectric absorption process
Some of the energy is used to overcome the electron binding energy and most of the
remainder appear as kinetic energy of the ejected electron. A very small amount of recoil
energy remains with the atom to conserve momentum. The probability of photoelectric
absorption taking place depends on the gamma-ray energy, the electron binding energy
and the atomic number of the atom. This probability is greater for most tightly bound
29
electrons. Therefore the K electrons are the most affected. The probability of
photoelectric absorption is given by equation (Malace, A., et al., 1996)
Z4
E3
(2)
The energy of the electron released by the interaction is the difference between the
gamma-ray energy E and the electron binding energy Eo.
ΔE = E – Eo
(3)
The electron binding energy is not lost but appears as the characteristic x-rays emitted in
coincidence with the photoelectron. In most cases, these x-rays are absorbed in the
detector in coincidence with the photoelectron and the resulting output pulse is
proportional to the total energy of the incident gamma-ray.
2.2.3.2 Compton Scattering
Compton scattering is a type of scattering that x-rays and gamma-rays undergo in
matter. The scattering of photons in matter results in a decrease in energy (increase in
wavelength) of an x-ray or gamma-ray photon. This effect is called the Compton effect.
Part of the energy of the x-or gamma- ray is transferred to a scattering electron, which
recoils and is ejected from its atom, and the rest of the energy is taken by the scattered,
photon.
30
Scattered photon
Direction of incidence
Incident photon
Recoil photon
Figure 2.4: Illustration of the Compton effect
A photon of wavelength λ comes in from the left, collides with a target at rest, and a
scattered photon of wavelength λ′ emerges at an angle θ (Fig 2.4).
Compton derived the relationship between the shift in wavelength and the scattering
angle:
(4)
where
λ is the wavelength of the incident photon,
λ′ is the wavelength of scattered photon,
h is the Planck constant,
me is the mass of the electron,
c is the speed of light in a vacuum, and
θ is the scattering angle.
31
The quantity h/mec is known as the Compton wavelength of the electron; it is equal to
2.43×10⁻¹² m. The wavelength shift λ′ − λ is at least zero (for θ = 0°) and at most twice
the Compton wavelength of the electron (for θ = 180°).
Compton scattering is an important effect in gamma spectroscopy. It gives rise to the
Compton edge, as it is possible for the gamma rays to scatter out of the detectors used.
2.2.3.3 Pair Production
Pair production refers to the creation of an elementary particle and its antiparticle
usually from a photon. It occurs when a high-energy photon interacts in the vicinity of a
nucleus, allowing the production of an electron and a positron pair without violating
conservation of momentum as illustrated in Fig 2.5. The minimum photon energy for
pair production in the vicinity of a nucleus is hv ≥ 1.022MeV or twice the rest mass
energy of an electron.
Figure 2.5: Illustration of the pair production process
32
2.3 EFFECTS OF IONIZING RADIATION ON CELLS
The human body is made up of many organs, and each organ of the body is made up of
specialized cells. Ionizing radiation can potentially affect the normal operation of these
cells. Ionizing radiation absorbed by human tissue could have enough energy to remove
electrons from the atoms that make up molecules of the tissue. When the electron that
was shared by the two atoms to form a molecular bond is dislodged by ionizing
radiation, the bond is broken and thus, the molecule falls apart. The following are
possible effects of radiation on cells:
Ionization may form chemically active substances which in some cases alter the
structure of the cells. These alterations may be the same as those changes that occur
naturally in the cell and may have no negative effect. Some ionizing events produce
substances that are not normally found in the cell. These can lead to a breakdown of the
cell structure and its components. Cells can repair the damage if it is small. If a damaged
cell needs to perform a function before it has had time to repair itself, it will either be
unable to perform the function or perform the function incorrectly or incompletely. The
result may be cells that cannot perform their normal functions or that are damaging to
other cells. These altered cells may be unable to reproduce themselves or may reproduce
at an uncontrolled rate. Such cells can be the underlying causes of cancers. If a cell is
extensively damaged by radiation, or damaged in such a way that reproduction is
affected, the cell may die. Radiation damage to cells may depend on how sensitive the
cells are to radiation. All cells are not equally sensitive to radiation damage. In general,
33
cells which divide rapidly and/or are relatively non-specialized tend to show effects at
lower doses of radiation than those which are less rapidly dividing and more specialized.
Examples of the more sensitive cells are those which produce blood.
Potential biological effects depend on how much and how fast a radiation dose is
received. Radiation doses can be grouped into two categories, acute and chronic dose.
An acute radiation dose is defined as a large dose (10 rad or more, to the whole body)
delivered during a short period of time (on the order of a few days at the most). If large
enough, it may result in effects which are observable within a period of hours to weeks.
Acute doses can cause a pattern of clearly identifiable symptoms (syndromes). These
conditions are referred to in general as Acute Radiation Syndrome. Radiation sickness
symptoms are apparent following acute doses of 100 rad and above. Acute whole body
doses of above 450 rad may result in a statistical expectation that 50% of the population
exposed will die within 60 days without medical attention. As in most illnesses, the
specific symptoms, the therapy that a doctor might prescribe, and the prospects for
recovery vary from one person to another and are generally dependent on the age and
general health of the individual. Some of the effects of acute radiation dose are;
a) Blood-forming organ (Bone marrow) syndrome occurs at doses that are more
than100 rad is characterized by damage to cells that divide at the most rapid pace
such as bone marrow, the spleen and lymphatic tissue. Symptoms include internal
bleeding, fatigue, bacterial infections, and fever.
34
b) Gastrointestinal tract syndrome occurs at radiation doses that are above 1000 rad and
is characterized by damage to cells that divide less rapidly such as the linings of the
stomach and intestines. Symptoms include nausea, vomiting, diarrhea, dehydration,
electrolytic imbalance, loss of digestion ability, bleeding ulcers, and the symptoms
of blood-forming organ syndrome.
c) Central nervous system syndrome occurs at radiation doses that are more than 5000
rad and is characterized by damage to cells that do not reproduce such as nerve cells.
Symptoms include loss of coordination, confusion, coma, convulsions, shock, and
the symptoms of the blood forming organ and gastrointestinal tract syndromes.
Other effects from an acute dose include: 200 to 300 rad to the skin can result in the
reddening of the skin, similar to a mild sunburn and may result in hair loss due to
damage to hair follicles.
125 to 200 rad to the ovaries can result in prolonged or permanent suppression of
menstruation in about fifty percent (50%) of women. 600 rad to the ovaries or testicles
can result in permanent sterilization. 50 rad to the thyroid gland can result in benign
(non cancerous) tumors. As a group, the effects caused by acute doses are called
deterministic. This means that severity of the effect is determined by the amount of dose
received.
A chronic dose is a relatively small amount of radiation received over a long period of
time. The body is better equipped to tolerate a chronic dose than an acute dose. The
35
body has time to repair damage because a smaller percentage of the cells need repair at
any given time. The body also has time to replace dead or non-functioning cells with
new, healthy cells. This is the type of dose received as occupational exposure. The
biological effects of high levels of radiation exposure are fairly well known, but the
effects of low levels of radiation are more difficult to determine because the
deterministic effects do not occur at these levels. The risks for these effects are not
directly measurable in populations of exposed workers, therefore the risk values at
occupational levels are estimates based on risk factors measured at high doses. To make
these estimates, a relationship between the occurrence of cancer at high doses and the
potential for cancer at low doses are used. Since the probability for cancer at high doses
increases with increasing dose, this relationship is assumed to hold true with low doses.
This type of risk model is called stochastic.
Somatic effects appear in the exposed person while genetic effects appear in the future
generations of the exposed person as a result of radiation damage to the reproductive
cells. They may be divided into two classes namely prompt somatic effects and delayed
somatic effects based on the rate at which the dose was received. Prompt somatic effects
are those that occur soon after an acute dose (typically 10 rad or more to the whole body
in a short period of time). One example of a prompt effect is the temporary hair loss
which occurs about three weeks after a dose of 400 rad to the scalp. New hair may to
grow within two months after the dose, although the colour and texture may be different.
Delayed somatic effects are those that occur years after radiation doses are received.
Among the delayed effects is an increased potential for the development of cancer.
36
Since a fetus is especially sensitive to radiation, (fetus cells are rapidly dividing) special
considerations are given to pregnant workers particularly in the first 20 weeks of
pregnancy. Limits are established to protect the fetus from any potential effects which
may occur from a significant amount of radiation. This radiation exposure may be the
result of exposure to external sources of radiation or internal sources of radioactive
material. Potential effects associated with prenatal radiation doses include: growth
retardation, small head/brain size, mental retardation and childhood cancer. At present
occupation dose limits, the actual probability of any of these effects occurring in the
fetus from occupational exposure of the mother is small (UNSCEAR, 2008).
2.3.1 Health Effects of Gamma Rays
All ionizing radiation causes similar damage at a cellular level, but because alpha and
beta rays are relatively non-penetrating, external exposure to them causes only localized
damage, e.g. radiation burns to the skin. Gamma rays and neutrons are more penetrating,
causing diffuse damage throughout the body (e.g. radiation sickness, increased incidence
of cancer) rather than burns. External radiation exposure should also be distinguished
from internal exposure, due to ingested or inhaled radioactive substances, which,
depending on the substance's chemical nature, can produce both diffuse and localized
internal damage. The most biological damaging forms of gamma radiation occur in the
gamma ray window, between 3 and 10 MeV, with higher energy gamma rays being less
harmful because the body is relatively transparent to them (Rothkamm, K 2003).
37
Shielding from gamma rays requires large amounts of mass. They are better absorbed by
materials with high atomic numbers and high density, although neither effect is
important compared to the total mass per area in the path of the gamma ray. For this
reason, a lead shield is only modestly better (20-30%) as a gamma shield than an equal
mass of another shielding material such as aluminum, concrete, or soil; the lead's major
advantage is in its compactness.
The higher the energy of the gamma rays, the thicker the shielding required. Materials
for shielding gamma rays are typically measured by the thickness required to reduce the
intensity of gamma rays by one half (the half-value-layer or HVL). For example gamma
rays that require 1 cm of lead to reduce their intensity by 50% will also have their
intensity reduced in half by 4.1 cm of Granite rock, 6 cm of concrete, or 9 cm of packed
soil. However, the mass of this much concrete or soil is only 20-30% larger than that of
this amount of lead. Depleted uranium is used for shielding in portable gamma ray
sources, but again the savings in weight over lead is modest, and the main effect is to
reduce shielding bulk.
Gamma radiation is often used to kill living organisms, in a process called irradiation.
Applications of this include sterilizing medical equipment (as an alternative to
autoclaves or chemical means), removing decay-causing bacteria from many foods or
preventing fruit and vegetables from sprouting to maintain freshness and flavour. Due to
their tissue penetrating property, gamma rays have a wide variety of medical uses such
as in CT scans and radiation therapy. However, as a form of ionizing radiation they have
38
the ability to effect molecular changes, giving them the potential to cause cancer when
DNA is affected. The molecular changes can also be used to alter the properties of semiprecious stones, and is often used to change white topaz into blue topaz. Despite their
cancer-causing properties, gamma rays are also used to treat some types of cancer. In the
procedure called gamma-knife surgery, multiple concentrated beams of gamma rays are
directed on the growth in order to kill the cancerous cells. The beams are aimed from
different angles to concentrate the radiation on the growth while minimizing damage to
the surrounding health tissues. Gamma rays are also used for diagnostic purposes in
nuclear medicine. Several gamma-emitting radioisotopes are used, one of which is
technetium-99m. When administered to a patient, a gamma camera can be used to form
an image of the radioisotope's distribution by detecting the gamma radiation emitted
from the target organs of the body. Such a technique can be employed to diagnose a
wide range of conditions (e.g. spread of cancer to the bones).In the US, gamma ray
detectors are used as part of the Container Security Initiative (CSI). The objective of this
technique is to screen merchant ship containers before they enter US ports.
2.4 GAMMA RAY DETECTORS
These detectors are either the scintillation type or the semiconductor type. In scintillation
detectors, primary electrons produced by the gamma-ray interaction raise secondary
electrons to the conduction band, leaving holes in the valence band. In some cases the
energy given to the electron may not be quite sufficient to raise it to the conduction
band. The electron will therefore fall back to the valence band emitting electromagnetic
39
radiation. If this radiation is in or near optical wavelengths, it can be detected by a
photomultiplier or other light measuring devices to provide the detector signal. This is
the basis of the scintillation detector.
A good scintillation material has a reasonable number of electron-hole pairs produced
per unit gamma-ray energy, high atomic number, is transparent to the emitted light, a
short decay time of the excited state to allow high count rates and a refractive index that
is near that of glass (1.5) to permit efficient coupling to photomultipliers. Materials that
have found particular application for gamma-ray measurements are, sodium iodide,
cesium iodide, cesium fluoride and bismuth germinate. The most commonly used
scintillator material is sodium iodide because it is cheap and readily available.
A semiconductor is a material whose conductivity lies between that of insulators and
conductors. In an insulator, the valence band is full and the next available energy states
are in a higher band called the conduction band, separated by a wide forbidden region.
Electrons are not able to jump across this forbidden region hence the material cannot
conduct. In a conductor, the valence and conduction bands overlap, hence electrons
easily move from the valence band to the conduction band. In semiconductors, the
forbidden gap is narrow. When electrons in the valence band of a semiconductor are
thermally excited, they are able to jump across the forbidden region to the conduction
band. This is the basis of the semiconductor gamma-ray detector.
40
A good semiconductor detector material has a high atomic number and provides as many
electron-hole pairs as possible per unity energy. It also allows good electron and hole
mobility, is available in high purity as near perfect single crystals and is available in
reasonable amounts at reasonable cost. Some of the semiconductors that meet the
requirements include silicon and germanium. The disadvantage of silicon over
germanium is its lower atomic number, which means that in practice it is only used in
measurement of low energy photons. Detectors based on silicon are in routine use in xray spectrometry.
Germanium is by far the most common gamma-ray detector material. Its higher atomic
number than silicon makes it practicable to use for detection of higher energy gamma
radiation. The germanium detector may be thought of as being like a solid ionization
chamber, it has a p-n diode structure in which the intrinsic region is created by depletion
of charge carriers when a reverse bias is applied across the diode. When photons interact
with the depletion region, charge carriers (holes and electrons) are freed and are swept to
their respective collecting electrodes by the electric field. The detector configurations
ensure that an electric field is present throughout the active volume so that both charge
carriers feel electrostatic forces that cause them to drift in opposite directions. The
motion of either the electrons or holes constitutes a current that will persist until those
carriers are collected at the boundaries of the active volume. The resultant charge is
41
integrated by a charge sensitive preamplifier and converted to a voltage pulse with
amplitude proportional to the original photon energy.
Due to the small band gap (0.7 eV); room- temperature operation of germanium
detectors of any type is impossible because of the large thermally induced leakage
current that would result. Instead, germanium detectors must be cooled to reduce the
leakage current to the point that associated noise does not spoil their excellent energy
resolution. Normally the temperature is reduced to 77 K through the use of an insulated
Dewar in which a reservoir of liquid nitrogen is kept in thermal contact with the detector
as illustrated in Fig 2.6.
42
C
Figure 2.6: Illustration of germanium detectors in liquid nitrogen dewars (Khan H. et al., 1993)
2.4.1 Energy Resolution
Resolution is a measure of the width (full width at half maxima) of a single energy peak
at a specific energy, either expressed in absolute keV (as with germanium detectors), or
as a percentage of the energy at that point (sodium iodide detectors). Better resolution
enables the system to more clearly separate the peaks within a spectrum.
43
The dominant characteristic of germanium detectors is their excellent energy resolution
when applied to gamma-ray spectroscopy. This allows the separation of many closely
spaced gamma-ray energies, which remain unresolved in the NaI(TI) spectrum.
Consequently, virtually all gamma-ray spectroscopy that involves complex energy
spectra is now carried out with germanium detectors. The increased number of charge
carriers has two beneficial effects on the attainable energy resolution. The statistical
fluctuation in the number of carriers per pulse becomes a smaller fraction of the total as
the number is increased. At low energies the resolution may be limited by electronic
noise.
2.4.2 Detector Efficiency
The efficiency of a detector is a measure of how many pulses occur for a given number
of gamma rays. Various kinds of efficiency definitions are in common use for gamma
ray detectors:
Absolute efficiency: The ratio of the number of pulses produced by the detector to the
number of gamma-rays emitted by the source (in all directions). Intrinsic efficiency: The
ratio of the number of pulses produced by the detector to the number of gamma-rays
striking the detector.
Relative efficiency: Efficiencies of one detector relative to another. Full energy peak
(photo peak) efficiency: The efficiency for producing full energy peak pulses only,
rather than a pulse of any size for the gamma ray. To be useful, the detector must be
capable of absorbing a large fraction of gamma ray energy.
44
Gamma-ray spectrometry of naturally occurring radioactive elements is difficult for a
number of reasons. First, the activity levels are low and if statistically significant results
are to be obtained, there is need for long count periods. The second reason is that most
gamma-spectrometer devices are not able to block background counts due to
radionuclides in the surroundings of the detector. Therefore the activity in the sample
itself must be detected on top of all that background activity. In many cases it will be
necessary to make a peaked background correction in addition to the normal continuum
subtraction. Semiconductor detectors like germanium detectors that overcome the two
challenges have been designed (Gordon, 2008).
45
CHAPTER THREE
3.0 MATERIALS AND METHODS
3.1 SAMPLE COLLECTION
The rock and soil samples were collected from Nyatike location, Bomanyara and
Bomware
sub locations of Tabaka region. At Bomanyara, samples were collected
from two quarries, one owned by Samson Orenge and the other by Peter Nyaberi. At
Bomware samples were collected from three quarries, two named after their owners
Joshua Ouma and Reuben Barongo and a third one called British quarry (Fig 3.1).
Samples could not be collected at the same depths in each quarry because soapstone was
not occurring at the same levels for all the quarries. A total of 14 samples were collected
from the five quarries (Table 3.1).
Table 3.1: Quarry identity and sample type collected
Quarry name
Orenge
Sample type showing depth Rock 5m
at which it was collected
Nyaberi
Ouma
Barongo
British
Rock 4m Rock 8m Rock 8m
Rock 15m
Rock 3m
Rock 7m Rock 4m Rock 4m
Rock 1m
Soil 0.3m
Soil 1m
46
Soil 0.3m Soil 0.3m
Figure 3.1: The occurrence of Kisii Soapstone in Tabaka area
47
(a)
(b)
(c)
(d)
Plate 3.1: Four selected quarries showing (a) Ouma’s quarry, with the Pink colour
clearly showing the soapstone rock, (b) British quarry, showing a refilled
section behind the worker, (c) an abandoned quarry and (d) Orenge’s quarry,
showing the hand tools that are used to extract the rock
48
3.2 SAMPLE PREPARATION
After collection, the rock and soil samples were separately crushed into powder form
and sieved through a 0.6 mm mesh sieve. They were then dried in an oven at 800C for 24
hours, completely removing water from the samples. A mass of 200g of each sample
was packed in special gas tight polyethylene plastic containers then closed and tightly
sealed using cellotape. The containers were labeled appropriately and then kept for 30
days. After this period all the decay products in the
232
Th series and
226
Ra sub-series
were in radioactive equilibrium with their daughters. The samples were then taken for
gamma spectrometric analysis at the National Radiation Protection Laboratory (NRPL).
The order of sample preparation is shown in plate 3.2.
49
(a)
(b)
(c)
(d)
(e)
Plate 3.2: The steps and devices for preparation of the rock and soil samples. Shown in
the figure are, (a) samples being crushed using a manual grinding machine,
(b) the 0.6mm wire mesh sieve, (c) crushed samples drying in an oven,
(d) samples packed in labeled polythene bags and (e) a sample placed inside a
hyper pure germanium detector
50
3. 3 ACTIVITY CONCENTRATION MEASUREMENTS
The concentrations of radionuclides (226Ra,
232
Th and
40
K) in each sample were
determined using a high purity germanium (HPGe) gamma ray spectrometer consisting
of a p-type intrinsic germanium coaxial detector (ORTEC model 7450) mounted
vertically. The detector had a relative efficiency of 33 % and full width at half maximum
(FWHM) of 2.0 keV energy resolution for the 1332 keV gamma ray line of
60
Co. The
detector was connected to a Canberra multichannel analyzer (MCA) with apex software,
that allowed data acquisition, display of gamma-spectra, analysis of the gamma-spectra
and storage of the results in memory counters called channels. The MCA was interfaced
with a computer and a printer (Fig 3.2). The detector was housed inside a 10 cm thick
lead shield internally lined with 2 mm Cu foils. This provided an efficient suppression of
background gamma radiation present within the laboratory. To ensure that all nuclides
due to 238U and 232Th were visible in the gamma spectrum, spectral data acquistion time
for the each sample was 12 hours.
Detector
Preamplifier
Amplifier
MCA
Computer
Printer
Figure 3.2: Block diagram of a gamma-ray MCA detection system
51
The activity concentration for each radionuclide in the measured samples was
determined by the net intensity of respective peaks. Equation 5 could also be used to
calculate activity concentration.
Cs
Na
BqKg
pt
1
(5)
Where Cs is the activity concentration, Na is the net count for the gamma ray, ε is the
counting efficiency of the detector, P is the absolute transition probability for gamma
decay per transformation, t is the counting time in seconds and ω is the weight of the
dried sample in kilograms. The analysis of results was performed using Microsoft Excel
software.
Geometric efficiency for soil matrices was determined by a reference soil standard
(International Atomic Energy Agency, IAEA-365) spiked with a series of nuclides (40K,
212
Bi, 212Pb, 214Bi, 214Pb, 137Cs, 228Ac, 234Pa, 235U) with total activity of 2.848 kBqkg-1 as
on the day 02.02.2010 at 11:32:52 am (Table 3.2).
52
Table 3.2: Identified radionuclides for IAEA – 365 soil sample
Nuclide
Absolute emission probability of Energy
name
gamma decay (%)
40
10.67
1460.81
296.00
K
0.005 Activity
0.005
(Bqkg-1)
(keV)
137
Cs
85.12
661.65
2420.00
212
Bi
11.80
727.17
12.10
212
Pb
44.60
238.63
13.40
214
Bi
46.30
609.31
11.90
214
Pb
37.20
351.92
12.70
228
Ac
27.70
911.60
19.50
234
Pa
0.59
1001.03
57.20
235
U
54.00
185.71
5.29
3.4 RADIONUCLIDE IDENTIFICATION REPORTS
The 226Ra activities for samples assumed to be in radioactive equilibrium were estimated
from 214Pb (351.92 keV) and 214Bi (609.31 keV). The gamma-ray energies of 212Bi, 212Pb
and
228
Ac were used to estimate activity of
232
Th. The activity concentrations of
40
K
were measured directly by its own gamma rays (1460.81 keV). Details of the employed
spectroscopic parameters are shown in Table 3.3
53
Table 3.3: Spectroscopic parameters employed for quantification of activity levels
(Tsai, L, et al., 2008)
Element Emitter
nuclide
226
214
Ra
Bi
232
40
Th
K
Half-life of
nuclide
19.90 min
Gamma-ray
Absolute emission probability
energy (keV)
of gamma decay (%)
609.31
46.30
214
Pb
26.80 min
351.92
37.20
212
Bi
60.55 min
727.17
11.80
212
Pb
10.64 h
238.63
44.60
228
Ac
6.25 h
911.60
27.70
1460.81
10.67
1.3 × 10⁹ y
3.5 ABSORBED DOSE
Two approaches were used to estimate the external absorbed doses that result from
deposition of radionuclides in soil surfaces: direct measurements and calculations based
on radionuclide deposition densities.
3.5.1 Measurement of Absorbed Dose Rates In Air
Absorbed dose rates in air were measured 1m above the surface at each quarry using a
hand held survey meter Canberra-radiagem 2000 model (Plate 3.3) with a reading range
of up to 100 µSvh-1. Absorbed dose rates in air in nGyh-1 were computed from the dose
rates in µSvh-1 as measured in the field using the conversion coefficient factor of 0.7
SvGy-1 as recommended by UNSCEAR, 2000.
54
Plate 3.3: Model 2000 Canberra radiagem that was used for measurement of absorbed
dose rates in air
3.5.2 Calculation of Absorbed Dose Rates
Radiation emitted by a radioactive substance is absorbed by any material it encounters.
UNSCEAR (2000) has given the dose conversion factors for converting the activity
concentrations of 226Ra, 232Th and 40K into dose (nGyh-1 per Bqkg-1) as 0.427, 0.662 and
0.043, respectively. Using these factors, the total absorbed dose rate in air is calculated
as given in the equation (6) (UNSCEAR 2000).
D = (0.427CRa + 0.662CTh + 0.043CK) nGyh-1,
(6)
where CRa, CTh and CK are the activity concentrations (Bqkg-1) of radium, thorium and
potassium in soil respectively.
3.5.3 Calculation of Annual Effective Dose
Effective dose is a dosimetric quantity used for comparing health effects of radiation to
the human body. To estimate the annual effective dose (AED), take into account the
conversion coefficient, (0.7 SvGy-1) from the absorbed dose in air to effective dose and
55
the outdoor occupancy factor. The average fraction of time spent indoor and outdoor
(occupancy factors) in Kenya are 0.6 and 0.4 respectively (Mustapha, 1999). The world
average indoor and outdoor occupancy factors are 0.8 and 0.2 respectively (UNSCEAR,
2000).
The effective dose rate in units of mSvy-1 was estimated using the formula (UNSCEAR,
1998);
Effective dose rate =
σ( 8.76× 10⁻⁶)
(7)
where σ = 0.7 SvGy-1 is the conversion coefficient, is absorbed dose rate in nGyh-1 and
= 0.4 is the outdoor occupancy factor in Kenya.
3.5.4 External Hazard Index (Hex)
Radiation exposure due to 226Ra, 232Th and 40K may be external. This hazard, defined in
terms of external hazard index or outdoor radiation hazard index and denoted by Hex,
can be calculated using the equation (Beretka and Mathew 1985):
H ex
CRa
370
CTh
259
CK
4810
(8)
where CRa, CTh and CK are activity concentrations of
in
226
Ra,
232
Th and 40K respectively
Bqkg-1. The value of this index should be less than 1 in order for the radiation
hazard to be considered acceptable to the public (Beretkab and Mathew, 1985).
56
3.5.5 Internal Hazard Index (Hin)
The internal hazard index (Hin) gives the internal exposure to carcinogenic radon and is
given by the formula (Beretkab and Mathew, 1985):
H in
CRa
185
CTh
259
CK
4810
(9)
where CRa, CTh and CK are activity concentrations of
in
226
Ra, 232Th and 40K, respectively,
Bqkg-1. The value of this index should be less than unit in order for the radiation
hazard to have negligible hazardous effects of radon to the respiratory organs of the
public (Beretkab and Mathew, 1985).
57
CHAPTER FOUR
4.0 RESULTS AND DISCUSSION
4.1 GAMMA-RAY SPECTRUM FOR A SOIL SAMPLE
A gamma-ray spectrum of one of the soil samples that were analyzed using HPGe is
shown in Figure 4.1.
Fig 4.1: Typical gamma-ray spectrum of a soil sample measured using HPGe detector.
Based on the spectroscopic parameters employed for quantification (Table 3.3) and the
gamma ray spectra for various samples (Fig 4.1), several radionuclides were identified
in the soil and rock samples as shown in appendix A3.
58
4.2 ACTIVITY CONCENTRATIONS OF RADIONUCLIDES IN THE SAMPLES
Data on activity concentration of radionuclides 226Ra, 232Th and 40K in rock and soil (all
values reported as Bqkg-1) collected from soapstone quarries at Tabaka is given in Table
4.1.
Table 4.1: Activity of radionuclides 232Th, 226Ra and 40K in the measured rock and soil
samples from Tabaka soapstone quarries in Kenya
Quarry
name
Orenge
Nyaberi
Ouma
Barongo
British
Activity concentration (Bqkg-1)
Depth of
point of
collection
of sample (m)
232
0.3
147.70
72.60
587.00
3
84.80
43.10
1780.00
5
38.60
52.20
922.00
4
263.30
75.80
307.00
7
100.20
52.50
1020.00
1
120.80
49.90
887.00
4
93.90
63.30
813.00
8
258.40
360.00
744.00
0.3
15.76
78.20
641.00
4
172.15
61.00
245.00
8
92.70
177.90
1090.00
0.3
210.40
72.70
534.00
1
271.70
82.00
284.00
15
236.50
65.80
403.00
Th
59
226
Ra
40
0.005
K
It can be seen in Table 4.1 that the general activity of
226
Ra and
232
Th in the collected
soil and rock samples were in the range of 43.1-360 Bqkg-1 and 38.6-271.7 Bqkg-1
respectively. There was no particular relationship between activity of the radionuclides
and depth of the point of collection of the sample. This could be attributed to the fact
that there may have been mixing of rock debrils during refilling of the quarries for
formation of new soapstone which is again excavated after 5-10 years.
In all quarries
40
K had the highest activity concentration. Its activity varied widely
between 245 and 1780 Bqkg-1 due to heterogeneous soil characteristics, the lowest being
at Barongo’s quarry and the highest at Orenge’s quarry.
The variation of natural radioactivity levels at different sampling sites was due to the
variation of concentrations of radionuclides in the geological formations. The younger
granites represent the highest elevation while the elevation in older rock is relatively
low. The presence of such high radioactivity in younger granites may be attributed to the
presence of relatively increased amount of accessory minerals such as zircon, iron
oxides, fluorite and other radioactive related minerals. These minerals play an important
role in controlling the distribution of uranium and thorium. Zircon usually contains
uranium and thorium concentration ranging from 0.01% to 0.19% and 1% to 2%
respectively (Cuney et al., 1987). Uranium in iron oxides is trapped by adsorption
(Speer et al., 1981).
A comparison between the average activity concentrations of radionuclides in each
quarry and the world average activity concentrations of the respective radionuclides was
done in Table 4.2. All the average values of activity concentrations of
60
40
K,
226
Ra and
232
Th were higher than the world wide average activity concentrations of 40K, 226Ra and
232
Th which are 400, 35 and 30 Bqkg-1 respectively as reported by UNSCEAR (2000).
Table 4.2: Comparison between average activities of radionuclides in each quarry and
the world average activities of the radionuclides.
Quarry name
Orenge
Radionuclides
232
Th
90.3
30
226
Ra
56.0
35
1096.3
400
40
Nyaberi
Th
181.8
30
226
Ra
64.2
35
663.5
400
Th
157.7
30
226
Ra
157.7
35
814.7
400
K
232
Th
93.5
30
226
Ra
105.7
35
658.7
400
40
British
K
232
40
Barongo
K
232
40
Ouma
Average activity World
average
activity
-1
-1
0.05 (Bqkg )
0.05 (Bqkg )(UNSCEAR,
2000)
K
232
Th
240.0
30
226
Ra
73.5
35
407.0
400
40
K
61
4.3 ABSORBED DOSE RATES
4.3.1 Measured Absorbed Dose Rates
The absorbed dose rates in air measured 1 m above the surface at each quarry are
presented in Table 4.3. These values vary from 480 – 597 nGyh-1, the lowest dose being
experienced at Nyaberi’s quarry and the highest at British quarry. The average measured
absorbed dose rate for the five quarries is 541.4 nGyh-1, which is 9.2 times higher than
the world average value of 60 nGyh-1 (UNSCEAR, 2000).
Table 4.3: Absorbed dose rates measured 1 m above the surface at each quarry
Quarry name
Absorbed dose rates 0.5 (nGyh-1)
Orenge
483
Nyaberi
480
Ouma
557
Barongo
590
British
597
4.3.2 Calculated Absorbed Dose Rates
The absorbed dose rates due to terrestrial gamma rays 1m above the ground were
calculated using equation (6) and were expressed in nGyh-1. Other radionuclides such as
137
Cs,
235
U,
231
Th,
211
Bi and
22
Na were neglected because their contribution to the total
62
dose rates from environmental background is negligible (Kocher and Sjoreen, 1985).
The results of the calculations are presented in Table 4.4.
Table 4.4: Calculated absorbed dose rates (nGyh-1) of the soil and rock samples
Quarry
name
Orenge
Nyaberi
Ouma
Barongo
British
Depth (in m) of
Absorbed dose rate
point of
(nGyh-1)
collection of
232
226
sample
Th
Ra
0.005
40
Total absorbed
dose rate
0.005 (nGyh-1)
K
0.3
97.78
31.00
25.24
154.02
3
56.14
18.40
76.54
151.08
5
25.55
22.29
39.65
87.49
4
174.30
32.34
13.20
219.84
7
66.33
22.42
43.86
132.61
1
79.97
21.31
38.14
139.42
4
62.16
27.90
34.96
125.02
8
171.06
153.72
31.99
356.77
0.3
104.33
33.39
27.56
165.28
4
113.96
26.05
10.54
150.55
8
61.37
75.96
46.87
184.20
0.3
139.28
31.04
22.96
193.28
1
179.86
35.01
12.21
227.08
15
156.56
28.10
17.33
201.99
63
The calculated total absorbed dose rates due to
226
Ra,
232
Th and
40
K in rocks and soils
varied between 87.49 nGyh-1 to 356.77 nGyh-1 as shown in Table 4.4. The computed
average absorbed dose rates in each of the quarries were 130.9, 176.23, 207.07, 166.68
and 207.45
nGyh-1 for Orenge’s, Nyaberi’s, Ouma’s, Barongo’s and British quarries
respectively and were all higher than the world average as illustrated in Figure 4.2. The
calculated average absorbed dose rate (183.79 nGyh-1) for the five quarries was found to
be about 4.3 times higher than the world average (43 nGyh-1) as reported by UNSCEAR
(2000).
Figure 4.2: Comparison of the mean absorbed dose rate for each quarry to the world
average absorbed dose rate.
64
The contribution by each of the radionuclides 226Ra, 232Th and 40K to the total absorbed
dose rate at the quarries were 25% (45.96 nGyh-1), 58% (106.3 nGyh-1) and 17% (31.5
nGyh-1) respectively as illustrated in Figure 4.3.
25%
Radium
Potassium
Thorium
58%
17%
Figure 4.3: The percentage contributions to the total absorbed dose rates due to 232Th,
226
Ra decay products and 40K for rock and soil samples from Tabaka
soapstone quarries.
A comparison between absorbed dose rates at Tabaka soapstone quarries and absorbed
dose rates at other places in the world was done. Details of the comparison are presented
in Table 4.5.
65
Table 4.5: Comparison of absorbed dose rates in Tabaka soapstone quarries with other
areas of the world.
Country
Absorbed
(nGyh-1)
Orisa, India
1925
Mohanty et al., 2004
Ruri hill, Kenya
949
Achola, 2009
Minas, Brazil
220
Malanka et al., 1993
Firtina valley, Turkey
77
Kurnaz et al., 2007
Xiazhuang, China
124
Yang et al., 2005
Eskisehir, Turkey
167
Orgun et al., 2005
Eastern desert, Egypt
488
Arafa, 2004
Tabaka, Kenya
184
Present study
dose
rates
0.5 References
The measured and calculated absorbed dose rates were compared in Table 4.6 and it was
noted that the measured absorbed dose rates in air were much higher than the calculated
absorbed dose rates for all the quarries. The reason for the difference is that the
measured absorbed dose rates included the dose due to cosmic rays while the calculated
absorbed dose rates did not.
66
Table 4.6: Comparison of calculated average absorbed dose rates and measured dose
rates.
Quarry
name
Measured absorbed dose rates
(nGyh-1)
0.5 Calculated average absorbed dose
rates 0.5 (nGyh-1)
Orenge
483
131
Nyaberi
480
176
Ouma
557
207
Barongo
590
167
British
597
207
4.4 EXTERNAL HAZARD INDEX AND INTERNAL HAZARD INDEX
The ultimate use of the measured activities in building materials is to estimate the
radiation dose expected to be delivered externally if a building is constructed using these
materials. To limit the annual external gamma-ray dose to 1 mSvy-1 (ICRP, 2000), the
external hazard index was calculated using equation (8). Results of these calculations are
presented in Table 4.7. The average external hazard index from all the samples was 1.02.
This average value slightly more than unity, the acceptable average value (ICRP, 2000).
67
Table 4.7: External and Internal hazard indices
Quarry
name
Depth (m) of
External hazard index
Internal hazard index
point collection
(Hex) 0.005
(Hin) 0.005
of sample
0.3
0.89
1.08
Orenge
Nyaberi
Ouma
Barongo
British
3
0.81
0.93
5
0.48
0.62
4
1.29
1.49
7
0.74
0.88
1
0.79
0.92
4
0.70
0.87
8
2.12
3.10
0.3
0.95
1.16
4
0.88
1.05
8
1.07
1.55
0.3
1.12
1.32
1
1.33
1.55
15
1.17
1.35
1.02
1.28
Average
Internal exposure to
222
Rn and its radioactive progeny is controlled by the internal
hazard index (Hin) which is given by equation (9). Calculated values of Hin are also
presented in Table 4.7. The average internal hazard index for all the samples is 1.28. For
safe use of a material in the construction of dwellings, Hin should be less than unity
(ICRP, 2000).
68
4.5 ANNUAL EFFECTIVE DOSE RATE
The annual effective dose rates that a quarry worker receives by extracting soapstone
from the quarries are presented in Table 4.8.
Table 4.8: Annual effective dose rates due to extraction of soapstone at Tabaka quarries
Quarry
Depth (in m) of point
of collection of sample
Effective dose rate
0.0005 (mSvy-1)
name
Orenge
0.3
0.378
3
0.371
5
0.215
4
0.539
7
0.325
1
0.342
4
8
0.3
0.305
0.875
0.403
4
0.369
8
0.452
0.3
0.474
1
0.557
15
0.495
Nyaberi
Ouma
Barongo
British
69
The mean annual effective dose rate in all the samples is 0.44 mSvy-1. The value is more
than the average annual effective dose rate (5.62 µSvy-1) received by artisanal gold
miners at Osiri, Macalder, Mikei and Masara gold mines in South Nyanza (Odumo,
2009). The average value and all the annual effective dose rate values in Table 4.8 are
less than the 5.71 mSvy-1 obtained by Achola 2009 in a radiological survey carried out at
Lambwe east location and are also less than 1 mSvy-1 which is the annual effective dose
rate limit for the public (ICRP, 2000). Results of effective doses from Tabaka soapstone
quarries, gold mines of parts of South Nyanza and the radiological survey at Lambwe
valley were compared because these places are close to each other. From the results it is
noted that Lambwe valley has an effective dose that is more than the limit acceptable for
the public and therefore can be considered a high background radiation area.
70
CHAPTER FIVE
5.0 CONCLUSIONS AND RECOMMENDATIONS
5.1 CONCLUSIONS
The activity concentrations of
226
Ra,
232
Th and
40
K were all found to be above the
world’s average. In all quarries sampled, 40K had the highest activity concentration. The
measured average absorbed dose rate in air (541.4 nGyh-1) at the soapstone quarries was
9 times higher than the world measured average (60 nGyh-1) and 2.9 times higher than
the calculated average.
The calculated average absorbed dose rate in air (183.79 nGyh-1) due to gamma-ray
emitters in the soapstone quarries was at least 4 times higher than the world average (43
nGyh-1). Thorium and potassium contributed the highest and lowest values respectively
to the average absorbed dose rate in the quarries. The averages for both the external
(1.02) and internal (1.28) hazard indices exceeded a unity, the limit acceptable by ICRP
2000. Therefore soapstone rock obtained from Tabaka area is not suitable for
construction of houses. The annual effective dose rate in the quarries (0.44 mSvy-1) was
less than 1 mSvy-1, the acceptable limit for the public.
Since the annual effective dose rate obtained is less than the limit set for the public,
soapstone carvings and other soapstone products pose no radiation threat to the public.
71
5.2 RECOMMENDATIONS
Based on the results and conclusions drawn from this study, the following are
recommended:Quarry workers should be encouraged to maintain high personal hygiene practices such
as washing hands thoroughly at meal times because there is a possibility of high levels
of toxic elements like lead in the mines. The gamma spectrometric analysis done in this
study revealed the presence of radioactive lead in the soapstone samples.
To avoid radiological contamination, tools used in the quarries should not be mixed with
tools used for other purposes such as utensils as this may increase possible exposure
pathways.
Soapstone rock obtained from Tabaka area should not be used as building
material since both the internal and external hazard indices obtained were more
than the acceptable limit. However, should it be used for building, adequate
ventilation is recommended.
The soil and rock samples should be collected from more quarries for analysis to
get more representative results. The samples should also be collected at different
times of the year since climatical changes in the year could affect dispersion of
radionuclides.
Research should be done to determine the presence of heavy metals in soapstone.
The government should provide machinery for quarrying to the miners as this
may reduce the time they spend in the quarries (occupancy factor) hence
reducing the annual effective dose rate they receive.
72
Clear policies on quarrying that pay closer attention to the effects of quarrying to
the environment should be put in place and the government should hold the
miners responsible for any environmental pollution during and after mining.
73
REFERENCES
Achola, S. O. 2009. Radioactivity and elemental analysis of carbonites rocks from parts
of Gwasi area, south western Kenya. M.Sc. Thesis, University of Nairobi.
AGI/NAGT. 1990. American Geological Institute and the National Association of
Geology Teachers. Laboratory manual in physical Geology, second edition., Merrill
Publishing Co., London. Pp 134-156.
Akerblom, G. 1995. “The use of Airborne Radiometric and Exploration Survey
Data and techniques in radon risk mapping in Sweden”, Application of uranium
exploration data and techniques in environmental studies, International Atomic
Energy Agency Technical Document 827.
Aly, A.A., Hassan, M.H. and Huwait, M.R.A. 1999. Radioactivity assessment of
fabricated phosphogypsum mixtures. Fourth Radiation Physics Conference, 15–19
November 1999, Alexandria, Egypt: Pp 632–640.
Ansoborlo, E., Chazel, V., Henge-Napoli, M. H., Pihet, P., Rannou, A., Bailey,
M.R., Stradling, N (2002). “Determination of the physical and chemical
properties, biokinetics and dose coefficients of uranium compounds handled during
nuclear fuel fabrication in France”, Health physics. 82(3).
Arafa, W., 2004. Specific activity and hazards of granite samples collected from
the eastern desert of Egypt. Journal of environmental radioactivity. 75, Pp 315-327
Beretka,J.,Mathew,P.J. 1985. Natural radioactivity of Australian building
materials, industrial wastes and by-products. Health physics. 48, Pp 87-95
74
Biehl, A., Neher, H., Roesch, W. (1998). Cosmic ray experiments at high
altitudes. Health and safety laboratory, New York Pp 914-932.
Bigu, J., Mohamed, I. H. and Hussein, A. Z. 2000. Radiation measurements in
Egyptian pyramids and tombs-occupational exposure of workers and the public. Journal
of Environmental Radioactivity 47, Pp 245-252.
Bock, R. K. 2008. "Very-High-Energy Gamma Rays from a Distant Quasar: How
Transparent Is the Universe?". Science 320, Pp 1752–1754.
Boularbah, A., Schwartz, C., Bitton, G. and Morel J. L. 2006. Heavy metal
contamination from mining sites in South Morocco: Use of a biotest to assess metal
toxicity of tailings and soil. Chemosphere 63, Pp 802-810.
Canoba, A., Lopez,F.O., Arnaud, M.I., Oliveria, A.A., Neman, R.S., Hadler, J.C.,
Iunes, P.J., Paulo, S.R., Osorio, A.M., Aparecido, R., Rodriguez, C., Moreno, V.,
Vasquez, R., Espinosa, G., Golzarri, J.I., Martinez, T., Navarrete, M., Cabrera, I.,
Sagovia, N., Pena, P., Tamez, E., Pereyra, P., Lopez, H.M.E., Sajo, B.L.,(2001)
“Indoor radon measurements and methodologies in Latin American Countries”,
Radiation Measurement, 34:
Conesa, H. M., Faz, A. and Raquel, A. 2006. Heavy metal accumulation and tolerance
in plants from mine tailings of the semi arid Cartagena La- Union mining district (SE
Spain). Science of the total environment 366, Pp 1-11.
Cox, P.A. 1995. The elements on earth. Inorganic chemistry in the environment, Oxford
university press, New York.
75
Cuney, M., LeFort, P., Wangeg, Z. 1987. Geology of Granites and their Metallogenic
Relations. Science Press, Moscow. Pp 852-873.
David, C. P. 2003. Heavy metal concentration in growth bands of corals: a record of
mining tailings input through time (Marinduque Island, Philippines). Marine Pollution
Bulletin 46, Pp 187-196.
Department for Environment, Food and Rural Affairs (DEFRA) UK. 2003. Key
facts about radioactivity. Pp 127
Dodson, R. G. 1953. A geology of south east machakos area. Geological Survey Kenya.
25, Pp 3
Dudka, S. and Adriano, C. D. 1997. Environmental impacts of metal ore mining and
processing. Journal of the Environment. 26, Pp 590-602.
European Commission (EC). 2002. Practical use of the concepts of clearance and
exemption, Part II, application of the concepts of exemption and clearance of natural
radiation sources. Radiation Protection. 122, Pp 213-218
Frank, H. A. 2004. Introduction to radiological physics and radiation dosimetry. WileyVCH Verlag GmbH and company. KGaA, Weinheim, Germany. Pp 234-345.
Funtua, I. I. and Elegba, S. B. 2005. Radiation exposure from high-level radiation area
and related mining and processing activities of Jos Plateau, central Nigeria. International
Congress Series 1276, Pp 401– 402.
Gregory, R. L. 1992. Analytical electron microscopy of Columbite: A niobiumtantalum oxide mineral with zonal uranium distribution. Journal of Nuclear Materials
190 North-Holland: Pp 302-311.
76
Gordon, R.G. 2008. Practical gamma-ray spectrometry. John Willey and sons Ltd.
Warrington UK.
Huddleston. A. 1951. Geology of the Kisii district. Degree sheet 41.goverment printer,
Nairobi: Pp 24.
Karakelle, B., Ozturk, N., Kose, A., Varinlioglu, A., Erkol, A. Y and Yilmaz, F.
2002. Natural radioactivity in soil samples of kocaeli basin, Turkey. J. Radioanal
Nuclear Chemistry. 254, Pp 649-651.
Khan, H. A., Qureshi, I. E. and Tufail, M. 1993. Passive dosimetry of Radon and its
daughters using solid state nuclear track detectors (SSNTDs). Radiation protection
dosimetry, 46, Pp 149-170.
Kocher, D.C., Sjoreen, A.L. 1985. Dose-rate conversion factors for external exposure
to photon emitters in soil. Health physics. 48, Pp 193-205.
Kurnaz, A., Keser, R., Okumusoglu, N.T., Karahan, G., Cevic, U. 2007.
Determination of radioactivity levels and hazards of soil and sediment samples in Firtina
Valley (Turkey), Applied Radiation and Isotopes 65 (2007), Pp1281-1289.
Gupta, C. K. and Suri A. K. 1994. Extractive Metallurgy of Niobium, CRC Press,
USA: Pp 21-121.
Habashi, F. 1997. Handbook of Extractive Metalurgy, vol. 3, Wiley-VCH, Germany:
Pp1404-1421.
Henriques, F. S. and Fernandes, J. C. 1991. Metal uptake and distribution in rush
(Juncus Conglomeratus) plants growing in pyrites mine tailings at Lousal, Portugal.
Total Environment. 102, Pp 253-260.
77
International Atomic Energy Agency (IAEA). 2004. Application of the Concepts of
Exclusion, Exemption and Clearance. Safety Series No. RS-G-1.7 (Vienna: IAEA).
Ibrahiem, N.M., Abdel-Ghani, A.H., Shawky, S.M., Ashraf, E.M. and Farouk, M.A.
1993. Measurement of radioactivity levels in soil in the Nile Delta and Middle Egypt.
Health Physics. 64, Pp 620–627.
International Commission on Radiation Protection (ICRP). 2000. Protection of the
public in situations of prolonged radiation exposure ICRP Publication 82; Ann. ICRP 29
(1–2), Pergamon Press, Oxford.
Juhậsz, L., Serbin, P. and Czoch, I. 2005. Evaluation of technologically enhanced
naturally occurring radioactive materials in Hungary. International congress series.
1276, Pp 367-368.
Lowder, W. and Beck, H. 1966. Cosmic ray ionization in the lower atmosphere.
Journal of geophysics 71(190), Pp 4651-4659.
Malance, A., Gaidolfi, L., Pessina, V. and Dallara, G. 1996. Distribution of
232
226
Ra,
Th, and 40K in soils of Rio Grande do Norte, Brazil. J. Environmental Radioactivity.
30, Pp 55–67.
Malanka, A., Pessina, V., Dallara, G. 1993. Assessment of the natural radioactivity in
the Brazilian state of Rio Grande, Health Physics 65(3), Pp. 298-302.
Mangala, J. M. 1987. A multi-channel X-ray fluorescence analysis of fluorspar ore and
rock from Mrima hill, Kenya, MSc Thesis, University of Nairobi.
78
Mbuzukongira, P. 2006. Assessment of occupational radiation exposures of artisan
miners of Columbite-tantalite (Coltan) in the Eastern Democratic Republic of Congo.
MSc Thesis, University of Nairobi, Unpublished.
McCall, G. J. H. 1958. Geology of Gwasi area. Geology Survey of Kenya Department,
Report number 45.
Merker, M., Light, E.S., Verschell, H.J., Mendell, R.B., Korff, S.A. 1973. Time
dependent worldwide distribution of atmospheric neutrons and their products (1) Fast
neutron observation. Journal of Geophysics. 78(16), Pp 2727-2740.
Mujahid. A, Hussain, S, Dogar, H. Karim. S. (2005) “Determination of porosity of
different materials by radon diffusion”, Physics radiation division, PINSTECH. P.O.
Nilore, Islamabad, Pakistan, Radiation Measurements 40:
Mustapha, A. O., Narayana, D.G.S., Patel, J.P. and Otwoma, D. (1997).
Radioactivity in some building materials in Kenya and contribution to the indoor
external doses, Radiation protection dosimetry. 71(1) 65-69.
Mustapha, A. O. 1999. Assessment of human exposures to natural sources of radiation
in Kenya. Ph.D Thesis, University of Nairobi.
Mbuzukongira, P.,
Mustapha, A.O. and Mangala, M. J. 2007. Occupational
radiation exposures of artisans mining Columbite-tantalite in the eastern Democratic
Republic of Congo, J. Radiological Protection. 27, Pp 187-195.
Mustapha, A.O., Patel, J.P. and Rathore, I.V.S. 2002. Preliminary report on radon
concentration in drinking water and indoor air in Kenya. Environmental Geochemistry
and health. 24(4), Pp 387-396.
79
National Council on Radiation Protection (NCRP). 1993. Limitation of exposure to
ionizing radiation, NCRP Report,116, Bethesda, MD.
Nazaroff, W. W. and Nero jr, A. V. 1988. Radon and its decay products in air. Wiley,
New York. Pp 67-68
O’ Brien, K. 1978. A code for the calculation of cosmic ray propagation in the
atmosphere. Health and safety laboratory, EML 338 Report, New York.
Odumo, B. O. 2009. Radiological survey and elemental analysis in the gold mining belt,
southern Nyanza, Kenya, M.Sc Thesis, University of Nairobi.
Ohde S. (2004). “Instrumental neutron activation analysis of carbonatites from
Homa hills”, Journal of Radioanalytical and Nuclear chemistry. 3, Pp 214-221.
Orgun, Y., Altinsony, N., Gultekin, A.H., Karahan, G., Celebi, N. 2005.
Natural radioactivity levels in granitic plutons and ground waters in Southeast part
of Eskisehir, Turkey, Applied Radiation and Isotopes. 63, Pp 267-275.
Otwoma, D and Mustafa, A.O. 1998. Measurement of
222
Rn concentration in
Kenyan ground water, Health Physics. 74 (1), 91-95.
Patel, J. P. 1991. Environmental radiation survey of the area of high natural
radioactivity of Mrima hill of Kenya. Discovery and innovation, 3(3), Pp 31-36.
Qureshi, A. A., Kakar, D. M., Akran, M., Khattak, M. T., Mehmood, K. and Khan,
H. A. 2000. Radon concentrations in coal mines of Baluchistan, Pakistan. Journal of
Environmental Radioactivity, 48, Pp 203-209.
80
Rothkamm K. 2003. Evidence for a lack of DNA double-strand break repair in human
cells exposed to very low x-ray doses - Proceedings of the National Academy of Science
of the USA, Pp 5057-5062.
Rodriguez, L., Ruiz, E., Alonso, A. J. and Rincon, J. 2009. Heavy metal distribution
and chemical speciation in tailings and soils around a Pb-Zn mine in Spain. Journal of
environmental management, 90, Pp 1106-1116.
Saggerson, E. P. 1957. Geology of the Kitui south area. Kenya Geological Survey.
Report number 37.
Sanders, L. D. 1954. Geology of the Kitui area. Kenya Geological Survey. Report
Number 30.
Shamos, M.H. and Liboff, A.R. 1966. A new measurement of the intensity of cosmic
ray ionization at sea level, Journal of Geophysics. 71(19), Pp 4651-4659.
Singha Surinder., Asha Rania and Rakesh Kumar Muhajanb (2005). “226Ra,
232
Th and
40
K analysis in soil samples from some areas of Punjab and Himachal
Pradesh, India using gamma ray spectrometry” Radiation measurements 39, Pp
165-167.
Singh, S., Singh, B., Kumar, A., (2003). “Natural Radioactivity measurements in
soil samples from Hamirpur district”, Radiation Measurement 36:
Solon, L., Lowder, W and Blatz, H. 1980. Investigations of natural
environmental radiation. Science: 131, Pp 903.
81
Speer, J., Solberg, T and Becker, S. 1981. Petrography of uranium bearing minerals of
the Liberty Hill Pluton. South Carolina: phase assemblages and migration of uranium in
granitoid rocks. Economical Geology: Pp 110-120.
Tsai, T. L., Lin, C. C., Wang, T. W and Chu, T. C. 2008.
Radioactivity
concentrations and dose assessment for soil samples around a nuclear power plant IV in
Taiwan. Journal of Radiological Protection, 28, Pp 347-360.
Tzortzis, M., Svoukis, E. and Tsertos, H. 2004. A comprehensive study of natural
gamma radioactivity levels and associated dose rates from surface soils in Cyprus.
Radiation Dosimetry, 109, Pp 217-224.
United Nations Scientific Committee on the Effects of Atomic Radiation
(UNSCEAR). 1998. Sources and effects of ionization radiation Report to the General
Assembly, with Scientific Annexes B: Exposures from Natural Radiation Sources (New
York: UNSCEAR), Pp 234-238.
United Nations Scientific Committee on the Effects of Atomic Radiation
(UNSCEAR). 2000. Sources, effects and risks of ionization radiation, Report to The
General Assembly, with Scientific Annexes B: Exposures from Natural Radiation
Sources (New York: UNSCEAR), Pp 678-679.
United Nations Scientific Committee on the Effects of Atomic Radiation
(UNSCEAR). 2008. Sources and Effects of Ionizing Radiation, Report of the United
Nations Scientific Committee on the Effects of Atomic Radiation, Fifty-sixth session,
New York, USA, Pp 456-458.
82
Varley, N. R. and Flowers, A. G. 1998. Indoor radon prediction from soil gas
measurements. Health Physics, 74, Pp 714-718.
Veigaa, R, N., Sanchesa, R. M., Anjosa, K., Macarioa, J., Iguatemya, J.G.,
Aguiarb, A.m.A., Santosb, B., Mosqueraa, C., Carvalhoa, M and Baptista
Filhoa, N.K. (2006) “Measurement of natural radioactivity in Brazilian beach
sands”, Radiation Measurements, Pp 346-349.
Wikipedia.org/wiki/soapstone., Soapstone, 22/09/09.
Wong, M. H. 2003. Ecological restoration of mine degraded soils with emphasis on
metal contaminated soils. Chemosphere, 50, Pp 775-780.
Wong, J. W. C., Ip, C. M and Wong, M. H. 1998. Acid forming capacity of Pb-Zn
mine tailings and its implications for mine rehabilitation. Environmental Geochemistry,
20, Pp 149-155.
Xinwei, L., (2005). “Radioactive Analysis of Cement and its Products collected
from Shaanxi”, China. Health Physics. 88(1):
Yang, Y., Wu, X., Wang, W., Lu, J. 2005. Radioactivity concentrations in soils
of the Xiazhuang granite area China. Applied Radiation and Isotopes. 63, Pp 225259.
83
APPENDICES
A1: Thorium series
232
Th
β-
14.1 billion Yr
α
β-
228
Ac, 6.1h
228
Th
1.9 Yr
228
α
Ra
224
5.75 yr
Ra
3.66 days
α
212
Pb
α
10.6 h
216
Po
0.15 s
β212
Bi
β-
α
TI
3.07 min
Po
3.05×10⁻⁷ s.
60.6 min
208
212
α
β-
208
Pb
Stable
84
α
220
Rn
55.6 s
A2: Uranium series
238
β-
U
4.47 × 10⁹h
α
234
234
U
2.45 ×10⁵y
Pa
β-
234
α
1.17min
230
Th
24.1 days
Th
7.7 y
α
226
Ra
1600 y
α
222
Rn
3.8 days
α
218
Po
3.05 min
α
214
β-
214
Bi
19.9 min
206
Pb
(stable)
Pb
26.8 min
β-
α
214
Po
1.64×10⁻⁴s
210
Po
138 days
85
210
α
Pb
22.3 y
β-
210
βBi
5.01 days
A3: Nuclide identification reports table
Quarry
name,
sample
depth.
Nuclide
name
40
K
Absolute emission
probabilityof
gamma
decay (%) 0.005
Energy
0.005 Activity
0.005
(Bqkg-1)
(keV)
10.67
1460.81
587.00
137
Cs
85.12
661.65
2.52
212
Bi
11.80
727.17
35.10
Orenge
212
Pb
44.60
238.63
52.90
0.3m
214
Bi
46.30
609.31
35.50
214
Pb
37.20
351.92
37.10
228
Ac
27.70
911.60
59.50
235
U
54.00
185.71
9.41
10.67
1460.81
1780.00
40
Orenge 3m
Orenge 5m
K
212
Bi
11.80
727.17
17.70
212
Pb
44.60
238.63
29.90
214
Bi
46.30
609.31
20.20
214
Pb
37.20
351.92
22.90
228
Ac
27.70
911.60
37.20
235
U
54.00
185.71
5.76
10.67
1460.81
922.00
40
K
214
Bi
46.30
609.31
27.10
214
Pb
37.20
351.92
25.10
228
Ac
27.70
911.60
38.60
235
U
54.00
185.71
5.35
86
40
Nyaberi 4m
K
10.67
1460.81
307.00
212
Bi
11.80
727.17
68.10
212
Pb
44.60
238.63
95.50
214
Bi
46.30
609.31
37.60
214
Pb
37.20
351.92
38.20
228
Ac
27.70
911.60
99.70
234
Pa
0.59
1001.03
187.00
235
U
54.00
185.71
9.94
10.67
1460.81
1020.00
Nyaberi
40
7m
212
Bi
11.80
727.17
23.90
212
Pb
44.60
238.63
36.40
214
Bi
46.30
609.31
24.50
214
Pb
37.20
351.92
28.00
228
Ac
27.70
911.60
39.90
235
U
54.00
185.71
6.39
10.67
1460.81
887.00
40
Ouma 1m
K
K
211
Bi
1.20
351.10
72.80
212
Bi
11.80
727.17
31.20
212
Pb
44.60
238.63
43.80
214
Bi
46.30
609.31
26.00
214
Pb
37.20
351.92
23.90
228
Ac
27.70
911.60
45.80
231
Th
18.70
26.64
18.50
234
Pa
0.59
1001.03
136.00
235
U
54.00
185.71
6.41
87
40
Ouma 4m
Ouma 8m
K
10.67
1460.81
813.00
212
Bi
11.80
727.17
19.30
212
Pb
44.60
238.63
29.90
214
Bi
46.30
609.31
29.90
214
Pb
37.20
351.92
33.40
228
Ac
27.70
911.60
44.70
235
U
54.00
185.71
6.16
22
Na
99.94
1274.54
0.48
40
K
10.67
1460.81
744.00
212
Bi
11.80
727.17
57.40
212
Pb
44.60
238.63
98.00
214
Bi
46.30
609.31
72.40
214
Pb
37.20
351.92
77.60
226
Ra
3.28
186.21
210.00
228
Ac
27.70
911.60
103.00
231
Th
18.70
26.64
26.80
235
U
54.00
185.71
12.80
10.67
1460.81
641.00
40
K
137
Cs
85.12
661.65
1.74
212
Bi
11.80
727.17
34.80
212
Pb
44.60
238.63
56.40
Barongo
214
Bi
46.30
609.31
39.10
0.3m
214
Pb
37.20
351.92
39.10
228
Ac
27.70
911.60
66.40
231
Th
18.70
26.64
24.00
234
Pa
0.59
1001.03
119.00
235
U
54.00
185.71
8.53
88
40
K
10.67
1460.81
245.00
Barongo
211
Bi
1.20
351.10
92.80
4m
212
Bi
11.80
727.17
5.75
212
Pb
44.60
238.63
81.80
214
Bi
46.30
609.31
30.60
214
Pb
37.20
351.92
30.40
228
Ac
27.70
911.60
84.60
231
Th
18.70
26.64
23.50
234
Pa
0.59
1001.03
214.00
235
U
54.00
185.71
7.86
10.67
1460.81
1090.00
40
K
212
Bi
11.80
727.17
23.30
212
Pb
44.60
238.63
30.10
Barongo
214
Bi
46.30
609.31
29.30
8m
214
Pb
37.20
351.92
28.80
226
Ra
3.28
186.21
120.00
228
Ac
27.70
39.30
39.30
234
Pa
0.59
1001.03
66.60
235
U
54.00
185.71
7.28
10.67
1460.81
883.40
40
K
137
Cs
85.12
661.65
34.30
212
Bi
11.80
727.17
35.20
British
212
Pb
44.60
238.63
78.70
0.3m
214
Bi
46.30
609.31
34.30
214
Pb
37.20
351.92
38.40
228
Ac
27.70
911.60
42.30
231
Th
18.70
26.64
26.40
235
U
54.00
185.71
8.53
89
40
British 1m
10.67
1460.81
284.00
212
Bi
11.80
727.17
62.70
212
Pb
44.60
238.63
103.00
214
Bi
46.30
609.31
39.30
214
Pb
37.20
351.92
42.70
228
Ac
27.70
911.60
106.00
231
Th
18.70
26.64
32.50
234
Pa
0.59
1001.03
198.00
235
U
54.00
185.71
11.10
10.67
1460.81
403.00
40
British 15m
K
K
212
Bi
11.80
727.17
52.30
212
Pb
44.60
238.63
86.40
214
Bi
46.30
609.31
33.00
214
Pb
37.20
351.92
32.80
228
Ac
27.70
911.60
97.80
235
U
54.00
185.71
9.77
90


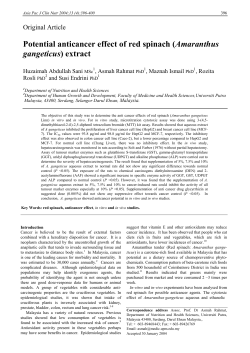


© Copyright 2026