
Oklahoma Cropland Rental Rates: 2012-13 CR-230 Damona Doye
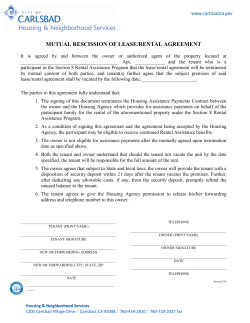
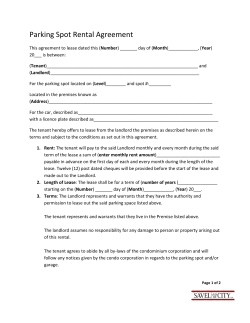
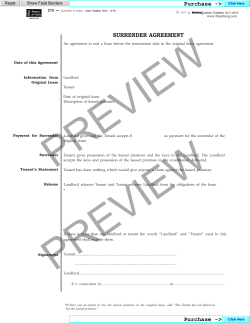
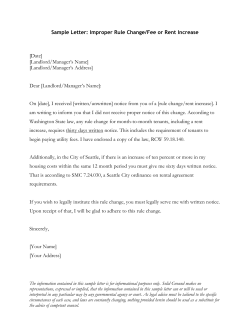
Oklahoma Cooperative Extension Service
CR-230
Current Report
0313
Oklahoma Cooperative Extension Fact Sheets are also available on our website at:
osufacts.okstate.edu
Oklahoma Cropland Rental Rates: 2012-13
Damona Doye
Roger Sahs
Regents Professor and Extension Economist
Rental agreements and rates are influenced by the
landowner’s costs, the tenant’s expected earnings, previous rates charged, competition for the land, government
programs, tax laws, and the non-agricultural economy.
The results of a statewide farmland leasing survey conducted in 2012 are reported here. Respondents were
individuals contacted through the Oklahoma Cooperative
Extension Service who agreed to complete periodic surveys
plus recipients of a mailing by the Oklahoma Agricultural
Statistics Service. Approximately 270 surveys were returned
with useable data. Figure 1 shows the regions of the state
used in reporting survey results: northwest, southwest, northcentral, and east.
On average, crop cash lease agreements had been in
effect for 15 years (Table 1). Average lease sizes ranged from
209 acres in eastern Oklahoma to 550 acres in Northcentral
Oklahoma. Most tenants and landlords in Oklahoma appear
to be satisfied with their lease agreements. Sixty-eight percent
of respondents with cash lease agreements crop share agreements classified their leasing agreements as either good or
excellent from a standpoint of fairness. Twenty-two percent
of respondents with cash lease agreements and 24% of respondents with crop share agreements classified their leasing
agreements as adequate from the standpoint of fairness.
Northwest
Cropland Cash Rental Rates
Cash leases require a fixed payment, typically cash (or
infrequently, a specified yield such as 10 bushels of wheat).
Survey results document some regional differences in rental
rates and average sizes of tracts rented. Cash rental rates
for dryland wheat were highest in the north-central region of
the state, averaging $38.48 per acre, compared to $28.10 to
$32.19 in other regions of the state (Table 2).1 The range in
reported rental rates was from $15 to $67 per acre. The state
average of $32.80 increased more than $1 per acre compared
to the 2010 average of $31.78. Northwestern and southwestern
areas reported slight regional declines, however.
Figure 2 shows the distribution of responses (128) for
dryland wheat cash rental rates. None of the respondents
reported a rental rate less than $10 per acre, 6% reported
a rental rate between $10 and $19 per acre, 30% reported
a rental rate between $20 and $29 per acre, 31% reported
a rental rate between $30 and $39 per acre, 23% reported
a rental rate between $40 and $49 per acre, and 9% of the
respondents reported a rental rate of $50 or more per acre.
Dryland grain sorghum average rental rates were less
than wheat at $29.66 per acre while dryland alfalfa averaged
significantly higher than wheat at $41.00 per acre. (Note that
there were only 7 responses on both grain sorghum and
dryland alfalfa rates, thus the averages and distributions are
less reliable than they would be with more observations.)
Cropland Share Rental Rates
Northcentral
Southwest
Extension Assistant Specialist
In a crop share lease, certain costs are often shared in
the same proportion that production is shared.2 In crop share
leases statewide, the tenant on average receives around
2/3 of dryland wheat, alfalfa, or grain sorghum, while paying
that or more of the fertilizer, herbicide, insecticide, and chemical
application expenses (Table 3). On average, the tenant pays
nearly all seed and harvesting (combining, hauling, cutting,
raking, baling) expenses.
Figure 3a shows the distribution of survey responses
regarding the tenant’s share of production. Figure 3b shows
East
Figure 1. Regions Used in Reporting Farmland Leasing
Survey Results
1 Averages reported are the simple average of rates reported by the respondents. They are not weighted by acres in the lease agreement.
2 Advantages and disadvantages of different types of lease agreements are
discussed in OSU Extension Fact Sheets AGEC-214 and AGEC-215.
Division of Agricultural Sciences and Natural Resources
•
Oklahoma State University
the distribution of responses for the tenant’s share of crop
inputs and expenses. These graphs indicate that the tenant typically pays either 2/3 or all of the fertilizer, herbicide,
insecticide, chemical application and lime costs. Chemical
applications in particular are frequently paid entirely by the
tenant. The graphs also show that the tenant typically pays
all seed, harvesting, and hauling costs. Figure 3c shows the
distribution of responses for hay inputs and expenses. The
results for hay are similar to crops in that the tenant typically
pays all seed, harvesting (cutting, raking and baling) and
hauling costs. Although the tenant typically pays 2/3 or all of
the fertilizer, herbicide, insecticide and chemical application
costs, the proportion of tenants paying 100% is higher for
fertilizer on hay than other crops.
Other Lease Terms
Many lease agreements specify terms and conditions
beyond the rental rate, which affect the value of the lease and
the “real” rental rate. For instance, tenants may or may not
be allowed to hunt, harvest pecans, graze cattle, cut timber,
use buildings, improvements, and lease out hunting privileges.
Lime application costs or similar costs for improvements in
which the benefits are shared over a number of years may
be shared by the landlord and tenant, or if the tenant pays for
them initially, repaid by the landlord at a fixed rate per year.
Tenants may be required to maintain fences, spray weeds
annually, provide liability insurance, share oil field damages,
maintain terraces, and leave strips of grain in the field for game.
Landlords may provide a well and water, fencing material, or
land for a mobile home. Tenants may ask for several months
notice if the landlord wishes to terminate the lease agreement.
In some cases, leases contain an option to buy with rental
payments applied to the purchase price.
Related Publications
To help educate landlords and tenants with equitable
lease agreements and current best management practices,
visit the Oklahoma State University (OSU) Ag Land Lease
website at http://www.aglandlease.info or http://www.aglease.
info. A joint effort between OSU’s Plant and Soil Sciences and
Agricultural Economics Departments, the website contains a
wide assortment of farm management spreadsheet tools, lease
information and forms, rental rate and land value resources,
legal and tax considerations plus the latest production practices in Oklahoma.
Specific addresses for the several referenced North
Central Farm Management Extension Committee (NCFMEC)
publications are:
Crop Share Rental Arrangements For Your Farm, NCFMEC-2
at http://aglandlease.info/wp-content/uploads/2012/05/
Crop-Share.pdf
Fixed and Flexible Cash Rental Arrangements For Your
Farm, NCFMEC-1 at http://aglandlease.info/wp-content/
uploads/2012/05/Fixed-and-Flexible.pdf
Pasture Rental Arrangements, NCFMEC-3 at http://
aglandlease.info/wp-content/uploads/2012/05/PastureRental.pdf
Recent Oklahoma school land lease auction information is
also available through the Real Estate Management Division
of Commissioners of the Land Office at http://oklaosf.state.
ok.us/~clo/.
50
Historical and Regional Perspective
Average-$32.80
n=128
45
Table 4 provides historical data on pasture rental rates for
Oklahoma, Kansas, Arkansas, and Texas for 2003-2012 as
reported by the USDA National Agricultural Statistics Service.
40
35
Concluding Comments
30
30
% of Responses
“Fair” rents must be negotiated between tenant and
landlord. Regional or state average rental rates may be used
as a beginning point for discussion and negotiation of rental
rates. However, differences in land quality, improvements,
and restrictions on land use can greatly impact the value of
potential leases. Likewise, differences in family living expenses
and hired labor costs can be substantial for different operations, affecting the maximum rental bids.
New legal restrictions and liability factors may instigate
changes in future farm lease agreements. Some farm management firms include language that explicitly requires the tenant
to be a good steward of the land. The tenant is expected to
follow label restrictions in the use of pesticides, to remain in
compliance with the farm’s conservation plan, and to dispose
of wastes in a manner approved by the Environmental Protection Agency. Some leases already stipulate precisely what
fertilizers, pesticides, and seed may be used on the property.
Both landlords and tenants must be aware of changing environmental laws and regulations to avoid potentially costly
liabilities.
31
25
23
20
15
9
10
6
5
0
0
0 - 9.99 10 - 19.99 20 - 29.99
30 - 39.99 40 - 49.99
50+
Rental Rate ($/acre)
Figure 2. Relative Frequency of Responses for Dryland
Wheat Cash Rental Rates, 2012.
CR-230.2
Table 1. Crop Cash Agreement Statistics by Region, 2012-13.
Northwest
Average
Range
Number of Observations
Average
Range
Number of Observations
Southwest
Northcentral
East
486
80-1,920
45
523
16-2,225
57
Acres in Lease
550
26-6,500
41
209
30-1,100
46
18
1-50
16
2-100
Average Years Lease Held
15
1-55
11
1-60
39
55
37
44
State
443
16-6,500
189
15
1-100
175
Table 2. State Crop Cash Rental Rates, 2012-13.
Cash Rent per Acre
Average
Range
No. of Observations
Dryland Wheat
Northwest
Southwest
Northcentral
East
State
$28.10
$32.07
$38.48
$32.19
$32.80
$15-49
$15-55
$20-55
$20-67
$15-67
Dryland Grain Sorghum
$29.66
$16-45
Dryland Alfalfa
$41.00
$30-50
7
Other Dryland Crops1
$39.38
$23-95
20
Other Irrigated Crops2
$66.25
$38-100
6
32
45
34
17
128
7
1
Other dryland crops (number of observations in parenthesis) include annual forages (6), soybeans (6), corn (4), cotton (2) and other small grains (2).
2
Other irrigated crops (number of observations in parenthesis) include grains (3), alfalfa (2) and cotton (1).
CR-230.3
Table 3. Crop Share Lease Provisions (Tenant’s Share), 2012-13.
Acres in Lease
Average Years Lease Held
Average
Range
No. of Observations
373
16
15-3,520
1-60
138
126
——————————Tenant’s Share of Receipts (Percentage)—————————
Dryland Wheat
Dryland Alfalfa
Dryland Grain Sorghum
Other Hay
Other Crops
66
67
66
63
69
50-75
50-75
50-75
50-90
67-75
106
12
13
16
8
——————————Tenant’s Share of Expenses (Percentage)—————————
Crop
Seed
Fertilizer
Herbicide
Insecticide
Chemical Applications
Harvesting
Hauling
Irrigation Energy
Lime Application1
Cotton Ginning and Processing
Hay and Other
Seed
Fertilizer
Herbicide
Insecticide
Chemical Applications
Cutting
Raking
Bailing
Hay Hauling
Irrigation Energy2
Lime Application1
Average
Range
No. of Observations
97
75
83
81
87
96
95
93
64
84
50-100
50-100
50-100
50-100
50-100
50-100
50-100
67-100
0-100
67-100
107
113
105
93
103
91
49
9
41
9
93
77
76
69
86
93
93
93
88
67-100
50-100
50-100
50-100
50-100
50-100
50-100
50-100
50-100
9
16
13
10
14
34
34
34
29
—
—
—
43
0-100
7
Rental shares of 100% of the crop for the tenant or zero percent of expenses are generally special situations, usually reflecting concessions or unusual circumstances in another part of the lease. However, as lime improves the soil and this improvement is retained by the landlord if the lease is terminated, it is not unusual
for the landlord to pay all lime expenses.
2
Insufficient information.
1
CR-230.4
Table 4. Average Gross Cash Rent (Dollars per Acre) for Cropland, Selected States, 2003-2012.
20032004
2005
2006
20072008
2009
2010
2011
2012
Oklahoma
Dryland
27.5030.00
29.00
28.00
27.0028.00
28.00
28.00
28.00
31.00
Kansas
Dryland
Irrigated
36.0037.50
68.0072.00
38.50
73.00
39.00
74.00
41.0042.50
82.0092.00
43.50
89.00
43.50
95.00
44.00
105.00
52.50
119.00
Missouri
Dryland
70.0076.00
79.00
79.00
79.0080.00
90.00
94.00
101.00
103.00
Texas
Dryland
Irrigated
21.0023.70
555.00
56.00
23.00
57.50
23.00
62.00
23.0024.00
65.0080.00
25.00
77.00
26.00
75.00
28.00
77.00
25.00
79.00
Source: Agricultural Statistics Service, Oklahoma Agricultural Statistics 2012, USDA/NASS, Oklahoma Department of Agriculture, http://www.nass.usda.gov/ok/.
Figure 3a. Relative frequency of responses for items in cropland share agreements, 2012-13.
Production
Dryland Wheat
Dryland Alfalfa
100
100
Average Tenant’s
Share: 66%
n = 106
87
n = 12
Average Tenant’s
Share: 67%
80
80
% of Responses
% of Responses
67
60
40
20
60
40
0
0
0
5
0
1 - 35
36 - 63
64 - 71
72 - 80
0
0
81 - 99
100
0
17
17
20
8
0
0
0
1 - 35
36 - 63
Other Hay
Average Tenant’s
Share: 63%
0
100
Dryland Grain Sorghum
100
80
56
38
n = 13
Average Tenant’s
Share: 66%
80
75
% of Responses
% of Responses
60
n =8
Average Tenant’s
Share: 69%
n = 16
80
% of Responses
0
81 - 99
Other Crops
100
40
72 - 80
Tenant’s Share
Tenant’s Share
100
64 - 71
60
40
77
60
40
25
20
20
20
15
8
6
0
0
0
0
1 - 35
0
36 - 63
64 - 71
72 - 80
Tenant’s Share
0
81 - 99
100
0
0
0
0
1 - 35
0
36 - 63
64 - 71
72 - 80
Tenant’s Share
CR-230.5
0
0
81 - 99
100
0
0
0
0
1 - 35
36 - 63
64 - 71
72 - 80
Tenant’s Share
0
0
81 - 99
100
Figure 3b. Relative frequency of responses for items in cropland share agreements, 2012-13.
Crop Inputs and Expenses
Seed
Fertilizer
Herbicide
100
100
Average Tenant’s
Share: 97%
100
93
n = 107
Average Tenant’s
Share: 75%
n = 113
80
n = 105
Average Tenant’s
Share: 83%
80
80
60
40
% of Responses
% of Responses
% of Responses
62
60
40
60
50
42
40
27
20
20
20
6
0
2
1 - 35
36 - 63
0
0
0
6
0
64 - 71
0
72 - 80
0
0
81 - 99
0
100
5
1 - 35
36 - 63
Insecticide
n = 93
Average Tenant’s
Share: 81%
100
20
20
1 - 35
36 - 63
64 - 71
0
72 - 80
81 - 99
0
100
0
0
0
1 - 35
4
36 - 63
64 - 71
72 - 80
0
81 - 99
100
Average Tenant’s
Share: 64%
80
80
60
60
40
40
20
6
0
0
1 - 35
100
n = 41
32
64 - 71
0
72 - 80
81 - 99
100
0
1 - 35
64 - 71
60
44
33
22
20
0
0
1 - 35
0
0
36 - 63
64 - 71
72 - 80
Tenant’s Share
n=9
Average Tenant’s
Share: 84%
0
64 - 71
72 - 80
1
81 - 99
100
n=9
Average Tenant’s
Share: 93%
78
60
40
0
36 - 63
80
0
36 - 63
7
Cotton Ginning
40
1 - 35
3
20
15
2
Tenant’s Share
100
0
4
22
17
2
0
36 - 63
0
80
6
0
3
0
Irrigation Energy
27
20
88
Tenant’s Share
100
86
100
40
Lime Application
n = 49
81 - 99
n = 91
Average Tenant’s
Share: 96%
Tenant’s Share
Hauling
Average Tenant’s
Share: 95%
0
72 - 80
60
0
% of Responses
0
3
0
64 - 71
20
5
Tenant’s Share
0
% of Responses
61
30
0
3
36 - 63
80
40
40
100
100
n = 103
Average Tenant’s
Share: 87%
44
0
1 - 35
Harvesting
60
46
6
0
Tenant’s Share
80
60
0
Application of Chemicals
80
% of Responses
81 - 99
100
100
% of Responses
72 - 80
0
0
Tenant’s Share
Tenant’s Share
% of Responses
64 - 71
6
0
0
72 - 80
81 - 99
100
Tenant’s Share
CR-230.6
81 - 99
0
100
0
0
0
1 - 35
0
0
36 - 63
64 - 71
72 - 80
Tenant’s Share
0
81 - 99
100
Figure 3c. Relative frequency of responses for items in cropland share agreements, 2012-13.
Hay Inputs and Expenses
Seed
Fertilizer
Average Tenant’s
Share: 77%
n=9
% of Responses
60
40
n = 16
80
78
80
100
60
40
38
38
22
n = 13
60
38
40
31
23
19
20
20
Average Tenant’s
Share: 76%
80
% of Responses
Average Tenant’s
Share: 93%
% of Responses
Herbicide
100
100
20
6
0
0
0
0
0
72 - 80
81 - 99
0
0
1 - 35
36 - 63
64 - 71
0
0
0
100
0
0
1 - 35
36 - 63
64 - 71
72 - 80
0
81 - 99
8
0
0
0
100
0
1 - 35
36 - 63
Tenant’s Share
Insecticide
Average Tenant’s
Share: 69%
100
n = 10
80
72 - 80
81 - 99
100
Tenant’s Share
Application of Chemicals
100
64 - 71
Cutting
100
n = 14
Average Tenant’s
Share: 86%
Average Tenant’s
Share: 93%
80
n = 34
85
80
60
50
40
30
20
20
0
0
0
0
1 - 35
36 - 63
64 - 71
0
0
72 - 80
81 - 99
% of Responses
% of Responses
% of Responses
64
60
40
21
20
0
100
0
0
1 - 35
12
0
36 - 63
Tenant’s Share
Raking
n = 34
0
100
0
100
n = 34
85
40
1 - 35
60
40
20
12
0
64 - 71
0
0
72 - 80
81 - 99
100
Tenant’s Share
0
0
0
0
1 - 35
3
0
36 - 63
64 - 71
Lime Application
n=7
80
60
43
40
29
29
20
0
0
0
1 - 35
36 - 63
72 - 80
Tenant’s Share
100
Average Tenant’s
Share: 43%
0
0
0
64 - 71
72 - 80
81 - 99
64 - 71
0
0
72 - 80
81 - 99
Average Tenant’s
Share: 88%
100
Tenant’s Share
CR-230.7
100
n = 29
72
60
40
20
12
3
36 - 63
36 - 63
80
% of Responses
60
0
1 - 35
Tenant’s Share
80
0
3
0
Hauling
Average Tenant’s
Share: 93%
85
% of Responses
% of Responses
81 - 99
0
Baling
20
% of Responses
72 - 80
100
80
0
64 - 71
0
Tenant’s Share
100
Average Tenant’s
Share: 93%
40
20
14
0
60
0
81 - 99
100
0
17
0
0
10
0
1 - 35
36 - 63
64 - 71
0
0
72 - 80
81 - 99
Tenant’s Share
100
The Oklahoma Cooperative Extension Service
Bringing the University to You!
The Cooperative Extension Service is the largest,
most successful informal educational organization in
the world. It is a nationwide system funded and guided
by a partnership of federal, state, and local governments that delivers information to help people help
themselves through the land-grant university system.
Extension carries out programs in the broad categories of agriculture, natural resources and environment;
family and consumer sciences; 4-H and other youth;
and community resource development. Extension
staff members live and work among the people they
serve to help stimulate and educate Americans to
plan ahead and cope with their problems.
Some characteristics of the Cooperative Extension
system are:
•
•
The federal, state, and local governments
cooperatively share in its financial support and
program direction.
It is administered by the land-grant university as
designated by the state legislature through an
Extension director.
•
Extension programs are nonpolitical, objective,
and research-based information.
•
It provides practical, problem-oriented education
for people of all ages. It is designated to take
the knowledge of the university to those persons
who do not or cannot participate in the formal
classroom instruction of the university.
•
It utilizes research from university, government,
and other sources to help people make their own
decisions.
•
More than a million volunteers help multiply the
impact of the Extension professional staff.
•
It dispenses no funds to the public.
•
It is not a regulatory agency, but it does inform
people of regulations and of their options in meeting them.
•
Local programs are developed and carried out in
full recognition of national problems and goals.
• The Extension staff educates people through
personal contacts, meetings, demonstrations,
and the mass media.
•
Extension has the built-in flexibility to adjust its
programs and subject matter to meet new needs.
Activities shift from year to year as citizen groups
and Extension workers close to the problems
advise changes.
Oklahoma State University, in compliance with Title VI and VII of the Civil Rights Act of 1964, Executive Order 11246 as amended, Title IX of the Education Amendments of 1972, Americans
with Disabilities Act of 1990, and other federal laws and regulations, does not discriminate on the basis of race, color, national origin, sex, age, religion, disability, or status as a veteran in any
of its policies, practices, or procedures. This includes but is not limited to admissions, employment, financial aid, and educational services.
Issued in furtherance of Cooperative Extension work, acts of May 8 and June 30, 1914, in cooperation with the U.S. Department of Agriculture, the Vice-President, Dean, and Director of Cooperative Extension Service, Oklahoma State University, Stillwater, Oklahoma. This publication is printed and issued by Oklahoma State University as authorized by the Dean of the Division
of Agricultural Sciences and Natural Resources and has been prepared and distributed at a cost of 42 cents per copy. 0313 GH Revised.
CR-230.8

© Copyright 2026