
MEASUREMENTS OF HEAVY METALS AND NATURAL RADIOACTIVITY
MEASUREMENTS OF HEAVY METALS AND NATURAL RADIOACTIVITY
LEVELS IN SOILS AROUND THE TITANIUM MINING SITE IN KWALE
DISTRICT
DOUGLAS NDIRANGU MAINA
B. Sc. (Hons)
A THESIS SUBMITTED IN PARTIAL FULFILLMENT OF THE
REQUIREMENTS OF THE DEGREE OF MASTER OF SCIENCE IN NUCLEAR
SCIENCE OF THE UNIVERSITY OF NAIROBI
SEPTEMBER 2008
Declaration
This is my original work and has not been presented in support of award of any degree or
qualification of the University of Nairobi or any other University.
…………………………………………..
…………………………………………..
Douglas Ndirangu Maina
Institute of Nuclear Science and Technology
University of Nairobi
Date
This thesis has been submitted for examination with our approval as the University
supervisors.
…………………………………………..
…………………………………………..
Maina, D. M.
Mangala, M. J.
Date: ……………………………………
Date: ……………………………………
Institute of Nuclear Science and Technology
University of Nairobi
i
To my parents for all their support and guidance they have provided throughout my life
and for their constant encouragement to have this work complete.
To George Mithamo, for accommodating me during my entire study period.
And to Julia, my soul mate, my inspiration, my friend.
ii
Acknowledgements
Special thanks to Alice Karuri through whom the idea of pursuing this noble cause came
to my mind and who together with Musyimi, then a postgraduate student at the Institute
of Nuclear Science & Technology, encouraged me to take up the challenge. Maina, D.
M., Dr. A. M. Kinyua, the current and the former Directors of the Institute of Nuclear
Science & Technology, and Prof. L. Njenga, my former Chemistry lecturer at Chiromo
College of Biological and Physical Sciences (UoN), recommended me to the Board of
Postgraduate Studies, BPS, for scholarship award, and for which I am sincerely grateful.
Special thanks to the entire staff of Radiation Protection Board for their assistance during
the initial stages of project formulation and the continued support; more particularly to
Mr. Joel Kamande, the Chief Radiation Protection Officer, for allowing me access to the
Board’s facilities used in this work, and to Mr. Joseph Maina for his selflessness and
desire to see me through whenever called upon.
To the Department of Geology and Mines, Ministry of Natural Resources & Environment
and especially the Librarians, my gratitude is beyond measure. To the then Kwale District
Geologist, Mr. Martin Nyakinye for his hospitality and guidance; the Ministry of
Education for permission to do sampling in Kwale district; the then Kwale District
Officer, Mr. Gabriel Rossie, for his warm welcome to the district; and to the then
Technical Director, Tiomin - Kenya, Mr. Collin Forbes, for the brief overview of Kwale
District in respect of radioactivity measurements and titanium mining.
Dr. James Kairu, a great mangrove conservationist, a scholar, a lecturer at the University
of Nairobi and a brother, based in Msambweni, Kwale district, together with my sister,
Lucy Wanjiku, hosted me from time to time during my fieldwork. I thank Neema
Mwamoto Juma and Thuo Kairu for their immense moral support and energy as
volunteer guides; and to Kijana Maarifa and Japheth Shughuli who selflessly stood by me
during sampling in Nguluku and Maumba, respectively, despite the hostility encountered
from the locals opposed to the titanium mining project in the initial stages.
iii
Very special thanks to the entire staff and students of the Institute of Nuclear Science and
Technology, for their team spirit and assistance. More so, to the Laboratory Technicians,
Simon Bartilol and Joseph Njogu, thank you so much for your time and guidance during
my entire lab-work.
To my supervisors, Maina D.M. again and Mangala M. J., it is their continuous
encouragement as my supervisors that has immensely contributed to the success of this
project. Very special thanks for having been such a great source of inspiration and a
fountain of knowledge.
And to all those who have contributed directly or indirectly, in cash or kind, I thank you
all.
Above all else, I thank our Creator for having provided me with the energy and resources
to make this work a true symbol of success and a firm foundation for a strong academic
pillar.
iv
List of Important Abbreviations
ADC
-
Analog Digital Converter
AQCS
-
Analytical Quality Control services
AXIL
-
Analysis Of X-Rays Using Iterative Least Square Method
BDL
-
Below Detection Limit
CES
-
Coastal Environmental Services
EDXRF
-
Energy Dispersive X-Ray Fluorescence
FWHM
-
Full Wave at Half Maximum
GANAAS
-
Gamma, Activity and Neutron Activation Analysis Software
Ge(Li)
-
Germanium-Lithium Drifted
GIS
-
Geographical Information System
HPGe
-
High Purity Germanium
IAEA
-
International Atomic Energy Agency
ICRP
-
International Commission on Radiological Protection
ICRU
-
International Commission on Radiological Units and
Measurements
ILO
-
International Labour Organization
JICA
-
Japanese International Co-Operation Agency
KeV
-
Kilo Electron-Volt
LLD
-
Lowest Limit of Detection
MCA
-
Multi-Channel Analyzer
MDA
-
Minimal Detectable Activity
MPD
-
Maximum Permissible Dose
NCRP
-
National Council on Radiation Protection
NORM
-
Naturally Occurring Radioactive Material
NSRA
-
Nuclear Safety Research Association
QXAS
-
Quantitative X-Ray Analysis System
Si(Li)
-
Silicon-Lithium Drifted
SIPRI
-
Stockholm International Peace Research Institute
SRM
-
Standard Reference Material
v
TRMC
-
Taiwan Radiation Monitoring Center
UNSCEAR
-
United Nations Scientific Committee on the Effects of Atomic
Radiation
WHO
-
World Health Organization
vi
Abstract
This study was initially formulated specifically to provide data of radioactivity and
elemental content of soils from two regions; Nguluku and Maumba, in Kwale District,
that are earmarked for Titanium mining project. However, while radioactivity levels for
both Nguluku and Maumba regions were assessed; elemental analysis for heavy metals
was only carried out for Maumba. A total number of fifty samples were analyzed for
heavy metals using energy dispersive x-ray fluorescence (EDXRF) system which consists
of a radioisotope cadmium-109 source and a silicon-lithium drifted (Si(Li)) detector.
Radioactivity levels of the samples were determined using a high purity germanium
(HPGe) detector.
Iron and titanium were observed as the major elemental constituents of the Maumba soils
with concentration levels of 1.21% and 1.57%, respectively. Zirconium and manganese
levels were also found to be high, with mean levels of 1193.3 µg/g and 822.2 µg/g
respectively. Niobium concentration level was found to vary between (13.77 - 79.24)
µg/g with a mean of 31.81 µg/g in these samples. These levels were found to be lower
than those reported earlier for Mrima Hill soil samples. Concentrations distribution of
titanium and zirconium in the samples were found to have a strong correlation of r=0.97.
Activity concentrations of the three major primordial radionuclides – thorium-232,
uranium-238 and potassium-40 – in the fifty samples from Maumba and seven samples
from Nguluku were assessed. High contributions from Th-232 and U-238 determined as
72.0 and 50.2 Bq/kg in Maumba and 178 and 162 Bq/kg in Nguluku soil samples. These
levels are much higher than the world average of 25 Bq/kg. Contribution from K-40 was
found to be negligible in all the samples analysed.
Elemental concentrations of titanium, iron, zirconium and niobium were found to
correlate significantly with the activity concentration levels of radionuclides in the Th232 and U-238 series.
vii
Using an occupancy factor of 0.2, annual effective dose to an adult due to gamma rays, in
air 1 m above the ground was estimated to be 156 µSv in Nguluku. This level exceeds the
world average effective dose (< 70 µSv) by a factor of two. Results for Maumba samples
have been presented for three sub-regions – Miembeni, Maumba Central and Maumba ya
Chini. The annual effective dose levels for the three sub-regions are 84, 44 and 23 µSv
respectively.
viii
Table of Contents
DECLARATION................................................................................................................ I
DEDICATIONS ............................................................................................................... II
ACKNOWLEDGEMENTS ........................................................................................... III
LIST OF IMPORTANT ABBREVIATIONS ............................................................... V
ABSTRACT ................................................................................................................... VII
CHAPTER 1 INTRODUCTION ..................................................................................... 1
1.0 Background ....................................................................................................... ………1
1.1 Natural Source of Ionising Radiation ........................................................................... 3
1.2 Ionizing Radiation ......................................................................................................... 4
1.3 Monitoring of Natural Radiation .................................................................................. 5
1.4 Monitoring of Radioactivity in Kenya .......................................................................... 6
1.5 Area of the Study ........................................................................................................ 10
1.5.1 Location ................................................................................................................... 10
1.5.2 Geology and Titanium Mineralization of Kwale ..................................................... 10
1.5.3 Nguluku Region ....................................................................................................... 12
1.5.4 Maumba Region ....................................................................................................... 13
1.6 Statement of the Problem ............................................................................................ 15
1.7 Objectives of the Study ............................................................................................... 16
1.8 Hypotheses of the Study ............................................................................................. 16
1.9 Justification and the Significance of the Study ........................................................... 17
CHAPTER 2 LITERATURE REVIEW ....................................................................... 18
2.0 Contributions to Global Data on Radiation Measurements ........................................ 18
2.1 Global Monitoring of Natural Radiation..................................................................... 19
2.2 Studies on natural radioactivity in Kenya ................................................................... 26
ix
CHAPTER 3 EXPERIMENTAL PROCEDURES ...................................................... 30
3.0 Introduction .......................... ………………………………………………………...30
3.1 Sampling ..................................................................................................................... 30
3.1.1 Nguluku Samples ..................................................................................................... 32
3.1.2 Maumba Samples ..................................................................................................... 32
3.2 Sample Preparations for Radioactivity Measurements ............................................... 33
3.3 Sample Preparations for X-ray Fluorescence Analysis .............................................. 35
3.4 EDXRF Instrumentation and Measurements .............................................................. 36
3.4.1 Accuracy of EDXRF by the Fundamental Parameter Method ................................ 37
3.4.2 Lower limits of Detection, LLD .............................................................................. 37
3.4.3 Calculations of Elemental Concentrations ............................................................... 38
3.5 The Gamma-ray Spectrometric Instrumentation and Measurements ......................... 38
3.5.1 Apparatus And Spectral Collection ......................................................................... 39
3.5.2 Detector Calibration ................................................................................................. 41
3.5.3 Standard Reference Material for Intercomparison................................................... 41
3.5.4 Calculation of Radionuclide Concentrations .......................................................... 42
3.6 Determination of Dose Rate and Exposure ................................................................. 43
CHAPTER 4 RESULTS AND DISCUSSIONS ........................................................... 45
4.0 Introduction ................................................................................................................. 45
4.1 Results of EDXRF Analysis ....................................................................................... 46
4.1.1 Accuracy of the Si(Li) Detector in determination of Elemental Concentrations..... 46
4.1.2 Detection Limits of Si(Li) Detector for the Elements of Interest ............................ 47
4.1.3 Maumba Samples ..................................................................................................... 48
4.1.4 Occurrence and Distribution of Elemental Concentrations of Maumba Samples ... 48
4.2 Results of Gamma Ray Analysis ................................................................................ 55
4.2.1 Accuracy of the Gamma Analysis Method Used ..................................................... 55
4.2.2 Detection Limits for Gamma Analysis for Th-232, U-238 and K-40...................... 56
4.2.3 Activity Concentrations of Th-232, U-238 and K-40 in Soil Samples from Maumba
.............................................................................................................................. 58
4.2.4 Activity concentrations of Th-232, U-238 and K-40 in soil samples from Nguluku ..
..................................................................................................................... 63
4.3 Outdoor Gamma Dose Rate Levels in Maumba ......................................................... 66
4.4 Exposure and Dose Rate Levels in Nguluku .............................................................. 67
x
CHAPTER 5 CONCLUSIONS AND RECOMMENDATIONS ................................ 68
5.0 Introduction ................................................................................................................. 68
5.1 General Conclusions ................................................................................................... 68
5.2 Recommendations and Suggestions for Further Research.......................................... 69
REFERENCES................................................................................................................ 71
xi
List of Figures
Figure 1.1: Map of Kenya showing the location of Kwale District in the Coast Province
........................................................................................................................ 11
Figure 1.2: Map of Kwale District showing the administrative boundaries and the roads
network ........................................................................................................... 12
Figure 3.1: Map showing the sampling sites of Nguluku, Maumba and their environs in
Kwale District. ............................................................................................... 31
Figure 3.2: Direct samples excitation with annular cadmium-109 .................................. 37
Figure 3.3: Schematic diagram of an EDXRF detector system ....................................... 40
Figure 4.1: Activity levels of Th-232, U-238 & K-40 in Miembeni samples ................. 60
Figure 4.2: Activity levels of Th-232, U-238 & K-40 in Maumba Central ..................... 62
Figure 4.3: Activity levels of Th-232, U-238 & K-40 in Maumba ya Chini ................... 64
Figure 4.4: Activity levels of Th-232, U-238 & K-40 in Nguluku samples .................... 65
xii
List of Tables
Table 2.1: Values of Maximum Permissible Dose and Dose Limits for Specified Organs
and Tissues as Recommended by ICRP and IAEA ....................................... 21
Table 2.2: The mean activity concentrations of U-238, Th-232, Ra-226, and K-40 for
different countries in comparison with the world average values. ................. 27
Table 3.1: Samples Descriptions – Nguluku Samples ..................................................... 32
Table 3.2: Samples Descriptions – Maumba Samples ..................................................... 33
Table 3.3: Some Important HPGe Detector Parameters .................................................. 40
Table 3.4: Activity concentratin levels of radionuclides under investigation in the
standard reference material as at December 31, 1991.................................... 42
Table 4.1: Results of EDXRF Analysis of Certified Reference Material, IAEA Soil 7. .. 46
Table 4.2: Lower Limits of Detection of Si(Li) for the Elements of Interest ................... 47
Table 4.3: Elemental concentrations for soil samples from Miembeni, Maumba ............ 50
Table 4.4: Correlation Matrix Table for EDXRF Results of the Major Constituents....... 51
Table 4.5: Elemental concentrations for soil samples from Maumba Central .................. 51
Table 4.6: Elemental concentrations for soil samples from ‘Maumba ya Chini’ ............. 52
Table 4.7: Correlation Matrix Table for Activity Concentrations of Th-232 and U-238
and the Elemental Concentrations of Titanium, Iron and Zirconium ............ 53
Table 4.8: Results of Gamma Analysis of Certified Reference Material, IAEA Soil 375.
........................................................................................................................ 56
Table 4.9: Lower Limits of Detection of the HPGe Detector for the radionuclides of
interest ............................................................................................................ 58
Table 4.10: Activity concentrations of Th-232, U-238 and K-40 in soil samples from
Miembeni .................................................................................................... 59
Table 4.11: Activity concentrations of Th-232, U-238 and K-40 in soil samples from
Maumba Central .......................................................................................... 61
xiii
Table 4.12: Activity concentrations of Th-232, U-238 and K-40 in soil samples from
‘Maumba ya Chini’ ..................................................................................... 63
Table 4.13: Activity concentrations of Th-232, U-238 and K-40 in soil samples from
Nguluku ....................................................................................................... 65
Table 4.14: Outdoor Dose rate and Annual Effective Dose for Maumba ........................ 66
Table 4.15: Outdoor Total Dose Rate and Annual Effective Dose Rates for Nguluku
region........................................................................................................... 67
xiv
APPENDICES
Appendix I: Uranium-238 Decay Series .......................................................................... 77
Appendix II: Thorium-232 Decay Series .......................................................................... 78
Appendix III: Typical AXIL computer generated elemental concentrations report ......... 79
Appendix IV: Typical EDXRF Spectrum - Standard Sample, Soil-7 .............................. 80
Appendix V: A typical spectrum from titanium bearing ore samples of Kwale – sample
24A1 ............................................................................................................ 81
Appendix VI: A typical spectrum from titanium bearing ore samples of Kwale – sample
2B2 .............................................................................................................. 82
Appendix VII: A Typical Gamma Spectrum .................................................................... 83
xv
Chapter 1
Introduction
1.0 Background
Naturally occurring radioactive materials (NORMs), under certain conditions, can reach
radiologically hazardous levels. The natural radioactivity in soil comes mainly from the
radionuclides in the U-238 and Th-232 series, and K-40. The radiological implication of
these radionuclides is external radiation exposure by gamma rays and internal exposure
due to inhalation of radon and its daughters. (UNSCEAR, 1988).
Measurements of radiation exposure by gamma rays from NORMs, and consequently the
determination of the respective dose rate are needed to implement radiation safety
measures. Over time, the exposure of human beings to natural sources of radiation have
been carefully evaluated and constitutes about 80% of the dose received by an average
person (WHO, 1972).
According to UNSCEAR report (1993), the tendency towards an increase in radioactivity
at the global level must be closely monitored. This is particularly important in connection
with the disposal of radioactive wastes into the sea and elsewhere in isolated areas and
also from the peaceful use of nuclear energy development. The development of nuclear
technology for national defense and generation of power, and the applications of
radionuclides in medicine, industrial research, and consumer products result in the release
of radioactive material into the environment. Other activities that have led to increase in
radioactivity in the environment include production of non-nuclear fuels such as coal, oil
1
and gas; production of industrial minerals like phosphate and clay materials and also
failures in the waste containment systems (IAEA, 2003). Testing of nuclear weapons,
including the use of depleted uranium, has also led to widespread radioactive
contamination in the environment.
Monitoring of radiation is done both on global or national scale, and on local scale
around installations such as nuclear plants or research institutions. According to WHO
(1972), environmental radiation monitoring systems were first organized in a number of
countries to monitor radiation fallout from nuclear weapon tests. At a later stage, these
systems were developed to monitor the radiation levels around nuclear installations,
nuclear power stations and research reactors. In the recent past, monitoring has also been
extended to non-nuclear industries involving natural radioactivity (Botezatu et al, 1999)
such as mineral mining and processing plants. Originally, these monitoring systems were
under the responsibility of national atomic energy commissions, and it was only later that
public health authorities in some countries became involved in the monitoring of
radioactivity levels in the environment (WHO, 1972).
Processing of earth minerals for economic purposes may expose miners and the general
public to additional natural radiation exposure when these minerals, or their by-products,
contain above-average concentration levels of naturally occurring radionuclides.
According to UNSCEAR report (2000), very little information is available to assess these
additional exposures and hence the related exposure dose estimates are highly uncertain
2
.1
Natural Source of Ionising Radiation
The main natural sources of ionizing radiation are extra-terrestrial; comprising cosmic
radiation and cosmogenic radionuclides, and terrestrial radiation due to the primordial
radionuclides (SIPRI, 1981). The exposures from these sources vary very slightly with
time. The magnitude of exposures to cosmic is largely dependent on the geographical
location and altitude. For instance, the higher the altitude, the higher the exposure.
Cosmogenic radionuclides are those formed as a result of interaction of the primary
cosmic ray with earth’s atmospheric elements. Examples are C-14, H-3 and Be-7.
Primordial radionuclides are those that are thought to have occurred since the creation of
the earth. They include U-235, U-238, Th-232, and K-40. These are often characterized
by long half-lives in the order of hundreds of thousands of years.
The other category of exposures is the technologically enhanced natural exposure. These
are exposures to natural sources of radiation that are caused by human activities.
Examples of technologically enhanced exposures include exposures to cosmic radiation
during air and space travels. For example, at 10 km height, aircraft crews and frequent
travellers are subjected to 1 to 2.5 µSv/h near the equator and 4 to 6 µSv/h above 500N
(Kraus and Kendall, 1999). Additional cases of enhanced exposures include mining
activities in phosphate industry, processing of monazite sands for rare earths extraction,
oil and gas industry and coal-fired work stations.
3
.2
Ionizing Radiation
Ionizing radiation may be divided into two main groups: the electromagnetic radiation (xrays and gamma rays) and the corpuscular radiation, some of which (alpha particles, beta
particles, and protons) are electrically charged whereas others (neutrons) have no electric
charge. The corpuscular or the particulate type may be regarded as projectiles whose
energy is greater than that binding the atoms in chemical compounds. They are thus
capable of breaking chemical bonds and dividing the electrically neutral molecules into
positively and negatively charged ions.
When x-rays and gamma rays are absorbed, high-energy electrons are released in the
irradiated materials, and it is these electrically charged particles that are the effective
ionizing agents. The action of the neutrons is more complex. When they collide with the
nuclei of hydrogen atoms, these nuclei (or protons) are set in motion and produce
ionization. Neutrons may also enter the atomic nuclei, causing such instability that the
atoms themselves disintegrate and emit radiation that, in turn, produces ionization.
Mechanisms of radiation interaction with matter are discussed in details by Knoll (Knoll,
1979). The common characteristic of all the types of radiation, whether electromagnetic
or corpuscular, is that charged particles are produced and are responsible for the
ionization effects they ultimately produce.
The biological effects of these types of radiation, which are related to the ionization that
they are capable of producing in living tissue, are essentially similar. However, the
distribution of damage they cause in the body will vary according to the type, energy and
4
penetrating power of the radiation involved. According to IAEA report (1974), alpha
particles, for example, have ranges of only about 0.01 to 0.07 mm in soft tissue and less
in bone. Beta particles have ranges in soft tissues of the order of several millimetres, that
is, much greater than those of alpha particles in such tissues.
In human beings, radiation exposure may cause such diseases as blood cancer and may
also cause somatic and genetic effects. In the somatic effects, the victim carries the
hazard whereas in the case of genetic effects, it is the offsprings of the irradiated victim,
or the future descendants that may suffer the consequences. To avoid such negative
effects, various organizations worldwide have come up with standards on radiation safety
guidelines. Among them are: International Commission on Radiological Protection
(ICRP), International Atomic Energy Agency (IAEA), International Labour Organization
(ILO), International Commission on Radiological Units and Measurements (ICRU) and
the United States’ National Council on Radiation Protection and Measurements (NCRP).
These organisations recommend that the guidelines they produce may be adopted or
improved on by national regulatory organisations. As such, practically all countries have
such organisations; in Kenya, the Radiation Protection Board is the organisation
responsible for matters relating to radiation uses, monitoring and protection.
1.3 Monitoring of Natural Radiation
As a result of effects from ionizing radiation on human beings, monitoring of natural
radiation has been a concern of the scientific community for several decades. The oldest
of the scientific organisations in this area is the International Commission on
5
Radiological Protection (ICRP) formed in 1928. ICRP has maintained continuous studies
in radiation monitoring and protection problems that are of special relevance to the
radiation control programs. UNSCEAR, established 1955, presents to the United Nations
General Assembly, and thereby to the world community, its latest evaluation of the
sources of ionizing radiation and effects of its exposures. IAEA was set up in 1957 within
the United Nations family as the world’s center of cooperation in the nuclear field to
promote safe, secure and peaceful nuclear technologies. IAEA, in its part, while
responding to the needs of its member states, recently launched an environmental
remediation project dealing with problems of radioactive contamination worldwide
(IAEA, 2006b). Its aim is to collate and disseminate information concerning the key
problem affecting the environment and remediation of contaminated sites.
The techniques employed globally in radiation monitoring include periodic physical
examinations and estimation of internally deposited radioactivity by bioassay and total
body counting. Personnel monitoring, radiation and contamination surveys, and
continuous environmental monitoring are other approaches utilised in radiation
monitoring.
1.4 Monitoring of Radioactivity in Kenya
Over time, various surveys to monitor the levels of radioactivity have been carried out in
Kenya by researchers in the universities and also by the Radiation Protection Board. In
the year 2000, a South African private firm, contracted by Tiomin (Kenya) to do an
6
environmental impact assessment of the proposed Titanium mining area reported on the
radioactivity levels (CES, 2000).
Mangala (1987) reported that the high radiation levels at Mrima Hill, about 60 Km
Southeast of the Mombasa Island and about 30 Km South of Kwale Township, was due
to occurrence of thorium and uranium. Titanium was also reported as one of the major
constituents in rocks samples from Mrima Hill; its concentrations were observed to be in
the range of 1- 9% with a mean value of 4.7% for most samples analysed.
Mustapha (Mustapha, 1999) and Mustapha et al (1999) carried out an assessment of
human exposures to natural radiation in Kenya, mainly in Nairobi, Kiambu, Kwale
Mombasa, Machakos, Bungoma and Trans Nzoia, and reported an average effective dose
of 3.79 mSv.y-1. This value is above the world average of 2.4 mSv.y-1 and therefore
dictates further assessments of even smaller regions of the studied areas.
The Kenyan coastal region, in particular, has been a concern to many researchers as a
region of high background radiation. Austromineral, an Austrian minerals prospecting
company, in collaboration with the government of Kenya, carried out a mineralization
study of the South Coast in 1978 (Austromineral, 1978). It was found the sediments
containing zircon ore and some concentrations of radioactive isotopes of lead and zinc
were distributed in the region. Niobium and rare earths were found to be concentrated in
Mrima-Jombo areas leading to the high alkalinity of the partially dominant igneous rocks
in the regions. According to Patel (1991a & b), gamma radiation levels were found to be
7
usually high at and around Mrima hill area, in addition to the cosmic content, which may
expose the residents beyond world average limit of 2.4 mSv annually.
According to Radiation Protection Board report (RPB, 1999), some patterns of high
radioactivity were reported in some areas of the South Coast area mainly due to the high
levels of radiation from the Mrima Hill confirming the results of Patel (Patel, 1991b). The
Radiation Protection Board carried out external radiation measurements at Mrima Hill
and along the roads known to have been gravelled using radioactive materials from
Mrima. Other places such as Mombasa Island, where there was no effect of the
radioactive gravelling materials, were also surveyed for comparisons. Radiation levels
from Mombasa Island were found to be very low, about 90 Bq/kg of Th-232 on average,
as compared to Likoni-Lunga Lunga highway, the stretch from Msambweni to Kenya Tanzania border point (Figure 1.2), where along this stretch, an average activity of 600
Bq/kg of Th-232 was recorded on the tarmac 15 mm deep, and as high as 1200 Bq/kg
(Th-232) at the base gravel, 500 cm deep. However, from Lunga Lunga to Msambweni
Hospital still along this highway, where no gravel from Mrima Hill was used, values
recorded averaged 70 Bq/kg(Th-232). Other areas like Mwangwei-Majoreni-Jego road, a
loose gravel road, recorded 1200 Bq/kg of Th-232. From these measurements, the annual
effective dose rate from outdoor terrestrial radiation, was determined to be 6.1 x 10⁻⁵ Sv/a
and for the indoor exposure, using an occupancy factor of 0.8, the annual effective
exposure dose equivalent was determined to be 2.9 x 10⁻⁴ Sv/a, which is within the
UNSCEAR 1993 recommendations of an annual effective dose not exceeding 3.5 x 10⁻⁴
S/a.
8
According to a report by Coastal and Environmental Services (2000), a South-African
consulting firm, the physical environment at Kwale proposed titanium mining site is
composed of two large sand dunes separated by the Mukurumudzi River. This river
serves as a source of water for domestic purposes to the neighbouring households. Owing
to its vicinity to the proposed titanium site, high contamination of the water is highly
inevitable in future once the mining process commences.
According to Wamicha et al (2000), rutile and zircon, two titanium bearing ores, were
found to contain appreciable concentrations of uranium and thorium for samples from
Msambweni titanium mineral deposits. Rutile was found to have about 28 µg/g of
uranium and 24.7 µg/g of thorium. Zircon was found to contain about 309 µg/g of
uranium and 143 µg/g of thorium. Ilmenite was found to contain no concentrations of
these two radioactive elements.
Other studies which have been carried out on natural radiation measurements in the
country include Maina et al (2002) on indoor radon (Rn-222) in Coastal and Rift Valley
regions of Kenya and Agola (2006) on natural radiation levels in (Olkaria) Geothermal
region and Nderito (unpublished) on natural radiation study in Kerio Valley.
The mentioned studies, which have been discussed further in Chapter 2, have largely
contributed to the continuous radiation monitoring program in Kenya. This is especially
important to the government of Kenya in general and in particular to the radiation
monitoring section of the Ministry of Health which is responsible for radioactivity
9
mapping, monitoring and protection in the country. This study aims at contributing
further to the ministry efforts in and gathering more information on possible enhancement
of radiation exposure in Kenya and particularly at the titanium mining sites in the
southern coastal region.
1.5 Area of the Study
1.5.1 Location
The study area is located in Kwale district, in the coastal region of Kenya, and lies
between longitudes 38o31’ and 39o31E and latitudes 3o30’ and 40 45S. The region borders
the Taita Taveta district to the northwest, Kilifi district to the north, Mombasa district to
the northeast, Indian Ocean to the south east and Tanzania to the South as shown in
Figure 1.1.
1.5.2 Geology and Titanium Mineralization of Kwale
The coastal region of Kenya, along the Indian Ocean, is generally characterized by
sediments of Triassic to Jurassic ages, igneous rocks of Cretaceous age and the
unconsolidated sediments of Tertiary to Quaternary ages (JICA, 1993). Triassic to
Jurassic sediments are mainly comprised of sandstone beds. Igneous rocks are widely
observed in the form of intrusive of alkaline rocks of varied type. The unconsolidated
sediments are observed to be composed of Tertiary sediments and the alluvial and
colluvial residues of Quaternary age (JICA, 1993). A detailed discussion on the geology
of the area is presented by Caswell and Baker (1993).
10
Figure 1.1: Map of Kenya showing the location of Kwale District in the Coast Province
11
Figure 1.2: Map of Kwale District showing the administrative boundaries and the roads
network
1.5.3 Nguluku Region
According to Austromineral report (Austromineral, 1978) on Kenya’s coastal
mineralization, Nguluku area is mainly comprised of Maji-ya-Chumvi Formation and
Igneous rocks both of Duruma Group of Formations. The other members of Duruma
12
Group are Mariakani Formation, Mazeras Formation, and Magarini Formation. The
geological arrangement is such that Nguluku Body is considered to be of a vent by
igneous activities of alkaline rock composed of the so-called “agglomerate”. Niobium
and rare earths can be expected to be the main components of the alkaline igneous rock.
The same mineralization was reported in Mrima-Jombo area under the same alkaline
igneous conditions. Post-reef sediments and the coral reef sediments were associated with
zircon and limestone respectively.
In the JICA report (1993), the Maji-ya-Chumvi Formation is divided into such three
members as Upper, Middle, and Lower members in upward grading. Lower and Middle
members are dominated by shale and siltstone beds while the Upper member consists of
sandstone beds. In the same report, a high content value of salt has been reported in shale
beds of lower member to pose a sedimentary probability under arid environmental
condition hence the name “Maji-ya-Chumvi”, which means “saline water” in Swahili
language. Sandstone beds in Upper Member are massive and are comprised of silty
sandstone beds with flaggy texture and well-developed joints.
1.5.4 Maumba Region
Rutile (TiO2), ilmenite (FeOTiO2) and zircon (ZrSiO4) minerals appear in Maumba and
Nguluku with respective specific gravities of 4.72, 4.2 to 4.3, and 3.9 to 4.7 (CES, 2000).
This shows that they are heavy sands (specific gravity beyond 2.9). They are therefore
deposited at similar sites through sedimentation in riverine and marine waters. Ilminite
and rutile are titanium-bearing (titaniferous) minerals while zircon belongs to zirconium
13
and zirconia-bearing minerals. Rutile and ilmenite are used to make titanium metal or
titanium dioxide (TiO2) pigment, a white non-toxic substance. Zircon is used mainly in
the manufacture of tiles and in the refractory and foundry industries. Thus, rutile, ilmenite
and zircon are targets for titanium-mining project in the near future of this region under
study.
According to CES (2000) the geological arrangement in Maumba region is actually
expected to greatly alter in the process of extracting these minerals. As such, this may
expose the environment to the suspected radionuclides in the affected regions.
Information in the same report indicates that in the Maumba area, the titanium mineral
deposits constitute about 5.7% of the Magarini sediments. The concentrations reduce
southwards to about 3% in the Nguluku area. Coral reef deposits give high existence of
limestone whereas a lead/zinc mineralization appears about 3 Km Northeast of Kwale
Township. Other minerals in the Southern Coast are gypsum and Kimberlitic Diatremes,
a diamond mineral (Ausrolmineral, 1978). Monazite, a rare earth bearing mineral, is one
of the principal sources of radioactivity of mineral sands deposits. However, according to
CES (2001), Kwale deposits contain very low concentrations of monazite. This results in
very low contaminations of ilminite, rutile and zircon hence low activity levels of 1.5, 5.2
and 49.8 Bq/g. Typical activity ranges encountered worldwide in such minerals are
estimated to be 3 – 30, 3 – 20 and 30 – 65 Bq/g respectively (CME, 2000).
14
1.6 Statement of the Problem
Exposure to the naturally occurring radioactive materials (NORMs) is actually enhanced
through mining/excavation works and the processing of minerals. According to
UNSCEAR report (1993), communities living near mineral sands mining operations may
be exposed to about 100 times the normal background levels (approximately 2.4 mSv per
year). Heavy mineral sands usually contain high concentrations of uranium and thorium
compared to the average levels in normal soils and rocks (UNSCEAR, 1993).
One of the ways in which the mining operations cause exposures of the general public is
the use of mine by- or waste-products for building and road construction. For example,
the use of gravels from Mrima Hill in the construction of the Likoni – Lunga Lunga road
increased the external dose due to gamma emission. Dust generation and re-settling or
suspended particles may also lead to changes in the distribution of the naturally occurring
radionuclides in the environment around the mines (Patel, 1991b). The use of the
titanium by/waste-products, e.g. in roads construction may enhance exposure to radiation.
(Mangala, 1987).
It was also noted (UNSCEAR, 1993) that information on exposures of members of the
public resulting from the mining and milling of mineral sands is extremely scarce. This is
also true in Kenya, and one of the reasons that there are often no pre-operational baseline
data on the environmental radioactivity levels around mines. Therefore, it is difficult to
determine the radiological implications once the mining operations have commenced.
15
This project is intended to provide baseline values of the radioactivity levels in soil
around the proposed titanium mines.
1.7 Objectives of the Study
The main aim of this study is to provide information and data on the pre-operational
status of the elemental and radionuclides concentrations in soil and rocks around the
titanium mining project site, Kwale district.
The specific objectives are:
1.
To determine the elemental concentration in the soil samples of Nguluku and
Maumba,
2.
To determine the activity concentrations of Th-232, U-238 and K-40 in soil
samples from the above areas,
3.
To determine outdoor gamma dose rate in air above ground in these areas,
4.
To compare the obtained results with data from other parts of the world.
1.8 Hypotheses of the Study
Null Hypothesis
Radioactivity levels are low and hence radiation dose in the regions of Nguluku and
Maumba are below or equal to the world average levels.
16
1.9 Justification and the Significance of the Study
The minerals found in the proposed mining areas include ilminite and rutile and
sometimes occur together with monazite, a rare earth mineral that usually contain
thorium and uranium (Binge and Mason, 1996). The proposed mining project therefore
poses a potential radiation exposure risk.
This study endeavours to determine the specific radiation levels around the proposed
mining site. This study, therefore, will be important especially to the Radiation Protection
Board in designing radiation protection control guidelines. It is therefore of primary
importance that radioactivity data that is collected for such regions earmarked for mining,
forms a basis for protection guidelines.
The results obtained in this study, together with data from other studies done earlier, will
enable projections on the possible levels of radioactivity enhancement due from the
radioactive sands extraction.
17
Chapter 2
Literature Review
2.0 Contributions to Global Data on Radiation Measurements
In this chapter, various studies reported globally and their scopes of coverage in
respective regions are discussed. It has been observed that most studies have largely
dwelled on exposure levels and their equivalent dose. To formulate the world average
radionuclide content in soil in the year 2000, UNSCEAR (2000), for instance, considered
various studies done world over. The regions reported by the UNSCEAR (2000) include
2 in Africa, 2 in North America, 1 in South America, 12 in East Asia and West Asia and
25 in Europe.
According to the UNSCEAR (2000) report, from Africa, only Algeria and Egypt were
considered to contribute data to the world average radionuclide concentrations in soil and
other materials. In the formulation of the world average radionuclide concentrations and
the associated external exposure rates in the UNSCEAR 2000 Report, there were
contributions from only two African countries – Algeria and Egypt. In the formulation of
population-weighted averages due to external exposure rates from terrestrial gamma
radiation in the same report, contributions from Sudan and Namibia were also considered
together with Algeria and Egypt. In Kenya, various studies have been carried out country
wide in areas suspected to be of high background radiation levels. In order to contribute
to global data on natural radiation levels, comprehensive studies need to be done.
18
2.1 Global Monitoring of Natural Radiation
It has been established that, on average, the effective background radiation dose rate is
about 2.4 mSv per year (UNSCEAR, 1993) and 1.1 mSv of this dose is due to
background radiation and an equal contribution due to radon exposure. This is an average
value for people living near sea level; with increasing altitude, there is a slight increase in
natural radiation due to the more intense cosmic radiation. In a few small regions of the
world, where the radioactive component of the earth’s crust is large, the terrestrial
component is enhanced, giving a natural background of 10-20 times greater (SIPRI,
1981).
Radiation exposures resulting from the extraction and processing of earth minerals have
also been studied. These exposures are relatively low in comparison to the overall
exposure from the natural sources of ionizing radiation. The average annual effective
dose worldwide arising from the extraction and processing of earth minerals, according to
UNSCEAR (1993) is estimated to be about 20 µSv. It is reported that (UNSCEAR,
1993), in an assessment of an Australian mineral mining plant, members of the public
who worked on the property adjacent to the plant site were estimated to receive a dose
slightly greater than 1 mSv/a attributed mainly to external irradiation from heavy
minerals spilled on the property. Away from the site, the main contribution to the dose
received by members of the public resulted from the inhalation of dust from the plant; the
highest doses were estimated to be about 2.5 mSv/a for five persons located 1.5-2 km
from the plant.
19
In Africa, levels of terrestrial gamma radiation in some parts of Sudan with mean
concentrations of 20.11 Bq/kg from U-238, 19.10 Bq/kg from Th-232 and 280.30 Bq/kg
from K-40 were reported to be within tolerable limits. The respective mean
concentrations were also below the world average values of 25 Bq/kg for both U-238 and
Th-232, and 370 Bq/kg for K-40 (UNSCEAR, 1988). The world average values for both
U-238 and Th-232 were further revised to 40 Bq/kg (UNSCEAR, 1993) on the basis of
higher levels reported in China and the United States. However, a more recent countrywide survey carried out in China by Pan (1999) with communication to UNSCEAR
Secretariat (UNSCEAR, 2000) indicated lower values. World median values 400, 35, and
30 Bq/Kq and the population weighted values of 420, 33 and 45 Bq/kg for K-40, U-238
and Th-232 have been suggested by UNSCEAR (2000). The population weighted values
give an average absorbed dose rate in air outdoors from terrestrial gamma radiation of 60
nGy/h with a median range of 50-59 nGy/h.
After regular global and national studies on natural and occupational radiation exposure
and its implications to man, various organizations worldwide have formulated the
radiation protection standards and guidelines. ICRP recommendations are as shown in the
Table 2.1. The dose limits for members of the republic are intended to be applied to the
effective dose equivalents to the members of the critical group which should be a
representative of those individuals in the population expected to receive the highest dose
equivalent. According to IAEA guidelines (IAEA, 1990), limit for the annual dose
equivalent is 5 mSv. However, if the exposure of the same individual extends over many
years, the average annual effective dose equivalent should not exceed 1 mSv.
20
Table 2.1: Values of Maximum Permissible Dose (MPD) and Dose Limits for
Specified Organs and Tissues as Recommended by ICRP and IAEA
Organ or tissue
MPD for adults exposed in
the course of their work
Dose Limits for members of
the public (average for
groups of individuals)
Whole body (in case of uniform
irradiation), gonads and red bone
marrow
50 mSv in a year,
30 mSv in 13 weeks
5 mSv in a year
*1 mSv in a year for a prolonged
exposure
Skin, bone & thyroid
300 mSv in a year,
80 mSv in 13 weeks
20 mSv in a year
Other single organs
150 mSv in a year,
40 mSv in 13 weeks
14 mSv in a year
Hands and forearms
750 mSv in a year,
200 mSv in 13 weeks
75 mSv in a year.
Source: WHO, 1972; *IAEA, 1990
According to Lin et al (1996), the indoor gamma dose rate in Taiwanese houses was
found to be 72 nSv/h, a level found to be higher than in other countries. Indoor radon
level, however, was much lower than most other countries. The annual effective dose for
adults in Taiwan which was found to be 1.56 mSv comprised of 0.25 mSv from cosmic
rays, 0.58 mSv and 0.28 mSv from terrestrial external and internal radiations
respectively, and 0.36 mSv from inhalation of Rn-222. According to the study, other
minor components such as cosmogenic radionuclides, inhalation of Rn-220, and ingestion
of Rn-222 were estimated to be comparable to the world average. In Taiwan, therefore,
the natural radiation dose level by year 1995 was reported to be only about two-third of
the global average of 2.4 mSv reported by UNSCEAR report of 1993 but very close to
Japanese level of 1.48 mSv (NSRA, 1992).
21
On dose assessment, Lin et al (1996), considered the major items as cosmic radiation,
cosmogenic radionuclides, terrestrial external exposure, and the terrestrial internal
exposure including radon. Exposure levels were found to be 25.7 nGy/h at sea level and
26.9 nGy/h at ground level. According to Lin et al (1996), the exposure levels at 2100 m
high (Mt. Alishan) were found to be double the value at sea level. Lin et al (1996) also
measured the shielding effect of cosmic radiation in a 20-storey building. At 155 g/cm2
concrete wall thickness, equivalent to 14 cm of lead, the cosmic component was almost
completely attenuated. In Taiwan, most people live in reinforced concrete buildings.
According to study done by Lin a decade earlier (Lin et al, 1986), two layers of 12 cm
concrete (56 g/cm2) could absorb 20% of cosmic rays. The indoor cosmic ray intensity
was estimated to be 21.5 nGy/h and its annual equivalent dose to be 0.2 mSv. Annual
effective dose was later determined to be 0.25 mSv including 0.015 mSv neutron
component and an ionizing component of 0.235 mSv.
In terms of dose, the four most important cosmogenic radionuclides are C-14, Na-22, Be7 and H-3. The four nuclides according to Lin et al (1996) have been measured routinely
by Taiwan Radiation Monitoring Centre (TRMC). However, it has been difficult to
distinguish whether they came from cosmic rays, nuclear detonation, or nuclear facilities.
Annual dose level from C-14 of 0.012 mSv/y reported by UNSCEAR (1993) has been
adopted since variability of dose from C-14 is not radiologically significant and that
contribution from the other radionuclides is negligible.
22
Miah et al (1998) determined the distribution of radionuclides in soil samples in and
around Dhaka city, Bangladesh. Concentrations of uranium, thorium and of K-40 and a
fission product Cs-137 were determined by gamma-ray spectrometry; the values
compared were with other global radioactivity measurements. Concentration values of
Cs-137 found in near-surface samples ranged from 5 to 10 Bq/kg greater than levels
obtained from samples of greater depths. The K-40 concentrations ranged from 402 to
750 Bq/kg with an average value of 574 Bq/kg, Ra-226 (uranium series) varied from 21
to 43 Bq/kg while concentrations of Th-228 ranged from 9 to 22 Bq/kg. The
concentrations of Ra-228 (thorium series) were found to range from 34 to 81 Bq/kg.
In India, Kumar et al (1999) analysed conventional building materials and by-products
from coal power plants for natural radiation due to Ra-226, Th-232 and K-40 using
gamma ray spectroscopy. According to the study, conventional building materials such as
clay bricks, sand, cement, fly ash and slag were found to have radioactivity levels below
the world averages. The concentration of primordial radionuclides in soil samples of
Gudalore Taluk in the Udagamandalam district of India was determined by
Selvasekarapandian et al (2000). The mean activities of Th-232, U-238 and K-40 were
found to be 75.3 ± 44.1 Bq/kg, 37.7 ± 10.1 Bq/kg and 195.2 ± 85.1 Bq/kg respectively.
The average outdoor absorbed dose rate in air at a height of 1 m above the ground was
found to be 74.3 ± 27.8 nGy/h, corresponding to an annual effective dose equivalent of
455.6 µSv. The dose equivalent ranged from 168.3 to 1,250 µSv. In comparison with
world average activity values of 25 Bq/kg for Th-232 and U-238 and 370 Bq/kg for K-40
23
(UNSCEAR, 1988), levels in Gudalore were found to be 3, 1.5 and 0.53 times the world
averages (Selvasekarapandian et al, 2000).
Bajwa et al (2003) studied natural radioactivity in some water and soil samples of Punjab
State in India. Uranium concentration in Amritsar and Bathinda cities were determined
using Solid State Nuclear Track Detectors which employs a plastic-etch technique. The
values obtained varied from 0.61 µg/g to 1.27 µg/g. Activity levels of Ra-226, Th-232
and K-40 were determined by use of a gamma spectroscopic technique; 43.9, 55.9 and
101.7 Bq/kg, respectively were obtained.
In the barren and cultivated soils of Bio-saline Research Station in Pakka Anna, Pakistan
radioactivity levels due to Th-232, U-238 and K-40 were determined by Akhtar et al
(2005). In the barren soils radioactivity levels due to Th-232, U-238 and K-40 were found
to be in the range of 50 – 55, 26 – 31 and 500 – 610 Bq/kg, respectively. Similar results
were found in fertilised soils; 50 – 64, 30 – 38 and 560 – 635 Bq/kg, respectively. The
results from the two soils segments were found to be within the world median ranges of
11 – 64, 17 – 60, 140 - 850 Bq/kg respectively (UNSCEAR, 2000).
Dose rate was calculated (Akhtar et al, 2005) from the activity concentration values and
were found to be in the ranges of 20.8 – 25.4, 12.0 – 14.3 and 30.2 – 33.2 nGy/h from K40, U-238 and Th–232 in barren soils respectively, and 23.5 – 26.3, 13.8 – 17.5 and 30.2
– 39.2 nGy/h from K-40, U-238 and Th–232, respectively in fertilised soils. The total
dose rates from the two soil segments were found to be in ranges of 63 – 73 and 68 – 83
24
nGy/h which were within the world median range of 18 – 93 nGy/h (UNSCEAR, 2000).
In the same study, effective dose rate values for the virgin saline and the fertilised saline
soils were found to be 82 µSv/y and 90 µSv/y respectively, far below world average.
According to UNSCEAR (2000), the worldwide annual effective dose is within 0.3 – 0.6
mSv range with an average of 0.48 mSv.
In Southern Italy, Bellia et al (1997) performed gamma ray measurements for U-238, Th232 and K-40, on rocks and soils of the island of Ustica. The concentrations obtained
ranged from 15 - 164, 16 - 174 and 201 - 1,350 Bq/kg respectively. The gamma activity
levels were compared to the mineralogical and chemical data obtained by XRD and XRF
analyses and what was observed. The observed levels of the primordial radionuclides
corresponded to the magmatological features of the rocks.
Sroor et al (2002) calculated the dose rate due to naturally occurring radioactive materials
(NORMs) in North Tushki area of the Egyptian south western desert from the
radioactivity levels obtained from the study. The activity concentrations due to Th, U and
K were found to be higher than the international recommended limits as shown earlier in
this section. The study indicated averages of 35.75 to 4576.61 Bq/kg for U-238, 36.66 to
93,824.18 Bq/kg for Th-232 and 427.17 to 10,203.18 Bq/kg for K-40. Elemental analysis
of the soil samples was also carried out for the three nuclides and the contents ranged
form 2 to 370.8 µg/g for U-238, 3.7 to 23221.6 µg/g for Th-232 and 6.3 to 335 µg/g for
K-40.
25
In Kuwait, Saad and Al-Azmi (2002) carried out measurements of radioactivity
concentrations in sediments and their correlation to the coastal structure. The average
activity concentrations obtained for U-238, Th-232, Ra-226, K-40 and Cs-137 for the
southern coastline were 13.5±6.2, 2.3±0.8, 18.4±7.5, 110.3±40.7 Bq/kg respectively and
66.5±19.25, 11.2±4.0, 59.8±5.9, 384.4±133 and 2.16±1.25 Bq/kg respectively for the
northern region of Kuwait coastline. Activity concentration due to Cs-137 was found to
be below the detection limit for the southern coastline. According to Saad and Al-Azmi
(2002), Table 2.2 compares mean activity concentrations, in Bq/Kq, of different countries
with the world averages.
2.2 Studies on natural radioactivity in Kenya
Mustapha (1999) reported high concentrations of Ra-226 and Th-232 in soils samples
from various parts in the country. In that study on the assessment of human exposure to
natural radiation in Kenya, samples (geological materials and water) from different
geological terrain, particularly the more densely populated areas; Nairobi, Kiambu,
Kwale, Mombasa, Machakos, Bungoma and Trans Nzoia districts were in the study. The
overall mean activity concentrations of K-40, Ra-226 and Th-232 in the geological
materials were found to be 705, 65 and 163 Bq/kg respectively. The estimated effective
dose due to external exposure to terrestrial gamma radiation varied from 0.06 to 2.00
mSv/y with an average of 0.76 mSv/y. Radon concentrations in various water sources
were reported to be higher than the accepted world average of 37.1 Bq/kg.
26
Table 2.2
The mean activity concentrations of U-238, Th-232, Ra-226, and K-40 for different
countries, Bq/kg
Activity concentration (ranges), Bq/kg
No
Country
1
References
U-238
Th-232
Ra-226
K-40
China
62 (26-119)
90 (35-228)
50 (18-135)
524(281-711)
Ziqiang et al (1988)
2
USA – Lousiana
34
36
64
472
Delune et al (1986)
3
Turkey
75 (15-224)
24 (5-63)
4
Republic of Ireland
37 (8-120)
26 (3-60)
60 (10-200)
350 (40-800)
McAulay and Moran (1988)
5
Spain
49 (7-204)
45 (13-165)
650 (48-1586)
Baeza et al (1992)
6
Netherlands
(290-700)
Koster et al (1988)
7
Japan
(5-185)
(5-130)
(75-1400)
Megumi et al (1988)
8
Belgium
(9-47)
(13-43)
(170-610)
Deworm et al (1988)
9
Norway
(26-50)
(720-1760)
(700-1400)
Stranden and Strand (1988)
10
Italy
(398-649)
Buttaglia and Bramati (1988)
11
Greece
214 (15-1049)
43 (18-66)
212 (24-764)
1130 (258-2464)
Travidon et al (1996)
12
France
37 (9-62)
38 (16-55)
38 (9-62)
599 (120-1026)
Lambrechts et al (1992)
13
Banglandesh
38 (20-90)
66 (51-88)
36 (18-85)
272 (217-320)
Mantazul et al (1999)
14
Bulgaria
(10-77)
(5-110)
(9-77)
(11-760)
15
Portugal
(60-85)
(42-51)
16
Taiwan
18 (0.87-35)
28 (0.4-66)
479 (16-970)
Chu et al (1992)
17
Egypt
17 (5-64)
18 (2-96)
316 (26-653)
Ibrahiem et al (1993)
18
Algeria
19
Kuwait
20
21
∗
World Averages
World Averages (population
weighted values)
(19-17)
(220-3202)
(22-77)
(16-62)
(17-630)
(27-133)
36 (5-115)
6 (2-17)
25 (10-50)
33
36 (8-72)
(184-632)
Kemru (1997)
Strezov et al (1998)
Carreira and Sequeira (1998)
Noureddine et al (1998)
227 (41-492)
Saad and Al-Azmi 2002)
25 (7-50)
370 (100-700)
UNSCEAR (1988)
45
420
UNSCEAR (2000)
∗
The world average values are also presented for comparison purposes with the world average values. Ranges are given in
parentheses (Saad and Al-Azmi, 2002).
27
According to Maina et al (2002) and Nderito (unpublished), a number of samples
analysed had reportedly higher values of
238
U and
232
Th gamma activity concentrations
than the world average of 40 Bq/kg for the two radionuclides. Agola (2006) also reported
mean activity concentrations of U-238 series, Th-232 series, Ra-226 series and K-40 as
73.72 ± 7.4, 149.33 ± 17.0, 163.81 ± 18.6, and 1,095.20 ± 53.2 Bq/kg respectively in the
Olkaria geothermal area. Radon (Rn-222) mean activity concentrations in water ranged
from 1.95 ± 0.4 to 8.63 ± 0.1 KBq/m3 with an overall mean value of 5.56 ± 0.5 KBq/m3.
The radon values obtained from water sources (Agola, 2006) were therefore within the
recommended level of 10 KBq/m3 in water (UNSCEAR, 1993). The overall mean
concentration for radon in water was also far below the US-EPA, 1993 permissible level
of 11 KBq/m3. Radon activity concentration for the indoor environments ranged from
5.13 ± 0.7 to 83.47 ± 0.1 Bqm3 with a mean value of 41.05 ± 3.2 Bq/m3 with a value
below the reference levels of 200-600 Bq/m3.
Agola (2006) computed absorbed dose rate in air and annual effective dose as 213.89
nGy/h and 0.53 mSv/y respectively. Comparing with the world average values of 57
nGy/h and 0.46 mSv/y respectively, the area of study, according to Agola (2006), was
classified to be high background radiation area. A total mean effective dose due to Rn222 activity in water was obtained as 46.55 nSv/y assuming dose to adults only and a
water consumption rate of 0.5 litres per day. Effective dose for indoor radon activity was
0.09 mSv/y due to radon gas and 1.87 mSv/y due to short-lived radon decay products
dissolved in soft tissues assuming equilibrium factor of 0.4. The geothermal are was
28
therefore deduced to have significant levels of natural radiation that pose some heath
risks to the residents.
According to Maina et al (2002) radon levels in 42 mud constructed houses of Soi region
in Kenya’s province of Rift Valley, were all below the action level of 200 Bqm-3
recommended by IAEA. In Taita and Taveta regions of the country’s coastal province,
however, more than half of similar houses exceeded the IAEA limit. Thirteen houses
exceeded 400 Bq/m3, the limit given by UNSCEAR 1993 report. Annual effective dose
was also computed and ranged from 3.1 – 3.6 mSv/y in the coastal region and 0.4 – 2.6
mSv/y in Rift Valley. Based on the African cultural norms, outdoor occupancy factors of
0.6 and 0.5 for men and women respectively from these regions were used to compute the
effective dose.
29
Chapter 3
Experimental Procedures and Sample Preparation
3.0 Introduction
In this chapter, the procedures followed for sampling, sample preparation, measurement
instruments and data evaluation are presented.
3.1 Sampling
Samples of the heavy sands were randomly obtained from two separate regional dunes
namely: Nguluku and Maumba (Figure 3.1). Bulk samples weighing between 500 g and
1000 g, and considered to be representatives of the radioactive heavy sands, were
obtained. At each sampling point, two samples were obtained as follows; one sample of
sand at up to 30 cm - depth and the other obtained at a depth below 30 cm. During sample
collection, the following factors were put into consideration;
i. Cleanliness of the tools used was ensured against any possible contaminants,
ii. Care was taken to obtain soils above 30 cm separately from that of below this depth,
iii. Samples were collected from the entire cross section of each pit to ensure proper
presentation,
iv. The top humus and other vegetation were removed from the sampling point prior to
sample collection,
v. All the samples collected were labelled and stored in polyethylene bags that were in
turn put in a shielded container to minimize radiation exposure level during
transportation.
30
Sampling Regions
Figure 3.1
Map showing the sampling sites of Nguluku, Maumba and their environs in
Kwale District.
31
3.1.1 Nguluku Samples
In the Nguluku region, only seven samples were obtained for radioactivity measurements.
A summary of samples description is presented in Table 3.1.
Table 3.1
Samples Descriptions – Nguluku Samples
Sample
Description
Ngu1
Topsoil along the road, approx. 1.5 Km from Shimba Hills Border
Ngu2
Subsoil, along the road, approx. 1.5 Km from Shimba Hills Border
Ngu3
Surface run-off deposits, along the road (surface), approx. 0.5 Km from Nguluku
Ctr towards Shimba Hills
Ngu4
Topsoil, along the road (surface), approx. 0.5 Km from Nguluku Ctr towards
Msambweni
Ngu5
Topsoil, along the roadside, approx. 0.5 Km from Nguluku Ctr towards
Msambweni
Ngu6
Topsoil, Noma Centre
Ngu7
Subsoil, Noma Centre
3.1.2 Maumba Samples
Maumba region is geographically divided into three sub-regions namely; Miembeni (also
known as Mwaweche), Maumba Central and Lower Maumba (known ‘Maumba ya
Chini’). In these three regions the surface soils were generally observed to be sandy and
pale brown in colour with some mix of black colouration. Intense black colouration could
be observed along the vertical profile of gulley and at various erosion deposits. It is
important to note that the titanium plant was initially erected at Miembeni.
Samples were collected from the farms where the residents spend most of their time
during the day and along the roadsides where soils were not disturbed. This was done
during and after the rains. Random sampling was the most applicable method of sample
32
collection due to various limitations during fieldwork. Inadequate resources and lack of
appropriate tools, like Geographical Information System (GIS), could not enable
application of modern sampling methods on the grid system. At every point, one sample
was collected at an approximate depth of 30 cm and then labeled as sample A; the second
at a depth below 30 cm and labeled as sample B. Since a GIS was not available during
sampling, further labeling of the samples was considered important by noting the names
of the farm owners where sampling was done for purposes of future reference. A total of
50 samples were collected in all and labeled numbers 1A, 1B, …, to 25A, 25B. A
summary of description of Maumba samples is presented in Table 3.2.
Table 3.2
Samples Descriptions – Maumba Samples
Sample
Location of sampling point
1 to 10
Miembeni
11 to 13
Maumba Centre
14 to 17
Maumba Centre, Duncan Ndegwa Pry. Sch
18 to 20
Maumba Centre
21 to 24
Maumba ya Chini
25
Miembeni, Surface run-off deposits
3.2 Sample Preparations for Radioactivity Measurements
The samples collected from the two regions were transported to the Institute of Nuclear
Science & Technology, University of Nairobi, for radioactivity analysis. The samples
were oven-dried for 48 hours to constant weight, before preparation. Storage of the
samples for a minimum period of one month was allowed to enable equilibrium of Ra-
33
226 with its decay products in the uranium series and Ra-228 with its daughters in the
thorium series.
The samples were crushed using a pestle and a mortar to reduce the particle sizes and
ensure homogeneity. This was followed by sieving (size of mesh) to ensure particles sizes
less than less than the mesh. For each sample, mechanical grinding was then carried out
using a Fritsch Pulverisette type 120 for about 20 minutes each to further reduce the
particle size and hence the interparticle sizes. Samples weights between 400-700 g were
portioned in a Marinelli beaker for gamma ray analysis.
To avoid detector contamination and sample cross-contamination every Marinelli beaker
used was cleaned with a solution of EDTA, dried and counted empty to confirm the
absence of any residual activity before putting in a new sample. To enable calculation of
activity concentration using the intercomparison method, the background spectrum,
standard reference material spectrum and the samples spectra were collected.
The background spectrum was collected by counting an empty Marinelli beaker for 20
hrs. Spectra acquisition for the samples and the standard reference material was carried
out by counting a known mass of material for a minimum period of 5.6 hrs. However, a
spectrum for the standard material was collected daily for use in the activity calculations,
with sample spectra collected on any particular day. The collected spectra were then
stored in a PC for further analyses. Each sample was analysed once.
34
3.3 Sample Preparations for X-ray Fluorescence Analysis
In the preparations for EDXRF analysis, a small fraction of every sample was obtained
by way of coning and quartering method. After the sample was ground, it was poured on
a clean sheet of paper in a small cone-like heap. The cone was then flattened and divided
into four equal parts. Two opposite quarters were stored separately while the other two
were further ground and sieved through a 200 mesh to attain particles size of not more
than 75 µm. The remains after sieving were further ground until all the two quarters
passed through the 200 mesh. The fine samples were then dried in an oven at 1000 C for
48 hours to constant weight. The coning and quartering procedure was repeated on the
dried samples so as to obtain a 25-g representatives of the whole sample which were then
stored in Petri-dishes.
The 25-g samples were further ground in a mortar to reduce the particle sizes. Further,
they were diluted and homogenised using cellulose, with dilution factors of 1- 2, in order
to reduce matrix effects and improve pellet formation. Due to the sandy nature of
mineralised soils, cellulose in the sample increased the cohesiveness of the soil particles
that is needed in pelletizing. Small amounts of the fine soil samples were pressed into
pellets of 2.5 cm in diameter using a hydraulic press at pressure of 2-3 kPa. Two pellets
were made from each sample, weighed and analysed. The mass of the pellets was used in
the determination of elemental concentrations. For each sample analysed, three
determinations were done.
35
3.4 EDXRF Instrumentation and Measurements
The x-ray fluorescence detector system used consisted of a Canberra Si(Li) detector
crystal model 2008 with 6 mm active diameter, 5 mm sensitive depth, and a beryllium
window thickness of 0.025 mm. The detector was operated at a negative bias of 1500 V
through an Ortec 456 high voltage bias supply, and had a resolution of 200-230 eV at the
Manganese Kα spectral line of 5.9 KeV at a time shaping constant of 10 µs. Other
spectrometer electronics include a Canberra 2026 spectroscopy amplifier with a pile-up
rejector (PUR) for pulse shaping and an interface of a Canberra 8075 ADC and an S-100
PC based multi-channel analyser (MCA) for spectral data acquisition storage and
analysis. Energy calibration of the detector’s multi-channel analyser was carried out
using Cd-109 and Fe-55 radioactive excitation sources.
The pellets of the prepared samples were irradiated for a period of 1500s using a Cd-109
excitation source using the geometry shown in Figure 3.2. A PC based MCA was used
spectral data collection and storage and the data deconvolution was done using AXIL
program. The program enables for calculation of background subtraction by fitting a
polynomial function to the actual spectrum and determines net peak areas of the elements
of interest present in the sample. Typical spectra of titanium bearing ore samples from
Kwale district are shown in Appendices V and VI.
For each pellet, three measurements were done; sample alone for 1500 s to acquire the
spectrum of interest and sample with multi-element target on top for 500 s, and the target
alone for 500 s for the purposes of absorption correction. The multi-element target used
36
was a thick pellet of pure cellulose mixed with titanium, manganese, zinc, bromine, and
niobium compounds of high purity. The energies of characteristic x-rays of these
elements cover the energy of the multi-channel analyser calibration.
Incident rays
characteristic x-rays
Sample
Source
Shield
Beryllium
window
Detector
Figure 3.2 Direct samples excitation with annular cadmium-109
3.4.1 Accuracy of EDXRF by the Fundamental Parameter Method
A soil reference material (Soil 7 SRM) was analysed and the results compared to the
certified values to indicate the accuracy of the method used for quantitative analysis.
3.4.2 Lower Limits of Detection, LLD
The expression used for determining the lower limit of detection for an element of
interest is given by
LLD =
3
•
m
Rb
Tb
………………………………………………………… 3.1
37
where Rb is the background count rate, Tb is the background count time, and m is the
sensitivity expressed in count rate per unit concentration of element of interest. Lower
limit of detection values in EDXRF analysis were obtained from the analysis of a
reference material; Soil – 7 SRM; which has a similar matrix to the samples collected for
analysis
3.4.3 Calculations of Elemental Concentrations
The fundamental parameter method was used for the evaluation of elemental
concentrations in soil samples. The computation method is programmed and available for
PC use at the Institute of Nuclear Science ant Technology laboratory and depends on
input results of AXIL (Analysis of X-rays using Iterative Least square method) software.
This is a modular program of the IAEA QXAS software that allows for analysis of the
spectra for the element of interest. A typical summary of EDXRF results from the
analysis tool, AXIL, is shown in Appendix III.
3.5 The Gamma-ray Spectrometric Instrumentation and Measurements
The most important naturally occurring radionuclides and the gamma lines used are given
below:
•
The U-238 series (half-life of 4.5 billion years): Pb-214 (242.0, 295.2 and 351.9
KeV lines) and Bi-214 (609.3 and 1120.3 KeV lines)
•
The Th-232 series (half-life 14 billion years): Ac-228 (338.3, 911.2 and 969.0
KeV lines), Pb-212 (238.6keV line) and Tl-208 (583.2keV)
•
Potassium (K-40), half-life 1.3 billion years: K-40 (1460.8keV line)
38
3.5.1 Apparatus and Spectral Collection
The gamma detector is a coaxial high purity germanium detector model CPVDS30-30185
from Oxford was used for gamma ray spectroscopy in this work. Spectral collection was
done using a fixed geometry by placing a 500 ml Marinelli beaker with the sample over
the vertically mounted coaxial HPGe detector. The spectrometer consists of the following
specifications:
i. Crystal characteristics
• Diameter – 57.4 mm
• Length – 56.9 mm
• Active volume – 144 cubic mm
• Germanium dead layer thickness – 600 microns
• Detector-to-window distance < 5 mm
ii. End Cap Characteristics
• Outside diameter – 76 mm, Aluminium 1mm thick
• Front window – 1 mm thick Aluminium
iii. Performance specifications
• Operating HV supply bias – 3200 V
• Polarity - positive
iv. Bias
• Gain setting to give 0.3 keV/channel for 1.33 MeV performance
• Gain setting to give 0.04 keV/channel for 122 keV
v. Pulse Height Analyzer
39
•
PCA-8000 with 8192 channels.
The following schematic diagram illustrates the electronic set up of HPGe gamma
spectrometer.
HV Supply
3200 KV
COMPUTER
PCA 3
DET
Amp
Det – Detector
Amp - Amplifier
Figure 3.3 Schematic diagram of an HPGe detector system
Other important parameters of the detector are summarized as per Table 3.3
Table 3.3 Some Important HPGe Detector Parameters
Measured
Expected
June 12, 1995*
Efficiency
1.33 MeV (Co-60)
FWHM
FWTM/FWHM
Peak to Compton
ratio
122 KeV (Co-57)
FWHM
June 14, 2007**
30%
29.7%
1.85 KeV
1.80 KeV
3.94 KeV
1.90 KeV
1.83 KeV
1.78 KeV
58:1
64:1
875 eV
850 eV
277 KeV (Ba-133) FWHM (a low energy close to Co-57)
Not measured
Not measured
Nuclide (h=270.5 d),
concentration in the
std negligible
2.70 KeV
*The measurements done by the suppliers, Oxford Instruments Inc., Analytical Systems
Division, according to the IEEE standard ANSI/IEEE Std 325-1986.
**The measurements done at the Institute of Nuclear Science and Technology, University
of Nairobi.
40
3.5.2 Detector Calibration
This process was carried out using four energy lines in a spectrum of a liquid standard
reference material, SRM-1 from Poland containing three radionuclides: Am-241 (59.54
eV line), Cs-137 (661.66 eV line), and Co-60 (1173.24 eV and 1332.50 eV lines). The
spectrum of the standard was used to determine energy, FWHM and photoefficiency
calibration parameters by regression method through submodule of Gamma, Activity and
Neutron Activation Analysis Software, GANAAS (Zaman, et al, 1993). The energy and
FWHM functions are polynomials of the second degree while the photoefficiency
function used was a logarithmically transformed power series of the form given by the
equation
ε =
1
E
n
∑a
i=0
i
(ln( E )) n ……………………… 3.2
where ε is the detector photoefficiency, ln(E) is the natural logarithm of photon energy E
and ai is the sought regression parameters. In this work, n=2 or n=4 gave a good fit.
3.5.3 Standard Reference Material for Intercomparison
In this experiment, an IAEA SRM 375 Standard was used. The standard was a soil
sample whose radioactivity concentrations of the various radionuclides commonly found
in geological materials have been predetermined. The values of radioactivity
concentrations for this particular reference material were determined on December 31,
1991 as shown in the Table 3.4. The material was collected in Chernobyl region in 1990
and donated to the IAEA by the former USSR (AQCS, 1998/99). Among the
radionuclides whose concentrations were determined and recorded are K-40, Th-232 and
U-238, which are of major concern in this work.
41
Table 3.4
Activity concentration levels of radionuclides under investigation in
the standard reference material as at December 31, 1991
Radionuclide
Activity Concentrations (Bq/kg)
Th-232
20.5
U-238
24.4
K-40
424.0
Source: AQCS (1998/99)
3.5.4 Calculation of Radionuclide Concentrations
The concentrations of the radionuclides of interest were computed using the
Intercomparison Method.
A
M
S
I
S
=
S
A
M
R
I
R
………………………………………………….
3.3
R
where,
AS = activity concentration of a radionuclide i in the sample, Bq/kg,
MS = mass of the soil sample, in g,
IS = intensity of a radionuclide I in the sample, in c/sec,
AR = activity concentration of a radionuclide i in the standard reference material,
in Bq/kg ,
MR = mass of the standard reference material, in g, and
IR = intensity, in counts per second, of a radionuclide i in the standard reference
material, in c/sec.
from which activity concentration, AS, as defined above, is calculated.
42
The results obtained are further compared to the world average as reported by
UNSCEAR (2000). Samples collected and their preparation, analytical procedures,
measurements of radionuclide in food and activity in the environment, in the UNSCEAR
(2000) report, were done according to procedures provided by IAEA in its technical and
quality control reports (IAEA, 2006b; IAEA, 2001; IAEA, 1989; AQCS, 1998) and
safety guidelines (IAEA, 2000a; IAEA, 2000b; IAEA, 1996a; IAEA, 1996b ).
3.6 Determination of Dose Rate and Exposure
The gamma dose rates D in outdoor air at 1 m above the ground was calculated using
equation 3.4 and the conversion factors published by UNSCEAR (2000).
D = AC × CF
……………………………………………………………………………………………………..3.4
where
D is the dose rate in nGy/h,
AC is the activity concentration in Bq/kg and,
CF is the dose conversion factor in nGy/h per Bq/kg (absorbed dose rate in air per
unit of activity concentration).
For an adult person, the absorbed dose rates were converted to effective dose rates by
using the following relationship given by UNSCEAR report of 2000:
HE = D × T × F………………………………………………………………… 3.5
43
where
HE is the effective dose in µSv/y,
D is the estimated absorbed dose rate in nGy/h,
T is the outdoor occupancy time factor (0.2 ×24 h×365.25 d ≈ 1753 h/y) and,
F is the adsorbed-to-effective dose conversion factor (0.7 × 10⁻³ µSv per nGy).
44
Chapter 4
Results and Discussions
4.0 Introduction
In this chapter, the results of the study are presented and discussed. First, the accuracy of
the analytical techniques is determined using standard reference materials from
International Atomic Energy Agency (IAEA). The elemental analysis results of the fifty
(50) soil samples from Maumba are then presented and discussed. Concentration levels
of titanium, vanadium, manganese, iron, cobalt, copper, zinc, thorium, yttrium, uranium,
zirconium, niobium and molybdenum are presented and discussed for the three smaller
subdivisions of the Maumba area sampled. The results have also been compared to a
similar study on Mrima Hill soil.
Also discussed in this chapter are the activity concentrations of Th-232 and U-238 in the
fifty samples from Maumba and the seven samples from Nguluku. The discussion is
limited to the two radionuclides owing to low activity concentration values of K-40
present in these samples.
Elemental concentrations distribution of the three major constituents of Maumba
samples; titanium, iron and zirconium, and that of niobium, a minor constituent, have
been compared to the distribution of Th-232 and U-238 activity concentrations. Finally,
dose rates due from exposure to the two radionuclides, is estimated using conversion
factors from the UNSCEAR (1993) and (2000) reports; as 0.0417, 0.462 and 0.604
respectively, for K-40, U-238 and Th-232. To convert dose rate to Sv, a factor of 0.7
45
Sv/Gy was used. This was adapted the UNSCEAR (2000) report and Selvasekarapandian
study (Selvasekarapandian et al, 2000). The results obtained are further compared to the
world average as reported by UNSCEAR (2000).
4.1 EDXRF Analysis
In this section, the accuracy and the detection limits of the method used are presented and
discussed.
4.1.1 Accuracy of the Si(Li) Detector in determination of Elemental Concentrations
The results obtained after carrying out elemental determination of the standard reference
material, IAEA Soil 7 using the Si(Li) detector are presented in Table 4.1. The measured
values of most of the elements of interest are found to be within the certified limits
whereas a slight deviation is observed for manganese, iron and zinc. However, using twotailed student t-test, the difference between the measured mean from the certified mean is
found to be insignificant at 95% confidence limit.
Table 4.1
Results of EDXRF Analysis of Certified Reference Material, IAEA
Soil 7
Element
Measured concentration Certified concentration
Ti
0.28 %
0.30 %
Mn*
558 µg/g
631 µg/g
Fe*
2.28 %
2.57 %
Zn*
79.4 µg/g
104 µg/g
Sr
111 µg/g
108 µg/g
Y
18.2 µg/g
21 µg/g
Zr
193 µg/g
185 µg/g
Nb*
20.3 µg/g
12 µg/g
* Elements whose measured concentrations are not within the certified intervals
46
4.1.2 Detection Limits of Si(Li) Detector for the Elements of Interest
The lowest limits of detection of the method used for the elements of interest were
obtained by applying Equation 3.1 and the results obtained after analysis of the pellet
form samples are presented in Table 4.2.
Table 4.2 Lower Limits of Detection of Si(Li) Detector for the Elements of Interest
Titanium
Detection limits (units in µg/g unless
otherwise stated)
0.13 %
Vanadium
616.0
Manganese
253.8
Iron
196.1
Cobalt
104.0
Copper
74.50
Zinc
66.70
Yttrium
17.30
Zirconium
13.81
Niobium
13.70
Molybdenum
13.01
Thorium
8.90
Uranium
8.87
Nuclide
It can be deduced from Table 4.2 that the detection limit improves with increasing atomic
number. Lowest limits of detection (LLD) for the elements of interest were found to be
considerably higher than is usual the case. This was attributable to the detector resolution
(220-230 eV) during the time when these measurements were done. Typical resolution
values of 180 – 200 eV yield much lower LLD values.
47
4.1.3 Maumba Samples
The EDXRF analysis results of Maumba samples are presented in Tables 4.3 to 4.5.
Sample numbers 25A and 25B, which had been collected from black erosion deposits had
significantly high elemental concentrations and were therefore excluded when computing
mean concentration values.
4.1.4 Occurrence and Distribution of Elemental Concentrations of Maumba
Samples
The occurrence of the major elements in the soil samples was determined through
calculations of mean concentrations at 95 % confidence level. The major constituents in
Maumba samples are titanium, manganese, iron and zirconium (Table 4.4). This is
partially comparable to Mangala (1987), where Mrima Hill samples, soil sediments of
carbonatite, exhibited iron as the major constituent despite the alkalinity of their origin.
Other constituents, in lower concentrations include; zinc, vanadium, cobalt, yttrium,
thorium, niobium and molybdenum.
Low concentrations of copper, thorium, zinc and molybdenum are observed in very few
samples from Miembeni region of Maumba. Copper is observed only once (sample 25A)
with a level of 138.8 ± 30.09 µg/g. Zinc and molybdenum appear twice with
concentration levels of 109.1 ± 23.26 & 155.1 ± 30.96 µg/g and 22.17 ± 5.09 & 58.01 ±
9.90 µg/g in samples 25A and 25B respectively. Thorium appears in three samples – 7B,
10A and 25B – in respective levels of 22.47 ± 3.64, 16.33 ± 2.81 and 40.93 ± 7.22 µg/g.
Uranium concentrations are observed below the detection limits in all samples analysed.
48
Titanium
This element is one of the major constituents and occurred in all the fifty (50) samples
analysed with a concentration range of 0.13 % to 2.81% and a mean range 1.21 ± 0.21%.
These values are significantly lower (95% confidence level) than the levels reported for
Mrima Hill samples analysed by Mangala’s study (1987), from which the element was
found to be one of the major constituent with an uneven distribution in the concentration
range of 1.00 % to 9 % and a mean concentration of 4.69 %.
In this study, occurrence of titanium has been found to be very strongly correlated to iron,
zirconium and niobium and weakly to manganese with respective coefficients of 0.96,
0.97, 0.90 and 0.25 as presented in Table 4.4. Its distribution in the samples has been
found to correlate strongly with the activity concentrations of Th-232 and U-238 with
respective coefficients of 0.88 and 0.83.
Other Elements
It was observed that concentration levels of copper, zinc, thorium, uranium, niobium and
molybdenum were very low (<LLD) for most soil samples from Maumba. However,
zinc, molybdenum and thorium were observed in two samples with highest levels
registered as being 155.1, 58.01 and 40.93 µg/g, respectively. Concentration levels of
yttrium and uranium were below detection limits in all the samples analysed.
49
Table 4.3
Elemental concentrations for soil samples from Miembeni, Maumba (in µg/g unless otherwise stated) X ± 1STD ;
n=2
Sample
Ti (%)
V
Mn
Fe (%)
Co
Y
Zr
Nb
1A
2.35 ± 0.64
< 616
(0.15 ± 0.03) %
2.87 ± 0.49
< 104
19.4 ± 3.7
(0.23 ± 0.04) %
29.7 ± 6.4
1B
1.65 ± 0.47
920 ± 175
(0.11 ± 0.02) %
2.34 ± 0.37
333 ± 90
18.0 ± 2.8
(0.20 ± 0.030 %
26.6 ± 7.5
2A
1.33 ± 0.05
< 616
889 ± 182
1.90 ± 0.45
< 104
<17.3
(0.13 ± 0.02) %
17.2 ± 2.9
2B
2.51 ± 0.70
704 ± 122
(0.17 ± 0.04) %
2.98 ± 0.75
186 ± 52
<17.3
(0.24 ± 0.06) %
41.9 ± 9.6
3A
1.72 ± 0.41
640 ± 98
679 ± 126
1.90 ± 0.31
136 ± 31
<17.3
(0.19 ± 0.04) %
31.2 ± 3.3
3B
1.35 ± 0.37
< 616
375 ± 87.7
1.58 ± 0.29
< 104
<17.3
(0.12 ± 0.02) %
28.2 ± 4.8
4A
0.93 ± 0.23
< 616
824 ± 169
1.08 ± 0.22
< 104
<17.3
870 ± 139
17.0 ± 2.4
4B
0.47 ± 0.14
< 616
922 ± 213
1.18 ± 0.28
< 104
<17.3
547 ± 115
< 13.7
5A
0.58 ± 0.16
< 616
801 ± 160
0.89 ± 0.24
< 104
<17.3
594 ± 107
< 13.7
5B
0.93 ± 0.19
< 616
652 ± 115
1.21 ± 0.37
< 104
<17.3
850 ± 167
16.5 ± 3.0
6A
0.88 ± 0.20
< 616
647 ± 131
0.92 ± 0.21
< 104
<17.3
843 ± 156
15.5 ± 3.0
6B
1.34 ± 0.25
< 616
634 ± 125
1.38 ± 0.26
< 104
<17.3
(0.15 ± 0.03) %
< 13.7
7A
0.92 ± 0.16
< 616
697 ± 122
1.62 ± 0.43
< 104
<17.3
(0.11 ± 0.02)%
< 13.7
7B
1.42 ± 0.32
(0.11 ± 0.02)%
820 ± 174
1.99 ± 0.51
295 ± 53
<17.3
(0.15 ± 0.03) %
22.7 ± 3.8
8A
1.51 ± 0.45
(0.11 ± 0.03)%
957 ± 223
1.98 ± 0.43
< 104
<17.3
(0.14 ± 0.03) %
30.4 ± 2.3
8B
2.05 ± 0.41
875 ± 138
(0.11 ± 0.02) %
2.60 ± 0.53
485 ± 88
<17.3
(0.17 ± 0.03) %
37.6 ± 6.5
9A
1.26 ± 0.27
< 616
(0.16 ± 0.03) %
2.02 ± 0.32
190 ± 40
<17.3
(0.12 ± 0.03) %
< 13.7
9B
2.78 ± 0.77
908 ± 148
(0.16 ± 0.04) %
3.11 ± 0.81
281 ± 46
19.6 ± 5.0
(0.26 ± 0.06) %
43.9 ± 7.8
10A
2.81 ± 0.49
(0.10 ± 0.02) %
(0.25 ± 0.06) %
2.98 ± 0.69
282 ± 51
22.8 ± 5.1
(0.33 ± 0.07) %
52.2 ± 10.2
10B
1.61 ± 0.38
917 ± 168
(0.12 ± 0.03) %
2.17 ± 054
< 104
19.8 ± 4.3
(0.18 ± 0.03) %
57.0 ± 9.8
25A
11.61 ±1.78
(0.59 ± 0.10)%
(0.14 ± 0.03) %
7.89 ± 1.69
675 ± 117
67.3 ± 0.4
(0.97 ± 0.17) %
184 ± 31.4
25B
16.6 ±3.44
(1.14 ± 0.21)%
(0.18 ± 0.04) %
13.76 ± 2.61
< 104
86.2 ± 5.3
1.86 ± 0.31 %
337 ± 60.9
50
Table 4.4
Correlation Matrix Table for EDXRF Results of the Major
Constituents
Ti
Mn
Fe
Zr
Ti
1
Mn
0.25
1
Fe
0.96
0.33
1
Zr
0.97
0.22
0.95
1
Nb
0.90
0.19
0.88
0.90
Table 4.5
Nb
1
Elemental concentrations for soil samples from Maumba Central (in
µg/g unless otherwise stated), X ± 1STD ; n=2
Sample
Ti (%)
V
Mn
Fe (%)
Co
Zr
Nb
11A
2.52 ± 0.65
752.1 ± 127.5
(0.15 ± 0.03) %
2.89 ± 0.47
220 ± 52
(0.18 ± 0.04) %
42.6 ± 7.0
11B
2.18 ± 0.31
< 616
718 ± 140
2.62 ± 0.53
< 104
(0.18 ± 0.03)%
63.5 ± 14.0
12A
1.51 ± 0.37
< 616
702 ± 129
1.75 ± 0.46
291 ± 78
(0.12 ± 0.04)%
26.3 ± 5.0
12B
1.34 ± 0.24
< 616
519 ± 112
1.77 ± 0.42
225 ± 61
(0.11 ± 0.02) %
28.5 ± 5.1
13A
1.53 ± 0.25
< 616
754 ± 152
1.61 ± 0.35
127 ± 28
(0.13 ± 0.03) %
25.9 ± 6.2
13B
1.98 ± 0.41
< 616
948 ± 190
2.71 ± 0.71
268 ± 68
(0.18 ± 0.04) %
36.7 ± 7.8
14A
0.95 ± 0.21
< 616
375 ± 80
1.35 ± 0.43
106 ± 19
884 ± 180
19.4 ± 2.8
14B
0.71 ± 0.2
< 616
250 ± 57
1.37 ± 0.35
222 ± 41
738 ± 137
39.2 ± 7.9
15A
1.09 ± 0.23
< 616
360 ± 76
1.31 ± 0.23
< 104
929 ± 177
27.6 ± 6.1
15B
0.88 ± 0.13
< 616
411 ± 80
1.36 ± 0.29
< 104
891 ± 140
17.0 ± 3.4
16A
1.29 ± 2.21
< 616
449 ± 78
1.64 ± 0.03
132 ± 22
(0.11 ± 0.02) %
18.5 ± 3.6
16B
0.96 ± 0.15
862.3 ± 145.4
370 ± 97
1.53 ± 0.37
158 ± 40
933 ± 163
29.9 ± 5.8
479 ± 79
45.5 ± 7.1
17A
0.55 ± 0.12
(0.11 ± 0.03) %
388 ± 81
0.97 ± 0.22
< 104
17B
1.34 ± 0.27
< 616
373 ± 62
1.67 ± 0.31
< 104
(0.11 ± 0.02) %
20.2 ± 4.6
18A
1.22 ± 0.27
< 616
772 ± 91
1.75 ± 0.41
196 ± 41
776 ± 124
93.01 ± 17.9
18B
0.96 ± 0.24
< 616
996 ± 114
1.61± 0.33
253 ± 42
685 ± 124
13.8 ± 3.2
19A
1.74 ± 0.47
(0.12 ± 0.02) %
(0.13 ± 0.02) %
2.07 ± 0.56
187 ± 41
(0.14 ± 0.03) %
28.6 ± 5.2
747 ± 121
< 13.7
19B
0.90 ± 0.19
< 616
987 ± 133
1.48 ± 0.29
< 104
20A
1.06 ± 0.23
(0.15 ± 0.03) %
364 ± 69
1.36 ± 0.23
< 104
980 ± 213
16.7 ± 3.2
20B
1.05 ± 0.21
< 616
282 ± 65
2.14 ± 0.48
148 ± 32
(0.16 ± 0.03) %
26.5 ± 4.3
51
Table 4.6
Elemental concentrations for soil samples from ‘Maumba ya Chini’
X ± 1STD ; n=2
(in µg/g unless otherwise stated),
Sample
Ti (%)
Fe (%)
Zr
21A
0.18 ± 0.05
0.37 ± 0.09
353 ± 61
21B
0.30 ± 0.08
0.29 ± 0.08
625 ± 111
22A
0.13 ± 0.03
0.15 ± 0.03
361 ± 67
22B
0.28 ± 0.06
934.1 ± 210.3
741 ± 124
23A
0.18 ± 0.04
0.15 ± 0.03
367 ±73
23B
0.19 ± 0.04
0.17 ± 0.04
278 ± 49
24A
0.23 ± 0.06
0.15 ± 0.03
536 ± 109
24B
0.23 ± 0.05
0.14 ± 0.03
601 ± 103
Manganese
The concentration levels of this element is found to range from 249.6 µg/g to 0.25 % in
forty-four (44) samples and a mean of 822.2 µg/g. Out of the eight samples from
Maumba ya Chini, however, the element appears only twice with the highest value of
261.9 µg/g. Manganese is weakly correlated to titanium, iron, zirconium and niobium as
shown in Table 4.4. This is in agreement with Mangala (1987), where the concentration
distribution of manganese was found to be weakly correlated to titanium and iron. The
concentrations of the element in Mrima Hill varied from 3556 µg/g to 17.1 % with a
calculated mean of 6.3 %. This difference is explained by the fact that Mangala mainly
considered rock samples as opposed to the fine soil samples.
Iron
Iron occurs in all the samples analysed with a range of 0.09 % to 3.11 % and a mean of
1.57 %. When compared to other elements of interest, a strong correlation to zirconium
52
and niobium is evident and is also comparable to the correlation to titanium. According to
Mangala (1987) study in Mrima Hills, the concentration of the element varied from 5.00
% to 30.00 % with a mean of 21.25 %. This is much higher than the results in this study.
Like titanium, this element is also found to correlate strongly with the activity
concentrations of Th-232 and U-238 as shown in Tables 4.2 and 4.3. However, a weak
correlation with manganese is observed in this study and which is in agreement with
Mangala (1987).
Table 4.7 Correlation Matrix Table for Activity Concentrations of Th-232 and U238 and the Elemental Concentrations of Titanium, Iron and Zirconium
Ti
Fe
Zr
Nb
Th-232
Ti
1
Fe
0.96
1
Zr
0.97
0.95
1
Nb
0.90
0.88
0.90
1
Th-232
0.88
0.82
0.83
0.74
1
U-238
0.83
0.78
0.77
0.68
0.92
U-238
1
Zirconium
All the samples exhibit moderate levels of zirconium. It occurs with a range of 278.4 µg/g
to 0.33 % with a mean of 1189.3 µg/g. These concentration distributions of the element
correlate strongly to those of titanium, niobium and iron and weakly to manganese. These
values have been found to be slightly higher than the values of Mrima Hill reported by
Mangala. According to Mangala, the values reported were between 94 µg/g and 720 µg/g
and a mean of 251 µg/g. The correlation coefficients to the elements and to the activity
53
concentrations of Th-232 and U-238 have been presented in Tables 4.2 and 4.3.
Niobium
Niobium occurs in small quantities compared to titanium, iron and zirconium ranging
from 13.8µg/g to 79.2 µg/g in 38 samples. Similar to the case of Manganese, out of the
eight samples from Maumba ya Chini, the element appears only twice above detection
limit with the higher value of 34.69 µg/g. The element occurs below detection limit in the
rest of the 12 samples. The trend is similar with Mangala’s study (1987) where the
element was also reported as one of the minor constituent within concentration range of
1000 µg/g to 9000 µg/g. A mean of 31.81 ± 2.71 µg/g was obtained from the 38 samples
compared to a mean of 4068 µg/g reported by Mangala (1987). Its concentration values
correlated strongly to the concentrations of titanium, zirconium and iron with a weak
correlation to that of manganese as shown in Tables 4.4. A fairly strong correlation with
activity concentrations of Th-232 and U-238 is demonstrated in Table 4.7. Typical
EDXRF spectra obtained from the titanium-bearing samples of Kwale are presented in
Appendices VI and VII.
Cobalt
This element appears in some selected samples in concentrations ranging from of 106.0
to 485.3 µg/g. It is normally masked by Fe-β line a fact that interferes with the results if
not well taken care of. In this study, a model spectrum which contained cobalt lines was
used to fit all the samples spectra thus giving room for accurate reporting.
54
4.2 Results of Gamma Ray Analysis
In this study, a high-purity germanium detector spectrometer was used for the analysis. A
comparative method using standard reference materials was used for evaluating
concentrations. It is important therefore to present, in this section, the accuracy and
detection limits of the method and the results of analysis of the standard reference
material.
4.2.1 Accuracy of the Gamma Analysis Method Used
The degree of agreement of measured values and the certified values for the reference
materials represents the accuracy of the analytical method. Accuracy of the gamma ray
spectroscopy method was confirmed using the standard reference material, SRM 375 soil.
A spectrum of the standard sample was collected on daily basis and used for spectral
analysis for the sample, using the equation 4.1.
εγ =
I
1
× ,
At Pr M
…………………………………………………………………….. 4.1
where εγ is the detector efficiency at energy, T, I is the intensity, in counts per second, of
a radionuclide i in the SRM, At is the activity, in Bq/kg, of the radionuclide i, Pr is the
emission probability of the radionuclide i and M is the mass of the SRM in Kg. The
results of the analysis of the certified reference material (IAEA, Soil 375) are presented
in Table 4.8. The measured values for the three radionuclides are found to be within the
IAEA certified limits.
55
Table 4.8 Results of Gamma Analysis of Certified Reference Material, IAEA Soil
375.
Radionuclide
Activity Concentrations in Bq/kg
Confidence interval
(certified)
Measured
Certified
Th-232
18.6 ± 2.0
20.5
19.1 – 22.1
U-238
24.3 ± 5.0
24.4
18.6 – 31.4
K-40
438.0 ± 6.0
424.0
417 - 432
4.2.2 Detection Limits for Gamma Analysis for Th-232, U-238 and K-40
Detection limit is a term used to express the detection capability of a measurement
system under certain conditions. An estimate for the lowest amount of activity of a
specific gamma-emitting radionuclide that can be detected at the time of measurement
can be calculated from several different expressions. A generally accepted expression for
the estimate of the detection limits, which is frequently referred to as the lower limit of
detection (LLD) and which contains a pre-selected risk of 5% of concluding falsely that
activity is present and a 95% degree of confidence for detecting the presence of activity,
is as follows:
LLD =
4.66Sb
…………………………………………………………………………4.2
∈ Pγ
where Sb is the estimated standard error of the net count rate,
∈ is the counting efficiency of the specific nuclide’s energy; number < 1
Pγ is the absolute transition probability by gamma decay through the selected
energy as for ∈ , number < 1.
56
LLD of the above equation provides a means of determining the operating capability of a
gamma measuring system without the influence of a sample and is applicable on the
assumption that the count rate in the energy area taken for the specific nuclide and the
count rate in the region(s) taken for background are independent.
A certified reference material, Soil 375, was used to obtain the detection limits of Th232, U-238 and K-40 by applying Equation 4.3. According to IAEA (IAEA, 2000b),
detection limit is defined as the true signal level which may be expected to lead to
detection. The parameter, LLD, of a radionuclide by a gamma ray detector and according
to IAEA (IAEA, 1974), is mathematically given by equation 3.1 discussed earlier as
LLD =
3 BG
PA
× C , ……………………………………………………………………… 4.3
where
BG is the background counts obtained from gamma spectrum,
PA is the peak area or the net area of the gamma spectrum, and
C is the activity concentration in Bq/kg of the specific radionuclide of interest.
Lower limits of detection for Th-232, U-238 and K-40 are presented in Table 4.9. The
values for U-238 have been found to be two times that of Th-232 while that of K-40 was
twenty times higher. However, decay energies and probability for decay also play a very
critical role in gamma ray detection limits. Emission probability of K-40 (1460.81 KeV
line only) is about 10.67% where as the emission probabilities for Th-232 (Tl-208, 583.1
KeV line) and U-238 (Bi-214, 609.3 KeV line) are 30.6% and 44.6% respectively.
57
Another factor likely to contribute to the detection limits is the efficiency of the detector.
The higher the efficiency, the better the detection limit is likely to become.
Table 4.9 Lower Limits of Detection of the HPGe Detector for the Radionuclides of
Interest
Radionuclide
Detection limits (Bq/kg)
Th-232
2.04
U-238
4.78
K-40
44.97
4.2.3 Activity Concentrations of Th-232, U-238 and K-40 in Soil Samples from
Maumba
Samples from this region were sub-divided into three groups: Miembeni, Maumba
Central and Maumba ya Chini. The results of analysis obtained are presented in Tables
4.10 to 4.12.
Miembeni Samples
The activity concentrations of samples from this region range from 49.2 ± 0.1 Bq/kg to
209 ± 1 Bq/kg for Th-232; 11.40 ± 0.15 to 134 ± 1 Bq/kg for U-238 means of 106 ± 21
and 73.1 ± 15.8 Bq/kg respectively. The K-40 concentrations levels are below the
detection limits (<45 Bq/kg) for all the samples analysed as shown in Figure 4.1.
Samples 25A and 25B which had been collected from erosions deposits show high levels
of activity concentrations in comparison with the other samples. These were 588 and 367
Bq/kg for Th-232 and U-238 respectively for sample 25A and 616 and 358 Bq/kg
58
respectively for sample 25B. This is evidence enough that radioactive ores exist uphill of
Miembeni.
Table 4.10 Activity concentrations of Th-232 and U-238 K-40 - Miembeni
Activity Concentration in Bq/ Kg for:
Soil
sample
Th-232
U-238
204 ± 1
107 ± 2
1A
209 ± 1
109 ± 2
1B
156 ± 1
88.4 ± 1.4
2A
144 ± 1
84.6 ± 1.5
2B
138 ± 1
84.8 ± 0.2
3A
119 ± 1
76.9 ± 0.2
3B
49.2 ± 0.1
31.3 ± 0.2
4A
49.9 ± 2.0
32.1 ± 0.1
4B
55.7 ± 0.1
33.5 ± 0.2
5A
61.7 ± 0.9
35.1 ± 0.1
5B
102 ± 1
52.9 ± 0.2
6A
102 ± 1
104 ± 3
6B
97.9 ± 0.1
134 ± 5
7A
93.4 ± 0.1
128 ± 3
7B
79.5 ± 0.1
65.3 ± 0.2
8A
82.2 ± 0.1
67.4 ± 0.2
8B
80.2 ± 0.1
11.4 ± 0.1
9A
77.5 ± 0.1
60.1 ± 0.2
9B
112.3 ± 0.1
77.9 ± 0.2
10A
110 ± 1
79.4 ± 1.2
10B
587± 1
367± 4
25A
616 ± 0.1
358 ± 6
25B
∗K-40 is below detection limit in all the samples
59
Radioactivity Level of Miembeni Samples - Maumba
700
600
Activity Concentration, Bq/Kg
500
400
Th-232
U-238
300
200
100
0
1A
1B
2A
2B
3A
3B
4A
4B
5A
5B
6A
6B
Sample
Figure 4.1 Activity levels of Th-232 & U-238 in Miembeni samples
60
7A
7B
8A
8B
9A
9B
10A
10B
25A
25B
Maumba Central Samples
The activity concentration in samples collected from Maumba Central, range from 30.6 107 Bq/kg with mean value 55.1 Bq/kg for Th-232 and 25.7 - 100 Bq/kg and mean value
of 39.5 Bq/kg for U-238. Activities of levels for K-40 are below detection limit in all the
samples (Table 4.11 & Figure 4.2).
Table 4.11 Activity concentrations of radionuclides
Central
Activity Concentration in Bq/ Kg for:
Soil
sample
Th-232
70.29 ± 0.08
11A
63.56 ± 0.06
11B
51.25 ± 0.06
12A
51.63 ± 0.08
12B
34.53 ± 0.06
13A
34.35 ± 0.05
13B
30.63 ± 0.06
14A
32.19 ± 0.08
14B
37.99 ± 0.09
15A
40.83 ± 0.06
15B
46.18 ± 0.08
16A
48.47± 0.06
16B
42.35 ± 0.05
17A
46.84 ± 0.05
17B
106.77 ± 0.11
18A
82.57 ± 0.10
18B
92.78 ± 0.06
19A
65.01 ± 0.08
19B
62.52 ± 0.10
20A
60.32 ± 0.07
20B
∗K-40 is below detection limit in all the samples
61
in soil samples from Maumba
U-238
100.23 ± 0.44
52.82 ± 0.13
45.79 ± 0.12
43.46 ± 0.16
31.56 ± 0.13
31.66 ± 0.11
28.03 ± 0.07
26.56 ± 0.10
32.77 ± 0.11
25.71 ± 0.07
28.07 ± 0.09
28.90 ± 0.06
29.75 ± 0.05
26.81 ± 0.06
55.58 ± 0.11
42.48 ± 0.13
47.50 ± 0.06
44.01 ± 0.09
35.64 ± 0.13
32.54 ± 0.09
Radioactivity Level of Maumba Central Samples
120
Activity Concentration, Bq/Kg
100
80
Th-233
U-239
60
40
20
0
11A
11B
12A
12B
13A
13B
14A
14B
15A
15B
16A
Sample
Figure 4.2 Activity levels of Th-232 & U-238 in Maumba Central
62
16B
17A
17B
18A
18B
19A
19B
20A
20B
Maumba ya Chini Samples
The activity concentrations in samples collected from ‘Maumba ya Chini’, range from
24.3 - 35.3 Bq/kg with mean value of 29.2 Bq/kg for Th-232 and 16.2 - 24.6 Bq/kg for U238 and mean value of 19.5 Bq/kg (Table 4.12 & Figure 4.3).
Table 4.12 Activity concentrations of radionuclides in soil samples from ‘Maumba
ya Chini’
Soil
Sample
Activity Concentration in Bq/ Kg for:
Th-232
21A
24.3 ± 0.
21B
26.5 ± 0.1
22A
35.3 ± 0.1
22B
33.8 ± 0.1
23A
27.6 ± 0.1
23B
32.1 ± 0.1
24A
28.8 ± 0.1
24B
25.4 ± 0.1
U-238
∗K-40 is below detection limit in all the samples
17.1 ± 0.1
18.7 ± 0.1
24.6 ± 0.1
23.5 ± 0.1
17.5 ± 0.1
18.3 ± 0.1
20.1 ± 0.1
16.2 ± 0.1
4.2.4 Activity concentrations of Th-232, U-238 and K-40 in soil samples from
Nguluku
The activity concentrations of radionuclides of interest are presented in Table 4.12.
Activity values range from 14.5 - 57.9 Bq/kg with a mean of 29.6 Bq/kg for Th-232 for
six samples and 11.0 - 35.3 Bq/kg with a mean of 27.1 Bq/kg for U-232. Sample Ngu3
was a top soil collected from surface run-off deposits. It was found to be highly
radioactive in comparison with levels of Th-232 and U-238 (502.43 ± 3.87 and 292.19 ±
4.06 Bq/kg respectively). The results of this sample show that the soils uphill are
mineralised with the two nuclides. None of the samples analysed had K-40, except for
samples Ngu2 and Ngu3 where activity concentrations for K-40 were 78.9 Bq/kg and 52
63
Bq/K. Figure 4.4 shows the variation of the activity concentrations for the samples from
Nguluku.
40
35
ACTIVITY CONCENTRATION (Bq/Kg)
30
25
Th-232
20
U-238
15
10
5
0
21A
21B
22A
22B
23A
23B
SAMPLE
Figure 4.3 Activity levels of Th-232 & U-238 in Maumba ya Chini
64
24A
24B
Table 4.13: Activity concentrations of Th-232, U-238 and K-40 - Nguluku
Soil
sample
Activity Concentration in Bq/ Kg for:
Ngu1
Ngu2
Ngu3
Ngu4
Ngu5
Ngu6
Ngu7
Th-232
37.59 ± 0.98
57.89 ± 0.37
502.43 ± 3.87
18.34 ± 1.11
15.04 ± 0.77
14.46 ± 1.06
U-238
28.33 ± 1.04
29.88 ± 0.36
292.19 ± 4.06
35.25 ± 1.21
29.14 ± 0.82
10.97 ± 1.17
34.16 ± 0.44
28.89 ± 0.65
K-40
< 45
78.88 ± 1.40
51.98 ± 10.01
< 45
< 45
< 45
< 45
600
ACTIVITY CONCENTRATION (Bq/Kg)
500
400
Th-232
U-238
300
K-40
200
100
0
NGU1
NGU2
NGU3
NGU4
NGU5
NGU6
NGU7
SAMPLE
Figure 4.4 Activity levels of Th-232, U-238 & K-40 in Nguluku samples
65
For most of the samples analysed, the activity levels for the three nuclides namely U-238,
Th-232 and K-40 are < 100 Bq/K except for sample Ngu3 (300 – 500 Bq/K) from a
partially mineralised area.
4.3 Outdoor Gamma Dose Rate Levels in Maumba
The gamma dose rates D in outdoor air at 1 m above the ground was evaluated from the
results of radionuclides concentrations of samples analysed. Dose conversion factors for
K-40, U-238 and Th-232 used were 0.0417, 0.462 and 0.604, in nGy/h per Bq/kg
respectively (UNSCEAR, 1998). The dose rates for an adult person compared to global
averages (Table 4.14).
Table 4.14 Outdoor Dose rate and Annual Effective Dose for Maumba
Radionuclide
Mean
activity
concentration (Bq/ Kg)
Exposure (nGy/h)
(E-09 Gy/h)
Dose (nSv)
Annual
effective dose
(µSv/y)
Miembeni
Th-232
106.1 ± 21.26
64.08 ± 12.84
44.86 ± 8.99
55.05 ± 11.03
U-238
73.14 ± 15.78
33.79 ± 7.29
23.65 ± 5.10
29.02 ± 6.26
97.87
68.51
84.07
Totals
Maumba Central
Th-232
55.05 ± 9.71
33.25 ± 5.86
23.28 ± 4.11
28.57 ± 5.04
U-238
39.49 ± 7.96
18.24 ± 3.68
12.77 ± 2.57
15.67 ± 3.15
51.49
36.05
44.24
Totals
‘Maumba ya Chini’
Th-232
29.24 ± 4.58
17.66 ± 2.77
12.36 ± 1.94
15.17 ± 2.38
U-238
19.51 ± 2.56
9.01 ± 1.82
6.31 ± 0.83
7.74 ± 1.02
26.67
18.67
22.91
Totals
66
The outdoor annual effective doses for the three subdivisions of the larger Maumba sand
dune – Miembeni, Maumba Central, and Maumba ya Chini – are found to be 84.07, 44.27
and 22.91 µSv/y respectively. According to UNSCEAR (2000), the worldwide annual
total effective dose due to external radiation is within 0.3 – 0.6 mSv range with an
average of 0.48 mSv, for the outdoor component limit 70 µSv while for the indoor
component is 410 µSv. In comparison to the world averages only samples from
Miembeni exceed the required limit (<70 µSv).
4.4 Outdoor gamma Dose Rate Levels in Nguluku
The total outdoor dose rates are estimated for Th-232 and U-238 and are summarised in
Table 4.15 where activity from K-40 was found to be insignificant. Based on the mean
value of dose exposure rate for the entire Nguluku, annual outdoor effective exposure
dose rate to an adult person was estimated to be 155.88 µSv: double the world average.
Table 4.15 Outdoor Total Dose Rate and Annual Effective Dose Rates for Nguluku
region
Radionuclide
Mean activity
concentration (Bq/ Kg)
Exposure (nGy/h)
Dose (nSv)
Th-232
177.5 ± 17.05
107.21 ± 10.30
75.05 ± 7.21
Annual
effective
dose
(µSv/y)
92.09 ± 8.85
U-238
162.5 ± 8.28
75.08 ± 3.83
52.56 ± 2.68
63.79 ± 3.29
182
128
156
Total Dose due from Th-232 and U-238
67
Chapter 5
Conclusions and Recommendations
5.0 Introduction
In this chapter, the conclusions and suggestions for further studies are presented based on
the objectives of the study. Elemental concentration distribution has been summarised for
the major constituents where thorium and uranium, though major contributors to
radioactivity, have not been reported as major constituents of Maumba and Nguluku
sands.
5.1 General Conclusions
The following conclusions have been drawn:
i.
The major elements in soil from Maumba area are iron, titanium and zirconium
with mean concentrations of 1.57 %, 1.21 % and 1189.3 µg/g.
ii.
The activity concentrations of Th-232 and U-238 are higher than world average of
25 Bq/kg, apart from concentration levels for Maumba ya Chini.
iii.
Annual effective doses to adults due to gamma dose in air 1m above the ground,
are below the world average value (< 70 µSv) for two sub-regions of Maumba (44
µSv for Maumba Central and 23 for Maumba ya Chini) and slightly higher (84
µSv) than the world average value for the third sub-region of Maumba
(Miembeni). An annual dose level for Nguluku was estimated as 156 µSv, higher
than the world average value by a factor of two.
68
5.2 Recommendations and Suggestions for Further Research
A similar but more detailed study is highly recommended for entire Kwale district and
the environs. This should be extended to cover activity levels in plants and water. Various
plants used for food or otherwise should be considered for this study. Sources of water
used for drinking and cleaning purposes, such as wells and boreholes and Mukurumudzi
River should also be investigated.
Further study should also be carried out, especially in the neighbouring areas, to
determine levels of the indoor component of annual effective radiation exposure dose.
On the method of elemental analysis used, EDXRF, lowest limits of detection (LLD) for
the elements of interest were found to be considerably higher than is usual the case. This
was attributable to the detector resolution (220-230 eV) during the time when these
measurements were done. Typical resolution values of 180 – 200 eV yield much lower
LLD values. There should be an endeavour therefore to bring down the detector
resolution to within the typical range.
It has been observed that variation in the depths at which samples were did not bring out
significant difference in both the elemental contents and radioactivity concentrations. It
would therefore be important that further research be carried out for soil samples of depth
1 – 2 metres or even at expected mining depths for further investigation on the variation
of the two parameters with depth.
69
The Government of Kenya, through Radiation Protection Board should ensure a
continuous radiation monitoring of Kwale district and the environs especially following
excavation from currently on-going titanium mining activities. This would ensure that the
enhanced radioactivity level does not put the workers and the public at risk, and to
provide protective measures where and when radiation levels are found as a threat to
human health.
70
REFERENCES
Agola, J.O. (2006) Assessment of Natural Radiation Levels in Olkaria Geothermal Area.
M. Sc Thesis, University of Nairobi. Pp 49-51, 71.
Akhatar, N et al (2005) Natural Environmental Radioactivity and Estimation of Radiation
Exposure from Saline Soils. International Journal of Environmental Science &
Technology, Vol.1, No.4, pp 279-285
Al-Arfaj, A. M. et al (1999) Assessment of Exposure to Natural Radiation in the
Kingdom of Saudi Arabia, Southport ‘99, Proceedings of the 6th SRP International
Symposium, The Society for Radiological Protection, London.
Austromineral Ges. m. b. H. (1978) Geological Survey of Mineral and Base Metal
Prospecting in the Coastal Belt, South of Mombasa (Kwale District), Mines and Geology
Department, Ministry of Natural Resources, Kenya. Pp 25-65, 98
Bajwa, B.S. et al (2003) Measurements of Natural Radioactivity in Some Water and Soil
Samples of Punjab State, India. Indoor Built Environ, Vol. 12, pp. 357-361
Bellia, S.et al (1997) Natural Radioactivity in a Volcanic Island: Ustica, Southern Italy.
Applied Radiation Isotopes, Vol. 48, No.2, pp. 287-293
Binge, F.W. and Mason, J.E. (1996) The Mrima Hill Niobium Deposits. Circular No.2,
Mines and Geology Department, Ministry of Natural Resources, Kenya. Pp 14-20, 36
Botezatu E. et al (1999) Radiation Exposure in Some Non-nuclear Industries Involving
Natural radioactivity, Southport ‘99, Proceedings of the 6th SRP International
Symposium, The Society for Radiological Protection, London.
Caswell P.V. and Baker, B.H. (1993) Geology of Mombasa – Kwale Area, Rept. No. 24,
Mines and Geology Department, Ministry of Natural Resources, Kenya.
71
CEM (2000) Best Practices, Radioactive Waste management Guidelines in Western
Australian Mineral Sands Industry, Chamber of Minerals & Energy, Perth.
CES (2000) Coastal and Environmental Services Resources, Environmental Impact
Assessment, Kwale Titanium Minerals Project, Coastal and Environmental Services
Resources Inc., Grahamstown, SA, Vol.7, Summary Report. Pp 4-14
CES (2001) Coastal and Environmental Services Resources, Environmental Impact
Assessment of Tiomin Resources Proposed Kwale Titanium Minerals Project, Coastal
and Environmental Services Resources Inc., Grahamstown, SA, Vol.9, Additional
Specialist Studies. Pp 59-88
Eisenbud, M and Gessell, T (1997) Environmental Radioactivity from Natural, Industrial
and Military Sources, Academic Press, Inc., London.
Gilmore, G. and Hemingway, J.O. (1995) Practical Gamma-ray spectrometry, Wiley.
IAEA (2006a) International Atomic Energy Agency, Applicability of Monitored Natural
Attenuation at Radioactively Contaminated Sites, Technical Reports Series No. 445,
International Atomic Energy Agency, Vienna.
IAEA (2006b) International Atomic Energy Agency, Radiological Conditions in the
Dnieper River Basin, International Atomic Energy Agency, Vienna.
IAEA (2003) International Atomic Energy Agency, Extent of Environmental
Contamination by Naturally Occurring Radioactive Material (NORM) and Technological
Options for Mitigation, Technical Reports No. 419, IAEA, Vienna.
IAEA (2000a) International Atomic Energy Agency, Assessing the Need for Radiation
Protection Measures in Work Involving Minerals and Raw Materials, IAEA Safety Rep.
No. 49, IAEA, Vienna.
72
IAEA (2000b) International Atomic Energy Agency, Indirect methods for Assessing
Intake of Radionuclides Causing Occupational Exposure, IAEA Safety Rep. No. 18,
IAEA, Vienna.
IAEA (1998) International Atomic Energy Agency, Catalogue for Reference Materials
and Intercomparison Exercises 1998/99, AQCS, IAEA, Vienna.
IAEA (1996a) International Atomic Energy Agency, Direct Methods for Measuring
Radionuclides in the Human Body, IAEA Safety Rep. No. 114, IAEA, Vienna.
IAEA (1996b) International Atomic Energy Agency, International Basic Safety Standards
for Protection against Ionizing Radiation and for the Safety of Radiation Sources, IAEA
Safety Rep. No. 115, IAEA, Vienna.
IAEA (1990) International Atomic Energy Agency, Operational Radiation Protection: A
guide to Optimization, IAEA Safety Rep. No. 101, IAEA, Vienna.
IAEA (1989) International Atomic Energy Agency, Measurement of Radionuclides in
Food and the Environment, IAEA Technical Rep. No. 295, IAEA, Vienna.
IAEA (1974) International Atomic Energy Agency, Population Dose Evaluation and
Standards for Man and His Environment, IAEA, Vienna, Austria. pp 13
IAEA (1963) International Atomic Energy Agency, A Basic Toxicity Classification of
Radionuclides, IAEA Technical Report Series No. 15, IAEA, Vienna.
JICA (1993) Japan International Co-operation Agency, Report on the Mineral
Exploration in Mombasa Area – Consolidated Report, Mines and Geology Department,
Ministry of Natural Resources, Kenya. Report No.30. pp 102-117, 132-133
Knoll, G.F. (1979) Radiation Detection and Measurements, John Wiley and Sons , New
York.
73
Kraus, W and Kendall, G. M. (1999) Examples of Enhanced Exposure to Natural
Radiation, Southport ‘99, Proceedings of the 6th SRP International Symposium, The
Society for Radiological Protection, London
Kumar, V. et al (1999) Natural Radioactivity of Indian Building Materials and ByProducts. Applied Radiation Isotopes, Vol. 51, pp. 93-96
Lin Y.M. et al (1996) Natural Background Radiation Dose Assessment in Taiwan.
Environment International, Vol. 22, Suppl. 1, pp S45-S48
Lin P. H. et al (1986) Study of the Indoor Cosmic Radiation Ionisation Intensity,
Radiation Protection Dosimetry, Nuclear Technology Publishing, Kent. Vol. 16, Pp 329332
Maina, D.M. et al (2002) Indoor radon levels in coastal and rift valley regions of Kenya,
International Conference on Occupational Radiation Protection: Protecting Workers
against Exposure to Ionizing Radiation, IAEA, Vienna, IAEA-CN-91/56, pp. 401-405
Mangala, M.J. (1987) Multi-channel Energy Dispersive X-Ray Fluorescence Analysis of
Kerio Valley Fluorite Ores and Mrima Hill Soil Sediments. M.Sc. Thesis, University of
Nairobi. Pp 20-31, 52-62
Miah, F.K. (1998) Distribution of Radionuclides in Soil Samples in and Around Dhaka
City. Applied Radiation Isotopes, Vol. 49, No.1-2, pp. 133-137
Mustapha, A.O (1999) Assessment of Human Exposures to Natural Sources of Radiation
in Kenya. Ph.D. Thesis, University of Nairobi.
Mustapha, A.O. et al (1999) Assessment of Human Exposures to Natural Sources of
Radiation in Kenya, Radiation Protection Dosimetry, Nuclear Technology Publishing,
Kent. Vol. 82, No. 4
Nderito, S.K. (2007) M.Sc. Thesis, University of Nairobi.
74
NSRA (1992) Radiation of Living Environment, NSRA, Tokyo
Patel, J.P. (1991a) Environmental Radiation Survey in Kenya. Discovery and Innovation,
African Academy of Sciences, Vol.3. pp 31-35
Patel, J.P. (1991b) Environmental Radiation Survey of the Area of High Natural
Radiation of Mrima Hill of Kenya, M.Sc. Thesis, University of Nairobi.
RPB (1999) Radiation Protection Board, Radioactivity Investigations at Mrima Hill
Murrum Quarry and Associated Gravelled Roads in Kwale District, Ministry of health,
Kenya.
Saad, H.R. and Al-Azmi, D. (2002) Radioactivity Concentrations in Sediments and Their
Correlation to the Coastal Structure in Kuwait. Applied Radiation Isotopes, Vol. 56, pp.
991-997
Selvasekarapandian, S. et al (2000) Natural Radionuclide Distribution in Soils of
Gudalore, India. Applied Radiation Isotopes, Vol. 52, pp. 299-306
Sroor, A. (2002) Environmental Pollutant Isotope Measurements and Natural
Radioactivity Assessment For North Tushki Area, South Western Desert, Egypt. Applied
Radiation Isotopes, Vol. 57, pp. 427-436
SIPRI, (1981) Stockholm International Peace Research Institute, Nuclear Radiation in
Warfare, Taylor and Francis Ltd., London. Pp 124
UNSCEAR (2000) Sources and Effects of Ionizing Radiation. UNSCEAR Report to the
General Assembly, with scientific annexes. United Nations, New York. Vol. 1, pp 84-141
UNSCEAR (1993) Source and Effects of Ionizing Radiation. UNSCEAR Report to the
General Assembly, with scientific annexes. United Nations, New York. Vol. 1, pp 17-61
UNSCEAR (1988) Source and Effects and Risks of Ionizing Radiation, UNSCEAR
Report to the General Assembly, with scientific annexes. United Nations, New York.
75
Uyttenhove, J. (1997) Capabilities and Limitations of High Resolution Gamma
Spectrometry In Environmental Research. Health Physics, Vol. 73, No.4, pp 644-646
Wamicha et al (2000) The Study of environmental Impact of Titanium Mining in Kwale,
Action-AID, Coastal regional Office, Kenya. Vol.1. pp 3, 8-10
WHO (1972) World Health Organization, Health Hazards of the Human Environment,
WHO, Geneva. Pp 273
Zaman, M.B. et al, (1993) Gamma Spectroscopic Measurements of Natural Radioactivity
in Zambian Phosphate Ores and Products. International Journal of Biochemiphysics,
Vol.2, Nos.1 & 2, Pp 143-147
76
APPENDICES
Appendix I
Uranium-238 Decay Series
Half-life
Mode of Decaya
U-238
4.468 x 10⁹ a
Alpha
Th-234
24.10 d
Beta
Radionuclide
Gamma energyb (KeV)
63.29 (4.8%), 92.38-92.8
(5.6%),
a
Pa-234m
1.17 min
Beta
U-234
245 700 a
Alpha
Th-230
75 380 a
Alpha
Ra-226
1600 a
Alpha
Rn-222
3.8235 d
Alpha
Po-218
3.10 min
Alpha
Pb-214
26.8 min
Beta
351.932 (37.6%)
Bi-214
19.9 min
Beta
609.312 (46.1%)
Po-214
164.3 µs
Alpha
Pb-210
22.20 a
Beta
Bi-210
5.012 d
Beta
Po-210
138.376 d
Alpha
Pb-206
Stable
Only major modes of decay are shown
Some important gamma emissions
b
77
1001.03 (0.837%)
186.211 (3.59%)
46.539 (4.25%)
Appendix II Thorium-232 Decay Series
Half-life
Mode of Decaya
Th-232
1.405 x 10¹⁰ a
Alpha
Ra-228
5.75 a
Beta
Ac-228
6.15 h
Beta
Th-228
1.912 a
Alpha
Ra-224
3.66 d
Alpha
Rn-220
55.6 s
Alpha
Po-216
0.145 s
Alpha
Pb-212
10.64 h
Beta
238.632 (43.6%)
Bi-212
60.55 min
Beta 64.06%
Alpha 35.94 %
727.330 (6.67%)
Po-212
0.299 µs
Alpha
Tl-208
3.053 min
Beta
Radionuclide
Gamma energyb (KeV)
911.204 (25.8%)
240.986 (4.1%)
583.191 (84.5%), 2614.533
(99.16%)
Pb-208
a
Stable
Only major modes of decay are shown
Some important gamma emissions
b
78
Appendix III Typical AXIL computer generated elemental concentrations report
(in g/g)
79
Appendix IV
Typical EDXRF Spectrum - Standard Sample, Soil-7
Scatter peaks
12000
Fe
10000
Ca
6000
Rb
Zr
Sr
4000
Zn
Mn
K
Pb
Ti
2000
Channels
80
1015
989
963
937
911
885
859
833
807
781
755
729
703
677
651
625
599
573
547
521
495
469
443
417
391
365
339
313
287
261
235
209
183
157
131
105
79
53
27
0
1
Counts
8000
Appendix V
Ti
A typical spectrum from titanium bearing ore samples of Kwale –
sample 24A1
Mn
Fe
Co
Cu
Th
Y
Zr
81
Nb
Appendix VI A typical spectrum from titanium bearing ore samples of Kwale –
Sample 2B2
Ti
Mn
Fe
Co
Zn
Th
Y
Zr
82
Nb
83
Channels
8120
7900
7680
7460
7240
7020
6800
6580
6360
6140
5920
5700
5480
5260
5040
4820
4600
4380
4160
3940
3720
3500
3280
3060
Bi-214 (U-238)
Annihilation peak
Pb-212 (Th-232)
40
2840
2620
2400
2180
1960
1740
60
1520
Pb-214 (U-238)
80
1300
120
Pb-212 (Th-232)
140
1080
860
640
420
200
Counts
Appendix VII A Typical Gamma Spectrum
100
K-40
20
0


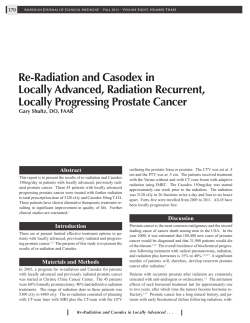
© Copyright 2026