
fulltext
Digital Comprehensive Summaries of Uppsala Dissertations from the Faculty of Science and Technology 1265 Hydrology and Bed Topography of the Greenland Ice Sheet Last known surroundings KATRIN LINDBÄCK ACTA UNIVERSITATIS UPSALIENSIS UPPSALA 2015 ISSN 1651-6214 ISBN 978-91-554-9280-9 urn:nbn:se:uu:diva-259076 Dissertation presented at Uppsala University to be publicly examined in Hambergsalen, Geocentrum, Villavägen 16, Uppsala, Friday, 11 September 2015 at 13:15 for the degree of Doctor of Philosophy. The examination will be conducted in English. Faculty examiner: Professor Francisco Navarro (Universidad Politécnica de Madrid). Abstract Lindbäck, K. 2015. Hydrology and Bed Topography of the Greenland Ice Sheet. Last known surroundings. Digital Comprehensive Summaries of Uppsala Dissertations from the Faculty of Science and Technology 1265. 59 pp. Uppsala: Acta Universitatis Upsaliensis. ISBN 978-91-554-9280-9. The increased temperatures in the Arctic accelerate the loss of land based ice stored in glaciers. The Greenland Ice Sheet is the largest ice mass in the Northern Hemisphere and holds ~10% of all the freshwater on Earth, equivalent to ~7 metres of global sea level rise. A few decades ago, the mass balance of the Greenland Ice Sheet was poorly known and assumed to have little impact on global sea level rise. The development of regional climate models and remote sensing of the ice sheet during the past decade have revealed a significant mass loss. To monitor how the Greenland Ice Sheet will affect sea levels in the future requires understanding the physical processes that govern its mass balance and movement. In the southeastern and central western regions, mass loss is dominated by the dynamic behaviour of ice streams calving into the ocean. Changes in surface mass balance dominate mass loss from the Greenland Ice Sheet in the central northern, southwestern and northeastern regions. Little is known about what the hydrological system looks like beneath the ice sheet; how well the hydrological system is developed decides the water’s impact on ice movement. In this thesis, I have focused on radar sounding measurements to map the subglacial topography in detail for a land-terminating section of the western Greenland Ice Sheet. This knowledge is a critical prerequisite for any subglacial hydrological modelling. Using the high-resolution ice thickness and bed topography data, I have made the following specific studies: First, I have analysed the geological setting and glaciological history of the region by comparing proglacial and subglacial spectral roughness. Second, I have analysed the subglacial water drainage routing and revealed a potential for subglacial water piracy between adjacent subglacial water catchments with changes in the subglacial water pressure regime. Finally, I have looked in more detail into englacial features that are commonly observed in radar sounding data from western Greenland. In all, the thesis highlights the need not only for accurate high-resolution subglacial digital elevation models, but also for regionally optimised interpolation when conducting detailed hydrological studies of the Greenland Ice Sheet. Keywords: climate change, Greenland Ice Sheet, radio-echo sounding, digital elevation models, ice thickness, bed topography, spectral analysis, roughness, subglacial hydrology, water piracy, englacial features, drainage catchments, meltwater runoff, ice dynamics Katrin Lindbäck, Department of Earth Sciences, Villav. 16, Uppsala University, SE-75236 Uppsala, Sweden. © Katrin Lindbäck 2015 ISSN 1651-6214 ISBN 978-91-554-9280-9 urn:nbn:se:uu:diva-259076 (http://urn.kb.se/resolve?urn=urn:nbn:se:uu:diva-259076) Akademisk avhandling som för avläggande av filosofie doktorsexamen i naturgeografi vid Uppsala universitet kommer att offentligen försvaras i Hambergsalen, Villavägen 16, Uppsala, fredagen den 11 september 2015, klockan 13:15. Disputationen sker på engelska. Fakultetsopponent: Francisco Navarro (Universidad Politécnica de Madrid). Referat Lindbäck, K. 2015. Grönlands inlandsis hydrologi och bottentopografi. Digital Comprehensive Summaries of Uppsala Dissertations from the Faculty of Science and Technology 1265. 59 pp. Uppsala: Acta Universitatis Upsaliensis. ISBN 978-91-554-9280-9. De ökade temperaturerna i Arktis påskyndar förlusten av landbaserad is lagrad i glaciärer och permafrost. Grönlands inlandsis är den största ismassan på norra halvklotet och lagrar ca 10% av allt sötvatten på jorden, vilket motsvarar ca 7 meter global havsnivåhöjning. För ett par decennier sedan var inlandsisens massbalans dåligt känd och antogs ha liten inverkan på dagens havsnivåhöjning. Utvecklingen av regionala klimatmodeller och satellitbaserad fjärranalys av inlandsisen har under de senaste decenniet påvisat en betydande massförlust. För att förutse vilken inverkan inlandsisen har på framtida havsnivåhöjningar krävs en förståelse för de fysikaliska processerna som styr dess massbalans och isrörelse. I de sydöstra och centrala västra delarna av inlandsisen domineras massförlusten av dynamiska processer i isströmmar som kalvar ut i havet. Massförlusten i de centrala norra, sydvästra och nordöstra delarna domineras av isytans massbalans. Ytterst lite är känt om hur det hydrologiska systemet ser ut under inlandsisen; hur väl det hydrologiska systemet är utvecklat avgör vattnets påverkan på isrörelsen. I denna doktorsavhandling har jag använt markbaserade radarmätningar för att kartlägga den subglaciala topografin för en del av den västra landbaserade inlandsisen. Denna kunskap är en viktig förutsättning för att kunna modellera den subglaciala hydrologin. Med hjälp av rumsligt högupplöst data över istjockleken och bottentopografin har jag gjort följande specifika studier: Först har jag analyserat de geologiska och glaciologiska förhållandena i regionen genom att jämföra proglacial och subglacial spektralanalys av terrängens ytojämnheter. Sedan har jag analyserat den subglaciala vattenavrinningen och påvisat en potential för att avrinningsområdena kan ändras beroende på vattentryckförhållandena på botten. Slutligen har jag tittat mer i detalj på englaciala radarstrukturer som ofta observerats i radardata från västra Grönland. Sammanfattningsvis belyser avhandlingen behovet av inte bara noggranna rumsligt högupplösta subglaciala digitala höjdmodeller, utan även regionalt optimerad interpolering när detaljerade hydrologiska studier ska utföras på Grönlands inlandsis. Nyckelord: klimatförändringar, Grönlands inlandsis, radarmätningar, digitala höjdmodeller, istjocklek, bottentopografi, spektralanalys, subglacial hydrologi, englaciala strukturer, avrinningsområden, isdynamik Katrin Lindbäck, Institutionen för geovetenskaper, Villav. 16, Uppsala universitet, 75236 Uppsala. © Katrin Lindbäck 2015 ISSN 1651-6214 ISBN 978-91-554-9280-9 Ilisimatuutut saqqummiussineq pissaaq Uppsala University tamanut ammasumik Hamberg inersuani, Geocentrum, Villagâgen 1, Uppsala, tallimanngorneq 11. September 2015 nal. 13:15 doktorinngorniutitut eqqarsarluarnianermi. Saqqummiussineq tuluttut saqqummiunneqassaaq. Ilinniartitsisutut censoriussaaq: Proffesor Francisco Navarro (Universidad Poltécnica de Madrid). Imaqaniliaq Lindbäck, K. 2015. Sumiiffik Kalaallit nunaata sermersuarujussua. Digital Comprehensive Summaries of Uppsala Dissertations from the Faculty of Science and Technology 1265. 59 pp. Uppsala: Acta Universitatis Upsaliensis. ISBN 978-91-554-9280-9. Avannaarsuani silaannaap kissakkiartornerata sermersuit Kalaallit Nunaaniittut aakkiartupiloortippai. Sermersuaq Kalaallit Nunaaniitoq anginersaavoq silarsuarmi sermini ataatsimoortuni. Nunarsuamilu ermit tamarmik 10 %-teralugu – aakkaluarunilu Nunarsuup imarsui 7 meterinik qaffattissalugit. Ukiut qulikkaat marluk matuma siorna Nunatta sermersua aakkiartulissappat sunik kinguneqassanersoq ilisimaneqanngilluinnangajassimavoq, aakkaluarunilu akornutaassanersorluunniit Nunarsuup imarsuinut. Ineriartortitsineq sumiiffinni silaannaap sermillu pissusiinik misissuinermi paasinarsitissimavaa malunnarluartumik sermeq aakkiartortoq. Kalaallit Nunaata sermersua alartaasernerani paasinarpoq sermip aakkiartornera imarsuit allanngorsinnaaneranik siunissami takussaasumik sunniuteqarumaartoq, immap sarfaqarneranik allannguisumik. Kujataa kangiata tungaani aamma sermip qiterpasissuani, aakkiartornerujussua sermillu immamut nakkaanersua ersarippoq. Allanngoriartornerit sermip qaavani, sermillu qiterpasissuani naqiittinerit ilanngariartornerujussualu sermersuup avannarpasissua qiterpasissuani, kujataata kitaani avannaatalu kangisissuani ersaripput. Ilisimasat annikitsoralaarsuupput imeqarnermut piusut sermersuup naqqaniittut pillugit; qanoq ermit pissuseqarnersut, imeqarneratalu qanoq sermip sisooriartornera sunnertarneraa. Uvani ilisimatuutut allaaserisanni erseqqissarniarsarivara radarikkut naatsorsuinerit sermillu iluini quppat putorsuillu sumiissusersiniarsaralugit, ersarissarniarlugit Kalaallit Nunaata kitaatungaaniituni sermersuarni. Tamanna ilisimasaq pingaaruteqarpoq qupparsuit sumiikkaluartut sumiissusiinik. Sikup issussusaa paasissutissallu pingaaruteqartut paasiniarlugit makku misissuinerit atorsimavakka: Siullermik paasiniarsimavakka nunap pissusiinik pisut aammalu sermeqarnermut pissuttit piffimmi qupparsuillut qajannaassusaai. Aappaatullu, paasiniarsimavakka qupparsuarni kuuit kuunneri, tamakkulu kuuit quppanik aamma allanik pilersitsiartorneri quppanut allanut pioreersunut katiterneri allanngoriartarnerilu, kiisalu erngit naqitsineri. Kingullertullu Sermit pissusai sukumiinerusumik misissorsimallugit radaritigullu misissuinerit atorlugit Kalaallit Nunaata kiterpasissuani. Ilisimatuutut saqqummersitami ersarippoq pisariaqartitsisoqartoq eqqoqqissaartunik ersarissakkanik qupparsuit qarasaasiatigut portussutsit/itissutsinik takussutissat, aammali sumiiffinni aaliangersimasuni aakkiartorfinni ersarissakkanik misissuinerni Kalaallit Nunaata Sermersuani. Sulinermi atukkat: Silaannaap allanngoriartornera, Kalaallit Nunaata sermersua, maligaasat atorlugit portu-ssutsinik misissuinerit, qarasaasiatigut titartakkat piusuusaartitat, sermip issussusaa, sermip pissusaata ersarissarnera, Sermip qajannaassusaa, qupparsuit, imeqassuseq, Sermeqarnerup pissusai, tasertat kuunneri, aakkiartornerup kunneri, sermip aalasinnaaneranik misissuinerit. Translated to Greenlandic by Aron Emil Petersen, Park Ranger, Ilulissat Icefjord. © Katrin Lindbäck 2015 ISSN 1651-6214 ISBN 978-91-554-9280-9 Trött att gissa och att fråga, Forskarn will till Polen tåga. Icke will den djerfwe stanna förrn han står på jordens panna och ur warelsernas graf mäter jord och himmel af. ESAIAS TEGNÉR (1817) List of Papers This thesis is based on the following papers, which are referred to in the text by their Roman numerals: I Lindbäck, K., Pettersson, R., Doyle, S.H., Helanow, C., Jansson, P., Savstrup Kristensen, S., Stenseng, L., Forsberg, R., Hubbard, A.L., 2014. High-resolution ice thickness and bed topography of a land-terminating section of the Greenland Ice Sheet. Earth System Science Data 6, 331–338, doi:10.5194/essd-6-3312014 © Authors 2014. CC Attribution 3.0 License. II Lindbäck, K., Pettersson, R., 2015. Spectral roughness and glacial erosion of a land-terminating section of the Greenland Ice Sheet, Geomorphology 238, 149–159, doi:10.1016/ j.geomorph.2015.02.027 © 2015 Elsevier B.V., reprinted with permission. III Lindbäck, K., Pettersson, R., Hubbard, A.L., Doyle, S.H., van As, D., Mikkelsen, A.B., Fitzpatrick, A.A., 2015. Subglacial water drainage, storage, and piracy beneath the Greenland Ice Sheet, Geophysical Research Letters, In Review. IV Lindbäck, K., Pettersson, R., Svensson, A., In Prep. Origin of englacial features in radio-echo sounding data from the Greenland Ice Sheet, Manuscript. Co-authorship Paper I: I collected, processed and analysed the data and wrote the paper. R. Pettersson initiated and designed the radar method. R. Pettersson, S.H. Doyle, C. Helanow and A.L. Hubbard participated in data collection. S.S. Kristensen and L. Stenseng contributed with the DTU data set. R. Pettersson, S.H. Doyle, C. Helanow and P. Jansson participated in the writing process. Paper II: I performed the analysis and wrote the paper with input from R. Pettersson. Paper III: I performed the analysis and wrote the paper. D. van As contributed with the runoff data set, A.B. Mikkelsen with the Watson discharge data set and A.A. Fitzpatrick with the supraglacial lake data set. R. Pettersson, A.L. Hubbard, S.H. Doyle and D. van As participated in the writing process. Paper IV: I wrote the paper and shared the analysis with R. Pettersson and A. Svensson. List of additional Papers In addition, I contributed to the following papers that are related to this work but not part of the thesis: V Doyle, S.H., Hubbard, A.L., Dow, C.F., Jones, G.A., Fitzpatrick, A., Gusmeroli, A., Kulessa, B., Lindbäck, K., Pettersson, R., Box, J.E., 2013. Ice tectonic deformation during the rapid in situ drainage of a supraglacial lake on the Greenland Ice Sheet. The Cryosphere 7, 129–140, doi:10.5194/tc-7-129-2013 VI Dow, C.F., Kulessa, B., Rutt, I.C., Tsai, V.C., Pimentel, S., Doyle, S.H., van As, D., Lindbäck, K., Pettersson, R., Jones, G.A., Hubbard, A., 2015. Modeling of subglacial hydrological development following rapid supraglacial lake drainage, Journal of Geophysical Research 120, 6, 1127–1147, doi:10.1002/2014JF003333 Contents Prologue ........................................................................................................ 11 Introduction ................................................................................................... 13 Climate change in the Arctic .................................................................... 13 Mass balance and dynamics of the Greenland Ice Sheet .......................... 14 Hydrology of the Greenland Ice Sheet ..................................................... 18 Aims and objectives ...................................................................................... 21 Study area ..................................................................................................... 23 Data and methods.......................................................................................... 25 Radar sounding in glaciology ................................................................... 26 Digital elevation models........................................................................... 33 Spectral roughness.................................................................................... 34 Hydraulic potential analysis ..................................................................... 34 Summary of Papers ....................................................................................... 37 Paper I ...................................................................................................... 37 Paper II ..................................................................................................... 37 Paper III .................................................................................................... 38 Paper IV ................................................................................................... 39 Discussion ..................................................................................................... 41 High-resolution subglacial data sets ......................................................... 41 Hard bedrock or soft sediments ................................................................ 42 Basal thermal regime ................................................................................ 43 The valley glacier analogue ...................................................................... 44 Subglacial water piracy ............................................................................ 44 Distribution of moulins ............................................................................ 45 Conclusions ................................................................................................... 47 Acknowledgments......................................................................................... 49 Sammanfattning på svenska .......................................................................... 51 References ..................................................................................................... 53 Prologue Glaciers are sensitive indicators of climate change and a key source of information on historical climate. Today, most glaciers and ice sheets decrease in mass and contribute to global sea level rise. But glaciers were not always appreciated. During the Little Ice Age, between the 16th and 19th century, Europe experienced several cold spells and many rivers and canals froze. It was so cold that the sea ice in the Arctic reached far to the south and polar bears came ashore in Iceland. It was also during this time that the Norse settlement in Greenland came to a mysterious end. In the Alps, glaciers grew. Sometimes they moved forward as rapidly as hundreds of metres per year and surged over valleys and destroyed villages and farmlands. They could block valleys and form ice-dammed lakes, which when they burst caused glacial floods, called jökulhlaups in Icelandic. The view on glaciers during that time was very different from today’s view. For centuries, when the glaciers advanced, they were seen as a curse, an evil dragon. Not until the late 18th century did glaciers start to have a natural romantic shimmer and people hiked in the mountains to watch them. Today, glaciers are still seen in a romantic light but with an added sadness to it; they are fragile creatures that need snow and cold to survive. Climate change and the melting of glaciers and ice sheets encompass one of the greatest challenges of our time. 11 06 April 2010 16:08 Russell glacier ice front Introduction Climate change in the Arctic Over a 100 years ago, the Swedish scientist Svante Arrhenius hypothesised that an increased concentration of carbon dioxide in the atmosphere could alter Earth’s surface temperatures and that the largest changes would occur in the polar regions (Arrhenius, 1896). As Arrhenius foresaw, the most alarming changes have so far taken place in the Arctic, compared with the planet as a whole. The warming anomaly in the Arctic has been twice the corresponding value of the global surface temperature change for the past 50 years (Fig. 1). This effect is caused by various feedback mechanisms, commonly referred to as the Arctic amplification. The Arctic amplification works on different temporal and spatial scales, where one of the most prominent aspects is the retreat of the Arctic sea ice during summer. When bright and reflective ice (with high albedo) melts, the dark ocean surface (with low albedo) absorbs more heat from the Sun amplifying the warming effect. The Arctic amplification is expected to become stronger in coming decades with impacts far beyond the Arctic region (Serreze and Barry, 2011). Figure 1. Linear trends in annual mean surface air temperature for the period 1960– 2009, based on NASA temperature analysis (http://data.giss.nasa.gov/gistemp; Serreze and Barry, 2011). 13 The increased temperatures in the Arctic accelerate the loss of land based ice stored in glaciers and permafrost by melting. The Greenland Ice Sheet is the largest ice mass in the Northern Hemisphere and holds 2.9 million gigatonnes (Gt) of frozen water, ~10% of all the freshwater on Earth, equivalent to 7.4 m of global sea level rise (Bamber et al., 2013). The maximum ice thickness is 3400 m and the current ice is 110 000 years old at the Summit location in central Greenland (Meese et al., 1997). Because of its large size, the ice sheet has, just like sea ice, an important role in controlling the climate. The bright surface of the ice sheet reflects sunlight, and when the surface melts, the albedo is decreased owing to a combination of factors, such as the deformation of snow crystals and the presence of liquid water in the snow (Box et al., 2012). Until recently, the mass balance of the Greenland Ice Sheet was poorly known and assumed to have little impact on the present sea level rise. The time scale for the dynamic response of ice sheets to climate change (e.g., snow accumulation, surface temperature and ice flow) was typically considered to be hundreds to thousands of years (Alley and Whillans, 1984; Zwally et al., 2002). The development of regional climate models and remote sensing of the ice sheet by satellites during the past decade have, however, revealed a significant mass loss (e.g., van den Broeke et al., 2011). The mass loss from the Greenland Ice Sheet has the potential to flood the highly populated coastal regions of Earth with large socioeconomic effects (Nicholls and Cazenave, 2010). Mass balance and dynamics of the Greenland Ice Sheet It is a challenge for the scientific community to predict the stability of the Greenland Ice Sheet, especially with the current anthropogenic climate change. Looking back into Earth’s history can give some clues on the behaviour of the ice sheet during different climatic settings. Natural cycles of glaciations (ice ages with large ice sheets) have occurred in the past million years in intervals of ~100 000 years, driven by changes in Earth’s orbital geometry. During the last warm interglacial period (the Eemian, 130 000 to 115 000 years ago) the sea levels were 4 to 8 m higher than the present level and the Greenland Ice Sheet had shrunk the equivalent of 2 m of sea level rise (NEEM community members, 2013). When the climate became colder again, several ice sheets formed and grew around the planet; by the Last Glacial Maximum (~20 000 years ago), the sea level was 120 m below the present level (Fairbanks, 1989). Vertical land movements (upwards and downwards) are still taking place in response to the past transfer of mass from the land to the oceans. After the Last Glacial Maximum, the ice sheets melted rapidly, raising the sea levels quickly, but 2000 years before present (YBP) the sea level rise had almost ceased. 14 Because of the present anthropogenic warming of the climate system the global mean sea level has again started to rise, increasing by 0.19 m during the 20th and early 21st century (Vaughan et al., 2013). The present mean global sea level rise since 1993 has been 3.2 ± 0.4 mm yr–1. Most of the sea level rise has so far been caused by thermal expansion of ocean water (~0.8 mm yr–1 between 1993 and 2010; Domingues et al., 2008) and melting of mountain glaciers (~0.8 mm yr–1, between 1993 and 2009; Gardner et al., 2013). The ice loss from the Greenland Ice Sheet, however, has increased over the past decade (Fig. 2; Rignot et al., 2011). The average rate of mass change has increased from –121 [–149 to –94] Gt yr–1 over the period 1993 to 2002 (a sea level equivalent to ~0.3 mm yr–1) to –229 [–290 to –169] Gt yr–1 over the period 2005 to 2010 (a sea level equivalent to ~0.6 mm yr–1). The mass loss from the Greenland Ice Sheet is therefore expected to be one of the dominant contributors to sea level rise in the 21st century. Figure 2. Contribution of glaciers and ice sheets to sea level change. Cumulative mass loss from glaciers and ice sheets (in sea level equivalents) is 1.0 to 1.4 mm yr–1 for 1993–2009 and 1.2 to 2.2 mm yr–1for 2005–2009 (Vaughan et al., 2013). To monitor how the Greenland Ice Sheet will affect sea levels in the future requires understanding the physical processes that govern its mass balance and movement (Fig. 3). During winter snow falls over the surface of the ice sheet and in the high, cold, central parts (called the accumulation zone), the snow is compacted into ice through metamorphosis, a process that built up the ice sheet over tens of thousands of years to its present thickness of over 3000 m (Allison et al., 2009). The mass increase in the central parts drives the movement of the ice sheet to the marginal areas through internal deformation and to some extent sliding. During summer, melting of the snow may occur in the accumulation zone, and the water percolates and refreezes in the snow pack. This process occurs more frequently at lower elevations, but in July 2012, 90% of the entire ice sheet surface experienced melting at the same time (Nghiem et al., 2012). The mass loss from the ice sheet, however, is taking place mainly from the marginal areas of the ice sheet (called the 15 ablation zone), where the melting of snow and ice produces surface runoff. The equilibrium line altitude (ELA) is the theoretical average altitude where the accumulation equals the ablation. The balance between accumulation and ablation (the surface mass balance) is one important component affecting the ice sheet’s total mass loss. In the present climate, the surface mass balance of the Greenland Ice Sheet is positive: total snowfall (697 Gt yr–1) and rainfall (46 Gt yr–1) minus runoff (248 Gt yr–1) and evaporation/sublimation (26 Gt yr–1) yield a surface mass balance of 469 ± 82 Gt yr–1 for the period 1958 to 2007 (Ettema et al., 2009). Recently, however, the surface mass balance has shown a progressively decreasing trend, since the increased ablation has been outweighing the accumulation. Precipitation is projected to increase at about 5% of the annual mean warming over Greenland, but the increase in snowfall is smaller because the fraction of rain increases as temperature rises (Fettweis et al., 2013). Changes in surface mass balance dominate mass loss from the Greenland Ice sheet in the central northern, southwestern and northeastern regions. In the southeastern and central western regions, the mass loss is dominated by another important process, called dynamic thinning (Pritchard et al., 2009), which makes the current total mass loss from the entire ice sheet negative. Ice streams channelise the ice flow, moving hundreds, or sometimes thousands, of times faster than the ice sheet’s average ice flow. The ice streams terminate in outlet glaciers or floating ice shelves, where icebergs break loose into the ocean (through calving). The largest outlet glaciers of the Greenland Ice Sheet are the Kangerdlugssuaq Glacier and Koge Bugt Glacier on the east coast, and the Jakobshavn Glacier, on the west coast. In total they drain ~40% of the ice sheet (Enderlin et al., 2014). Ice discharge across the grounding line is increased by the acceleration of some of these glaciers (Joughin et al., 2010; Sasgen et al., 2012). The flow is enhanced by a wet lubricated bed and in some cases soft subglacial sediments, and the flow is mainly governed by calving, as well as by submarine melt by subsurface warm waters at the terminus (Allison et al., 2009). With a predicted warmer climate in Greenland (Hanna et al., 2013), the outlet glaciers of the Greenland Ice Sheet may retreat inland and eventually lose their contact with the ocean. Hence, the slow-moving land-terminating parts of the ice sheet governed by surface mass balance may have an increasing role in the mass loss of the ice sheet in the future, even though many of the marine outlet glaciers have very deep troughs extending far into the ice sheet interior (Morlighem et al., 2014). The ablation zone is also assumed to expand to higher altitudes with a warmer climate, making a larger area of the ice sheet surface affected by intense melting, which results in a lower (and warmer) ice surface and a lower surface albedo (allowing the surface to absorb more solar radiation); both processes further increase the melt in a posi16 tive feedback loop (Robinson et al., 2012). The warm summers of the past two decades are unusual in the multi-centennial records and extreme melt such as the one in July 2012 has been observed only twice in ice core records (Vaughan et al., 2013). An understanding of the geometry and evolution of meltwater drainage pathways on and beneath the Greenland Ice Sheet is therefore important in assessing their contribution to the ice sheet’s meltinduced dynamic response. Figure 3. Key variables related to the determination of the Greenland Ice Sheet mass changes: (a) mean surface mass balance 1989–2004 from regional atmospheric climate modelling (Ettema et al., 2009); (b) ice sheet velocity for 2007–2009 determined from satellite data, showing fastest ice flow in red, fast flow in blue, and slower flow in green and yellow (Rignot and Mouginot, 2012); (c) changes in ice sheet surface elevation for 2003–2008 determined from ICESat altimetry, with elevation decrease in red to increase in blue (Pritchard et al., 2009); and (d,e,f) temporal evolution of ice loss determined from GRACE time-variable gravity, shown in centimetres of water per year for the different periods 2003–2012, 2003–2006, and 2006–2012, colour coded red (loss) to blue (gain) (Velicogna, 2009). Image compilation from Vaughan et al. (2013). 17 Hydrology of the Greenland Ice Sheet Ice dynamics may also play an important role in areas where surface mass balance is the dominant process governing mass loss, through a process called basal lubrication. In large parts of the western ablation zone of the Greenland Ice Sheet, water is collected in streams on the ice surface. Supraglacial streams provide a steady supply of large volumes of meltwater into surface lakes (called supraglacial lakes) and vertical conduits (called moulins) during the melt season (Phillips et al., 2011; Smith et al., 2015; Yang and Smith, 2013). Due to hydro-fracturing at the bottom of the supraglacial lakes (Alley et al., 2005; van der Veen, 2007) meltwater can drain through more than 1000 metres of ice in crevasses and form moulins connecting the surface and the bed of the ice sheet (e.g., Das et al., 2008; Doyle et al., 2013; Joughin et al., 2013; Selmes et al., 2011). Moulins can also form independently of supraglacial lakes in crevassed areas (Holmlund, 1988). When the meltwater reaches the bedrock through moulins (Fig. 4), it lubricates the ice–bed interface and reduces friction, lifting and making the ice mass slide faster (Shepherd et al., 2009; Stevens et al., 2015; Zwally et al., 2002). This hydrological coupling between the surface and the bed causes ice flow variations (Das et al., 2008; Doyle et al., 2013), but on short temporal and spatial scales only (Sundal et al., 2011; van de Wal et al., 2008). Studies have shown that the ice sheet’s hydrological system may adapt quickly to larger inputs of meltwater by forming efficient low pressure subglacial channels, resulting in a more or less constant ice flux over the years (Sole et al., 2013; Tedstone et al., 2013). Hence, the impact of meltwater on mass loss over longer decadal time scales is uncertain. These studies, however, took place close to the ice margin and it is still doubtful if low pressure channels can exist in the interior under kilometre thick ice, with high ice overburden pressures at the bed and low surface slopes to drive the water (Dow et al., 2015; Meierbachtol et al., 2013). There have also been observations of an interannual increase in annual flow velocity above the ELA, since the surface melt is too low in these areas for the development of efficient drainage at the bed (Doyle et al., 2014). Low-pressure channels have been mostly studied on valley glaciers (Benn and Evans, 2014; Cuffey and Paterson, 2010), where channelised systems consist of tunnels, carved into the ice, the bedrock or the till (e.g., Nye, 1976; Röthlisberger, 1972), through which water can flow quickly to the glacier front (~1 m s–1). The channels form during the melt season, when the input of water from the surface is large. When the water flow ceases in the autumn the high pressure from the ice overburden closes the channels and the drainage at the bed transforms into a distributed system, with linked cavities, thin films or flow through sediments (e.g., Hallet, 1979; Hubbard et al., 1995; Kamb, 1987). The cavities transport much smaller amounts of water 18 (~0.01 m s–1) from areas with basal melt and are always water filled (Cuffey and Paterson, 2010). They are characterised by high pressure and will prevail until the melting season starts again the next year. Many of the processes found in small valley glaciers may be scaled up to serve as models for ice sheet hydrology, but ice sheets, because of their size, involve different problems that need to be resolved before a useful model of ice sheet hydrology can be applied. Figure 4. Glaciological features in the equilibrium and ablation zones, including surface lakes, inflow channels, crevasses and moulins. Ice flow from basal ice at the pressure melting point is partly from basal sliding and partly from shear deformation, which is mostly in a near-basal boundary layer (Zwally et al., 2002). Other indirect processes coupled with basal lubrication may have an effect on ice flow: soft lubricated sediments may smooth the bed (Boulton and Hindmarsh, 1987; Smith et al., 2013) and whether the ice sheet is frozen to its bed may affect ice flow (Alley, 1993). With a warming climate supraglacial lakes will migrate to higher elevations in the interior of the ice sheet, potentially increasing the amount of meltwater reaching the bed (Leeson et al., 2014). Basal lubrication modulates ice flow in some regions, especially in southwest Greenland, but it cannot explain recent dramatic regional speed-ups that have resulted in rapid increases in ice loss from calving glaciers, which are associated with the intrusion of warm ocean waters into glacial fjords (Vaughan et al., 2013). Nevertheless, surface mass balance and ice dynamics cannot be assessed separately, because of the strong interaction between these two processes (Gillet-Chaulet et al., 2012; Goelzer et al., 2013). After decades of theoretical and empirical studies, the scientific community is only now starting to understand the variety of processes involved in the inaccessible englacial and subglacial environments, and field observations are needed to test theories of subglacial processes (Lüthi, 2013). Understanding the dynamics at the base of the Greenland Ice Sheet will make it possible to predict the ice sheet’s future stability in a warming climate. 19 06 August 2010 15:44 moulin Aims and objectives The overarching aim of my thesis is to increase the knowledge of Greenland Ice Sheet hydrology by analysing the spatial distribution of the sub- and englacial drainage systems using geophysical methods. The main objective of my project was therefore to collect radar sounding data on the ice thickness and subglacial topography in detail for a land-terminating section of the ice sheet. Knowledge of the ice thickness and bed topography is a critical prerequisite for any subglacial hydrological modelling. Regional scale mapping also reveals more about the representability of detailed local data. This study is part of the Greenland Analogue Project (GAP), a large international project that aims to improve the current understanding of hydrogeological processes associated with continental-scale glaciations, including the presence of permafrost and the advance/retreat of ice sheets. Over a shorter time scale, the aims of the project include increasing the understanding of how increased melting of the Greenland Ice Sheet will impact the cryo-hydrological system and, by extension, ice sheet dynamics and stability. With the high-resolution ice thickness and bed topography data the following specific objectives were identified: To compare glacial erosion and basal roughness of the well-studied proglacial area with the inaccessible subglacial area and thereby provide a geomorphological setting of the glacially hidden surfaces. To analyse large-scale subglacial water routing and compare it with ice surface runoff, proglacial discharge and ice sheet dynamics. To investigate and model the characteristics of englacial hydrological features that are commonly observed in radar data from the western margin of the Greenland Ice Sheet. Achieving these aims and objectives should add to the currently limited spatial knowledge of Greenland Ice Sheet hydrology, which is important in assessing the ice sheet’s melt-induced dynamic response on a large scale. 21 14 April 2011 16:58 drive to the ice front Study area The field site is located at the land-terminating western part of the Greenland Ice Sheet close to the Arctic Circle (67°N, 50°W; Fig. 5) and close to Greenlandʼs international airport Kangerlussuaq, meaning the long fjord in Greenlandic (called Søndre Strømfjord in Danish). The landscape in the Kangerlussuaq area is characterised by long and narrow fjords, up to 600 m deep. The land ends at the coast of the Davis Strait and is one of the largest continuous ice-free areas in Greenland. The Sukkertoppen Ice Cap in the south has elevations up to ~1800 m above sea level (a.s.l.), and to the northeast (i.e., towards the ice margin) a low-relief highland is located at ~1000 m a.s.l.. Farther north, the plateau becomes progressively lower and the landscape changes to an undulating terrain with irregular hills with an elevation of ~600 m. The Precambrian basement is exposed, and the bedrock consists of primarily Archaean orthogneiss with minor amounts of amphibolites and metasedimentary rocks (Garde and Hollis, 2010; Wilson et al., 2006). Figure 5. Geological map of the West Greenland region (modified from Gool and Marker, 2007). The location of the study area is indicated by the red box. There is a good understanding of the regional Holocene (~11 700 YBP until today) deglaciation history of the proglacial area: the Kangerlussuaq fjord area has been extensively studied since the 1970s, with radiocarbon dating of moraine systems, glaciomarine deposits and aeolian and lake deposits 23 (Storms et al., 2012, and references therein). The ice sheet had its maximum extent during the Last Glacial Maximum ~20 thousand YBP and extended beyond the present day coastline, depositing off-shore moraines. The ice sheet thickness was relatively thin (500 to 1000 m), and the area was influenced by shelf-based coalescent ice stream systems, of which little is known of their history. The ice sheet retreated slowly during the Holocene, with moraines marking temporary halts or readvances (van Tatenhove et al., 1996). Approximately 4000 YBP, during the mid-Holocene climatic optimum, the ice sheet reached its most landward location. The minimum extent of the ice sheet during the Holocene is uncertain and models show a wide variety in timing and extent. Nevertheless, clear evidence in the proglacial landscape indicates that the retreat was beyond the present margin during the mid-Holocene. The currently ice-covered area includes the informally named Isunnguata Sermia, Russell, Leverett, Ørkendalen and Isorlersuup glaciers and their catchment areas up to an elevation of ~1600 m a.s.l., ~90 km from the ice margin where the long-term ELA is located (van de Wal et al., 2005). The area extends 100 km farther to the south and has a total area of ~12 000 km2. The study area represents a typical land-terminating section of the Greenland Ice Sheet, which during the melt season shows diurnal (e.g., Shepherd et al., 2009) and seasonal variations in ice velocity and surface uplift (e.g., Bartholomew et al., 2011a). Land-terminating glaciers and their catchments provide ideal study areas for investigating the response of ice sheet dynamics to atmospheric forcing, as they are isolated from marine influences such as calving and submarine melt. The study area is well covered by meteorological stations, many of them part of the Greenland Climate Network (Steffen and Box, 2001). The high density of automatic weather stations on the otherwise scarcely instrumented ice sheet makes the area an attractive location for investigations of surface mass balance and meltwater runoff (van As et al., 2012; van de Wal et al., 2005). The surface mass balance showed a significant decrease the past two decades (van de Wal et al., 2012), while supraglacial lakes expanded to higher elevations (Fitzpatrick et al., 2014; Liang et al., 2012; Sundal et al., 2009) and albedo persistently declined between 2000 and 2011 (Box et al., 2012). These changes are consistent with warming temperatures over Greenland (Hanna et al., 2013; van As et al., 2012). 24 Data and methods In the following sections, I describe the basic radar sounding methods used to acquire the Uppsala University data set in Paper I (Fig. 6) to give a short background to the technique in measuring ice thickness and bed elevation with radar, and I also include a description of the origin of englacial features in Paper IV. Furthermore, I summarise the spectral roughness method in Paper II and the hydraulic potential method in Paper III. Figure 6. Study area in west Greenland with data sources consisting of groundbased radar surveys (UU data set) and airborne radar surveys (DTU and IceBridge data sets) collected between 2003 and 2012. 25 Radar sounding in glaciology Radio-echo sounding or simply radar sounding is a geophysical method for detection of objects under the ground surface (Dowdeswell and Evans, 2004). Radar is an acronym for radio detection and ranging, and in 1886, Heinrich Hertz showed that radio waves can be reflected from solid objects. In 1930, at Admiral Byrd’s base in Antarctica, the personnel suspected that glacial ice might be transparent to radio waves, since there had been numerous flight crashes with aircraft where the pilots had reported that the radar altimeters were useless for picking up the ground ice surface and the radar signal seemed to penetrate the ice. It was not until 1957, however, that Amory Waite and others used radar to measure ice depth in northwestern Greenland and on the Ross Ice Shelf in Antarctica. Over the next 20 years, systematic flight surveys of Antarctica collected more than 400 000 km of radar profiles, covering 50% of the ice sheet (Siegert, 1999), and some of the most fascinating findings were the hundreds of subglacial lakes hidden under the kilometre thick ice. Radar sounding in glaciology has primarily been developed to give information about ice thickness. Without this information, ice sheet models would be theoretical and have too many assumptions and inaccuracies (Dowdeswell and Evans, 2004). Today, radar sounding has many applications, mainly in glaciology (Plewes and Hubbard, 2001): Determining ice thickness and mapping subglacial landscapes. Investigating the ice–bed boundary, characterising melting conditions, roughness, debris and crevasses, and identifying subglacial lakes. Investigating strong internal reflectors in the ice and firn (stratigraphy) and ice crystal orientation. In the following sections, I describe electromagnetic radiation, wave propagation, attenuation, reflection and scattering in more detail. I also report on the specific radar system and processing techniques used in this study. Electromagnetic radiation James Clerk Maxwell formulated equations for electromagnetic radiation propagation in 1864 and explained the wavelike nature of electric and magnetic fields and their symmetry. Maxwell’s equations describe the foundation for how electromagnetic waves propagate through any media. Electromagnetic radiation can be described as a wave as it travels through space (Fig. 7). Radiation has both electric and magnetic field components that oscillate in phase (i.e., the initial angle of a sinusoidal function), perpendicular to each other and perpendicular to the direction of the energy. 26 Figure 7. Propagation of electromagnetic waves in free space, with electric and magnetic field components. Maxwell’s equations can be expressed as a differential equation called the wave equation, where the electric field can be expressed as (Daniels, 2004): (1) and the magnetic field can be expressed as: (2) A plane wave propagating in the positive direction can be expressed as: (3) Electromagnetic radiation is created by the acceleration of charged particles and its fundamental characteristic is the frequency of its wave, where a shorter wavelength (distance between the crests of the waves) gives a higher frequency: (4) where is the velocity of the wave, is the frequency and is the wavelength. Frequencies used for sounding range between 1 and 1000 MHz, which are in the radio spectrum. These are the same wavelengths used in UHF/VHF radios. Radio-echo sounding mostly refers to frequencies lower than 100 MHz, whereas ground-penetrating radar (GPR) refers to frequencies higher than 100 MHz. 27 Wave propagation and attenuation Differences in the capacity of materials to polarise and hold electrical energy influence the propagation of the electromagnetic waves. In materials, there are three main polarisation mechanisms: polarisation of the molecule, stretching of the bonds between the atoms, and electronic polarisation caused by a shift of the electron cloud around the nucleus (King and Smith, 1981). As the electromagnetic wave propagates through the material, the signal strength decreases (called attenuation). Different electrical and magnetic properties of the material control the velocity and attenuation of the wave propagation through the material, as follows (Hauck and Kneisel, 2008): 28 Electrical permittivity is the ability of atoms/molecules in a material to polarise and it varies with frequency, since the different polarisation mechanisms become dominant at different frequencies of the applied field. However, electrical permittivity is constant for most geological materials and frequency ranges used in radar sounding. The relaxation frequency (i.e., the maximum absorption at atomic and electronic resonance regions) occurs at lower frequencies in ice (~103; Daniels, 2004) than what is commonly used in radar sounding. Electrical permittivity is often expressed in relation to the permittivity in vacuum, and is called the relative permittivity (or the dielectric constant). The relative permittivity of geological materials have values between 1 and 80 (Tabl. 1). Water has the highest value 80 and ice has values between 3 and 8 (polar ice between 3 and 3.15). Permittivity is primarily determined by the water content, due to the polar nature of water molecules. Water rotates easily and creates a displacement current, disturbing the velocity of the electromagnetic wave. Permittivity also shows a small pressure and temperature dependence (Plewes and Hubbard, 2001), since the thermal motion of the molecules resemble the polarisation mechanisms. Electrical conductivity is the ability of a material to let free electrical charges move within the material. Conductivity causes attenuation of the electromagnetic wave by dispersing energy in the material and is largely determined by the amount of dissolved salts present in the material. Polar ice is generally more conductive than temperate ice, since impurities often have been flushed out. Impurities in ice primarily come from sea-salt and volcanic ash deposits. Magnetic permeability is the ability of a material to magnetise (i.e., support the formation of a magnetic field). The magnetic permeability is normally assumed to be of little importance in radar sounding in ice, owing to the lack of magnetic properties of ice, and is therefore neglected for radar applications on glaciers. Typical electrical properties of common Earth surface materials are shown in Table 1. Table 1. Typical electrical properties of a variety of common Earth surface materials (Plewes and Hubbard, 2001). Material Air Fresh water Salt water Dry sand Saturated sand Silt Clay Granite Ice Relative electrical permittivity Electrical conductivity (mS m–1) 1 80 80 3–5 20–30 5–30 5–40 4–6 3–4 0 0.5 3000 0.01 0.1–1.0 1–100 2–1000 0.01–1 0.01 Velocity (108 m s–1) 3.0 0.33 0.1 1.5 0.6 0.7 0.6 1.3 1.68 Attenuation (dB m–1) 0 0.1 1000 0.01 0.03–0.3 1–100 1–300 0.01–1 0.01 Wave reflection and scattering Other sources of signal loss than the material losses occur by signal scattering, which is an umbrella term covering a variety of energy loss processes including reflecting surfaces, the wave front on entering and leaving a denser material and diffraction from irregularities. Desirable scatter (the signal) is produced by wave reflection from the target of interest in the preferred direction, while unwanted scatter is termed clutter or noise (Plewes and Hubbard, 2001). How much energy is scattered by uninteresting targets (e.g., small particles in an inhomogeneous material) depends on their size relative to the wavelength of the signal. Therefore, low frequencies (i.e., long wavelengths) are commonly used to reduce clutter from temperate ice (Watts and England, 1976). A large difference in the relative permittivity between two materials leads to less energy continuing through the interface; therefore, deeper interfaces can be more difficult to detect. Reflections may also originate from anisotropy due to fine layering or density variations of a single material, or from the creation of an interference pattern by objects on the surface (Hauck and Kneisel, 2008). The wave is reflected on the target’s surface and the two-way travel time is given by: 1 (5) where v is the wave velocity, is the distance along the profile and is the depth of the reflector. When the radar moves over reflecting points, the point will appear as hyperbolas in the radar image. After correction for transmitter 29 and receiver offset Equation 5 can be simplified to (Plewes and Hubbard, 2001): (6) Accurate determination of the velocity is essential for radar-derived measurements of ice thickness, since it defines the relationship between the twoway travel time of the recorded signal and the depth. Field measurements of electromagnetic wave velocity can be done in several ways, with logging in drill holes being a common way, because values can then be correlated with the observed density and temperature profile. Figure 8. Examples of diffractions (left) and multiples (right) (Kearey and Brooks, 1991). In addition to the reflections, there can be refractions when the wave crosses from one material to another with different density, which alters the speed and direction of the wave, but the frequency remains constant. Moreover, there can be diffractions from point reflectors (Fig. 8), and these diffractions appear as “umbrellas” in the profile, where the top of the curve is the top of the source for the diffraction. Multiples are events that have gone through more than one reflection. Strong reflections (e.g., the ice surface) can give multiples. A single multiple appears at double the time distance in relation to the primary reflection. The depth of these englacial features can be difficult to determine since these events can have gone through more than one reflection. Further details on englacial radar features and how these can be modelled are given in Paper IV. Radar system The most common radar system used is the time-domain impulse radar, which is also the system used in this study. It consists of four types of component: transmitter antennas, receiver antennas, a transmitter that generates the electromagnetic pulse and a receiver that picks up the returned pulse. The receiver detects both the direct airwave and the component of the transmitted signal that is reflected back to the surface. The receiver computer performs 30 real-time processing, stores data and has a display for checking data during measurement and for changing the surveying parameters. The radar system in this study consisted of resistively loaded halfwavelength dipole antennas of 2.5 MHz centre frequency and the system was towed behind a snowmobile (Fig. 9). The choice of antenna system determines the resolution and penetration depth of the system. Dipole antennas were used and consist of two identical wire arms with resistors along them, connected to the transmitter and receiver units. The transmitter causes electric currents to oscillate along the wire, which generates an electromagnetic field. One complete round trip of the electrons (i.e., to each end of the antenna) represents one cycle of oscillation; since electrons move at a constant speed, the frequency is determined by the length of the antenna (i.e., longer antenna equals lower frequency; Plewes and Hubbard, 2001). Resistorloaded antennas were used to prevent ringing and effects from the antenna ends. Figure 9. Schematic setup of the impulse radar sounding system, with processes involved in propagation and attenuation of the electromagnetic wave. Radar processing Compared with other geophysical methods radar sounding supplies data with high range and has a potentially high recording speed and the opportunity for real-time display of the acquired data (on a computer screen). Processing of the data, however, is needed to amplify and filter the signal and to present the geometry of the reflections more correctly. Some of the processing techniques are applied in real-time even though the original data are stored unaltered. Filtering of the data may be performed in the time domain (along a 31 trace) or in space (between neighbouring traces), which may increase the signal-to-noise ratio or remove spikes in the data. The collected radar data in this study were processed using customised tools written in Matlab/C++. Several corrections and filters were applied to the collected radar data: (1) a bandpass filter, with cut-off frequencies of 0.75 and 7 MHz, was used to remove the unwanted frequency components in the data (Yilmaz, 2001); (2) normal move-out correction was applied to correct for antenna separation; (3) rubber-band correction was used to interpolate the data and thereby obtain uniform trace spacing (Jol, 2009); and (4) twodimensional frequency wave-number migration was used to collapse hyperbolic reflectors back to their original positions in the profile direction (Stolt, 1978). The migration is applied to compensate for the effect of the radar image being systematically distorted, since the electromagnetic wave propagates as a section of a sphere with an increasing radius with depth, rather than in a straight line. A specific reflector may come from anywhere on the spherical wave front. Point reflectors are imaged from some time before or after they are directly beneath the surveying line, owing to the radiation pattern of antennas, which causes a hyperbola to appear in the image and sloping reflectors are also imaged with a sloping angle less than the real slope. Migration requires good knowledge of the subsurface velocity. If the travel velocity of the electromagnetic energy through the material is known, the recorded travel time for the wave can be converted into depth. Recorded radar soundings are commonly plotted as trace locations against the travel time of the signal, where the amplitude of the recorded signal is plotted in a greyscale (in an image called radargram). An example of a processed radar image is shown in Figure 10, where the travel signal has been converted to depth and the trace locations to distance. This image was used to pick out the bed returns semi-automatically using a cross-correlation picker (Irving et al., 2007). The ice thickness was calculated from the picked travel times of the bed return using a constant wave speed of 168 m μs−1, a commonly used assumption in glaciology because of ice being a homogeneous material (Bamber et al., 2013; Lythe et al., 2001). However, the wave speed can vary spatially to some degree depending on mainly variations of density and impurities in the ice (Navarro and Eisen, 2010). Further information on radar acquisition and uncertainties are given in Paper I. 32 Figure 10. Examples of a processed radar image of the UU data set with migrated data. Various features can be seen such as englacial features, internal layers, the bed reflector with a high subglacial peak and the surface reflector. Digital elevation models During spring 2010 and spring 2011, 1500 km of radar profiles from groundbased radar surveys were collected (Fig. 6). In addition to the collected ground-based data, two airborne data sets of subglacial elevation were used: (1) 3000 km profiles of 60 MHz radar data collected by the Technical University of Denmark (DTU) in 2003 (Christensen et al., 2000; Forsberg et al., 2001) and (2) 5500 km profiles of 194 MHz radar data collected by the NASA IceBridge project (Leuschen and Allen, 2010). The two additional data sets were provided with already picked bed returns as ice thickness and surface elevation and their geographical coordinates. Crossover analysis was made of the ice thicknesses, to estimate digitisation and positioning errors within each data set and to test the consistency between data sets. The ground-based and airborne data sets were combined after the quality check to produce digital elevation models (DEMs) of ice thickness and bed topography. The interpolation was done using universal kriging (Isaaks and Srivastava, 1989), with a bilinear drift applied to remove large-scale trends. The compiled DEMs have a 250 m resolution in the northern part of the study area, where there was high spatial density of profiles, and a 500 m resolution in the southern part, where the spacing between profiles was the largest. In Paper III, the DEM was supplemented with the mass conservation DEM of Morlighem et al. (2014; 150 m horizontal resolution) for areas with 33 low data density close to the ice margin (Fig. 6). To cover the subglacial area from ~1700 m a.s.l. up to the ice divide at ~2600 m a.s.l., the ice thickness map was merged with the 1 km gridded ice thickness map of Bamber et al. (2013). The bed elevation was calculated by subtracting the ice thickness from the Greenland Ice Mapping Project (GIMP) surface elevation model (30 m resolution; Howat et al., 2014). Further details on the methods of digital elevation models are given in Paper I to III. Spectral roughness Spectral roughness can be calculated from bed elevation measurements and is defined as the vertical variation in the subglacial interface with distance along a profile in the horizontal plane. Roughness has the advantage of being simple to calculate and offers a significant potential for understanding the evolution of glaciated landscapes (Bingham and Siegert, 2009). Spectral roughness analysis was performed on the bed data following the method of Taylor et al. (2004) by applying a fast Fourier transform algorithm on a moving window along the profiles to obtain the spectral power density : = | | (7) is the bed elevation with window length along the profile. The where single-parameter roughness index for each window is obtained by integrating the spectral power density in a specific wavelength interval: (8) is zero and where , are the limits of each interval given in Hz. When is infinity, the total roughness value for the window is obtained. Integration was carried out using the trapezoidal rule between all adjacent power density values. The roughness calculations were done along profiles, since the interpolation of a bed map would add values where no data have been taken. This makes an assessment of the roughness (i.e., wavelength-related undulation of the bed from a gridded map) problematic (Siegert et al., 2005). Further details on the basal roughness calculations are given in Paper II. Hydraulic potential analysis Hydraulic potential is a steady-state proxy for routing of subglacial water (Shreve, 1972) and is the sum of the pressure potential from the ice overburden and the elevation potential : 34 (9) is the density of ice, is the density of water, is the accelerawhere tion of gravity, is the ice thickness and is the ice surface elevation. When factor equals 1 the subglacial drainage is assumed to be completely filled with water and the pressure potential is equivalent to the ice overburden pressure. As water is denser than ice, water will accumulate under the ice and flow from high-pressure areas (high hydraulic potential) to lower pressure areas (low hydraulic potential). The hydraulic potential method assumes that the water can travel in any direction at the bed and the surface gradients are weighted approximately 10 times more than bed gradients when driving the water flow (Clarke, 2005). To calculate subglacial drainage catchments, the ArcGIS hydrology toolkit (ESRI, 2013) was used. The steepest hydraulic potential gradient was calculated from the hydraulic potential surface (Flowers and Clarke, 1999) with an eight-direction (D8) flow model (Jenson and Domingue, 1988). The flow direction was determined by the direction of steepest descent from each grid cell. Drainage basins were delineated by clustering the steepest hydraulic gradients and identifying ridge lines between basins. To connect the subglacial drainage basins to the margin a hydraulic potential surface was created with filled sinks (i.e., low points) to allow the water to flow past the sinks. Positions of subglacial sinks were calculated by differentiating the filled and unfilled hydraulic potential surface. A sensitivity analysis was also done using different values for the subglacial water pressure as a fraction of the ice overburden pressure in the calculations. Further details on the hydraulic potential analysis and subglacial catchment delineation are given in Paper III. 35 14 April 2010 17:49 radar survey Summary of Papers Paper I Lindbäck, K., Pettersson, R., Doyle, S.H., Helanow, C., Jansson, P., Savstrup Kristensen, S., Stenseng, L., Forsberg, R., Hubbard, A.L., 2014. High-resolution ice thickness and bed topography of a land-terminating section of the Greenland Ice Sheet, Earth System Science Data 6, 331– 338, doi:10.5194/essd-6-331-2014 In this paper, we collected and combined the Uppsala University groundbased radar sounding data set with airborne radar surveys from DTU and IceBridge to produce ice thickness and bed topography DEMs with high spatial resolution (250 to 500 m) of a large land-terminating section of the western Greenland Ice Sheet. The bed topography shows highly variable subglacial trough systems, resembling the landscape in the proglacial area. The troughs are over-deepened and reach an elevation of several hundred metres below sea level. The ice surface is smooth and does not reflect the bedrock topography other than in a subtle way, resulting in highly variable ice thickness. The southern parts covered in the data set consist of higher bed elevations. The bed topography becomes smoother away from the ice margin. The covered area is one of the most studied regions of the Greenland Ice Sheet with studies of mass balance, dynamics and supraglacial lakes, and our combined data set can be valuable for detailed studies of ice sheet dynamics and hydrology. The combined data set is freely available at doi:10.1594/ pangaea.830314. Paper II Lindbäck, K., Pettersson, R., 2015. Spectral roughness and glacial erosion of a land-terminating section of the Greenland Ice Sheet, Geomorphology 238, 149–159, doi:10.1016/j.geomorph.2015.02.027 In this paper, we investigated the impact of ice flow direction, ice dynamics, lithology and geological structure on the basal properties in the study area. The undulation of the bed beneath an ice mass has an important influence on its flow, and basal roughness provides insight into the role of topography on past, current and future ice sheet dynamics. Roughness shows a directional 37 dependence, where lower roughness was found in the flow-parallel direction compared with across-flow. The well-developed trough systems in the northern ice-covered study area have low roughness values and high ice surface velocities, which is consistent with a well-lubricated bed and active erosion. The southern area shows a strong correlation between roughness and topography, where high topography is associated with higher roughness values, indicating less erosion at higher elevations. The geology beneath the Greenland Ice Sheet is poorly known; this region may consist of hard granitic gneiss, also present in the proglacial study area, and could consist, at least to some extent, of glacially preserved paleosurfaces. When comparing our bed map with a geological study in the proglacial area, we found strong evidence that the subglacial troughs have a preglacial origin as they are aligned with geological weakness zones. Several geological lineaments can be traced for long distances underneath the ice sheet. The preglacial troughs have been eroded and widened by the ice sheet to different extents, depending on location. In general, there is a major geological control on the distribution of bed variability. This study has demonstrated that comparison between subglacial and proglacial roughness provides valuable insights into the dynamics and history of subglacial regions of the Greenland Ice Sheet. Paper III Lindbäck, K., Pettersson, R., Hubbard, A.L., Doyle, S.H., van As, D., Mikkelsen, A.B., Fitzpatrick, A.A., 2015. Subglacial water drainage, storage, and piracy beneath the Greenland Ice Sheet, Geophysical Research Letters, In Review. In this paper, we presented a high-resolution subglacial hydrological analysis of the land-terminating Kangerlussuaq sector of the Greenland Ice Sheet, characterizing subglacial catchments, flow networks and hydrological sinks. The presence of water beneath ice sheets has a fundamental impact on ice flow due to its role as a lubricant either between the ice and its base or between grains of subglacial sediment and hence plays a key role on the rate of dynamic mass-loss to global sea level. Meltwater drainage across the surface of the Greenland Ice Sheet is well constrained by measurements and modeling, yet despite its critical role, knowledge of its transit through the subglacial environment remains poor. Our results reveal substantial hydrological transience beneath the Greenland Ice Sheet with rapid switching of subglacial drainage between competing catchments driven by seasonal changes in basal water pressure. We caution against attempts to reconcile ice sheet runoff and discharge based on supraglacial watershed analysis alone and that water piracy between subglacial catchments should be accounted for. These findings must be considered in studies which compare estimates of surface 38 runoff from energy balance models with measurements of proglacial discharge and ice dynamics. Paper IV Lindbäck, K., Pettersson, R., Svensson, A., In Prep. Origin of englacial features in radio-echo sounding data from the Greenland Ice Sheet, Manuscript. In this paper we used radar sounding to investigate and model the characteristics of englacial features that are commonly observed in radar data from the western margin of the Greenland Ice Sheet. An understanding of the geometry and evolution of the drainage pathways of the Greenland Ice Sheet is important in assessing the effects of melt-induced dynamic response. The englacial features form vertically stacked hyperbola (VSH) patterns in the radar data. These radar features have previously been attributed to moulins or cracks intersecting internal layers. We show that the VSH patterns may equally be attributed to surface lakes, that have been frozen-over during the winter. Hence, we caution against using radar sounding to deduce moulins from VSH patterns without additional validation methods such as direct observations. 39 02 May 2012 21:16 camp Discussion Observations of the Greenland Ice Sheet suggest three main mechanisms by which climate change can affect the dynamics of the ice flow (Church et al., 2013): (1) changes in ice loss from marine-terminating outlet glaciers through calving and marine melt; (2) changes in basal sliding through the interaction of ice surface meltwater with the glacier bed; and (3) indirectly through the interaction between surface mass balance and ice flow. In the following sections, I discuss the results from the individual papers in relation to the second and third research points above relevant to this thesis, and suggest some directions for future research. The sections cover the application of high-resolution subglacial data sets, the composition of the bed, the basal thermal regime, the valley glacier analogue, subglacial water piracy and the spatial distribution of moulins. High-resolution subglacial data sets The high-resolution (250 to 500 m gridded) ice thickness and bed elevation maps described in Paper I contain enough detail for a wide range of studies and can contribute to improvements in future ice sheet modelling efforts and subglacial studies in the region. The study covers a regional area of 12 000 km2, only a small part of the total Greenland Ice Sheet. The previously best available subglacial DEM of Greenland, the Bamber et al. (2013) data set, consists of 1 km gridded maps of ice thickness and bed elevation, compiled from six data sources. The size of many outlet glaciers in Greenland is small, however, and bed elevation data with a higher resolution than 1 km are therefore required as boundary conditions for detailed modelling of ice sheet dynamics and hydrology. Recent high-resolution measurements of ice thickness have focused on mapping Greenland’s fast-flowing marine-terminating glaciers that drain the majority of the ice sheet (e.g., Plummer et al., 2008; Raney, 2009), while the typically slower, landterminating glaciers have received less attention. However, land-terminating glaciers and their catchments provide ideal study areas for investigating the response of ice sheet dynamics to atmospheric forcing, since they are isolated from marine influences such as calving and submarine melt. On a regional scale, high-resolution DEMs of the bed allow the determination of subglacial hydrological pathways and drainage basins (e.g., Wingham et al., 2006; Wright et al., 2008) and the study of the development of subglacial 41 landforms and landscapes (e.g., King et al., 2009; Siegert et al., 2005). A higher resolution bed map of a land-terminating region of the Greenland Ice Sheet is therefore timely. The data set in Paper I has so far contributed to three published studies, except the ones included in this thesis (Paper II to IV): Doyle et al. (2013) compiled detailed records of supraglacial lake discharge, ice motion and passive seismicity capturing processes before, during and after the rapid drainage of a lake through 1.1 km-thick ice. The majority of the discharge occurred through a ~3 km-long fracture that allowed rapid discharge to be achieved by combining reasonable water velocities with sub-metre fracture widths. The hydraulic potential analysis based on the data set from Paper I gave important insights on where the water travelled when it reached the bed. Bougamont et al. (2014) used a three-dimensional model to investigate hydrological controls on a potentially soft-bedded region of the Greenland Ice Sheet. The results demonstrated that weakening and strengthening of subglacial sediment, associated with the seasonal delivery of surface meltwater to the bed modulates ice flow consistent with observations. The geometry of the model was described by the subglacial topography data set from Paper I, which exerts, together with the ice surface, primary control on ice flow and the subglacial distribution and flow of water. Dow et al. (2015) developed a supraglacial lake drainage model incorporating both a subglacial radial flux element driven by elastic hydraulic jacking and downstream drainage through a linked channelised distributed system. The rapid drainage of supraglacial lakes injects substantial volumes of water to the bed of the Greenland Ice Sheet over a short time scale. The effect of these water pulses on the development of basal hydrological systems is largely unknown. The model outputs suggest that efficient subglacial channels do not readily form in the vicinity of the lake during rapid drainage. Instead, water is evacuated to the northwest primarily by a transient turbulent sheet and the distributed system. The flow direction was determined by the hydraulic potential analysis conducted on the data set from Paper I. These studies exemplify the importance of bed topography as a control on the subglacial water distribution and ice flow. Hard bedrock or soft sediments The bedrock lithology underneath the Greenland Ice Sheet is poorly known, and high-resolution DEMs from radar sounding measurements can provide geomorphological information about glacially hidden surfaces. Soft lubri42 cated sediments may play an important role in ice sheet dynamics by smoothing the basal topography, reducing basal drag and facilitating flow by sediment deformation (Bougamont et al., 2014; Boulton and Hindmarsh, 1987; Smith et al., 2013). The highly variable subglacial trough systems, resembling the landscape in the proglacial area described in Paper II, indicate a major geological control on bed variability and ice velocity. In the central and southern study area we suggest that the hard granitic gneiss in the proglacial area may extend under the ice sheet, underlain by cold ice with limited erosion, preserving high bed elevations and high basal roughness. In the northern fast-flowing area, the ice sheet is presently eroding the bed; however, the extent and degree of contemporary erosion, sediment reworking and transport under the ice sheet remain uncertain. In previous studies, it has been assumed that the ice sheet rests on hard bedrock (Bartholomew et al., 2010; Hewitt, 2013; Schoof, 2010; Shannon et al., 2013); however, recent seismic studies in the area have indicated the presence of mechanically weak, subglacial sediments close to the ice margin (Booth et al., 2012; Dow et al., 2013). Sediment layers have also been identified at other locations in the western part of the Greenland Ice Sheet (e.g., Christianson et al., 2014; Clarke and Echelmeyer, 1996; Walter et al., 2014). Studies of proglacial discharge have shown a high sediment load (Bartholomew et al., 2011b; Cowton et al., 2013; Hasholt et al., 2013), suggesting the presence of sediments or high erosion rates. In contrast, several boreholes have been drilled in the fast-flowing area (Meierbachtol et al., 2013) and no or very limited amounts of sediments were found at the bed. The generally high roughness values described in Paper II indicate that there are no widespread Quaternary deposits underneath the ice sheet in the study area, as lower roughness and smoother beds would be expected. The removal of fjord and valley sediments from each subsequent glacial cycle is characteristic of glaciogenic sedimentary basins (Storms et al., 2012). The role of sediment deformation under the Greenland Ice Sheet requires further exploration, and future field research should be undertaken to characterise the material properties of the bed. Basal thermal regime To determine the response of the Greenland Ice Sheet to the observed expansion of surface melt to higher elevations, an important question is whether the ice sheet is frozen to the bed. If the melt thaws frozen bed, the ice sheet will start to flow faster than if the bed is already at the pressure melting point. The good correspondence between roughness and ice surface velocities noted in Paper II indicates that the ice temperature distribution has been stable during the Holocene. In the interior parts of the study area, the flowparallel roughness increases, and the subglacial troughs are less pronounced. This may indicate the transition zone from a lubricated bed to dryer subgla43 cial conditions, and potentially areas with less erosion, which corresponds well with ice sheet modelling of the area indicating that very wet basal conditions are limited to ~50 km from the ice sheet margin (Joel Harper, University of Montana, personal communication, 2014). Where exactly the transition zone from wet to frozen bed is located remains uncertain, and sparsely distributed patches of cold-bedded ice with high basal drag (so called sticky spots) may exist, surrounded by a wet and temperate bed with lower shear stress (Alley, 1993). Future studies (e.g., borehole drilling above the ELA) are needed to test whether the hypothesised cryo-hydrological warming of the ice sheet (i.e., by the sensible and latent heat release of freezing meltwater) is enhancing the rates of internal deformation and the basal thermal regime (Phillips et al., 2010, 2013). The valley glacier analogue Meltwater production on the ice surface accounts for one half or more of Greenland’s mass loss, yet the efficiency of the melt transfer from the ice surface to proglacial rivers is not well constrained. The lack of extensive subglacial studies on Greenland have led several recent studies (e.g., Bartholomew et al., 2010) to argue that hydrological processes on valley glacier systems could be scaled up to serve as analogues for ice sheets. This analogue appears to hold for the ice sheet margin with late-summer slowdown caused by the development of channelised subglacial drainage (Bartholomew et al., 2012, 2010; Sole et al., 2013). Yet, direct observations of the basal hydrological system from boreholes or tracing experiments are limited to small areas in the lower ablation zone (e.g., Andrews et al., 2014; Chandler et al., 2013; Meierbachtol et al., 2013; Smeets et al., 2012). Further inland the considerable differences in geometry between valley glaciers and ice sheets become more pronounced. We demonstrate in Paper I that the ice thicknesses in the ablation area (with a maximum gridded ice depth of 1470 m and a mean value of 830 m) exceed those of valley glaciers. Hence, the basal thermal regime is likely to be significantly different (as discussed in the previous section) and creep closure rates of the subglacial drainage system are expected to be much faster (Bartholomaus et al., 2008; Chandler et al., 2013). Furthermore, the development of efficient channelized subglacial hydrology is hindered by low surface melt rates and gentle bed slopes (Dow et al., 2014; Doyle et al., 2014; Meierbachtol et al., 2013). Subglacial water piracy Accurate water drainage catchment delineation is important to be able to compare ice surface runoff and discharge to the ocean. In the study area there are large differences between ice surface and subglacial drainage delineations, as shown in Paper III. The lack of high-resolution bed topogra44 phy data has led previous comparative studies of ice surface runoff and proglacial discharge to extrapolate subglacial drainage catchments from surface DEMs (e.g., Bartholomew et al., 2011b; Chandler et al., 2013; Cowton et al., 2013; Fitzpatrick et al., 2014; Mernild and Hasholt, 2009; Mernild et al., 2010; Palmer et al., 2011; van As et al., 2012). Other studies that were based on a combination of high-resolution ice surface and low-resolution bed DEMs, have concluded that there is substantial sub- or englacial meltwater storage (Rennermalm et al., 2013; Smith et al., 2015) owing to the difference between modelled runoff and measured discharge. In Paper III, the highresolution subglacial analysis suggests a very limited subglacial storage component by the end of the summer. Moreover, remote sensed data have revealed that the extent and magnitude of accelerated flow vary considerably between adjacent outlets despite similar hypsometry and climatic control. The hydrology analysis in Paper III shows that the discrete fast-flow units by Palmer et al. (2011) and Fitzpatrick et al. (2013) correspond to the locations of subglacial valleys that channelise subglacial water flow in different directions, indicating that the subglacial hydrological regime is more complex at larger scales than a valley glacier analogue (as discussed earlier). Antarctic subglacial hydrological flow paths have been shown to be highly sensitive to changes in ice surface elevation and may also exhibit highly unstable conditions (Allison et al., 2009; Fricker et al., 2007; Wright et al., 2008) depending on the subglacial water pressure regime. In some cases, ice flow has been observed to switch on and off owing to water competition between adjacent ice flow units, a behaviour termed water piracy (Anandakrishnan and Alley, 1997; Carter et al., 2013; Vaughan et al., 2008). In Paper III, we document large-scale water piracy in Greenland, which has so far not been investigated. These findings should be considered in studies that attempt to relate estimates of surface runoff from energy balance models with measurements of proglacial discharge and ice dynamics. Distribution of moulins With a warming climate supraglacial lakes will migrate to higher elevations in the interior of the ice sheet (Leeson et al., 2014), potentially increasing the amount of meltwater reaching the bed through hydraulic fracturing. The distribution of meltwater conduits (moulins) is an important aspect of the future cryo-hydrological warming of the englacial and subglacial systems, as discussed earlier (Phillips et al., 2010, 2013). Most of these lakes in the interior, however, are unlikely to drain rapidly to the bed, since they need preexisting meltwater at the bed through neighbouring moulin systems (Stevens et al., 2015). Previous studies (Catania and Neumann, 2010; Catania et al., 2008) have attributed radar features in radar sounding data from the Greenland Ice Sheet to moulins or cracks intersecting internal layers. Only a small portion of the supraglacial lakes drain rapidly through moulins 45 (Selmes et al., 2011); therefore, this method for mapping moulins is doubtful, as is discussed in Paper IV. Further research is required into the role of moulins in delivering surface water to the ice–bed interface, including the mechanisms involved in their formation and reactivation. It remains unknown at what pressure moulins on the Greenland Ice Sheet operate and to what extent they close during the winter. Such information is important in understanding ice sheet hydrology and may provide insight into the nature of subglacial conduits. In all, future studies should be directed at furthering the understanding of basal processes and hydrological conditions in Greenland, especially under thick ice (Lüthi, 2013). Continuous or repeat radar experiments, seismic surveys and borehole instrumentation would all help reduce the number of assumptions in ice sheet models. Continued efforts targeting the hydrological system of the ice sheet should over time result in finer spatial coverage, allowing for a broader understanding of the ice sheet’s response to climate change and ultimately its contribution to global sea level rise. 46 Conclusions In this thesis, I have collected ground-based radar sounding data and compiled them with various sources of airborne radar surveys to produce a highresolution ice thickness and bed topography DEM of a land-terminating section of the Greenland Ice Sheet. Furthermore, I have characterised subglacial water catchments, flow networks and hydrological sinks for the area. My four main conclusions drawn from these data are as follows: The bed topography shows highly variable subglacial trough systems, indicating a major geological control on bed variability and ice flow. Attempts to reconcile modelled ice sheet runoff and measured discharge based on supraglacial watershed analysis alone are not recommended and water piracy between subglacial catchments should be accounted for. Englacial radar features may originate from moulins, as suggested in previous studies, but may also arise from supraglacial water bodies, indicating that moulins are not as common as previously assumed. In all, the thesis highlights the need not only for accurate highresolution subglacial DEMs, but also for regionally optimised interpolation when conducting detailed hydrological studies of the Greenland Ice Sheet. 47 16 April 2011 16:43 land of the musk ox Acknowledgments First of all, I would like to thank my supervisor, Rickard Pettersson, for all the encouragement and help whenever I needed it. I can’t possibly imagine a better supervisor, so intelligent, pedagogic, patient and kind. I would also like to thank my assistant supervisor and head of the department, Veijo Pohjola, for always taking valuable time to talk to and support every single person in our working group. I would like to thank all my co-workers at Uppsala University for the warm atmosphere, especially in the Ice and Climate group: Carmen, Dorothée, Sergey, Anna, Christian and Thomas. Heaps of thanks to my roommates Eva and Andreas, who made me feel less lonely at the office, I will miss you! I will also read much fewer books now that I am not part of the PhD student book club meetings anymore, so thanks to Anna, Johan, Olof and Petra for sharing so many bad novel experiences with me. Finally, I would like to thank all my co-workers in the GAP project, organising meetings (Lillemor and Anne) and helping out collecting the data on the Greenland Ice Sheet, sometimes in harsh and cold conditions, with up to ten hours sitting on a radar sledge in the middle of nowhere. Special thanks to my co-PhD students: Christian and Heidi for sharing tents and ˮtherapyˮ talks, and Sam for always being helpful and such an expert in English writing. I would also like to thank all the wonderful glaciologist i met through the SVALI project. Loads of thanks to all my outdoorsy friends for the challenges. Learning by doing it all wrong, as Bergur would have phrased it. Some dried olives will help me get through the day, thanks to Bea. Special thanks to Emma, Johanna and Bobo for making my conference trips into climbing adventures. Hanna for mental support the final months and Jonas for ideas on the layout. Last but not least, I would like to thank my family Lena, Björn and Anders for all the love and exploration throughout my life. Taking me to my first glacier in Yukon 1992 apparently made a long-lasting impression. Tack till Jenny, Elsa och Märta för alla roliga stunder som vi har delat, jobbet är inte allt! 49 My PhD thesis was partly funded by the Greenland Analogue Project (GAP), funded by the nuclear waste management organisations in Sweden, Finland and Canada. Support for fieldwork and travel funds were also given from the Nordic Centre of Excellence SVALI, the Swedish Society for Anthropology and Geography (SSAG), the Geographical Society of Uppsala, Helge Ax:son Johnson foundation, Wallenberg foundation, Heino and Sigrid Jänes foundation and C F Liljevalch foundation. 18 April 2011 09:27 landed on the ice sheet Sammanfattning på svenska Summary in Swedish Grönlands inlandsis hydrologi och bottentopografi De ökade temperaturerna i Arktis påskyndar förlusten av landbaserad is lagrad i glaciärer och permafrost. Grönlands inlandsis är den största ismassan på norra halvklotet och lagrar cirka 10% av allt sötvatten på jorden, vilket motsvarar cirka 7 meter global havsnivåhöjning. För ett par decennier sedan var inlandsisens massbalans dåligt känd och antogs ha liten inverkan på havsnivåhöjningen. Tidsskalan för förändringar av inlandsisars egenskaper, till exempel förändringar i snöackumulation, istemperatur och isrörelse, ansågs vara hundratals eller tusentals år. Utvecklingen av regionala klimatmodeller och satellitbaserad fjärranalys av Grönlands inlandsis har under det senaste decenniet påvisat en betydande massförlust. Massförlusten har en potential att översvämma de tätbefolkade kustområdena på jorden med stora samhällsekonomiska effekter. Den nuvarande genomsnittliga globala höjningen av havsnivån sedan 1993 har varit 3,2 ± 0,4 mm/år. Huvuddelen av den stigande havsnivån har hittills orsakats av expansion av havsvatten vid ökade temperaturer och smältning av dalglaciärer. Förlusten av ismassa från Grönlands inlandsis har dock ökat under de senaste 20 åren. Den genomsnittliga massförändringen har ökat från –121 gigaton/år under perioden 1993 till 2002 (motsvarande en havsnivåhöjning på 0,3 mm/år) till –229 gigaton/år under perioden 2005 till 2010 (motsvarande en havsnivåhöjning på 0,6 mm/år). Massförlusten från Grönlands inlandsis förväntas därför bli en av de dominerande bidragsgivarna till havsnivåhöjningen under 2000talet. För att förutse vilken inverkan inlandsisen har på framtida havsnivåhöjningar krävs en förståelse för de fysikaliska processerna som styr dess massbalans och isrörelse. I de sydöstra och centrala västra delarna av inlandsisen domineras massförlusten av dynamiska processer i isströmmar. Isströmmar kanaliserar isens flöde och rör sig hundratals eller ibland tusentals gånger snabbare än inlandsisens genomsnittliga isflöde. Isströmmar slutar i utlöparglaciärer eller flytande shelfisar, där isberg bryts loss (kalvar) ut i havet. Det snabba isflödet i dessa isströmmar är ofta kopplat till hydrologin i och under isen, då smältvattnet fungerar som smörjmedel för isens rörelse. Massförlusten i de centrala norra, sydvästra och nordöstra delarna domineras av isytans av51 smältning som styrs av interaktionen med atmosfären. Isdynamik kan dock spela en viktig roll även i dessa områden där isytans massbalans är den dominerande processen som styr massförlusten. En ökad isrörelse kan leda till ytnivåförändringar som i sin tur leder till ökad smältning på grund av högre temperaturer på lägre höjd, en process som kallas dynamisk uttunning. Hur väl det hydrologiska systemet är utvecklat under isen avgör smältvattnets påverkan på isrörelsen, men än idag är ytterst lite känt om hur det hydrologiska systemet ser ut. I stora delar av västra Grönland samlas vatten på isytan i vattendrag och så kallade supraglaciala sjöar. Vattendragen ger en stadig tillförsel av stora mängder smältvatten till glaciärbrunnar. På grund av fortplantning av hydrauliska sprickor från botten av de supraglaciala sjöarna ner i isen kan smältvatten tränga igenom mer än 1000 meter is och bilda brunnar som förbinder isytan med botten. När smältvattnet når botten av isen minskar den isens friktion vilket gör att ismassan lyfts och glider snabbare mot underlaget. Denna hydrologiska koppling mellan ytan och botten orsakar isflödesvariationer men endast under kort tid och med en liten rumslig utbredning. Studier har visat att inlandsisens hydrologiska system kan anpassa sig snabbt till större mängder av smältvatten genom att bilda effektiva subglaciala kanaler med lågt tryck, vilket resulterar i ett mer eller mindre konstant årligt isflöde. Men dessa studier gjordes nära iskanten och det är fortfarande tveksamt om lågtryckskanaler kan finnas i den inre djupare delarna av inlandsisen under kilometertjock is, med höga tryckförhållanden och låg lutning på botten och isytan som kan driva vattnet nedströms. I denna doktorsavhandling har jag använt markbaserade radarmätningar för att kartlägga den subglaciala topografin för en del av den västra landbaserade inlandsisen. Denna kunskap är en viktig förutsättning för att kunna modellera den subglaciala hydrologin. För det första har jag analyserat de geologiska och glaciologiska förhållandena i regionen genom att jämföra spektralanalys av topografins ojämnheter framför och under isen. För det andra har jag kartlagt de subglaciala avrinningsområdena. Slutligen har jag tittat mer i detalj på strukturer i isen som har observeras i radardata. De tre viktigaste slutsatserna från avhandlingen är: (1) Bottentopografin visar en stor variation av subglaciala dalsystem, vilket indikerar en betydande geologisk kontroll på bottenvariationen och isflödet. (2) Försök att jämföra modellerad avrinnig från avrinningsområden på isytan med uppmätta flödesvärden i älvarna framför isen medför stora osäkerheter och de subglaciala avrinningsområdena kan ändras beroende på vattentryckförhållandena på botten. (3) Radarreflektioner i isen kan komma från glaciärbrunnar, men kan likväl komma från sjöar på isytan vilket indikerar att glaciärbrunnar inte är så vanligt förekommande som tidigare studier antagit. Sammanfattningsvis, belyser avhandlingen behovet av inte bara noggranna rumsligt högupplösta subglaciala digitala höjdmodeller, utan även regionalt optimerad interpolering när detaljerade hydrologiska studier ska utföras på Grönlands inlandsis. 52 References Alley, R.B., Whillans, I.M., 1984. Response of the East Antarctica Ice Sheet to Sea-Level Rise. J. Geophys. Res. 89, 6487–6493. Alley, R.B., 1993. In search of ice-stream sticky spots. J. Glaciol. 39, 447–454. Alley, R.B., Dupont, T.K., Parizek, B.R., Anandakrishnan, S., 2005. Access of surface meltwater to beds of sub-freezing glaciers: preliminary insights. Ann. Glaciol. 40, 8– 14. Allison, I., Alley, R.B., Fricker, H.A., Thomas, R.H., Warner, R.C., 2009. Ice sheet mass balance and sea level. Antarct. Sci. 21, 413. Anandakrishnan, S., Alley, R.B., 1997. Stagnation of Ice Stream C, West Antarctica by water piracy. Geophys. Res. Lett. 24, 265. Andrews, L., Catania, G., Hoffman, M., Gulley, J., Lüthi, M., Ryser, C., Hawley, R.L., Neumann, T.A., 2014. Direct observations of evolving subglacial drainage beneath the Greenland Ice Sheet. Nature 514. Arrhenius, S., 1896. On the influence of carbonic acid in the air upon the temperature of the Earth. Publ. Astron. Soc. Pacific 9, 14. Bamber, J.L., Griggs, J.A., Hurkmans, R.T.W.L., Dowdeswell, J.A., Gogineni, S.P., Howat, I., Mouginot, J., Paden, J., Palmer, S., Rignot, E., Steinhage, D., 2013. A new bed elevation dataset for Greenland. Cryosph. 7, 499–510. Bartholomaus, T.C., Anderson, R.S., Anderson, S.P., 2008. Response of glacier basal motion to transient water storage. Nat. Geosci. 1, 33–37. Bartholomew, I., Nienow, P., Mair, D., Hubbard, A., King, M.A., Sole, A., 2010. Seasonal evolution of subglacial drainage and acceleration in a Greenland outlet glacier. Nat. Geosci. 3, 408–411. Bartholomew, I., Nienow, P., Sole, A., Mair, D., Cowton, T., King, M.A., Palmer, S., 2011a. Seasonal variations in Greenland Ice Sheet motion: Inland extent and behaviour at higher elevations. Earth Planet. Sci. Lett. 307, 271–278. Bartholomew, I., Nienow, P., Sole, A., Mair, D., Cowton, T., Palmer, S., Wadham, J., 2011b. Supraglacial forcing of subglacial drainage in the ablation zone of the Greenland ice sheet. Geophys. Res. Lett. 38, 1–5. Bartholomew, I., Nienow, P., Sole, A., Mair, D., Cowton, T., King, M.A., 2012. Short-term variability in Greenland Ice Sheet motion forced by time-varying meltwater drainage: Implications for the relationship between subglacial drainage system behavior and ice velocity. Geophys. Res. Lett. 117, 1–17. Benn, D.I., Evans, D.J.A., 2014. Glaciers and Glaciation. Routledge. Bingham, R.G., Siegert, M.J., 2009. Quantifying subglacial bed roughness in Antarctica: implications for ice-sheet dynamics and history. Quat. Sci. Rev. 28, 223–236. Booth, A.D., Clark, R.A., Kulessa, B., Murray, T., Carter, J., Doyle, S., Hubbard, A., 2012. Thin-layer effects in glaciological seismic amplitude-versus-angle (AVA) analysis: implications for characterising a subglacial till unit, Russell Glacier, West Greenland. Cryosph. 6, 909–922. Bougamont, M., Christoffersen, P., Hubbard, A.L., Fitzpatrick, A.A., Doyle, S.H., Carter, S.P., 2014. Sensitive response of the Greenland Ice Sheet to surface melt drainage over a soft bed. Nat. Commun. 5, 5052. Boulton, G.S., Hindmarsh, R.C.A., 1987. Sediment deformation beneath glaciers: Rheology and geological consequences. J. Geophys. Res. 92, 9059–9082. 53 Box, J.E., Fettweis, X., Stroeve, J.C., Tedesco, M., Hall, D.K., Steffen, K., 2012. Greenland ice sheet albedo feedback: thermodynamics and atmospheric drivers. Cryosph. 6, 821– 839. Carter, S.P., Fricker, H.A., Siegfried, M.R., 2013. Evidence of rapid subglacial water piracy under Whillans Ice Stream, West Antarctica. J. Glaciol. 59, 1147–1162. Catania, G.A., Neumann, T.A., Price, S.F., 2008. Characterizing englacial drainage in the ablation zone of the Greenland ice sheet. J. Glaciol. 54, 567–578. Catania, G.A., Neumann, T.A., 2010. Persistent englacial drainage features in the Greenland Ice Sheet. Geophys. Res. Lett. 37, L02501. Chandler, D.M., Wadham, J.L., Lis, G.P., Cowton, T., Sole, A., Bartholomew, I., Telling, J., Nienow, P., Bagshaw, E.B., Mair, D., Vinen, S., Hubbard, A., 2013. Evolution of the subglacial drainage system beneath the Greenland Ice Sheet revealed by tracers. Nat. Geosci. 6, 195–198. Christensen, E.L., Reeh, N., Forsberg, R., Jørgensen, J.H., Skou, N., Woelders, K., 2000. Instruments and Methods A low-cost glacier-mapping system. J. Glaciol. 46, 531–537. Christianson, K., Peters, L.E., Alley, R.B., Anandakrishnan, S., Jacobel, R.W., Riverman, K.L., Muto, A., Keisling, B.A., 2014. Dilatant till facilitates ice-stream flow in northeast Greenland. Earth Planet. Sci. Lett. 401, 57–69. Church, J.A., Clark, P.U., Cazenave, A., Gregory, J.M., Jevrejeva, S., Levermann, A., Merrifield, M.A., Milne, G.A., Nerem, R.., Nunn, P.D., Payne, A.J., Pfeffer, W.T., Stammer, D., Unnikrishnan, A.S., 2013. Sea level change, In: Stocker, T.F., Qin, D., Plattner, G.-K., Tignor, M. , Allen, S.K., Boschung, J., Nauels, A., Xia, Y., Bex, V., Midgley, P.M. (Eds.), Climate Change 2013: The Physical Science Basis. Contribution of Working Group I to the Fifth Assessment Report of the Intergovernmental Panel on Climate Change. Cambridge University Press, Cambridge, United Kingdom and New York, NY, USA, pp. 1137–1216. Clarke, T.S., Echelmeyer, K., 1996. Seismic-reflection evidence for a deep subglacial trough beneath Jakobshavns Isbræ, West Greenland. J. Glaciol. 43, 219–232. Clarke, G.K.C., 2005. Subglacial Processes. Annu. Rev. Earth Planet. Sci. 33, 247–276. Cowton, T., Nienow, P., Sole, A., Wadham, J., Lis, G., Bartholomew, I., Mair, D., Chandler, D., 2013. Evolution of drainage system morphology at a land-terminating Greenlandic outlet glacier. J. Geophys. Res. Earth Surf. 118, 29–41. Cuffey, K.M., Paterson, W.S.B., 2010. The Physics of Glaciers, Fourth edition. Academic Press, Hardbound. Daniels, J.D., 2004. Ground Penetrating Radar. The Institution of Engineering and Technology, London. Das, S.B., Joughin, I., Behn, M.D., Howat, I.M., King, M.A., Lizarralde, D., Bhatia, M.P., 2008. Fracture propagation to the base of the Greenland Ice Sheet during supraglacial lake drainage. Science 320, 778–81. Domingues, C.M., Church, J.A., White, N.J., Gleckler, P.J., Wijffels, S.E., Barker, P.M., Dunn, J.R., 2008. Improved estimates of upper-ocean warming and multi-decadal sealevel rise. Nature 453, 1090–3. Dow, C.F., Hubbard, A., Booth, A.D., Doyle, S.H., Gusmeroli, A., 2013. Seismic evidence of mechanically-weak sediments underlying Russell Glacier, West Greenland. Ann. Glaciol. 54, 135–141. Dow, C.F., Kulessa, B., Rutt, I.C., Doyle, S.H., Hubbard, A., 2014. Upper bounds on subglacial channel development for interior regions of the Greenland ice sheet. J. Glaciol. 60, 1044–1052. Dow, C.F., Kulessa, B., Rutt, I.C., Tsai, V.C., Pimentel, S., Doyle, S.H., van As, D., Lindbäck, K., Pettersson, R., Jones, G.A., Hubbard, A., 2015. Modeling of subglacial hydrological development following rapid supraglacial lake drainage. J. Geophys. Res. Earth Surf. 120, 1127–1147. Dowdeswell, J.A., Evans, S., 2004. Investigations of the form and flow of ice sheets and glaciers using radio-echo sounding. Reports Prog. Phys. 67, 1821–1861. 54 Doyle, S.H., Hubbard, A.L., Dow, C.F., Jones, G.A., Fitzpatrick, A., Gusmeroli, A., Kulessa, B., Lindback, K., Pettersson, R., Box, J.E., 2013. Ice tectonic deformation during the rapid in situ drainage of a supraglacial lake on the Greenland Ice Sheet. Cryosph. 7, 129–140. Doyle, S.H., Hubbard, A., Fitzpatrick, A.A.W., van As, D., Mikkelsen, A.B., Pettersson, R., Hubbard, B., 2014. Persistent flow acceleration within the interior of the Greenland Ice Sheet. Geophys. Res. Lett. 41, 899–905. Enderlin, E.M., Howat, I.M., Jeong, Myoung-Jong, Angelen, V., van den Broeke, M.R., 2014. An Improved Mass Budget for the Greenland Ice Sheet. Geophys. Res. Lett. 41, 1–7. ESRI, 2013. ArcMap Release 10.2., Environmental Systems Research Institute, Redlands, California. Ettema, J., van den Broeke, M.R., van Meijgaard, E., van de Berg, W.J., Bamber, J.L., Box, J.E., Bales, R.C., 2009. Higher surface mass balance of the Greenland ice sheet revealed by high-resolution climate modeling. Geophys. Res. Lett. 36, L12501. Fairbanks, R.G., 1989. A 17,000-year glacio-eustatic sea level record; influence of glacial melting rates on the Younger Dryas event and deep-ocean circulation. Nature 342, 637–642. Fettweis, X., Franco, B., Tedesco, M., van Angelen, J.H., Lenaerts, J.T.M., van den Broeke, M.R., Gallée, H., 2013. Estimating Greenland ice sheet surface mass balance contribution to future sea level rise using the regional atmospheric climate model MAR. Cryosph. 7, 469–489. Fitzpatrick, A.A.W., Hubbard, A., Joughin, I., Quincey, D.J., van As, D., Mikkelsen, A.P.B., Doyle, S.H., Hasholt, B., Jones, G.A., 2013. Ice flow dynamics and surface meltwater flux at a land-terminating sector of the Greenland ice sheet. J. Glaciol. 59, 687–696. Fitzpatrick, A.A.W., Hubbard, A.L., Box, J.E., Quincey, D.J., van As, D., Mikkelsen, A.P.B., Doyle, S.H., Dow, C.F., Hasholt, B., Jones, G.A., 2014. A decade (2002–2012) of supraglacial lake volume estimates across Russell Glacier, West Greenland. Cryosph. 8, 107–121. Flowers, G.E., Clarke, G.K.C., 1999. Surface and bed topography of Trapridge Glacier, Yukon Territory, Canada: digital elevation models and derived hydraulic geometry. J. Glaciol. 45, 165–174. Forsberg, R., Keller, K., Jacobsen, S.M., 2001. Laser monitoring of ice elevations and sea-ice thickness in Greenland. Int. Arch. Photogramm. Remote Sens. XXXIV, 163–168. Fricker, H.A., Scambos, T., Bindschadler, R., Padman, L., 2007. An active subglacial water system in West Antarctica mapped from space. Science 315, 1544–1548. Garde, A.A., Hollis, J.A., 2010. A buried Palaeoproterozoic spreading ridge in the northern Nagssugtoqidian orogen, West Greenland. Geol. Soc. London, Spec. Publ. 338, 213– 234. Gardner, A.S., Moholdt, G., Cogley, J.G., Wouters, B., Arendt, A.A., Wahr, J., Berthier, E., Hock, R., Pfeffer, W.T., Kaser, G., Ligtenberg, S.R.M., Bolch, T., Sharp, M.J., Hagen, J.O., van den Broeke, M.R., Paul, F., 2013. A reconciled estimate of glacier contributions to sea level rise: 2003 to 2009. Science 340, 852–7. Gillet-Chaulet, F., Gagliardini, O., Seddik, H., Nodet, M., Durand, G., Ritz, C., Zwinger, T., Greve, R., Vaughan, D.G., 2012. Greenland ice sheet contribution to sea-level rise from a new-generation ice-sheet model. Cryosph. 6, 1561–1576. Goelzer, H., Huybrechts, P., Fürst, J.J., Nick, F.M., Andersen, M.L., Edwards, T.L., Fettweis, X., Payne, A.J., Shannon, S., 2013. Sensitivity of Greenland ice sheet projections to model formulations. J. Glaciol. 59, 733–749. Hallet, B., 1979. Subglacial regelation water film. J. Glaciol. 23, 321–334. Hanna, E., Navarro, F.J., Pattyn, F., Domingues, C.M., Fettweis, X., Ivins, E.R., Nicholls, R.J., Ritz, C., Smith, B., Tulaczyk, S., Whitehouse, P.L., Zwally, H.J., 2013. Ice-sheet mass balance and climate change. Nature 498, 51–9. Hasholt, B., Bech Mikkelsen, A., Holtegaard Nielsen, M., Andreas Dahl Larsen, M., 2013. Observations of Runoff and Sediment and Dissolved Loads from the Greenland Ice 55 Sheet at Kangerlussuaq, West Greenland, 2007 to 2010. Zeitschrift für Geomorphol. Suppl. Issues 57, 3–27. Hauck, C., Kneisel, C., 2008. Applied Geophysics in Periglacial Environments. University Press, Cambridge. Hewitt, I.J., 2013. Seasonal changes in ice sheet motion due to melt water lubrication. Earth Planet. Sci. Lett. 371-372, 16–25. Holmlund, P., 1988. Internal geometry and evolution of moulins, Storglaciären, Sweden. J. Glaciol. 34, 242–248. Howat, I.M., Negrete, A., Smith, B.E., 2014. The Greenland Ice Mapping Project (GIMP) land classification and surface elevation data sets. Cryosph. 8, 1509–1518. Hubbard, B.P., Sharp, M.J., Willis, I.C., Nielsen, M.K., Smart, C.C., 1995. Borehole waterlevel variations and the structure of the subglacial hydrological system of Haut Glacier d’Arolla, Valais, Switzerland. J. Glaciol. 41, 572–583. Irving, J.D., Knoll, M.D., Knight, R.J., 2007. Improving crosshole radar velocity tomograms: A new approach to incorporating high-angle traveltime data. Geophysics 72, 31–41. Isaaks, E., Srivastava, M., 1989. An Introduction to Applied Geostatistics. Oxford University Press, New York. Jenson, S.K., Domingue, J.O., 1988. Extracting Topographic Structure from Digital Elevation Data for Geographic Information System Analysis. Photogramm. Eng. Remote Sensing 54, 1593–1600. Jol, H.M., 2009. Ground Penetrating Radar: Theory and Applications. Elsevier Science, Amsterdam. Joughin, I., Smith, B.E., Howat, I.M., Scambos, T., Moon, T., 2010. Greenland flow variability from ice-sheet-wide velocity mapping. J. Glaciol. 56, 415–430. Joughin, I., Das, S.B., Flowers, G.E., Behn, M.D., Alley, R.B., King, M.A., Smith, B.E., Bamber, J.L., 2013. Influence of ice-sheet geometry and supraglacial lakes on seasonal ice-flow variability. Cryosph. 7, 1185–1192. Kamb, B., 1987. Glacier surge mechanism based on linked cavity configuration of the basal water conduit system. J. Geophys. Res. 92, 9083–9100. Kearey, P., Brooks, M., 1991. An Introduction to Geophysical Exploration. Blackwell Scientific Publications, Oxford. King, E.C., Hindmarsh, R.C.A., Stokes, C.R., 2009. Formation of mega-scale glacial lineations observed beneath a West Antarctic ice stream. Nat. Geosci. 2, 585–588. King, R.W.P., Smith, G.S., 1981. Antennas in Matter: Fundamentals, Theory, and Applications. The MIT Press, Cambridge, Massachusetts. Leeson, A., Shepherd, A., Briggs, K., Fettweis, X., 2014. Supraglacial lakes on Greenland migrate inland under warming climate. Nat. Clim. Chang. 5, 51–55. Leuschen, C., Allen, C., 2010. IceBridge MCoRDS L2 Ice Thickness, 2010-2012 [WWW Document]. Boulder, Color. USA NASA DAAC Natl. Snow Ice Data Cent. URL http://nsidc.org/data/irmcr2 Liang, Y.-L., Colgan, W., Lv, Q., Steffen, K., Abdalati, W., Stroeve, J., Gallaher, D., Bayou, N., 2012. A decadal investigation of supraglacial lakes in West Greenland using a fully automatic detection and tracking algorithm. Remote Sens. Environ. 123, 127–138. Lythe, M.B., Vaughan, D.G., The BEDMAP Consortium, 2001. BEDMAP: A new ice thickness and subglacial topographic model of Antarctica. J. Geophys. Res. 106, 11,335–11,351. Lüthi, M., 2013. Geophysics. Gauging Greenland’s subglacial water. Science 341, 721–2. Meese, D.A., Gow, A.J., Alley, R.B., Zielinski, G.A., Grootes, P.M., Ram, M., Taylor, K.C., Mayewski, P.A., Bolzan, J.F., 1997. The Greenland Ice Sheet Project 2 depth-age scale: Methods and results. J. Geophys. Res. 102, 26411–26423. Meierbachtol, T., Harper, J., Humphrey, N., 2013. Basal drainage system response to increasing surface melt on the Greenland ice sheet. Science 341, 777–9. Mernild, S.H., Hasholt, B., 2009. Observed runoff, jökulhlaups and suspended sediment load from the Greenland ice sheet at Kangerlussuaq, West Greenland, 2007 and 2008. J. Glaciol. 55, 855–858. 56 Mernild, S.H., Liston, G.E., Steffen, K., van den Broeke, M., Hasholt, B., 2010. Runoff and mass-balance simulations from the Greenland Ice Sheet at Kangerlussuaq (Søndre Strømfjord) in a 30-year perspective, 1979–2008. Cryosph. 4, 231–242. Morlighem, M., Rignot, E., Mouginot, J., Seroussi, H., Larour, E., 2014. Deeply incised submarine glacial valleys beneath the Greenland ice sheet. Nat. Geosci. 7, 418–22. Navarro, F.J., Eisen, O., 2010. Ground penetrating radar. In: Pellikka, P. and Rees,W.G. (Eds.), Remote Sensing of Glaciers – Techniques for Topographic, Spatial and Thematic Mapping. Taylor & Francis group, London, pp. 195–229. NEEM community members, 2013. Eemian interglacial reconstructed from a Greenland folded ice core. Nature 493, 489–94. Nghiem, S. V., Hall, D.K., Mote, T.L., Tedesco, M., Albert, M.R., Keegan, K., Shuman, C.A., DiGirolamo, N.E., Neumann, G., 2012. The extreme melt across the Greenland ice sheet in 2012. Geophys. Res. Lett. 39, L20502. Nicholls, R.J., Cazenave, A., 2010. Sea-level rise and its impact on coastal zones. Science 328, 1517–20. Nye, J.F., 1976. Water flow in glaciers: jokulhlaups, tunnels and veins. J. Glaciol. 17, 181– 207. Palmer, S., Shepherd, A., Nienow, P., Joughin, I., 2011. Seasonal speedup of the Greenland Ice Sheet linked to routing of surface water. Earth Planet. Sci. Lett. 302, 423–428. Phillips, T., Rajaram, H., Steffen, K., 2010. Cryo-hydrologic warming: A potential mechanism for rapid thermal response of ice sheets. Geophys. Res. Lett. 37, 1–5. Phillips, T., Leyk, S., Rajaram, H., Colgan, W., Abdalati, W., McGrath, D., Steffen, K., 2011. Modeling moulin distribution on Sermeq Avannarleq glacier using ASTER and WorldView imagery and fuzzy set theory. Remote Sens. Environ. 115, 2292–2301. Phillips, T., Rajaram, H., Colgan, W., Steffen, K., Abdalati, W., 2013. Evaluation of cryohydrologic warming as an explanation for increased ice velocities in the wet snow zone, Sermeq Avannarleq, West Greenland. J. Geophys. Res. Earth Surf. 118, 1241– 1256. Plewes, L.A., Hubbard, B., 2001. A review of the use of radio-echo sounding in glaciology. Prog. Phys. Geogr. 25, 203–236. Plummer, J., Gogineni, S., van der Veen, C., Leuschen, C., Li, J., 2008. Ice thickness and bed map for Jakobshavn Isbræ. CReSIS Tech. Rep. 2008–1. Pritchard, H.D., Arthern, R.J., Vaughan, D.G., Edwards, L.A., 2009. Extensive dynamic thinning on the margins of the Greenland and Antarctic ice sheets. Nature 461, 971–5. Raney, K., 2009. IceBridge PARIS L2 Ice Thickness , 2009, Boulder, Colorado USA [WWW Document]. NASA Distrib. Act. Arch. Cent. Natl. Snow Ice Data Center, Digit. media. URL http://nsidc.org/ data/irpar2.html Rennermalm, A.K., Smith, L.C., Chu, V.W., Box, J.E., Forster, R.R., van den Broeke, M.R., van As, D., Moustafa, S.E., 2013. Evidence of meltwater retention within the Greenland ice sheet. Cryosph. 7, 1433–1445. Rignot, E., Velicogna, I., van den Broeke, M.R., Monaghan, A., Lenaerts, J.T.M., 2011. Acceleration of the contribution of the Greenland and Antarctic ice sheets to sea level rise. Geophys. Res. Lett. 38, 1–5. Rignot, E., Mouginot, J., 2012. Ice flow in Greenland for the International Polar Year 2008– 2009. Geophys. Res. Lett. 39, 1–7. Robinson, A., Calov, R., Ganopolski, A., 2012. Multistability and critical thresholds of the Greenland ice sheet. Nat. Clim. Chang. 2, 429–432. Röthlisberger, H., 1972. Water pressure in intra- and subglacial channels. J. Glaciol. 11, 177– 203. Sasgen, I., van den Broeke, M., Bamber, J.L., Rignot, E., Sørensen, L.S., Wouters, B., Martinec, Z., Velicogna, I., Simonsen, S.B., 2012. Timing and origin of recent regional ice-mass loss in Greenland. Earth Planet. Sci. Lett. 333-334, 293–303. Schoof, C., 2010. Ice-sheet acceleration driven by melt supply variability. Nature 468, 803– 806. 57 Selmes, N., Murray, T., James, T.D., 2011. Fast draining lakes on the Greenland Ice Sheet. Geophys. Res. Lett. 38. Serreze, M.C., Barry, R.G., 2011. Processes and impacts of Arctic amplification: A research synthesis. Glob. Planet. Change 77, 85–96. Shannon, S.R., Payne, A.J., Bartholomew, I.D., van den Broeke, M.R., Edwards, T.L., Fettweis, X., Gagliardini, O., Gillet-Chaulet, F., Goelzer, H., Hoffman, M.J., Huybrechts, P., Mair, D.W.F., Nienow, P.W., Perego, M., Price, S.F., Smeets, C.J.P.P., Sole, A.J., van de Wal, R.S.W., Zwinger, T., 2013. Enhanced basal lubrication and the contribution of the Greenland ice sheet to future sea-level rise. Proc. Natl. Acad. Sci. U.S.A. 110, 14156–61. Shepherd, A., Hubbard, A., Nienow, P., King, M., McMillan, M., Joughin, I., 2009. Greenland ice sheet motion coupled with daily melting in late summer. Geophys. Res. Lett. 36, L01501. Shreve, R.L., 1972. Movement of water in glaciers. J. Glaciol. 11, 205–214. Siegert, M.J., 1999. On the origin, nature and uses of Antarctic ice-sheet radio-echo layering. Prog. Phys. Geogr. 23, 159–179. Siegert, M.J., Taylor, J., Payne, A.J., 2005. Spectral roughness of subglacial topography and implications for former ice-sheet dynamics in East Antarctica. Glob. Planet. Change 45, 249–263. Smeets, C.J.P.P., Boot, W., Hubbard, A., Pettersson, R., Wilhelms, F., van den Broeke, M.R., van de Wal, R., 2012. Instruments and Methods A wireless subglacial probe for deep ice applications. J. Glaciol. 58, 841–848. Smith, A.M., Jordan, T.A., Ferraccioli, F., Bingham, R.G., 2013. Influence of subglacial conditions on ice stream dynamics: Seismic and potential field data from Pine Island Glacier, West Antarctica. J. Geophys. Res. Solid Earth 118, 1471–1482. Smith, L.C., Chu, V.W., Yang, K., Gleason, C.J., Pitcher, L.H., Rennermalm, A.K., Legleiter, C.J., Behar, A.E., Overstreet, B.T., Moustafa, S.E., Tedesco, M., Forster, R.R., LeWinter, A.L., C., F.D., Sheng, Y., Balog, J., 2015. Efficient meltwater drainage through supraglacial streams and rivers on the southwest Greenland ice sheet. Proc. Natl. Acad. Sci. U. S. A. 112, 1001–1006. Sole, A., Nienow, P., Bartholomew, I., Mair, D., Cowton, T., Tedstone, A., King, M.A., 2013. Winter motion mediates dynamic response of the Greenland Ice Sheet to warmer summers. Geophys. Res. Lett. 40, 3940–3944. Steffen, K., Box, J., 2001. Surface climatology of the Greenland ice sheet: Greenland Climate Network 1995–1999. J. Geophys. Res. 106, 33951–64. Stevens, L.A., Behn, M.D., McGuire, J.J., Das, S.B., Joughin, I., Herring, T., Shean, D.E., King, M.A., 2015. Greenland supraglacial lake drainages triggered by hydrologically induced basal slip. Nature 522, 73–76. Stolt, R.H., 1978. Migration by Fourier Transform. Geophysics 43, 23–48. Storms, J.E.A., de Winter, I.L., Overeem, I., Drijkoningen, G.G., Lykke-Andersen, H., 2012. The Holocene sedimentary history of the Kangerlussuaq Fjord-valley fill, West Greenland. Quat. Sci. Rev. 35, 29–50. Sundal, A. V., Shepherd, A., Nienow, P., Hanna, E., Palmer, S., Huybrechts, P., 2009. Evolution of supra-glacial lakes across the Greenland Ice Sheet. Remote Sens. Environ. 113, 2164–2171. Sundal, A.V., Shepherd, A., Nienow, P., Hanna, E., Palmer, S., Huybrechts, P., 2011. Meltinduced speed-up of Greenland ice sheet offset by efficient subglacial drainage. Nature 469, 521–524. Taylor, J., Siegert, M.J., Payne, A.J., Hubbard, B., 2004. Regional-scale bed roughness beneath ice masses: measurement and analysis. Comput. Geosci. 30, 899–908. Tedstone, A.J., Nienow, P.W., Sole, A.J., Mair, D.W.F., Cowton, T.R., Bartholomew, I.D., King, M.A., 2013. Greenland ice sheet motion insensitive to exceptional meltwater forcing. Proc. Natl. Acad. Sci. U.S.A. 110, 19719–24. Walter, F., Chaput, J., Lüthi, M.P., 2014. Thick sediments beneath Greenland’s ablation zone and their potential role in future ice sheet dynamics. Geology 42, 487–490. 58 van As, D., Hubbard, A.L., Hasholt, B., Mikkelsen, A.B., van den Broeke, M.R., Fausto, R.S., 2012. Large surface meltwater discharge from the Kangerlussuaq sector of the Greenland ice sheet during the record-warm year 2010 explained by detailed energy balance observations. Cryosph. 6, 199–209. van de Wal, R.S.W., Greuell, W., van den Broeke, M.R., Reijmer, C.H., Oerlemans, J., 2005. Surface mass-balance observations and automatic weather station data along a transect near Kangerlussuaq, West Greenland. Ann. Glaciol. 42, 311–316. van de Wal, R.S.W., Boot, W., van den Broeke, M.R., Smeets, C.J.P.P., Reijmer, C.H., Donker, J.J.A., Oerlemans, J., 2008. Large and Rapid Melt-Induced Velocity Changes in the Ablation Zone of the Greenland Ice Sheet. Science 321, 111–3. van de Wal, R.S.W., Boot, W., Smeets, C.J.P.P., Snellen, H., van den Broeke, M.R., Oerlemans, J., 2012. Twenty-one years of mass balance observations along the Ktransect, West Greenland. Earth Syst. Sci. Data 4, 31–35. van den Broeke, M.R., Bamber, J., Lenaerts, J., Rignot, E., 2011. Ice Sheets and Sea Level: Thinking Outside the Box. Surv. Geophys. 32, 495–505. van der Veen, C.J., 2007. Fracture propagation as means of rapidly transferring surface meltwater to the base of glaciers. Geophys. Res. Lett. 34, L01501. van Tatenhove, F.G.M., van der Meer, J.J.M., Koster, E.A., 1996. Implications for Deglaciation Chronology from New AMS Age Determinations in Central West Greenland. Quat. Res. 45, 245–253. Watts, R.D., England, A.W., 1976. Radio-echo sounding of temperate glaciers: Ice properties and sounder design criteria. J. Glaciol. 17, 39–48. Vaughan, D.G., Comiso, J.C., Allison, I., Carrasco, J., Kaser, G., Kwok, R., Mote, P., Murray, T., Paul, F., Ren, J., Rignot, E., Solomina, O., Steffen, K., Zhang, T., 2013. Observations: Cryosphere. In: Stocker, T.F., Qin, D., Plattner, G.-K., Tignor, M. , Allen, S.K., Boschung, J., Nauels, A., Xia, Y., Bex, V., Midgley, P.M. (Eds.), Climate Change 2013: The Physical Science Basis. Contribution of Working Group I to the Fifth Assessment Report of the Intergovernmental Panel on Climate Change. Cambridge University Press, Cambridge, United Kingdom and New York, NY, U.S.A., pp. 317–382. Vaughan, D.G., Corr, H.F.J., Smith, A.M., Pritchard, H.D., Shepherd, A., 2008. Flowswitching and water piracy between Rutford ice stream and Carlson inlet, West Antarctica. J. Glaciol. 54, 41–48. Velicogna, I., 2009. Increasing rates of ice mass loss from the Greenland and Antarctic ice sheets revealed by GRACE. Geophys. Res. Lett. 36, 2–5. Wilson, R.W., Klint, K.E.S., Gool, J.A.M. van, McCaffrey, K.J.W., Holdsworth, R.E., Chalmers, J.A., 2006. Faults and fractures in central West Greenland: onshore expression of continental break-up and sea-floor spreading in the Labrador – Baffin Bay Sea. Geol. Surv. Denmark Greenl. Bull. 11, 185–204. Wingham, D.J., Siegert, M.J., Shepherd, A., Muir, A.S., 2006. Rapid discharge connects Antarctic subglacial lakes. Nature 440, 1033–6. Wright, A.P., Siegert, M.J., Le Brocq, A.M., Gore, D.B., 2008. High sensitivity of subglacial hydrological pathways in Antarctica to small ice-sheet changes. Geophys. Res. Lett. 35, L17504. Yang, K., Smith, L.C., 2013. Supraglacial Streams on the Greenland Ice Sheet Delineated From Combined Spectral–Shape Information in High-Resolution Satellite Imagery. IEEE Geosci. Remote Sens. Lett. 10, 801–805. Yilmaz, Ö., 2001. Seismic data analysis. Society of Exploration Geophysicists. Zwally, H.J., Abdalati, W., Herring, T., Larson, K., Saba, J., Steffen, K., 2002. Surface meltinduced acceleration of Greenland ice-sheet flow. Science 297, 218–222. Map p. 10: A map of old Greenland, agreeable to Egede’s late description of Greenland, by Emanuel Bowen (1747) cf P614 (1752 edition of A Complete Atlas); NMM p.356; M&B p 166. Photos p. 12 and 20: Christian Helanow, p. 22, 36, 40, 48 and 50: by the author 59 Acta Universitatis Upsaliensis Digital Comprehensive Summaries of Uppsala Dissertations from the Faculty of Science and Technology 1265 Editor: The Dean of the Faculty of Science and Technology A doctoral dissertation from the Faculty of Science and Technology, Uppsala University, is usually a summary of a number of papers. A few copies of the complete dissertation are kept at major Swedish research libraries, while the summary alone is distributed internationally through the series Digital Comprehensive Summaries of Uppsala Dissertations from the Faculty of Science and Technology. (Prior to January, 2005, the series was published under the title “Comprehensive Summaries of Uppsala Dissertations from the Faculty of Science and Technology”.) Distribution: publications.uu.se urn:nbn:se:uu:diva-259076 ACTA UNIVERSITATIS UPSALIENSIS UPPSALA 2015


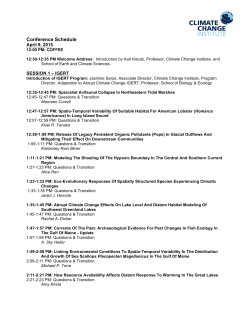


© Copyright 2026