
Funds Menu
Funds Menu Funds Menu November 2014 For Non-Professional Investors September 2013 For Non-Professional Investors Contents • Please pay particular attention to the risk of investment in China and other markets in the Asian region and in • • • • companies with medium or small capitalization. The value of the funds can be extremely volatile and could go down substantially within a short period of time. It is possible that the entire value of your investment could be lost. Value Partners High-Dividend Stocks Fund and Value Partners Greater China High Yield Income Fund may invest in higher-yielding debt and equity securities that are below investment grade; additionally, Value Partners Greater China High Yield Income Fund may invest in debt securities issued by special purpose vehicles. Such investments can involve material risks, e.g. counterparty risk, liquidity risk, credit risk and default risk, and may expose the Fund to significant losses. Investors should note that there is no guarantee that the underlying securities in Value Partners High-Dividend Stocks Fund and Value Partners Greater China High Yield Income Fund will pay out dividends. Therefore, there is no guarantee that those funds’ investment strategies will succeed. There is also no guarantee of dividend or distribution payments during the period an investor holds units in such funds, and a positive dividend yield does not represent/imply positive return. The funds may also invest in derivatives which can involve material risks, e.g. counterparty default risk, insolvency or liquidity risk, and may expose the funds to significant losses. You should not make investment decision on the basis of this material alone. Please read the explanatory memorandum for details and risk factors. Pages Value Partners Classic Fund 5-12 Value Partners High-Dividend Stocks Fund 13-14 Value Partners Intelligent Funds - China Convergence Fund 15-16 Value Partners Intelligent Funds - Chinese Mainland Focus Fund 17-18 Value Partners China Greenchip Fund Limited 19-20 Value Partners Taiwan Fund 21-22 Value Partners Greater China High Yield Income Fund 23-24 2 Value Partners Fund Offerings Absolute return long-biased strategy Asia Pacific China Taiwan Classic Fund China Convergence Fund Taiwan Fund A value fund investing primarily in a broad mandate in the AsiaPacific markets with an emphasis on Greater China equities. A value fund mainly investing primarily in China A, B and H shares. High-Dividend Stocks Fund Chinese Mainland Focus Fund A value fund mainly investing in relatively high yielding investment in Asian region. A value fund mainly investing in Mainland China related investments and investments that we believe would be boosted by the appreciation of Renminbi. China Greenchip Fund A value fund mainly investing in undervalued Taiwan and Taiwan-related entities. CIES Eligible* A value fund investing primarily in undervalued small-cap entities with a focus on Greater China. Fixed income strategy China Greater China High Yield Income Fund A fund that aims to provide regular income through primarily investing in Greater China debt securities. * Value Partners China Greenchip Fund Limited is one of the eligible collective investment schemes for the purpose of the Hong Kong Capital Investment Entrant Scheme (CIES). 3 4 3 Mar 2008 28 Mar 2012 Value Partners Taiwan Fund Taiwan Stock Exchange Index MSCI Taiwan Index Value Partners Greater China High Yield Income Fund (P USD Acc) USD 1,044.5m USD 63.82m HKD 4,995.66m - - 0.2% -13.9% -10.5% 1.1% -14.0% - 10.5% -5.7% - 21.2% -15.7% 20.9% -15.7% - 2002 - - 85.6% 34.9% 86.7% 92.1% 87.6% 3.9% 20.1% 79.7% 41.5% - 83.6% 33.1% 83.1% 33.1% - 2003 - - 1.5% 13.2% 2.0% 0.8% 1.9% 8.4% 1.9% 8.9% 19.7% - 5.8% 13.4% 5.6% 13.4% - 2004 - - 16.1% 8.4% 19.5% 3.9% 19.8% 11.6% 19.8% 12.2% 20.1% - 15.9% 9.8% 15.6% 9.8% - 2005 - - 43.7% 39.0% 83.4% 86.9% 82.9% 48.1% 82.9% 35.0% 28.2% - 41.8% 35.3% 41.2% 35.3% - 2006 - - 36.3% 43.4% 66.7% 56.6% 66.2% 56.0% 66.2% 44.2% 34.8% - 41.1% 45.3% 40.4% 45.3% - 2007 - -35.7% -42.4% -47.9% -57.4% -46.4% -51.1% -45.2% -50.8% -44.8% -50.8% -46.8% -54.1% - -47.9% -46.5% -48.1% -46.5% - 2008 - 58.0% 81.6% 76.4% 116.7% 56.6% 62.4% 87.1% 62.3% 86.0% 62.3% 82.8% 68.2% - 82.9% 56.6% 82.0% 56.6% 7.7% -0.3% 2009 - 19.2% 13.3% 21.3% 37.8% 8.6% 4.9% 21.3% 4.6% 23.9% 4.6% 25.8% 15.2% - 20.2% 8.6% 19.6% 8.6% 21.2% 8.6% 2010 - -13.0% -19.7% -19.5% -25.0% -17.0% -18.2% -22.4% -18.4% -17.8% -18.4% -11.9% -16.6% - -17.2% -17.4% -17.6% -17.4% -17.6% -17.4% 2011 13.0% 26.1% 18.2% 16.9% 24.8% 26.9% 22.0% 9.3% 22.7% 11.6% 22.7% 25.2% 18.6% 7.2% 14.0% 27.7% 13.4% 27.7% 13.4% 27.7% 2012 1.2% 13.7% 12.2% 9.1% 16.5% 6.6% 3.7% 9.2% 3.6% 8.3% 3.6% 8.1% 3.4% 7.5% 11.2% 6.5% 10.6% 6.5% 10.8% 6.5% 2013 4.3% 3.6% 5.2% 10.2% 2.2% 7.1% 5.1% 7.0% 5.1% 2.0% 5.1% 6.9% 6.4% 6.8% 6.6% 7.1% 6.1% 7.1% 6.2% 7.1% 2014 YTD 19.2% 56.5% 39.6% 26.2% 507.9% 210.9% 464.1% 1,271.4% 166.4% 274.6% 305.6% 636.9% 317.5% 23.1% 2,406.4% 425.4% 1,040.3% 210.6% 43.5% 30.0% Since inception No part of this document, or any information contained herein, may be distributed, reproduced, taken or transmitted into the United States or its territories or possession. Any failure to comply with the restrictions may constitute a violation of the relevant laws. + Source: HSBC Institutional Trust Services (Asia) Limited and Bloomberg. Unless otherwise stated, performance is calculated in USD, NAV to NAV, with dividends reinvested. Performance data is net of all fees. Performance is calculated in HKD, NAV to NAV, with dividends reinvested. Performance data is net of all fees. Investors should note that figures for Non-Redeemable Class N shares shown above may differ from those of classes currently available for subscription (namely Class A and Class A2 QDis), due to differences in launch date of these classes. For Class A, the since launch return is +72.0%. *Indices combine the price return indices up to 31 December 2004 with the total return indices thereafter. Total return indices include dividend reinvestment whereas price return indices does not take into account reinvestment of dividends. Ω Starting from July 2009, the MSCI China Index will be used as the reference index for the entire history of the fund. Hang Seng H Shares Index, Shanghai Composite Index and Shenzhen Composite Index were no longer shown for comparison. Disclaimer: Investors should note investment involves risk. The price of units may go down as well as up and past performance is not indicative of future results. Investors should read the explanatory memorandum for details and risk factors in particular those associated with investment in emerging markets. Information in this report has been obtained from sources believed to be reliable but Value Partners Limited does not guarantee the accuracy or completeness of the information provided by third parties. This report has not been reviewed by the Securities and Futures Commission. Issuer: Value Partners Limited 8 Apr 2002 USD 320.57m USD 134.47m 14 Jul 2000 USD 2,596.16m (Total Class A1, A2MDis & Z) USD 1,314.33m (Total A, B & C units) Fund size 27 Nov 2003 28 Sep 2012 2 Sep 2002 15 Oct 2009 15 May 1996 1 Apr 1993 Inception date Value Partners China Greenchip Fund Limited+ Hong Kong Hang Seng Index* MSCI China Free HKD Value Partners Intelligent Funds -China Convergence Fund Ω MSCI China Index Chinese Mainland Focus Fund Ω MSCI China Index Value Partners High-Dividend Stocks Fund(Class A1) MSCI Asia Pacific (ex-Japan) Index Value Partners High-Dividend Stocks Fund(Class A2) Value Partners Classic Fund (A unit) Hong Kong Hang Seng Index* Value Partners Classic Fund (B unit) Hong Kong Hang Seng Index* Value Partners Classic Fund (C unit) Hong Kong Hang Seng Index* Recent performance Updated to end of October 2014 HHHH Morningstar RatingTM1 As at 31-10-2014 31 October 2014 Value Partners Classic Fund NAV per unit : A Units - USD250.64 USD1,314.3 million Fund size : B Units - USD114.03 2 Pages C Units - USD14.35 • Value Partners Classic Fund (“the fund”) primarily invests in stock markets of the Asia-Pacific region, with a Greater China focus. • Please pay particular attention to the risk of investment in China and other markets in the Asian region and in companies with medium or small capitalization. The value of the fund can be extremely volatile and could go down substantially within a short period of time. It is possible that the entire value of your investment could be lost. • The fund may also invest in derivatives which can involve material risks, e.g. counterparty default risk, insolvency or liquidity risk, and may expose the fund to significant losses. • You should not make investment decision on the basis of this material alone. Please read the explanatory memorandum for details and risk factors. Performance update Investment objective The fund aims to achieve consistent superior return and uses a bottom-up approach to invest in value stocks in the Asia Pacific region, particularly those in Greater China region, which the Manager believes are being traded at deep discounts to their intrinsic value. Performance since launch (with dividends reinvested) % 2800 2400 Value Partners Classic Fund (A Units, USD) Hong Kong Hang Seng Index 3 Year-to-date One year Three years 2 Five years Since launch +2,406.4% 2000 Annualized return Annualized volatility A Units Hang Seng B Units (USD) Index 3 (USD) +1.6% +5.0% +1.5% +6.6% +7.1% +6.1% +12.2% +7.6% +11.6% +25.8% +35.6% +24.0% +45.4% +31.4% +41.8% +2,406.4% +425.4% +1,040.3% +16.1% +8.0% +14.1% 21.9% 27.1% 22.8% 1200 Annual performance 2 800 +425.4% 400 0 1996 1998 2000 2002 2004 2006 2008 2010 2012 2014 NAVs & codes Classes 5 A Units (USD) B Units (USD) C Units (USD) C Units (HKD) 6 C Units (AUD) Hedged C Units (CAD) Hedged C Units (NZD) Hedged NAV 250.64 114.03 14.35 111.2886 11.52 11.41 11.47 ISIN KYG9316N1025 KYG931701018 KYG9316N1280 KYG9316N1280 KYG9316N1363 KYG9316N1447 KYG9316N1512 Bloomberg VLPARAI KY VLPARBI KY VLPARCI KY VLPARCI KY VLCHAUD KY VLCHCAD KY VLCHNZD KY 2003 2004 2005 2006 2007 2008 2009 2010 2011 2012 2013 2014 (YTD) A Units (USD) +83.6% +5.8% +15.9% +41.8% +41.1% -47.9% +82.9% +20.2% -17.2% +14.0% +11.2% +6.6% B Units (USD) +83.1% +5.6% +15.6% +41.2% +40.4% -48.1% +82.0% +19.6% -17.6% +13.4% +10.6% +6.1% Value Partners Classic Fund – A Units (USD): Monthly performance from 1 Jan 2003 to 31 Oct 2014 Year 2003 2004 2005 2006 2007 2008 2009 2010 2011 2012 2013 2014 (YTD) C Units (USD) +1.6% +6.2% +11.9% +24.4% +42.8% +43.5% +7.4% 19.0% Annualized return and volatility are calculated from inception. Volatility is a measure of the theoretical risk in terms of standard deviation; in general, the lower the number, the less risky the investment, and vice versa. 1600 1993 One month 2 Jan +6.2% +2.9% +0.7% +9.2% +2.1% -14.0% -3.2% -5.8% -1.5% +7.8% +7.9% -5.5% Feb +4.9% +4.5% +3.4% +3.5% +2.5% +6.1% -0.2% +2.2% -1.6% +6.3% -2.5% +2.3% Mar +0.7% +0.1% -1.1% +6.7% +2.5% -9.5% +8.2% +7.1% +5.4% -5.7% -2.9% -4.0% Apr -2.2% -2.9% +0.3% +4.6% +5.0% +10.9% +8.2% +3.1% +3.5% +1.6% +0.6% -1.6% May +9.3% -6.1% -1.2% -5.6% +3.7% -2.2% +20.1% -6.1% -1.3% -10.2% +1.2% +2.0% Jun +4.5% -0.8% +4.0% -2.6% +4.8% -8.3% +1.3% +1.1% -3.2% -2.1% -9.0% +4.6% Jul +9.8% -0.1% +1.6% +3.2% +12.6% -5.3% +11.5% +5.0% +2.8% -1.3% +2.3% +6.2% Aug +6.9% -0.1% -0.1% +0.7% -7.4% -8.6% +0.1% +0.2% -7.5% +1.7% +0.5% +3.0% Sep +6.3% +4.2% +3.1% +0.8% +10.5% -11.0% +2.5% +10.5% -19.8% +6.4% +2.2% -1.5% Oct +8.5% +0.7% -1.9% +5.0% +8.9% -31.0% +7.5% +3.8% +15.3% +2.3% +6.2% +1.6% Nov +1.4% +3.9% +3.8% +6.4% -9.6% +5.2% +5.9% -0.7% -7.8% +1.9% +4.8% C Units (USD) N/A N/A N/A N/A N/A N/A +7.7% 4 +21.2% -17.6% +13.4% +10.8% +6.2% 2 Dec +6.5% +0.0% +2.5% +4.6% +1.6% +13.4% +2.2% -0.7% +1.0% +5.9% +0.4% Annual +83.6% +5.8% +15.9% +41.8% +41.1% -47.9% +82.9% +20.2% -17.2% +14.0% +11.2% +6.6% 9th Floor, Nexxus Building, 41 Connaught Road Central, Hong Kong Tel : (852) 2880 9263 Fax : (852) 2565 7975 Email : [email protected] Website : www.valuepartners.com.hk 5 Value Partners Classic Fund 31 October 2014 Top 10 securities holdings Name Luye Pharma PetroChina Chongqing Changan Automobile China Vanke Lijun International Pharmaceutical Daqin Railway Inner Mongolia Yili Industrial China Unicom Tasly Pharmaceutical Poly Real Estate Portfolio characteristics Industry 7 Pharmaceuticals, biotechnology & life sciences Energy Automobiles & components % 8.9 Real estate Pharmaceuticals, biotechnology & life sciences Transportation Food, beverage & tobacco Telecom services Pharmaceuticals, biotechnology & life sciences Real estate 5.5 5.3 8.1 7.2 5.1 3.0 2.7 2.6 2.6 These stocks constitute 51% of the fund. The top ten securities holdings only include companies and/ or REITs the fund invested, excluding any index tracking fund or ETF. As at 31 Oct 2014 Price/earnings ratio Price/book ratio Dividend yield 2015 10 13.6 times 2.0 times 3.1% Fund facts Manager: Base currency: Trustee: Custodian: Launch date: Value Partners Limited USD Bank of Bermuda (Cayman) Limited HSBC Institutional Trust Services (Asia) Limited A Units (USD) - 1 Apr 1993 B Units (USD) - 15 May 1996 C Units (USD) - 15 Oct 2009 C Units (AUD/CAD/NZD) - 17 Mar 2014 A, B and C units are invested in the same fund, A and B units were no longer issued from 12 Apr 2002 and 15 Oct 2009 respectively. Only C units are currently available. Unit price is published daily in the South China Morning Post, the Hong Kong Economic Journal and the Hong Kong Economic Times. Geographical exposure by listing 8 Hong Kong China A Shares Red Chips China B Shares H Shares Taiwan Others Singapore Cash 9 29% 27% 17% 11% 10% 6% 3% 2% -4% Short exposure includes: H Shares, -2.1%. Fee structure A Units Minimum subscription Minimum subsequent subscription Subscription fee Management fee Performance fee 11 Redemption fee Dealing day C Units USD10,000 Closed Closed or equivalent USD5,000 Nil Nil or equivalent Closed Closed up to 5% 0.75% p.a. 1.25% p.a. 1.25% p.a. 15% of profit (High-on-high principle) Nil Daily Daily Daily dealing redemption redemption 78 Health care Consumer discretionary Energy Real estate Utilities Information technology Consumer staples Industrials Insurance Banks Telecom services Other financials Cash 9 22% 17% 12% 10% 9% 8% 6% 5% 5% 3% 3% 2% -4% Total short exposure is -2.1%. Short exposure includes: Consumer discretionary, -1.1% and Materials, -1.0%. Value Partners Investment Team Chairman & Co-Chief Investment Officer: Cheah Cheng Hye Deputy Chairman & Co-Chief Investment Officer: Louis So Deputy Chief Investment Officer: Renee Hung Senior Investment Director: Norman Ho, CFA Investment Directors: Eric Chow; Alan Wang, CFA Senior Fund Managers: Doris Ho; Kyu Ho; Michelle Yu, CFA; Yu Xiao Bo Recent awards GREATER CHINA EQUITY Fund of the Year Awards 2011 Outstanding Achiever – Greater China Equity category 12 ~ Benchmark OUTSTANDING ACHIEVER 2011 - Long-Term Performance Award (10 years) 13 ~ AsiaHedge Awards 2011 1. © 2014 Morningstar, Inc. All Rights Reserved (for A Units). 2. Source: HSBC Institutional Trust Services (Asia) Limited and Bloomberg, in USD, NAV to NAV, with dividends reinvested. Performance data is net of all fees. 3. Index refers to Hang Seng Price Return Index up to 31 Dec 2004, thereafter it is the Hang Seng Total Return Index. Hang Seng Total Return Index includes dividend reinvestment whereas Hang Seng Price Return Index does not take into account reinvestment of dividends. 4. Calculated based on the since inception return of C Untis. 5. The fund may invest in financial derivative instruments (“FDI”) for hedging purposes. In adverse situations, the fund’s use of FDI may become ineffective in hedging and the fund may suffer significant losses. Each hedged share class will hedge the fund’s base currency back to its currency of denomination on a best efforts basis. However, the volatility of the hedged classes measured in the fund’s base currency may be higher than that of the equivalent class denominated in the fund’s base currency. Risks associated with FDI include counterparty risk, credit risk and liquidity risk. Such exposure may lead to a high risk of capital loss. The AUD/CAD/NZD Hedged Classes are not recommended for investors whose base currency of investment is not in the aforesaid currencies. 6. Investors should note that the base currency of “C” Units is in USD. The HKD is for reference only and should not be used for subscription or redemption purpose. Conversion to the base currency of “C” Units will normally take place at the prevailing rate (as determined by the Fund’s Trustee or Custodian) on the corresponding fund dealing day. Investor should be aware of possible risks resulting from fluctuations of exchange rates against USD. 7. Classification is based on Global Industry Classification Standard (GICS). 8. Exposure refers to net exposure (long exposure minus short exposure). Due to rounding, percentages shown may not add up to 100%. 9. Cash refers to net cash on hand excluding cash for collaterals and margins. 10. The profile is based on market consensus forecast as derived from S&P Capital IQ and Bloomberg. Note that the manager’s internal estimates may differ significantly from S&P Capital IQ and Bloomberg estimates. 11. Performance fee will only be charged if the NAV at the end of the financial year or upon realization of units exceeds the “high watermark”, which is the all-time year-end high of the fund’s NAV. If in any one year, the fund suffers a loss, no performance fee can be charged in subsequent years until the loss is recovered fully (the high-on-high principle). 12. Class A Units of the fund selected as one of the top 100 funds based on fund size, track record, Morningstar’s Star rating and one year absolute ranking as at month end Oct 2011. 13. Value Partners Classic Fund is not authorized as a hedge fund by the Securities and Futures Commission (“SFC”) in Hong Kong according to the Code on Unit Trusts and Mutual Funds. SFC authorization is not a recommendation or endorsement of a scheme nor does it guarantee the commercial merits of a scheme or its performance. It does not mean the scheme is suitable for all investors nor is it an endorsement of its suitability for any particular investor or class of investors. Investors should note investment involves risk. The price of units may go down as well as up and past performance is not indicative of future results. Investors should read the explanatory memorandum for details and risk factors in particular those associated with investment in emerging markets. Information in this report has been obtained from sources believed to be reliable but Value Partners Limited does not guarantee the accuracy or completeness of the information provided by third parties. This report has not been reviewed by the SFC. Issuer: Value Partners Limited. VPCF_Master_201410 Sector exposure B Units 6 Value Partners Classic Fund Commentary / Third Quarter 2014 Value Partners Classic Fund (the “Fund”) primarily invests in stock markets of the Asia-Pacific region, with a Greater China focus. Please pay particular attention to the risk of investment in China and other markets in the Asian region and in companies with medium or small capitalization. The value of the Fund can be extremely volatile and could go down substantially within a short period of time. It is possible that the entire value of your investment could be lost. The Fund may also invest in derivatives which can involve material risks, e.g. counterparty default risk, insolvency or liquidity risk, and may expose the Fund to significant losses. You should not make investment decisions on the basis of this material alone. Please read the explanatory memorandum for details and risk factors. The Chinese equity markets began the third quarter on a bright note as stocks posted strong gains in July and August. However, we saw a steady retreat in September as the release of weaker macro data, combined with political protests in Hong Kong, put additional pressure on the markets. Value Partners Classic Fund rose 7.7% in the third quarter while the Hang Seng Index stayed flat and the MSCI China Index was up 1.4%. In the past year, the Fund gained 17.0%. For reference, the Hang Seng Index and MSCI China Index were up 4.3% and 4.6%, respectively, over the same period. With a turnaround in the Chinese equity markets beginning in late second quarter, we have seen a significant improvement in our fund performance during the third quarter. As the market began to recognize the potential “reform dividends” from investing in state-owned enterprises (SOEs), traditional sectors which show value characteristics have rallied, acting as a tailwind for our investment approach. SOE reforms gather pace SOEs are a key part of China’s command economy, representing up to 70% of the constituent stocks of the MSCI China universe. SOEs are trading at lower valuations as investors perceive these companies as less efficient and less profit-focused. To tackle the inefficiencies, the State-owned Assets Supervision and Administration Commission of the State Council (SASAC) announced in mid-July a pilot program to improve the management, supervision and efficiency of SOEs. Companies are required to start adopting more market-based compensation plans to encourage better alignment of corporate and shareholder’s interests. The response has been positive. In the past few months, a number of companies have been reducing their capital expenditure as management started to focus more on the bottom line. We believe the roll-out of reforms will take place gradually instead of being a one-off measure. Reforms will be seen most notably in industries such as natural resources and alternative energy – areas that we already have positions- and benefits from such reforms can be manifold. For example, PetroChina, one of our key resources plays, has shown stronger commitment in improving profits this year. It has been reducing capital expenditure and shutting down inefficient refineries on the one hand, and undergoing an austerity program to reduce entertainment expenses on the other hand. In addition, it is also enhancing corporate governance, while introducing private capital and planning to sell selected pipeline assets which were previously unavailable to private investors. Finally, as we mentioned previously, PetroChina may benefit from the gas price reform, potential adjustments to tax, as well as supportive policies for shale gas development. While some investors remain skeptical of the SOE reform conviction in the energy sector after witnessing the sale of Sinopec’s marketing division to domestic investors, we believe the opening up of the sector to private capital and foreign investors will likely be gradual and hence takes time for the market to fully recognize. 9th Floor, Nexxus Building, 41 Connaught Road Central, Hong Kong Tel: (852) 2880-9263 Fax: (852) 2565-7975 Email: [email protected] Website: www.valuepartners.com.hk 7 Tapping the “through train” opportunities While reforms are expected to continue to support the market in the medium term, the upcoming ShanghaiHong Kong Stock Connect program is likely to act as a near-term catalyst. The “through train” scheme is a landmark opening of investment channels which will let global investors participate in Shanghai-listed securities trading and allow Chinese domestic investors to trade Hong Kong-listed stocks. At Value Partners, we are very excited about this program which is likely to be launched in late October. We have been closely following the progress and are well prepared to make full use of it. We look to take every step to generate gains for our investors. In addition to preparing ourselves to take part in the program, we have already positioned our portfolio to take advantage of the potential arbitrage opportunities. Through utilizing various existing and newly granted access quota to A shares, we have substantially increased the Fund’s A-share exposure to 24% currently* from 10% at end-June. While selected dually-listed companies are still trading at discounts ranging from 10% to 15% in the A-share market, this presents an immediate and obvious investment opportunity. The significant additions reflect our focus on value opportunities in the A-share market, an area where experienced Hong Kong investors will focus as the Stock Connect program launches. Meanwhile, we have also deployed capital in traditional value sectors that offer attractive dividend yields. Luye Pharma shines in booming healthcare sector During the quarter, we have increased our exposure in our favorite sectors such as healthcare. The rapid growth of the sector is a reflection of aging population and dietary shifts in China. As China is increasingly focusing on the quality of growth, we remain confident that the healthcare sector will continue to grow at 1.5 to 2 times the GDP growth rate as it did in the past, benefiting drug and medical equipment manufacturers. Our additions in the healthcare sector continued to do well in the third quarter and made significant contributions to portfolio return. One example is Luye Pharma, one of the largest drug manufacturers in oncology, cardiovascular system, and alimentary tract and metabolism - the faster-growing segments in the healthcare sector. With a strong product pipeline over the next three years, together with four upcoming drug trials in the U.S., Luye is well positioned within the sector. Its recent initial public offering (“IPO”) has also provided the company with capital to purchase Jialin, a local cardiovascular drug manufacturer. Jialin’s drug portfolio can leverage Luye’s existing distribution network, giving us more confidence in Luye’s ability in growing market share. Since our participation in Luye’s IPO in early July, it has been one of the top 10 positions in our portfolio. The company’s share price gained over 65% in the third quarter. Hong Kong protests While we remain pro-active with our portfolio fully invested, Hong Kong has been in newspaper headlines on the political front. In late September, we witnessed a political divide accompanied by mass street protests. As Hong Kong society became increasingly polarized, some investors took profits, causing a retreat in Hong Kong share prices. The protests certainly have hurt certain local industries such as retail, tourism, and property landlords, but have little or no impact on Chinese businesses which make up the majority of our portfolio. In fact, local Hong Kong exposure is estimated to be at only around 2% of our portfolio. As usual, we will be monitoring the situation carefully. We think there is a reasonable chance that the unrest in Hong Kong will have only a temporary impact on local shares, but we are fully prepared for a bad-case scenario where the negative impact could be a lot longer-lasting but largely confined to Hong Kong. Although based in Hong Kong, Value Partners has been dedicated to investing across the Greater China region, and since the late 1990s has spread out across the Asia Pacific Region. Like many well-diversified investors, we wish Hong Kong well but we are not overly dependent on it. Page 2 8 As market sentiment has improved, we have seen significant positive inflows to our funds during the quarter. We thank our investors for their continued support and will remain focused as ever on delivering performance for clients through our value investing approach. Value Partners Investment Team 13 October 2014 * Including exposure from both direct A-share investment and indirect investment through China A-Share Access Products (CAAPs). Fund performance mentioned referred to Value Partners Classic Fund “A” Unit. All performance figures are sourced from HSBC Institutional Trust Services (Asia) Limited and Bloomberg (Data computed in US$ terms on NAV-to-NAV basis with dividends reinvested) as at 30 September2014. Performance data is net of all fees. Individual stock performance is not indicative of fund performance. Investors should note that investment involves risk. The price of units may go down as well as up and past performance is not indicative of future results. Investors should read the explanatory memorandum for details and risk factors in particular those associated with investment in emerging markets. This commentary has not been reviewed by the Securities and Futures Commission. Issuer: Value Partners Limited. Page 3 9 10 Market cap: US$12.9 billion Inner Mongolia Yili Industrial (Code: 600887 CH) Market cap: US$18.8 billion Daqin Railway (Code: 601006 CH) Market cap: US$10.3 billion Chongqing Changan Automobile (Code: 200625 CH) Dairy product manufacturer Railway Auto manufacturer Real estate China Vanke (Code: 000002 CH – A shares) Market cap: US$16.8 billion Industry Stock Price: CNY25.90 P/E: 16.3x P/B: 3.6x Yield: 2.3% Price: CNY7.78 P/E: 7.1x P/B: 1.2x Yield: 7.6% Price: HK$16.68 P/E: 6.4x P/B: 1.7x Yield: 2.2% Price: CNY9.18 P/E: 4.9x P/B: 1.0x Yield: 5.2% Valuation (2015 Estimates) Page 4 Yili is the leading dairy group in China engaging in sectors including liquid milk, ice cream, infant milk powder and yoghurt. Since 2010, its management has been committed to channel optimization and product upgrade, resulting in a continuous operational improvement. Its market share would also grow further as Yili would be the major beneficiary of the policy-driven industry consolidation among domestic peers. At present, Yili is trading at a huge valuation discount to its closest peer, Mengniu, which is listed in Hong Kong’s stockmarket. Daqin Railway is one of the largest eastbound coal transporters in Northern China, serving a number of major coal companies while also running a passenger transportation business. The company possesses strong fundamentals with growth potential as a beneficiary of railway reforms with possible tariff hikes that will likely improve the company’s profitability. The average dividend payout ratio of Daqin Railway in the past five years has been over 50%, contributing to its relatively high dividend yield. Chongqing Changan Automobile (“Changan”) is one of the largest automakers in China. It owns a joint venture with Ford. The joint venture Changan Ford has contributed to the majority of the company’s profits and launched in 2013 two locally manufactured sports utility vehicles (SUV) models, aiming to participate in the fastest-growing passenger vehicle segment. Ford is determined to ramp up production capacity to double their current production volume by 2015 and also expects to bring more new models to China and gain market share. China Vanke is China’s largest developer of residential properties in terms of contract sales. It has over 300 projects that are located in over 60 cities in mainland China. We see China Vanke’s land bank as one of the most diversified among its peers, which may help it deliver faster sales growth over its peers. Being the largest homebuilder in China, it may also benefit from the improving mortgage situation and more accommodative policy environment in China. The A shares of China Vanke are trading at a discount of around 15% to H shares. Remarks Value Partners Classic Fund: 10 biggest holdings of securities as at 30 September 2014 11 Market cap: US$232.5 billion PetroChina (Code: 857 HK) Market cap: US$4.3 billion Luye Pharma Group (Code: 2186 HK) Energy Drug manufacturer and distributor Drug manufacturer Lijun International Pharmaceutical (Code: 2005 HK) Market cap: US$1.4 billion Industry Stock Price: HK$9.95 P/E: 9.7x P/B: 1.1x Yield: 4.6% Price: HK$9.95 P/E: 39.8x P/B: 4.9x Yield: 0.0% Price: HK$3.74 P/E: 15.6x P/B: 3.0x Yield: 2.0% Valuation (2015 Estimates) Page 5 PetroChina is the largest integrated oil company in Asia by market capitalization. It has crude reserves of nearly 11 billion barrels and gas reserves of over 69,000 billion cubic feet. Its downstream assets consist of refining, and a service-station marketing network of over 20,000 stations. PetroChina is expected to benefit from growth in gas usage as China targets to diversify their energy reliance from coal. A new pricing mechanism of natural gas will help its prospects, as the government announced in June 2013 the lifting of the city-gate gas price. The SOE reform undergoing will also push the company to adopt measures for better cost control and returns for investors. Luye Pharma Group (“Luye Pharma”) is a leading pharmaceutical company which focuses on the manufacturing and selling of pharmaceutical products in three of the fastest growing therapeutic areas in China including oncology, cardiovascular system, and alimentary tract and metabolism. In the first half of 2014, the group’s nationwide distribution network enabled it to sell its products to over 8,000 hospitals in the PRC. Given its strong product pipeline, proven R&D capabilities and sales and marketing networks, Luye is well positioned to continue gaining market share despite an increasingly competitive market environment. Lijun International is a leading pharmaceutical manufacturer in China mainly engaged in producing intravenous infusion solutions and antibiotics. It has the highest sales revenue in intravenous infusion solution in China on a single factory basis. In 2013, intravenous infusion solution and related products contributed 62.8% of the company’s total revenue and 90% of total profit. Gross profit margin of the company was 44.9% in 2013, higher than 42.5% a year earlier. We believe profit margin will continue to rise because of the upgrade of its infusion solution products. Remarks 12 Food and beverage Price: TWD52.80 P/E: 18.2x P/B: 2.9x Yield: 3.2% Price: HK$9.32 P/E: 7.3x P/B: 2.1x Yield: 4.6% Price: HK$5.82 P/E: 24.6x P/B: 5.1x Yield: 1.2% Valuation (2015 Estimates) Uni-President Enterprises Corporation is a leading food and beverage manufacturer and distributor in Taiwan, commanding more than 45% share of the instant noodle, ready-to-drink tea, and convenience-store markets. To strengthen its China business further, its management has completed sales-channel reforms and successfully launched a number of popular products in the past two years. We see huge potential in the group and expect it to become one of the biggest food conglomerates in the fast-growing Greater China market. TCL Communication is one of the top mobile phone brands in the global market by shipments. Leveraging its lean cost structure, as well as strong channels and relationship with global operators via the TCL-Alcatel brand, the company has gained success in the feature phone market in the past few years. Starting 2013, TCL Communication has gradually come up with comprehensive smartphone offerings. We believe the company has key elements that can help it duplicating success from the feature phone era to the smartphone era and delivering strong earnings growth in the coming years. Sihuan Pharmaceutical is one of the largest domestic drug companies in China as well as a leading cardio-cerebral vascular prescription drug franchise by market share. The company enjoys a diversified product mix, in which its fast-growing exclusive drugs will likely face limited pricing pressure. We expect the company to likely see further growth with rising demand from a demographic more susceptible to stroke-related conditions. Its extensive agent distribution network is expected to support continued strong sales, in particular their fastgrowing drug products manufactured to treat cerebral damage. Remarks Page 6 Individual stock performance/yield is not necessarily indicative of overall fund performance. Note: The above investments made up 53.5% of Value Partners Classic Fund as at 30 September 2014. The stock prices are based on the closing of 30 September 2014. Market cap: US$9.5 billion Uni-President Enterprises (Code: 1216 TT) Market cap: US$1.5 billion TCL Communication Technology (Code: 2618 HK) Electronics manufacturer Drug manufacturer Sihuan Pharmaceutical (Code: 460 HK) Market cap: US$7.8 billion Industry Stock HHHHH Morningstar RatingTM1 As at 31-10-2014 Value Partners High-Dividend Stocks Fund NAV per unit: Class A1 (USD) - USD72.93 USD2,596.2 million Fund size: 31 October 2014 2 Pages Class A2 MDis (USD) - USD11.38 • Value Partners High-Dividend Stocks Fund (“the fund”) primarily invests in stock markets of the Asia-Pacific region, with a Greater China focus. • The fund will primarily invest in higher-yielding equities and debt securities, while maintaining a flexible allocation to other assets including gold, REITs and cash. • The fund may invest in higher-yielding debt and equity securities that are below investment grade. Such investments can involve material risks, e.g. counterparty risk, liquidity risk, credit risk and default risk, and may expose the fund to significant losses. • Investors should note that there is no guarantee that the underlying securities in the fund will pay out dividends. Therefore, there is no guarantee that the fund’s investment strategies will succeed. There is also no guarantee of dividend or distribution payments during the period an investor holds units in the fund, and a positive dividend yield does not represent/imply positive return. • Please pay particular attention to the risk of investment in China and other markets in the Asian region and in companies with medium or small capitalization. The value of the fund can be extremely volatile and could go down substantially within a short period of time. It is possible that the entire value of your investment could be lost. • The fund may also invest in derivatives which can involve material risks, e.g. counterparty default risk, insolvency or liquidity risk, and may expose the fund to significant losses. • You should not make investment decision on the basis of this material alone. Please read the explanatory memorandum for details and risk factors. Investment objective Performance update The fund aims to provide capital appreciation to unitholders by investing primarily in a portfolio of relatively higher yielding debt and equity securities in Asian region. Performance since launch (with dividends reinvested) 2 % 800 The fund (Class A1, USD) Index* +636.9% 600 400 +317.5% 200 2 Class A1 (USD) +0.3% +6.9% +6.9% +38.3% +70.4% +636.9% +17.8% 19.1% One month Year-to-date One year Three years Five years Since launch Annualized return ^ Annualized volatility ^ +2.7% +6.4% +4.0% +24.0% +42.9% +317.5% +12.5% 21.2% * Index refers to MSCI AC Asia Pacific (ex-Japan) Total Return Index. ^ Annualized return and volatility are calculated from inception on 2 Sep 2002. Volatility is a measure of the theoretical risk in terms of standard deviation; in general, the lower the number, the less risky the investment, and vice versa. Dividend information – Class A2 MDis 0 -100 2002 Classes 4 2004 2005 2006 2007 2008 2009 2010 2011 2012 2013 2014 Class A2 MDis USD Class A2 MDis HKD Class A2 MDis AUD Hedged Class A2 MDis CAD Hedged Class A2 MDis NZD Hedged NAVs & codes Classes 4 Class A1 USD Class A1 HKD 7 Class A2 MDis USD Class A2 MDis HKD Class A2 MDis AUD Hedged Class A2 MDis CAD Hedged Class A2 MDis NZD Hedged NAV 72.93 565.5940 11.38 10.39 10.40 10.43 10.40 ISIN KYG931731056 KYG931731056 KYG9318L1041 KYG9318L1538 KYG9318L1207 KYG9318L1389 KYG9318L1462 Bloomberg VALASHY KY VALASHY KY VALHYA2 KY VALHA2H KY VALHA2A KY VALHA2C KY VALHA2N KY Class A2 MDis (USD) +0.4% +6.8% +6.8% N/A N/A +23.1% +10.5% N/A Index* Dividend per unit 5 0.0499 0.0458 0.0639 0.0503 0.0641 3 Annualized yield 6 5.3% 5.3% 7.4% 5.8% 7.4% Ex-dividend date 31-10-2014 31-10-2014 31-10-2014 31-10-2014 31-10-2014 Value Partners High-Dividend Stocks Fund - Class A1 (USD): Monthly performance from 1 Jan 2003 to 31 Oct 2014 Year 2003 2004 2005 2006 2007 2008 2009 2010 2011 2012 2013 2014 (YTD) Jan +6.2% +5.0% +1.4% +4.0% +3.8% -14.3% -3.0% -1.6% +0.4% +7.5% +3.7% -4.4% Feb +7.1% +5.0% +3.8% +6.7% +7.1% +3.3% +1.2% +0.2% -1.6% +4.7% +0.4% +1.8% Mar -3.2% -0.5% -2.0% +3.6% -1.5% -5.6% +7.5% +7.0% +2.6% -1.7% -0.8% +0.7% Apr -2.0% -2.5% +0.5% +6.3% +4.1% +8.3% +8.9% +5.1% +5.7% +2.2% +1.5% +0.2% May +8.8% -4.2% -0.6% -5.2% +6.6% -3.6% +18.9% -6.4% -2.3% -6.5% +1.7% +3.8% Jun +4.6% -1.3% +3.0% -3.3% +3.0% -8.1% +5.4% +3.5% -2.1% +1.5% -5.6% +1.8% Jul +14.4% +1.2% +2.4% +5.1% +8.4% -3.4% +9.2% +2.4% +2.5% +2.4% +2.3% +5.9% Aug +8.0% -0.3% -1.1% +0.6% -1.3% -8.4% -3.8% +1.5% -5.2% +0.4% -0.1% +1.2% Sep +4.8% +2.5% +1.7% +2.4% +5.0% -10.5% +3.3% +8.0% -15.1% +5.5% +2.5% -4.1% Oct +4.2% -0.6% -1.0% +3.3% +8.6% -29.4% +10.2% +5.6% +9.2% +3.1% +2.7% +0.3% Nov +2.2% +5.2% +2.7% +5.4% -7.9% +6.6% +3.9% +0.0% -4.7% +1.7% +1.6% Dec +6.0% -0.5% +0.9% +2.3% +2.5% +11.3% +2.1% -1.2% +0.2% +2.4% -1.5% 2 Annual +79.7% +8.9% +12.2% +35.0% +44.2% -46.8% +82.8% +25.8% -11.9% +25.2% +8.1% +6.9% 9th Floor, Nexxus Building, 41 Connaught Road Central, Hong Kong Tel : (852) 2880 9263 Fax : (852) 2565 7975 Email : [email protected] Website : www.valuepartners.com.hk 13 Value Partners High-Dividend Stocks Fund 31 October 2014 Name Bank of China China Construction Bank Samsung Fire & Marine Insurance Amorepacific Corp. Daqin Railway PetroChina Agricultural Bank of China China Vanke Hyundai Motor China Resources Power Portfolio characteristics Industry 8 Banks Banks Insurance Household & personal products Transportation Energy Banks Real estate Automobiles & components Utilities % 4.2 3.4 2.9 2.6 2.5 2.4 2.3 2.1 2.1 2.1 These stocks constitute 27% of the fund. The top ten securities holdings only include companies and/ or REITs the fund invested, excluding any index tracking fund or ETF. Geographical exposure by listing 9 H Shares South Korea Hong Kong Cash 10 Red Chips Singapore Bonds Others China A Shares Taiwan Thailand 17% 16% 9% 7% 6% 6% 6% 5% 3% 2% Short exposure includes: South Korea, -0.9%. Sector exposure 8 9 Consumer discretionary Banks Industrials Real estate Cash 10 Information technology Bonds Energy Telecom services Utilities Insurance Consumer staples Materials REITs Others 15% 14% 11% 10% 9% 7% 6% 5% 5% 5% 4% 3% 2% 2% 2% Total short exposure is -0.9%. Short exposure includes: Consumer staples, -0.9%. 22% As at 31 Oct 2014 Price/earnings ratio Price/book ratio Dividend yield Yield to maturity/put 2015 11 8.3 times 1.2 times 5.3% 8.6% Fund facts Manager: Base currency: Trustee: Custodian: Launch date: Dividend policy 3: Value Partners Limited USD Bank of Bermuda (Cayman) Limited HSBC Institutional Trust Services (Asia) Limited Class A1 (USD) - 2 Sep 2002 Class A2 MDis (USD) - 28 Sep 2012 Class A2 MDis (AUD/CAD/NZD) - 23 Sep 2013 Class A2 MDis – aim at monthly distribution, subject to Manager’s discretion Unit price is published daily in the South China Morning Post, the Hong Kong Economic Journal and the Hong Kong Economic Times. Fee structure Class A1 Minimum subscription Minimum subsequent subscription Subscription fee Management fee Performance fee 12 Redemption fee Dealing day Class A2 MDis USD10,000 / HKD80,000 / AUD10,000 / CAD10,000 / NZD10,000 USD5,000 / HKD40,000 / USD5,000 or AUD5,000 / CAD5,000 / HKD equivalent 7 NZD5,000 Up to 5% 1.25% p.a. 15% of profit (High-on-high principle) Nil Daily USD10,000 or HKD equivalent 7 Value Partners Investment Team Chairman & Co-Chief Investment Officer: Cheah Cheng Hye Deputy Chairman & Co-Chief Investment Officer: Louis So Deputy Chief Investment Officer: Renee Hung Senior Investment Director: Norman Ho, CFA Investment Directors: Eric Chow; Alan Wang, CFA Senior Fund Managers: Doris Ho; Kyu Ho; Michelle Yu, CFA; Yu Xiao Bo Recent awards Lipper Fund Awards 2014 (Hong Kong) Best Asia Pacific (Ex-Japan) Equity 5 Years Category 13 ~ Lipper Morningstar Hong Kong Fund Awards 2014 14 Best Asia Ex-Japan Equity Fund ~ Morningstar Fund of the Year Awards 2013 Outstanding Achiever – Asia Pacific Equity Category 15 ~ Benchmark 1. © 2014 Morningstar, Inc. All Rights Reserved (for Class A1). 2. Source: HSBC Institutional Trust Services (Asia) Limited and Bloomberg, in USD, NAV to NAV, with dividend reinvested. Performance data is net of all fees. 3. The Manager currently intends to make monthly dividend distribution in respect of the A2 MDis Classes; actual dividend payout will be subject to the Manager’s discretion. For A1 Class units, Manager will review dividend distribution at its discretion once a year (last dividend payout date: 21 Nov 2005). Please refer to the explanatory memorandum for more details. 4. The fund may invest in financial derivative instruments (“FDI”) for hedging purposes. In adverse situations, the fund’s use of FDI may become ineffective in hedging and the fund may suffer significant losses. Each hedged share class will hedge the fund’s base currency back to its currency of denomination on a best efforts basis. However, the volatility of the hedged classes measured in the fund’s base currency may be higher than that of the equivalent class denominated in the fund’s base currency. Risks associated with FDI include counterparty risk, credit risk and liquidity risk. Such exposure may lead to a high risk of capital loss. The AUD/CAD/NZD Hedged Classes are not recommended for investors whose base currency of investment is not in the aforesaid currencies. 5. The receiving bank may charge a fee for incoming payments. Such fees will reduce the actual amount of dividends received by the investor. 6. Annualized yield of Class A2 MDis is calculated as follows: (dividend amount/NAV as of ex-dividend date) x 12. Investors should note that yield figures are estimated and for reference only and do not represent the performance of the fund, and that there is no guarantee as to the actual frequency and/or amount of dividend payments. 7. Investors should note that the base currency of the fund is in USD. The HKD equivalent NAV per unit is for reference only and should not be used for subscription or redemption purpose. Conversion to the base currency of the fund will normally take place at the prevailing rate (as determined by the fund’s Trustee or Custodian) on the corresponding fund dealing day. Investors should be aware of possible risks resulting from fluctuations of exchange rates against USD. 8. Classification is based on Global Industry Classification Standard (GICS). 9. Exposure refers to net exposure (long exposure minus short exposure). Due to rounding, percentages shown may not add up to 100%. 10. Cash refers to net cash on hand excluding cash for collaterals and margins. 11. The profile is based on market consensus forecast as derived from S&P Capital IQ and Bloomberg. Note that the manager’s internal estimates may differ significantly from S&P Capital IQ and Bloomberg estimates. Investors should note that all yield figures are for reference only and do not represent the actual performance of the fund or the dividend yield received by investors, nor does a positive yield imply a positive return. “Dividend yield” is calculated based on the equity portion of the fund, whereas “Yield to maturity/put” is calculated based on the debt portion of the fund by taking the average of yields of individual holdings (being the higher of the yield to maturity and yield to put of each bond/convertible bond) after excluding event-driven investment with extremely high yield. 12. Performance fee will only be charged if the NAV at the end of the financial year or upon realization of units exceeds the “high watermark”, which is the all-time year-end high of the fund’s NAV. If in any one year, the fund suffers a loss, no performance fee can be charged in subsequent years until the loss is recovered fully (the high-on-high principle). 13. Based on data as of year-end 2013. 14. The 2014 Morningstar award was based on data of eligible funds in their respective Morningstar category up to 31 Dec 2013. 15. Based on data as of 30 Sep 2013. Investors should note investment involves risk. The price of units may go down as well as up and past performance is not indicative of future results. Investors should read the explanatory memorandum for details and risk factors in particular those associated with investment in emerging markets. Information in this report has been obtained from sources believed to be reliable but Value Partners Limited does not guarantee the accuracy or completeness of the information provided by third parties. This report has not been reviewed by the Securities and Futures Commission. Issuer: Value Partners Limited. HDF_Master_201410 Top 10 securities holdings 14 HHHH Morningstar RatingTM1 As at 31-10-2014 China Convergence Fund 31 October 2014 2 Pages A Sub-Fund of Value Partners Intelligent Funds NAV per unit: USD137.14 USD320.6 million Fund size: • Please pay particular attention to the risk of investment in China and other markets in the Asian region and in companies with medium or small capitalization. The value of the fund can be extremely volatile and could go down substantially within a short period of time. It is possible that the entire value of your investment could be lost. • The fund may also invest in derivatives which can involve material risks, e.g. counterparty default risk, insolvency or liquidity risk, and may expose the fund to significant losses. • You should not make investment decision on the basis of this material alone. Please read the explanatory memorandum for details and risk factors. Investment objective Performance update The fund aims to provide unitholders with long-term capital appreciation by investing primarily in A and B shares listed on the stock exchanges of Shanghai and Shenzhen, as well as H shares listed in Hong Kong. One month Year-to-date Note: On inception, in Jul 2000, the fund’s objective was to invest primarily in B shares. In Jul 2001, the mandate was extended to include H shares. In Mar 2005, the mandate was further extended to include China A shares. One year Performance since launch (with dividends reinvested) 2 Since launch % 1600 Three years Five years Annualized return Annualized volatility China Convergence Fund MSCI China Index 3 +1,271.4% 1200 2 China Convergence Fund +3.2% +7.0% +10.9% +17.8% +30.4% +1,271.4% +20.0% 26.1% MSCI China Index 3 +4.3% +5.1% +6.4% +25.5% +17.5% +166.4% +7.1% 27.5% Annualized return and volatility are calculated from inception on 14 Jul 2000. Volatility is a measure of the theoretical risk in terms of standard deviation; in general, the lower the number, the less risky the investment, and vice versa. 800 400 +166.4% 0 -200 2000 2002 2004 2006 2008 2010 2012 2014 Monthly performance from 1 Jan 2003 to 31 Oct 2014 Year Jan Feb Mar 2003 +9.5% +2.4% 2004 +2.4% +6.7% 2005 +1.9% 2006 2 Apr May Jun Jul Aug Sep Oct Nov Dec Annual +0.0% +1.1% +7.8% +4.1% +11.3% +4.5% +2.3% +14.5% +1.6% +9.0% +92.1% +1.0% -11.0% +1.3% -4.3% +1.0% -1.3% +5.7% -0.2% +3.7% -2.9% +0.8% +6.8% +1.3% +0.4% -4.0% -0.7% +0.7% -0.3% +1.0% -5.4% +0.9% +1.6% +3.9% +16.5% +4.8% +8.5% +3.6% +0.7% -2.3% -0.3% +1.8% +3.8% +5.5% +11.6% +11.5% +86.9% 2007 +3.5% +3.2% +3.8% +11.8% +8.0% +2.8% +11.7% +0.8% +7.6% +11.8% -12.5% -4.0% +56.6% 2008 -15.7% +7.4% -11.5% +9.2% -4.4% -12.3% -2.4% -8.8% -9.9% -15.6% +0.2% +10.2% -45.2% 2009 -3.0% -2.3% +12.4% +11.6% +17.9% +4.3% +11.9% -7.0% +4.6% +8.4% +6.8% +1.5% +87.1% 2010 -6.1% +2.4% +6.2% +2.3% -4.8% +1.6% +3.9% +1.6% +10.8% +4.5% +1.2% -2.6% +21.3% 2011 -3.2% -0.9% +4.8% +2.2% -2.5% -2.4% +1.5% -7.3% -19.4% +13.5% -7.6% -0.3% -22.4% 2012 +7.6% +6.6% -5.5% +1.0% -8.4% -3.8% -3.5% +0.6% +5.8% +2.7% +0.1% +7.4% +9.3% 2013 +7.5% -2.0% -2.9% -0.6% +2.7% -9.9% +3.5% +1.8% +2.2% +3.9% +5.6% -1.8% +9.2% 2014 (YTD) -5.6% +1.0% -3.6% -1.0% +1.2% +3.4% +8.8% +1.3% -1.2% +3.2% +7.0% 9th Floor, Nexxus Building, 41 Connaught Road Central, Hong Kong Tel : (852) 2880 9263 Fax : (852) 2565 7975 Email : [email protected] Website : www.valuepartners.com.hk 15 China Convergence Fund: A Sub-Fund of Value Partners Intelligent Funds 31 October 2014 Top 10 securities holdings Name Chongqing Changan Automobile Inner Mongolia Yili Industrial China Vanke (Stock code: 2202HK - H shares) China Vanke (Stock code: 000002CH - A shares) ZTE Corp. (Stock code: 763HK - H shares) Luye Pharma Portfolio characteristics 4 Industry Automobiles & components % 6.7 Food, beverage & tobacco Real estate 4.8 3.9 Real estate 3.4 Technology, hardware & equipment Pharmaceuticals, biotechnology & life sciences Techtronic Industries Consumer durables & apparel Sunac China Real estate Huadian Fuxin Energy Utilities ZTE Corp. Technology, hardware & (Stock code: 000063CH - A shares) equipment 3.3 2.8 2.6 2.4 2.2 2.1 These stocks constitute 34% of the fund. The top ten securities holdings only include companies and/ or REITs the fund invested, excluding any index tracking fund or ETF. Geographical exposure by listing 5 H Shares 34% China A Shares 29% Hong Kong 22% China B Shares 12% Red Chips Cash 6 8% -7% Sector exposure 4 5 Consumer discretionary 18% 15% Real estate 12% Utilities 11% Health care 10% Consumer staples 10% Information technology 10% Energy Materials Insurance Banks Other financials Cash 6 9% 4% 3% Fund facts Manager: Base currency: Trustee: Custodian: Launch date: Bloomberg and ISIN codes: Value Partners Limited USD Bank of Bermuda (Cayman) Limited HSBC Institutional Trust Services (Asia) Limited 14 Jul 2000 VAPAICB KY / KYG9317Q1047 Unit price is published daily in the South China Morning Post, the Hong Kong Economic Journal and the Hong Kong Economic Times. Fee structure USD10,000 Minimum subscription Minimum subsequent subscription Subscription fee Management fee Performance fee 8 Redemption fee Dealing day USD5,000 Up to 5% 1.25% p.a. 15% of profit (High-on-high principle) Nil Daily Value Partners Investment Team 2% Industrials 2015 7 11.8 times 1.8 times 3.1% Chairman & Co-Chief Investment Officer: Cheah Cheng Hye Deputy Chairman & Co-Chief Investment Officer: Louis So Deputy Chief Investment Officer: Renee Hung Senior Investment Director: Norman Ho, CFA Investment Directors: Eric Chow; Alan Wang, CFA; Senior Fund Managers: Doris Ho; Kyu Ho; Michelle Yu, CFA; Yu Xiao Bo Recent awards Morningstar 2010 Fund Awards (Hong Kong) – Best Greater China Equity Fund ~ Morningstar Top 100 Funds of the Year 2010 – China Equity 9 ~ Benchmark Magazine 2% 2% -7% 1. © 2014 Morningstar, Inc. All Rights Reserved. 2. Source: HSBC Institutional Trust Services (Asia) Limited and Bloomberg, in USD, NAV to NAV, with dividends reinvested. Performance data is net of all fees. 3. Starting from Jul 2009, the MSCI China Index will be used as the reference index for the entire history of the fund. Hang Seng H Shares Index, Shanghai Composite Index and Shenzhen Composite Index were no longer shown for comparison. 4. Classification is based on Global Industry Classification Standard (GICS). 5. Exposure refers to net exposure (long exposure minus short exposure). Due to rounding, percentages shown may not add up to 100%. 6. Cash refers to net cash on hand excluding cash for collaterals and margins. 7. The profile is based on market consensus forecast as derived from S&P Capital IQ and Bloomberg. Note that the manager’s internal estimates may differ significantly from S&P Capital IQ and Bloomberg estimates. 8. Performance fee will only be charged if the NAV at the end of the financial year or upon realization of units exceeds the “high watermark”, which is the all-time year-end high of the fund’s NAV. If in any one year, the fund suffers a loss, no performance fee can be charged in subsequent years until the loss is recovered fully (the high-on-high principle). 9. Based on fund size, track record, Morningstar’s Star rating and one year absolute ranking as at month end Oct 2010. Investors should note investment involves risk. The price of units may go down as well as up and past performance is not indicative of future results. Investors should read the explanatory memorandum for details and risk factors in particular those associated with investment in emerging markets. Information in this report has been obtained from sources believed to be reliable but Value Partners Limited does not guarantee the accuracy or completeness of the information provided by third parties. This report has not been reviewed by the Securities and Futures Commission. Issuer: Value Partners Limited. CCF_Master_201410 Singapore As at 31 Oct 2014 Price/earnings ratio Price/book ratio Dividend yield 16 HHHH Morningstar RatingTM1 As at 31-10-2014 Chinese Mainland Focus Fund 31 October 2014 2 Pages A Sub-Fund of Value Partners Intelligent Funds NAV per unit: USD37.46 USD134.5 million Fund size: • Please pay particular attention to the risk of investment in China and other markets in the Asian region and in companies with medium or small capitalization. The value of the fund can be extremely volatile and could go down substantially within a short period of time. It is possible that the entire value of your investment could be lost. • The fund may also invest in derivatives which can involve material risks, e.g. counterparty default risk, insolvency or liquidity risk, and may expose the fund to significant losses. • You should not make investment decision on the basis of this material alone. Please read the explanatory memorandum for details and risk factors. Performance update Investment objective The fund aims to achieve medium to long-term capital appreciation by investing primarily in investments which are related to the Mainland of the People’s Republic of China (“PRC”) and investments whose value the Manager believes would be boosted by a Renminbi (“RMB”) appreciation. The Manager will also invest in investments whose value the Manager believes would increase even if the RMB exchange rate remains unchanged. Performance since launch (with dividends reinvested) 2 % 500 One month Chinese Mainland Focus Fund +2.8% MSCI China Index 3 +4.3% Year-to-date +2.0% +5.1% One year +4.2% +6.4% Three years +14.3% +25.5% Five years +36.3% +17.5% Since launch +274.6% +305.6% Annualized return +12.9% +13.7% Annualized volatility 21.9% 27.2% Annualized return and volatility are calculated from inception on 27 Nov 2003. Volatility is a measure of the theoretical risk in terms of standard deviation; in general, the lower the number, the less risky the investment, and vice versa. Chinese Mainland Focus Fund MSCI China Index 3 600 2 400 +305.6% +274.6% 300 200 100 0 2003 2005 2006 2007 2008 2009 2010 2011 2012 2013 2014 Monthly performance from 27 Nov 2003 to 31 Oct 2014 Year Jan Feb Mar Apr May Jun 2 Jul Aug Sep Oct Nov Dec Annual +3.9% 2003 N/A N/A N/A N/A N/A N/A N/A N/A N/A N/A N/A +3.9% 2004 +5.5% +7.6% -0.3% -11.3% +0.7% -3.4% +1.9% -1.4% +4.6% +1.4% +6.0% -1.7% +8.4% 2005 +1.6% +4.9% -3.3% +0.7% -2.6% +1.6% +1.6% +0.5% +1.8% -3.0% +4.5% +3.3% +11.6% 2006 +12.3% +2.8% +7.9% +2.0% -5.1% -0.6% +0.6% +1.3% +1.6% +4.4% +7.6% +6.3% +48.1% 2007 +1.5% +3.7% +4.4% +5.3% +5.0% +3.3% +15.8% -3.1% +8.6% +12.9% -8.7% -0.9% +56.0% 2008 -17.5% +5.7% -10.1% +10.1% -2.9% -11.0% -2.7% -7.8% -9.9% -16.2% -0.5% +9.9% -44.8% 2009 -3.2% -2.1% +11.8% +11.4% +17.7% +3.4% +12.3% -7.1% +5.2% +8.8% +6.7% +1.8% +86.0% 2010 -5.7% +1.9% +6.5% +2.8% -4.7% +1.5% +4.9% +1.7% +10.6% +6.4% -1.1% -2.0% +23.9% 2011 -2.5% -0.9% +4.8% +3.4% -1.2% -2.2% +1.8% -7.6% -19.5% +15.6% -7.8% +0.6% -17.8% 2012 +6.7% +6.8% -5.7% +1.4% -8.6% -3.5% -2.7% +0.7% +5.5% +4.5% +1.4% +6.0% +11.6% 2013 +8.1% -3.2% -3.3% -0.1% +0.4% -8.8% +2.4% +4.5% +2.9% +4.1% +4.5% -2.3% +8.3% 2014 (YTD) -5.7% -1.7% -2.4% -1.8% +1.4% +4.0% +7.7% +0.4% -2.0% +2.8% +2.0% 9th Floor, Nexxus Building, 41 Connaught Road Central, Hong Kong Tel : (852) 2880 9263 Fax : (852) 2565 7975 Email : [email protected] Website : www.valuepartners.com.hk 17 Chinese Mainland Focus Fund: A Sub-Fund of Value Partners Intelligent Funds 31 October 2014 Top 10 securities holdings Luye Pharma Industry 4 Automobiles & components % 6.8 Food, beverage & tobacco Real estate 5.0 4.8 Consumer durables & apparel Transportation Insurance Real estate 4.5 4.2 4.2 4.0 Materials Pharmaceuticals, biotechnology & life sciences Pharmaceuticals, biotechnology & life sciences 3.6 3.5 3.1 These stocks constitute 44% of the fund. The top ten securities holdings only include companies and/ or REITs the fund invested, excluding any index tracking fund or ETF. Geographical exposure by listing 5 China A Shares 34% H Shares 27% Hong Kong 21% China B Shares 13% Red Chips Others Cash 6 Fund facts Manager: Base currency: Trustee: Custodian: Launch date: Bloomberg and ISIN codes: Value Partners Limited USD Bank of Bermuda (Cayman) Limited HSBC Institutional Trust Services (Asia) Limited 27 Nov 2003 VAPAICM KY / KYG9317Q1120 Unit price is published daily in the South China Morning Post, the Hong Kong Economic Journal and the Hong Kong Economic Times. Fee structure Minimum subscription Minimum subsequent subscription Subscription fee Management fee Performance fee 8 USD10,000 USD5,000 Up to 5% 1.25% p.a. 15% of profit (High-on-high principle) Nil Daily 5% 2% Value Partners Investment Team -8% Sector exposure 4 5 Consumer discretionary 20% Health care 14% Real estate 13% Industrials 10% Utilities 10% Information technology 10% Consumer staples 9% Energy 7% Materials 6% Insurance 6% Banks 2015 7 11.2 times 1.8 times 3.6% Redemption fee Dealing day 7% United States As at 31 Oct 2014 Price/earnings ratio Price/book ratio Dividend yield 2% Others 1% Cash 6 -8% Chairman & Co-Chief Investment Officer: Cheah Cheng Hye Deputy Chairman & Co-Chief Investment Officer: Louis So Deputy Chief Investment Officer: Renee Hung Senior Investment Director: Norman Ho, CFA Investment Directors: Eric Chow; Alan Wang, CFA Senior Fund Managers: Doris Ho; Kyu Ho; Michelle Yu, CFA; Yu Xiao Bo Recent awards Lipper Fund Awards 2013 (Hong Kong) Best China Equity Fund (5 Years) 9 ~ Lipper Lipper Fund Awards 2012 (Hong Kong) Best China Equity Fund (3 Years) 10 ~ Lipper Top 100 Funds of the Year 2010 – China Equity – Best in Class 11 ~ Benchmark Magazine 1. © 2014 Morningstar, Inc. All Rights Reserved. 2. Source: HSBC Institutional Trust Services (Asia) Limited and Bloomberg, in USD, NAV to NAV, with dividends reinvested. Performance data is net of all fees. 3. Starting from Jul 2009, the MSCI China Index will be used as the reference index for the entire history of the fund. Hang Seng H Shares Index, Shanghai Composite Index and Shenzhen Composite Index were no longer shown for comparison. 4. Classification is based on Global Industry Classification Standard (GICS). 5. Exposure refers to net exposure (long exposure minus short exposure). Due to rounding, percentages shown may not add up to 100%. 6. Cash refers to net cash on hand excluding cash for collaterals and margins. 7. The profile is based on market consensus forecast as derived from S&P Capital IQ and Bloomberg. Note that the manager’s internal estimates may differ significantly from S&P Capital IQ and Bloomberg estimates. 8. Performance fee will only be charged if the NAV at the end of the financial year or upon realization of units exceeds the “high watermark”, which is the all-time year-end high of the fund’s NAV. If in any one year, the fund suffers a loss, no performance fee can be charged in subsequent years until the loss is recovered fully (the high-on-high principle). 9. Based on data as of yearend 2012. 10. Based on data as of year-end 2011. 11. Based on fund size, track record, Morningstar’s Star rating and one year absolute ranking as at month end Oct 2010. Investors should note investment involves risk. The price of units may go down as well as up and past performance is not indicative of future results. Investors should read the explanatory memorandum for details and risk factors in particular those associated with investment in emerging markets. Information in this report has been obtained from sources believed to be reliable but Value Partners Limited does not guarantee the accuracy or completeness of the information provided by third parties. This report has not been reviewed by the Securities and Futures Commission. Issuer: Value Partners Limited. CMF_Master_201410 Name Chongqing Changan Automobile Inner Mongolia Yili Industrial China Vanke (Stock code: 000002CH - A shares) Midea Group Daqin Railway Ping An Insurance China Vanke (Stock code: 2202HK - H shares) Anhui Conch Cement Tasly Pharmaceutical Portfolio characteristics 18 HHHH Morningstar RatingTM1 As at 31-10-2014 Value Partners China Greenchip Fund Limited 31 October 2014 2 Pages NAV per share: Class A - HKD60.79 Class A2 QDis - HKD11.33 USD643.8 million (HKD4,995.7 million) Fund size: CIES Eligible* • Please pay particular attention to the risk of investment in China and other markets in the Asian region and in companies with medium or small capitalization. The value of the fund can be extremely volatile and could go down substantially within a short period of time. It is possible that the entire value of your investment could be lost. • The fund may also invest in derivatives which can involve material risks, e.g. counterparty default risk, insolvency or liquidity risk, and may expose the fund to significant losses. • You should not make investment decision on the basis of this material alone. Please read the explanatory memorandum for details and risk factors. Performance update Investment objective The fund aims to achieve medium-term capital growth by means of investing in companies established in Greater China or which derive a majority of their revenue from business related to Greater China, whether in the form of direct investment in, or trade with, Greater China. This includes companies incorporated and/or listed outside Greater China. One month Year-to-date One year Three years Five years Since launch Annualized return Annualized volatility Performance since launch (with dividends reinvested) 2 % Value Partners China Greenchip Fund Limited Hang Seng Index 3 MSCI China Index 900 700 +507.9%# +464.1% 500 300 +210.9% 100 Class A (HKD) +0.6% +2.2% +7.5% +40.4% +67.0% +507.9%# +15.4%# 22.1%# MSCI China Hang Seng Class A2 Index Index 3 QDis (HKD) +4.2% +4.8% +0.6% +5.1% +7.1% +1.8% +6.4% +7.7% +7.0% +30.3% +41.1% N/A +17.5% +31.5% N/A +464.1% +210.9% +15.7% +14.7% +9.4% +12.1% 25.6% 20.4% N/A Annualized return and volatility are calculated from inception on 8 Apr 2002. Volatility is a measure of the theoretical risk in terms of standard deviation; in general, the lower the number, the less risky the investment, and vice versa. # Investors should note that figures for Non-Redeemable Class N shares shown above may differ from those of classes currently available for subscription (namely Class A and Class A2 QDis), due to differences in launch date of these classes. For Class A, the since launch return, annualized return and annualized volatility are +72.0%, +7.4% and 25.4% respectively. NAVs & codes 0 -100 2002 2 Classes 7 Class A HKD Class A USD Class A AUD Hedged Class A CAD Hedged Class A NZD Hedged Class A2 QDis HKD 2003 2004 2005 2006 2007 2008 2009 2010 2011 2012 2013 2014 Dividend information – Class A2 QDis 4 Ex-dividend date 30-9-2014 30-6-2014 31-3-2014 31-12-2013 30-9-2013 Ex-dividend date Dividend per unit 5 NAV (HKD) (HKD) 11.26 0.0565 11.34 0.0550 11.00 0.0388 11.28 0.0388 10.28 0.0388 Annualized yield 6 2.0% 1.9% 1.4% 1.4% 1.5% NAV 60.79 10.24 10.33 10.31 10.31 11.33 ISIN KYG9317M1033 KYG9317M1603 KYG9317M1371 KYG9317M1454 KYG9317M1520 KYG9317M1116 Bloomberg VPCHIGC KY VPCHAUS KY VPCHAAH KY VPCHACH KY VPCHANH KY VPCA2QD KY Value Partners China Greenchip Fund Limited – Class A (HKD): Monthly performance from 1 Jan 2003 to 31 Oct 2014 2 Year 2003 2004 2005 2006 2007 2008 2009 2010 2011 2012 2013 2014 (YTD) Jan +7.3% +1.4% +1.2% +10.7% +3.1% -18.6% +0.2% -1.3% -2.6% +6.0% +6.4% -3.0% Feb +7.1% +6.3% +4.2% +4.0% +4.8% +1.4% -0.2% +3.0% -2.9% +10.5% +0.0% +4.0% Mar -3.5% -1.2% -2.7% +9.2% +3.8% -9.6% +10.2% +8.1% +4.0% -3.9% -2.2% -2.6% Apr -1.5% -8.7% -1.1% +0.5% +4.7% +10.2% +13.1% +4.2% +2.7% -2.4% +1.2% -1.2% May +10.9% -1.1% -1.4% -3.7% +9.6% -2.2% +25.0% -5.4% -2.5% -4.6% +3.3% +1.9% Jun +5.9% -2.8% +1.6% -1.6% +5.7% -11.8% +1.9% +0.9% -5.0% -3.2% -8.9% +2.9% Jul +12.7% +0.8% +1.1% +1.9% +9.7% -5.7% +14.0% +4.2% +5.1% -0.5% +1.8% +1.1% Aug +6.2% -0.3% +0.0% +1.4% -9.1% -10.0% -4.8% +1.7% -10.5% +3.7% +1.7% +0.6% Sep +2.2% +3.7% +11.0% +1.4% +3.6% -12.1% +6.9% +13.4% -17.2% +6.3% +3.0% -1.8% Oct +9.5% +0.6% -3.2% +3.7% +5.8% -26.1% +7.9% +4.2% +8.8% +3.1% +4.8% +0.6% Nov +3.0% +5.4% +3.6% +6.7% -7.4% +0.8% +6.2% +1.3% -3.4% +4.9% +4.5% Dec +5.0% -1.6% +1.5% +3.6% -1.0% +7.8% +2.5% -0.5% -2.1% +3.7% +0.7% Annual +85.6% +1.5% +16.1% +43.7% +36.3% -57.4% +116.7% +37.8% -25.0% +24.8% +16.5% +2.2% 9th Floor, Nexxus Building, 41 Connaught Road Central, Hong Kong Tel : (852) 2880 9263 Fax : (852) 2565 7975 Email : [email protected] Website : www.valuepartners.com.hk 19 Value Partners China Greenchip Fund Limited 31 October 2014 Top 10 securities holdings (as at 29 Aug 2014) CNOOC Perfect Shape PRC Holdings Texwinca Holdings ENN Energy Ju Teng International Techtronic Industries Industry 8 Automobiles & components % 5.7 Banks Technology, hardware & equipment Pharmaceuticals, biotechnology & life sciences Energy Consumer services Consumer durables & apparel Utilities Technology, hardware & equipment Consumer durables & apparel 3.8 3.5 3.1 2.8 2.6 2.6 2.4 2.4 2.4 These stocks constitute 31% of the fund. The top ten securities holdings only include companies and/ or REITs the fund invested, excluding any index tracking fund or ETF. Geographical exposure by listing 9 Hong Kong 46% H Shares 13% Taiwan China B Shares 10% 7% China A Shares 4% South Korea 3% Cash 10 2% Others 1% 2015 11 12.5 times 2.0 times 3.6% Fund facts Manager: Base currency: Administrator: Custodian: Launch date: Dividend policy 4: Value Partners Limited HKD Bank of Bermuda (Cayman) Limited HSBC Institutional Trust Services (Asia) Limited Class N - 8 Apr 2002 (Closed) Class A - 27 Mar 2007 Class A2 QDis - 22 Jul 2013 Class A (AUD / CAD / NZD / USD) - 26 May 2014 Class A2 QDis - aim at quarterly distribution, subject to Manager’s discretion Other Classes - N/A Unit price is published daily in the South China Morning Post and the Hong Kong Economic Times. Fee structure (Class A and Class A2 QDis) Minimum subscription Minimum subsequent subscription Subscription fee Management fee Performance fee 13 Redemption fee Dealing day 15% Red Chips As at 31 Oct 2014 Price/earnings ratio Price/book ratio Dividend yield HKD80,000 or equivalent 12 HKD40,000 or equivalent 12 Up to 5% 1.5% p.a. 15% of profit (High-on-high principle) Nil Daily Value Partners Investment Team Sector exposure 8 9 9% Chairman & Co-Chief Investment Officer: Cheah Cheng Hye Deputy Chairman & Co-Chief Investment Officer: Louis So Deputy Chief Investment Officer: Renee Hung Senior Investment Director: Norman Ho, CFA Investment Directors: Eric Chow; Alan Wang, CFA Senior Fund Managers: Doris Ho; Kyu Ho; Michelle Yu, CFA; Yu Xiao Bo Utilities 8% Banks 7% Recent awards Consumer discretionary 30% Information technology 13% Health care 10% Industrials Energy 5% Consumer staples 5% Insurance 4% Telecom services 2% Real estate 2% Cash 10 2% Other financials 2% Materials 2% Lipper Fund Awards 2014 (Hong Kong) Best Greater China Equity Fund (5 Years) 14 ~ Lipper Lipper Fund Awards 2013 (Hong Kong) Best Greater China Equity Fund (5 Years) 15 ~ Lipper Lipper Fund Awards 2012 (Hong Kong) Best Greater China Equity Fund (3 Years) 16 ~ Lipper * Value Partners China Greenchip Fund Limited is one of the eligible collective investment schemes for the purpose of the Hong Kong Capital Investment Entrant Scheme (CIES). 1. © 2014 Morningstar, Inc. All Rights Reserved. 2. Unless otherwise specified, fund performance shown in this document refers to the returns on Non-Redeemable Class N shares, which was launched on 8 Apr 2002. Source: HSBC Institutional Trust Services (Asia) Limited and Bloomberg, in HKD, NAV to NAV, with dividends reinvested. Non-Redeemable Class N shares of the fund are closed for subscription from 26 Mar 2007; existing and new investors may subscribe for/redeem Class A or A2 QDis shares. 3. Index refers to Hang Seng Price Return Index up to 31 Dec 2004, thereafter it is the Hang Seng Total Return Index. Hang Seng Total Return Index includes dividend reinvestment whereas Hang Seng Price Return Index does not take into account reinvestment of dividends. 4. The Manager currently intends to make quarterly dividend distribution in respect of the A2 QDis Class; actual dividend payout will be subject to the Manager’s discretion. 5. The receiving bank may charge a fee for incoming payments. Such fees will reduce the actual amount of dividends received by the investor. 6. Annualized yield of Class A2 QDis is calculated as follows: (dividend amount/NAV as of ex-dividend date) x 4. Investors should note that yield figures are estimated and for reference only and do not represent the performance of the fund, and that there is no guarantee as to the actual frequency and/or amount of dividend payments. 7. The fund may invest in financial derivative instruments (“FDI”) for hedging purposes. In adverse situations, the fund’s use of FDI may become ineffective in hedging and the fund may suffer significant losses. Each hedged share class will hedge the fund’s base currency back to its currency of denomination on a best efforts basis. However, the volatility of the hedged classes measured in the fund’s base currency may be higher than that of the equivalent class denominated in the fund’s base currency. Risks associated with FDI include counterparty risk, credit risk and liquidity risk. Such exposure may lead to a high risk of capital loss. The AUD/CAD/NZD Hedged Classes are not recommended for investors whose base currency of investment is not in the aforesaid currencies. 8. Classification is based on Global Industry Classification Standard (GICS). 9. Exposure refers to net exposure (long exposure minus short exposure). Due to rounding, percentages shown may not add up to 100%. 10. Cash refers to net cash on hand excluding cash for collaterals and margins. 11. The profile is based on market consensus forecast as derived from S&P Capital IQ and Bloomberg. Note that the manager’s internal estimates may differ significantly from S&P Capital IQ and Bloomberg estimates. 12. Investors should note that the base currency of the fund is in HKD. Conversion to the base currency of the fund will normally take place at the prevailing rate (as determined by the fund’s Trustee or Custodian) on the corresponding fund dealing day. Investors should be aware of possible risks resulting from fluctuations of exchange rates against USD/AUD/CAD/NZD. 13. Performance fee will only be charged if the NAV at the end of the financial year or upon realization of units exceeds the “high watermark”, which is the all-time year-end high of the fund’s NAV. If in any one year, the fund suffers a loss, no performance fee can be charged in subsequent years until the loss is recovered fully (the high-on-high principle).14. Based on data as of year-end 2013. 15. Based on data as of year-end 2012. 16. Based on data as of year-end 2011. Investors should note investment involves risk. The price of shares may go down as well as up and past performance is not indicative of future results. Investors should read the explanatory memorandum for details and risk factors in particular those associated with investment in emerging markets. Information in this report has been obtained from sources believed to be reliable but Value Partners Limited does not guarantee the accuracy or completeness of the information provided by third parties. This report has not been reviewed by the SFC. Issuer: Value Partners Limited. CG_Master_201410 Name Chongqing Changan Automobile Bank of China TCL Communication Technology Sihuan Pharmaceutical Portfolio characteristics 20 HHHH Morningstar RatingTM1 As at 31-10-2014 31 October 2014 Value Partners Taiwan Fund 2 Pages NAV per unit: USD15.65 USD63.8 million Fund size: • Please pay particular attention to the risk of investment in China and other markets in the Asian region and in companies with medium or small capitalization. The value of the fund can be extremely volatile and could go down substantially within a short period of time. It is possible that the entire value of your investment could be lost. • The fund may also invest in derivatives which can involve material risks, e.g. counterparty default risk, insolvency or liquidity risk, and may expose the fund to significant losses. • You should not make investment decision on the basis of this material alone. Please read the explanatory memorandum for details and risk factors. Performance update Investment objective The fund aims to achieve long term capital growth through primarily investing in equity and equity linked securities of companies that are listed on (a) the Taiwan Stock Exchange; or (b) the GRE Tai Securities Market; or (c) any stock exchange but which have their main operations or majority of assets in or derive the majority of their income from Taiwan. This includes companies incorporated and/or quoted outside Taiwan. Performance since launch (with dividends reinvested) 2 % Value Partners Taiwan Fund Taiwan Stock Exchange Index MSCI Taiwan Index 80 60 +56.5% 2 Value Partners Taiwan Stock MSCI Taiwan Taiwan Fund Exchange Index Index (USD) (USD) (USD) One month -2.4% +0.1% +2.5% Year-to-date +3.6% +5.2% +10.2% One year +6.5% +5.7% +10.1% Three years +38.0% +29.8% +32.8% Since launch +56.5% +39.6% +26.2% Annualized return +6.9% +5.1% +3.6% Annualized volatility 21.0% 27.5% 27.3% Annualized return and volatility are calculated from inception on 3 Mar 2008. Volatility is a measure of the theoretical risk in terms of standard deviation; in general, the lower the number, the less risky the investment, and vice versa. +39.6% +26.2% 40 20 0 -20 -40 -60 2008 2009 2010 2011 2012 2013 2014 Monthly performance from 3 Mar 2008 to 31 Oct 2014 2 Year Jan Feb Mar Apr May Jun Jul Aug Sep Oct Nov Dec 2008 N/A N/A +4.5% +1.0% -0.2% -5.9% -5.0% -6.2% -11.9% -25.3% +6.2% +4.2% Annual -35.7% 2009 -4.4% -1.3% +12.0% +1.6% +17.9% -3.4% +7.9% -2.2% +11.4% +2.1% +3.8% +3.7% +58.0% 2010 -5.4% -0.1% +6.5% +4.6% -10.6% +1.7% +5.7% +1.3% +6.3% +1.4% +1.1% +6.9% +19.2% 2011 +2.5% -3.5% +0.9% +8.0% -1.4% -0.5% +7.2% -10.3% -12.9% +5.7% -7.8% +0.8% -13.0% 2012 +4.5% +11.5% +0.1% -4.0% -2.7% +0.3% +2.9% +5.1% +5.4% -4.1% +4.1% +1.5% +26.1% 2013 +0.5% -0.2% +0.5% +3.7% -0.6% -3.6% +3.1% +1.1% +2.1% +4.0% +1.3% +1.4% +13.7% 2014 (YTD) +0.5% +5.1% +2.6% -1.6% +3.3% +2.2% -1.2% +1.1% -5.5% -2.4% +3.6% 9th Floor, Nexxus Building, 41 Connaught Road Central, Hong Kong Tel : (852) 2880 9263 Fax : (852) 2565 7975 Email : [email protected] Website : www.valuepartners.com.hk 21 Value Partners Taiwan Fund 31 October 2014 Top 5 securities holdings Name Taiwan Semiconductor Manufacturing Far Eastern Department Stores Chicony Power Technology Quanta Computer King’s Town Bank Portfolio characteristics Industry 3 Semiconductors & semiconductor equipment Retailing 4.5 Capital goods 4.4 Technology, hardware & equipment Banks 3.6 % 9.1 3.6 These stocks constitute 25% of the fund. The top five securities holdings only include companies and/ or REITs the fund invested, excluding any index tracking fund or ETF. Geographical exposure by listing 4 Taiwan Cash 5 94% 6% Sector exposure 3 4 As at 31 Oct 2014 Price/earnings ratio 2015 6 11.7 times Price/book ratio 2.0 times Dividend yield 5.3% Fund facts Manager: Base currency: Trustee: Custodian: Launch date: Bloomberg and ISIN codes: Value Partners Hong Kong Limited USD Bank of Bermuda (Cayman) Limited HSBC Institutional Trust Services (Asia) Limited 3 Mar 2008 VTAIWAN KY / KYG9318Y1061 Unit price is published daily in the South China Morning Post, the Hong Kong Economic Journal and the Hong Kong Economic Times. Fee structure Information technology 48% 6% Minimum subscription Minimum subsequent subscription Subscription fee Consumer staples 5% Management fee 1.25% p.a. Banks 5% Performance fee 7 15% of profit (High-on-high principle) Insurance 4% Redemption fee Dealing day Consumer discretionary 12% Industrials 11% Cash 5 Materials 3% Health care 3% Other financials 3% US$10,000 US$5,000 Up to 5% Nil Daily Value Partners Investment Team 1. © 2014 Morningstar, Inc. All Rights Reserved. 2. Source: HSBC Institutional Trust Services (Asia) Limited and Bloomberg, in USD, NAV to NAV, with dividends reinvested. Performance data is net of all fees. 3. Classification is based on Global Industry Classification Standard (GICS). 4. Exposure refers to net exposure (long exposure minus short exposure). Due to rounding, percentages shown may not add up to 100%. 5. Cash refers to net cash on hand excluding cash for collaterals and margins. 6. The profile is based on market consensus forecast as derived from S&P Capital IQ and Bloomberg. Note that the manager’s internal estimates may differ significantly from S&P Capital IQ and Bloomberg estimates. 7. Performance fee will only be charged if the NAV at the end of the financial year or upon realization of units exceeds the “high watermark”, which is the all-time year-end high of the fund’s NAV. If in any one year, the fund suffers a loss, no performance fee can be charged in subsequent years until the loss is recovered fully (the high-on-high principle). Investors should note investment involves risk. The price of units may go down as well as up and past performance is not indicative of future results. Investors should read the explanatory memorandum for details and risk factors in particular those associated with investment in emerging markets. Information in this report has been obtained from sources believed to be reliable but Value Partners Hong Kong Limited does not guarantee the accuracy or completeness of the information provided by third parties. This report has not been reviewed by the Securities and Futures Commission. Issuer: Value Partners Hong Kong Limited. TW_Master_201410 Chairman & Co-Chief Investment Officer: Cheah Cheng Hye Deputy Chairman & Co-Chief Investment Officer: Louis So Deputy Chief Investment Officer: Renee Hung Senior Investment Director: Norman Ho, CFA Investment Directors: Eric Chow; Alan Wang, CFA Senior Fund Managers: Doris Ho; Kyu Ho; Michelle Yu, CFA; Yu Xiao Bo 22 31 October 2014 Value Partners Greater China High Yield Income Fund 2 Pages NAV per unit: USD11.92 (P Acc USD) / USD9.41 (P MDis USD) USD1,044.5 million Fund size: • Please pay attention to the risks associated with the Fund, particularly the risk of investment in China and other markets in the Asian region and in companies with medium or small capitalization. The value of the Fund can be extremely volatile and could go down substantially within a short period of time. It is possible that the entire value of your investment could be lost. • Investors should note that there is no guarantee that the underlying securities in the Fund will pay out dividends. Therefore, there is no guarantee that the Fund’s investment strategies will succeed. There is also no guarantee of dividend or distribution payments during the period an investor holds units in the Fund, and a positive dividend yield does not represent/imply positive return. • The Fund may invest in debt securities that are below investment grade and/or issued by special purpose vehicles and may involve greater risks, including credit risk, issuer-specific risk or counterparty risk. The Fund may also invest in derivatives and structured products which can involve material risks, e.g. counterparty default risk or insolvency, and may expose the Fund to significant losses. • You should not make investment decision on the basis of this marketing material alone. Please read the Explanatory Memorandum for details and risk factors. Investment objective To provide capital appreciation to investors through primarily investing in Greater China debt securities including but not limited to high yield, convertible, and mainland Chinese offshore bonds. Commentary Portfolio Review: In October, the market saw the ending of US quantitative easing (QE) just when Japan announced an expansion of its own QE. Upon Japan’s action, the market received a boost in risk appetite and both stocks and bonds rallied strongly, reversing some of the losses that have been accumulated from the September selloff. The US dollar once again strengthened against all major currencies while the US Treasury gave up some of the flight-to-safety gains made in September. During the month, we took advantage of the rally to take profit on some property and industrial names, while adding to laggards as well as names that suffered temporary dislocation in valuations. We were also active in trading the primary market and finding values in the convertible markets. Outlook: As we enter the last two trading months of the year, we expect liquidity will likely dwindle towards December. In terms of valuation, we see values are more abundant in the China high-yield space than in other Asian high-yield credits. We expect overall trading technicals of Asian credits to remain supportive. Therefore, occasional market disruption as a result of temporary negative headlines will likely present opportunities for acquiring good credits at attractive prices. Performance since launch (with dividends reinvested) 1 % 30 Value Partners Greater China High Yield Income Fund (P Acc USD) +19.2% 20 10 0 -10 3/2012 10/2012 2/2013 6/2013 Performance update The Fund (P Acc USD) One month +0.8% 10/2013 2/2014 6/2014 10/2014 1 Three Six months months -0.5% +4.2% One year Since launch +5.4% +19.2% Calendar year performance 1 The Fund (P Acc USD) 2014 (YTD) 2013 2012 (Since launch) +4.3% +1.2% +13.0% Top 10 securities holdings Name Times Property 12.625% 03/21/2019 Kaisa Group 10.25% 01/08/2020 Sumitomo Mitsui 10.231% Perpetual CIFI Holdings 12.25% 04/15/2018 Sunac 9.375% 04/05/2018 Shui On Development 10.125% Perpetual KWG Property 13.25% 03/22/2017 China SCE Property 11.5% 11/14/2017 Caifu Holdings 8.75% 01/24/2020 Shenzhou International 0.5% 06/18/2019 CB Sector 2 Real estate Real estate Banks Real estate Real estate Real estate Real estate Real estate Diversified financials Consumer durables & apparel Country China/ Hong Kong China/ Hong Kong Japan % 2.3 China/ Hong Kong China/ Hong Kong China/ Hong Kong China/ Hong Kong China/ Hong Kong China/ Hong Kong China/ Hong Kong 1.9 2.2 2.0 1.8 1.7 1.7 1.6 1.6 1.6 1. Source: HSBC Institutional Trust Services (Asia) Limited, in USD, NAV to NAV, with dividends reinvested. Performance data is net of all fees. 2. Classification is based on Global Industry Classification Standard (GICS). 9th Floor, Nexxus Building, 41 Connaught Road Central, Hong Kong Tel: (852) 2880 9263 Fax: (852) 2565 7975 Email: [email protected] Website: www.valuepartners.com.hk 23 Value Partners Greater China High Yield Income Fund 31 October 2014 Sector exposure 2 3 Dividend information – Class MDis 7 Real estate Banks Others Energy Diversified financials Cash 4 Consumer durables & apparel Software & services Commercial & professional services Materials Retailing Average duration Yield to Maturity 5 Number of bond issuers 47.5% 10.6% 9.3% 6.8% 5.2% 5.0% 4.0% 3.9% 2.8% 2.6% 2.4% P MDis USD P MDis HKD A MDis AUD Hedged A MDis CAD Hedged A MDis NZD Hedged Classes 8 3.2 years 9.2% 108 66.1% 19.5% 9.6% 5.0% 0.5% 3.5% 21.7% 49.3% 20.1% 5.0% Investment grade High yield Average credit rating 2.8% 2.0% 0.8% 0.5% 13.7% Annualized yield 9 9.6% 9.6% 11.7% 10.2% 11.7% Ex-dividend date 31-10-2014 31-10-2014 31-10-2014 31-10-2014 31-10-2014 71.0% B NAV 11.92 11.83 9.41 9.36 10.10 9.61 9.65 9.69 ISIN KYG9319N1097 KYG9319N1253 KYG9319N1170 KYG9319N1337 KYG9319N1824 KYG9319N2327 KYG9319N2400 KYG9319N2574 Bloomberg VPGCPUA KY VPGCPHA KY VPGPUMD KY VPGPHMD KY VPPSHMA KY VPGCAUD KY VPGCCAD KY VPGCHNZ KY Fund facts Value Partners Hong Kong Limited USD HSBC Trustee (Cayman) Limited HSBC Institutional Trust Services (Asia) Limited P Acc & MDis (USD/HKD) – 27 Mar 2012 A MDis (AUD/CAD/NZD) – 23 Sep 2013 P MDis (SGD) – 26 Sep 2014 MDis – Aim at Monthly distribution, subject to Manager’s discretion Fee structure (Class A and Class P) Minimum subscription Subscription fee Management fee Performance fee Dealing day 4.0% Currency breakdown USD CNY HKD GBP AUD SGD P Acc USD P Acc HKD P MDis USD P MDis HKD P MDis SGD Hedged A MDis AUD Hedged A MDis CAD Hedged A MDis NZD Hedged Manager: Base currency: Administrator: Custodian: Launch date: Dividend policy 7: Credit ratings AA BBB BB B & Below Others 6 Cash 4 Dividend amount / unit 0.0750 0.0750 0.0941 0.0821 0.0947 NAVs & Codes Geographical exposure 3 China/Hong Kong Others Indonesia Cash 4 Classes 8 HK$80,000/USD10,000 or equivalent Up to 5% 1.5% p.a. Nil Daily Value Partners Investment Team 80.3% Chairman & Co-Chief Investment Officer: Cheah Cheng Hye Deputy Chairman & Co-Chief Investment Officer: Louis So Deputy Chief Investment Officer: Renee Hung Senior Investment Director: Norman Ho, CFA Investment Directors: Eric Chow; Alan Wang, CFA Senior Fund Managers: Doris Ho; Kyu Ho; Michelle Yu, CFA; Yu Xiao Bo Fixed Income Fund Managers: Gordon lp, CFA; Jason Yan, CFA, ACCA Recent award 3. Exposure refers to net exposure (long exposure minus short exposure). Due to rounding, percentages shown may not add up to 100%. 4. Cash refers to net cash on hand excluding cash for collaterals and margins. 5. Investors should note that Yield to Maturity is for reference only and does not represent the actual performance of the Fund or the dividend yield received by investors, nor does a positive yield imply a positive return. 6. Including bonds whose issuers do not seek credit ratings (Convertible Bonds 8.5%; Dim Sum Bonds 5.6%; Greater China Bonds 3.5%; Philippines Bonds 1.1%; Australia 0.8%; Singapore Bonds 0.5%). 7. The manager intends to declare and pay monthly dividends equal to all or substantially all of the net income attributable to each of the Distribution Classes. However, there is neither a guarantee that such dividends will be made nor will there be a target level of dividend payout. No dividends will be paid with respect to the Accumulation Classes. Distribution may be paid from capital of the fund. Investors should note that where the payment of distributions are paid out of capital, this represents and amounts to a return or withdrawal of part of the amount that have been originally invested or capital gains attributable to that and may result in an immediate decrease in the value of units. Please refer to the Explanatory Memorandum for further details including the distribution policy. 8. The fund may invest in financial derivative instruments (“FDI”) for hedging purposes. In adverse situations, the fund’s use of FDI may become ineffective in hedging and the fund may suffer significant losses. Each hedged share class will hedge the fund’s base currency back to its currency of denomination on a best efforts basis. However, the volatility of the hedged classes measured in the fund’s base currency may be higher than that of the equivalent class denominated in the fund’s base currency. Risks associated with FDI include counterparty risk, credit risk and liquidity risk. Such exposure may lead to a high risk of capital loss. The AUD/CAD/NZD/SGD Hedged Classes are not recommended for investors whose base currency of investment is not in the aforesaid currencies. 9. Annualized yield of Class MDis is calculated as follows: (dividend amount/NAV as of ex-dividend date) x 12. Investors should note that yield figures are estimated and for reference only and do not represent the performance of the fund, and that there is no guarantee as to the actual frequency and/or amount of dividend payments. This document is prepared by Value Partners Hong Kong Limited for information purposes only. Neither Value Partners Hong Kong Limited nor the Directors of the company accept any responsibility whatsoever for the accuracy or completeness of the information provided by third parties contained in this document. It should not be copied or distributed to third parties without the written consent of Value Partners Hong Kong Limited. This document does not constitute a prospectus, an offer or an invitation to subscribe any securities, or a recommendation in relation to any securities. Investors should note investment involves risk and past performance is not indicative of future results. Investors should refer to the explanatory memorandum for details and risk factors in particular those associated with investment in China and other markets in the Asian region, non-investment grade debt securities, and in companies with medium or small capitalization. This document has not been reviewed by the Securities and Futures Commission. Issuer: Value Partners Hong Kong Limited. GCHY_Master_201410 Mr. Gordon IP (Value Partners’ Fund Manager): One of the top 10 Astute Investors in Asian G3 bonds in Hong Kong in 2014 ~ The Asset 24

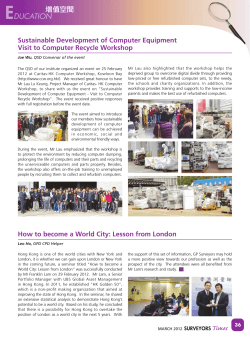


© Copyright 2026