
Hydrogeochemical characterization of the eastern Minesing Wetlands
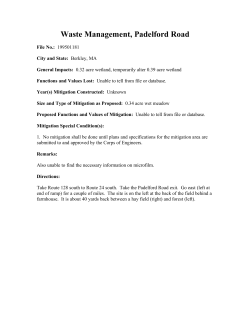
Hydrogeochemical characterization of the eastern Minesing Wetlands John Spoelstra, PhD, Research Scientist Groundwater Quality and Assessment Section National Water Research Institute Environment Canada, CCIW 867 Lakeshore Road, P.O. Box 5050 Burlington, ON, L7R 4A6 Phone: (905) 336-6246 Email: [email protected] Ryan Post, M.Sc. P.Geo Hydrogeologist Source Protection Coordinator Nottawasaga Valley Conservation Authority 8195 8th Line Utopia, Ontario LOM 1T0 Phone: (705) 424-1479 x249 Email: [email protected] NWRI Report Number 12-001 Cite as: Spoelstra, J. and Post, R. 2012. Hydrogeochemical characterization of the eastern Minesing Wetlands. National Water Research Institute, Report Number 12‐001. Environment Canada. 20 pp. Abstract: The provincially significant Minesing Wetlands span an area of over 6,000 hectares in Simcoe County, Ontario. The eastern portion of the wetlands (conifer swamps and fen complex) is sustained by groundwater discharge and is relatively isolated from the surface water influences that dominate the remainder of the wetland. Sustaining the current hydrogeological function of the eastern component of the wetland is related to the effective management of the associated recharge areas, as identified in the Minesing Wetland Management Plan (Pulfer and Thompson, 2011). The objectives of this study are to: 1. Provide a hydrogeochemical characterization of the eastern core of the Minesing Wetlands, 2. Complete a comparative analysis to previous hydrogeochemical work completed by Bradford (1999), and 3. Provide recommendations for future monitoring and geochemical analysis of the fen and eastern component of the wetlands. Groundwater sampling was completed over a 3-day period (October 14, 19, and 20, 2010) at 12 monitoring stations that consisted of a standpipe screened just below the surface of the peat and a piezometer screened just above the mineral soil. The monitoring stations were located along two transects, commencing at the former glacial lake shoreline and terminating in the fen. Water samples were analyzed for major anions, major cations, select anionic herbicides, and ammonium. For monitoring stations and parameters that were common to both the Bradford (1999) study and this one, the groundwater chemistry exhibited a very similar range in concentrations, indicating that the major chemical composition of the fen groundwater has remained relatively unchanged over a period of more than 12 years. Compared to more centrally-located monitoring stations, groundwater at several locations near the wetland margins had higher sodium concentrations, possibly indicating a slight influence from road salt application. The presence of nitrate and a breakdown product of the herbicide glyphosate in one well at the eastern edge of the wetland also suggests that adjacent land use is impacting some of the groundwater entering the Minesing Wetlands. At a minimum, future groundwater monitoring in the Minesing Wetlands should include the instrumented stations closest to the wetland edge since these are likely to be the first impacted by changes in groundwater chemistry from land use in the adjacent uplands. Key geochemical parameters to monitor include sodium, chloride, and nitrate. 2 Résumé: Les Terres humides de Minesing d’importance provinciale ont une superficie de plus de 6 000 hectares et elles sont situées dans le comté Simcoe, en Ontario. La partie est des terres humides (marécages à conifères et complexe de tourbière) est alimentée par les eaux souterraines et elle relativement isolée de l’influence des eaux de surface qui dominent le reste de la zone humide. Le maintien des fonctions hydrogéologiques actuelles de la partie est de la zone humide dépend de la gestion efficace des zones de recharge connexes, recensées dans le plan de gestion des Terres humides de Minesing (Pulfer et Thompson, 2011). Les objectifs de la présente étude sont les suivants. 1. Fournir une caractérisation hydrogéochimique de la partie est des Terres humides Minesing. 2. Effectuer une analyse comparative avec la caractérisation hydrogéochimique effectuée précédemment par Bradford (1999). 3. Formuler des recommandations pour la surveillance et l’analyse géochimique futures de la tourbière et de la partie est des terres humides. L’échantillonnage des eaux souterraines s’est échelonné sur une période de 3 jours (14, 19 et 20 octobre 2010) et a été effectué à partir de 12 stations de surveillance, qui étaient constituées d’un tuyau vertical muni d’un grillage juste sous la surface de la tourbe et d’un piézomètre muni d’un grillage juste au-dessus du sol minéral. Les stations de surveillance étaient situées le long de deux transects, entre le rivage de l’ancien lac glaciaire et la tourbière. Les échantillons d’eau ont été analysés en fonction des paramètres suivants : anions majeurs, cations majeurs, herbicides anioniques choisis et ammonium. Dans le cas des stations de surveillance et des paramètres qui étaient communs à l’étude de Bradford (1999) et à la présente étude, la chimie des eaux souterraines présentait une plage de concentrations très semblable entre les deux études, ce qui indique que les principaux éléments chimiques de l’eau souterraine de la tourbière sont restés à peu près inchangés pendant plus de 12 ans. Par rapport à l’eau prélevée par les stations de surveillance plus centrales, l’eau souterraine de plusieurs stations près des lisières de la zone humide présentait des concentrations de sodium plus élevées, ce qui révèle possiblement une légère influence de l’application des sels de voirie. La présence de nitrate et d’un produit de dégradation de l’herbicide glyphosate dans un puits de la lisière est de la zone humide suggère aussi que l’utilisation des terres adjacentes a des répercussions sur une partie des eaux souterraines qui pénètrent dans les Terres humides de Minesing. La surveillance future des eaux souterraines dans les Terres humides de Minesing devrait à tout le moins inclure les stations les plus près des lisières de la zone humide, puisque c’est à cet endroit que risquent de se produire les premières modifications de la chimie des eaux souterraines causées par l’utilisation des terres dans les milieux secs adjacents. Les principaux paramètres géochimiques à surveiller comprennent le sodium, le chlorure et le nitrate. 3 Table of Contents: Table of Contents.......................................................................................................................................... 4 1 2 Introduction............................................................................................................................................ 5 1.1 Minesing Fen Hydrology .............................................................................................................. 5 1.2 Minesing Wetland Groundwater Monitoring Network .................................................................. 6 Methodology........................................................................................................................................ 10 2.1 Sampling methods ..................................................................................................................... 10 2.2 Analytical Methods..................................................................................................................... 10 3 Results ................................................................................................................................................ 11 4 Discussion ........................................................................................................................................... 14 5 Conclusions and Recommendations .................................................................................................. 18 6 Acknowledgements ............................................................................................................................. 19 7 References .......................................................................................................................................... 19 4 1 Introduction: The provincially significant Minesing Wetlands span an area of over 6,000 hectares and is located within the townships of Clearview, Springwater and Essa in Simcoe County, Ontario. Designated as a wetland of international importance by the RAMSAR Convention on Wetlands, it is home to 527 plant species and 568 animal species; six of which are globally rare, 24 are nationally rare, and more than 50 are rare in Ontario (Pulfer and Thompson, 2011). Of national and international interest are the endangered Eastern Prairie Fringed-Orchid (Platanthera leucophaea) and Hine’s Emerald Dragonfly (Somatochlora hineana). Since 1973, the Nature Conservancy of Canada (NCC), Ministry of Natural Resources (MNR) and the Nottawasaga Valley Conservation Authority (NVCA) have secured over 11,000 acres of the Minesing Wetlands, making this the fifth largest protected area in southern Ontario. The eastern portion of the wetlands (conifer swamps and shrub and sedge fen complex) is generally sustained by regional groundwater discharge, which plays an important role in maintaining ecological integrity as well as in moderating the flow and thermal regime of creeks and tributaries adjacent to the wetland. Bradford (1999) noted the importance of groundwater as a source of water and nutrients for the vegetation within the wetlands and the need to manage land uses within the recharge areas to ensure that degradation of this internationally significant wetland does not occur. Further, sustaining the current hydrogeological function of the eastern component of the wetlands is related to the effective management of the associated recharge areas, as identified by Pulfer and Thompson (2011). Recent and anticipated future rapid development near the wetland may alter the quality and quantity of groundwater recharge, most notably in the proximal Snow Valley Uplands area. Geochemical analysis of groundwater can be used to provide information on the sources of water to the eastern portion of the wetlands as well as providing indicators of anthropogenic impact (e.g. road salts and nutrients). Initial hydrogeochemical analysis was completed in the eastern part of the Minesing Wetlands by Bradford (1999) who indicated that the chemistry was generally homogenous and dominated by calcium and bicarbonate. It is noted that no subsequent geochemical analysis has been completed in the Minesing Wetlands. The objectives of this study are to: 1. Provide a hydrogeochemical characterization of the eastern core of the Minesing Wetlands, 2. Complete a comparative analysis to previous hydrogeochemical work completed by Bradford (1999), 3. Provide recommendations for future monitoring and geochemical analysis of the fen and eastern component of the wetlands. This project builds on the desktop hydrogeological review of the eastern section of the wetlands (Post, 2009) and the Integrated Minesing Wetlands Monitoring Program - 2009 Results (Post et al., 2010), which included groundwater level measurements along two pre-existing transects in the fen. 1.1 Minesing Fen Hydrology: Fens are minerotrophic, peat-accumulating ecosystems that have perennially saturated soils, and whose hydrologic regime, geochemistry, and potential ecological characteristics are produced by the landscape that supplies its groundwater as well as long-term issues of site history (Cooper and Wolf, 2006). Fens are among the most floristically diverse of all wetland types, supporting a large number of rare and uncommon bryophytes and vascular plant species, as well as uncommon animals (Mitsch and Gosselink, 2000). Typically, fens occupy a low point of relief in a basin and are usually characterized by very slow internal drainage through seepage. Streams, runoff and groundwater also provide nutrient enrichment to fens. General characteristics of fens include: Soil: Non-acidic, sedge-derived peat; saturated or nearly saturated during most of the growing season; Hydrology: Constant, upwelling groundwater; waterlogged within at least a few inches of the surface with scattered small pools and rivulets; and 5 Vegetation: Grasses, sedges, rushes, shrubs, various broad-leaved plants; many rare species. The eastern part of the Minesing Wetlands is a fen-dominated boreal wetland complex, bracketed by the bottomland complex to the north and west and the ancestral shorelines of glacial lakes Algonquin, Payette, and Nipissing (Edenvale) to the south and east (Bradford, 1999). The principal groundwater flow direction is north-west with lateral flow across the fen exhibiting extremely low groundwater gradients (Bradford, 1999). The regional A2 aquifer is the principal source of groundwater to the eastern portion of the wetlands (Beckers and Frind, 2001). It outcrops at the base of the bluffs on the western margin of the Snow Valley Upland, which is associated with the glacial shoreline complexes (Nipissing (Elmvale) and Payette; Beckers and Frind, 2001; Bradford, 1999). This groundwater discharge at the base of the bluffs is associated with strong wetland characteristics, often open mixed/conifer swamp (Post et al., 2010). Moving west towards the fen, this groundwater discharge coalesces into spring tributaries and the vegetation changes from the open mixed/conifer swamp to low, hummocky terrain supporting deciduous and mixed forests that are at the fresh-moist/swamp forest transition. These forests transition to conifer swamps that develop dominant tamarack components as they approach the central shrub fen. Within the fen, three distinct vegetation communities are present: 1. Peat plain fen with string islands that form an extensive network of sedges and grasses mixed with coniferous and low shrub islands. 2. Peat plain-conifer complex that surrounds the fens and has colonized the string islands and are dominated by cedar and tamarack. 3. Remnant tamarack and cedar Islands, dead standing trees and alder thickets that define the peat plain big marsh. The Snow Valley Uplands is a critical recharge area to the east of the Minesing Wetlands (Beckers and Frind, 2001). Land use in this upland area is dominated by row cropland (i.e. wheat, corn, soybean, etc), privately serviced rural residences, and by deciduous or coniferous forests predominating on the flanks of the upland (Figure 1.1). Further, there are several small aggregates pits and transportation corridors proximal to the wetland in addition to a closed landfill site. The surficial geology of the Snow Valley Uplands is dominated by sands and gravels and subordinate tills. Several watercourses with short headwater reaches prograding off the flanks of the uplands into the fen are marked by cold and cool water fisheries habitats (e.g. Mink and Keast creeks). Previous hydrogeochemical analysis of wetland groundwater indicates that the fen is dominated by calcium and bicarbonate ions with the postulated source being from deep groundwater or mineral soils below the peat, regionally originating from the outcropping aquifers at the stranded glacial shoreline deposits and through the shallow peat (Bradford, 1999). Groundwater discharge along the eastern margin could account for the observed hydrogeochemical trends from the bluffs towards the fen along the principal direction of groundwater flow (Bradford, 1999). 1.2 Minesing Wetland Groundwater Monitoring Network: Bradford (1999) installed a series of groundwater monitoring transects in the wetland as part of her PhD thesis research. Site reconnaissance was carried out in 2009 to relocate, GPS, and assess the current condition of these groundwater stations (Post et al. 2010). A total of 12 monitoring stations along two transects, T3 and T6, that were established in 1996 by Bradford (1999) were relocated (Figure 1.2). The transects commence at the glacial lake shoreline at the eastern margin of the wetlands and terminate in the fen. There were other piezometers and monitoring wells originally located on these transects, but they were not located during the reconnaissance. Each groundwater station consists of a standpipe that is screened just below the surface of the peat and a piezometer screened just above the mineral soil (screen mid-point range = 1.5 to 2.3m). All of these monitoring wells are made of PVC and have screened intakes approximately 65cm long with an inside diameter of 3.2cm. 6 Water levels at all stations were measured manually approximately once every two weeks for a total of seven measurements during the period of July 20 to October 16, 2009, plus once in 2010. In addition, HOBO water level loggers were deployed in 2009 in three standpipes and two piezometers to record water levels and groundwater temperatures at 10 minute intervals. Figure 1.1. Land use surrounding the Minesing Wetlands. The box outlines the study area shown in Figure 1.2. Comparison of 2009 groundwater level data to Bradford (1999) data indicates that groundwater levels (i.e. water table depths) in the study area have not changed significantly over the last ten plus years (Table 1.1; Post et al., 2010). Spatially, the 2009 data indicates that water levels increase significantly as the vegetation changes from Coniferous to Deciduous to Fen, with the highest water level observed in the Open Fen. The lowest water levels, wells T6-13 and T6-11 are located within the dense Coniferous vegetation. Further, comparison of 2009 NVCA vegetation community data with Bradford’s data suggests that no significant changes in vegetation community composition have occurred during the ten-year period. Vegetation community descriptions and coefficients of wetness have remained relatively constant over the same period (Post et al., 2010). 7 Figure 1.2. Groundwater monitoring stations from Bradford (1999) that were relocated and sampled for this study. 8 Table 1.1. Minesing Wetlands groundwater monitoring station locations; associated vegetation communities; and static water level minimum, maximum, and average for the period of July to October, 2009. (mbgs: metres below ground surface). Static water levels (mbgs) Well Easting Northing T3-2-P 591599 4914459 T3-2-S 591599 T3-3-P T3-3-S Vegetation Community Minimum Maximum Average White Cedar - Conifer Mineral Con. Swamp -0.011 0.137 0.084 4914459 White Cedar - Conifer Mineral Con. Swamp -0.002 0.104 0.095 591851 591851 4914541 4914541 Tamarack Organic Con. Swamp Tamarack Organic Con. Swamp 0.002 0.008 0.242 0.264 0.096 0.119 T3-4-P 591952 4914560 White Cedar-Conifer Organic Con. Swamp / Tamarack Organic Con. Swamp 0.057 0.287 0.164 T3-4-S 591952 4914560 White Cedar-Conifer Organic Con. Swamp / Tamarack Organic Con. Swamp 0.06 0.292 0.159 T3-5-P T3-5-S 592073 592073 4914598 4914598 Tamarack Organic Con. Swamp Tamarack Organic Con. Swamp 0.151 0.17 0.384 0.395 0.261 0.266 T3-9-S 592777 4914838 White Cedar - Conifer Mineral Con. Swamp 0.099 0.271 0.186 T6-1-S T6-1-P T6-4-P T6-4-S 591630 591630 592218 592218 4915160 4915160 4915022 4915022 Sweet Gale Shrub Fen Sweet Gale Shrub Fen Twig-rush Open Fen Twig-rush Open Fen -0.005 -0.043 -0.025 -0.026 0.203 0.181 0.159 0.148 0.085 0.060 0.058 0.051 T6-7-P 592723 4914922 White Cedar - Conifer Mineral Con. Swamp 0.111 0.166 0.124 T6-7-S 592723 4914922 White Cedar - Conifer Mineral Con. Swamp 0.028 0.046 0.029 T6-9-P 592976 4914875 Popular-Conifer Mineral Mixed Swamp 0.089 0.458 0.290 T6-9-S 592976 4914875 Popular-Conifer Mineral Mixed Swamp 0.116 0.362 0.270 T6-10-S 593039 4914881 Fresh-Moist HemlockHardwood Mixed Forest -0.029 0.131 0.062 T6-11-P 593089 4914868 Fresh-Moist Sugar Maple Hardwood Deciduous Forest 0.475 0.885 0.746 T6-11-S 593089 4914868 Fresh-Moist Sugar Maple Hardwood Deciduous Forest 0.526 0.917 0.809 T6-13-P 593163 4914860 White Cedar - Conifer Mineral Con. Swamp -0.024 0.011 -0.002 T6-13-S 593163 4914860 White Cedar - Conifer Mineral Con. Swamp 0.012 0.029 0.023 9 2 Methodology: 2.1 Sampling methods Water samples were collected on October 14, 19, and 20, 2010. Sampling was done during a period of minimal precipitation to minimize surface water runoff effects in the wetlands during groundwater sampling. Due to the October sampling period and associated lowered evapotranspiration rates, the peat pore water may have been less concentrated than at other times of the year. Initially, water levels in each well were measured with a Solinst water level tape. Prior to the collection of samples for analysis, the wells were purged in excess of three well volumes using a manual Waterra foot valve pump,. Each well was sampled for anions, cations, anionic herbicides, and ammonium. Sample treatment methods for these parameters are outlined in Table 2.1. Table 2.1. Summary of sampling and preservation methods for each parameter. Parameter Bottle Treatment Storage Anions and anionic herbicides 500mL plastic bottle Filtered to 0.45μm Refrigerate Cations 20mL glass vial Filtered to 0.45μm, Acidify to pH=~2 with 70% nitric acid Refrigerate Ammonium 30mL plastic bottle Filtered to 0.45μm, Acidify to pH= ~5 with 10% HCl Freeze 2.2 Analytical Methods Chemical analyses were conducted at the lab facilities of the Groundwater Quality and Assessment Section of Environment Canada at the Canada Centre for Inland Waters, Burlington, Ontario. Anions: Sub-samples for anions (fluoride, chloride, bromide, nitrite, nitrate, sulfate, phosphate) were filtered to 0.45μm and refrigerated until analysis. Analysis of anionic species was conducted using a Dionex 2500 ion chromatograph. Sample concentrations were calibrated against multi-ion standards that were analyzed with the samples. When necessary, samples were diluted with Milli-Q water to bring their concentration within the working range of the standards. Cations: Sub-samples for cations (calcium, magnesium, sodium, potassium, iron) were filtered to 0.45μm and acidified with nitric acid prior to being refrigerated until analysis. Cation concentrations were determined by inductively coupled plasma-atomic emission spectroscopy using a HoribaJobin Yvon Ultima 2 ICP. Sample concentrations were calibrated against multi-ion standards that were analyzed with the samples. When necessary, samples were diluted with Milli-Q water to bring their concentration within the working range of the standards. Ammonium: Sub-samples for ammonium analysis were syringe filtered to 0.45μm and acidified with hydrochloric acid to a pH of approximately 5-6 and stored frozen until analysis. Ammonium concentrations were determined using a colorimetric method (Salicylate-Nitroprusside) by measuring absorbance at 640nm on a Beckman-Coulter DU720 UV/visible spectrophotometer. Sample values were calibrated against multiple ammonium standards that were analyzed with the samples. When necessary, samples were diluted with Milli-Q water to bring their concentration within the working range of the standards. 10 Anionic Herbicides: Samples were re-filtered (0.45μm) and analyzed for select anionic herbicides (glyphosate, AMPA, 2,4-D, glufosinate, fosamine, MCPA and picloram) using suppressed ion chromatography (IC) coupled to a tandem mass spectrometer (MS/MS). Separation was performed using a Dionex (Sunnyvale, CA, USA) 2500 IC system on a Dionex IONPAC® AS20 analytical column (2 x 250 mm). The IC was interfaced to an AB Sciex 5500 QTrap MS/MS (ON, Canada), and operated in the negative electrospray ionization (ESI) mode. Isotope labelled glyphosate (98%, 100 mg/L 1,2-13C,15N) and isotope labelled AMPA (98%, 100 mg/L 13C, 15N, 2H) were used as an internal standard's to account for matrix effects. 3 Results: Table 3.1: Static groundwater levels in meters below ground surface (mbgs) at time of sampling. Sample Date Static Elevation (mbgs) T3-2-P 20-Oct-10 0.000 T3-2-S 20-Oct-10 0.205 T3-3-P 20-Oct-10 -0.019 T3-3-S 20-Oct-10 0.019 T3-4-S 20-Oct-10 0.047 T3-5-P 20-Oct-10 0.157 T3-5-S 20-Oct-10 0.174 T3-9-S 14-Oct-10 0.100 T6-1-P 19-Oct-10 -0.064 T6-1-S 19-Oct-10 -0.023 T6-4-P 19-Oct-10 -0.044 T6-4-S 19-Oct-10 -0.012 T6-7-P 19-Oct-10 0.106 T6-7-S 19-Oct-10 0.006 T6-9-P 14-Oct-10 0.086 T6-9-S 14-Oct-10 0.091 T6-13-P 14-Oct-10 0.840 T6-13-S 14-Oct-10 0.655 Well 11 Table 3.2. Anion chemistry for wetland groundwater samples. The minimum detection limit (mdl) for each parameter is given at the bottom of the table. Sample Date Fluoride Chloride Bromide Sulfate Nitrite Nitrate Phosphate (mg/L) (mg/L) (mg/L) (mg/L) (mg N/L) (mg N/L) (mg/L) T3-2-P 20-Oct-10 0.09 2.33 <0.02 1.08 <0.003 <0.016 <0.02 T3-2-S 20-Oct-10 0.10 3.43 <0.02 1.02 <0.003 <0.016 <0.02 T3-3-P 20-Oct-10 0.11 3.22 <0.02 1.03 <0.003 <0.016 <0.02 T3-3-S 20-Oct-10 0.10 2.70 <0.02 1.06 <0.003 <0.016 <0.02 T3-4-S 20-Oct-10 0.09 4.17 <0.02 1.08 <0.003 <0.016 <0.02 T3-5-P 20-Oct-10 0.09 4.15 <0.02 1.07 <0.003 <0.016 <0.02 T3-5-S 20-Oct-10 0.08 3.44 <0.02 1.08 <0.003 0.11 <0.02 T3-9-S 14-Oct-10 0.07 2.03 <0.02 2.28 <0.003 <0.016 <0.02 T6-1-P 19-Oct-10 0.07 2.15 <0.02 1.12 <0.003 <0.016 <0.02 T6-1-S 19-Oct-10 0.07 1.66 <0.02 1.10 <0.003 <0.016 <0.02 T6-4-P 19-Oct-10 0.07 2.45 <0.02 1.33 <0.003 <0.016 <0.02 T6-4-S 19-Oct-10 0.08 2.75 <0.02 1.10 <0.003 <0.016 <0.02 T6-7-P 19-Oct-10 0.08 3.65 <0.02 1.05 <0.003 <0.016 <0.02 T6-7-S 19-Oct-10 0.07 3.59 <0.02 2.92 <0.003 <0.016 <0.02 T6-9-P 14-Oct-10 0.18 10.73 0.09 1.09 <0.003 <0.016 <0.02 T6-9-S 14-Oct-10 0.09 3.96 <0.02 18.37 <0.003 <0.016 <0.02 T6-11-P 14-Oct-10 0.07 2.64 <0.02 4.17 <0.003 <0.016 <0.02 T6-13-P 14-Oct-10 0.09 0.73 <0.02 1.07 <0.003 <0.016 <0.02 T6-13-S 14-Oct-10 0.13 1.15 <0.02 5.30 0.024 0.610 <0.02 0.004 0.01 0.02 0.05 0.003 0.016 0.02 mdl 12 Table 3.3. Cation chemistry for wetland groundwater samples. The minimum detection limit (mdl) for each parameter is given at the bottom of the table. Sample Date Calcium Iron Potassium Magnesium Sodium Ammonium (mg/L) (mg/L) (mg/L) (mg/L) (mg/L) (mg N/L) T3-2-P 20-Oct-10 73.6 3.63 0.78 12.32 10.76 0.404 T3-2-S 20-Oct-10 57.2 0.88 0.78 13.21 7.76 0.707 T3-3-P 20-Oct-10 63.2 1.84 0.56 10.69 8.76 0.396 T3-3-S 20-Oct-10 58.0 0.14 0.60 10.97 7.72 0.357 T3-4-S 20-Oct-10 51.2 1.01 0.83 13.73 6.33 0.062 T3-5-P 20-Oct-10 60.7 0.83 0.73 12.33 9.09 0.326 T3-5-S 20-Oct-10 55.6 0.03 0.98 14.07 7.75 <0.016 T3-9-S 14-Oct-10 79.9 0.05 0.76 13.63 6.89 0.124 T6-1-P 19-Oct-10 57.8 1.66 0.91 11.73 5.99 0.194 T6-1-S 19-Oct-10 72.7 0.86 0.66 14.05 5.95 0.054 T6-4-P 19-Oct-10 72.4 0.31 0.63 13.51 6.99 0.225 T6-4-S 19-Oct-10 69.4 1.44 0.65 11.24 6.69 0.357 T6-7-P 19-Oct-10 73.1 0.28 1.09 15.76 7.66 0.318 T6-7-S 19-Oct-10 77.7 0.11 1.23 16.56 6.49 0.194 T6-9-P 14-Oct-10 36.8 0.18 0.70 14.48 26.53 0.070 T6-9-S 14-Oct-10 65.8 0.15 0.27 15.38 10.89 0.023 T6-11-P 14-Oct-10 80.6 <0.02 0.52 22.34 14.87 <0.016 T6-13-P 14-Oct-10 74.1 0.80 0.84 17.26 7.77 0.031 T6-13-S 14-Oct-10 54.5 0.02 1.36 17.22 12.01 0.179 0.020 0.020 0.10 0.020 0.10 0.016 mdl 13 Table 3.4. Anionic herbicide concentrations for wetland groundwater samples. The minimum detection limit (mdl) is given at the bottom of the table. “n.d.” indicates that the parameter was not detected in the sample. “<mdl” indicates that the parameter was detected but at a concentration below the mdl. Sample Date Glyphosate AMPA 2,4-D Glufosinate Fosamine MCPA Picloram (ng/L) (ng/L) (ng/L) (ng/L) (ng/L) (ng/L) (ng/L) T3-2-P 20-Oct-10 n.d. n.d. n.d. <mdl n.d. n.d. n.d. T3-2-S 20-Oct-10 n.d. n.d. n.d. <mdl n.d. n.d. n.d. T3-3-P 20-Oct-10 n.d. n.d. n.d. n.d. n.d. n.d. n.d. T3-3-S 20-Oct-10 n.d. n.d. n.d. <mdl n.d. n.d. n.d. T3-4-S 20-Oct-10 n.d. n.d. n.d. n.d. n.d. n.d. n.d. T3-5-P 20-Oct-10 n.d. n.d. n.d. <mdl n.d. n.d. n.d. T3-5-S 20-Oct-10 n.d. <mdl n.d. n.d. n.d. n.d. n.d. T3-9-S 14-Oct-10 n.d. n.d. n.d. n.d. n.d. n.d. n.d. T6-1-P 19-Oct-10 n.d. n.d. n.d. n.d. n.d. n.d. n.d. T6-1-S 19-Oct-10 n.d. n.d. n.d. n.d. n.d. n.d. n.d. T6-4-P 19-Oct-10 n.d. n.d. n.d. n.d. n.d. n.d. n.d. T6-4-S 19-Oct-10 n.d. n.d. n.d. n.d. n.d. n.d. n.d. T6-7-P 19-Oct-10 n.d. n.d. n.d. n.d. n.d. n.d. n.d. T6-7-S 19-Oct-10 n.d. <mdl n.d. n.d. n.d. n.d. n.d. T6-9-P 14-Oct-10 n.d. <mdl <mdl n.d. n.d. n.d. n.d. T6-9-S 14-Oct-10 n.d. <mdl n.d. n.d. n.d. n.d. n.d. T6-11-P 14-Oct-10 n.d. n.d. n.d. n.d. n.d. n.d. n.d. T6-13-P 14-Oct-10 n.d. n.d. n.d. <mdl n.d. n.d. n.d. T6-13-S 14-Oct-10 <mdl 39.0 n.d. n.d. n.d. n.d. n.d. 10 10 10 10 5 10 150 mdl 4 Discussion: Overall, the groundwater chemistry for samples collected in this study (Oct 2010) was similar to that found by Bradford (1999) for samples collected in July 1998 (Figure 4.1). The wetland groundwater exhibits relatively low ion concentrations, due partially to the influence of direct precipitation inputs to the wetland and its subsequent dilution of groundwater inputs. Both studies indicate that the dominant cation present is calcium (Table 3.3, Figure 4.1). Although not measured for the current study, Bradford (1999) found that bicarbonate is the dominant anion for these sampling sites (Figure 4.1). It is assuming that blanks in Table C2 in Bradford (1999) are samples that had analyte concentrations that were below detection rather than not analyzed for. Unfortunately, minimum detection limits (mdl) were not specified for the parameters measured in the Bradford (1999) study. Since a potential difference between the mdl of these two studies could present a bias, a comparison to the results of this study was not done for parameters 14 where a significant number of samples had blank values in Table C2 of Bradford (1999) (e.g. K+, NH4+, SO42-) (Figure 4.1). Nutrient concentrations were low in groundwater from the eastern portion of the Minesing Wetlands. Phosphate was below detection (<0.02 mg/L) in all samples collected (Table 3.2). Dissolved inorganic nitrogen concentrations were low in the groundwater and, with the exception of T3-5-P and T6-13-S, dominated by ammonium. In fact, nitrate was below the detection limit (<0.016 mg N/L) for all samples in this study except T3-5-P and T6-13-S (Table 3.2). Bradford (1999) did not find nitrate for any of the locations sampled in the current study. 1000 100 mg/L 10 1 0.1 0.01 2+ 2+ Ca Ca Mg a b a 2+ Mg b 2+ + + Na Na a b + + K NH4 -N Fe b b b Cl a - - Cl b SO4 b 2- HCO3 - a Figure 4.1 Comparison of Minesing Wetland groundwater chemistry data from Bradford (1999) (green, “a”) and this study (blue, “b”) for the T3 and T6 transects. Box ends and whiskers represent the 25th and 75th and 10th and 90th percentiles of the data, respectively. The line within the box indicates the median value and outliers are shown as data points beyond the whiskers. Although there was not a large range in concentrations for many of the parameters measured, some general spatial trends were observed. As groundwater discharging through wetland sediments gets closer to the surface, it is more likely to be diluted by wetland surface water and meteoric waters, as well as influenced by physical, biological and chemical processes occurring in the wetland sediments. Therefore in order to identify areas where upland groundwater discharge has a higher impact on wetland groundwater chemistry, we used the deeper “P” samples at each location to generate the spatial data plots (Figures 4.2 to 4.5). Due to the chemical composition of aquifer materials in the area surrounding the Minesing Wetlands, upland groundwater is expected to have higher concentrations of Ca2+, Mg2+ and Na+ than wetland surface water. Therefore, the higher groundwater concentrations of these elements at the eastern and south-western margins of the sampling area (e.g. T3-2-P, T6-9-P, T6-10-P, T6-11-P) could indicate a higher relative contribution and chemical influence of upland groundwater discharge at these points. 15 Figure 4.2. Sodium concentrations in groundwater collected from the “P” series piezometers at each sampling location. Figure 4.3. Magnesium concentrations in groundwater collected from the “P” series piezometers at each sampling location. 16 Figure 4.4. Calcium concentrations in groundwater collected from the “P” series piezometers at each sampling location. Figure 4.5. Chloride concentrations in groundwater collected from the “P” series piezometers at each sampling location. 17 Another potential source of elevated Na+ (and Cl-) in groundwater and surface runoff is the application of road salt for de-icing. Although still relatively low, T3-2-P, T6-11-P, and T6-9-P exhibited somewhat higher Na+ concentrations in both studies when compared to the other wetland groundwater samples. One sample in particular, T6-9-P, had elevated Cl- (10.7 mg/L) compare to the other groundwater samples in this study. The fact that both Na+ and Cl- are elevated in T6-9-P provides additional evidence for a NaCl (e.g. road salt) influence on the groundwater collected at this location. It should be noted that Na+ and Cl- concentrations at T6-9-P are still quite low compared to other groundwaters known to be contaminated by road salt (e.g. Meriano et al., 1999; Williams et al., 1999; Howard and Maier, 2007). An additional indication of anthropogenic impact to groundwater chemistry at the eastern most sampling area is the presence of aminomethylphosphonic acid (AMPA) in T6-13-S. AMPA is a product of the microbial breakdown of the anionic herbicide, glyphosate (e.g. Roundup), both of which have previously been detected in surface and ground water in Ontario (e.g. Struger et al., 2008; Van Stempvoort et al., 2008). With an AMPA concentration of 39 ng/L, T6-13-S was the only sample with a detection above the minimum detection limit for the seven anionic herbicide compounds analyzed. AMPA is thought to have a toxicity similar to its parent compound, glyphosate, which has a Canadian Water Quality Guideline for the Protection of Aquatic Life of 65,000ng/L (Trotter et al. 1990). Although the AMPA concentration for T613-S is well below the guideline for glyphosate, its presence demonstrates that land use activities in the adjacent uplands can affect the composition of groundwater discharging to the Minesing Wetlands. T613-S is the sampling point closest to the eastern edge of the wetland and thereby closest to potential sources of AMPA (and glyphosate) including agricultural, domestic and roadside application of glyphosate. The nitrate detected at T6-13-S is also consistent with groundwater impacted by nitrogen fertilizer application (agricultural and/or domestic use) or septic/manure derived nitrate. As nitrate-contaminated groundwater discharges to wetland areas, the carbon-rich sediments typically promote anaerobic conditions and the attenuation of nitrate by denitrification and plant uptake (e.g. Devito et al., 2000; Mengis et al., 1999; Spoelstra et al., 2010). Therefore it is possible that the 0.61 mg N/L in T6-13-S is residual nitrate left over from incomplete denitrification of nitrate in the source groundwater. Further analyses would have to be done to confirm the extent of denitrification activity at this site. 5 Conclusions and Recommendations: The results of groundwater quality studies conducted in 1998 (Bradford 1999) and 2010 (this study) suggest that groundwater chemistry in the Minesing Wetlands has not changed significantly over the 12 year period. However, both studies are snapshots in time and do not provide information on the seasonality or intra-annual variability of groundwater chemistry in the Minesing Wetlands. Future monitoring of the Minesing Wetlands should include both physical and chemical characteristics of groundwater within and adjacent to the wetlands. In addition to the existing monitoring wells in the wetland, it would be useful to have monitoring wells outside the wetland that could be used to measure water table elevations and water quality of the nearby upland groundwater. In addition to providing an “early warning” mechanism for possible changes to the wetland’s groundwater source, upland monitoring wells could also be used to determine how the chemical composition of upland groundwater changes as a result of sub-surface flow through the wetland. For example, it is expected that denitrification and plant uptake in the organic carbon-rich wetland sediments will reduce or eliminate nitrate that might be present in the groundwater discharging to the wetland. The buffering effects of the wetland with respect to water quality might predominantly occur in a narrow zone where groundwater first encounters the wetland sediments. Therefore detection of these reactions is difficult without knowledge of the regional groundwater chemistry and/or a dense monitoring network within the wetland. The nitrate detected at T6-13-S could indicate that this well is near a point where groundwater enters the wetland and still retains some of the nitrate from the upland groundwater source; more research would be needed to confirm this hypothesis. 18 The temporal variability of groundwater chemistry in the Minesing Wetlands is currently unknown. Therefore it is not presently possible to say how differences in the timing of an annual wetland groundwater sampling initiative would affect the comparability of these data. It would be useful to conduct a more intensive sampling of the Minesing Wetlands groundwater at multiple times per year to adequately capture variations in groundwater chemistry as a function of seasonal variability in wetland hydrology and the biogeochemical processes that influence groundwater parameters. Not only would this be a first step towards a better understanding of the variability in the chemistry of Minesing Wetlands groundwater, but it would also provide a scientific basis for choosing the most meaningful time of year to conduct subsequent monitoring at a reduced temporal intensity (e.g. once annually). Chemical characterization of the regional groundwater on the up-gradient perimeter of the wetland would help identify the parameter(s) best suited for identifying key areas of groundwater discharge to the Minesing Wetlands. Additionally, it might be possible to use some of these parameters (e.g. Cl-) to provide quantitative insights into groundwater discharge. At a minimum, future monitoring should include analysis of common anions and cations, both in the wetland and in the up-gradient groundwater source. Analysis of common anions and cations includes NO3-, Cl-, Na+, Mg2+, Ca2+ and therefore these analyses are sufficient for detecting anthropogenic nutrient impacts (NO3-) and impacts from road salt application (Na+ and Cl-). The impacts of climate variability are likely to first manifest themselves on groundwater levels in the wetland. Therefore automated water level recording in existing and/or new monitoring wells, in and outside the wetland, would be a key component of a monitoring program designed to detect future changes in the biological, hydrological, and hydrochemical characteristics of the Minesing Wetlands. Recommendations Summary: Establish a series of monitoring wells up-gradient of the wetland for collecting water samples and monitoring water levels in the groundwater source. Investigate the intra-annual variability of groundwater chemistry in the wetland and in nearby upland groundwater. Establish a regular monitoring program of water levels and groundwater chemistry for the Minesing Wetlands for the purpose of detecting and quantifying long-term changes. 6 Acknowledgements: We acknowledge the work of several individuals that contributed to this study. Sue Brown, Pam Collins, and Jerry Rajkumar, Groundwater Quality and Assessment Section, Environment Canada, provided analytical support. Brad Pettersone and Lyle Wood, Nottawasaga Valley Conservation Authority, assisted with the field work and figures, respectively. Funding for this study was provided by Environment Canada and in-kind support from the Nottawasaga Valley Conservation Authority. 7 References: Beckers, J. and Frind, E.O. 2001. Simulating groundwater flow and runoff for the Oro Moraine aquifer system. Part II. Automated calibration and mass balance calculations. Journal of Hydrology 243: 73-90. Bradford, A. 1999. A hydrobiological study of Minesing Swamp, Ontario. PhD thesis. Queen’s University, Kingston, ON, Canada. 392 pages. 19 Cooper, D.J, and Wolf, E.C. 2006. Fens of the Sierra Nevada, California. Colorado State University; Fort Collins, CO; 47 pg. Devito, K.J., Fitzgerald, D., Hill, A.R., and Aravena, R. 2000. Nitrate dynamics in relation to lithology and hydrologic flow path in a river riparian zone. Journal of Environmental Quality 29: 1075-1084. Howard, K.W.F. and Maier, H. 2007. Road de-icing salt as a potential constraint on urban growth in the Greater Toronto Area, Canada. Journal of Contaminant Hydrology 91: 146-170. Mengis, M., Schiff, S.L., Harris, M., English, M.C., Aravena, R., Elgood, R.J., and MacLean, A. 1999. Multiple geochemical and isotopic approaches for assessing ground water N03- elimination in a riparian zone. Ground Water 37(3): 448-457. Meriano, M., Eyles, N., and Howard, K.W.F. 2009. Hydrogeological impacts of road salt from Canada's busiest highway on a Lake Ontario watershed (Frenchman's Bay) and lagoon, City of Pickering. Journal of Contaminant Hydrology 107: 66–81. Mitsch, W.J. and Gosselink, J.G. 2000. Wetlands, 3rd Ed. John Wiley & Sons, New York. 920 pp. Post, R. 2009. Desktop hydrogeological review of the Minesing Wetlands. Nottawasaga Valley Conservation Authority. 33 pages. Post, R., Featherstone D., Ockenden, I., and Roddie, A. 2010. Integrated Minesing Wetlands Monitoring Program – 2009 Results. Nottawasaga Valley Conservation Authority, 64 pages. Pulfer, T. and Thompson, E.. 2011. Minesing Wetlands Natural Area Conservation Plan (NACP) II. Nature Conservancy of Canada. Spoelstra, J., Schiff, S.L., Semkin, R.G., Jeffries, D.S., and Elgood, R.J. 2010. Nitrate attenuation in a small temperate wetland following forest harvest. Forest Ecology and Management 259: 2333-2341. Struger, J., Thompson, D., Staznik, B., Martin, P., McDaniel, T. and Marvin, C. 2008. Occurrence of glyphosate in surface waters of southern Ontario. Bulletin of Environmental Contamination and Toxicology 80:378–384. Trotter, D.M., Wong, M.P. and Kent, R.A. 1990. Canadian Water Quality Guidelines for Glyphosate. Scientific Series No. 170. Inland Waters Directorate, Water Quality Branch, Environment Canada. Ottawa, Ontario. 27 pages. Van Stempvoort, D.R., Brown, S., Graham, G., Jiang, Y. and Spoelstra, J. 2008. Glyphosate in shallow groundwater in Canada. 61st Canadian Geotechnical Conference and 9th Joint CGS/IAH-CNC Groundwater Conference. Edmonton, Alberta, Canada. 1541-1547. Williams, D.D., Williams, N.E., and Cao, Y. 1999. Road salt contamination of groundwater in a major metropolitan area and development of a biological index to monitor its impact. Water Resources 34(1): 127–138. 20


© Copyright 2026