
Long-Term Effects of 4 Popular Diets on Weight Loss and... Systematic Review of Randomized Controlled Trials
Long-Term Effects of 4 Popular Diets on Weight Loss and Cardiovascular Risk Factors: A
Systematic Review of Randomized Controlled Trials
Renée Atallah, Kristian B. Filion, Susan M. Wakil, Jacques Genest, Lawrence Joseph, Paul
Poirier, Stéphane Rinfret, Ernesto L. Schiffrin and Mark J. Eisenberg
Circ Cardiovasc Qual Outcomes. published online November 11, 2014;
Circulation: Cardiovascular Quality and Outcomes is published by the American Heart Association, 7272
Greenville Avenue, Dallas, TX 75231
Copyright © 2014 American Heart Association, Inc. All rights reserved.
Print ISSN: 1941-7705. Online ISSN: 1941-7713
The online version of this article, along with updated information and services, is located on the
World Wide Web at:
http://circoutcomes.ahajournals.org/content/early/2014/11/11/CIRCOUTCOMES.113.000723
Data Supplement (unedited) at:
http://circoutcomes.ahajournals.org/content/suppl/2014/11/11/CIRCOUTCOMES.113.000723.DC1.html
Permissions: Requests for permissions to reproduce figures, tables, or portions of articles originally published
in Circulation: Cardiovascular Quality and Outcomes can be obtained via RightsLink, a service of the
Copyright Clearance Center, not the Editorial Office. Once the online version of the published article for
which permission is being requested is located, click Request Permissions in the middle column of the Web
page under Services. Further information about this process is available in the Permissions and Rights
Question and Answer document.
Reprints: Information about reprints can be found online at:
http://www.lww.com/reprints
Subscriptions: Information about subscribing to Circulation: Cardiovascular Quality and Outcomes is online
at:
http://circoutcomes.ahajournals.org//subscriptions/
Downloaded from http://circoutcomes.ahajournals.org/ by guest on November 19, 2014
Original Article
Long-Term Effects of 4 Popular Diets on Weight Loss and
Cardiovascular Risk Factors
A Systematic Review of Randomized Controlled Trials
Renée Atallah, MSc; Kristian B. Filion, PhD; Susan M. Wakil, MD; Jacques Genest, MD;
Lawrence Joseph, PhD; Paul Poirier, MD, PhD; Stéphane Rinfret, MD, SM;
Ernesto L. Schiffrin, MD, PhD; Mark J. Eisenberg, MD, MPH
Background—We conducted a systematic review to examine the efficacy of the Atkins, South Beach, Weight Watchers
(WW), and Zone diets, with a particular focus on sustained weight loss at ≥12 months.
Methods and Results—We systematically searched MEDLINE, EMBASE, and the Cochrane Library of Clinical Trials to
identify randomized controlled trials (RCTs) published in English with follow-up ≥4 weeks that examined the effects
of these 4 popular diets on weight loss and cardiovascular risk factors. We identified 12 RCTs (n=2559) with follow-up
≥12 months: 10 versus usual care (5 Atkins, 4 WW, and 1 South Beach) and 2 head-to-head (1 of Atkins, WW, and Zone,
and 1 of Atkins, Zone, and control). At 12 months, the 10 RCTs comparing popular diets to usual care revealed that
only WW was consistently more efficacious at reducing weight (range of mean changes: −3.5 to −6.0 kg versus −0.8 to
−5.4 kg; P<0.05 for 3/4 RCTs). However, the 2 head-to-head RCTs suggest that Atkins (range: −2.1 to −4.7 kg), WW
(−3.0 kg), Zone (−1.6 to −3.2 kg), and control (−2.2 kg) all achieved modest long-term weight loss. Twenty-four-month
data suggest that weight lost with Atkins or WW is partially regained over time.
Conclusions—Head-to-head RCTs, providing the most robust evidence available, demonstrated that Atkins, WW, and Zone
achieved modest and similar long-term weight loss. Despite millions of dollars spent on popular commercial diets, data
are conflicting and insufficient to identify one popular diet as being more beneficial than the others. (Circ Cardiovasc
Qual Outcomes. 2014;7:00-00.)
Key Words: diet, carbohydrate-restricted ◼ weight loss
A
wide variety of diets are available to promote weight loss
and improve cardiovascular risk factors, such as lipid
levels, blood pressure, and glycemia. Among them, 4 are particularly popular among North Americans. Millions of copies
of Atkins, South Beach (SB), and Zone instructional books
have been sold,1–3 and over a million Weight Watchers (WW)
members attend its weekly group meetings globally.4 These
diets contribute to a North American weight loss market estimated at >$66 billion for 2013.5
Editorial see p 809
Each diet has its own philosophy and macronutrient targets. Atkins is a 4-phase diet based on very low carbohydrate
intake, with unlimited protein and fat consumption.1 SB is
a 3-phase modified low-carbohydrate high-protein diet. It
focuses on controlling carbohydrate intake, as well as eating
lean proteins, mono- or polyunsaturated fats, and low-glycemic index carbohydrates.2 WW is a food, physical activity,
and behavior modification plan that uses a personalized points
system to provide caloric intake restriction and weekly group
sessions led by plan graduates.6 Zone is a low-carbohydrate
diet that recommends the consumption of low-fat proteins,
low-glycemic load carbohydrates, and small amounts of good
fat (eg, olive oil, avocado).3
The efficacy of these 4 popular commercial diets has been
examined in several randomized controlled trials (RCTs), both
comparing them to usual care and to each other. However,
they provided heterogeneous results. Despite their popularity
and their substantial contribution to a billion-dollar industry,
the efficacy of these diets in promoting sustained weight loss
and improving cardiovascular risk factors remains unclear.
Our objective was to examine the efficacy of these 4 diets
Received November 5, 2013; accepted September 18, 2014.
From the Centre for Clinical Epidemiology (R.A., K.B.F., S.M.W., M.J.E.), Lady Davis Institute (R.A., K.B.F., S.M.W., E.L.S., M.J.E.), Department of
Medicine (K.B.F., E.L.S.), and Division of Cardiology (M.J.E.), Jewish General Hospital, McGill University, Montreal, QC, Canada; Division of Clinical
Epidemiology (K.B.F.), Department of Epidemiology, Biostatistics, and Occupational Health (K.B.F., L.J., M.J.E.), and Department of Ophthalmology
(S.M.W.), McGill University, Montreal, QC, Canada; Division of Cardiology, McGill University Health Centre/Royal Victoria Hospital, Montreal, QC,
Canada (J.G.); Division of Clinical Epidemiology, McGill University Health Centre, Montreal, QC, Canada (L.J.); Centre de recherche de l’Institut
universitaire de cardiologie et de pneumologie de Québec, Québec, QC, Canada (P.P., S.R.); and Faculté de pharmacie, Université Laval, Québec, QC,
Canada (P.P.).
The Data Supplement is available at http://circoutcomes.ahajournals.org/lookup/suppl/doi:10.1161/CIRCOUTCOMES.113.000723/-/DC1.
Correspondence to Mark J. Eisenberg, MD, MPH, Divisions of Cardiology and Clinical Epidemiology, Jewish General Hospital/McGill University, 3755
Côte-Ste-Catherine Road, Suite H421, Montreal, Quebec, Canada H3T 1E2. E-mail [email protected]
© 2014 American Heart Association, Inc.
Circ Cardiovasc Qual Outcomes is available at http://circoutcomes.ahajournals.org
DOI: 10.1161/CIRCOUTCOMES.113.000723
Downloaded from http://circoutcomes.ahajournals.org/
by guest on November 19, 2014
1
2 Circ Cardiovasc Qual Outcomes November 2014
identify RCTs conducted in adults and published in English that examined the effect of Atkins, SB, Zone, or WW on weight loss and
cardiovascular risk factors. These 4 diets were chosen as a representative and pragmatic sample of popular commercial diets: the first 3 are
best-selling book-based diets,1–3 whereas WW, another leading popular commercial diet, involves a contrasting meeting-based approach.4
Our search involved the following keywords: Atkins, calorie restriction, carbohydrate-restricted, diet, diet fads, diet therapy, fat-restricted, high-fiber, high-protein, low-carbohydrate, low-fat, popular diet,
obese, Ornish, overweight, protein-restricted, SB, vegetarian diet,
weight loss program, WW, and Zone. Although Ornish was initially
included in our search, it is predominantly used and classified by US
Medicare as Intensive Cardiac Rehabilitation.7 We thus excluded
Ornish from the present study. Finally, we hand-searched references
from published RCTs, relevant reviews, and previous meta-analyses
for additional RCTs.
WHAT IS KNOWN
• The obesity epidemic and its accompanying health
consequences in North America and worldwide are
well-established.
• The efficacy of popular commercial diets at achieving sustained weight loss and improving cardiovascular risk factors remains unclear.
WHAT THE STUDY ADDS
• This systematic review demonstrates that available data
on the efficacy of popular commercial diets are limited
and heterogeneous, with 2 head-to-head trials suggesting that Atkins, Weight Watchers, and Zone achieve
modest and similar long-term weight loss, as well as
similar effects on cardiovascular risk factor levels.
• South Beach was only assessed in 1 long-term trial,
which found no difference in weight loss versus
usual care, and no data were reported on its effects
on cardiovascular risk factor levels.
• Despite millions of dollars spent in the weight loss
industry, available data are conflicting and insufficient to identify one popular diet as being more beneficial than the others.
Inclusion Criteria
in promoting weight loss and improving cardiovascular risk
factors (ie, anthropometric measures, lipid profiles, blood
pressure, and glycemia), with a particular focus on sustained
weight loss at ≥12 months.
Methods
We included RCTs that examined the effects of Atkins, SB, WW, and
Zone (diets described in Table I in the Data Supplement) on weight
loss and cardiovascular risk factors with follow-up ≥4 weeks. A
4-week grace period was allowed for the classification of short- versus long-term RCTs (ie, <12 months versus ≥12 months) to account
for RCTs that measured follow-up in weeks rather than months. We
restricted inclusion to RCTs comparing these diets to usual care or to
each other. To reduce heterogeneity and specifically examine these 4
popular diets, we also restricted inclusion to reports describing these
diets by name or referencing specific manuals for those diets. For
multiphase diets, included RCTs must have examined all phases preceding their final weight maintenance phase.
We excluded trials evaluating the effects of popular diets on weight
maintenance, with participants with malignancies or post-transplant,
without an appropriate active or usual care reference group, and
those randomizing participants to an arm where they could preferentially select their diet, unless data from these participants were
not combined with those of participants randomized directly to the
studied diets.
Search Strategy
Data Extraction and Analysis
We systematically searched the MEDLINE, EMBASE, and Cochrane
Library of Clinical Trials databases from inception to May 2014 to
Data on study characteristics, study population, demographic and
clinical characteristics, intervention characteristics, and use of any
Articles
identified
through
MEDLINE
(n = 2,194)
Articles
identified
through
EMBASE
(n = 5,328)
Articles
identified
through
Cochrane
(n = 3,399)
Articles identified through database searching
(n = 10,921)
Articles identified via hand-searching of references
(n = 296)
Articles after removal of duplicates
(n = 8,097)
Titles/abstracts screened
(n = 8,393)
Articles excluded
(n= 7,748)
Full-text articles assessed for eligibility
(n = 645)
•
Studies included in qualitative synthesis
(n = 26)
•
•
•
•
•
•
•
•
•
•
Figure 1. PRISMA flow diagram.
Full-text articles excluded
(n = 619)
Not an included popular diet/included
popular diet name or manual not referenced (n = 477)
Not relevant (n = 60)
Sub-study/sub-analysis (n = 33)
Not a RCT (n = 20)
No control arm (n = 13)
Weight maintenance (n = 6)
Crossover study (n = 4)
Rationale/study design (n = 2)
Transplant patients (n = 1)
Not in adults (n = 2)
Conference abstract (n=1)
Downloaded from http://circoutcomes.ahajournals.org/ by guest on November 19, 2014
52
213
307
Goldstein (2011)13
Shai (2008)14¶
Foster (2010)15
97
772
170
423
Pinto (2013)17¶
Jebb (2011)18
Jolly (2011)19¶***
Heshka (2003)20
Weight Watchers
Swenson (2007)16
32‡‡
105
Davis (2009)12
South Beach
63
Randomized
Foster (2003)11
Atkins
Study
Downloaded from http://circoutcomes.ahajournals.org/ by guest on November 19, 2014
423§§§
170†††
772#
95║║
26§§
307**
213#
30§
105‡
63*
Analyzed
Participants
104
52
52
48
52
104
104
52
52
52
Duration, wk
BMI: 27–40, ±
comorbidities
Overweight/obese
± comorbidities‡‡‡
BMI: 27–35 with
≥1 other risk factor
for obesity-related
disease##
BMI: 27–50
aged 30–65 y
Severely obese
postgastric bypass
BMI: 30–40,
otherwise healthy
BMI ≥27 aged
40–65 y, or T2DM,
or coronary heart
disease
ADA diet with CR
LFD modeled after
Diabetes Prevention
Program with CR
High-carbohydrate/
LFD with LEARN†
Arms
LFD with CR
AHA LFD with CR
WW
WW
WW
WW
South Beach
Self-help
Nurse-led individual
support at general
practice
Standard care at
general practice
BWL intervention¶¶
AHA LFD
with comprehensive behavioral
program††
Atkins
Atkins
after 4-week Dietary Approach to Stop
Hypertension run-in
Modified
Atkins║
Atkins
BMI ≥25, T2DM
BMI: 30–39.9,
T2DM
Atkins
Obese, otherwise
healthy
Population
Table 1. Baseline Characteristics of Participants in Long-Term (≥12 mo) Trials
Yes for self-help
Yes for
individual
support
Yes for
standard care
Yes for BWL
intervention
Yes
Yes
Yes
Yes
Yes
Yes
Nutritional
Counseling
No
No
No
Yes
Yes
Yes
No
No
No
No
Exercise
Prescription
44.5
50.6
47.4
49.1
40.9‡‡
45.5
51.5
56.0
53.5
44.1
84.6
70.0
86.5
89.5
90.6‡‡
67.8
11.7
51.9
78.1
68.3
Age, y Female, %
NR
88.2
NR
NR
84.4‡‡
70.7
NR
NR
14.3
76.2
White, %
93.6
92.9
86.7
98.1
184.9‡‡
103.4
91.6
92.0
97.1
98.5
Weight, kg
(Continued)
33.7
33.6
31.4
35.9
48.9‡‡
36.1
30.7
33.2
36.0
34.1
BMI,
kg/m2
Atallah et al A Systematic Review of 4 Popular Diets 3
235
Gardner (2007)22¶
235##
120##
52
52
Duration, wk
BMI: 27–40,
premenopausal,
otherwise healthy
BMI: 27–42, with
≥1 cardiometabolic
risk factor‖‖‖
Population
Atkins
Atkins
Zone
WW
Arms
LEARN†
Zone
Yes
Yes
Nutritional
Counseling
No
No
Exercise
Prescription
40.7
49.0
100
53.3
Age, y Female, %
72.3
73.3
White, %
85.0
98.7
31.3
34.7
Weight, kg BMI, kg/m2
ADA indicates American Diabetes Association; AHA, American Heart Association; BMI, body mass index; BWL, behavioral weight loss; CR, calorie restriction; LFD, low-fat diet; NR, not reported; T2DM, type 2 diabetes mellitus;
and WW, Weight Watchers.
*Repeated-measures analysis of variance (ANOVA) with baseline observation carried forward (BOCF).
†The LEARN Program for Weight Management manual contains 16 lessons addressing different aspects of weight management.
‡Intention-to-treat (ITT) analysis with hierarchical linear models to analyze all available data.
§Repeated-measures ANOVA ignoring dropouts.
║Very low carbohydrate content of 25 g/d for the first 6 wk postrandomization increased to 40 g/d thereafter, with unrestricted calorie, protein, or fat intake and encouraging participants to increase their fat consumption through
foods rich in monounsaturated fatty acids.
¶Trial had other arms that were not included.
#ITT analysis with last observation carried forward (LOCF).
**Random-effects linear model fitted to all available data for each variable for all 307 participants.
††Delivered in-person to participants through group sessions held throughout the study follow-up, and comprising topics on behavioral skills (eg, self-monitoring, stimulus control, relapse management); an exercise prescription;
and daily multivitamin supplements.
‡‡Modified ITT analysis including 32 patients who completed ≥1 postoperative assessment (baseline assessment completed by n=43).
§§Completers analysis.
║║Linear mixed models including all participants and using all available data.
¶¶Emphasizing behavioral skills and comprising closed-group meetings led by BWL expert; moderate CR dietary intervention with ≤25% fat; and an exercise prescription.
##Central adiposity, T2DM not insulin-treated, family history of diabetes mellitus, previous gestational diabetes mellitus, impaired glucose tolerance or fasting glycemia, mild-to-moderate dyslipidemia, hypertension treatment,
polycystic ovarian syndrome or infertility with no other apparent cause than weight, lower-limb osteoarthritis, and abdominal hernia.
***Twelve-week dietary intervention.
†††ITT analysis with BOCF.
‡‡‡Trial eligibility: South Asians without comorbidity BMI ≥25, with comorbidity, BMI ≥23; white Europeans/all other ethnic groups without comorbidities BMI ≥30, with comorbidities, BMI ≥28.
§§§ITT analysis with LOCF or linear interpolation and BOCF for participants with no follow-up data.
║║║Fasting glucose ≥6.1 mmol/L, total cholesterol ≥5.2 mmol/L, low-density lipoprotein cholesterol ≥3.4 mmol/L, high-density lipoprotein cholesterol ≤1.0 mmol/L, triglycerides ≥1.7 mmol/L, systolic blood pressure ≥145
mm Hg, diastolic blood pressure ≥90 mm Hg, or current use of medication for hypertension, diabetes mellitus, or dyslipidemia.
120
Analyzed
Participants
Randomized
Dansinger (2005)21¶
Head-to-Head
Study
Table 1. Continued
4 Circ Cardiovasc Qual Outcomes November 2014
Downloaded from http://circoutcomes.ahajournals.org/ by guest on November 19, 2014
Atallah et al A Systematic Review of 4 Popular Diets 5
cointerventions (eg, exercise, nutritional counseling) were independently extracted by 2 reviewers using a standardized form, with disagreements resolved by consensus or by a third reviewer. Nutritional
counseling was defined as any additional, clearly specified one-onone or group meeting with registered dietitians, nutritionists, or other
healthcare professionals or research staff, with training or experience
in obesity management. Outcome data were extracted for the longest follow-up time available; for studies with 24-month follow-up,
12-month data were also extracted. In studies where authors used
multiple statistical methods, we extracted the results of their primary
analysis. Our primary end point was sustained weight loss, defined
as mean weight change at ≥12 months, reported in kg or as mean
percentage change. Secondary end points included mean change and
mean percentage change in body mass index, body fat, waist circumference, waist-to-hip ratio, fasting glucose, fasting insulin, total cholesterol, low-density lipoprotein cholesterol, high-density lipoprotein
cholesterol, triglycerides, systolic blood pressure (SBP), diastolic
blood pressure (DBP), and the prevalence of adverse events. Close
examination of extracted data revealed significant clinical heterogeneity; quantitative meta-analyses were, therefore, not undertaken.8,9
Finally, RCT quality was assessed using the Cochrane Collaboration’s
tool for assessing risk of bias10 independently by 2 reviewers, with
disagreements resolved by consensus or by a third reviewer.
Results
Search Results
Our search yielded 8393 potentially relevant publications
(Figure 1). After screening titles and abstracts, 645 were
retrieved for full-text review. Of those, 26 RCTs met our inclusion criteria.
Study Characteristics
Of the 26 included RCTs, 14 (n=1016) had short-term followup (<12 months) (Table II in the Data Supplement) and 12
(n=2559) had long-term follow-up (≥12 months)11–22 (Table 1).
Ten long-term RCTs were versus usual care (5 Atkins, 4 WW,
and 1 SB), and 2 were head-to-head (1 of Atkins, WW, and
Zone; 1 of Atkins, Zone, and control; Table 1). There was
significant heterogeneity in study populations, control interventions, as well as specific components and delivery of the
popular diets, which prevented quantitative synthesis. Finally,
most of the 26 included RCTs had an unclear risk of bias in
the domains of allocation concealment, blinding, and incomplete data reporting. Six and 5 RCTs, respectively, had high
risks of bias in the latter 2 domains (Figure 2), largely because
of their poor or incomplete outcome collection and high rate
of loss to follow-up.
Participant Characteristics
The majority of the 26 included RCTs assessed the effects of
popular diets in otherwise healthy overweight or obese individuals, whose mean age ranged from 35.5 to 56.0 years (median:
45.0 years; Table II in the Data Supplement ; Table 1). Mean
weight of participants ranged from 65.9 to 184.9 kg (median:
92.5 kg), with 1 RCT conducted in Chinese women23 and
another evaluating the efficacy of SB in severely obese subjects
postgastric bypass surgery.16 Dropouts ≥20% were reported in
13 included RCTs. Finally, the majority of studies were conducted in young, white, obese women, with few data available
on their use in men and in individuals whose body mass index
<30 kg/m2 (Table II in the Data Supplement; Table 1).
Weight Loss and Change in Other Anthropometric
Measures
Short-term RCTs revealed generally greater weight loss and
improvements in other anthropometric measures with popular
diets, with some heterogeneity on Zone.24,25 Findings from the 2
head-to-head RCTs suggest that Atkins, WW, and Zone achieved
similar short-term weight loss and improvements in other
anthropometric measures25,26 (Table III in the Data Supplement).
There was also heterogeneous reporting of changes in weight
and other anthropometric measures in long-term RCTs (Table 2).
At 12 months, the 10 RCTs comparing popular diets to usual
care showed that only WW was consistently more efficacious at
reducing weight (range of mean changes: −3.5 to −6.0 kg versus
−0.8 to −5.4 kg; P<0.05 for 3/4 RCTs; Table 2; Figure 3). This
reduction was accompanied by statistically significant improvements in other anthropometric measures in the 3 WW RCTs
reporting these outcomes. Atkins’ efficacy was inconsistent at
12 and 24 months, whereas the single SB RCT16 found no difference versus usual care among severely obese patients postgastric
Figure 2. Risk of bias of included trials as
per the Cochrane Risk of Bias Tool.
Downloaded from http://circoutcomes.ahajournals.org/ by guest on November 19, 2014
101±19
−3.1±5.8
Downloaded from http://circoutcomes.ahajournals.org/ by guest on November 19, 2014
Intervention
Control
Jebb (2011)18
Intervention
Control
Pinto (2013)17
Weight Watchers
Intervention
Control
Swenson (2007)16
South Beach
12
12
12
24
86.9±11.6
86.5±11.5
98.9±19.1
97.3±17.1
197.5±85
166.5±71
103.3±15.5
103.5±14.4
Intervention
103.3±15.5
Control
103.5±14.4
Intervention
Control
12
−5.06 (SE: 0.31)‡
−2.25 (SE: 0.21)
−6.0 (SE: 0.8)
−5.4 (SE: 0.8)
NR
−6.3 (−8.06, −4.63)
−7.4 (−9.1, −5.63)
−10.87 (−12.1, −9.67)
−10.81 (−12.4, −9.28)
−4.7±6.5‡
91.8±14.3
Foster (2010)15
Intervention
−2.9±4.2
NR
−3.4±4.0
−5.4±5.7
−3.1±4.8
91.3±12.3
91.3±12.3
91.7±10.2
92.2±13.7
93.6±18
NR
Control
24
98.3±16.4
98.7±19.5
Weight
Mean Change,
kg
91.8±14.3
12
12
12
12
Baseline,
kg
Intervention
Control
Shai (2008)14†
Intervention
Control
Goldstein (2011)13
Intervention
Control
Davis (2009)12
Intervention
Control
Foster (2003)11
Atkins
Study
Follow-Up,
mo
NR
NR
−59.6±13.0§
−60.3±15.3§
NR
NR
NR
NR
−4.4±6.7
−2.5±6.3
% Change
31.5±2.6
31.3±2.6
35.5±5.3
36.4±5.0
50.7±8.7
46.3±9.4
36.1±3.59
36.1±3.46
36.1±3.59
36.1±3.46
30.8±3.5
30.6±3.2
30.8±3.5
30.6±3.2
33.1±3.6
33.3±3.0
35±6
37±6
33.9±3.8
34.4±3.1
Baseline,
kg/m2
NR
NR
NR
NR
−1.5±2.1
−1.0±1.4
NR
NR
NR
NR
Mean Change,
kg/m2
Body Mass Index
Table 2. Change in Body Weight and Other Anthropometric Measures in Long-Term (≥12 mo) Trials*
NR
NR
−17.0±4.5
−14.0±5.5
NR
NR
NR
NR
NR
% Change
100±9.2
99.9±9.3
NR
145±16
140±25
NR
106.3±9.1
105.3±9.2
106.3±9.1
105.3±9.2
112±8
113±10
NR
NR
−5.6 (SE: 0.37)‡
−3.16 (SE: 0.28)
NR
NR
NR
−3.8±5.2
−2.8±4.3
NR
NR
NR
NR
Mean Change,
cm
Waist Circumference
Baseline,
cm
33.3±7.0 kg
32.9±7.4 kg
NR
70.5±21 kg
58.4±14 kg
40±7.6 kg
40.4±7.8 kg
40±7.6 kg
40.4±7.8 kg
NR
NR
NR
NR
Baseline,
kg or %
(Continued )
−4.23 (SE: 0.28) kg‡
−1.85 (SE: 0.19) kg
NR
NR
−3.99 kg (−5.50, −2.79)
−3.84 kg (−5.03, −2.64)
−7.83 kg (−7.89, −6.14)
−7.29 kg (−8.55, −6.03)
NR
NR
NR
NR
Mean Change,
kg or %
Body Fat
6 Circ Cardiovasc Qual Outcomes November 2014
22
12
12
84±12
86±13
85±14
99±18
97±14
100±14
94.2±13.1
−1.6 (−2.8, −0.4)
−4.7 (−6.3, −3.1)¶
−2.2 (−3.6, −0.8)
−3.2±6.0
−3.0±4.9
−2.1±4.8
−2.9 (SE: 0.5)‡
−0.2 (SE: 0.4)
−4.3 (SE: 0.4)‡
−1.3 (SE: 0.4)
−3.5 (−4.8, −2.1)║
−0.8 (−2.0, 0.4)
Mean Change,
kg
Weight
NR
NR
NR
NR
% Change
31±3
32±4
31±4
34±4.5
35±3.8
35±3.5
33.8±3.4
33.6±3.7
33.8±3.4
33.6±3.7
33.96±3.9
33.06±3.5
Baseline,
kg/m2
−0.5±2.0
−1.7±2.5¶
−0.9±2.0
−1.1±2.0
−1.1±1.7
−0.7±1.6
−1.1 (SE: 0.2)‡
−0.2 (SE: 0.2)
−1.6 (SE: 0.2)‡
−0.5 (SE: 0.2)
−1.17 (−1.7, −0.7)║
−0.32 (−0.7, 0.1)
Mean Change,
kg/m2
Body Mass Index
All values are mean±SD or mean (95% CI) unless otherwise indicated. NR indicates not reported; and SE, standard error.
* Only long-term follow-up data from these studies are presented in this table.
†Trial had other arms that were not included.
‡P<0.05 for difference between groups.
§Loss of excess body weight.
║P<0.05 for difference between groups; calculated using data presented in the original article.
¶P<0.05 vs. Zone.
Zone
Atkins
Control
Gardner (2007) †
Zone
Weight Watchers
Atkins
Dansinger (2005)21†
Head-to-Head
24
93.1±14.4
Intervention
94.2±13.1
93.1±14.4
93.47±14.15
92.04±14.75
Baseline,
kg
Control
12
12
Follow-Up,
mo
Intervention
Control
Heshka (2003)20
Intervention
Control
Jolly (2011)19†
Study
Table 2. Continued
NR
NR
NR
NR
% Change
NR
108±13
108±11
109±11
101±12
99±12
101±12
99±12
NR
Baseline,
cm
NR
−2.9±5.3
−3.3±5.4
−2.5±4.5
−2.4 (SE: 0.6)‡
−0.6 (SE: 0.6)
−4.1 (SE: 0.6)‡
−1.6 (SE: 0.6)
NR
Mean Change,
cm
Waist Circumference
40±6%
41±6%
38±6%
NR
44±8%
45±9%
44±8%
45±9%
NR
Baseline,
kg or %
−1.3±3.4%
−2.9±4.8%
−1.0±3.4%
NR
NR
NR
Mean Change,
kg or %
Body Fat
Atallah et al A Systematic Review of 4 Popular Diets 7
Downloaded from http://circoutcomes.ahajournals.org/ by guest on November 19, 2014
8 Circ Cardiovasc Qual Outcomes November 2014
Figure 3. Forest plot for mean weight change from baseline to 12 months among long-term trials. N is the number of patients included in
the 12-month analysis. CI indicates confidence interval.
bypass surgery (Table 2; Figure 3). Head-to-head comparisons of Atkins, WW, and Zone, as well as of Atkins, Zone, and
control, suggest that at 12 months, Atkins (range: −2.1 to −4.7
kg), WW (−3.0 kg), Zone (−1.6 to −3.2 kg), and control (−2.2
kg) all achieved modest weight loss.21,22 The only statistically
significant comparisons from these head-to-head RCTs were
reported by Gardner et al22 for Atkins versus Zone for weight
loss and body mass index (Table 2; Figure 3). Overall, much of
the weight loss achieved early in follow-up (eg, <6 months) was
regained over time such that these diets were generally similar in
efficacy relative to control by 12 months (data not shown). This
trend was particularly prominent with the Atkins diet. Similarly,
24-month data suggest that the weight lost with Atkins or WW at
12 months is partially regained over time (Table 2).
Lipid Levels
Of the 14 short-term RCTs, 3 examined the effect of SB,
WW, and Zone on lipid profiles. Eight RCTs provided data
on Atkins and suggest a favorable impact on high-density
lipoprotein cholesterol and triglycerides relative to usual care,
WW, and Zone. However, Atkins may have an adverse effect
on low-density lipoprotein cholesterol levels, with unchanged
or increased levels observed in 5 RCTs (Table IV in the Data
Supplement). Long-term RCTs comparing Atkins to usual care
showed significant improvements in high-density lipoprotein
cholesterol and, to a lesser extent, triglyceride levels at 12 and
24 months; there was no evidence of a low-density lipoprotein
cholesterol increase (Table 3). There were no or limited data
on the effect of SB and WW on lipid profiles versus usual care
at ≥12 months. Finally, results from the 2 long-term head-tohead RCTs found no marked differences between the Atkins,
WW, and Zone diets in improving lipid levels at 12 months,
with only a significant improvement in triglyceride levels for
Atkins versus Zone reported by Gardner et al22 (Table 3).
Blood Pressure
Findings from short-term RCTs showed that Atkins and WW
had favorable effects on SBP and DBP, with benefits being
greatest with the Atkins diet. No blood pressure data were
available regarding SB, and only 1 RCT provided such data
regarding Zone (Table V in the Data Supplement). Atkins and
WW had inconsistent long-term effects on SBP and DBP versus usual care, with only a significant improvement in DBP
at 12 months with WW reported by Heshka et al20 and at 24
months with Atkins reported by Foster et al.15 There were
no blood pressure data for SB (Table 4). Findings from the
2 head-to-head RCTs indicated that Zone was less effective
than Atkins and WW and similar to usual care at improving
SBP and DBP, even increasing SBP in 1 RCT. There were no
statistically significant comparisons in these 2 trials, with the
exception of Atkins being more effective than Zone and control at improving SBP in the study by Gardner et al22 (Table 4).
Glycemic Control Measures
Overall, there were no major differences in glycemic control
measures between popular diets in short-term RCTs. Atkins
showed a trend toward worsened fasting glucose, but improved
fasting insulin. There was limited evidence available on WW
and Zone (1 RCT each) (Table VI in the Data Supplement).
Limited long-term evidence was also available on the impact of
popular diets on glycemic control measures versus usual care
(Atkins: 1 RCT; WW: 2 RCTs) (Table VII in the Data Supplement). Findings from head-to-head RCTs suggest that Atkins,
WW, Zone, and control were similar at improving fasting glucose and insulin at 12 months, with no statistically significant
difference between groups (Table VII in the Data Supplement).
Discussion
Our systematic review was designed to examine the currently
available evidence on the efficacy of the Atkins, SB, WW, and
Zone diets at promoting weight loss and improving cardiovascular risk factors, with a particular focus on sustained weight
loss at ≥12 months. We found a small number of heterogeneous RCTs. Although this heterogeneity prevented quantitative synthesis of our findings,8,9 qualitative synthesis of this
limited body of evidence was nevertheless informative.
Our results suggest that all 4 diets are modestly efficacious
for short-term weight loss, but that these benefits are not sustained long-term. Long-term RCTs comparing popular diets to
usual care suggested that WW might be more efficacious than
Atkins and SB at 12 months, as it was the only diet achieving consistent weight loss across trials. These findings were
Downloaded from http://circoutcomes.ahajournals.org/ by guest on November 19, 2014
Downloaded from http://circoutcomes.ahajournals.org/ by guest on November 19, 2014
Intervention
Control
Jebb (2011)18
Intervention
Control
Pinto (2013)17
Weight Watchers
Intervention
Control
Swenson (2007)16
South Beach
Intervention
Control
12
12
12
24
NR
NR
NR
4.9±0.8
5.0±0.9
5.0±0.9
4.9±0.8
Intervention
12
Control
Foster (2010)15
Intervention
0.00 (SE: 0.04)
0.03 (SE: 0.03)
NR
NR
NR
NR
−0.2±0.7
−0.05±0.54
0.1±0.8
−0.1±0.7
NR
NR
NR
NR
NR
NR
NR
0.003±0.25
−0.075±0.21
3.0±0.9
NR
2.5±0.7
2.4±0.7
3.4±0.8
3.1±0.8
Baseline,
mmol/L
NR
NR
NR
3.1±0.7
3.2±0.8
3.1±0.7
3.2±0.8
3.0±0.9
3.0±0.9
NR
5.02±0.65
5.17±0.96
4.4±0.8
4.3±0.9
NR
% Change
Control
24
5±0.8
5.2±0.9
Mean Change,
mmol/L
3.0±0.9
12
12
12
12
Follow-Up, Baseline,
mmol/L
mo
−0.01 (SE: 0.03)
0.02 (SE: 0.03)
NR
NR
−0.12 (−0.24, −0.01)
−0.21 (−0.3, −0.12)
−0.22 (−0.33, −0.11)
−0.22 (−0.33, −0.12)
−0.078
−0.001
NR
NR
−0.04±0.6
−0.2±0.7
NR
Mean Change,
mmol/L
NR
NR
NR
NR
NR
NR
NR
0.008±0.43
−0.08±0.31
% Change
Low-Density Lipoprotein Cholesterol
Intervention
Control
Shai (2008)14‡
Intervention
Control
Goldstein (2011)13
Intervention
Control
Davis (2009)12
Intervention
Control
Foster (2003)11
Atkins
Study
Total Cholesterol
Table 3. Change in Lipid Levels in Long-Term (≥12 mo) Trials*
NR
NR
NR
1.2±0.4
1.2±0.3
1.2±0.4
1.2±0.3
1±0.2
1±0.3
1±0.2
1±0.3
1.14±0.34
1.1±0.3
1.3±0.2
1.2±0.3
1.2±0.3
1.3±0.3
Baseline,
mmol/L
0.06 (SE: 0.01)
0.04 (SE: 0.01)
NR
NR
0.2 (0.16, 0.25)†
0.12 (0.07, 0.14)
0.21 (0.16, 0.25)†
0.10 (0.065, 0.14)
0.22†
0.17
NR
0.11±0.2
0.14±0.23
0.2±0.3†
0.1±0.2
NR
Mean Change,
mmol/L
1.4±0.9
Baseline,
mmol/L
NR
NR
NR
NR
NR
NR
NR
NR
NR
NR
1.3±0.6
1.4±0.8
1.3±0.6
1.4±0.8
2.1±1.3
1.8±0.7
2.1±1.3
1.8±0.7
2.31±1.12
2.21±0.97
1.4±0.8
1.4±0.7
0.28±0.50† 1.5±1.3
0.041±0.29
% Change
High-Density Lipoprotein Cholesterol
−0.09 (SE: 0.03)
−0.06 (SE: 0.03)
NR
NR
−0.14 (−0.26, −0.02)
−0.16 (−0.29, −0.04)
−0.20 (−0.32, −0.09)†
−0.36 (−0.45, −0.27)
−0.27†
−0.032
NR
−0.45±0.76
−0.045±0.62
−0.2±0.9
0.0±0.9
NR
Mean Change,
mmol/L
Triglycerides
(Continued )
NR
NR
NR
NR
NR
NR
NR
−0.19±0.26†
0.008±0.04
% Change
Atallah et al A Systematic Review of 4 Popular Diets 9
12
12
NR
NR
−0.3±0.9
5.74±1.19
−0.1±0.6
−0.2±0.6
5.72±1.19
5.53±0.8
5.54±0.98 −0.3 (SE: 0.05)
NR
NR
NR
NR
% Change
2.95±0.83
2.82±0.75
2.69±0.75
3.57±1.16
3.67±1
3.52±0.8
NR
NR
0.0±0.5
0.0±0.6
0.0±0.4
−0.3±0.9
−0.2±0.7
−0.2±0.6
NR
NR
Mean Change,
mmol/L
NR
NR
NR
NR
% Change
Low-Density Lipoprotein Cholesterol
Baseline,
mmol/L
All values are mean±SD or mean (95% CI) unless otherwise indicated. NR indicates not reported; and SE, standard error.
*Only long-term follow-up data from these studies are presented in this table.
†P<0.05 for difference between groups.
‡Trial had other arms that were not included.
§P<0.05 vs. Zone.
Zone
Atkins
Control
Gardner (2007)22‡
Zone
Weight Watchers
Atkins
Dansinger (2005)21†‡
Head-to-Head
Intervention
5.4±0.92 −0.3 (SE: 0.05)
Control
24
NR
5.4±0.92 −0.25 (SE: 0.04)
NR
5.54±0.98 −0.23 (SE: 0.04)
12
12
Total Cholesterol
Mean Change,
mmol/L
Intervention
Control
Heshka (2003)20
Intervention
Control
Jolly (2011)19‡
Study
Follow-Up, Baseline,
mmol/L
mo
Table 3. Continued
NR
1.34±0.28
1.37±0.36
1.31±0.28
1.24±0.34
1.22±0.06
1.24±0.41
1.29±0.31
1.26±0.33
0.1±0.2
0.1±0.2
0.1±0.2
0.1±0.3
0.1±0.3
0.1±0.2
0.0 (SE: 0.02)
0.0 (SE: 0.02)
1.29±0.31 0.052 (SE: 0.02)
1.26±0.33 0.021 (SE: 0.02)
NR
Mean Change,
mmol/L
NR
NR
NR
NR
% Change
High-Density Lipoprotein Cholesterol
Baseline,
mmol/L
1.39±1.11
1.4±0.88
1.34±0.82
2.19±1.39
1.74±0.98
1.72±1.12
1.75±1.12
1.59±0.93
1.75±1.12
1.59±0.93
NR
Baseline,
mmol/L
Triglycerides
0.0±0.5
−0.3±0.7§
−0.2±0.7
0.0±1.7
−0.1±0.7
0.0±0.9
−0.0 (SE: 0.05)
−0.0 (SE: 0.04)
−0.088 (SE: 0.042)
0.017 (SE: 0.043)
NR
Mean Change,
mmol/L
NR
NR
NR
NR
% Change
10 Circ Cardiovasc Qual Outcomes November 2014
Downloaded from http://circoutcomes.ahajournals.org/ by guest on November 19, 2014
Atallah et al A Systematic Review of 4 Popular Diets 11
Table 4. Change in Blood Pressure in Long-Term (≥12 mo) Trials*
Systolic Blood Pressure
Study
Follow-Up, mo
Baseline, mm Hg
Mean Change, mm Hg
123.3±14.1
NR
Diastolic Blood Pressure
% Change
Baseline, mm Hg
Mean Change, mm Hg
77.6±10.8
NR
% Change
Atkins
Foster (2003)11
Control
Intervention
Davis (2009)12
Control
Intervention
Goldstein (2011)13
Control
Intervention
Shai (2008)14†
Control
Intervention
Control
Intervention
Foster (2010)15
Control
Intervention
Control
Intervention
South Beach
Swenson (2007)16
Control
Intervention
Weight Watchers
Pinto (2013)17
Control
Intervention
Jebb (2011)18
Control
Intervention
Jolly (2011)19†
Control
Intervention
Heshka (2003)20
Control
Intervention
Control
Intervention
Head-to-Head
Dansinger (2005)21†
Atkins
Weight Watchers
Zone
12
120.5±11.0
1.7±11.8
−1.0±9.4
74.6±8.5
−3.8±13.2
−3.7±12.4
12
130±17
125±18
−1.8±22.6
2.0±15.6
NR
77±10
73±9
−2.2±11.6
−2.9±9.4
NR
12
136±14
140±17
−5±12
−14±38
NR
80±9
79±10
−3.8±7
−8.3±19
NR
12
129.6±13.2
130.8±15.1
129.6±13.2
130.8±15.1
NR
79.1±9.1
79.4±9.1
79.1±9.1
79.4±9.1
−0.9±8.1
−0.8±8.7
−2.19 (−3.58, −0.79)
−3.25 (−4.74, −1.76)
−0.5 (−2.13, 1.13)
−3.2 (−4.66, −1.73)‡
NR
24
NR
−4.3±11.8
−3.9±12.8
NR
NR
124.6±15.8
124.3±14.1
124.6±15.8
124.3±14.1
−4.06 (−6.07, −2.05)
−5.64 (−7.62, −3.67)
−2.6 (−5.07, −0.12)
−2.7 (−5.08, −0.27)
NR
76±9.7
73.9±9.4
76±9.7
73.9±9.4
12
NR
NR
NR
NR
NR
NR
12
NR
NR
NR
NR
NR
NR
12
124.2±14.7
124.7±17.1
−1.50 (SE: 0.64)
−2.37 (SE: 0.67)
NR
79.1±9.0
78.2±9.8
−1.29 (SE: 0.41)
−1.61 (SE: 0.44)
NR
12
NR
NR
NR
NR
NR
NR
12
121±12
123±14
121±12
123±14
0.2 (SE: 0.8)
−0.6 (SE: 0.9)
−2.4 (SE: 1.0)
−2.2 (SE: 1.1)
NR
79±9
79±8
79±9
79±8
1.4 (SE: 0.6)
−0.4 (SE: 0.6)‡
0.0 (SE: 0.6)
−0.6 (SE: 0.7)
NR
129±17
133±17
130±16
0.2±12
−2.7±13.0
1.4±15.0
NR
77±9
74±11
77±10
−1.4±7.5
−1.7±6.4
−1.2±9.5
NR
116±12
−3.1±9.3
75±9
−2.2±6.7
118±11
−7.6±11.0§║
NR
75±8
−4.4±8.4
115±13
−3.3±8.1
74±9
−2.1±5.8
12
24
24
12
Gardner (2007)22†
Control
Atkins
Zone
12
All values are mean±SD or mean (95% CI) unless otherwise indicated. NR indicates not reported; and SE, standard error.
*Only long-term follow-up data from these studies are presented in this table.
†Trial had other arms that were not included.
‡P<0.05 for difference between groups.
§P<0.05 vs. Zone.
║P<0.05 vs. Control.
Downloaded from http://circoutcomes.ahajournals.org/ by guest on November 19, 2014
NR
12 Circ Cardiovasc Qual Outcomes November 2014
not replicated in head-to-head RCTs, the most robust evidence available. Rather, head-to-head RCTs suggest that at
12 months, Atkins, WW, and Zone all achieved modest and
similar weight loss. Moreover, 24-month data suggest that the
modest weight losses achieved with Atkins or WW are partially
regained over time. Moreover, there were more limited data on
the long-term effects of the 4 popular diets on other cardiovascular risk factors, with Atkins and WW being the most studied. Overall, results from the 2 long-term head-to-head RCTs
showed no marked differences among Atkins, WW, and Zone
at improving cardiovascular risk factor levels. Although North
Americans spend millions of dollars in the weight loss industry, available data are conflicting and insufficient to identify
one popular diet as being more beneficial than the others.
The prevalence of overweight and obesity has risen steadily
over the past few decades worldwide, with nearly 1.5 billion
adults estimated to be overweight or obese as of 2008.27 In the
United States, the prevalence of overweight and obesity reaches
69.2% and 35.9%, respectively.28 The health consequences of
this trend are well-established and include increased prevalences of cardiovascular disease, metabolic syndrome, and
type 2 diabetes mellitus.29 Consequently, effective prevention
and management strategies are needed to reduce the burdens
of overweight, obesity, and their associated comorbidities.30,31
Despite their popularity,1–4 the Atkins, SB, WW, and Zone
diets seem to only achieve modest sustained weight loss.
Comprehensive lifestyle interventions aimed at curbing both
adult and childhood obesity are urgently needed. Interventions
that include dietary, behavioral, and exercise components, as
well as legislative measures and industry regulations, may be
better suited to the multifaceted obesity epidemic.32
Our results stem from the review of RCTs that predominantly enrolled young, white, obese women. Few data were
available in other ethnic groups or in individuals who were
overweight but not obese. The paucity of data available in men
is also concerning. Pagoto et al.33 previously highlighted this
underrepresentation in their systematic review of RCTs investigating different lifestyle interventions for weight loss, where
the average proportions of men and women were 27% versus
73%, respectively.33 Thus, our findings regarding study populations in RCTs in this area are not an isolated occurrence.
The generalizability of the weight loss observed with
these popular diets in RCTs to a real-world setting remains
unclear. We found that 12-month mean weight loss with WW
ranged from 3.0 to 6.0 kg.17–22 In a recent observational study
of individuals prescribed a 12-month WW diet by healthcare professionals through the UK’s WW National Health
Service Referral Scheme, median weight loss was 2.8 kg at 12
months.34 Thus, the weight loss achieved in the ideal conditions of RCTs likely overestimates that achieved by patients
seen as part of everyday clinical practice.
To our knowledge, our study is the first systematic review
of RCTs to specifically focus on the Atkins, SB, WW, and
Zone diets. A previous systematic review of major commercial weight loss programs in the United States examined the
3 major nonmedical weight loss programs at the time (WW,
Jenny Craig, LA Weight loss), as well as medically supervised
proprietary programs, online programs, and organized selfhelp programs, but excluded book-based diets.35 This previous
review included case series in addition to RCTs. Similar to our
findings, the authors concluded that: “With the exception of
1 trial of WW, the evidence to support the use of major commercial and self-help weight loss programs is suboptimal.”35
Limitations
First, our review focused on the Atkins, SB, Zone, and WW popular diets. To ensure this, only RCTs clearly referencing or mentioning the diet name were included, which could have resulted
in fewer included studies. Moreover, other commercial diets are
available that were not studied here; such diets deserve to be the
object of additional studies. However, the 4 included diets constitute a representative sample of commercial North American popular diets. Second, some of the included RCTs were limited by
relatively small sample sizes and may have been underpowered.
Third, a key principle of RCTs is the use of intention-to-treat
analysis in which all patients are included. Included studies had
high attrition rates, and studies varied in their statistical approach
to address this limitation, each of which rests on a given set of
assumptions: completers’ analysis assumes participants completing the trial are similar to those who do not, resulting in potential selection bias, whereas the last-observation-carried-forward
method assumes that participants’ subsequent outcomes are the
same as the last one available, underestimating the data’s true
variability.36 Although using missing data techniques such as multiple imputation can help reduce the bias because of incomplete
follow-up, every effort must be made to ensure complete followup to ensure the validity of trials. Fourth, inclusion was restricted
to published data. We reviewed a large number of RCTs during
the conduct of our systematic review, and only a small number
of the published RCTs were well-designed. Thus, the probability that there are well-designed RCTs that are unpublished
is low, limiting the potential contribution of these unpublished
data. Nonetheless, the presence of publication bias, a potential
limitation of all systematic reviews, cannot be excluded. Finally,
all included trials were open-label, a limitation inherent to trials
examining dietary interventions.
Conclusions
Our study was designed to examine the evidence currently
available from the literature to examine the efficacy of 4
commercial, popular diets on weight loss and improving cardiovascular risk factors, with a particular focus on sustained
weight loss at ≥12 months. Our results suggest that all 4 diets
are modestly efficacious at decreasing weight in the shortterm, but that these benefits are not sustained long-term. RCTs
comparing popular diets to usual care showed that only WW
consistently demonstrated greater efficacy at reducing weight
at 12 months. Head-to-head RCTs demonstrated that Atkins,
WW, and Zone are all modestly and similarly efficacious at
achieving sustained weight loss at ≥12 months. Finally, while
North Americans spend millions of dollars in the weight loss
industry, available data are conflicting and insufficient to identify one popular diet as being more beneficial than the others.
Acknowledgments
We thank Yevgeniya Mizina, Anna Eisenberg, and Tara Dourian for
their help with data abstraction, and Maria Eberg for generating the
forest plot.
Downloaded from http://circoutcomes.ahajournals.org/ by guest on November 19, 2014
Atallah et al A Systematic Review of 4 Popular Diets 13
Sources of Funding
This work was supported by the Canadian Institutes of Health
Research (CIHR; grant number MOP-87343). Dr. Wakil was supported by a Canadian Cardiovascular Outcomes Research Team summer
studentship funded through a CIHR Team Grant in Cardiovascular
Outcomes Research. Dr. Filion is a CIHR New Investigator. Dr.
Poirier is a Senior Clinician-Research Scholar from the Fonds de
recherche du Québec-Santé. Dr. Schiffrin holds a Canada Research
Chair (CRC) on Hypertension and Vascular Research from CIHR/
Government of Canada CRC Program.
Disclosures
None.
References
1. Atkins RC. Dr. Atkins’ New Diet Revolution. New York, NY: HarperCollins;
2002.
2. Agatston A. The South Beach Diet. New York, NY: St. Martin’s Press; 2005.
3. Sears B. A Week in the Zone. New York, NY: HarperCollins; 2004.
4. Weight Watchers International, Inc. United States Securities and Exchange
Commission Form 10-K. February 27, 2013. Available at: http://www.
weightwatchersinternational.com/phoenix.zhtml?c=130178&p=irolsec&seccat01.1_rs=31&seccat01.1_rc=10&control_searchbox=&control_
selectgroup=0. Accessed July 26, 2013.
5. PRWEB. U.S. Weight loss market forecast to hit $66 billion in 2013.
December 31, 2012. Available at: http://www.prweb.com/releases/2012/12/prweb10278281.htm. Accessed April 1, 2014.
6. Weight Watchers International, Inc. The science behind the PointsPlus™
Program. Available at: http://www.weightwatchers.ca/util/art/index_art.
aspx?tabnum=4&art_id=52761. Accessed August 1, 2013.
7.The Ornish Spectrum. Available at: http://www.ornishspectrum.com/.
Accessed August 1, 2013.
8. Egger M, Smith GD, Sterne JA. Uses and abuses of meta-analysis. Clin
Med. 2001;1:478–484.
9. DerSimonian R, Kacker R. Random-effects model for meta-analysis of
clinical trials: an update. Contemp Clin Trials. 2007;28:105–114.
10.Higgins JP, Altman DG, Gøtzsche PC, Jüni P, Moher D, Oxman AD,
Savovic J, Schulz KF, Weeks L, Sterne JA; Cochrane Bias Methods Group;
Cochrane Statistical Methods Group. The Cochrane Collaboration’s tool
for assessing risk of bias in randomised trials. BMJ. 2011;343:d5928.
11. Foster GD, Wyatt HR, Hill JO, McGuckin BG, Brill C, Mohammed BS,
Szapary PO, Rader DJ, Edman JS, Klein S. A randomized trial of a lowcarbohydrate diet for obesity. N Engl J Med. 2003;348:2082–2090.
12. Davis NJ, Tomuta N, Schechter C, Isasi CR, Segal-Isaacson CJ, Stein D,
Zonszein J, Wylie-Rosett J. Comparative study of the effects of a 1-year dietary intervention of a low-carbohydrate diet versus a low-fat diet on weight
and glycemic control in type 2 diabetes. Diabetes Care. 2009;32:1147–1152.
13. Goldstein T, Kark JD, Berry EM, Adler B, Ziv E, Raz I. The effect of a low
carbohydrate energy-unrestricted diet on weight loss in obese type 2 diabetes patients—a randomized controlled trial. e-SPEN. 2011;6:e178–e186.
14. Shai I, Schwarzfuchs D, Henkin Y, Shahar DR, Witkow S, Greenberg I,
Golan R, Fraser D, Bolotin A, Vardi H, Tangi-Rozental O, Zuk-Ramot R,
Sarusi B, Brickner D, Schwartz Z, Sheiner E, Marko R, Katorza E, Thiery
J, Fiedler GM, Blüher M, Stumvoll M, Stampfer MJ; Dietary Intervention
Randomized Controlled Trial (DIRECT) Group. Weight loss with a low-carbohydrate, Mediterranean, or low-fat diet. N Engl J Med. 2008;359:229–241.
15. Foster GD, Wyatt HR, Hill JO, Makris AP, Rosenbaum DL, Brill C, Stein
RI, Mohammed BS, Miller B, Rader DJ, Zemel B, Wadden TA, Tenhave
T, Newcomb CW, Klein S. Weight and metabolic outcomes after 2 years
on a low-carbohydrate versus low-fat diet: a randomized trial. Ann Intern
Med. 2010;153:147–157.
16. Swenson BR, Saalwachter Schulman A, Edwards MJ, Gross MP, Hedrick
TL, Weltman AL, Northrup CJ, Schirmer BD, Sawyer RG. The effect of
a low-carbohydrate, high-protein diet on post laparoscopic gastric bypass
weight loss: a prospective randomized trial. J Surg Res. 2007;142:308–313.
17.Pinto AM, Fava JL, Hoffmann DA, Wing RR. Combining behavioral
weight loss treatment and a commercial program: a randomized clinical
trial. Obesity. 2013;21:673–680.
18. Jebb SA, Ahern AL, Olson AD, Aston LM, Holzapfel C, Stoll J, AmannGassner U, Simpson AE, Fuller NR, Pearson S, Lau NS, Mander AP,
Hauner H, Caterson ID. Primary care referral to a commercial provider for
weight loss treatment versus standard care: a randomised controlled trial.
Lancet. 2011;378:1485–1492.
19. Jolly K, Lewis A, Beach J, Denley J, Adab P, Deeks JJ, Daley A, Aveyard
P. Comparison of range of commercial or primary care led weight reduction programmes with minimal intervention control for weight loss in obesity: Lighten Up randomised controlled trial. BMJ. 2011;343:d6500.
20. Heshka S, Anderson JW, Atkinson RL, Greenway FL, Hill JO, Phinney
SD, Kolotkin RL, Miller-Kovach K, Pi-Sunyer FX. Weight loss with selfhelp compared with a structured commercial program: a randomized trial.
JAMA. 2003;289:1792–1798.
21. Dansinger ML, Gleason JA, Griffith JL, Selker HP, Schaefer EJ. Comparison
of the Atkins, Ornish, Weight Watchers, and Zone diets for weight loss and
heart disease risk reduction: a randomized trial. JAMA. 2005;293:43–53.
22. Gardner CD, Kiazand A, Alhassan S, Kim S, Stafford RS, Balise RR,
Kraemer HC, King AC. Comparison of the Atkins, Zone, Ornish, and
LEARN diets for change in weight and related risk factors among overweight premenopausal women: the A TO Z Weight Loss Study: a randomized trial. JAMA. 2007;297:969–977.
23. Liu X, Zhang G, Ye X, Li H, Chen X, Tang L, Feng Y, Shai I, Stampfer
MJ, Hu FB, Lin X. Effects of a low-carbohydrate diet on weight loss and
cardiometabolic profile in Chinese women: a randomised controlled feeding trial. Br J Nutr. 2013;110:1444–1453.
24. Landers P, Wolfe MM, Glore S, Guild R, Phillips L. Effect of weight loss
plans on body composition and diet duration. J Okla State Med Assoc.
2002;95:329–331.
25. McAuley KA, Hopkins CM, Smith KJ, McLay RT, Williams SM, Taylor
RW, Mann JI. Comparison of high-fat and high-protein diets with a
high-carbohydrate diet in insulin-resistant obese women. Diabetologia.
2005;48:8–16.
26.Truby H, Baic S, deLooy A, Fox KR, Livingstone MB, Logan CM,
Macdonald IA, Morgan LM, Taylor MA, Millward DJ. Randomised controlled trial of four commercial weight loss programmes in the UK: initial
findings from the BBC “diet trials”. BMJ. 2006;332:1309–1314.
27. Finucane MM, Stevens GA, Cowan MJ, Danaei G, Lin JK, Paciorek CJ,
Singh GM, Gutierrez HR, Lu Y, Bahalim AN, Farzadfar F, Riley LM,
Ezzati M; Global Burden of Metabolic Risk Factors of Chronic Diseases
Collaborating Group (Body Mass Index). National, regional, and global
trends in body-mass index since 1980: systematic analysis of health examination surveys and epidemiological studies with 960 country-years
and 9·1 million participants. Lancet. 2011;377:557–567.
28. Flegal KM, Carroll MD, Kit BK, Ogden CL. Prevalence of obesity and
trends in the distribution of body mass index among US adults, 19992010. JAMA. 2012;307:491–497.
29. Poirier P, Giles TD, Bray GA, Hong Y, Stern JS, Pi-Sunyer FX, Eckel
RH; American Heart Association; Obesity Committee of the Council on
Nutrition, Physical Activity, and Metabolism. Obesity and cardiovascular
disease: pathophysiology, evaluation, and effect of weight loss: an update
of the 1997 American Heart Association Scientific Statement on Obesity
and Heart Disease from the Obesity Committee of the Council on Nutrition,
Physical Activity, and Metabolism. Circulation. 2006;113:898–918.
30. Mozaffarian D, Afshin A, Benowitz NL, Bittner V, Daniels SR, Franch HA,
Jacobs DR Jr, Kraus WE, Kris-Etherton PM, Krummel DA, Popkin BM, Whitsel
LP, Zakai NA; American Heart Association Council on Epidemiology and
Prevention, Council on Nutrition, Physical Activity and Metabolism, Council on
Clinical Cardiology, Council on Cardiovascular Disease in the Young, Council
on the Kidney in Cardiovascular Disease, Council on Peripheral Vascular
Disease, and the Advocacy Coordinating Committee. Population approaches to
improve diet, physical activity, and smoking habits: a scientific statement from
the American Heart Association. Circulation. 2012;126:1514–1563.
31.Kushner RF. Clinical assessment and management of adult obesity.
Circulation. 2012;126:2870–2877.
32. Eisenberg MJ, Atallah R, Grandi SM, Windle SB, Berry EM. Legislative
approaches to tackling the obesity epidemic. CMAJ. 2011;183:1496–1500.
33. Pagoto SL, Schneider KL, Oleski JL, Luciani JM, Bodenlos JS, Whited
MC. Male inclusion in randomized controlled trials of lifestyle weight loss
interventions. Obesity. 2012;20:1234–1239.
34. Ahern AL, Olson AD, Aston LM, Jebb SA. Weight Watchers on prescription: an observational study of weight change among adults referred to
Weight Watchers by the NHS. BMC Public Health. 2011;11:434.
35. Tsai AG, Wadden TA. Systematic review: an evaluation of major commercial
weight loss programs in the United States. Ann Intern Med. 2005;142:56–66.
36. Gadbury GL, Coffey CS, Allison DB. Modern statistical methods for handling missing repeated measurements in obesity trial data: beyond LOCF.
Obes Rev. 2003;4:175–184.
Downloaded from http://circoutcomes.ahajournals.org/ by guest on November 19, 2014
SUPPLEMENTAL MATERIAL
1. Supplemental Tables
Table 1: Overview of the five popular diets
p. 2
Table 2: Baseline characteristics of participants in short-term
(4 to 24 weeks) trials
p. 3
Table 3: Change in body weight and other anthropometric measures
in short-term (4 to 24 weeks) trials
p. 5
Table 4: Change in lipid levels in short-term (4 to 24 weeks) trials
p. 7
Table 5: Change in blood pressure in short-term (4 to 24 weeks) trials
p. 9
Table 6: Change in glycemic control outcomes in short-term
(4 to 24 weeks) trials
p. 10
Table 7: Change in glycemic control in long-term (≥12 months) trials
p. 11
2. Supplemental References
p. 12
Supplemental Table 1. Overview of the five popular diets
Diet
Atkins1
Ornish2
South Beach3
Weight
Watchers4
Zone5
Duration of
Treatment
Energy Intake
%
Protein
Type of
Protein
Not
Specified
%
Phase 1:
2 weeks.
Phase 2:
Ongoing weight
loss
Phase 3:
Until target
weight is
maintained.
Phase 4:
Lifelong
maintenance
Indefinite
Not specified
10
30
Not specified
20
Lean proteins
70
Phase 1:
2 weeks
Phase 2:
Until target
weight is
achieved.
Phase 3:
Lifelong
maintenance
Plan is until
healthy weight
is maintained.
After:
maintenance
plan.
Indefinite
Not specified
30
Lean Proteins
20
Points based on
caloric content,
fiber and fat
content. Min:
1050
Max: 2350
Men:
1400-1500
calories
Women: 11001200 calories
20 25
Lean Proteins
30
Not specified
Carbohydrates
Type of
Carbohydrate
Strict Rules
%
Fat
Type of Fat
Low
Carb
Low
Fat
Alcohol Intake
Caffeine
Intake
60
Not specified
Yes
No
Phase 1:
none
After:
in moderation
(counted as a
carbohydrate)
Avoid
caffeine
Whole grains,
fruits, vegetables
Phase 1: very
limited
Phase 2 and 3:
Moderate
limitations on
processed carbs
10
Not specified
No
Yes
None
50
Poly- or monounsaturated
Yes
Yes
Wine is allowed
(especially red
wine).
About a glass/day.
Avoid
caffeine
No
restriction
45
55
Whole Grains,
Fruits, Vegetables
20
35
No
Yes
Based on point
system.
1 cup/day for
women. 2 cups/day
for men.
No
restriction
40
Low glycemic load
30
Recommend 2
tablespoons of
healthy oil
(monounsaturated,
vitamin E)
Plan approved
fats: e.g.
Almonds,
olive oil,
avocado.
Yes
Yes
Treated as a
carbohydrate. 1
serving of alcohol
= 10g of
carbohydrates
Avoid
caffeine
2
Supplemental Table 2. Baseline characteristics of participants in short-term (4 to 24 weeks) trials.
Study
Participants
Randomized
Analyzed
Duration
(Weeks)
Population
Arms
Nutritional
Counseling
Exercise
Prescription
Age
(y)
Female
(%)
Caucasian
(%)
Weight
(kg)
BMI
(kg/m2)
Atkins
BMI > 24.5,
premenopausal,
otherwise healthy
BMI: 25-40,
premenopausal,
otherwise healthy
Rankin
20076
32*
29*,†
4
NickolsRichardson
20057
28
28
6
Phillips
20088
28
20†
6‡
BMI: 29-39,
otherwise healthy
Hernandez
20109§
32
32
6
BMI: 30-40,
otherwise healthy
Liu10
2013
50
49#
12
BMI ≥ 24**,
aged 30-65
50
40†
16
53
42†
24
Yancy
200413
120
119#
24
South Beach
Aude
200414
Weight Watchers
60
54†
12
Rippe
199815
80
44†
12
292
257†
24
91##
33†, ##
12
BMI > 27,
otherwise healthy
96***
93†††
24
BMI > 27,
insulin-resistant,
otherwise healthy
Atkins
176
176§§§
24
BMI: 27-40,
otherwise healthy
Atkins
Brehm
200511
Brehm
200312
Johnston
201316
Zone
Landers
200217|| ||
BMI: 30-35,
otherwise healthy
BMI: 30-35,
otherwise healthy
BMI: 30-60,
hyperlipidemic,
generally healthy
BMI ≥ 27,
otherwise healthy
Overweight/obese,
otherwise
healthy§§
BMI: 27-40,
aged ≥ 18
Atkins
HC/LP/LFD
with CR
No
No
39.5*
100
87.5
83.3*
32.1
Atkins
NCEP HC/LFD
with CR
Yes
No
39.5
100
NR
82.0
30.7
No
No
35.5†
75.0†
70.0†
97.8†
33.9†
Yes
No
43.1
68.8
NR
102
NR
No
No
47.9
100
0
65.9
26.7
Yes
No
43.0†
100
80.0
90.8†
33.2†
Yes
No
43.7†
100
75.5
91.7†
33.6†
Atkins minus
750 calories
for 4 weeks
AHA LFD minus
750 calories
for 4 weeks
HC/US Food Guide
Atkins
Pyramid LFD
with CR
with comprehensive behavioral
program||
Traditional Chinese
Atkins
diet design with
CR††
AHA LFD
Atkins
with CR
AHA LFD
Atkins
with CR
Atkins + Daily
Supplements
LFD
with CR
Yes
Yes
44.9#
76.5#
76.5#
97.3#
34.3‡‡
South Beach
with CR
NCEP diet
with CR
Yes
No
45.1†
51.9†
NR
99.5†
35.2†
WW
Maintenance
of current
diet/exercise
No
No
36.8†
100
NR
81.5†
NR
WW
Self-help
No
No
46.6
89.7
90.7
90.1
33.0
Zone
Hypocaloric
diabetic exchange
diet
Yes
No
NR
NR
NR
NR
NR
Zone
HC/high-fibre
diet
No
Yes
45.6†††
100
100
95.8†††
35.7†††
WW
Maintenance
Of current
diet/exercise
No
Yes
40.5
73.9
NR
89.0
31.5
Head-to-Head
McAuley
200518, || ||
Truby 2006,
200919, 20, || ||,
‡‡‡
AHA indicates American Heart Association; BMI, body mass index; CR, calorie restriction; HC, High-carbohydrate; LP, Low-protein; LFD, low-fat diet; NCEP, National Cholesterol Education Program; NR, not reported;
WW, Weight Watchers.
* The number of participants in each arm of the study is not reported. Baseline characteristics were averaged across groups assuming an equal sample size in each treatment group. † Completers analysis. ‡ The dietary
3
intervention involved a 4-week weight loss phase and a 2-week weight maintenance phase. Except for fasting glucose and insulin outcomes reported at 4 and 6 weeks, all other outcomes of interest were reported at 2 and 6
weeks of follow-up, hence 6-week outcomes were included in our systematic review. § Substudy of Foster et. al21 with independent measurements except for those assessing weight. || Delivered in-person to participants
through group sessions held throughout the study follow-up, and comprising topics on behavioural skills (e.g., self-monitoring, stimulus control, relapse management); an exercise prescription; and daily multivitamin
supplements. # Intention-to-treat analysis (ITT). ** Overweight for the Chinese people is defined as BMI ≥ 24. †† Daily CR to 65% on average of usual intake, with calories from carbohydrates, protein and fat being 5055%, 17-19% and 26-33%, respectively. ‡‡ Linear mixed-effects model analysis which assumes non-informative dropouts. §§ Study participants’ weight exceeded the 1983 Metropolitan Life Insurance Table of desirable
weight for height by 20 to 50%. || || Trial had other arms that were not included. ## A total of 91 participants were randomized to 1 of 3 dietary interventions. The results presented are that of the 33 study completers in the
Zone or usual care arms only. *** Of the 96 participants randomized, 3 withdrew before the start of their assigned diet intervention and were excluded from analyses. ††† ITT analysis, with mixed-models comprising a
random effect for each participant and assuming an underlying variance-covariance structure. ‡‡‡ Lipid and glycemic control measures data for the Truby et al.19 trial were reported in a secondary paper by Morgan et al.20
§§§ ITT analysis with baseline observation carried forward (BOCF).
4
Supplemental Table 3. Change in body weight and other anthropometric measures in short-term (4 to 24 weeks) trials.
Followup
(Weeks)
Study
Atkins
Rankin 20076
Control
Intervention
NickolsRichardson 20057
Control
Intervention
Phillips 20088
Control
Intervention
Hernandez 20109
Control
Intervention
Liu 201310
Weight
Body Mass Index
Baseline
(kg)
FollowUp
(kg)
Mean
Change
(kg)
4
79.2±16.0
87.3±15.2
76.6±15.7
83.5±14.8
6
79.8±12.1
84.6±12.7
6
6
Control
Body Fat
% Change
Follow-Up
(kg/m2)
Mean
Change
(kg/m2)
Baseline
(cm)
Follow-Up
(cm)
Mean
Change
(cm)
Baseline
(kg or %)
Follow-Up
(kg or %)
Mean
Change
(kg or %)
-2.6±1.7
-3.8±1.2
NR
31.4±5.4
32.7±5.5
NR
NR
NR
NR
NR
NR
NR
NR
75.6±15.4
78.2±15.9
-4.2†
-6.4†, §
NR
30.3±5.5
31.1±4.9
29.0±5.3
29.3±4.6
-1.3†
-1.8†
NR
NR
NR
NR
NR
NR
100.2 (SE: 3.7)
95.4 (SE: 4.1)
96.1 (SE: 4.0)
89.9 (SE: 3.8)
-4.0 (SE: 0.5)
-5.2 (SE: 0.6)
NR
33.8 (SE: 1.1)
34.0 (SE: 0.9)
32.3 (SE: 1.2)
32.0 (SE: 0.8)
-1.5†
-2.0†
NR
NR
NR
NR
NR
NR
103±11
101±13
95.4±11.3
97.3±12.9
-6.0±3.5
-6.2±4.8
NR
NR
NR
NR
NR
NR
NR
NR
NR
NR
NR
67.0 (SE: 1.3)
61.2 (SE: 1.1)
-5.1
(-5.5, -4.7)
-5.3
(-6.1, -4.5)
26.9 (SE: 0.4)
24.5 (SE: 0.4)
91.0 (SE: 1.1)
84.2 (SE: 1.3)
23.1 (SE: 0.8) kg
20.1 (SE: 0.7) kg
NR
26.6 (SE: 0.5)
24.4 (SE: 0.4)
90.2 (SE: 1.1)
82.4 (SE: 1.4)
22.6 (SE: 0.8) kg
20.1 (SE: 0.8) kg
37.15 (SE: 0.92)
kg
37.89 (SE: 1.27)
kg
33.91 (SE: 1.29)
kg
31.70 (SE: 1.41)
kg
37.83±2.65 kg
35.85±4.13 kg
37.33±4.79 kg
32.55±5.17 kg
41.1±NR %
38.3±NR %
41.0±NR %
35.2±NR %
12
Intervention
Waist Circumference
Baseline
(kg/m2)
64.8 (SE: 1.3)
59.5 (SE: 1.2)
-2.1
(-2.2, -1.9)
-2.2
(-2.6, -1.8)
-6.5
(-8.3, -4.7)
-7.9
(-9.2, -6.5)
-2.59
(-3.02, -2.15) kg
-2.48
(-3.10, -1.85) kg
Brehm 200511
Control
90.9 (SE: 2.1)
16
Intervention
Brehm 2003
Control
-6.14 (SE: 0.91)
NR
90.6 (SE: 2.4)
-9.79 (SE :
0.71)§
33.5 (SE: 0.5)
NR
NR
NR
NR
NR
NR
NR
NR
NR
NR
NR
NR
NR
NR
NR
NR
32.8 (SE: 0.5)
-3.2 (SE: 0.67) kg
-6.2 (SE: 0.67)§
kg
12
Intervention
92.31±6.0
24
91.2±8.4
-3.9 (SE: 1.0)
NR
-8.5 (SE: 1.0)§
34.04±1.83
NR
33.17±1.83
-2.0 (SE: 0.75) kg
-4.8 (SE: 0.67)§
kg
Yancy 200413
Control
96.8±19.2
24
Intervention
South Beach
Aude 200414
Control
12
Intervention
Weight Watchers
Rippe 199815
Control
12
Intervention
Johnston 201316
Control
24
Intervention
Zone
Landers 200217*
Control
12
Intervention
Head-to-Head
McAuley 200518*,‡
Control
Atkins
8
Zone
19, 20
Truby 2006, 2009
,*
Control
Atkins
24
WW
NR
97.8±15.0
-6.5
(-8.4, -4.6)
-12.0§
(-13.8, -10.2)
-6.7
(-8.7, -4.8)
-12.9§
(-14.8, -10.9)
34.0±5.2
34.6±4.9
-2.8
(-3.9, -1.9) %
-5.8§
(-6.7, -4.8) %
99.9±21.1
99.1±31.9
NR
-3.4±2.0
-6.2±1.8§
NR
35.5±6.0
34.9±4.0
NR
NR
NR
NR
NR
NR
NR
NR
82.1±5.3
81.2±7.6
NR
1.3±1.3
-6.1±4.0§
NR
NR
NR
NR
NR
NR
NR
36.2±2.7%
36.8±2.6 %
36.0±NR %
32.5±NR %
-0.2†
-4.8†,§
90.0±12.7
90.2±14.1
NR
-0.6±NR
-4.6±NR§
NR
32.8±3.6
33.1±3.7
NR
NR
NR
NR
NR
NR
NR
NR
NR
NR
-5.4±2.8
-4.4±3.2
NR
NR
NR
NR
NR
NR
NR
NR
NR
-3.52±2.62 kg
-3.62±2.28 kg
98.0±15.1
96.0±10.8
93.2±14.5
93.7±14.6
89.4±10.3
87.8±13.7
-4.3†
-6.6†,§
-5.4†,§
NR
36.6±5.6
36.0±3.9
34.5±5.3
35.2±5.6
33.5±3.7
32.4±4.8
-1.4†
-2.5†,§
-2.1†,§
109.1±11.6
108.9±9.9
108.0±11.5
104.3±10.9
100.6±9.6
100.3±9.6
-4.8†
-8.3†,§
-7.7†,§
46.1±9.9 kg
44.2±6.9 kg
42.1±8.0 kg
42.7±9.7 kg
39.8±7.1 kg
39.0±7.8 kg
-3.4†
-4.4†,§
-3.1†,§
87.9±13.5
90.3±12.7
88.8±13.3
NR
0.6±2.2
-6.0±6.4
-6.6±5.4
0.6±2.7
-6.2±6.2
-7.3±6.1
31.5±2.9
31.9±2.2
31.2±2.7
NR
NR
100±10.1
102±10.6
100±10.3
NR
-0.8±3.8
-8.1±7.4
-8.3±7.0
33.4±6.5 kg
35.7±6.0 kg
34.2±6.9 kg
NR
0.3±4.4 kg
-4.6±4.8 kg
-5.0±4.3 kg
All values are mean±SD or mean (95% CI) unless otherwise indicated. NR indicates not reported; SE, standard error; WW, Weight Watchers.
5
* Trial had other arms that were not included. † Calculated from data in the publication. ‡ Data at the end of the 8-week intervention period, not including weight maintenance period (the study’s maximum duration of follow-up is 24 weeks). § p<0.05 vs. Control.
6
Supplemental Table 4. Change in lipid levels in short-term (4 to 24 weeks) trials.
Study
Follow-up
(Weeks)
Baseline
TC
(mmol/L)
Total Cholesterol
TC at
Follow-Up
(mmol/L)
TC
Mean Change
(mmol/L)
Baseline
(mmol/L)
Follow-Up
(mmol/L)
Mean Change
(mmol/L)
Baseline
(mmol/L)
Follow-Up
(mmol/L)
Mean Change
(mmol/L)
Baseline
(mmol/L)
Follow-Up
(mmol/L)
Mean Change
(mmol/L)
4
NR
NR
NR
NR
NR
NR
NR
NR
NR
NR
NR
NR
6
NR
NR
NR
NR
NR
NR
NR
NR
NR
NR
NR
NR
6
3.95 (SE: 0.22)
4.08 (SE: 0.11)
3.76 (SE: 0.22)
4.22 (SE: 0.16)
-0.19‡
0.14‡
2.43 (SE: 0.18)
2.13 (SE: 0.37)
2.18 (SE: 0.24)
2.47 (SE: 0.35)
-0.25‡
0.34‡
1.29 (SE: 0.11)
1.41 (SE: 0.14)
1.15 (SE: 0.12)
1.41 (SE: 0.13)
-0.14‡
0.0‡
0.68 (SE: 0.08)
0.88 (SE: 0.16)
0.78 (SE: 0.27)
0.65 (SE: 0.05)
0.10‡
-0.23‡
1.1†
(IQR: 1.0, 1.2)
1.1†
(IQR: 0.9, 1.5)
-0.3±0.5
NR
1.2†
(IQR: 1.1, 1.5)
1.1†
(IQR: 0.9, 1.6)
1.02±0.55
NR
2.4†
(IQR: 2.2, 2.9)
3.1†
(IQR: 2.5, 3.4)
1.3±0.62
NR
2.6†
(IQR: 2.4, 3.0)
2.8†
(IQR: 2.0, 3.3)
-0.1±0.2
6
0.0±0.3
1.4±0.66
0.91±0.33
-0.5±0.7
3.44 (SE: 0.20)
2.99 (SE: 0.13)
1.44 (SE: 0.08)
1.31 (SE: 0.07)
1.33 (SE: 0.12)
0.90 (SE: 0.11)
3.30 (SE: 0.16)
3.35 (SE: 0.23)
1.30 (SE: 0.07)
1.45 (SE: 0.07)
1.69 (SE: 0.26)
0.79 (SE: 0.07)
Atkins
Rankin 20076
Control
Intervention
NickolsRichardson 20057
Control
Intervention
Phillips 20088
Control
Intervention
Hernandez 20109
Low-Density Lipoprotein Cholesterol
Control
Intervention
High-Density Lipoprotein Cholesterol
-0.2±0.2
0.3±0.7#
Triglycerides
Liu 201310
Control
-0.5
(-0.84, -0.17)
0.05
(-0.40, 0.50)
-0.14
(-0.27, -0.00)
0.16
(-0.02, 0.34)#
-0.45
(-0.57, -0.33)
-0.88
(-1.37, -0.41)
4.55 (SE: 0.16)
5.01 (SE: 0.21)
5.00 (SE: 0.25)
16
5.08 (SE: 0.21)
5.31 (SE: 0.25)
4.89 (SE: 0.25)
5.17 (SE: 0.27)
-0.19‡
-0.14‡
3.24 (SE: 0.15)
3.49 (SE: 0.21)
3.02 (SE: 0.21)
3.42 (SE: 0.26)
-0.22‡
-0.07‡
1.15 (SE: 0.04)
1.15 (SE: 0.05)
1.2 (SE: 0.05)
1.34 (SE: 0.07)
0.05‡
0.19‡,#
1.65 (SE: 0.23)
1.46 (SE: 0.15)
1.48 (SE: 0.15)
0.91 (SE: 0.07)
-0.17‡
-0.55‡
24
4.78 (SE: 0.16)
5.34 (SE: 0.17)
4.74 (SE: 0.16)
5.32 (SE: 0.18)
-0.04‡
-0.02‡
2.95 (SE: 0.16)
3.23 (SE: 0.14)
2.79 (SE: 0.15)
3.21 (SE: 0.15)
-0.16‡
-0.02‡
1.26 (SE: 0.06)
1.34 (SE: 0.07)
1.37 (SE: 0.07)
1.52 (SE: 0.07)
0.11‡
0.16‡
1.23 (SE: 0.11)
1.68 (SE: 0.15)
1.25 (SE: 0.14)
1.29 (SE: 0.17)
0.02‡
-0.39‡
24
6.20±NR
6.32±NR
5.85±NR
6.11±NR
-0.35 (NR)
-0.21 (NR)
3.83±NR
4.07±NR
3.64±NR
4.11±NR
-0.19 (NR)
0.04 (NR)
1.40±NR
1.43±NR
1.36±NR
1.57±NR
-0.04 (NR)
0.14 (NR)#
2.15±NR
1.78±NR
1.84±NR
0.94±NR
-0.3 (NR)
-0.8 (NR)#
12
5.33±0.95
5.51±1.2
NR
-0.3±0.5
-0.3±0.8
3.17±0.69
3.32±1.16
NR
-0.2±0.4
-0.1±0.7
1.41±0.48
1.3±0.37
NR
-0.1±0.2
-0.0±0.2
1.64±0.899
2.05±1.51
NR
-0.2±0.5
-0.5±1.1
12
NR
NR
NR
NR
NR
NR
NR
NR
NR
NR
NR
NR
24
NR
NR
NR
NR
NR
NR
NR
NR
NR
NR
NR
NR
12
12
NR
NR
NR
NR
NR
NR
NR
NR
NR
NR
NR
NR
8
8
8
5.9±0.9
5.8±1.0
5.7±1.0
5.3±0.9
5.5±1.2
5.0±0.8
-0.6‡
-0.3‡,††
-0.7‡
3.9±0.8
3.8±0.9
3.7±0.8
3.6±0.9
3.8±1.0
3.3±0.7
-0.3‡
0.0‡
-0.4‡,**
1.16±0.21
1.17±0.28
1.21±0.23
1.09±0.25
1.18±0.29
1.16±0.24
-0.07‡
0.01‡,#
-0.05‡
1.77±0.57
1.78±0.76
1.86±0.66
1.46±0.51
1.09±0.25
1.23±0.43
-0.31‡
-0.69‡,#
-0.63‡,#
24
24
5.80±1.1
5.77±0.9
NR
NR
-0.5±0.2
-0.3±0.8
3.64±0.84||
3.72±0.52||
3.55±0.73||
3.56±0.76||
-0.09‡
-0.16‡
1.19±0.22||
1.22±0.23||
1.04±0.20||
1.14±0.32||
-0.15‡
-0.08‡
1.40±0.65||
1.65±0.70||
1.38±0.65||
1.01±0.33||
-0.02‡
-0.64‡
24
5.58±1.1
NR
-0.6±0.7#
3.56±0.81||
3.13±0.58||
-0.43‡
1.16±0.24||
0.98±0.15||
-0.18‡
1.55±0.77||
1.20±0.47||
-0.35‡
Intervention
Brehm 200511
Control
Intervention
Brehm 200312
Control
Intervention
Yancy 200413
Control
Intervention
South Beach
Aude 200414
Control
Intervention
Weight Watchers
Rippe 199815
Control
Intervention
Johnston 201316
Control
Intervention
Zone
Landers 200217*
Control
Intervention
Head-to-Head
McAuley 200518*,§
Control
Atkins
Zone
Truby 2006, 200919, 20*
Control
Atkins
Weight
Watchers
-0.68
(-1.11, -0.26)
0.01
(-0.61, 0.62)
5.19 (SE: 0.24)
12
All values are mean±SD or mean (95% CI) unless otherwise indicated. IQR indicates interquartile range; NR, not reported; SE, standard error.
7
* Trial had other arms that were not included. † Median (IQR). ‡ Calculated from data in the publication. § Data at the end of the 8-week intervention period, not including weight maintenance period (the study’s maximum
duration of follow-up is 24 weeks). || Lipid data for the Truby et al. trial were reported in a secondary paper by Morgan et al.20 # p<0.05 vs. Control. ** p<0.05 vs. Atkins. †† p<0.05 vs. Zone.
8
Supplemental Table 5. Change in blood pressure in short-term (4 to 24 weeks) trials.
Study
Atkins
Rankin 20076
Control
Intervention
NickolsRichardson 20057
Control
Intervention
Phillips 20088
Control
Intervention
Hernandez 20109
Control
Intervention
Liu 201310
Follow-up
(Weeks)
Baseline
(mm Hg)
Systolic Blood Pressure
Follow-Up
Mean Change
(mm Hg)
(mm Hg)
Diastolic Blood Pressure
Follow-Up
Mean Change
(mm Hg)
(mm Hg)
% Change
4
NR
NR
NR
NR
NR
NR
NR
NR
6
NR
NR
NR
NR
NR
NR
NR
NR
6
124.1 (SE: 4.0)
123.3 (SE: 3.1)
115.2 (SE: 3.0)
112.6 (SE: 2.7)
-8.9†
-10.7†
NR
73.2 (SE: 3.6)
70.0 (SE: 3.5)
66.8 (SE: 3.3)
65.8 (SE: 2.6)
-6.4†
-4.2†
NR
6
NR
NR
NR
NR
NR
NR
NR
NR
131.4 (SE: 3.4)
116.4 (SE: 2.6)
85.5 (SE: 2.0)
77.7 (SE: 2.0)
NR
134.0 (SE: 3.4)
113.7 (SE: 2.0)
86.5 (SE: 1.6)
75.7 (SE: 1.5)
-8.1
(-11.3, -4.8)
-10.8
(-13.0, -8.7)
16
119 (SE: 2.9)
119 (SE: 3.5)
24
Control
-15.7
(-20.4, -11.0)
-20.3
(-24.8, -15.8)
NR
116 (SE: 3.5)
110 (SE: 3.4)
-3†
-9†
NR
77 (SE: 1.7)
76 (SE: 1.7)
75 (SE: 2.8)
71 (SE: 2.1)
-2†
-5†
NR
115 (SE: 2.47)
116 (SE: 3.23)
113 (SE: 2.41)
114 (SE: 2.82)
-2†
-2†
NR
75 (SE: 1.99)
79 (SE: 2.69)
74 (SE: 1.62)
74 (SE: 2.23)
-1†
-5†
NR
NR
NR
NR
NR
NR
NR
NR
NR
NR
NR
NR
NR
NR
NR
NR
NR
NR
NR
117.4±8.8
117.2±13.8
114.5±9.6
110.7±13.1
-3.2±11.8
-6.5±13.1
NR
81.1±6.5
81.0±7.0
79.0±6.7
76.7±8.8
-2.1±7.9
-4.3±9.6§
NR
NR
NR
NR
NR
NR
NR
NR
NR
NR
NR
NR
NR
NR
NR
NR
NR
126±11
130±14
124±13
122±13
118±14
122±14
-4†
-12†
-2†
NR
81±10
83±10
80±9
80±9
76±10
76±7
-1†
-7†
-4†
NR
12
Intervention
Brehm 200511
Control
Intervention
Brehm 200312
Control
Intervention
Yancy 200413
% Change
Baseline
(mm Hg)
Control
24
Intervention
South Beach
Aude 200414
Control
12
Intervention
Weight Watchers
Rippe 199815
Control
12
Intervention
16
Johnston 2013
Control
24
Intervention
Zone
Landers 200217*
Control
12
Intervention
Head-to-Head
McAuley 200518*,‡
Control
Atkins*
8
Zone*
Truby 2006, 200919, 20*
Control
Atkins
24
Weight
Watchers
130±16.1
135±15.1
127±15.1
NR
-7.5
(-11.6, -3.5)
-9.6
(-13.3, -6.0)
-2.8±11.8
-7.2±11.6
-4.1±11.7
NR
81±9.6
83±10.7
80±10.7
NR
-5.2
(-7.5, -2.9)
-6.0
(-8.0, -3.9)
-1.6±7.4
-4.9±8.1
NR
NR
NR
-4.4±8.6
All values are mean±SD or mean (95% CI) unless otherwise indicated. NR indicates not reported; SE, standard error.
* Trial had other arms that were not included. † Calculated from data in the publication. ‡ Data at the end of the 8-week intervention period, not including weight
maintenance period (the study’s maximum duration of follow-up is 24 weeks). § p<0.05 vs. Control.
9
Supplemental Table 6. Change in glycemic control outcomes in short-term (4 to 24 weeks) trials.
Baseline
(mmol/L)
Fasting Glucose
Follow-Up
(mmol/L)
Mean Change
(mmol/L)
Baseline
(pmol/L)
4
4.71±0.59
4.76±0.31
4.63±0.26
4.53±0.42
-0.08†
-0.23†
NR
NR
NR
6
NR
NR
NR
NR
NR
NR
6
4.99 (SE: 0.11)
5.09 (SE: 0.06)
5.07 (SE: 0.09)
5.33 (SE: 0.12)
0.08†
0.24†
118.4#
126.4#
100.4#
87.5#
-18†
-38.9†
6
4.76±0.46
4.75±0.61
4.75±0.36
4.8±0.42
-0.0±0.3
0.1±0.6
74.3±42.4
78.48±50.7
54.87±39.59
45.84±25
-19.5±36.8
-32.6±55.6
6.15 (SE: 0.24)
5.86 (SE: 0.19)
NR
NR
NR
6.01 (SE: 0.18)
6.11 (SE: 0.24)
-0.32
(-0.83, 0.20)
0.12
(-0.52, 0.76)
16
5 (SE: 0.01)
NR
NR
151 (SE: 22)
135 (SE: 12)
133 (SE: 18)
86 (SE: 10)
-18†
-49†
24
5.06 (SE: 0.12)
5.5 (SE: 0.14)
4.86 (SE: 0.11)
5.00 (SE: 0.12)
NR
166 (SE: 16.25)
117.37 (SE: 12.50)
125.7 (SE: 14.6)
100 (SE: 9.72)
-40.3†
-17.37†
24
NR
NR
NR
NR
NR
NR
12
NR
NR
NR
NR
NR
NR
12
NR
NR
NR
NR
NR
NR
24
NR
NR
NR
NR
NR
NR
12
NR
NR
NR
NR
NR
NR
5.0±0.6
4.8±0.4
-0.2†
4.8±0.4
-0.3†
5.1±0.5
5.0±0.6
-0.1†
73.6§
(52.8, 77.1)
60.4§
(7.4,10.2)
46.5§
(39.58, 54.2)
-29.2†
5.1±0.6
102.79§
(84.7, 123.6)
104.18§
(84.7, 127.8)
82.65§
(70.84, 95.8)
-0.1±0.5
-0.2±0.5
68.1±35.6||
73.2±35.1||
75.9±45.0||
54.8±32.4||
7.8†
-18.4†
-0.5±0.6**
62.2±32.4||
52.9±30.2||
-9.3†
Follow-up
(Weeks)
Study
Atkins
Rankin 20076
Control
Intervention
NickolsRichardson 20057
Control
Intervention
Phillips 20088*,†
Control
Intervention
Hernandez 20109
Control
Intervention
Liu 201310
Control
12
Intervention
Brehm 200511
Control
Intervention
Brehm 200312
Control
Intervention
Yancy 200413
Control
Intervention
South Beach
Aude 200414
Control
Intervention
Weight Watchers
Rippe 199815
Control
Intervention
Johnston 201316
Control
Intervention
Zone
Landers 200217*
Control
Intervention
Head-to-Head
McAuley 200518*,‡
Control
Atkins
8
Zone
19, 20
Truby 2006, 2009
Control
Atkins
Weight
Watchers
Fasting Insulin
Follow-Up
(pmol/L)
Mean Change
(pmol/L)
-43.8†
-36.2†
*
24
5.48±0.5
5.47±0.5
5.46±0.5
NR
All values are mean±SD or mean (95% CI) unless otherwise indicated. NR indicates not reported; SE, standard error.
* Trial had other arms that were not included. † Calculated from data in the publication. ‡ Data at the end of the 8-week intervention period, not
including weight maintenance period (the study’s maximum duration of follow-up is 24 weeks). § Geometric mean. || Glycemic control measures
data for the Truby et al. trial were reported in a secondary paper by Morgan et al.20 # Values reported in mg/dL in the publication are: Baseline:
Atkins: 18.2 (SE: 3), Control: 17.05 (SE: 3.92); 6 weeks: Atkins: 12.6 (SE: 1.2), Control: 14.46 (SE: 2.09). ** p<0.05 vs. Control.
10
Supplemental Table 7. Change in glycemic control in long-term (≥12 months) trials.*
Fasting Glucose
Follow-up
(Months)
Study
Fasting Insulin
Baseline
(mmol/L)
Mean Change
(mmol/L)
Baseline
(pmol/L)
Mean Change
(pmol/L)
12
NR
NR
NR
NR
12
NR
NR
NR
NR
10.4±1.9
2.1±1.3
10.5±2.6
1.8±0.9
NR
NR
Atkins
Foster 200322
Control
Intervention
Davis 2009
Control
23
Intervention
Goldstein 2011
Control
24
Intervention
Shai 200825‡
Control
Intervention
Control
Intervention
Foster 201021
Control
Intervention
Control
Intervention
South Beach
Swenson 200726
Control
Intervention
12
12
24
2.3±0.7
92.4±47.2
5.1±1.6
NR
2.3±0.7
5.1±1.6
97.9±70.8
92.4±47.2
NR
97.9±70.8
12
NR
NR
NR
NR
12
NR
NR
NR
NR
12
NR
NR
NR
NR
12
NR
12
NR
NR
NR
4.94±0.67
0.20 (SE: 0.03)
125.01±69.45
-2.1 (SE: 3.5)
5.11±0.78
4.94±0.67
0.19 (SE: 0.03)
0.3 (SE: 0.04)
125.01±62.51
125.01±69.45
-13.9 (SE: 3.5)†
16.0 (SE: 4.2)
5.11±0.78
0.3 (SE: 0.04)
125.01±62.51
4.2 (SE: 4.2)†
7.06±3.44
0.1±1.7
152.8±111.1
-8.3±46.5
6.44±2.94
-0.3±1.1
138.9±69.45
-18.1±42.4
6.44±2.67
-0.2±1.0
215.3±256.97
-37.5±97.2
5.3±0.9
0.0±0.5
69.45±55.6
-12.5±35.4
5.1±0.5
-0.1±0.7
69.45±48.62
-12.5±33.3
5.2±1.1
-0.1±0.4
69.45±48.62
-10.4±34.0
24
Weight Watchers
Marinilli Pinto 201327
Control
Intervention
Jebb 201128
Control
Intervention
Jolly 201129‡
Control
Intervention
Heshka 2003
Control
Intervention
12
24
Head-to-Head
Dansinger 200531‡
Atkins
Weight Watchers
12
Zone
Gardner 200732‡
Control
Zone
NR
-0.65 (SE: 0.95)
-3.89 (SE: 0.97)†
NR
30
Intervention
Control
Atkins
0.01 (SE: 0.03)
-0.06 (SE: 0.02)†
12
All values are mean±SD or mean (95% CI) unless otherwise indicated. NR indicates not reported; SE, standard error.
* Only long-term follow-up data from these studies are presented in this table. † p<0.05 for difference between
groups. ‡ Trial had other arms that were not included.
11
SUPPLEMENTAL REFERENCES
1.
2.
3.
4.
5.
6.
7.
8.
9.
10.
11.
12.
13.
14.
15.
16.
17.
18.
19.
20.
Atkins RC. Dr. Atkins' New Diet Revolution. New York: HarperCollins; 2002.
The Ornish Spectrum. Available at: http://www.ornishspectrum.com/. Accessed: August 1, 2013.
Agatston A. The South Beach Diet. New York: St. Martin's Press; 2005.
Weight Watchers International, Inc. The science behind the PointsPlus™ Program. Available at:
http://www.weightwatchers.ca/util/art/index_art.aspx?tabnum=4&art_id=52761. Accessed: August 1,
2013.
Sears B. A Week in the Zone. New York: HarperCollins; 2004.
Rankin JW, Turpyn AD. Low carbohydrate, high fat diet increases c-reactive protein during weight loss.
J Am Coll Nutr. 2007;26:163-169.
Nickols-Richardson SM, Coleman MD, Volpe JJ, Hosig KW. Perceived hunger is lower and weight loss
is greater in overweight premenopausal women consuming a low-carbohydrate/high-protein vs highcarbohydrate/low-fat diet. J Am Diet Assoc. 2005;105:1433-1437.
Phillips SA, Jurva JW, Syed AQ, Kulinski JP, Pleuss J, Hoffmann RG, Gutterman DD. Benefit of lowfat over low-carbohydrate diet on endothelial health in obesity. Hypertension. 2008;51:376-382.
Hernandez TL, Sutherland JP, Wolfe P, Allian-Sauer M, Capell WH, Talley ND, Wyatt HR, Foster GD,
Hill JO, Eckel RH. Lack of suppression of circulating free fatty acids and hypercholesterolemia during
weight loss on a high-fat, low-carbohydrate diet. Am J Clin Nutr. 2010;91:578-585.
Liu X, Zhang G, Ye X, Li H, Chen X, Tang L, Feng Y, Shai I, Stampfer MJ, Hu FB, Lin X. Effects of a
low-carbohydrate diet on weight loss and cardiometabolic profile in Chinese women: A randomised
controlled feeding trial. Br J Nutr. 2013;110:1444-1453.
Brehm BJ, Spang SE, Lattin BL, Seeley RJ, Daniels SR, D'Alessio DA. The role of energy expenditure
in the differential weight loss in obese women on low-fat and low-carbohydrate diets. J Clin Endocrinol
Metab. 2005;90:1475-1482.
Brehm BJ, Seeley RJ, Daniels SR, D'Alessio DA. A randomized trial comparing a very low
carbohydrate diet and a calorie-restricted low fat diet on body weight and cardiovascular risk factors in
healthy women. J Clin Endocrinol Metab. 2003;88:1617-1623.
Yancy WS, Jr., Olsen MK, Guyton JR, Bakst RP, Westman EC. A low-carbohydrate, ketogenic diet
versus a low-fat diet to treat obesity and hyperlipidemia: A randomized, controlled trial. Ann Intern
Med. 2004;140:769-777.
Aude YW, Agatston AS, Lopez-Jimenez F, Lieberman EH, Marie A, Hansen M, Rojas G, Lamas GA,
Hennekens CH. The National Cholesterol Education Program diet vs a diet lower in carbohydrates and
higher in protein and monounsaturated fat: A randomized trial. Arch Intern Med. 2004;164:2141-2146.
Rippe JM, Price JM, Hess SA, Kline G, DeMers KA, Damitz S, Kreidieh I, Freedson P. Improved
psychological well-being, quality of life, and health practices in moderately overweight women
participating in a 12-week structured weight loss program. Obes Res. 1998;6:208-218
Johnston CA, Rost S, Miller-Kovach K, Moreno JP, Foreyt JP. A randomized controlled trial of a
community-based behavioral counseling program. Am J Med. 2013;126:1143.e19-1143.e24.
Landers P, Wolfe MM, Glore S, Guild R, Phillips L. Effect of weight loss plans on body composition
and diet duration. J Okla State Med Assoc. 2002;95:329-331.
McAuley KA, Hopkins CM, Smith KJ, McLay RT, Williams SM, Taylor RW, Mann JI. Comparison of
high-fat and high-protein diets with a high-carbohydrate diet in insulin-resistant obese women.
Diabetologia. 2005;48:8-16.
Truby H, Baic S, deLooy A, Fox KR, Livingstone MB, Logan CM, Macdonald IA, Morgan LM, Taylor
MA, Millward DJ. Randomised controlled trial of four commercial weight loss programmes in the UK:
Initial findings from the BBC "diet trials". BMJ. 2006;332:1309-1314.
Morgan LM, Griffin BA, Millward DJ, DeLooy A, Fox KR, Baic S, Bonham MP, Wallace JM,
MacDonald I, Taylor MA, Truby H. Comparison of the effects of four commercially available weightloss programmes on lipid-based cardiovascular risk factors. Public Health Nutr. 2009;12:799-807.
12
21.
22.
23.
24.
25.
26.
27.
28.
29.
30.
31.
32.
Foster GD, Wyatt HR, Hill JO, Makris AP, Rosenbaum DL, Brill C, Stein RI, Mohammed BS, Miller B,
Rader DJ, Zemel B, Wadden TA, Tenhave T, Newcomb CW, Klein S. Weight and metabolic outcomes
after 2 years on a low-carbohydrate versus low-fat diet: A randomized trial. Ann Intern Med.
2010;153:147-157.
Foster GD, Wyatt HR, Hill JO, McGuckin BG, Brill C, Mohammed BS, Szapary PO, Rader DJ, Edman
JS, Klein S. A randomized trial of a low-carbohydrate diet for obesity. New Engl J Med. 2003;348:20822090.
Davis NJ, Tomuta N, Schechter C, Isasi CR, Segal-Isaacson CJ, Stein D, Zonszein J, Wylie-Rosett J.
Comparative study of the effects of a 1-year dietary intervention of a low-carbohydrate diet versus a
low-fat diet on weight and glycemic control in type 2 diabetes. Diabetes Care. 2009;32:1147-1152.
Goldstein T, Kark JD, Berry EM, Adler B, Ziv E, Raz I. The effect of a low carbohydrate energyunrestricted diet on weight loss in obese type 2 diabetes patients - a randomized controlled trial. e-SPEN.
2011;6:e178-e186.
Shai I, Schwarzfuchs D, Henkin Y, Shahar DR, Witkow S, Greenberg I, Golan R, Fraser D, Bolotin A,
Vardi H, Tangi-Rozental O, Zuk-Ramot R, Sarusi B, Brickner D, Schwartz Z, Sheiner E, Marko R,
Katorza E, Thiery J, Fiedler GM, Bluher M, Stumvoll M, Stampfer MJ. Weight loss with a lowcarbohydrate, mediterranean, or low-fat diet. N Engl J Med. 2008;359:229-241.
Swenson BR, Saalwachter Schulman A, Edwards MJ, Gross MP, Hedrick TL, Weltman AL, Northrup
CJ, Schirmer BD, Sawyer RG. The effect of a low-carbohydrate, high-protein diet on post laparoscopic
gastric bypass weight loss: A prospective randomized trial. J Surg Res. 2007;142:308-313.
Pinto AM, Fava JL, Hoffmann DA, Wing RR. Combining behavioral weight loss treatment and a
commercial program: A randomized clinical trial. Obesity. 2013;21:673-680.
Jebb SA, Ahern AL, Olson AD, Aston LM, Holzapfel C, Stoll J, Amann-Gassner U, Simpson AE, Fuller
NR, Pearson S, Lau NS, Mander AP, Hauner H, Caterson ID. Primary care referral to a commercial
provider for weight loss treatment versus standard care: A randomised controlled trial. Lancet.
2011;378:1485-1492.
Jolly K, Lewis A, Beach J, Denley J, Adab P, Deeks JJ, Daley A, Aveyard P. Comparison of range of
commercial or primary care led weight reduction programmes with minimal intervention control for
weight loss in obesity: Lighten Up randomised controlled trial. BMJ. 2011;343:d6500.
Heshka S, Anderson JW, Atkinson RL, Greenway FL, Hill JO, Phinney SD, Kolotkin RL, MillerKovach K, Pi-Sunyer FX. Weight loss with self-help compared with a structured commercial program:
A randomized trial. JAMA. 2003;289:1792-1798.
Dansinger ML, Gleason JA, Griffith JL, Selker HP, Schaefer EJ. Comparison of the Atkins, Ornish,
Weight Watchers, and Zone diets for weight loss and heart disease risk reduction: A randomized trial.
JAMA. 2005;293:43-53.
Gardner CD, Kiazand A, Alhassan S, Kim S, Stafford RS, Balise RR, Kraemer HC, King AC.
Comparison of the Atkins, Zone, Ornish, and Learn diets for change in weight and related risk factors
among overweight premenopausal women: The A to Z Weight Loss Study: A randomized trial. JAMA.
2007;297:969-977.
13


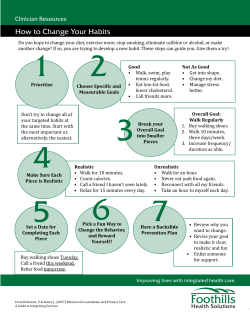

© Copyright 2026