
Package ‘rgl’ November 12, 2014
Package ‘rgl’
November 12, 2014
Version 0.95.1158
Title 3D visualization device system (OpenGL)
Author Daniel Adler <[email protected]>, Duncan Murdoch <[email protected]>, and others (see README)
Maintainer Duncan Murdoch <[email protected]>
Depends R (>= 2.15.0),stats,grDevices
Suggests MASS
Description Provides medium to high level functions for 3D interactive graphics, including
functions modelled on base graphics (plot3d(), etc.) as well as functions for
constructing representations of geometric objects (cube3d(), etc.). Output
may be on screen using OpenGL, or to various standard 3D file formats including
WebGL, PLY, OBJ, STL as well as 2D image formats, including PNG, Postscript, SVG, PGF.
License GPL
URL https://r-forge.r-project.org/projects/rgl/
SystemRequirements OpenGL, GLU Library, zlib (optional), libpng
(>=1.2.9, optional), FreeType (optional)
BugReports https://r-forge.r-project.org/projects/rgl/
Repository CRAN
Repository/R-Forge/Project rgl
Repository/R-Forge/Revision 1158
Repository/R-Forge/DateTimeStamp 2014-11-11 17:27:21
Date/Publication 2014-11-12 08:33:28
NeedsCompilation yes
1
R topics documented:
2
R topics documented:
rgl-package . . . . . .
.check3d . . . . . . . .
abclines3d . . . . . . .
addNormals . . . . . .
aspect3d . . . . . . . .
axes3d . . . . . . . . .
bg3d . . . . . . . . . .
bgplot3d . . . . . . . .
cylinder3d . . . . . . .
ellipse3d . . . . . . . .
extrude3d . . . . . . .
grid3d . . . . . . . . .
identify3d . . . . . . .
light . . . . . . . . . .
matrices . . . . . . . .
mesh3d . . . . . . . .
mfrow3d . . . . . . . .
observer3d . . . . . . .
par3d . . . . . . . . .
par3dinterp . . . . . .
persp3d . . . . . . . .
persp3d.function . . .
planes3d . . . . . . . .
play3d . . . . . . . . .
plot3d . . . . . . . . .
points3d . . . . . . . .
polygon3d . . . . . . .
r3d . . . . . . . . . . .
readSTL . . . . . . . .
rgl.attrib . . . . . . . .
rgl.bbox . . . . . . . .
rgl.bringtotop . . . . .
rgl.material . . . . . .
rgl.open . . . . . . . .
rgl.pixels . . . . . . .
rgl.postscript . . . . .
rgl.primitive . . . . . .
rgl.select . . . . . . . .
rgl.setMouseCallbacks
rgl.snapshot . . . . . .
rgl.surface . . . . . . .
rgl.Sweave . . . . . . .
rgl.useNULL . . . . .
rgl.user2window . . .
scene . . . . . . . . .
scene3d . . . . . . . .
.
.
.
.
.
.
.
.
.
.
.
.
.
.
.
.
.
.
.
.
.
.
.
.
.
.
.
.
.
.
.
.
.
.
.
.
.
.
.
.
.
.
.
.
.
.
.
.
.
.
.
.
.
.
.
.
.
.
.
.
.
.
.
.
.
.
.
.
.
.
.
.
.
.
.
.
.
.
.
.
.
.
.
.
.
.
.
.
.
.
.
.
.
.
.
.
.
.
.
.
.
.
.
.
.
.
.
.
.
.
.
.
.
.
.
.
.
.
.
.
.
.
.
.
.
.
.
.
.
.
.
.
.
.
.
.
.
.
.
.
.
.
.
.
.
.
.
.
.
.
.
.
.
.
.
.
.
.
.
.
.
.
.
.
.
.
.
.
.
.
.
.
.
.
.
.
.
.
.
.
.
.
.
.
.
.
.
.
.
.
.
.
.
.
.
.
.
.
.
.
.
.
.
.
.
.
.
.
.
.
.
.
.
.
.
.
.
.
.
.
.
.
.
.
.
.
.
.
.
.
.
.
.
.
.
.
.
.
.
.
.
.
.
.
.
.
.
.
.
.
.
.
.
.
.
.
.
.
.
.
.
.
.
.
.
.
.
.
.
.
.
.
.
.
.
.
.
.
.
.
.
.
.
.
.
.
.
.
.
.
.
.
.
.
.
.
.
.
.
.
.
.
.
.
.
.
.
.
.
.
.
.
.
.
.
.
.
.
.
.
.
.
.
.
.
.
.
.
.
.
.
.
.
.
.
.
.
.
.
.
.
.
.
.
.
.
.
.
.
.
.
.
.
.
.
.
.
.
.
.
.
.
.
.
.
.
.
.
.
.
.
.
.
.
.
.
.
.
.
.
.
.
.
.
.
.
.
.
.
.
.
.
.
.
.
.
.
.
.
.
.
.
.
.
.
.
.
.
.
.
.
.
.
.
.
.
.
.
.
.
.
.
.
.
.
.
.
.
.
.
.
.
.
.
.
.
.
.
.
.
.
.
.
.
.
.
.
.
.
.
.
.
.
.
.
.
.
.
.
.
.
.
.
.
.
.
.
.
.
.
.
.
.
.
.
.
.
.
.
.
.
.
.
.
.
.
.
.
.
.
.
.
.
.
.
.
.
.
.
.
.
.
.
.
.
.
.
.
.
.
.
.
.
.
.
.
.
.
.
.
.
.
.
.
.
.
.
.
.
.
.
.
.
.
.
.
.
.
.
.
.
.
.
.
.
.
.
.
.
.
.
.
.
.
.
.
.
.
.
.
.
.
.
.
.
.
.
.
.
.
.
.
.
.
.
.
.
.
.
.
.
.
.
.
.
.
.
.
.
.
.
.
.
.
.
.
.
.
.
.
.
.
.
.
.
.
.
.
.
.
.
.
.
.
.
.
.
.
.
.
.
.
.
.
.
.
.
.
.
.
.
.
.
.
.
.
.
.
.
.
.
.
.
.
.
.
.
.
.
.
.
.
.
.
.
.
.
.
.
.
.
.
.
.
.
.
.
.
.
.
.
.
.
.
.
.
.
.
.
.
.
.
.
.
.
.
.
.
.
.
.
.
.
.
.
.
.
.
.
.
.
.
.
.
.
.
.
.
.
.
.
.
.
.
.
.
.
.
.
.
.
.
.
.
.
.
.
.
.
.
.
.
.
.
.
.
.
.
.
.
.
.
.
.
.
.
.
.
.
.
.
.
.
.
.
.
.
.
.
.
.
.
.
.
.
.
.
.
.
.
.
.
.
.
.
.
.
.
.
.
.
.
.
.
.
.
.
.
.
.
.
.
.
.
.
.
.
.
.
.
.
.
.
.
.
.
.
.
.
.
.
.
.
.
.
.
.
.
.
.
.
.
.
.
.
.
.
.
.
.
.
.
.
.
.
.
.
.
.
.
.
.
.
.
.
.
.
.
.
.
.
.
.
.
.
.
.
.
.
.
.
.
.
.
.
.
.
.
.
.
.
.
.
.
.
.
.
.
.
.
.
.
.
.
.
.
.
.
.
.
.
.
.
.
.
.
.
.
.
.
.
.
.
.
.
.
.
.
.
.
.
.
.
.
.
.
.
.
.
.
.
.
.
.
.
.
.
.
.
.
.
.
.
.
.
.
.
.
.
.
.
.
.
.
.
.
.
.
.
.
.
.
.
.
.
.
.
.
.
.
.
.
.
.
.
.
.
.
.
.
.
.
.
.
.
.
.
.
.
.
.
.
.
.
.
.
.
.
.
.
.
.
.
.
.
.
.
.
.
.
.
.
.
.
.
.
.
.
.
.
.
.
.
.
.
.
.
.
.
.
.
.
.
.
.
.
.
.
.
.
.
.
.
.
.
.
.
.
.
.
.
.
.
.
.
.
.
.
.
.
.
.
.
.
.
.
.
.
.
.
.
.
.
.
.
.
.
.
.
.
.
.
.
.
.
.
.
.
.
.
.
.
.
.
.
.
.
.
.
.
.
.
.
.
.
.
.
.
.
.
.
.
.
.
.
.
.
.
.
.
.
.
.
.
.
.
.
.
.
.
.
.
.
.
.
.
.
.
.
.
.
.
.
.
.
.
.
.
.
.
.
.
.
.
.
.
.
.
.
.
.
.
.
.
.
.
.
.
.
.
.
.
.
.
.
.
.
.
.
.
.
.
.
.
.
.
.
.
.
.
.
.
.
.
.
.
.
.
.
.
.
.
.
.
.
.
.
.
.
.
.
.
.
.
.
.
.
.
.
.
.
.
.
.
.
.
.
.
.
.
.
.
.
.
.
.
.
.
.
.
.
.
.
.
.
.
.
.
.
.
.
.
.
.
.
.
.
.
.
.
.
.
.
.
.
.
.
.
.
.
.
.
.
.
.
.
.
.
.
.
.
.
.
.
.
.
.
.
.
.
.
.
.
.
.
.
.
.
.
.
.
.
.
.
.
.
.
.
.
.
.
.
.
.
.
.
.
.
.
.
.
.
.
.
.
.
.
.
.
.
.
.
.
.
.
.
.
.
.
.
.
.
.
.
.
.
.
.
.
.
.
.
.
.
.
.
.
.
.
.
.
.
.
.
.
.
.
.
.
.
.
.
.
.
.
.
.
.
.
.
.
.
.
.
.
.
.
.
.
.
.
.
.
.
.
.
.
.
.
.
.
.
.
.
.
.
.
.
.
.
.
.
.
.
.
.
.
.
.
.
.
.
.
.
.
.
.
.
.
.
.
.
.
.
.
.
.
.
.
.
.
.
.
.
.
.
.
.
.
.
.
.
.
.
.
.
.
.
.
.
.
.
.
.
.
.
.
.
.
.
.
.
.
.
.
.
.
.
.
.
.
.
.
.
.
.
.
.
.
.
.
.
.
.
.
.
.
.
.
.
.
.
.
.
.
.
.
.
.
.
.
.
.
.
.
.
.
.
.
.
.
.
.
.
.
.
.
.
.
.
.
.
.
.
.
.
.
.
.
.
.
.
.
.
.
.
.
.
.
.
.
.
.
.
.
.
.
.
.
.
.
.
.
.
.
.
.
.
.
.
.
.
.
.
.
.
.
.
.
.
.
.
.
.
.
.
.
.
.
.
.
.
.
.
.
.
.
.
.
.
.
.
.
.
.
.
.
.
.
.
.
.
.
.
.
.
.
.
.
.
3
4
4
5
6
7
9
10
12
13
15
16
18
19
20
22
24
26
27
32
33
36
38
40
42
44
45
47
48
50
51
53
54
57
58
59
61
62
63
64
65
67
69
69
71
72
rgl-package
select3d . . .
selectpoints3d
shapelist3d .
spheres3d . .
spin3d . . . .
sprites . . . .
subdivision3d
subscene3d .
subsceneInfo
surface3d . .
text3d . . . .
triangulate . .
turn3d . . . .
viewpoint . .
writeOBJ . .
writePLY . .
writeWebGL .
3
.
.
.
.
.
.
.
.
.
.
.
.
.
.
.
.
.
.
.
.
.
.
.
.
.
.
.
.
.
.
.
.
.
.
.
.
.
.
.
.
.
.
.
.
.
.
.
.
.
.
.
.
.
.
.
.
.
.
.
.
.
.
.
.
.
.
.
.
.
.
.
.
.
.
.
.
.
.
.
.
.
.
.
.
.
.
.
.
.
.
.
.
.
.
.
.
.
.
.
.
.
.
.
.
.
.
.
.
.
.
.
.
.
.
.
.
.
.
.
.
.
.
.
.
.
.
.
.
.
.
.
.
.
.
.
.
.
.
.
.
.
.
.
.
.
.
.
.
.
.
.
.
.
.
.
.
.
.
.
.
.
.
.
.
.
.
.
.
.
.
.
.
.
.
.
.
.
.
.
.
.
.
.
.
.
.
.
.
.
.
.
.
.
.
.
.
.
.
.
.
.
.
.
.
.
.
.
.
.
.
.
.
.
.
.
.
.
.
.
.
.
.
.
.
.
.
.
.
.
.
.
.
.
.
.
.
.
.
.
.
.
.
.
.
.
.
.
.
.
.
.
.
.
.
.
.
.
.
.
.
.
.
.
.
.
.
.
.
.
.
.
.
.
.
.
.
.
.
.
.
.
.
.
.
.
.
.
.
.
.
.
.
.
.
.
.
.
.
.
.
.
.
.
.
.
.
.
.
.
.
.
.
.
.
.
.
.
.
.
.
.
.
.
.
.
.
.
.
.
.
.
.
.
.
.
.
.
.
.
.
Index
rgl-package
.
.
.
.
.
.
.
.
.
.
.
.
.
.
.
.
.
.
.
.
.
.
.
.
.
.
.
.
.
.
.
.
.
.
.
.
.
.
.
.
.
.
.
.
.
.
.
.
.
.
.
.
.
.
.
.
.
.
.
.
.
.
.
.
.
.
.
.
.
.
.
.
.
.
.
.
.
.
.
.
.
.
.
.
.
.
.
.
.
.
.
.
.
.
.
.
.
.
.
.
.
.
.
.
.
.
.
.
.
.
.
.
.
.
.
.
.
.
.
.
.
.
.
.
.
.
.
.
.
.
.
.
.
.
.
.
.
.
.
.
.
.
.
.
.
.
.
.
.
.
.
.
.
.
.
.
.
.
.
.
.
.
.
.
.
.
.
.
.
.
.
.
.
.
.
.
.
.
.
.
.
.
.
.
.
.
.
.
.
.
.
.
.
.
.
.
.
.
.
.
.
.
.
.
.
.
.
.
.
.
.
.
.
.
.
.
.
.
.
.
.
.
.
.
.
.
.
.
.
.
.
.
.
.
.
.
.
.
.
.
.
.
.
.
.
.
.
.
.
.
.
.
.
.
.
.
.
.
.
.
.
.
.
.
.
.
.
.
.
.
.
.
.
.
.
.
.
.
.
.
.
.
.
.
.
.
.
.
.
.
.
.
.
.
.
.
.
.
.
.
.
.
.
.
.
.
.
.
.
.
.
.
.
.
.
.
.
.
.
.
.
.
.
.
.
.
.
.
.
.
.
.
.
.
.
.
.
.
.
.
74
75
77
78
79
80
81
82
85
86
87
90
91
92
94
95
97
99
3D visualization device system
Description
3D real-time rendering system.
Details
RGL is a 3D real-time rendering system for R. Multiple windows are managed at a time. Windows
may be divided into “subscenes”, where one has the current focus that receives instructions from the
R command-line. The device design is oriented towards the R device metaphor. If you send scene
management instructions, and there’s no device open, it will be opened automatically. Opened
devices automatically get the current device focus. The focus may be changed by using rgl.set()
or useSubscene3d().
rgl provides medium to high level functions for 3D interactive graphics, including functions modelled on base graphics (plot3d(), etc.) as well as functions for constructing geometric objects
(cube3d(), etc.). Output may be on screen using OpenGL, or to various standard 3D file formats
including WebGL, PLY, OBJ, STL as well as 2D image formats, including PNG, Postscript, SVG,
PGF.
The open3d() function attempts to open a new RGL window, using default settings specified by
the user.
rgl also includes a lower level interface which is described in the rgl.open help topic. We recommend that you avoid mixing rgl.* and *3d calls.
See the first example below to display the ChangeLog.
4
abclines3d
See Also
r3d for a description of the *3d interface; par3d for a description of scene properties and the rendering pipeline.
Examples
file.show(system.file("NEWS", package="rgl"))
example(surface3d)
example(plot3d)
.check3d
Check for an open rgl window.
Description
Mostly for internal use, this function returns the current device number if one exists, or opens a new
device and returns that.
Usage
.check3d()
Value
The device number of an rgl device.
Author(s)
Duncan Murdoch
See Also
open3d
abclines3d
Lines intersecting the bounding box
Description
This adds mathematical lines to a scene. Their intersection with the current bounding box will be
drawn.
Usage
rgl.abclines(x, y = NULL, z = NULL, a, b = NULL, c = NULL, ...)
abclines3d(x, y = NULL, z = NULL, a, b = NULL, c = NULL, ...)
addNormals
5
Arguments
x,y,z
Coordinates of points through which each line passes.
a,b,c
Coordinates of the direction vectors for the lines.
...
Material properties.
Details
These functions draw the segment of a line that intersects the current bounding box of the scene
using the parametrization (x, y, z) + (a, b, c) ∗ s where s is a real number.
Any reasonable way of defining the coordinates x,y,z and a,b,c is acceptable. See the function
xyz.coords for details.
Value
A shape ID of the object is returned invisibly.
See Also
planes3d, rgl.planes for mathematical planes.
segments3d draws sections of lines that do not adapt to the bounding box.
Examples
plot3d(rnorm(100), rnorm(100), rnorm(100))
abclines3d(0,0,0, a=diag(3), col="gray")
addNormals
Add normal vectors to objects so they render more smoothly.
Description
This generic function adds normals at each of the vertices of a polyhedron by averaging the normals
of each incident face. This has the effect of making the surface of the object appear smooth rather
than faceted when rendered.
Usage
addNormals(x, ...)
Arguments
x
An object to which to add normals.
...
Additional parameters which will be passed to the methods. Currently unused.
Details
Currently methods are supplied for "mesh3d" and "shapelist3d" classes.
6
aspect3d
Value
A new object of the same class as x, with normals added.
Author(s)
Duncan Murdoch
Examples
open3d()
y <- subdivision3d(tetrahedron3d(col="red"), depth=3)
shade3d(y) # No normals
y <- addNormals(y)
shade3d(translate3d(y, x=1, y=0, z=0)) # With normals
aspect3d
Set the aspect ratios of the current plot
Description
This function sets the apparent ratios of the x, y, and z axes of the current bounding box.
Usage
aspect3d(x, y = NULL, z = NULL)
Arguments
x
The ratio for the x axis, or all three ratios, or "iso"
y
The ratio for the y axis
z
The ratio for the z axis
Details
If the ratios are all 1, the bounding box will be displayed as a cube approximately filling the display.
Values may be set larger or smaller as desired. Aspect "iso" signifies that the coordinates should
all be displayed at the same scale, i.e. the bounding box should not be rescaled. (This corresponds
to the default display before aspect3d has been called.) Partial matches to "iso" are allowed.
aspect3d works by modifying par3d("scale").
Value
The previous value of the scale is returned invisibly.
Author(s)
Duncan Murdoch
axes3d
7
See Also
plot3d, par3d
Examples
x <- rnorm(100)
y <- rnorm(100)*2
z <- rnorm(100)*3
open3d()
plot3d(x, y, z)
aspect3d(1,1,0.5)
open3d()
plot3d(x, y, z)
aspect3d("iso")
axes3d
Draw boxes, axes and other text outside the data
Description
These functions draw axes, boxes and text outside the range of the data. axes3d, box3d and title3d
are the higher level functions; normally the others need not be called directly by users.
Usage
axes3d(edges = "bbox", labels = TRUE, tick = TRUE, nticks = 5,
box=FALSE, expand = 1.03, ...)
box3d(...)
title3d(main = NULL, sub = NULL, xlab = NULL, ylab = NULL,
zlab = NULL, line = NA, ...)
axis3d(edge, at = NULL, labels = TRUE, tick = TRUE, line = 0,
pos = NULL, nticks = 5, ...)
mtext3d(text, edge, line = 0, at = NULL, pos = NA, ...)
Arguments
edges
a code to describe which edge(s) of the box to use; see Details below
labels
whether to label the axes, or (for axis3d) the labels to use
tick
whether to use tick marks
nticks
suggested number of ticks
box
draw the full box if "bbox" axes are used
expand
how much to expand the box around the data
main
the main title for the plot
sub
the subtitle for the plot
8
axes3d
xlab, ylab, zlab
the axis labels for the plot
line
the “line” of the plot margin to draw the label on
edge, pos
the position at which to draw the axis or text
text
the text to draw
at
the value of a coordinate at which to draw the axis
...
additional parameters which are passed to bbox3d or material3d
Details
The rectangular prism holding the 3D plot has 12 edges. They are identified using 3 character
strings. The first character (‘x’, ‘y’, or ‘z’) selects the direction of the axis. The next two characters
are each ‘-’ or ‘+’, selecting the lower or upper end of one of the other coordinates. If only one or
two characters are given, the remaining characters default to ‘-’. For example edge = 'x+' draws
an x-axis at the high level of y and the low level of z.
By default, axes3d uses the bbox3d function to draw the axes. The labels will move so that they
do not obscure the data. Alternatively, a vector of arguments as described above may be used, in
which case fixed axes are drawn using axis3d.
If pos is a numeric vector of length 3, edge determines the direction of the axis and the tick marks,
and the values of the other two coordinates in pos determine the position. See the examples.
Value
These functions are called for their side effects. They return the object IDs of objects added to the
scene.
Author(s)
Duncan Murdoch
See Also
Classic graphics functions axis, box, title, mtext, and rgl function bbox3d.
Examples
open3d()
points3d(rnorm(10),rnorm(10),rnorm(10))
# First add standard axes
axes3d()
# and one in the middle (the NA will be ignored, a number would
# do as well)
axis3d('x',pos=c(NA, 0, 0))
# add titles
title3d('main','sub','xlab','ylab','zlab')
bg3d
9
rgl.bringtotop()
open3d()
points3d(rnorm(10),rnorm(10),rnorm(10))
# Use fixed axes
axes3d(c('x','y','z'))
# Put 4 x-axes on the plot
axes3d(c('x--','x-+','x+-','x++'))
axis3d('x',pos=c(NA, 0, 0))
title3d('main','sub','xlab','ylab','zlab')
bg3d
Set up Background
Description
Set up the background of the scene.
Usage
bg3d(...)
rgl.bg( sphere = FALSE, fogtype = "none", color=c("black","white"),
back="lines", ...)
Arguments
fogtype
fog type:
"none" no fog
"linear" linear fog function
"exp" exponential fog function
"exp2" squared exponential fog function
sphere
logical, if true, an environmental sphere geometry is used for the background
decoration.
color
Primary color is used for background clearing and as fog color. Secondary color
is used for background sphere geometry. See material3d for details.
back
Specifies the fill style of the sphere geometry. See material3d for details.
...
Material properties. See material3d for details.
10
bgplot3d
Details
If sphere is set to TRUE, an environmental sphere enclosing the whole scene is drawn.
If not, but the material properties include a bitmap as a texture, the bitmap is drawn in the background of the scene. (The bitmap colors modify the general color setting.)
If neither a sphere nor a bitmap background is drawn, the background is filled with a solid color.
Note
The writeWebGL function only supports solid color backgrounds.
See Also
material3d, bgplot3d to add a 2D plot as background.
Examples
open3d()
# a simple white background
bg3d("white")
# the holo-globe (inspired by star trek):
bg3d(sphere=TRUE, color=c("black","green"), lit=FALSE, back="lines" )
# an environmental sphere with a nice texture.
bg3d(sphere=TRUE, texture=system.file("textures/sunsleep.png", package="rgl"),
back="filled" )
# The same texture as a fixed background
open3d()
bg3d(texture=system.file("textures/sunsleep.png", package="rgl"), col="white")
bgplot3d
Use base graphics for RGL background
Description
Add a 2D plot or a legend in the background of an RGL window.
Usage
bgplot3d(expression)
legend3d(...)
bgplot3d
11
Arguments
expression
Any plotting commands to produce a plot.
...
Arguments to pass to the legend function.
Details
The bgplot3d function opens a png device and executes expression, producing a plot there. This
plot is then used as a bitmap background for the current RGL subscene.
The legend3d function draws a standard 2D legend to the background of the current subscene by
calling bgplot3d to open a device, and setting up a plot region there to fill the whole display.
Value
The bgplot3d function invisibly returns the ID of the background object that was created, with
attribute "value" holding the value returned when the expression was evaluated.
The legend3d function does similarly. The "value" attribute is the result of the call to legend.
The scaling of the coordinates runs from 0 to 1 in X and Y.
Note
Because the background plots are drawn as bitmaps, they do not resize very gracefully. It’s best to
size your window first, then draw the background at that size.
Author(s)
Duncan Murdoch
See Also
bg3d for other background options.
Examples
x <- rnorm(100)
y <- rnorm(100)
z <- rnorm(100)
open3d()
# Needs to be a bigger window than the default
par3d(windowRect = c(100,100,612,612))
Sys.sleep(0.1) # Allow sluggish window managers to catch up
parent <- currentSubscene3d()
mfrow3d(2,2)
plot3d(x,y,z)
next3d(reuse = FALSE)
bgplot3d(plot(y,z))
next3d(reuse = FALSE)
bgplot3d(plot(x,z))
next3d(reuse = FALSE)
legend3d("center", c("2D Points", "3D Points"), pch=c(1, 16))
12
cylinder3d
useSubscene3d(parent)
cylinder3d
Create cylindrical or "tube" plots.
Description
This function converts a description of a space curve into a "mesh3d" object forming a cylindrical
tube around the curve.
Usage
cylinder3d(center, radius = 1, twist = 0, e1 = NULL, e2 = NULL, e3 = NULL,
sides = 8, section = NULL, closed = 0, debug = FALSE, keepVars = FALSE)
Arguments
center
An n by 3 matrix whose columns are the x, y and z coordinates of the space
curve.
radius
The radius of the cross-section of the tube at each point in the center.
twist
The amount by which the polygon forming the tube is twisted at each point.
e1, e2, e3
The Frenet coordinates to use at each point on the space curve.
sides
The number of sides in the polygon cross section.
section
The polygon cross section as a two-column matrix, or NULL.
closed
Whether to treat the first and last points of the space curve as identical, and close
the curve, or put caps on the ends. See the Details.
debug
If TRUE, plot the local Frenet coordinates at each point.
keepVars
If TRUE, return the local variables in attribute "vars".
Details
The number of points in the space curve is determined by the vector lengths in center, after using
xyz.coords to convert it to a list. The other arguments radius, twist, e1, e2, and e3 are extended
to the same length.
The closed argument controls how the ends of the cylinder are handled. If closed > 0, it
represents the number of points of overlap in the coordinates. closed == TRUE is the same as
closed = 1. Negative values indicate that caps should be put on the ends of the cylinder. If
closed == -1, a cap will be put on the end corresponding to center[1,]. If closed == -2, caps
will be put on both ends.
If section is NULL (the default), a regular sides-sided polygon is used, and radius measures the
distance from the center of the cylinder to each vertex. If not NULL, sides is ignored (and set
internally to nrow(section)), and radius is used as a multiplier to the vertex coordinates. twist
specifies the rotation of the polygon. Both radius and twist may be vectors, with values recycled
ellipse3d
13
to the number of rows in center, while sides and section are the same at every point along the
curve.
The three optional arguments e1, e2, and e3 determine the local coordinate system used to create
the vertices at each point in center. If missing, they are computed by simple numerical approximations. e1 should be the tangent coordinate, giving the direction of the curve at the point. The
cross-section of the polygon will be orthogonal to e1. e2 defaults to an approximation to the normal
or curvature vector; it is used as the image of the y axis of the polygon cross-section. e3 defaults to
an approximation to the binormal vector, to which the x axis of the polygon maps. The vectors are
orthogonalized and normalized at each point.
Value
A "mesh3d" object holding the cylinder, possibly with attribute "vars" containing the local environment of the function.
Author(s)
Duncan Murdoch
Examples
# A trefoil knot
open3d()
theta <- seq(0, 2*pi, len=25)
knot <- cylinder3d(
center = cbind(
sin(theta)+2*sin(2*theta),
2*sin(3*theta),
cos(theta)-2*cos(2*theta)),
e1 = cbind(
cos(theta)+4*cos(2*theta),
6*cos(3*theta),
sin(theta)+4*sin(2*theta)),
radius = 0.8,
closed = TRUE)
shade3d(addNormals(subdivision3d(knot, depth=2)), col="green")
ellipse3d
Make an ellipsoid
Description
A generic function and several methods returning an ellipsoid or other outline of a confidence region
for three parameters.
14
ellipse3d
Usage
ellipse3d(x, ...)
## Default S3 method:
ellipse3d(x, scale = c(1, 1, 1), centre = c(0, 0, 0), level = 0.95,
t = sqrt(qchisq(level, 3)), which = 1:3, subdivide = 3, smooth = TRUE, ...)
## S3 method for class 'lm'
ellipse3d(x, which = 1:3, level = 0.95, t = sqrt(3 * qf(level,
3, x$df.residual)), ...)
## S3 method for class 'glm'
ellipse3d(x, which = 1:3, level = 0.95, t, dispersion, ...)
## S3 method for class 'nls'
ellipse3d(x, which = 1:3, level = 0.95, t = sqrt(3 * qf(level,
3, s$df[2])), ...)
Arguments
x
An object. In the default method the parameter x should be a square positive definite matrix at least 3x3 in size. It will be treated as the correlation or covariance
of a multivariate normal distribution.
...
Additional parameters to pass to the default method or to qmesh3d.
scale
If x is a correlation matrix, then the standard deviations of each parameter can
be given in the scale parameter. This defaults to c(1, 1, 1), so no rescaling
will be done.
centre
The centre of the ellipse will be at this position.
level
The confidence level of a simultaneous confidence region. The default is 0.95,
for a 95% region. This is used to control the size of the ellipsoid.
t
The size of the ellipse may also be controlled by specifying the value of a tstatistic on its boundary. This defaults to the appropriate value for the confidence
region.
which
This parameter selects which variables from the object will be plotted. The
default is the first 3.
subdivide
This controls the number of subdivisions (see subdivision3d) used in constructing the ellipsoid. Higher numbers give a smoother shape.
smooth
If TRUE, smooth interpolation of normals is used; if FALSE, a faceted ellipsoid
will be displayed.
dispersion
The value of dispersion to use. If specified, it is treated as fixed, and chi-square
limits for t are used. If missing, it is taken from summary(x).
Value
A mesh3d object representing the ellipsoid.
Examples
# Plot a random sample and an ellipsoid of concentration corresponding to a 95%
# probability region for a
extrude3d
15
# trivariate normal distribution with mean 0, unit variances and
# correlation 0.8.
if (requireNamespace("MASS")) {
Sigma <- matrix(c(10,3,0,3,2,0,0,0,1), 3,3)
Mean <- 1:3
x <- MASS::mvrnorm(1000, Mean, Sigma)
open3d()
plot3d(x, box=FALSE)
}
plot3d( ellipse3d(Sigma, centre=Mean), col="green", alpha=0.5, add = TRUE)
# Plot the estimate and joint 90% confidence region for the displacement and cylinder
# count linear coefficients in the mtcars dataset
data(mtcars)
fit <- lm(mpg ~ disp + cyl , mtcars)
open3d()
plot3d(ellipse3d(fit, level = 0.90), col="blue", alpha=0.5, aspect=TRUE)
extrude3d
Generate extrusion mesh
Description
Given a two-dimensional polygon, this generates a three-dimensional extrusion of the shape by
triangulating the polygon and creating a cylinder with that shape as the end faces.
Usage
extrude3d(x, y = NULL, thickness = 1, smooth = FALSE, ...)
Arguments
x, y
A polygon description in one of the forms supported by triangulate.
thickness
The extrusion will have this thickness.
smooth
logical; should normals be added so that the edges of the extrusion appear
smooth?
...
Other parameters to pass to tmesh3d when constructing the mesh.
Details
The extrusion is always constructed with the polygon in the xy plane at z = 0 and another copy at
z = thickness. Use the transformation functions (e.g. rotate3d) to obtain other orientations and
placements.
16
grid3d
Value
A mesh object containing a triangulation of the polygon for each face, and quadrilaterals for the
sides.
Author(s)
Duncan Murdoch
See Also
polygon3d for a simple polygon, triangulate for the triangulation, turn3d for a solid of rotation.
Examples
x <- c(1:10, 10:1)
y <- rev(c(rep(c(0,2), 5), rep(c(1.5,-0.5),5)))
plot(x, y, type="n")
polygon(x, y)
open3d()
shade3d( extrude3d(x, y), col = "red" )
grid3d
Add a grid to a 3D plot
Description
This function adds a reference grid to an RGL plot.
Usage
grid3d(side, at = NULL, col = "gray", lwd = 1, lty = 1, n = 5)
Arguments
side
Where to put the grid; see the Details section.
at
How to draw the grid; see the Details section.
col
The color of the grid lines.
lwd
The line width of the grid lines. (Currently only lty = 1 is supported.)
lty
The line type of the grid lines.
n
Suggested number of grid lines; see the Details section.
grid3d
17
Details
This function is similar to grid in classic graphics, except that it draws a 3D grid in the plot.
The grid is drawn in a plane perpendicular to the coordinate axes. The first letter of the side
argument specifies the direction of the plane: "x", "y" or "z" (or uppercase versions) to specify the
coordinate which is constant on the plane.
If at = NULL (the default), the grid is drawn at the limit of the box around the data. If the second
letter of the side argument is "-" or is not present, it is the lower limit; if "+" then at the upper
limit. The grid lines are drawn at values chosen by pretty with n suggested locations. The default
locations should match those chosen by axis3d with nticks = n.
If at is a numeric vector, the grid lines are drawn at those values.
If at is a list, then the "x" component is used to specify the x location, the "y" component specifies
the y location, and the "z" component specifies the z location. Missing components are handled
using the default as for at = NULL.
Multiple grids may be drawn by specifying multiple values for side or for the component of at that
specifies the grid location.
Value
A vector or matrix of object ids is returned invisibly.
Note
If the scene is resized, the grid will not be resized; use abclines3d to draw grid lines that will
automatically resize.
Author(s)
Ben Bolker and Duncan Murdoch
See Also
axis3d
Examples
x <- 1:10
y <- 1:10
z <- matrix(outer(x-5,y-5) + rnorm(100), 10, 10)
open3d()
persp3d(x, y, z, col="red", alpha=0.7, aspect=c(1,1,0.5))
grid3d(c("x", "y+", "z"))
18
identify3d
identify3d
Identify points in plot.
Description
Identify points in a plot, similarly to the identify function in base graphics.
Usage
identify3d(x, y = NULL, z = NULL, labels = seq_along(x), n = length(x),
plot = TRUE, adj = c(-0.1, 0.5), tolerance = 20,
buttons = c("right", "middle"))
Arguments
x, y, z
coordinates of points in a scatter plot. Alternatively, any object which defines
coordinates (see xyz.coords) can be given as x, and y and z left missing.
labels
an optional character vector giving labels for the points. Will be coerced using
as.character, and recycled if necessary to the length of x.
n
the maximum number of points to be identified.
plot
logical: if plot is TRUE, the labels are printed near the points and if FALSE they
are omitted.
adj
numeric vector to use as adj parameter to text3d when plotting the labels.
tolerance
the maximal distance (in pixels) for the pointer to be ‘close enough’ to a point.
buttons
a length 1 or 2 character vector giving the buttons to use for selection and quitting.
Details
If buttons is length 1, the user can quit by reaching n selections, or by hitting the escape key, but
the result will be lost if escape is used.
Value
A vector of selected indices.
Author(s)
Duncan Murdoch
See Also
identify for base graphics, select3d for selecting regions.
light
19
light
add light source
Description
add a light source to the scene.
Usage
light3d(theta = 0, phi = 15, x = NULL, ...)
rgl.light( theta = 0, phi = 0, viewpoint.rel = TRUE, ambient = "#FFFFFF",
diffuse = "#FFFFFF", specular = "#FFFFFF", x = NULL, y = NULL, z = NULL)
Arguments
theta, phi
polar coordinates, used by default
viewpoint.rel
logical, if TRUE light is a viewpoint light that is positioned relative to the current
viewpoint
ambient, diffuse, specular
light color values used for lighting calculation
x, y, z
cartesian coordinates, optional
...
generic arguments passed through to RGL-specific (or other) functions
Details
Up to 8 light sources are supported. They are positioned either in world space or relative to the
camera. By providing polar coordinates to theta and phi a directional light source is used. If
numerical values are given to x, y and z, a point-like light source with finite distance to the objects
in the scene is set up.
If x is non-null, xyz.coords will be used to form the location values, so all three coordinates can
be specified in x.
Value
This function is called for the side effect of adding a light. A light ID is returned to allow rgl.pop
to remove it.
See Also
rgl.clear rgl.pop
20
matrices
Examples
#
# a lightsource moving through the scene
#
data(volcano)
z <- 2 * volcano # Exaggerate the relief
x <- 10 * (1:nrow(z)) # 10 meter spacing (S to N)
y <- 10 * (1:ncol(z)) # 10 meter spacing (E to W)
zlim <- range(z)
zlen <- zlim[2] - zlim[1] + 1
colorlut <- terrain.colors(zlen) # height color lookup table
col <- colorlut[ z-zlim[1]+1 ] # assign colors to heights for each point
open3d()
bg3d("gray50")
surface3d(x, y, z, color=col, back="lines")
r <- max(y)-mean(y)
lightid <- spheres3d(1,1,1,alpha=0)
for (a in seq(-pi, pi, length.out=100)) {
}
save <- par3d(skipRedraw=TRUE)
clear3d(type = "lights")
rgl.pop(id = lightid)
xyz <- matrix(c(r*sin(a)+mean(x), r*cos(a) + mean(y), max(z)), ncol=3)
light3d(x = xyz, diffuse = "gray75",
specular = "gray75", viewpoint.rel = FALSE)
light3d(diffuse="gray10", specular="gray25")
lightid <- spheres3d(xyz, emission="white", radius=4)
par3d(save)
Sys.sleep(0.02)
matrices
Work with homogeneous coordinates
Description
These functions construct 4x4 matrices for transformations in the homogeneous coordinate system
used by OpenGL, and translate vectors between homogeneous and Euclidean coordinates.
Usage
identityMatrix()
scaleMatrix(x, y, z)
translationMatrix(x, y, z)
rotationMatrix(angle, x, y, z, matrix)
asHomogeneous(x)
matrices
21
asEuclidean(x)
scale3d(obj, x, y, z, ...)
translate3d(obj, x, y, z, ...)
rotate3d(obj, angle, x, y, z, matrix, ...)
transform3d(obj, matrix, ...)
Arguments
x, y, z, angle, matrix
See details
obj
An object to be transformed
...
Additional parameters to be passed to methods
Details
OpenGL uses homogeneous coordinates to handle perspective and affine transformations. The homogeneous point (x, y, z, w) corresponds to the Euclidean point (x/w, y/w, z/w). The
matrices produced by the functions scaleMatrix, translationMatrix, and rotationMatrix are
to be left-multiplied by a row vector of homogeneous coordinates; alternatively, the transpose of the
result can be right-multiplied by a column vector. The generic functions scale3d, translate3d
and rotate3d apply these transformations to the obj argument. The transform3d function is a
synonym for rotate3d(obj, matrix=matrix).
By default, it is assumed that obj is a row vector (or a matrix of row vectors) which will be multiplied on the right by the corresponding matrix, but users may write methods for these generics
which operate differently. Methods are supplied for mesh3d objects.
To compose transformations, use matrix multiplication. The effect is to apply the matrix on the left
first, followed by the one on the right.
identityMatrix returns an identity matrix.
scaleMatrix scales each coordinate by the given factor. In Euclidean coordinates, (u, v, w) is
transformed to (x*u, y*v, z*w).
translationMatrix translates each coordinate by the given translation, i.e. (u,v,w) is transformed to (u+x,v+y,w+z).
rotationMatrix can be called in three ways. With arguments angle, x, y, z it represents a
rotation of angle radians about the axis x, y, z. If matrix is a 3x3 rotation matrix, it will be
converted into the corresponding matrix in 4x4 homogeneous coordinates. Finally, if a 4x4 matrix
is given, it will be returned unchanged. (The latter behaviour is used to allow transform3d to act
like a generic function, even though it is not.)
Use asHomogeneous(x) to convert the Euclidean vector x to homogeneous coordinates, and asEuclidean(x)
for the reverse transformation.
Value
identityMatrix, scaleMatrix, translationMatrix, and rotationMatrix produce a 4x4 matrix representing the requested transformation in homogeneous coordinates.
22
mesh3d
scale3d, translate3d and rotate3d transform the object and produce a new object of the same
class.
Author(s)
Duncan Murdoch
See Also
par3d for a description of how rgl uses matrices in rendering.
Examples
# A 90 degree rotation about the x axis:
rotationMatrix(pi/2, 1, 0, 0)
# Find what happens when you rotate (2,0,0) by 45 degrees about the y axis:
x <- asHomogeneous(c(2,0,0))
y <- x
asEuclidean(y)
# or more simply...
rotate3d(c(2,0,0), pi/4, 0, 1, 0)
mesh3d
3D Mesh objects
Description
3D triangle and quadrangle mesh object creation and a collection of sample objects.
Usage
qmesh3d(vertices, indices, homogeneous = TRUE, material = NULL,
normals = NULL, texcoords = NULL)
tmesh3d(vertices, indices, homogeneous = TRUE, material = NULL,
normals = NULL, texcoords = NULL)
cube3d(trans = identityMatrix(), ...)
tetrahedron3d(trans = identityMatrix(), ...)
octahedron3d(trans = identityMatrix(), ...)
icosahedron3d(trans = identityMatrix(), ...)
dodecahedron3d(trans = identityMatrix(), ...)
cuboctahedron3d(trans = identityMatrix(), ...)
mesh3d
23
oh3d(trans = identityMatrix(), ...)
# an 'o' object
dot3d(x, ...)
# draw dots at the vertices of an object
## S3 method for class 'mesh3d'
dot3d(x, override = TRUE, ...)
wire3d(x, ...) # draw a wireframe object
## S3 method for class 'mesh3d'
wire3d(x, override = TRUE, ...)
shade3d(x, ...) # draw a shaded object
## S3 method for class 'mesh3d'
shade3d(x, override = TRUE, ...)
Arguments
x
a mesh3d object (class qmesh3d or tmesh3d)
vertices
3- or 4-component vector of coordinates
indices
4-component vector of vertex indices
homogeneous
logical indicating if homogeneous (four component) coordinates are used.
material
material properties for later rendering
normals
normals at each vertex
texcoords
texture coordinates at each vertex
trans
transformation to apply to objects; see below for defaults
...
additional rendering parameters
override
should the parameters specified here override those stored in the object?
Details
These functions create and work with mesh3d objects, which consist of a matrix of vertex coordinates together with a matrix of indices indicating which vertex is part of which face. Such objects
may have triangular faces, planar quadrilateral faces, or both.
The sample objects optionally take a matrix transformation trans as an argument. This transformation is applied to all vertices of the default shape. The default is an identity transformation.
The "shape3d" class is a general class for shapes that can be plotted by dot3d, wire3d or shade3d.
The "mesh3d" class is a class of objects that form meshes: the vertices are in member vb, as a 3 or
4 by n matrix. Meshes with triangular faces will contain it, a 3 * n matrix giving the indices of
the vertices in each face. Quad meshes will have vertex indices in ib, a 4 * n matrix.
Value
qmesh3d, cube3d, oh3d, tmesh3d, tetrahedron3d, octahedron3d, icosahedron3d and dodecahedron3d
return objects of class c("mesh3d", "shape3d"). The first three of these are quad meshes, the
rest are triangle meshes.
dot3d, wire3d, and shade3d are called for their side effect of drawing an object into the scene;
they return an object ID (or vector of IDs, for some classes) invisibly.
See rgl.primitive for a discussion of texture coordinates.
24
mfrow3d
See Also
r3d, par3d, shapelist3d for multiple shapes
Examples
# generate a quad mesh object
vertices <- c(
-1.0, -1.0, 0, 1.0,
1.0, -1.0, 0, 1.0,
1.0, 1.0, 0, 1.0,
-1.0, 1.0, 0, 1.0
)
indices <- c( 1, 2, 3, 4 )
open3d()
wire3d( qmesh3d(vertices,indices) )
# render 4 meshes vertically in the current view
open3d()
bg3d("gray")
l0 <- oh3d(tran = par3d("userMatrix"), color = "green" )
shade3d( translate3d( l0, -6, 0, 0 ))
l1 <- subdivision3d( l0 )
shade3d( translate3d( l1 , -2, 0, 0 ), color="red", override = FALSE )
l2 <- subdivision3d( l1 )
shade3d( translate3d( l2 , 2, 0, 0 ), color="red", override = TRUE )
l3 <- subdivision3d( l2 )
shade3d( translate3d( l3 , 6, 0, 0 ), color="red" )
# render
open3d()
shade3d(
shade3d(
shade3d(
shade3d(
shade3d(
mfrow3d
all of the Platonic solids
translate3d(
translate3d(
translate3d(
translate3d(
translate3d(
tetrahedron3d(col="red"), 0, 0, 0) )
cube3d(col="green"), 3, 0, 0) )
octahedron3d(col="blue"), 6, 0, 0) )
dodecahedron3d(col="cyan"), 9, 0, 0) )
icosahedron3d(col="magenta"), 12, 0, 0) )
Set up multiple figure layouts in rgl.
Description
The mfrow3d and layout3d functions provide functionality in rgl similar to par("mfrow") and
layout in classic R graphics.
mfrow3d
25
Usage
subsceneList(value, window = rgl.cur())
mfrow3d(nr, nc, byrow = TRUE, parent = NA, ...)
layout3d(mat, widths = rep.int(1, ncol(mat)),
heights = rep.int(1, nrow(mat)),
parent = NA,
...)
next3d(current = NA, clear = TRUE, reuse = TRUE)
clearSubsceneList(delete = currentSubscene3d() %in% subsceneList(),
window = rgl.cur())
Arguments
value
A new subscene list to set. If missing, return the current one (or NULL).
window
Which window to operate on.
nr, nc
Number of rows and columns of figures.
byrow
Whether figures progress by row (as with par("mfrow")) or by column (as with
par("mfcol")).
mat, widths, heights
Layout parameters; see layout for their interpretation.
parent
The parent subscene. NA indicates the current subscene. See Details below.
...
Additional parameters to pass to newSubscene3d as each subscene is created.
current
The subscene to move away from. NA indicates the current subscene.
clear
Whether the newly entered subscene should be cleared upon entry.
reuse
Whether to skip advancing if the current subscene has no objects in it.
delete
If TRUE, delete the subscenes in the current window.
Details
rgl can maintain a list of subscenes; the mfrow3d and layout3d functions create that list. When the
list is in place, next3d causes rgl to move to the next scene in the list, or cycle back to the first one.
Unlike the classic R graphics versions of these functions, these functions are completely compatible
with each other. You can mix them within a single rgl window.
In the default case where parent is missing, mfrow3d and layout3d will call clearSubsceneList()
at the start.
By default clearSubsceneList() checks whether the current subscene is in the current subscene
list; if so, it will delete all subscenes in the list, and call gc3d to delete any objects that are no longer
shown. The subscene list will be set to a previous value if one was recorded, or NULL if not.
If parent is specified in mfrow3d or layout3d (even as NA), the new subscenes will be created
within the parent.
26
observer3d
Value
mfrow3d and layout3d return a vector of subscene id values that have just been created. If a
previous subscene list was in effect and was not automatically cleared, it is attached as an attribute
"prev".
Author(s)
Duncan Murdoch
See Also
newSubscene3d, par, layout.
Examples
shapes <- list(Tetrahedron=tetrahedron3d(), Cube=cube3d(), Octahedron=octahedron3d(),
Icosahedron=icosahedron3d(), Dodecahedron=dodecahedron3d(),
Cuboctahedron=cuboctahedron3d())
col <- rainbow(6)
open3d()
mfrow3d(3,2)
for (i in 1:6) {
next3d()
# won't advance the first time, since it is empty
shade3d(shapes[[i]], col=col[i])
}
open3d()
mat <- matrix(1:4, 2,2)
mat <- rbind(mat, mat+4, mat+8)
layout3d(mat, height = rep(c(3,1), 3), model = "inherit")
for (i in 1:6) {
next3d()
shade3d(shapes[[i]], col=col[i])
next3d()
text3d(0,0,0, names(shapes)[i])
}
observer3d
Set the observer location.
Description
This function sets the location of the viewer.
Usage
observer3d(x, y = NULL, z = NULL, auto = FALSE)
par3d
27
Arguments
x,y,z
The location as a 3 vector, using the usual xyz.coords conventions for specification. If x is missing or any coordinate is NA, no change will be made to the
location.
auto
If TRUE, the location will be set automatically by rgl to make the whole bounding
box visible.
Details
This function sets the location of the viewer relative to the scene, after the model transformations
(scaling, rotation) have been done, but before lighting or projection have been applied. (See par3d
for details on the rendering pipeline.)
The coordinate system is a slightly strange one: the X coordinate moves the observer location from
left to right, and the Y coordinate moves up and down. The Z coordinate changes the depth from the
viewer. All are measured relative to the center of the bounding box (par("bbox")) of the subscene.
The observer always looks in the positive Z direction after the model rotation have been done. The
coordinates are in post-scaling units.
Value
Invisibly returns the previous value.
Note
This function is likely to change in future versions of rgl, to allow more flexibility in the specification of the observer’s location and orientation.
Author(s)
Duncan Murdoch
Examples
example(surface3d) # The volcano data
observer3d(0,0,440) # Viewed from very close up
par3d
Set or Query RGL Parameters
Description
par3d can be used to set or query graphical parameters in rgl. Parameters can be set by specifying
them as arguments to par3d in tag = value form, or by passing them as a list of tagged values.
28
par3d
Usage
par3d(..., no.readonly = FALSE, dev = rgl.cur(),
subscene = currentSubscene3d(dev))
open3d(..., params=getr3dDefaults(),
useNULL = rgl.useNULL())
getr3dDefaults()
Arguments
...
arguments in tag = value form, or a list of tagged values. The tags must come
from the graphical parameters described below.
no.readonly
logical; if TRUE and there are no other arguments, only those parameters which
can be set by a subsequent par3d() call are returned.
dev
integer; the rgl device.
subscene
integer; the subscene.
params
a list of graphical parameters
useNULL
whether to use the null graphics device
Details
Parameters are queried by giving one or more character vectors to par3d.
par3d() (no arguments) or par3d(no.readonly=TRUE) is used to get all the graphical parameters
(as a named list).
By default, queries and modifications apply to the current subscene on the current device; specify
dev and/or subscene to change this. Some parameters apply to the device as a whole; these are
marked in the list below.
open3d opens a new rgl device, and sets the parameters as requested. The r3dDefaults list returned
by the getr3dDefaults function will be used as default values for parameters. As installed this
sets the point of view to ’world coordinates’ (i.e. x running from left to right, y from front to back,
z from bottom to top), the mouseMode to (zAxis, zoom, fov), and the field of view to 30 degrees.
Users may create their own variable named r3dDefaults in the global environment and it will
override the installed one. If there is a bg element in the list or the arguments, it should be a list of
arguments to pass to the bg3d function to set the background.
The arguments to open3d may include material, a list of material properties as in r3dDefaults,
but note that high level functions such as plot3d normally use the r3dDefaults values in preference to this setting.
If useNULL is TRUE, rgl will use a “null” device. This device records objects as they are plotted, but
displays nothing. It is intended for use with writeWebGL and similar functions.
Value
When parameters are set, their former values are returned in an invisible named list. Such a list can
be passed as an argument to par3d to restore the parameter values. Use par3d(no.readonly = TRUE)
for the full list of parameters that can be restored.
par3d
29
When just one parameter is queried, its value is returned directly. When two or more parameters
are queried, the result is a list of values, with the list names giving the parameters.
Note the inconsistency: setting one parameter returns a list, but querying one parameter returns an
object.
Parameters
R.O. indicates read-only arguments: These may only be used in queries, i.e., they do not set anything.
antialias R.O. in par3d, may be set in open3d. The (requested) number of hardware antialiasing planes to use (with multisample antialiasing). The OpenGL driver may not support the
requested number, in which case par3d("antialias") will report what was actually set. Applies to the whole device.
cex real. The default size for text.
family character. The default device independent family name; see text3d. Applies to the whole
device.
font integer. The default font number (from 1 to 5; see text3d. Applies to the whole device.
useFreeType logical. Should FreeType fonts be used? Applies to the whole device.
fontname R.O.; the system-dependent name of the current font. Applies to the whole device.
FOV real. The field of view, from 0 to 179 degrees. This controls the degree of parallax in the
perspective view. Isometric perspective corresponds to FOV=0.
ignoreExtent logical. Set to TRUE so that subsequently plotted objects will be ignored in calculating the bounding box of the scene. Applies to the whole device.
maxClipPlanes R.O.; an integer giving the maximum number of clip planes that can be defined in
the current system. Applies to the whole device.
modelMatrix R.O.; a 4 by 4 matrix describing the position of the user data. See the Note below.
mouseMode character. A vector of 4 strings describing what the 3 mouse buttons and the mouse
wheel do. Partial matching is used. Possible values for the first 3 entries of mouseMode
(corresponding to the mouse buttons are
"none" No action for this button.
"trackball" Mouse acts as a virtual trackball, rotating the scene.
"xAxis" Similar to "trackball", but restricted to X axis rotation.
"yAxis" Y axis rotation.
"zAxis" Z axis rotation.
"polar" Mouse rotates the scene by moving in polar coordinates.
"selecting" Mouse is used for selection. This is not normally set by the user, but is used
internally by the select3d function.
"zoom" Mouse is used to zoom the display.
"fov" Mouse changes the field of view of the display.
"user" Used when a user handler is set by rgl.setMouseCallbacks.
Possible values for the 4th entry corresponding to the mouse wheel are
"none" No action.
30
par3d
"pull" Pulling on the mouse wheel increases magnification, i.e. “pulls the scene closer”.
"push" Pulling on the mouse wheel decreases magnification, i.e. “pushes the scene away”.
"user" Used when a user handler is set by rgl.setWheelCallback.
A common default on Mac OSX is to convert a two finger drag on a trackpad to a mouse wheel
rotation.
Applies to the whole device.
observer R.O.; the position of the observer relative to the model. Set by observer3d. See the
Note below.
projMatrix R.O.; a 4 by 4 matrix describing the current projection of the scene.
scale real. A vector of 3 values indicating the amount by which to rescale each axis before display.
Set by aspect3d.
skipRedraw whether to update the display. Set to TRUE to suspend updating while making multiple
changes to the scene. See demo(hist3d) for an example. Applies to the whole device.
userMatrix a 4 by 4 matrix describing user actions to display the scene.
viewport real. A vector giving the dimensions of the window in pixels. The entries are taken to
be c(x,y,width,height) where c(x,y) are the coordinates in pixels of the lower left corner
within the window.
zoom real. A positive value indicating the current magnification of the scene.
bbox R.O.; real. A vector of six values indicating the current values of the bounding box of the
scene (xmin, xmax, ymin, ymax, zmin, zmax)
windowRect integer. A vector of four values indicating the left, top, right and bottom of the displayed window (in pixels). Applies to the whole device.
Rendering
The parameters returned by par3d are sufficient to determine where rgl would render a point on the
screen. Given a column vector (x,y,z) in a subscene s, it performs the equivalent of the following
operations:
1. It converts the point to homogeneous coordinates by appending w=1, giving the vector v = (x,y,z,1).
2. It calculates the M = par3d("modelMatrix") as a product from right to left of the following
matrices:
•
•
•
•
•
A matrix to translate the centre of the bounding box to the origin.
A matrix to rescale according to par3d("scale").
The par3d("userMatrix") as set by the user.
A matrix which may be set by mouse movements.
If s has the "model" set to "modify", a similar collection of matrices using parameters
from the parent subscene.
3. It multiplies the point by M giving u = M %*% v.
4. It multiplies that point by a matrix based on the observer position to translate the origin to the
centre of the viewing region.
5. Using this location and information on the normals (which have been similarly transformed),
it performs lighting calculations.
par3d
31
6. It obtains the projection matrix P = par3d("projMatrix") and multiplies the point by it
giving P %*% u = (x2, y2, z2, w2).
7. It converts back to Euclidean coordinates by dividing the first 3 coordinates by w2.
8. The new value z2/w2 represents the depth into the scene of the point. Depending on what has
already been plotted, this depth might be obscured, in which case nothing more is plotted.
9. If the point is not culled due to depth, the x2 and y2 values are used to determine the point in
the image. The par3d("viewport") values are used to translate from the range (-1, 1) to
pixel locations, and the point is plotted.
10. If hardware antialiasing is enabled, then the whole process is repeated multiple times (at least
conceptually) with different locations in each pixel sampled to determine what is plotted there,
and then the images are combined into what is displayed.
See ?matrices for more information on homogeneous and Euclidean coordinates.
Note that many of these calculations are done on the graphics card using single precision; you
will likely see signs of rounding error if your scene requires more than 4 or 5 digit precision to
distinguish values in any coordinate.
Note
The "xAxis", "yAxis" and "zAxis" mouse modes rotate relative to the coordinate system of the
data, regardless of the current orientation of the scene.
When multiple parameters are set, they are set in the order given. In some cases this may lead
to warnings and ignored values; for example, some font families only support cex = 1, so changing both cex and family needs to be done in the right order. For example, when using the "bitmap"
family on Windows, par3d(family = "sans", cex = 2) will work, but par3d(cex = 2, family = "sans")
will leave cex at 1 (with a warning that the "bitmap" family only supports that size).
Although par3d("viewport") names the entries of the reported vector, names are ignored when
setting the viewport and entries must be specified in the standard order.
In rgl versions 0.94.x the modelMatrix entry had a changed meaning; before and after that it
contains a copy of the OpenGL MODELVIEW matrix.
References
OpenGL Architecture Review Board (1997). OpenGL Programming Guide. Addison-Wesley.
See Also
rgl.viewpoint to set FOV and zoom.
rgl.useNULL for default usage of null device.
Examples
r3dDefaults
open3d()
shade3d(cube3d(color=rep(rainbow(6),rep(4,6))))
save <- par3d(userMatrix = rotationMatrix(90*pi/180, 1,0,0))
save
32
par3dinterp
par3d("userMatrix")
par3d(save)
par3d("userMatrix")
par3dinterp
Interpolator for par3d parameters
Description
Returns a function which interpolates par3d parameter values, suitable for use in animations.
Usage
par3dinterp(times = NULL, userMatrix, scale, zoom, FOV,
method = c("spline", "linear"),
extrapolate = c("oscillate", "cycle", "constant", "natural"),
dev = rgl.cur(), subscene = currentSubscene3d(dev))
Arguments
times
Times at which values are recorded or a list; see below
userMatrix
Values of par3d("userMatrix")
scale
Values of par3d("scale")
zoom
Values of par3d("zoom")
FOV
Values of par3d("FOV")
method
Method of interpolation
extrapolate
How to extrapolate outside the time range
dev
Which rgl device to use
subscene
Which subscene to use
Details
This function is intended to be used in constructing animations. It produces a function that returns
a list suitable to pass to par3d, to set the viewpoint at a given point in time.
All of the parameters are optional. Only those par3d parameters that are specified will be returned.
The input values other than times may each be specified as lists, giving the parameter value settings at a fixed time, or as matrices or arrays. If not lists, the following formats should be used:
userMatrix can be a 4 x 4 x n array, or a 4 x 4n matrix; scale should be an n x 3 matrix; zoom
and FOV should be length n vectors.
An alternative form of input is to put all of the above arguments into a list (i.e. a list of lists, or a
list of arrays/matrices/vectors), and pass it as the first argument. This is the most convenient way to
use this function with the tkrgl function par3dsave.
Interpolation is by cubic spline or linear interpolation in an appropriate coordinate-wise fashion.
Extrapolation may oscillate (repeat the sequence forward, backward, forward, etc.), cycle (repeat
persp3d
33
it forward), be constant (no repetition outside the specified time range), or be natural (linear on an
appropriate scale). In the case of cycling, the first and last specified values should be equal, or the
last one will be dropped. Natural extrapolation is only supported with spline interpolation.
Value
A function is returned. The function takes one argument, and returns a list of par3d settings interpolated to that time.
Author(s)
Duncan Murdoch
See Also
play3d to play the animation.
Examples
f <- par3dinterp( zoom = c(1,2,3,1) )
f(0)
f(1)
f(0.5)
## Not run:
play3d(f)
## End(Not run)
persp3d
Surface plots
Description
This function draws plots of surfaces over the x-y plane. persp3d is a generic function.
Usage
persp3d(x, ...)
## Default S3 method:
persp3d(x = seq(0, 1, len = nrow(z)), y = seq(0, 1, len = ncol(z)), z,
xlim = range(x, na.rm = TRUE),
ylim = range(y, na.rm = TRUE),
zlim = range(z, na.rm = TRUE),
xlab = NULL, ylab = NULL, zlab = NULL, add = FALSE, aspect = !add, ...)
34
persp3d
Arguments
x, y
locations of grid lines at which the values in z are measured. These may be
given as vectors or matrices. If vectors, they must be in ascending order. Either
one or both may be matrices. If x is a list, its components x$x and x$y are
used for x and y, respectively.
z
a matrix containing the values to be plotted. Note that x can be used instead of
z for convenience.
xlim, ylim, zlim
x-, y- and z-limits. The plot is produced so that the rectangular volume defined
by these limits is visible.
xlab, ylab, zlab
titles for the axes. N.B. These must be character strings; expressions are not
accepted. Numbers will be coerced to character strings.
add
whether to add the points to an existing plot.
aspect
either a logical indicating whether to adjust the aspect ratio, or a new ratio
...
additional material parameters to be passed to surface3d and decorate3d.
Details
This is similar to persp with user interaction. See plot3d for more general details.
One difference from persp is that colors are specified on each vertex, rather than on each facet
of the surface. To emulate the persp color handling, you need to do the following. First, convert
the color vector to an (nx-1) by (ny-1) matrix; then add an extra row before row 1, and an extra
column after the last column, to convert it to nx by ny. (These extra colors will not be used). For
example, col <- rbind(1, cbind(matrix(col, nx-1, ny-1), 1)). Finally, call persp3d with
material property smooth = FALSE.
If the x or y argument is a matrix, then it must be of the same dimension as z, and the values in the
matrix will be used for the corresponding coordinates. This is used to plot shapes such as spheres
or cylinders where z is not a function of x and y. See the fourth and fifth examples below.
Value
This function is called for the side effect of drawing the plot. A vector of shape IDs is returned.
Author(s)
Duncan Murdoch
See Also
plot3d, persp. There is a persp3d.function method for drawing functions.
persp3d
35
Examples
# (1) The Obligatory Mathematical surface.
#
Rotated sinc function.
x <- seq(-10, 10, length= 30)
y <- x
f <- function(x,y) { r <- sqrt(x^2+y^2); 10 * sin(r)/r }
z <- outer(x, y, f)
z[is.na(z)] <- 1
open3d()
bg3d("white")
material3d(col="black")
persp3d(x, y, z, aspect=c(1, 1, 0.5), col = "lightblue",
xlab = "X", ylab = "Y", zlab = "Sinc( r )")
# (2) Add to existing persp plot:
xE <- c(-10,10); xy <- expand.grid(xE, xE)
points3d(xy[,1], xy[,2], 6, col = "red")
lines3d(x, y=10, z= 6 + sin(x), col = "green")
phi <- seq(0, 2*pi, len = 201)
r1 <- 7.725 # radius of 2nd maximum
xr <- r1 * cos(phi)
yr <- r1 * sin(phi)
lines3d(xr,yr, f(xr,yr), col = "pink", lwd = 2)
# (3) Visualizing a simple DEM model
z <- 2 * volcano
x <- 10 * (1:nrow(z))
y <- 10 * (1:ncol(z))
# Exaggerate the relief
# 10 meter spacing (S to N)
# 10 meter spacing (E to W)
open3d()
bg3d("slategray")
material3d(col="black")
persp3d(x, y, z, col = "green3", aspect="iso",
axes = FALSE, box = FALSE)
# (4) A globe
lat <- matrix(seq(90,-90, len=50)*pi/180, 50, 50, byrow=TRUE)
long <- matrix(seq(-180, 180, len=50)*pi/180, 50, 50)
r
x
y
z
<<<<-
6378.1 # radius of Earth in km
r*cos(lat)*cos(long)
r*cos(lat)*sin(long)
r*sin(lat)
open3d()
persp3d(x, y, z, col="white",
36
persp3d.function
texture=system.file("textures/worldsmall.png",package="rgl"),
specular="black", axes=FALSE, box=FALSE, xlab="", ylab="", zlab="",
normal_x=x, normal_y=y, normal_z=z)
if (!rgl.useNULL())
play3d(spin3d(axis=c(0,0,1), rpm=16), duration=2.5)
## Not run:
# This looks much better, but is slow because the texture is very big
persp3d(x, y, z, col="white",
texture=system.file("textures/world.png",package="rgl"),
specular="black", axes=FALSE, box=FALSE, xlab="", ylab="", zlab="",
normal_x=x, normal_y=y, normal_z=z)
## End(Not run)
persp3d.function
Plot a function of two variables
Description
Plot a function z(x,y) or a parametric function (x(s,t), y(s,t), z(s,t)).
Usage
## S3 method for class 'function'
persp3d(x,
xlim = c(0, 1), ylim = c(0, 1), zlim = NULL,
slim = NULL, tlim = NULL,
n = 101,
xvals = seq.int(min(xlim), max(xlim), length.out
yvals = seq.int(min(ylim), max(ylim), length.out
svals = seq.int(min(slim), max(slim), length.out
tvals = seq.int(min(tlim), max(tlim), length.out
xlab = "x", ylab = "y", zlab = "z",
col = "gray", otherargs = list(),
normal = NULL, texture = NULL, ...)
## S3 method for class 'function'
plot3d(x, ...)
=
=
=
=
n[1]),
n[2]),
n[1]),
n[2]),
Arguments
x
A function of two arguments. See the details below.
xlim, ylim
By default, the range of x and y values. For a parametric surface, if these are not
missing, they are used as limits on the displayed x and y values.
zlim
If not NULL, limits on the displayed z values.
slim, tlim
If not NULL, these give the range of s and t in the parametric specification of the
surface. If only one is given, the other defaults to c(0,1).
persp3d.function
37
n
A one or two element vector giving the number of steps in the x and y (or s and
t) grid.
xvals, yvals
The values at which to evaluate x and y. Ignored for a parametric surface. If
used, xlim and/or ylim are ignored.
svals,tvals
The values at which to evaluate s and t for a parametric surface. Only used if
slim or tlim is not NULL. As with xvals and yvals, these override the corresponding slim or tlim specification.
xlab, ylab, zlab
The axis labels.
col
The color to use for the plot. See the details below.
otherargs
Additional arguments to pass to the function.
normal, texture
Functions to set surface normals or texture coordinates. See the details below.
...
Additional arguments to pass to persp3d.
Details
The "function" method for plot3d simply passes all arguments to persp3d. Thus this description
applies to both.
The first argument x is required to be a function. It is named x only because of the requirements of
the S3 system; in the remainder of this help page, we will assume that the assignment f <- x has
been made, and will refer to the function f().
persp3d.function evaluates f() on a two-dimensional grid of values, and displays the resulting
surface. The values on the grid will be passed in as vectors in the first two arguments to the function,
so f() needs to be vectorized. Other optional arguments to f() can be specified in the otherargs
list.
In the default form where slim and tlim are both NULL, it is assumed that f(x,y) returns heights,
which will be plotted in the z coordinate.
If slim or tlim is specified, a parametric surface is plotted. Values of s f(s,t) must return a
3-column matrix, giving x, y and z coordinates of points on the surface.
The color of the surface may be specified as the name of a color, or a vector or matrix of color
names. In this case the colors will be recycled across the points on the grid of values.
Alternatively, a function may be given: it should be a function like rainbow that takes an integer
argument and returns a vector of colors. In this case the colors are mapped to z values.
The normal argument allows specification of a function to compute normal vectors to the surface.
This function is passed the same arguments as f() (incuding otherargs if present), and should
produce a 3-column matrix containing the x, y and z coordinates of the normals.
The texture argument is a function similar to normal, but it produces a 2-column matrix containing
texture coordinates.
Both normal and texture may also contain matrices, with 3 and 2 columns respectively, and rows
corresponding to the points that were passed to f().
Value
This function constructs a call to persp3d and returns the value from that function.
38
planes3d
Author(s)
Duncan Murdoch
See Also
The curve function in base graphics does something similar for functions of one variable. See the
example below for space curves.
Examples
# (1) The Obligatory Mathematical surface.
#
Rotated sinc function, with colors
f <- function(x,y) {
r <- sqrt(x^2+y^2)
ifelse(r == 0, 10, 10 * sin(r)/r)
}
open3d()
plot3d(f, col = colorRampPalette(c("blue", "white", "red")),
xlab = "X", ylab = "Y", zlab = "Sinc( r )",
xlim = c(-10,10), ylim = c(-10,10),
aspect=c(1, 1, 0.5))
# (2) A cylindrical plot
f <- function(s, t) {
r <- 1 + exp( -pmin( (s - t)^2,
(s - t - 1)^2,
(s - t + 1)^2 )/0.01 )
cbind(r*cos(t*2*pi), r*sin(t*2*pi), s)
}
open3d()
plot3d(f, slim=c(0,1), tlim=c(0,1), col="red", alpha = 0.8)
# Add a curve to the plot, fixing s at 0.5.
plot3d(f(0.5, seq.int(0,1,length.out=100)), type="l", add=TRUE,
lwd = 3, depth_test = "lequal")
planes3d
add planes
Description
planes3d and rgl.planes add mathematical planes to a scene. Their intersection with the current
bounding box will be drawn. clipplanes3d and rgl.clipplanes add clipping planes to a scene.
planes3d
39
Usage
planes3d(a, b = NULL, c = NULL, d = 0, ...)
rgl.planes(a, b = NULL, c = NULL, d = 0, ...)
clipplanes3d(a, b = NULL, c = NULL, d = 0)
rgl.clipplanes(a, b = NULL, c = NULL, d = 0)
Arguments
a, b, c
Coordinates of the normal to the plane. Any reasonable way of defining the
coordinates is acceptable. See the function xyz.coords for details.
d
Coordinates of the "offset". See the details.
...
Material properties. See rgl.material for details.
Details
planes3d and rgl.planes draw planes using the parametrization ax + by + cz + d = 0. Multiple
planes may be specified by giving multiple values for any of a, b, c, d; the other values will be
recycled as necessary.
clipplanes3d and rgl.clipplanes define clipping planes using the same equations. Clipping
planes suppress the display of other objects (or parts of them) in the scene, based on their coordinates. Points (or parts of lines or surfaces) where the coordinates x,y,z satisfy ax+by +cz +d < 0
will be suppressed.
The number of clipping planes supported by the OpenGL driver is implementation dependent; use
par3d("maxClipPlanes") to find the limit.
Value
A shape ID of the planes or clipplanes object is returned invisibly.
See Also
abclines3d, rgl.abclines for mathematical lines.
triangles3d, rgl.triangles or the corresponding functions for quadrilaterals may be used to
draw sections of planes that do not adapt to the bounding box.
The example in subscene3d shows how to combine clipping planes to suppress complex shapes.
Examples
# Show regression plane with z as dependent variable
open3d()
x <- rnorm(100)
y <- rnorm(100)
z <- 0.2*x - 0.3*y + rnorm(100, sd=0.3)
fit <- lm(z ~ x + y)
plot3d(x,y,z, type="s", col="red", size=1)
40
play3d
coefs <- coef(fit)
a <- coefs["x"]
b <- coefs["y"]
c <- -1
d <- coefs["(Intercept)"]
planes3d(a, b, c, d, alpha=0.5)
open3d()
plot3d(x,y,z, type="s", col="red", size=1)
clipplanes3d(a, b, c, d)
play3d
Play animation of rgl scene
Description
play3d calls a function repeatedly, passing it the elapsed time in seconds, and using the result of
the function to reset the viewpoint. movie3d does the same, but records each frame to a file to make
a movie.
Usage
play3d(f, duration = Inf, dev = rgl.cur(), ..., startTime = 0)
movie3d(f, duration, dev = rgl.cur(), ..., fps = 10,
movie = "movie", frames = movie, dir = tempdir(),
convert = TRUE, clean = TRUE, verbose=TRUE,
top = TRUE, type = "gif", startTime = 0)
Arguments
f
duration
dev
...
startTime
fps
movie
frames
dir
convert
clean
verbose
top
type
A function returning a list that may be passed to par3d
The duration of the animation
Which rgl device to select
Additional parameters to pass to f.
Initial time at which to start the animation
Number of frames per second
The base of the output filename, not including .gif
The base of the name for each frame
A directory in which to create temporary files for each frame of the movie
Whether to try to convert the frames to a single GIF movie, or a command to do
so
If convert is TRUE, whether to delete the individual frames
Whether to report the convert command and the output filename
Whether to call rgl.bringtotop before each frame
What type of movie to create. See Details.
play3d
41
Details
The function f will be called in a loop with the first argument being the startTime plus the time in
seconds since the start (where the start is measured after all arguments have been evaluated).
play3d is likely to place a high load on the CPU; if this is a problem, calls to Sys.sleep should be
made within the function to release time to other processes.
play3d will run for the specified duration (in seconds), but can be interrupted by pressing ESC
while the rgl window has the focus.
movie3d saves each frame to disk in a filename of the form ‘framesXXX.png’, where XXX is the
frame number, starting from 0. If convert is TRUE, it uses ImageMagick to convert them to a single
file, by default an animated GIF. The type argument will be passed to ImageMagick to use as a file
extension to choose the file type.
Alternatively, convert can be a template for a command to execute in the standard shell (wildcards
are allowed). The template is converted to a command using
sprintf(convert, fps, frames, movie, type, dir, duration)
For example, code=TRUE uses the template "convert -delay 1x%d %s*.png %s.%s". All work
is done in the directory dir, so paths should not be needed in the command. (Note that sprintf
does not require all arguments to be used, and supports formats that use them in an arbitrary order.)
The top=TRUE default is designed to work around an OpenGL limitation: in some implementations,
rgl.snapshot will fail if the window is not topmost.
As of rgl version 0.94, the dev argument is not needed: the function f can specify its device, as
spin3d does, for example. However, if dev is specified, it will be selected as the current device as
each update is played.
Value
This function is called for the side effect of its repeated calls to f. It returns NULL invisibly.
Author(s)
Duncan Murdoch, based on code by Michael Friendly
See Also
spin3d and par3dinterp return functions suitable to use as f. See demo(flag) for an example
that modifies the scene in f.
Examples
open3d()
plot3d( cube3d(col="green") )
M <- par3d("userMatrix")
if (!rgl.useNULL())
play3d( par3dinterp(time=(0:2)*0.75,userMatrix=list(M,
rotate3d(M, pi/2, 1, 0, 0),
rotate3d(M, pi/2, 0, 1, 0) ) ),
duration=3 )
## Not run:
movie3d( spin3d(), duration=5 )
42
plot3d
## End(Not run)
plot3d
3D Scatterplot
Description
Draws a 3D scatterplot.
Usage
plot3d(x, ...)
## Default S3 method:
plot3d(x, y, z,
xlab, ylab, zlab, type = "p", col,
size, lwd, radius,
add = FALSE, aspect = !add, ...)
## S3 method for class 'mesh3d'
plot3d(x, xlab = "x", ylab = "y", zlab = "z", type = c("shade", "wire", "dots"),
add = FALSE, ...)
decorate3d(xlim, ylim, zlim,
xlab = "x", ylab = "y", zlab = "z",
box = TRUE, axes = TRUE, main = NULL, sub = NULL,
top = TRUE, aspect = FALSE, expand = 1.03, ...)
Arguments
x, y, z
vectors of points to be plotted. Any reasonable way of defining the coordinates
is acceptable. See the function xyz.coords for details.
xlab, ylab, zlab
labels for the coordinates.
type
For the default method, a single character indicating the type of item to plot.
Supported types are: ’p’ for points, ’s’ for spheres, ’l’ for lines, ’h’ for line
segments from z=0, and ’n’ for nothing. For the mesh3d method, one of ’shade’,
’wire’, or ’dots’. Partial matching is used.
col
the color to be used for plotted items.
size
the size for plotted points.
lwd
the line width for plotted items.
radius
the radius of spheres: see Details below.
add
whether to add the points to an existing plot.
aspect
either a logical indicating whether to adjust the aspect ratio, or a new ratio.
expand
how much to expand the box around the data, if it is drawn.
plot3d
43
...
additional parameters which will be passed to par3d, material3d or decorate3d.
xlim, ylim, zlim
limits to use for the coordinates.
box, axes
whether to draw a box and axes.
main, sub
main title and subtitle.
top
whether to bring the window to the top when done.
Details
plot3d is a partial 3D analogue of plot.default.
Note that since rgl does not currently support clipping, all points will be plotted, and xlim, ylim,
and zlim will only be used to increase the respective ranges.
Missing values in the data are skipped, as in standard graphics.
If aspect is TRUE, aspect ratios of c(1,1,1) are passed to aspect3d. If FALSE, no aspect adjustment
is done. In other cases, the value is passed to aspect3d.
With type = "s", spheres are drawn centered at the specified locations. The radius may be
controlled by size (specifying the size relative to the plot display, with the default size=3 giving a
radius about 1/20 of the plot region) or radius (specifying it on the data scale if an isometric aspect
ratio is chosen, or on an average scale if not).
Value
plot3d is called for the side effect of drawing the plot; a vector of object IDs is returned.
decorate3d adds the usual decorations to a plot: labels, axes, etc.
Author(s)
Duncan Murdoch
See Also
plot.default, open3d, par3d. There is a plot3d.function method for plotting surfaces.
Examples
open3d()
x <- sort(rnorm(1000))
y <- rnorm(1000)
z <- rnorm(1000) + atan2(x,y)
plot3d(x, y, z, col=rainbow(1000))
44
points3d
points3d
add primitive set shape
Description
Adds a shape node to the current scene
Usage
points3d(x, y = NULL, z = NULL, ...)
lines3d(x, y = NULL, z = NULL, ...)
segments3d(x, y = NULL, z = NULL, ...)
triangles3d(x, y = NULL, z = NULL, ...)
quads3d(x, y = NULL, z = NULL, ...)
Arguments
x, y, z
...
coordinates. Any reasonable way of defining the coordinates is acceptable. See
the function xyz.coords for details.
Material properties (see rgl.material), normals and texture coordinates (see
rgl.primitive).
Details
The functions points3d, lines3d, segments3d, triangles3d and quads3d add points, joined
lines, line segments, filled triangles or quadrilaterals to the plots. They correspond to the OpenGL
types GL_POINTS, GL_LINE_STRIP, GL_LINES, GL_TRIANGLES and GL_QUADS respectively.
Points are taken in pairs by segments3d, triplets as the vertices of the triangles, and quadruplets for
the quadrilaterals. Colors are applied vertex by vertex; if different at each end of a line segment, or
each vertex of a polygon, the colors are blended over the extent of the object. Quadrilaterals must
be entirely in one plane and convex, or the results are undefined.
These functions call the lower level functions rgl.points, rgl.linestrips, and so on, and are
provided for convenience.
The appearance of the new objects are defined by the material properties. See rgl.material for
details.
The two principal differences between the rgl.* functions and the *3d functions are that the former
set all unspecified material properties to defaults, whereas the latter use current values as defaults;
the former make persistent changes to material properties with each call, whereas the latter make
temporary changes only for the duration of the call.
Value
Each function returns the integer object ID of the shape that was added to the scene. These can be
passed to rgl.pop to remove the object from the scene.
polygon3d
45
Author(s)
Ming Chen and Duncan Murdoch
Examples
# Show 12 random vertices in various ways.
M <- matrix(rnorm(36), 3, 12, dimnames=list(c('x','y','z'),
rep(LETTERS[1:4], 3)))
# Force 4-tuples to be convex in planes so that quads3d works.
for (i in c(1,5,9)) {
quad <- as.data.frame(M[,i+0:3])
coeffs <- runif(2,0,3)
if (mean(coeffs) < 1) coeffs <- coeffs + 1 - mean(coeffs)
quad$C <- with(quad, coeffs[1]*(B-A) + coeffs[2]*(D-A) + A)
M[,i+0:3] <- as.matrix(quad)
}
open3d()
# Rows of M are x, y, z coords; transpose to plot
M <- t(M)
shift <- matrix(c(-3,3,0), 12, 3, byrow=TRUE)
points3d(M)
lines3d(M + shift)
segments3d(M + 2*shift)
triangles3d(M + 3*shift, col='red')
quads3d(M + 4*shift, col='green')
text3d(M + 5*shift, texts=1:12)
# Add labels
shift <- outer(0:5, shift[1,])
shift[,1] <- shift[,1] + 3
text3d(shift,
texts = c('points3d','lines3d','segments3d',
'triangles3d', 'quads3d','text3d'),
adj = 0)
rgl.bringtotop()
polygon3d
Triangulate and draw a polygon in three dimensions.
Description
This function takes a description of a flat polygon in x, y and z coordinates, and draws it in three
dimensions.
46
polygon3d
Usage
polygon3d(x, y = NULL, z = NULL, fill = TRUE, plot = TRUE,
coords = 1:2, random = TRUE, ...)
Arguments
x, y, z
fill
plot
coords
random
...
Vertices of the polygon in a form accepted by xyz.coords.
logical; should the polygon be filled?
logical; should the polygon be displayed?
Which two coordinates (x=1, y=2, z=3) describe the polygon.
Should a random triangulation be used?
Other parameters to pass to lines3d or shade3d if plot = TRUE.
Details
The function triangulates the two dimensional polygon described by coords, then applies the triangulation to all three coordinates. No check is made that the polygon is actually all in one plane, but
the results may be somewhat unpredictable (especially if random = TRUE) if it is not.
Polygons need not be simple; use NA to indicate separate closed pieces. For fill = FALSE there
are no other restrictions on the pieces, but for fill = TRUE the resulting two-dimensional polygon
needs to be one that triangulate can handle.
Value
If plot = TRUE, the id number of the lines (for fill = FALSE) or triangles (for fill = TRUE) that
have been plotted.
If plot = FALSE, then for fill = FALSE, a vector of indices into the XYZ matrix that could be
used to draw the polygon. For fill = TRUE, a triangular mesh object representing the triangulation.
Author(s)
Duncan Murdoch
See Also
extrude3d for a solid extrusion of a polygon, triangulate for the triangulation.
Examples
theta <- seq(0, 4*pi, len=50)
r <- theta + 1
r <- c(r[-50], rev(theta*0.8) + 1)
theta <- c(theta[-50], rev(theta))
x <- r*cos(theta)
y <- r*sin(theta)
plot(x,y,type="n")
polygon(x, y)
polygon3d(x, y, x+y, col = "blue")
r3d
47
r3d
Generic 3D interface
Description
Generic 3D interface for 3D rendering and computational geometry.
Details
R3d is a design for an interface for 3d rendering and computation without dependency on a specific
rendering implementation. R3d includes a collection of 3D objects and geometry algorithms. All
r3d interface functions are named *3d. They represent generic functions that delegate to implementation functions.
The interface can be grouped into 8 categories: Scene Management, Primitive Shapes, High-level
Shapes, Geometry Objects, Visualization, Interaction, Transformation, Subdivision.
The rendering interface gives an abstraction to the underlying rendering model. It can be grouped
into four categories:
Scene Management: A 3D scene consists of shapes, lights and background environment.
Primitive Shapes: Generic primitive 3D graphics shapes such as points, lines, triangles, quadrangles and texts.
High-level Shapes: Generic high-level 3D graphics shapes such as spheres, sprites and terrain.
Interaction: Generic interface to select points in 3D space using the pointer device.
In this package we include an implementation of r3d using the underlying rgl.* functions.
3D computation is supported through the use of object structures that live entirely in R.
Geometry Objects: Geometry and mesh objects allow to define high-level geometry for computational purpose such as triangle or quadrangle meshes (see mesh3d.
Transformation: Generic interface to transform 3d objects.
Visualization: Generic rendering of 3d objects such as dotted, wired or shaded.
Computation: Generic subdivision of 3d objects.
At present, the main practical differences between the r3d functions and the rgl.* functions are as
follows.
The r3d functions call open3d if there is no device open, and the rgl.* functions call rgl.open.
By default open3d sets the initial orientation of the coordinate system in ’world coordinates’, i.e. a
right-handed coordinate system in which the x-axis increases from left to right, the y-axis increases
with depth into the scene, and the z-axis increases from bottom to top of the screen. rgl.* functions,
on the other hand, use a right-handed coordinate system similar to that used in OpenGL. The x-axis
matches that of r3d, but the y-axis increases from bottom to top, and the z-axis decreases with depth
into the scene. Since the user can manipulate the scene, either system can be rotated into the other
one.
The r3d functions also preserve the rgl.material setting across calls (except for texture elements,
in the current implementation), whereas the rgl.* functions leave it as set by the last call.
The example code below illustrates the two coordinate systems.
48
readSTL
See Also
points3d, lines3d, segments3d, triangles3d, quads3d, text3d, spheres3d, sprites3d, terrain3d,
select3d, dot3d, wire3d, shade3d, transform3d, rotate3d, subdivision3d, mesh3d, cube3d,
rgl
Examples
x <- c(0,1,0,0)
y <- c(0,0,1,0)
z <- c(0,0,0,1)
labels <- c("Origin", "X", "Y", "Z")
i <- c(1,2,1,3,1,4)
# rgl.* interface
rgl.open()
rgl.texts(x,y,z,labels)
rgl.texts(1,1,1,"rgl.* coordinates")
rgl.lines(x[i],y[i],z[i])
# *3d interface
open3d()
text3d(x,y,z,labels)
text3d(1,1,1,"*3d coordinates")
segments3d(x[i],y[i],z[i])
readSTL
Read and write STL (stereolithography) format files
Description
These functions read and write STL files. This is a simple file format that is commonly used in
3D printing. It does not represent text, only triangles. The writeSTL function converts some RGL
object types to triangles.
Usage
readSTL(con, ascii = FALSE, plot = TRUE, ...)
writeSTL(con, ascii = FALSE,
pointRadius=0.005,
pointShape = icosahedron3d(),
lineRadius = pointRadius,
lineSides = 20,
ids = NULL)
readSTL
49
Arguments
con
A connection or filename.
ascii
Whether to use the ASCII format or the binary format.
plot
On reading, should the object be plotted?
...
If plotting, other parameters to pass to triangles3d
pointRadius, lineRadius
The radius of points and lines relative to the overall scale of the figure.
pointShape
A mesh shape to use for points. It is scaled by the pointRadius.
lineSides
Lines are rendered as cylinders with this many sides.
ids
The identifiers (from rgl.ids) of the objects to write. If NULL, try to write
everything.
Details
The current implementation is limited. For reading, it ignores normals and color information. For
writing, it only outputs triangles, quads, planes, spheres, points, line segments, line strips and surfaces, and does not write color information. Lines and points are rendered in an isometric scale: if
your data scales vary, they will look strange.
Since the STL format only allows one object per file, all RGL objects are combined into a single
object when output.
The output file is readable by Blender and Meshlab; the latter can write in a number of other formats,
including U3D, suitable for import into a PDF document.
Value
readSTL invisibly returns the object id if plot=TRUE, or (visibly) a matrix of vertices of the triangles
if not.
writeSTL invisibly returns the name of the connection to which the data was written.
Author(s)
Duncan Murdoch
References
The file format was found on Wikipedia on October 25, 2012. I learned about the STL file format
from David Smith’s blog reporting on Ian Walker’s r2stl function.
See Also
scene3d saves a copy of a scene to an R variable; writeWebGL, writePLY, writeOBJ and writeSTL
write the scene to a file in various other formats.
50
rgl.attrib
Examples
filename <- tempfile(fileext=".stl")
open3d()
shade3d( icosahedron3d(col="magenta") )
writeSTL(filename)
open3d()
readSTL(filename, col="red")
rgl.attrib
Get information about shapes
Description
Retrieves information about the shapes in a scene.
Usage
rgl.attrib.count(id, attrib)
rgl.attrib(id, attrib, first = 1,
last = rgl.attrib.count(id, attrib))
Arguments
id
A shape identifier, as returned by rgl.ids.
attrib
An attribute of a shape. Currently supported: one of
"vertices", "normals", "colors", "texcoords", "dim", "texts", "cex",
"adj", "radii", "centers", "ids", "usermatrix", "types", "flags"
or unique prefixes to one of those.
first, last
Specify these to retrieve only those rows of the result.
Details
If the identifier is not found or is not a shape that has the given attribute, zero will be returned by
rgl.attrib.count, and an empty matrix will be returned by rgl.attrib.
The first four attrib names correspond to the usual OpenGL properties; "dim" is used just for
surfaces, defining the rows and columns in the rectangular grid; "cex" and "adj" apply only to text
objects.
Value
rgl.attrib.count returns the count of the requested attribute. rgl.attrib returns the values of
the attribute. Attributes are mostly real-valued, with the following sizes:
"vertices"
"normals"
"centers"
"colors"
3 values
3 values
3 values
4 values
x, y, z
x, y, z
x, y, z
r, g, b, a
rgl.bbox
51
"texcoords"
"dim"
"cex"
"adj"
"radii"
"ids"
"usermatrix"
"texts"
"types"
"flags"
2 values
2 values
1 value
2 values
1 value
1 value
4 values
1 value
1 value
1 value
s, t
r, c
cex
x, y
r
id
x, y, z, w
text
type
flag
The "texts" and "types" attributes are character-valued; the flags attribute is logical valued, with
named rows.
These are returned as matrices with the row count equal to the count for the attribute, and the
columns as listed above.
Author(s)
Duncan Murdoch
See Also
rgl.ids
Examples
p <- plot3d(rnorm(100), rnorm(100), rnorm(100), type="s", col="red")
rgl.attrib.count(p["data"], "vertices")
rgl.attrib(p["data"], "vertices", last=10)
rgl.bbox
Set up Bounding Box decoration
Description
Set up the bounding box decoration.
Usage
rgl.bbox(
xat=NULL, xlab=NULL, xunit=0, xlen=5,
yat=NULL, ylab=NULL, yunit=0, ylen=5,
zat=NULL, zlab=NULL, zunit=0, zlen=5,
marklen=15.0, marklen.rel=TRUE, expand=1,
draw_front=FALSE, ...)
bbox3d(xat=NULL, yat=NULL, zat=NULL,
52
rgl.bbox
xunit="pretty", yunit="pretty", zunit="pretty",
expand=1.03, nticks=5,
draw_front=FALSE, ...)
Arguments
xat,yat,zat
vector specifying the tickmark positions
xlab,ylab,zlab character vector specifying the tickmark labeling
xunit,yunit,zunit
value specifying the tick mark base for uniform tick mark layout
xlen,ylen,zlen value specifying the number of tickmarks
marklen
value specifying the length of the tickmarks
marklen.rel
logical, if TRUE tick mark length is calculated using 1/marklen * axis length,
otherwise tick mark length is marklen in coordinate space
expand
value specifying how much to expand the bounding box around the data
nticks
suggested number of ticks to use on axes
draw_front
draw the front faces of the bounding box
...
Material properties (or other rgl.bbox parameters in the case of bbox3d). See
rgl.material for details.
Details
Four different types of tick mark layouts are possible. If at is not NULL, the ticks are set up at
custom positions. If unit is numeric but not zero, it defines the tick mark base. If it is "pretty"
(the default in bbox3d), ticks are set at pretty locations. If length is not zero, it specifies the
number of ticks that are automatically specified. The first color specifies the bounding box, while
the second one specifies the tick mark and font color.
bbox3d defaults to pretty locations for the axis labels and a slightly larger box, whereas rgl.bbox
covers the exact range.
axes3d offers more flexibility in the specification of the axes, but they are static, unlike those drawn
by rgl.bbox and bbox3d.
Value
This function is called for the side effect of setting the bounding box decoration. A shape ID is
returned to allow rgl.pop to delete it.
See Also
rgl.material, axes3d
rgl.bringtotop
53
Examples
rgl.open()
rgl.points(rnorm(100), rnorm(100), rnorm(100))
rgl.bbox(color=c("#333377","white"), emission="#333377",
specular="#3333FF", shininess=5, alpha=0.8 )
open3d()
points3d(rnorm(100), rnorm(100), rnorm(100))
bbox3d(color=c("#333377","black"), emission="#333377",
specular="#3333FF", shininess=5, alpha=0.8)
rgl.bringtotop
Assign focus to an RGL window
Description
’rgl.bringtotop’ brings the current RGL window to the front of the window stack (and gives it focus).
Usage
rgl.bringtotop(stay = FALSE)
Arguments
stay
whether to make the window stay on top.
Details
If stay is TRUE, then the window will stay on top of normal windows.
Note
not completely implemented for X11 graphics (stay not implemented; window managers such
as KDE may block this action (set "Focus stealing prevention level" to None in Control Center/Window Behavior/Advanced)). Not currently implemented under OS/X.
Author(s)
Ming Chen/Duncan Murdoch
Examples
rgl.open()
rgl.points(rnorm(1000), rnorm(1000), rnorm(1000), color=heat.colors(1000))
rgl.bringtotop(stay = TRUE)
54
rgl.material
rgl.material
Generic Appearance setup
Description
Set material properties for geometry appearance.
Usage
rgl.material(
color
= c("white"),
alpha
= c(1.0),
lit
= TRUE,
ambient
= "black",
specular
= "white",
emission
= "black",
shininess
= 50.0,
smooth
= TRUE,
texture
= NULL,
textype
= "rgb",
texmipmap
= FALSE,
texminfilter = "linear",
texmagfilter = "linear",
texenvmap
= FALSE,
front
= "fill",
back
= "fill",
size
= 3.0,
lwd
= 1.0,
fog
= TRUE,
point_antialias = FALSE,
line_antialias = FALSE,
depth_mask
= TRUE,
depth_test
= "less",
...
)
material3d(...)
Arguments
color
vector of R color characters. Represents the diffuse component in case of lighting calculation (lit = TRUE), otherwise it describes the solid color characteristics.
lit
logical, specifying if lighting calculation should take place on geometry
ambient, specular, emission, shininess
properties for lighting calculation. ambient, specular, emission are R color character string values; shininess represents a numerical.
rgl.material
55
alpha
vector of alpha values between 0.0 (fully transparent) .. 1.0 (opaque).
smooth
logical, specifying whether Gouraud shading (smooth) or flat shading should be
used.
texture
path to a texture image file. Supported formats: png.
textype
specifies what is defined with the pixmap
"alpha" alpha values
"luminance" luminance
"luminance.alpha" luminance and alpha
"rgb" color
"rgba" color and alpha texture
texmipmap
Logical, specifies if the texture should be mipmapped.
texmagfilter
specifies the magnification filtering type (sorted by ascending quality):
"nearest" texel nearest to the center of the pixel
"linear" weighted linear average of a 2x2 array of texels
texminfilter
specifies the minification filtering type (sorted by ascending quality):
"nearest" texel nearest to the center of the pixel
"linear" weighted linear average of a 2x2 array of texels
"nearest.mipmap.nearest" low quality mipmapping
"nearest.mipmap.linear" medium quality mipmapping
"linear.mipmap.nearest" medium quality mipmapping
"linear.mipmap.linear" high quality mipmapping
texenvmap
logical, specifies if auto-generated texture coordinates for environment-mapping
should be performed on geometry.
front, back
Determines the polygon mode for the specified side:
"fill" filled polygon
"line" wireframed polygon
"points" point polygon
"cull" culled (hidden) polygon
size
numeric, specifying the size of points in pixels
lwd
numeric, specifying the line width in pixels
fog
logical, specifying if fog effect should be applied on the corresponding shape
point_antialias, line_antialias
logical, specifying if points and lines should be antialiased
depth_mask
logical, specifying whether the object’s depth should be stored.
depth_test
Determines which depth test is used to see if this object is visible, depending
on its apparent depth in the scene compared to the stored depth. Possible values
are "never", "less" (the default), "equal", "lequal" (less than or equal),
"greater", "notequal", "gequal" (greater than or equal), "always".
...
Any of the arguments above; see Details below.
56
rgl.material
Details
Only one side at a time can be culled.
material3d is an alternate interface to the material properties, modelled after par3d: rather than
setting defaults for parameters that are not specified, they will be left unchanged. material3d may
also be used to query the material properties; see the examples below.
The current implementation does not return parameters for textures.
If point_antialias is TRUE, points will be drawn as circles; otherwise, they will be drawn as
squares. Lines tend to appear heavier with line_antialias==TRUE.
The material member of the r3dDefaults list may be used to set default values for material
properties.
The ... parameter to rgl.material is ignored.
Value
rgl.material() is called for the side effect of setting the material properties. It returns a value
invisibly which is not intended for use by the user.
Users should use material3d() to query material properties. It returns values similarly to par3d
as follows: When setting properties, it returns the previous values in a named list. A named list is
also returned when more than one value is queried. When a single value is queried it is returned
directly.
See Also
rgl.primitive, rgl.bbox, rgl.bg, rgl.light
Examples
save <- material3d("color")
material3d(color="red")
material3d("color")
material3d(color=save)
# this illustrates the effect of depth_test
x <- c(1:3); xmid <- mean(x)
y <- c(2,1,3); ymid <- mean(y)
z <- 1
open3d()
tests <- c("never", "less", "equal", "lequal", "greater",
"notequal", "gequal", "always")
for (i in 1:8) {
triangles3d(x,y,z+i, col=heat.colors(8)[i])
texts3d(xmid,ymid,z+i, paste(i, tests[i], sep=". "), depth_test=tests[i])
}
rgl.open
rgl.open
57
3D visualization device system
Description
3D real-time rendering system.
Usage
# Low level rgl.* interface
rgl.open(useNULL = rgl.useNULL())
# open new device
rgl.close()
# close current device
rgl.cur()
# returns active device ID
rgl.dev.list() # returns all device IDs
rgl.set(which, silent=FALSE) # set device as active
rgl.quit()
# shutdown rgl device system
rgl.init(initValue=0, onlyNULL=FALSE)
# re-initialize rgl
Arguments
useNULL
whether to open the “null” device
which
device ID
silent
whether to suppress update of window titles
initValue
value for internal use only
onlyNULL
only initialize the null (no display) device
Details
The rgl device design is oriented towards the R device metaphor. If you send scene management
instructions, and there’s no device open, it will be opened automatically. Opened devices automatically get the current device focus. The focus may be changed by using rgl.set(). rgl.quit()
shuts down the rgl subsystem and all open devices, detaches the package including the shared library
and additional system libraries.
The rgl.open() function attempts to open a new RGL window. If the "rgl.antialias" option
is set, it will be used to select the requested antialiasing. (See open3d for more description of
antialiasing and an alternative way to set the value.)
If useNULL is TRUE, rgl will use a “null” device. This device records objects as they are plotted, but
displays nothing. It is intended for use with writeWebGL and similar functions.
If rgl.open() fails (e.g. because X windows is not running, or its DISPLAY variable is not set
properly), then you can retry the initialization by calling rgl.init(). Do not do this when windows
have already been successfully opened: they will be orphaned, with no way to remove them other
than closing R. In fact, it’s probably a good idea not to do this at all: quitting R and restarting it is a
better solution.
58
rgl.pixels
This package also includes a higher level interface which is described in the r3d help topic. That
interface is designed to act more like classic 2D R graphics. We recommend that you avoid mixing
rgl.* and *3d calls.
See the first example below to display the ChangeLog.
Value
rgl.open, rgl.close and rgl.set are called for their side effects and return no useful value.
Similarly rgl.init and rgl.quit are not designed to return useful values; in fact, users shouldn’t
call them at all!
rgl.cur returns the currently active devices, or 0 if none is active; rgl.dev.list returns a vector
of all open devices. Both functions name the items according to the type of device: null for a
hidden null device, wgl for a Windows device, glX for an X windows device, and NSopenGL for a
Cocoa device on OSX.
See Also
r3d, rgl.clear, rgl.pop, rgl.viewpoint, rgl.light, rgl.bg, rgl.bbox, rgl.points, rgl.lines,
rgl.triangles, rgl.quads, rgl.texts, rgl.surface, rgl.spheres, rgl.sprites, rgl.snapshot,
rgl.useNULL
rgl.pixels
Extract pixel information from window
Description
This function extracts single components of the pixel information from the topmost window.
Usage
rgl.pixels(component = c("red", "green", "blue"), viewport=par3d("viewport"), top = TRUE)
Arguments
component
Which component(s)?
viewport
Lower left corner and size of desired region.
top
Whether to bring window to top before reading.
Details
The possible components are "red", "green", "blue", "alpha", "depth", and "luminance" (the
sum of the three colors). All are scaled from 0 to 1.
Note that the luminance is kept below 1 by truncating the sum; this is the definition used for the
GL_LUMINANCE component in OpenGL.
rgl.postscript
59
Value
A vector, matrix or array containing the desired components. If one component is requested, a
vector or matrix will be returned depending on the size of block requested (length 1 dimensions are
dropped); if more, an array, whose last dimension is the list of components.
Author(s)
Duncan Murdoch
See Also
rgl.snapshot to write a copy to a file, demo("stereo") for functions that make use of this to draw
a random dot stereogram and an anaglyph.
Examples
example(surface3d)
depth <- rgl.pixels(component="depth")
if (length(depth) && is.matrix(depth)) # Protect against empty or single pixel windows
contour(depth)
rgl.postscript
export screenshot
Description
Saves the screenshot to a file in PostScript or other vector graphics format.
Usage
rgl.postscript( filename, fmt="eps", drawText=TRUE )
Arguments
filename
full path to filename.
fmt
export format, currently supported: ps, eps, tex, pdf, svg, pgf
drawText
logical, whether to draw text
Details
Animations can be created in a loop modifying the scene and saving a screenshot to a file. (See
example below)
This function is a wrapper for the GL2PS library by Christophe Geuzaine, and has the same limitations as that library: not all OpenGL features are supported, and some are only supported in some
formats. See the reference for full details.
60
rgl.postscript
Author(s)
Christophe Geuzaine / Albrecht Gebhardt
References
GL2PS: an OpenGL to PostScript printing library by Christophe Geuzaine, http://www.geuz.
org/gl2ps/, version 1.3.8.
See Also
rgl.viewpoint, rgl.snapshot
Examples
x <- y <- seq(-10,10,length=20)
z <- outer(x,y,function(x,y) x^2 + y^2)
persp3d(x,y,z, col='lightblue')
title3d("Using LaTeX text", col='red', line=3)
rgl.postscript("persp3da.ps","ps",drawText=FALSE)
rgl.postscript("persp3da.pdf","pdf",drawText=FALSE)
rgl.postscript("persp3da.tex","tex")
rgl.pop()
title3d("Using ps/pdf text", col='red', line=3)
rgl.postscript("persp3db.ps","ps")
rgl.postscript("persp3db.pdf","pdf")
rgl.postscript("persp3db.tex","tex",drawText=FALSE)
## Not run:
#
# create a series of frames for an animation
#
rgl.open()
shade3d(oh3d(), color="red")
rgl.viewpoint(0,20)
for (i in 1:45) {
rgl.viewpoint(i,20)
filename <- paste("pic",formatC(i,digits=1,flag="0"),".eps",sep="")
rgl.postscript(filename, fmt="eps")
}
## End(Not run)
rgl.primitive
rgl.primitive
61
add primitive set shape
Description
Adds a shape node to the current scene
Usage
rgl.points(x, y = NULL, z = NULL, ... )
rgl.lines(x, y = NULL, z = NULL, ... )
rgl.linestrips(x, y = NULL, z = NULL, ...)
rgl.triangles(x, y = NULL, z = NULL, normals=NULL, texcoords=NULL, ... )
rgl.quads(x, y = NULL, z = NULL, normals=NULL, texcoords=NULL, ... )
Arguments
x, y, z
coordinates. Any reasonable way of defining the coordinates is acceptable. See
the function xyz.coords for details.
normals
Normals at each point.
texcoords
Texture coordinates at each point.
...
Material properties. See rgl.material for details.
Details
Adds a shape node to the scene. The appearance is defined by the material properties. See
rgl.material for details.
The names of these functions correspond to OpenGL primitives. They all take a sequence of vertices
in x,y,z. The only non- obvious ones are rgl.lines which draws line segments based on pairs of
vertices, and rgl.linestrips which joins the vertices.
For triangles and quads, the normals at each vertex may be specified using normals. These may
be given in any way that would be acceptable as a single argument to xyz.coords. These need not
match the actual normals to the polygon: curved surfaces can be simulated by using other choices
of normals.
Texture coordinates may also be specified. These may be given in any way that would be acceptable
as a single argument to xy.coords, and are interpreted in terms of the bitmap specified as the
material texture, with (0,0) at the lower left, (1,1) at the upper right. The texture is used to
modulate the color of the polygon.
These are the lower level functions called by points3d, segments3d, lines3d, etc. The two principal differences between the rgl.* functions and the *3d functions are that the former set all unspecified material properties to defaults, whereas the latter use current values as defaults; the former
make persistent changes to material properties with each call, whereas the latter make temporary
changes only for the duration of the call.
62
rgl.select
Value
Each primitive function returns the integer object ID of the shape that was added to the scene. These
can be passed to rgl.pop to remove the object from the scene.
See Also
rgl.material, rgl.spheres, rgl.texts, rgl.surface, rgl.sprites
Examples
rgl.open()
rgl.points(rnorm(1000), rnorm(1000), rnorm(1000), color=heat.colors(1000))
rgl.select
Switch to select mode, and return the mouse position selected.
Description
Mostly for internal use, this function temporarily installs a handler on a button of the mouse that
will return the mouse coordinates of one click and drag rectangle.
Usage
rgl.select(button = c("left", "middle", "right"))
Arguments
button
Which button to use?
Value
A vector of four coordinates: the X and Y coordinates of the start and end of the dragged rectangle.
Author(s)
Duncan Murdoch
See Also
rgl.select3d, a version that allows the selection region to be used to select points in the scene.
rgl.setMouseCallbacks
63
rgl.setMouseCallbacks
User callbacks on mouse events
Description
This function sets user callbacks on mouse events.
Usage
rgl.setMouseCallbacks(button, begin = NULL, update = NULL, end = NULL)
rgl.setWheelCallback(rotate)
Arguments
button
Which button?
begin
Called when mouse down event occurs
update
Called when mouse moves
end
Called when mouse is released
rotate
Called when mouse wheel is rotated
Details
This function sets an event handler on mouse events that occur within the current rgl window.
The begin and update events should be functions taking two arguments; these will be the mouse
coordinates when the event occurs. The end event handler takes no arguments. The rotate event
takes a single argument, which will be equal to 1 if the user pushes the wheel away by one click,
and 2 if the user pulls the wheel by one click.
Alternatively, the handlers may be set to NULL, the default value, in which case no action will occur.
Value
This function is called for the side effect of setting the mouse event handlers.
Author(s)
Duncan Murdoch
See Also
par3d to set built-in handlers
64
rgl.snapshot
Examples
## Not quite right --- this doesn't play well with rescaling
pan3d <- function(button) {
start <- list()
begin <- function(x, y) {
start$userMatrix <<- par3d("userMatrix")
start$viewport <<- par3d("viewport")
start$scale <<- par3d("scale")
start$projection <<- rgl.projection()
start$pos <<- rgl.window2user( x/start$viewport[3], 1 - y/start$viewport[4], 0.5,
projection=start$projection)
}
update <- function(x, y) {
xlat <- (rgl.window2user( x/start$viewport[3], 1 - y/start$viewport[4], 0.5,
projection = start$projection) - start$pos)*start$scale
mouseMatrix <- translationMatrix(xlat[1], xlat[2], xlat[3])
par3d(userMatrix = start$userMatrix %*% t(mouseMatrix) )
}
rgl.setMouseCallbacks(button, begin, update)
cat("Callbacks set on button", button, "of rgl device",rgl.cur(),"\n")
}
pan3d(3)
rgl.snapshot
export screenshot
Description
Saves the screenshot as png file.
Usage
rgl.snapshot( filename, fmt="png", top=TRUE )
snapshot3d( ... )
Arguments
filename
full path to filename.
fmt
image export format, currently supported: png
top
whether to call rgl.bringtotop
...
arguments to pass to rgl.snapshot
rgl.surface
65
Details
Animations can be created in a loop modifying the scene and saving each screenshot to a file.
Various graphics programs (e.g. ImageMagick) can put these together into a single animation. (See
movie3d or the example below.)
Note
On some systems, the snapshot will include content from other windows if they cover the active rgl
window. Setting top=TRUE (the default) will use rgl.bringtotop before the snapshot to avoid this.
(See http://www.opengl.org/resources/faq/technical/rasterization.htm#rast0070 for
more details.)
See Also
movie3d, rgl.viewpoint
Examples
## Not run:
#
# create animation
#
shade3d(oh3d(), color="red")
rgl.bringtotop()
rgl.viewpoint(0,20)
setwd(tempdir())
for (i in 1:45) {
rgl.viewpoint(i,20)
filename <- paste("pic",formatC(i,digits=1,flag="0"),".png",sep="")
rgl.snapshot(filename)
}
## Now run ImageMagick command:
##
convert -delay 10 *.png -loop 0 pic.gif
## End(Not run)
rgl.surface
add height-field surface shape
Description
Adds a surface to the current scene. The surface is defined by a matrix defining the height of each
grid point and two vectors defining the grid.
66
rgl.surface
Usage
rgl.surface(x, z, y, coords=1:3, ...,
normal_x=NULL, normal_y=NULL, normal_z=NULL,
texture_s=NULL, texture_t=NULL)
Arguments
x
values corresponding to rows of y, or matrix of x coordinates
y
matrix of height values
z
values corresponding to columns of y, or matrix of z coordinates
coords
See details
...
Material and texture properties. See rgl.material for details.
normal_x, normal_y, normal_z
matrices of the same dimension as y giving the coordinates of normals at each
grid point
texture_s, texture_t
matrices of the same dimension as z giving the coordinates within the current
texture of each grid point
Details
Adds a surface mesh to the current scene. The surface is defined by the matrix of height values in
y, with rows corresponding to the values in x and columns corresponding to the values in z.
The coords parameter can be used to change the geometric interpretation of x, y, and z. The
first entry of coords indicates which coordinate (1=X, 2=Y, 3=Z) corresponds to the x parameter.
Similarly the second entry corresponds to the y parameter, and the third entry to the z parameter. In
this way surfaces may be defined over any coordinate plane.
If the normals are not supplied, they will be calculated automatically based on neighbouring points.
Texture coordinates run from 0 to 1 over each dimension of the texture bitmap. If texture coordinates
are not supplied, they will be calculated to render the texture exactly once over the grid. Values
greater than 1 can be used to repeat the texture over the surface.
rgl.surface always draws the surface with the ‘front’ upwards (i.e. towards higher y values). This
can be used to render the top and bottom differently; see rgl.material and the example below.
If the x or z argument is a matrix, then it must be of the same dimension as y, and the values in the
matrix will be used for the corresponding coordinates. This is used to plot shapes such as cylinders
where y is not a function of x and z.
NA values in the height matrix are not drawn.
Value
The object ID of the displayed surface is returned invisibly.
See Also
rgl.material, surface3d, terrain3d. See persp3d for a higher level interface.
rgl.Sweave
67
Examples
#
# volcano example taken from "persp"
#
data(volcano)
y <- 2 * volcano
# Exaggerate the relief
x <- 10 * (1:nrow(y))
z <- 10 * (1:ncol(y))
# 10 meter spacing (S to N)
# 10 meter spacing (E to W)
ylim <- range(y)
ylen <- ylim[2] - ylim[1] + 1
colorlut <- terrain.colors(ylen) # height color lookup table
col <- colorlut[ y-ylim[1]+1 ] # assign colors to heights for each point
rgl.open()
rgl.surface(x, z, y, color=col, back="lines")
rgl.Sweave
Integrating rgl with Sweave
Description
As of R 2.13.0, it is possible to include rgl graphics into a Sweave document. These functions
support that integration.
Usage
Sweave.snapshot()
rgl.Sweave(name, width, height, options, ...)
rgl.Sweave.off()
Arguments
name, width, height, options, ...
These arguments are passed by Sweave to rgl.Sweave when it opens the device.
Details
The rgl.Sweave function is not normally called by the user. The user specifies it as the graphics
driver when opening the code chunk, e.g. by using
<<fig=TRUE, pdf=FALSE, grdevice=rgl.Sweave, resolution=100>>=
68
rgl.Sweave
When the rgl device is closed at the end of the code chunk, rgl.Sweave.off() will be called
automatically. It will save a snapshot of the last image (by default in ‘.png’ format) for inclusion
in the Sweave document and (by default) close the device. Alternatively, the Sweave.snapshot()
function can be called to save the image before the end of the chunk. Only one snapshot will be
taken per chunk.
Several chunk options are used by the rgl.Sweave device:
stayopen (default FALSE). If TRUE then the rgl device will not be closed at the end of the chunk, instead a call to Sweave.snapshot() will be used if it has not been called explicitly. Subsequent
chunks can add to the scene.
outputtype (default png). The output may be specified as outputtype=pdf or outputtype=eps
instead, in which case the rgl.postscript function will be used to write output in the specified format. Note that rgl.postscript has limitations and does not always render scenes
correctly.
delay (default 0.1). After creating the display window, Sys.sleep will be called to delay this many
seconds, to allow the display system to initialize. This is needed in X11 systems which open
the display asynchronously. If the default time is too short, rgl.Sweave may falsely report
that the window is too large to open.
Value
These functions are called for their side effects.
Note
We recommend turning off all other graphics drivers in a chunk that uses grdevice=rgl.Sweave.
The rgl functions do not write to a standard graphics device.
Note
The rgl package relies on your graphics hardware to render OpenGL scenes, and the default ‘.png’
output copies a bitmap from the hardware device. All such devices have limitations on the size of
the bitmap, but they do not always signal these limitations in a way that rgl will detect. If you find
that images are not being produced properly, try reducing the size using the resolution, width or
height chunk options.
Author(s)
Duncan Murdoch
See Also
RweaveLatex for a description of alternate graphics drivers in Sweave, and standard options that
can be used in code chunks.
rgl.useNULL
69
rgl.useNULL
Report default use of null device.
Description
This function checks the "rgl.useNULL" option if present, or the RGL_USE_NULL environment variable if it is not. If the value is TRUE or a string which matches “yes” or “true” in a case-insensitive
test, TRUE is returned.
Usage
rgl.useNULL()
Value
A logical value indicating the current default for use of the null device.
Author(s)
Duncan Murdoch
See Also
open3d and rgl.open.
Examples
rgl.useNULL()
rgl.user2window
Convert between rgl user and window coordinates
Description
This function converts from 3-dimensional user coordinates to 3-dimensional window coordinates.
Usage
rgl.user2window(x, y = NULL, z = NULL, projection = rgl.projection())
rgl.window2user(x, y = NULL, z = 0, projection = rgl.projection())
rgl.projection()
Arguments
x, y, z
Input coordinates. Any reasonable way of defining the coordinates is acceptable.
See the function xyz.coords for details.
projection
The rgl projection to use
70
rgl.user2window
Details
These functions convert between user coordinates and window coordinates.
Window coordinates run from 0 to 1 in X, Y, and Z. X runs from 0 on the left to 1 on the right;
Y runs from 0 at the bottom to 1 at the top; Z runs from 0 foremost to 1 in the background. rgl
does not currently display vertices plotted outside of this range, but in normal circumstances will
automatically resize the display to show them. In the example below this has been suppressed.
Value
The coordinate conversion functions produce a matrix with columns corresponding to the X, Y, and
Z coordinates.
rgl.projection() returns a list containing the following components:
model
the modelview matrix
projection
the projection matrix
viewport
the viewport vector
See par3d for more details.
Author(s)
Ming Chen / Duncan Murdoch
See Also
select3d
Examples
open3d()
points3d(rnorm(100), rnorm(100), rnorm(100))
if (interactive() || !.Platform$OS=="unix") {
# Calculate a square in the middle of the display and plot it
square <- rgl.window2user(c(0.25, 0.25, 0.75, 0.75, 0.25),
c(0.25, 0.75, 0.75, 0.25, 0.25), 0.5)
par3d(ignoreExtent = TRUE)
lines3d(square)
par3d(ignoreExtent = FALSE)
}
scene
71
scene
scene management
Description
Clear shapes, lights, bbox
Usage
clear3d( type =
rgl.clear( type
pop3d( ... )
rgl.pop( type =
rgl.ids( type =
c("shapes", "bboxdeco", "material"), defaults, subscene = 0 )
= "shapes", subscene = 0 )
"shapes", id = 0 )
"shapes", subscene = NA )
Arguments
type
Select subtype(s):
"shapes" shape stack
"lights" light stack
"bboxdeco" bounding box
"userviewpoint" user viewpoint
"modelviewpoint" model viewpoint
"material" material properties
"background" scene background
"subscene" subscene list
"all" all of the above
defaults
default values to use after clearing
subscene
which subscene to work with. NA means the current one, 0 means the whole
scene
id
vector of ID numbers of items to remove
...
generic arguments passed through to RGL-specific (or other) functions
Details
RGL holds several lists of objects in each scene. There are lists for shapes, lights, bounding box
decorations, subscenes, etc. clear3d and rgl.clear clear the specified stack, or restore the defaults for the bounding box (not visible) or viewpoint. With id=0 rgl.pop removes the last added
node on the list (except for subscenes: there it removes the active subscene). The id argument may
be used to specify arbitrary item(s) to remove; if id != 0, the type argument is ignored.
rgl.clear and clear3d may also be used to clear material properties back to their defaults.
clear3d has an optional defaults argument, which defaults to r3dDefaults. Only the materials
component of this argument is currently used by clear3d.
72
scene3d
rgl.ids returns a dataframe containing the IDs in the currently active subscene by default, or a
specified subscene, or if subscene = 0, in the whole rgl window, along with an indicator of their
type.
Note that clearing the light stack leaves the scene in darkness; it should normally be followed by a
call to rgl.light or light3d.
See Also
rgl, rgl.bbox, rgl.light, open3d to open a new window.
Examples
x <- rnorm(100)
y <- rnorm(100)
z <- rnorm(100)
p <- plot3d(x, y, z, type='s')
rgl.ids()
lines3d(x, y, z)
rgl.ids()
if (interactive()) {
readline("Hit enter to change spheres")
rgl.pop(id = p["data"])
spheres3d(x, y, z, col="red", radius=1/5)
box3d()
}
scene3d
Saves the current scene to a variable, and displays such variables.
Description
This function saves a large part of the RGL state associated with the current window to a variable.
Usage
scene3d()
## S3 method for class 'rglscene'
plot3d(x, add=FALSE, ...)
## S3 method for class 'rglobject'
plot3d(x, ...)
## S3 method for class 'rglscene'
print(x, ...)
## S3 method for class 'rglobject'
print(x, ...)
scene3d
73
Arguments
x
An object of class "rglscene"
add
Whether to open a new window, or add to the existing one.
...
Additional parameters, currently ignored.
Details
The components saved are: the par3d settings, the material3d settings, the bg3d settings, the
lights and the objects in the scene.
In most cases, calling plot3d on that variable will duplicate the scene. (There are likely to be small
differences, mostly internal, but some aspects of the scene are not currently available.) If textures
are used, the name of the texture will be saved, rather than the contents of the texture file.
Other than saving the code to recreate a scene, saving the result of scene3d to a file will allow
it to be reproduced later most accurately. In roughly decreasing order of fidelity, writeWebGL,
writePLY, writeOBJ and writeSTL write the scene to a file in formats readable by other software.
Value
The scene3d function returns an object of class "rglscene". This is a list with some or all of the
components
par3d
The results returned from a par3d call.
material
The results returned from a material3d call.
bg
A list containing some of the properties of the scene background.
bbox
A list containing some of the properties of the scene bounding box decoration.
objects
A list containing the RGL lights and objects in the scene.
The objects in the objects component are of class "rglobject". They are lists containing some
or all of the components
id
The RGL identifier of the object in the original scene.
type
A character variable identifying the type of object.
material
Components of the material that differ from the scene material.
vertices, normals, etc.
Any of the attributes of the object retrievable by rgl.attrib.
ignoreExtent
A logical value indicating whether this object contributes to the bounding box.
Currently this may differ from the object in the original scene.
objects
Sprites may contain other objects; they will be stored here as a list of "rglobject"s.
Lights in the scene are stored similarly, mixed into the objects list.
The plot3d methods invisibly return a vector of RGL object ids that were plotted. The print
methods invisibly return the object that was printed.
Author(s)
Duncan Murdoch
74
select3d
See Also
writeWebGL, writePLY, writeOBJ and writeSTL write the scene to a file in various formats.
Examples
open3d()
z <- 2 * volcano
# Exaggerate the relief
x <- 10 * (1:nrow(z))
# 10 meter spacing (S to N)
y <- 10 * (1:ncol(z))
# 10 meter spacing (E to W)
persp3d(x, y, z, col = "green3", aspect="iso")
s <- scene3d()
# Make it bigger
s$par3d$windowRect <- 1.5*s$par3d$windowRect
# and draw it again
plot3d(s)
select3d
Select a rectangle in an RGL scene
Description
This function allows the user to use the mouse to select a region in an RGL scene.
Usage
rgl.select3d(button = c("left", "middle", "right"))
select3d(...)
Arguments
button
Which button to use for selection.
...
Button argument to pass to rgl.select3d
Details
This function selects 3-dimensional regions by allowing the user to use a mouse to draw a rectangle
showing the projection of the region onto the screen. It returns a function which tests points for
inclusion in the selected region.
If the scene is later moved or rotated, the selected region will remain the same, no longer corresponding to a rectangle on the screen.
Value
Returns a function f(x,y,z) which tests whether each of the points (x,y,z) is in the selected
region, returning a logical vector. This function accepts input in a wide variety of formats as it uses
xyz.coords to interpret its parameters.
selectpoints3d
75
Author(s)
Ming Chen / Duncan Murdoch
See Also
selectpoints3d, locator
Examples
# Allow the user to select some points, and then redraw them
# in a different color
if (interactive()) {
x <- rnorm(1000)
y <- rnorm(1000)
z <- rnorm(1000)
open3d()
points3d(x,y,z)
f <- select3d()
keep <- f(x,y,z)
rgl.pop()
points3d(x[keep],y[keep],z[keep],color='red')
points3d(x[!keep],y[!keep],z[!keep])
}
selectpoints3d
Select points from a scene
Description
This function uses the select3d function to allow the user to choose a point or region in the scene,
then reports on all the vertices in or near that selection.
Usage
selectpoints3d(objects = rgl.ids()$id, value = TRUE, closest = TRUE,
multiple = FALSE, ...)
Arguments
objects
A vector of object id values to use for the search.
value
If TRUE, return the coordinates of the points; otherwise, return their indices.
closest
If TRUE, return the points closest to the selection of no points are exactly within
it.
multiple
If TRUE or a function, do multiple selections. See the Details below.
...
Other parameters to pass to select3d.
76
selectpoints3d
Details
The multiple argument may be a logical value or a function. If logical, it controls whether multiple
selections will be performed. If multiple is FALSE, a single selection will be performed; it might
contain multiple points. If TRUE, multiple selections will occur and the results will be combined
into a single matrix.
If multiple is a function, it should take a single argument. This function will be called with the
argument set to a matrix containing newly added rows to the value, i.e. it will contain coordinates
of the newly selected points (if value = TRUE), or the indices of the points (if value = FALSE). It
should return a logical value, TRUE to indicate that selection should continue, FALSE to indicate that
it should stop.
In either case, if multiple selections are being performed, the ESC key will stop the process.
Value
If value is TRUE, a 3-column matrix giving the coordinates of the selected points. All rows in the
matrix will be unique even if multiple vertices have the same coordinates.
If value is FALSE, a 2-column matrix containing columns:
id
The object id containing the point.
index
The index of the point within rgl.attrib(id, "vertices"). If multiple
points have the same coordinates, all indices will be returned.
Author(s)
Duncan Murdoch
See Also
select3d to return a selection function.
Examples
xyz <- cbind(rnorm(20), rnorm(20), rnorm(20))
ids <- plot3d( xyz )
# Click near a point to select it and put a sphere there.
# Press ESC to quit...
# This version returns coordinates
selectpoints3d(ids["data"],
multiple = function(x) {
spheres3d(x, color = "red", alpha = 0.3, radius = 0.2)
TRUE
})
# This one returns indices
selectpoints3d(ids["data"], value = FALSE,
multiple = function(ids) {
shapelist3d
})
77
spheres3d(xyz[ids[, "index"],,drop=FALSE], color = "blue",
alpha = 0.3, radius = 0.2)
TRUE
shapelist3d
Create and plot a list of shapes
Description
These functions create and plot a list of shapes.
Usage
shapelist3d(shapes, x = 0, y = NULL, z = NULL, size = 1, matrix = NULL, override = TRUE,
..., plot = TRUE)
Arguments
shapes
A single shape3d object, or a list of them.
x, y, z
Translation(s) to apply
size
Scaling(s) to apply
matrix
A single matrix transformation, or a list of them.
override
Whether the material properties should override the ones in the shapes.
...
Material properties to apply.
plot
Whether to plot the result.
Details
shapelist3d is a quick way to create a complex object made up of simpler ones. Each of the
arguments shapes through override may be a vector of values (a list in the case of shapes or
matrix). All values will be recycled to produce a list of shapes as long as the longest of them.
The xyz.coords function will be used to process the x, y and z arguments, so a matrix may be used
as x to specify all three. If a vector is used for x but y or z is missing, default values of 0 will be
used.
The "shapelist3d" class is simply a list of "shape3d" objects.
Methods for dot3d, wire3d, shade3d, translate3d, scale3d, and rotate3d are defined for these
objects.
Value
An object of class c("shapelist3d", "shape3d").
78
spheres3d
Author(s)
Duncan Murdoch
See Also
mesh3d
Examples
shapelist3d(icosahedron3d(), x=rnorm(10), y=rnorm(10), z=rnorm(10), col=1:5, size=0.3)
spheres3d
add sphere set shape
Description
Adds a sphere set shape node to the scene
Usage
spheres3d(x, y = NULL, z = NULL, radius = 1, ...)
rgl.spheres(x, y = NULL, z = NULL, radius, ...)
Arguments
x, y, z
Numeric vector of point coordinates corresponding to the center of each sphere.
Any reasonable way of defining the coordinates is acceptable. See the function
xyz.coords for details.
radius
Vector or single value defining the sphere radius/radii
...
Material properties. See rgl.material for details.
Details
If a non-isometric aspect ratio is chosen, these functions will still draw objects that appear to the
viewer to be spheres. Use ellipse3d to draw shapes that are spherical in the data scale.
When the scale is not isometric, the radius is measured in an average scale. In this case the bounding box calculation is iterative, since rescaling the plot changes the shape of the spheres in usercoordinate, which changes the bounding box. Versions of rgl prior to 0.92.802 did not do this
iterative adjustment.
If any coordinate or radius is NA, the sphere is not plotted.
Value
A shape ID of the spheres object is returned.
spin3d
79
See Also
rgl.material, aspect3d for setting non-isometric scales
Examples
open3d()
spheres3d(rnorm(10), rnorm(10), rnorm(10), radius=runif(10), color=rainbow(10))
spin3d
Create a function to spin a scene at a fixed rate
Description
This creates a function to use with play3d to spin an rgl scene at a fixed rate.
Usage
spin3d(axis = c(0, 0, 1), rpm = 5,
dev = rgl.cur(), subscene = currentSubscene3d(dev))
Arguments
axis
The desired axis of rotation
rpm
The rotation speed in rotations per minute
dev
Which rgl device to use
subscene
Which subscene to use
Value
A function with header function(time, base=M), where M is the result of par3d("userMatrix")
at the time the function is created. This function calculates and returns a list containing userMatrix
updated by spinning the base matrix for time seconds at rpm revolutions per minute about the
specified axis.
Author(s)
Duncan Murdoch
See Also
play3d to play the animation
80
sprites
Examples
# Spin one object
open3d()
plot3d(oh3d(col="lightblue", alpha=0.5))
if (!rgl.useNULL())
play3d(spin3d(axis=c(1,0,0), rpm=30), duration=2)
# Show spinning sprites, and rotate the whole view
open3d()
spriteid <- NULL
spin1 <- spin3d(rpm=4.5 ) # the scene spinner
spin2 <- spin3d(rpm=9 ) # the sprite spinner
f <- function(time) {
par3d(skipRedraw = TRUE) # stops intermediate redraws
on.exit(par3d(skipRedraw=FALSE)) # redraw at the end
rgl.pop(id=spriteid) # delete the old sprite
cubeid <- shade3d(cube3d(), col="red")
spriteid <<- sprites3d(0:1, 0:1, 0:1, shape=cubeid,
userMatrix=spin2(time,
base=spin1(time)$userMatrix)$userMatrix)
spin1(time)
}
if (!rgl.useNULL())
play3d(f, duration=2)
sprites
add sprite set shape
Description
Adds a sprite set shape node to the scene.
Usage
sprites3d(x, y = NULL, z = NULL, radius = 1, shapes = NULL, userMatrix, ...)
particles3d(x, y = NULL, z = NULL, radius = 1, ...)
rgl.sprites(x, y = NULL, z = NULL, radius = 1, shapes = NULL, userMatrix, ...)
Arguments
x, y, z
radius
shapes
userMatrix
...
point coordinates. Any reasonable way of defining the coordinates is acceptable.
See the function xyz.coords for details.
vector or single value defining the sphere radius
NULL for a simple square, or a vector of identifiers of shapes in the scene
if shape is not NULL, the transformation matrix for the shapes
material properties when shape == 0, texture mapping is supported
subdivision3d
81
Details
Simple sprites (used when shapes is NULL) are 1 by 1 squares that are directed towards the viewpoint. Their primary use is for fast (and faked) atmospherical effects, e.g. particles and clouds
using alpha blended textures. Particles are Sprites using an alpha- blended particle texture giving
the illusion of clouds and gasses. The centre of each square will be at the coordinates given by
x, y, z.
When shapes is not NULL, it should be a vector of identifers of objects to plot in the scene (e.g.
as returned by plotting functions or by rgl.ids). These objects will be removed from the scene
and duplicated as a sprite image in a constant orientation, as specified by userMatrix. The origin
0,0,0 will be plotted at the coordinates given by x, y, z.
The userMatrix argument is ignored for shapes=NULL. For shapes, sprites3d defaults the matrix
to r3dDefaults$userMatrix while rgl.sprites defaults it to an identity transformation.
If any coordinate is NA, the sprite is not plotted.
The id values of the shapes are retrieved using rgl.attrib(id, "ids"); the user matrix is retrieved using rgl.attrib(id, "usermatrix").
Value
These functions are called for the side effect of displaying the sprites. The shape ID of the displayed
object is returned.
See Also
rgl.material
Examples
open3d()
particles3d( rnorm(100), rnorm(100), rnorm(100), color=rainbow(100) )
# is the same as
sprites3d( rnorm(100), rnorm(100), rnorm(100), color=rainbow(100),
lit=FALSE, alpha=.2,
textype="alpha", texture=system.file("textures/particle.png", package="rgl") )
sprites3d( rnorm(10)+6, rnorm(10), rnorm(10), shape=shade3d(tetrahedron3d(), col="red") )
subdivision3d
generic subdivision surface method
Description
The Subdivision surface algorithm divide and refine (deform) a given mesh recursively to certain
degree (depth). The mesh3d algorithm consists of two stages: divide and deform. The divide step
generates for each triangle or quad four new triangles or quads, the deform step drags the points
(refinement step).
82
subscene3d
Usage
subdivision3d( x, ...)
## S3 method for class 'mesh3d'
subdivision3d( x, depth=1, normalize=FALSE, deform=TRUE, ... )
divide.mesh3d(mesh, vb=mesh$vb, ib=mesh$ib, it=mesh$it )
normalize.mesh3d(mesh)
deform.mesh3d(mesh,vb=mesh$vb,ib=mesh$ib,it=mesh$it )
Arguments
x
3d geometry mesh
mesh
3d geometry mesh
depth
recursion depth
normalize
normalize mesh3d coordinates after division if deform is TRUE
deform
deform mesh
it
indices for triangular faces
ib
indices for quad faces
vb
matrix of vertices: 4xn matrix (rows x,y,z,h) or equivalent vector, where h indicates scaling of each plotted quad
...
other arguments (unused)
Details
Generic subdivision surface method. Currently there exists an algorithm that can be applied on
mesh3d objects.
See Also
r3d mesh3d
Examples
open3d()
shade3d( subdivision3d( cube3d(), depth=3 ), color="red", alpha=0.5 )
subscene3d
Create, select or modify a subscene.
Description
This creates a new subscene, or selects one by id value, or adds objects to one.
subscene3d
83
Usage
newSubscene3d(viewport = "replace", projection = "replace", model = "replace",
parent = currentSubscene3d(),
copyLights = TRUE, copyShapes = FALSE, copyBBoxDeco = copyShapes,
copyBackground = FALSE, newviewport,
ignoreExtent)
currentSubscene3d(dev = rgl.cur())
useSubscene3d(subscene)
addToSubscene3d(ids, subscene = currentSubscene3d())
delFromSubscene3d(ids, subscene = currentSubscene3d())
gc3d(protect = NULL)
Arguments
viewport, projection, model
How should the new subscene be embedded? Possible values are c("inherit", "modify", "replace")
See Details below.
parent
The parent subscene (defaults to the current subscene).
copyLights, copyShapes, copyBBoxDeco, copyBackground
Whether lights, shapes, bounding box decorations and background should be
copied to the new subscene.
newviewport
Optionally specify the new subscene’s viewport (in pixels).
ignoreExtent
Whether to ignore the subscene’s bounding box when calculating the parent
bounding box. Defaults to TRUE if model is not "inherit".
dev
Which rgl device to query for the current subscene.
subscene
Which subscene to use or modify.
ids
A vector of integer object ids to add to the subscene.
protect
Object ids to protect from this garbage collection.
Details
The rgl package allows multiple windows to be open; each one corresponds to a “scene”. Within
each scene there are one or more “subscenes”. Each subscene corresponds to a rectangular region
in the window, and may have its own projection and transformation.
There is always a current subscene: most graphic operations make changes there, e.g. by adding an
object to it.
The scene “owns” objects; addToSubscene3d and delFromSubscene3d put their ids into or remove
them from the list being displayed within a particular subscene. The gc3d function deletes objects
from the scene if they are not visible in any subscene, unless they are protected by having their id
included in protect.
The viewport, projection and model parameters each have three possible settings: c("inherit", "modify", "replace")
"inherit" means that the corresponding value from the parent subscene will be used. "replace"
means that the new subscene will have its own value of the value, independent of its parent.
"modify" means that the child value will be applied first, and then the parent value will be applied. For viewport, this means that if the parent viewport is changed, the child will maintain its
84
subscene3d
relative position. For the two matrices, "modify" is unlikely to give satisfactory results, but it is
available for possible use.
The viewport parameter controls the rectangular region in which the subscene is displayed. It is
specified using newviewport (in pixels relative to the whole window), or set to match the parent
viewport.
The projection parameter controls settings corresponding to the observer. These include the field
of view and the zoom; they also include the position of the observer relative to the model. The
par3d("projMatrix") matrix is determined by the projection.
The model parameter controls settings corresponding to the model. Mouse rotations affect the
model, as does scaling. The par3d("modelMatrix") matrix is determined by these as well as
by the position of the observer (since OpenGL assumes that the observer is at (0,0,0) after the
MODELVIEW transformation). Only those parts concerning the model are inherited when model
specifies inheritance, the observer setting is controlled by projection.
If copyBackground is TRUE, the background of the newly created child will overwrite anything
displayed in the parent subscene, regardless of depth.
Value
If successful, each function returns the object id of the subscene, with the exception of gc3d, which
returns the count of objects which have been deleted.
Author(s)
Duncan Murdoch and Fang He.
See Also
subsceneInfo for information about a subscene, mfrow3d and layout3d to set up multiple panes
of subscenes.
Examples
# Show the Earth with a cutout by using clipplanes in subscenes
lat <- matrix(seq(90,-90, len=50)*pi/180, 50, 50, byrow=TRUE)
long <- matrix(seq(-180, 180, len=50)*pi/180, 50, 50)
r
x
y
z
<<<<-
6378.1 # radius of Earth in km
r*cos(lat)*cos(long)
r*cos(lat)*sin(long)
r*sin(lat)
open3d()
obj <- surface3d(x, y, z, col="white",
texture=system.file("textures/worldsmall.png",package="rgl"),
specular="black", axes=FALSE, box=FALSE, xlab="", ylab="", zlab="",
normal_x=x, normal_y=y, normal_z=z)
cols <- c(rep("chocolate4",4), rep("burlywood1", 4), "darkgoldenrod1")
subsceneInfo
85
rs <- c(6350, 5639, 4928.5, 4207, 3486,
(3486+2351)/2, 2351, (2351+1216)/2, 1216)
for (i in seq_along(rs))
obj <- c(obj, spheres3d(0,0,col = cols[i], radius = rs[i]))
root <- currentSubscene3d()
newSubscene3d("inherit", "inherit", "inherit", copyShapes=TRUE, parent=root)
clipplanes3d(1,0,0,0)
newSubscene3d("inherit", "inherit", "inherit", copyShapes=TRUE, parent=root)
clipplanes3d(0,1,0,0)
newSubscene3d("inherit", "inherit", "inherit", copyShapes=TRUE, parent=root)
clipplanes3d(0,0,1,0)
# Now delete the objects from the root subscene, to reveal the clipping planes
useSubscene3d(root)
delFromSubscene3d(obj)
subsceneInfo
Get information on subscenes
Description
This function retrieves information about the tree of subscenes shown in the active window.
Usage
subsceneInfo(id = NA, embeddings, recursive = FALSE)
Arguments
id
Which subscene to report on; NA is the current subscene. Set to "root" for the
root.
embeddings
Optional new setting for the embeddings for this subscene.
recursive
Whether to report on children recursively.
Details
In rgl, each window contains a tree of “subscenes”, each containing views of a subset of the objects
defined in the window.
Rendering in each subscene depends on the viewport, the projection, and the model transformation.
Each of these characteristics may be inherited from the parent (embedding[i] = "inherit"), may
modify the parent (embedding[i] = "modify"), or may replace the parent (embedding[i] == "replace").
All three must be specified if embeddings is used.
86
surface3d
Value
id
The object id of the subscene
parent
The object id of the parent subscene, if any
children
If recursive, a list of the information for the children, otherwise just their
object ids.
embedding
A vector of 3 components describing how this subscene is embedded in its parent.
Author(s)
Duncan Murdoch
See Also
newSubscene3d
Examples
example(plot3d)
subsceneInfo()
surface3d
add height-field surface shape
Description
Adds a surface to the current scene. The surface is defined by a matrix defining the height of each
grid point and two vectors defining the grid.
Usage
surface3d(x, y, z, ..., normal_x=NULL, normal_y=NULL, normal_z=NULL)
terrain3d(x, y, z, ..., normal_x=NULL, normal_y=NULL, normal_z=NULL)
Arguments
x
values corresponding to rows of z, or matrix of x coordinates
y
values corresponding to the columns of z, or matrix of y coordinates
z
matrix of heights
...
Material and texture properties. See rgl.material for details.
normal_x, normal_y, normal_z
matrices of the same dimension as z giving the coordinates of normals at each
grid point
text3d
87
Details
Adds a surface mesh to the current scene. The surface is defined by the matrix of height values in
z, with rows corresponding to the values in x and columns corresponding to the values in y. This is
the same parametrization as used in persp.
If the x or y argument is a matrix, then it must be of the same dimension as z, and the values in the
matrix will be used for the corresponding coordinates. This is used to plot shapes such as cylinders
where z is not a function of x and y.
If the normals are not supplied, they will be calculated automatically based on neighbouring points.
surface3d always draws the surface with the ‘front’ upwards (i.e. towards higher z values). This
can be used to render the top and bottom differently; see rgl.material and the example below.
For more flexibility in defining the surface, use rgl.surface.
surface3d and terrain3d are synonyms.
See Also
rgl.material, rgl.surface. See persp3d for a higher level interface.
Examples
#
# volcano example taken from "persp"
#
data(volcano)
z <- 2 * volcano
# Exaggerate the relief
x <- 10 * (1:nrow(z))
y <- 10 * (1:ncol(z))
# 10 meter spacing (S to N)
# 10 meter spacing (E to W)
zlim <- range(y)
zlen <- zlim[2] - zlim[1] + 1
colorlut <- terrain.colors(zlen) # height color lookup table
col <- colorlut[ z-zlim[1]+1 ] # assign colors to heights for each point
open3d()
surface3d(x, y, z, color=col, back="lines")
text3d
add text
88
text3d
Description
Adds text to the scene. The text is positioned in 3D space. Text is always oriented towards the
camera.
Usage
rgl.texts(x, y = NULL, z = NULL, text,
adj = 0.5, justify, family = par3d("family"), font = par3d("font"),
cex = par3d("cex"), useFreeType=par3d("useFreeType"), ...)
text3d(x, y = NULL, z = NULL, texts, adj = 0.5, justify, ...)
texts3d(x, y = NULL, z = NULL, texts, adj = 0.5, justify, ...)
rglFonts(...)
Arguments
x, y, z
point coordinates. Any reasonable way of defining the coordinates is acceptable.
See the function xyz.coords for details.
text
text character vector to draw
texts
text character vector to draw
adj
one value specifying the horizontal adjustment, or two, specifying horizontal
and vertical adjustment respectively. .
justify
(deprecated, please use adj instead) character string specifying the horizontal
adjustment; options are "left", "right", "center".
family
A device-independent font family name, or ""
font
A numeric font number from 1 to 5
cex
A numeric character expansion value
useFreeType
logical. Should FreeType be used to draw text? (See details below.)
...
In rgl.texts, material properties; see rgl.material for details. In rglFonts,
device dependent font definitions for use with FreeType. In the other functions,
additional parameters to pass to rgl.texts.
Details
The adj parameter determines the position of the text relative to the specified coordinate. Use
adj = c(0,0) to place the left bottom corner at (x,y,z), adj = c(0.5, 0.5) to center the text
there, and adj = c(1,1) to put the right top corner there. The optional second coordinate for
vertical adjustment defaults to 0.5. Placement is done using the "advance" of the string and the
"ascent" of the font relative to the baseline, when these metrics are known.
text3d and texts3d draw text using the r3d conventions. These are synonyms; the former is singular to be consistent with the classic 2-D graphics functions, and the latter is plural to be consistent
with all the other graphics primitives. Take your choice!
If any coordinate or text is NA, that text is not plotted.
text3d
89
Value
The text drawing functions return the object ID of the text object i invisibly.
rglFonts returns the current set of font definitions.
Fonts
Fonts are specified using the family, font, cex, and useFreeType arguments. Defaults for the
currently active device may be set using par3d, or for future devices using r3dDefaults.
The family specification is the same as for standard graphics, i.e. families
c("serif", "sans", "mono", "symbol")
are normally available, but users may add additional families. font numbers are restricted to the
range 1 to 4 for standard, bold, italic and bold italic respectively; with font 5 recoded as family
"symbol" font 1.
Using an unrecognized value for "family" will result in the system standard font as used in rgl up
to version 0.76. That font is not resizable and font values are ignored.
If useFreeType is TRUE, then rgl will use the FreeType anti-aliased fonts for drawing. This is
generally desirable, and it is the default if rgl was built to support FreeType.
FreeType fonts are specified using the rglFonts function. This function takes a vector of four
filenames of TrueType font files which will be used for the four styles regular, bold, italic and bold
italic. The vector is passed with a name to be used as the family name, e.g. rglFonts(sans = c("/path/to/FreeSans.ttf"
In order to limit the file size, rgl ships with just 3 font files, for regular versions of the serif,
sans and mono families. Additional free font files are available from the Amaya project at http:
//dev.w3.org/cvsweb/Amaya/fonts/. See the example below for how to specify a full set of
fonts.
Full pathnames should normally be used to specify font files. If relative paths are used, they are
interpreted differently by platform. Currently Windows fonts are looked for in the Windows fonts
folder, while other platforms use the current working directory.
If FreeType fonts are not used, then bitmapped fonts will be used instead. On Windows these will be
based on the fonts specified using the windowsFonts function, and are resizable. Other platforms
will use the default bitmapped font which is not resizable. Currently MacOSX does not support
bitmapped fonts in the Cocoa display used by R.app.
Bitmapped fonts have a limited number of characters supported; if any unsupported characters are
used, an error will be thrown.
See Also
r3d
Examples
open3d()
famnum <- rep(1:4, 8)
family <- c("serif", "sans", "mono", "symbol")[famnum]
font <- rep(rep(1:4, each=4), 2)
cex <- rep(1:2, each=16)
text3d(font, cex, famnum, text=paste(family, font),adj = 0.5,
color="blue", family=family, font=font, cex=cex)
90
triangulate
## Not run:
# These FreeType fonts are available from the Amaya project, and are not shipped
# with rgl. You would normally install them to the rgl/fonts directory
# and use fully qualified pathnames, e.g.
# system.file("fonts/FreeSerif.ttf", package= "rgl")
rglFonts(serif=c("FreeSerif.ttf","FreeSerifBold.ttf","FreeSerifItalic.ttf",
"FreeSerifBoldItalic.ttf"),
sans =c("FreeSans.ttf", "FreeSansBold.ttf", "FreeSansOblique.ttf",
"FreeSansBoldOblique.ttf"),
mono =c("FreeMono.ttf", "FreeMonoBold.ttf", "FreeMonoOblique.ttf",
"FreeMonoBoldOblique.ttf"),
symbol=c("ESSTIX10.TTF", "ESSTIX12.TTF", "ESSTIX9_.TTF",
"ESSTIX11.TTF"))
## End(Not run)
triangulate
Triangulate a two-dimensional polygon.
Description
This algorithm decomposes a general polygon into simple polygons and uses the “ear-clipping”
algorithm to triangulate it. Polygons with holes are supported.
Usage
triangulate(x, y = NULL, random = TRUE, plot = FALSE, partial = NA)
Arguments
x, y
Coordinates of a two-dimensional polygon in a format supported by xy.coords.
random
Whether to use a random or deterministic triangulation.
plot
Whether to plot the triangulation; mainly for debugging purposes.
partial
If the triangulation fails, should partial results be returned?
Details
The algorithm works as follows. First, it breaks the polygon into pieces separated by NA values in
x or y. Each of these pieces should be a simple, non-self-intersecting polygon, separate from the
other pieces. (Though some minor exceptions to this rule may work, none are guaranteed). The
nesting of these pieces is determined.
The “outer” polygon(s) are then merged with the polygons that they immediately contain, and each
of these pieces is triangulated using the ear-clipping algorithm.
Finally, all the triangulated pieces are put together into one result.
turn3d
91
Value
A three-by-n array giving the indices of the vertices of each triangle. (No vertices are added; only
the original vertices are used in the triangulation.)
The array has an integer vector attribute "nextvert" with one entry per vertex, giving the index of
the next vertex to proceed counter-clockwise around outer polygon boundaries, clockwise around
inner boundaries.
Note
Not all inputs will succeed, even when a triangulation is possible. Generally using random = TRUE
will find a successful triangulation if one exists, but it may occasionally take more than one try.
Author(s)
Duncan Murdoch
References
See the Wikipedia article “polygon triangulation” for a description of the ear-clipping algorithm.
See Also
extrude3d for a solid extrusion of a polygon, polygon3d for a flat display; both use triangulate.
Examples
theta <- seq(0, 2*pi, len=25)[-25]
theta <- c(theta, NA, theta, NA, theta, NA, theta, NA, theta)
r <- c(rep(1.5, 24), NA, rep(0.5, 24), NA, rep(0.5, 24), NA, rep(0.3, 24), NA, rep(0.1, 24))
dx <- c(rep(0, 24), NA, rep(0.6, 24), NA, rep(-0.6, 24), NA, rep(-0.6, 24), NA, rep(-0.6, 24))
x <- r*cos(theta) + dx
y <- r*sin(theta)
plot(x,y,type="n")
polygon(x,y)
triangulate(x, y, plot=TRUE)
open3d()
polygon3d(x, y, x - y, col = "red")
turn3d
Create a solid of rotation from a two-dimensional curve.
Description
This function “turns” the curve (as on a lathe) to form a solid of rotation along the x axis.
Usage
turn3d(x, y = NULL, n = 12, smooth = FALSE, ...)
92
viewpoint
Arguments
x, y
Points on the curve, in a form suitable for xy.coords. The y values must be
non-negative.
n
How many steps in the rotation?
smooth
logical; whether to add normals for a smooth appearance.
...
Additional parameters to pass to tmesh3d.
Value
A mesh object containing triangles and/or quadrilaterals.
Author(s)
Fang He and Duncan Murdoch
See Also
extrude3d
Examples
x <- 1:10
y <- rnorm(10)^2
shade3d(turn3d(x, y), col = "green")
viewpoint
Set up viewpoint
Description
Set the viewpoint orientation.
Usage
view3d( theta = 0, phi = 15, ...)
rgl.viewpoint( theta = 0, phi = 15, fov = 60, zoom = 1, scale = par3d("scale"),
interactive = TRUE, userMatrix, type=c("userviewpoint", "modelviewpoint") )
Arguments
theta,phi
polar coordinates
...
additional parameters to pass to rgl.viewpoint
fov
field-of-view angle in degrees
zoom
zoom factor
scale
real length 3 vector specifying the rescaling to apply to each axis
viewpoint
93
interactive
logical, specifying if interactive navigation is allowed
userMatrix
4x4 matrix specifying user point of view
type
which viewpoint to set?
Details
The data model can be rotated using the polar coordinates theta and phi. Alternatively, it can
be set in a completely general way using the 4x4 matrix userMatrix. If userMatrix is specified,
theta and phi are ignored.
The pointing device of your graphics user-interface can also be used to set the viewpoint interactively. With the pointing device the buttons are by default set as follows:
left adjust viewpoint position
middle adjust field of view angle
right or wheel adjust zoom factor
The user’s view can be set with fov and zoom.
If the fov angle is set to 0, a parallel or orthogonal projection is used. Small non-zero values (e.g.
0.01 or less, but not 0.0) are likely to lead to rendering errors due to OpenGL limitations.
Prior to version 0.94, all of these characteristics were stored in one viewpoint object. With that
release the characteristics are split into those that affect the projection (the user viewpoint) and
those that affect the model (the model viewpoint). By default, this function sets both, but the type
argument can be used to limit the effect.
See Also
par3d
Examples
## Not run:
# animated round trip tour for 10 seconds
rgl.open()
shade3d(oh3d(), color="red")
start <- proc.time()[3]
while ((i <- 36*(proc.time()[3]-start)) < 360) {
rgl.viewpoint(i,i/4);
}
## End(Not run)
94
writeOBJ
writeOBJ
Write Wavefront OBJ format files
Description
This function writes OBJ files. This is a file format that is commonly used in 3D graphics applications. It does not represent text, but does represent points, lines, polygons (and many other types
that RGL doesn’t support).
Usage
writeOBJ(con,
pointRadius = 0.005, pointShape = icosahedron3d(),
lineRadius = pointRadius, lineSides = 20,
pointsAsPoints = FALSE, linesAsLines = FALSE,
withNormals = TRUE, withTextures = TRUE,
separateObjects = TRUE,
ids = NULL)
Arguments
con
A connection or filename.
pointRadius, lineRadius
The radius of points and lines relative to the overall scale of the figure, if they
are converted to polyhedra.
pointShape
A mesh shape to use for points if they are converted. It is scaled by the pointRadius.
lineSides
Lines are rendered as cylinders with this many sides.
pointsAsPoints, linesAsLines
Whether to convert points and lines to “point” and “line” records in the OBJ
output.
withNormals
Whether to output vertex normals for smooth shading.
separateObjects
Whether to mark each RGL object as a separate object in the file.
withTextures
Whether to output texture coordinates.
ids
The identifiers (from rgl.ids) of the objects to write. If NULL, try to write
everything.
Details
The current implementation only outputs triangles, quads, planes, spheres, points, line segments,
line strips and surfaces. It does not output material properties such as colors, since the OBJ format
does not support the per-vertex colors that RGL uses.
The defaults for pointsAsPoints and linesAsLines have been chosen because Blender (http:
//www.blender.org) does not import points or lines, only polygons. If you are exporting to other
software you may want to change them.
writePLY
95
If present, texture coordinates are output by default, but the textures themselves are not.
Individual RGL objects are output as separate objects in the file when separateObjects = TRUE,
the default.
The output file should be readable by Blender and Meshlab; the latter can write in a number of other
formats, including U3D, suitable for import into a PDF document.
Value
Invisibly returns the name of the connection to which the data was written.
Author(s)
Duncan Murdoch
References
The file format was found at http://www.martinreddy.net/gfx/3d/OBJ.spec on November 11,
2012.
See Also
scene3d saves a copy of a scene to an R variable; writeWebGL, writePLY and writeSTL write the
scene to a file in various other formats.
Examples
filename <- tempfile(fileext=".obj")
open3d()
shade3d( icosahedron3d() )
writeOBJ(filename)
writePLY
Write Stanford PLY format files
Description
This function writes PLY files. This is a simple file format that is commonly used in 3D printing.
It does not represent text, only edges and polygons. The writePLY function does the necessary
conversions.
Usage
writePLY(con, format = c("little_endian", "big_endian", "ascii"),
pointRadius = 0.005, pointShape = icosahedron3d(),
lineRadius = pointRadius, lineSides = 20,
pointsAsEdges = FALSE, linesAsEdges = pointsAsEdges,
withColors = TRUE, withNormals = !(pointsAsEdges || linesAsEdges),
ids = NULL)
96
writePLY
Arguments
con
A connection or filename.
format
Which output format. Defaults to little-endian binary.
pointRadius, lineRadius
The radius of points and lines relative to the overall scale of the figure, if they
are converted to polyhedra.
pointShape
A mesh shape to use for points if they are converted. It is scaled by the pointRadius.
lineSides
Lines are rendered as cylinders with this many sides.
pointsAsEdges, linesAsEdges
Whether to convert points and lines to “Edge” records in the PLY output.
withColors
Whether to output vertex color information.
withNormals
Whether to output vertex normals for smooth shading.
ids
The identifiers (from rgl.ids) of the objects to write. If NULL, try to write
everything.
Details
The current implementation only outputs triangles, quads, planes, spheres, points, line segments,
line strips and surfaces.
The defaults for pointsAsEdges and linesAsEdges have been chosen because Blender (http:
//www.blender.org) does not import lines, only polygons. If you are exporting to other software
you may want to change them.
Since the PLY format only allows one object per file, all RGL objects are combined into a single
object when output.
The output file is readable by Blender and Meshlab; the latter can write in a number of other formats,
including U3D, suitable for import into a PDF document.
Value
Invisibly returns the name of the connection to which the data was written.
Author(s)
Duncan Murdoch
References
The file format was found at http://www.mathworks.com/matlabcentral/fx_files/5459/1/
content/ply.htm on November 10, 2012.
See Also
scene3d saves a copy of a scene to an R variable; writeWebGL, writeOBJ and writeSTL write the
scene to a file in various other formats.
writeWebGL
97
Examples
filename <- tempfile(fileext=".ply")
open3d()
shade3d( icosahedron3d(col="magenta") )
writePLY(filename)
writeWebGL
Write scene to HTML.
Description
Writes the current scene to a collection of files that contain WebGL code to reproduce it in a browser.
Usage
writeWebGL(dir = "webGL", filename = file.path(dir, "index.html"),
template = system.file(file.path("WebGL", "template.html"), package = "rgl"),
prefix = "",
snapshot = TRUE, font = "Arial", width, height)
Arguments
dir
Where to write the files.
filename
The filename to use for the main file.
template
The template web page to which to write the Javascript for the scene. See Details
below.
prefix
An optional prefix to use on global identifiers in the scene; use different prefixes
for different scenes displayed on the same web page. If not blank, it should be a
legal identifier in Javascript and HTML.
snapshot
Whether to include a snapshot of the scene, to be displayed in browsers that
don’t support WebGL.
font
The font to use for text.
width, height
The (optional) width and height in pixels of the image to display. If omitted, the
par3d("windowRect") dimensions will be used.
Details
This function writes out a web page containing Javascript that reconstructs the scene in WebGL.
Use the template argument to give the filename of a web page that is to contain the code for the new
scene. It should contain a single line containing paste("%", prefix, "WebGL%"), e.g. %WebGL%
with the default empty prefix. That line will be replaced by the Javascript and other code necessary
to reproduce the current scene. The template may also contain the string "%rglVersion%" which
will be replaced with the current rgl version number.
98
writeWebGL
To put more than one scene into a web page, use different values of prefix for each. The prefix
will be used in identifiers in both Javascript and HTML, so it is safest to start with a letter and only
use alphanumeric characters.
WebGL is a fairly new technology for displaying 3D scenes in browsers. Most current browsers
support it to some extent, though it may not be enabled by default; see http://get.webgl.org for
details. A major exception currently is Microsoft’s Internet Explorer, though plugins are available.
Currently writeWebGL has a number of known limitations, some of which will be gradually eliminated as development progresses:
The bounding box decorations are fixed; labels do not move as they do within R.
User-defined mouse controls are not supported.
No automatic movement (e.g. rotation via spin3d) is supported.
Missing values are not handled properly.
Polygons will only be rendered as filled; there is no support in WebGL for wireframe or point
rendering.
• WebGL browsers generally do not support more than 65535 vertices per object. writeWebGL
will print a warning if this limit is exceeded, but it is up to the user to break his scene into
smaller objects. (And 65535 vertices may not be small enough!)
•
•
•
•
•
Value
The filename is returned.
Note
The output includes a binary copy of the CanvasMatrix Javascript library. Its source (including the
copyright notice and license for free use) is included in the file named by system.file("WebGL/CanvasMatrix.src.js", pa
Author(s)
Duncan Murdoch.
References
http://www.webgl.org
See Also
scene3d saves a copy of a scene to an R variable; writePLY, writeOBJ and writeSTL write the
scene to a file in various other formats.
Examples
plot3d(rnorm(100), rnorm(100), rnorm(100), type="s", col="red")
# This writes a copy into temporary directory 'webGL', and then displays it
browseURL(paste("file://", writeWebGL(dir=file.path(tempdir(), "webGL"),
width=500), sep=""))
Index
subdivision3d, 81
surface3d, 86
text3d, 87
viewpoint, 92
∗Topic graphics
bgplot3d, 10
extrude3d, 15
identify3d, 18
mfrow3d, 24
observer3d, 26
persp3d, 33
persp3d.function, 36
polygon3d, 45
readSTL, 48
rgl.attrib, 50
scene3d, 72
selectpoints3d, 75
subscene3d, 82
subsceneInfo, 85
triangulate, 90
turn3d, 91
writeOBJ, 94
writePLY, 95
writeWebGL, 97
∗Topic utilities
rgl.Sweave, 67
.check3d, 4
∗Topic dplot
ellipse3d, 13
par3dinterp, 32
play3d, 40
spin3d, 79
∗Topic dynamic
abclines3d, 4
addNormals, 5
aspect3d, 6
axes3d, 7
bg3d, 9
cylinder3d, 12
grid3d, 16
light, 19
matrices, 20
mesh3d, 22
par3d, 27
persp3d, 33
planes3d, 38
plot3d, 42
points3d, 44
r3d, 47
rgl-package, 3
rgl.bbox, 51
rgl.bringtotop, 53
rgl.material, 54
rgl.open, 57
rgl.pixels, 58
rgl.postscript, 59
rgl.primitive, 61
rgl.setMouseCallbacks, 63
rgl.snapshot, 64
rgl.surface, 65
rgl.user2window, 69
scene, 71
select3d, 74
shapelist3d, 77
spheres3d, 78
sprites, 80
abclines3d, 4, 17, 39
addNormals, 5
addToSubscene3d (subscene3d), 82
as.character, 18
asEuclidean (matrices), 20
asHomogeneous (matrices), 20
aspect3d, 6, 30, 43, 79
axes3d, 7, 52
axis, 8
axis3d, 17
axis3d (axes3d), 7
99
100
bbox3d, 8, 52
bbox3d (rgl.bbox), 51
bg3d, 9, 11, 28, 73
bgplot3d, 10, 10
box, 8
box3d (axes3d), 7
clear3d (scene), 71
clearSubsceneList (mfrow3d), 24
clipplanes3d (planes3d), 38
cube3d, 3, 48
cube3d (mesh3d), 22
cuboctahedron3d (mesh3d), 22
currentSubscene3d (subscene3d), 82
curve, 38
cylinder3d, 12
decorate3d, 34
decorate3d (plot3d), 42
deform.mesh3d (subdivision3d), 81
delFromSubscene3d (subscene3d), 82
divide.mesh3d (subdivision3d), 81
dodecahedron3d (mesh3d), 22
dot3d, 48, 77
dot3d (mesh3d), 22
ellipse3d, 13, 78
extrude3d, 15, 46, 91, 92
gc3d, 25
gc3d (subscene3d), 82
getr3dDefaults (par3d), 27
grid, 17
grid3d, 16
icosahedron3d (mesh3d), 22
identify, 18
identify3d, 18
identityMatrix (matrices), 20
layout, 24–26
layout3d, 84
layout3d (mfrow3d), 24
legend, 11
legend3d (bgplot3d), 10
light, 19
light3d, 72
light3d (light), 19
lines3d, 46, 48, 61
lines3d (points3d), 44
INDEX
locator, 75
material3d, 8–10, 43, 73
material3d (rgl.material), 54
matrices, 20, 31
mesh3d, 14, 21, 22, 47, 48, 78, 82
mfrow3d, 24, 84
movie3d, 65
movie3d (play3d), 40
mtext, 8
mtext3d (axes3d), 7
newSubscene3d, 25, 26, 86
newSubscene3d (subscene3d), 82
next3d (mfrow3d), 24
normalize.mesh3d (subdivision3d), 81
observer3d, 26, 30
octahedron3d (mesh3d), 22
oh3d (mesh3d), 22
open3d, 3, 4, 43, 47, 57, 69, 72
open3d (par3d), 27
par, 24–26
par3d, 4, 7, 22, 24, 27, 27, 32, 40, 43, 56, 63,
70, 73, 89, 93
par3dinterp, 32, 41
par3dsave, 32
particles3d (sprites), 80
persp, 34, 87
persp3d, 33, 37, 66, 87
persp3d.function, 34, 36
planes3d, 5, 38
play3d, 33, 40, 79
plot.default, 43
plot3d, 3, 7, 28, 34, 42, 73
plot3d.function, 43
plot3d.function (persp3d.function), 36
plot3d.rglobject (scene3d), 72
plot3d.rglscene (scene3d), 72
png, 11
points3d, 44, 48, 61
polygon3d, 16, 45, 91
pop3d (scene), 71
pretty, 17, 52
print.rglobject (scene3d), 72
print.rglscene (scene3d), 72
qmesh3d, 14
INDEX
qmesh3d (mesh3d), 22
quads3d, 48
quads3d (points3d), 44
r3d, 4, 24, 47, 58, 82, 88, 89
r3dDefaults, 28, 56, 71, 89
r3dDefaults (par3d), 27
rainbow, 37
readSTL, 48
rgl, 48, 72
rgl (rgl-package), 3
rgl-package, 3
rgl.abclines, 39
rgl.abclines (abclines3d), 4
rgl.antialias (rgl.open), 57
rgl.attrib, 50, 73, 76
rgl.bbox, 51, 52, 56, 58, 72
rgl.bg, 56, 58
rgl.bg (bg3d), 9
rgl.bringtotop, 40, 53, 64, 65
rgl.clear, 19, 58
rgl.clear (scene), 71
rgl.clipplanes (planes3d), 38
rgl.close (rgl.open), 57
rgl.cur (rgl.open), 57
rgl.dev.list (rgl.open), 57
rgl.ids, 49–51, 81, 94, 96
rgl.ids (scene), 71
rgl.init (rgl.open), 57
rgl.light, 56, 58, 72
rgl.light (light), 19
rgl.lines, 58
rgl.lines (rgl.primitive), 61
rgl.linestrips, 44
rgl.linestrips (rgl.primitive), 61
rgl.material, 39, 44, 52, 54, 61, 62, 66, 78,
79, 81, 86–88
rgl.open, 3, 47, 57, 69
rgl.pixels, 58
rgl.planes, 5
rgl.planes (planes3d), 38
rgl.points, 44, 58
rgl.points (rgl.primitive), 61
rgl.pop, 19, 44, 52, 58, 62
rgl.pop (scene), 71
rgl.postscript, 59, 68
rgl.primitive, 23, 44, 56, 61
rgl.projection (rgl.user2window), 69
rgl.quads, 58
101
rgl.quads (rgl.primitive), 61
rgl.quit (rgl.open), 57
rgl.select, 62
rgl.select3d, 62
rgl.select3d (select3d), 74
rgl.set, 3
rgl.set (rgl.open), 57
rgl.setMouseCallbacks, 29, 63
rgl.setWheelCallback, 30
rgl.setWheelCallback
(rgl.setMouseCallbacks), 63
rgl.snapshot, 41, 58–60, 64
rgl.spheres, 58, 62
rgl.spheres (spheres3d), 78
rgl.sprites, 58, 62
rgl.sprites (sprites), 80
rgl.surface, 58, 62, 65, 87
rgl.Sweave, 67
rgl.texts, 58, 62
rgl.texts (text3d), 87
rgl.triangles, 39, 58
rgl.triangles (rgl.primitive), 61
rgl.useNULL, 31, 58, 69
rgl.user2window, 69
rgl.viewpoint, 31, 58, 60, 65
rgl.viewpoint (viewpoint), 92
rgl.window2user (rgl.user2window), 69
rglFonts (text3d), 87
rglobject-class (scene3d), 72
rglscene-class (scene3d), 72
rotate3d, 15, 48, 77
rotate3d (matrices), 20
rotationMatrix (matrices), 20
RweaveLatex, 68
scale3d, 77
scale3d (matrices), 20
scaleMatrix (matrices), 20
scene, 71
scene3d, 49, 72, 95, 96, 98
segments3d, 5, 48, 61
segments3d (points3d), 44
select3d, 18, 29, 48, 70, 74, 75, 76
selectpoints3d, 75, 75
shade3d, 46, 48, 77
shade3d (mesh3d), 22
shape3d (mesh3d), 22
shapelist3d, 24, 77
snapshot3d (rgl.snapshot), 64
102
spheres3d, 48, 78
spin3d, 41, 79, 98
sprintf, 41
sprites, 80
sprites3d, 48
sprites3d (sprites), 80
subdivision3d, 14, 48, 81
subscene3d, 39, 82
subsceneInfo, 84, 85
subsceneList (mfrow3d), 24
surface3d, 34, 66, 86
Sweave, 67
Sweave.snapshot (rgl.Sweave), 67
Sys.sleep, 41, 68
terrain3d, 48, 66
terrain3d (surface3d), 86
tetrahedron3d (mesh3d), 22
text3d, 18, 29, 48, 87
texts3d (text3d), 87
title, 8
title3d (axes3d), 7
tkrgl, 32
tmesh3d, 15, 92
tmesh3d (mesh3d), 22
transform3d, 48
transform3d (matrices), 20
translate3d, 77
translate3d (matrices), 20
translationMatrix (matrices), 20
triangles3d, 39, 48, 49
triangles3d (points3d), 44
triangulate, 15, 16, 46, 90
turn3d, 16, 91
useSubscene3d, 3
useSubscene3d (subscene3d), 82
view3d (viewpoint), 92
viewpoint, 92
wire3d, 48, 77
wire3d (mesh3d), 22
writeOBJ, 49, 73, 74, 94, 96, 98
writePLY, 49, 73, 74, 95, 95, 98
writeSTL, 49, 73, 74, 95, 96, 98
writeSTL (readSTL), 48
writeWebGL, 10, 28, 49, 57, 73, 74, 95, 96, 97
xy.coords, 61, 90, 92
INDEX
xyz.coords, 5, 12, 18, 19, 39, 42, 44, 46, 61,
69, 74, 77, 78, 80, 88


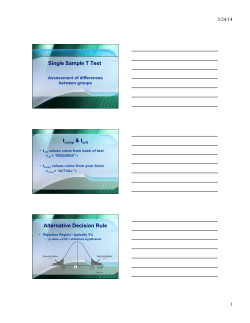
© Copyright 2026