
Contracting Universe and the Cosmological Redshift
Contracting Universe and the Cosmological Redshift
Sudesh Kumar
November, 2014
Abstract: Standard cosmology is based on Einstein’s general theory of relativity and uses
FRW metric to describe the start and evolution of universe. The FRW metric written in
comoving coordinates states that one can think of a coordinate system in which separations
increase in proportion to a scale factor
which increases with time. This separation
increase is commonly called as space expansion and is supposed to cause the observed
cosmological redshift. FRW metric and standard cosmology has some serious theoretical
issues, which are discussed in detail in this paper and an alternate model and a new metric
based on general relativity is proposed, which explains the cosmological redshift as a
consequence of a contracting universe rather than an expanding one. It turns out that the
model is able to match the observed data accurately without any dark energy or dark energy.
Keywords: cosmology: theory
1. Introduction
Most contemporary cosmologists believe that the
universe as we know it was created some 15 billion
years ago in an immense explosion called Big Bang.
In the fraction of a second it expanded trillion
times, creating all the space, matter, and energy
that now make up the galaxies and stars. The heat
of the immense explosion which started the
universe is still reaching us from all directions and
called Cosmic Microwave Background (CMB).
The current description of the universe also called
standard model of cosmology is bizarre and
enigmatic. There is an unknown type of matter
called dark matter, which is supposed to have
seeded the formation of large scale structures but
has not been confirmed in any experiment or
observations so far. There is some mysterious
energy called dark energy which is pushing all the
galaxies apart but whose density is not decreasing
a bit despite of so much space being added
between the galaxies. This energy has some
unknown source and way for its production but no
one has any clue about its origin or nature. The
current concept of the universe, despite being
bizarre, attempts to answer most of the questions
regarding origin and fate of universe. Despite the
efforts of the cosmologists, the current description
of the universe is most certainly wrong.
Copyright © 2014: Sudesh Kumar
To understand the issues with standard cosmology
we first discuss the FRW Metric which is the
mathematical backbone for the current
description of the universe as per standard
cosmology. We discuss Hubble Parameter and age
of universe, and why dark energy was introduced,
without which the FRW equations predict a much
younger universe than is observed. We discuss the
nature of time dilation in standard model and
highlight how it is different from time dilation of
SR.
In section 2 we discuss few problems related to
the standard cosmology in general and FRW metric
in particular. The keys issues highlighted are the
large scale structures, anomalies in CMB and BBN,
the flatness and horizon problems and finally the
ugly and arbitrary nature of space expansion.
In section 3 I propose the new metric and discuss
the physics behind the theory. Relation of the
scale factor in my metric and FRW are discussed
and equations for time and distances are
developed which can be used to verify the theory
against present observational data. It is shown
that the age of universe is not finite. In this section
I will also highlight how the new model solves the
problem of stability of field equations without the
cosmological constant. My model for the very first
time presents a theoretical foundation for the
apparent change in values for the constants of
[email protected]
Page 1
nature with time, a concept, which has long been
suspected but never really predicted to exist or not
exist.
In section 4 I present observational proofs for my
model and compare those against the standard
model. It turns out that in most cases observations
can be attributed to almost all models of
cosmology, making those observations indecisive
at best. We discuss how real time dilation in look
back time is the key observation, which can really
differentiate beyond doubt which model depicts
the reality.
Hubble rate is the measure of how rapidly the
scale factor changes with time and is defined as
This is not the definition that was used initially for
Hubble rate. Hubble rate was thought to be a
constant initially which indicated the
proportionality between recession velocity and
distance
in Hubble Law.
Finally I conclude with the hope that my model will
end the current stagnancy in theoretical physics
and provide a new direction in which we should
look to reveal the secrets of nature, which are still
too many to be uncovered.
Later on when metric expansion of space was
proposed as the theory behind Hubble Law it was
proposed that comoving distance between two
1.1 FRW Metric and FRW equations
scale factor
As the physical distance in an expanding universe
increases with the scale factor the metric
This prompted scientists to recast ratio between
recession velocity and distance as the ratio of rate
of change of scale factor and the scale factor
describing the universe must then be similar to
Minkowski metric (assuming Universe is flat
globally), except that distant must be multiplied by
the scale factor. The Friedmann-Robertson-Walker
(FRW) metric is such a metric and is defined (in its
simplest form and in Cartesian coordinates) as
points in space remained same while their physical
distance
increased with time due to a
whose value increased with time.
itself.
Using the first FRW equation given in section 1.1
above and the definition of Hubble Rate
we
can then say that Hubble rate is directly
proportional to square root of mass density
Assuming a flat universe we can derive from the
metric
The equation is called the first FRW equation and
is used to derive many important parameters like
Hubble rate and age of universe. This is the
simplest form of first FRW equation and does not
yet contain the terms for possible curvature in
space and cosmological constant.
1.2 Hubble Rate and dark energy
Copyright © 2014: Sudesh Kumar
Clearly if universe is expanding, as claimed then
value of Hubble Rate should decrease with time
due to decrease in mass density. As we will see in
next sections this is not what has been observed.
The Hubble rate has been measured to increase
with time, that is, the expansion of universe seems
to be accelerating rather than decelerating. This is
the exact reason Einstein’s cosmological constant
was incorporated into the FRW equation enabling
Hubble parameter to increase with time.
[email protected]
Page 2
The complete first equation is given by
Here k is the curvature parameter and
Equation for age of the universe derived from the
complete first FRW equation (assuming flat
universe)
is the
Einstein’s cosmological constant. Hubble rate then
is defined as (assuming flat universe -> k=0)
The age of the universe turns out to be approximately
13.8 Gy (assuming
75 km
,
and
While the value of density decreases with
expanding space the cosmological constant must
increase with time to make the Hubble parameter
remain constant or grow with time. This means the
cosmological constant is not a constant really but
some unknown type of energy whose density
keeps on increasing with time. This is called dark
energy (unknown).
1.3 Age of the Universe
It can be shown that redshift is related to scale
factor
as below
Here
is the value of scale factor at present time
while
is the value of scale factor at time when
the light we observe today was emitted. Using this
relation and the simple equation above it can be
shown that age of the universe is
As we will see in next sections this can’t be correct
as there are structures in universe which are older
than this and obviously universe can’t be younger
than its constituents. Again cosmological constant
came to the rescue and age of universe was
revised.
)
1.4 Distances in standard cosmology
The universe is expanding means that early in its
history the distance between us and distant
galaxies was smaller than it is today. We can
picture space as a grid as in Figure 1.1 which
expands uniformly as time evolves. Points on the
grid maintain their coordinates, so the comoving
distance between two points—which just
measures the difference between coordinates—
remains constant. However, the physical distance
is proportional to the scale factor, and the physical
distance does evolve with time.
Figure 1: Expansion of the universe. The comoving distance between
points on a hypothetical grid remains constant as the universe expands.
The physical distance is proportional to the comoving distance times the
scale factor, so it gets larger as time evolves. Figure courtesy: Dodelson,
Scott. Modern Cosmology
It is clear from the description above that as universe
expands and value of scale factor increases the ratio of
physical distance to coordinate (or comoving) distance
also keeps on increasing.
Comoving distance is calculated by integrating up the
proper distances of nearby fundamental observers along
the Line Of Sight (LOS).
Light travel distance (or physical distance) is the
distance light travels in a given time. We have
Copyright © 2014: Sudesh Kumar
[email protected]
Page 3
already calculated the equation for time integral
above. Using the relation
and
multiplying by the speed of light we get the light
travel distance
The luminosity distance
in an expanding
universe is given by
Using the equation for comoving distance gives us
2. Problems with standard cosmology and FRW
Metric
Standard cosmology as we know today started
from the famous observations about redshift in
light coming from distant galaxies. Ironically the
biggest problem with standard model and FRW
metric is that it does not correctly explain this
redshift appropriately. The description for the
redshift by believers of standard model is that the
wavelength of the photon is stretched along with
the expanding space during its travel from
emission to absorption, just like a pattern on the
surface of a balloon gets stretched with the
expanding balloon.
Expansion of space in standard cosmology is the
source of biggest confusion. The FRW metric
written in comoving coordinates (supposedly)
states that one can think of a coordinate system in
which separations increase in proportion to a scale
factor
which increases with time. A common
interpretation of this algebra is to say that the
galaxies separate “because the space between
them expands”. Some cosmologists question the
use of this description as stated by Martin Rees
and Steven Weinberg “How is it possible for space,
which is utterly empty, to expand? How can nothing
expand? The answer is: space does not expand.
Cosmologists sometimes talk about expanding space,
but they should know better.” One way of interpreting
Weinberg’s words is that, according to him, talk
Copyright © 2014: Sudesh Kumar
about expansion of space is no more than
metaphorical, the physical fact being the increase
(in time) of the distances between any two
galaxies. Irrespective of how it’s described, almost
all cosmologists agree that as per FRW metric
distance between galaxies increases with time.
Going forward whenever we mention space
expansion we mean increase in distance with time.
But if the distance between galaxies increases with
time, does the distance between walls of my room
also increase with time? Do we expect the Earth to
recede from the Sun as the distance between
them increases with time?
It is clear that there can be three different answers
to these questions.
First one is to say that the space expands at all
scales including space in my bedroom but because
the rate of expansion is so slow that there will be
no noticeable expansion between local distances
even up to the solar scale in our lifetimes.
Second answer could be that although the space is
expanding at all scales local forces keep the
distances fixed at local scales. For example
molecular forces keep walls of my room intact
stopping those to expand with the space. Similarly
gravitational forces keep distance between earth
and the sun fixed stopping them to drift apart with
the increasing space between them.
Finally third answer is to say that the space does
not expand at all levels but the expansion is
applicable only for intergalactic (or for intercluster) space.
To anyone who has a basic knowledge about GR
and matrices, the first answer seems most natural
and reasonable. After all if there is a matric which
applies to the whole universe, it must apply to
space at all levels. Problem is that this is not the
answer, as per most cosmologists; and this causes
a big confusion to anyone new to the topic of
cosmology.
Most cosmologists believe today that the real
answer is a mixture of the second and third.
Francis et al argue in their paper “Expanding
Space: the root of all Evil?”
[email protected]
Page 4
“Retaining the relativistic picture of expanding space, it
is easy to address the question of what happens to
Peacock’s bedroom, namely it will evolve as determined
by the relativistic equations. But as ever, knowledge of
the scenario, and particularly the initial conditions, is
vital; the walls of the bedroom are held together by
electromagnetic forces and hence are not following
geodesics, and the distribution of matter has collapsed
and is not uniform, and so the underlying geometry of
spacetime in this region needs to be calculated; it would
not be represented by the FRW spacetime of the
homogeneous and isotropic universe. Clearly, if the
universe were homogeneous on scales smaller than
Peacock’s bedroom, and the walls were not held
together by electromagnetic or other forces, and the
particles making up the wall were at rest with the
cosmological fluid which, importantly, requires that they
not be initially at rest with respect to one another, then
indeed as the universe expands the total volume of the
bedroom would increase. The many conditions listed
above are (at least approximately) true for galaxies not
bound in common groups and hence they behave in
ways that can be understood and predicted via the
framework of expanding space.
This leads to an important point, namely that we should
not expect the global behaviour of a perfectly
homogeneous and isotropic model to be applicable when
these conditions are not even approximately met. The
expansion of space fails to have a ‘meaningful local
counterpart’ not because there is some sleight of hand
involved in considering the two regimes but because the
physical conditions that manifest the effects described as
the expansion of space are not met in the average
suburban bedroom.”
Clearly they are saying that the molecular forces at
the smaller level keep the shape of the room intact
but if there are no such forces then the objects will
be stretched with the expanding space (meaning
that space expands even at smallest scales). This is
further cleared in another section of the paper.
“What if an object had no internal forces, leaving it at
the mercy of expanding space? This is a rather strange
object it would very quickly be disrupted by the forces of
everyday life. Nevertheless, it is a useful thought
experiment. The above result shows that the object,
being subject only to expanding space, has been
stretched in proportion with the scale factor. These are
essentially cosmological tidal forces. We therefore have
clear, unambiguous conditions that determine whether
an object will be stretched by the expansion of space.
Objects will not expand with the universe when there are
Copyright © 2014: Sudesh Kumar
sufficient internal forces to maintain the dimensions of
the object”
However when it comes to objects held together
by gravity, they prefer the third answer, which
says that the space expansion is global but not
universal.
“Having dealt with objects that are held together by
internal forces, we now turn to objects held together by
gravitational ‘force’. One response to the question of
galaxies and expansion is that their self-gravity is
sufficient to ‘overcome’ the global expansion. However,
this suggests that on the one hand we have the global
expansion of space acting as the cause, driving matter
apart, and on the other hand we have gravity fighting
this expansion. This hybrid explanation treats gravity
globally in general relativistic terms and locally as
Newtonian, or at best a four force tacked onto the FRW
metric. Unsurprisingly then, the resulting picture the
student comes away with is somewhat murky and
incoherent, with the expansion of the Universe having
mystical properties. A clearer explanation is simply that
on the scales of galaxies the cosmological principle does
not hold, even approximately, and the FRW metric is not
valid. The metric of space-time in the region of a galaxy
(if it could be calculated) would look much more
Schwarzschildian than FRW like, though the true metric
would be some kind of chimera of both. There is no
expansion for the galaxy to over-come, since the metric
of the local universe has already been altered by the
presence of the mass of the galaxy. Treating gravity as a
four-force and something that warps spacetime in the
one conceptual model is bound to cause student more
trouble than the explanation is worth. The expansion of
space is global but not universal, since we know the FRW
metric is only a large scale approximation.”
Careful analysis of the arguments put forward
reveals some flaws in this line of reasoning.
First of all saying that FRW Metric is not applicable
on galactic scales because the cosmological
principle does not hold on such scales implies that
it should not be applicable on the scales of large
scale structures also which have been observed to
be the order of billions of light years big. Most
cosmologists believe mechanism for formation of
large scale structures is gravity, which means that
Schwarzschild Metric will be the dominant metric
at such large scales. Still we see different
cosmological redshifts for different galaxies (based
on their distance) within large scale structures.
This implies that FRW Metric is also applicable at
[email protected]
Page 5
those scales. If both the Metrics can be applicable
on one scale then there is no reason to believe
that they should not be applicable on all scales.
For argument’s sake if we assume that FRW Metric
is not applicable on some scales, then question
becomes, how does nature decide at which scales
to apply the Metric and at what scales not to?
There is nothing in the metric which tells us that
the metric should be applicable or not applicable
on a particular scale. How does nature decide if it
has to be a galaxy, a cluster of galaxies, or a supercluster at which to apply or not to apply the
Metric? There is no clear answer for this and none
of the believers of standard cosmology have
addressed this adequately. If there is ambiguity of
conditions in which a law is applicable or not then
we can be sure that at least the interpretation of
the law is incorrect if not the law itself.
Argument about molecular forces keeping
dimensions of my room intact against the
expansion of space is also ill found. Space and time
are the most fundamental entities in the universe,
on which everything else plays out in the universe
including forces. If really space is expanding as per
FRW Metric and if that Metric is applicable at all
scales then all objects including the atoms and
molecules must also expand with that. As we have
discussed above that FRW Metric must be
applicable at all scales, this implies that my room
must also expand.
But the conclusion that the FRW metric must be
applicable on scales creates a problem for the
standard model itself. First issue is that if space is
expanding on all scales then it must be true for
space on earth including the space at sub atomic
level. It can be shown that if the space expands
with time at sub atomic level then all our scales of
measure will also expand with time including the
wave length of the photons emitted. What this
means that wavelengths of successive photons
emitted for a particular spectral line will be bigger
and bigger with time. Although such increase will
be undetectable in lab experiments due to very
slow growth of the scale factor, the increase in
wavelength over considerable period of times will
be significant. In fact the change in wavelength of
spectrum-photons emitted on earth will be same
Copyright © 2014: Sudesh Kumar
as the elongation of wavelength (if that happens)
of the same wavelength spectrum- photon which
was emitted in far-away galaxy and has travelled
for the same time period. This should cancel out
and we should not see any redshift at all in the
photons coming from far-away galaxies.
To understand this better consider a photon with
wavelength emitted at time (as a result of
formation of a neutral hydrogen) from far-away
galaxy which reaches earth at time . The increase
in wavelength of this photon due to space
expansion will be given as
Here
and
time
and
are the values of scale factor at
.
Since laws of nature are same at all places the
wavelength of photon emitted as a result of
neutral hydrogen formation at time here on
earth should also be . Now due to space
expansion at sub-atomic level the average distance
between nucleus of Hydrogen and ground state of
electron will also increase in the ration of .
Since the energy of ionization is inversely
proportional to the average distance between
nucleus and the ground state electron the energy
of the photon emitted will reduce by and
wavelength being inversely proportional to energy
of the photon will increase in the ratio
So we see that the wavelength of the incident
photon and the photon generated in the lab on
earth should have the same wavelength meaning
that there should be no redshift if wavelength of
photons increases during travel due to space
expansion. We discussed earlier that increase in
wavelength of photons due to space expansion
should not happen as it violates the energy
conservation principle. This leads to the inevitable
conclusion that if space is really expanding then as
per FRW metric then we should really see blue
shift in light coming from distant galaxies. The fact
that we see redshift rather than blue shift tells us
[email protected]
Page 6
something about nature which I will discuss in next
sections.
Another reason the standard model cosmology is
plain wrong in explaining the cosmological redshift
is a fairly simple reason. We know the energy of a
photon is inversely proportional to its wavelength.
This means a photon will lose energy with time
due to increase in its wavelength without any
physical mechanism to dispel that energy. This
violates the fundamental law of conservation of
energy and therefore is incorrect. So we see that
standard model does not explain the very
phenomenon for which it was invented.
There are many more issues with standard
cosmology and big bang which have been raised
already by many experts and are available in
literature. I don’t want to repeat those here and
have prepared a compilation of few, such issue
from literature in Appendix D for those who are
interested.
including the molecules, atoms and all sub-atomic
distances. This would result in shrinking of all our
scales of measure creating an illusion of expansion
through red-shift.
But if all our scales of measurements are shrinking,
it poses a threat to the principle of constant speed
of light, which would appear to increase with time.
This leads us to a natural conclusion that the FRW
metric is not correct even if assume that the scale
factor in the metric is decreasing with time rather
than increasing. We need to create a new metric
with a term for the time component of the metric
which is inverse of the scale factor, so the (proper)
time must run faster with (coordinate) time if
space is contracting to keep the speed of light
fixed at all times.
My metric is defined as
3. My model for the universe and the associated
Metric
FRW Metric is an elegant mathematical
instrument, but as soon as the ad hoc space
expansion interpretation is ascribed to it, without
any hints in the metric for the scales at which this
expansion is to be applicable, it becomes an ugly
monster, creating all sorts of issues as we have
discussed in the previous sections. Elegance of any
mathematical model that describes physical reality
lies in its non-ambiguous nature and simplicity. I
am surprised how mathematicians and
theoreticians missed the simple and elegant
message that FRW metric gives us loud and clear.
The space expansion (or contraction) if real must
be applicable at all scales.
But if the space does really expand at all scales,
then (as discussed in previous section) what we
should really observe is a blue-shift in light coming
from far off galaxies.
The fact that we observe red-shift rather than
blue, tells us that we have been looking in the
wrong direction all along. Instead of space
expanding, it must be actually contracting with
time along with everything in the universe
Copyright © 2014: Sudesh Kumar
Here I have used
for scale factor rather than
to
avoid ambiguity between my metric and the FRW
metric.
As the scale factor in my metric applies to all
scales, it means, as the space contracts and
galaxies becomes closer to each other, all our
scales also shrink in size, keeping the (coordinate
as well as proper) distance between the galaxies
fixed (ignoring peculiar motion) at all times.
3.1 The equations
It is straight forward to calculate the equations for
my model. Using the metric and the field
equations we get
Here
is the mass-density, while
and are
gravitational constant and speed of light
respectively.
The equation tells us the time derivative of the
scale factor is directly proportional to the [email protected]
Page 7
energy density of the universe. This is very similar
to the first FRW equation but because of the
absence of scale factor in the denominator of LHS
in my equation.
As we will see in a moment coordinate time is
related with scale factor as
Scale factor
Which means unit volume as a function of scale
factor can calculated by the integral
in my equations decreases with time
and scale factor
from FRW equations increases
with time and they must be defined as inverse of
each other to match my model predictions with
current observational data
So total volume will be
3.2 Elapsed time and age of Universe in my model
In a stationary metric we expect the energy
density within the galaxies to vary with inverse of
volume, which would imply that density as a
function of time would vary as inverse of scale
factor cubed
The fact that elapsed proper unit time itself
increases with time, forces us to review our basic
definition of mass density to arrive at a correct
equation for variation of mass-density with proper
time. As mass density is nothing but mass per unit
volume, and since mass of the universe is not
changing with time we need to choose a consistent
definition of unit volume. Speed of light being a
constant comes to our rescue and we must define
unit volume as the volume of space enclosed in
the sphere of light ray formed in an infinitesimal
unit proper time starting from the origin. In a
contracting universe the volume of this sphere will
reduce in proportion to the cube of scale factor
but due to simultaneous increase in elapsed
proper time the net effect will be proportional to
square of scale factor.
Let
be the unit volume at a given coordinate
time t. Rate of change of unit volume at that time
is proportional to
Copyright © 2014: Sudesh Kumar
Another intuitive way to understand this is to
consider that space-time is a four dimensional
manifold and volume in rest frame varies in
proportion to all diagonal elements of the metric
multiplied together.
Hence we expect the mass density to vary with
inverse of scale factor squared
That is the density of galaxies increases with
decreasing scale factor. This is same as saying
density in past was less compared to today. Here
is the current time and
is the current
density
In contrast to FRW equations which tell us that
rate of expansion of universe should reduce with
time (which is not what has been observed so far,
forcing cosmologists to invent fudge factor of dark
energy), the equation derived above tells us that
rate of contraction of galaxies should increase with
time without any need to invent the dark energy.
Scale factor
in standard model is the inverse of
scale factor
used in my model
[email protected]
Page 8
Taking time derivative of both sides
Looking at the equation above we can conclude
that age of the universe is not finite, which means
that there was no Big Bang.
3.3 Distances in my model
Dividing both sides by
As all scales of length in my model reducing in
same proportion as the distance between the
galaxies and all objects at all scales, the coordinate
and proper distance in my model is always the
same at a given time.
Using the equation above and dividing both sides
of my equation by
Comoving distance or physical distance in my
model is thus simply the distance travelled by the
photon. Multiplying the equation for coordinate
time elapsed (between a photon is emitted and
absorbed) derived above with c gives the
comoving distance. We denote this as .
Setting
should gives us the value of Hubble
Rate today
Rewrite the equation in terms of
In a contracting universe number of photons
received at a given surface from a fixed distance
source will increase proportional to scale factor
(due to both coming closer), but length of proper
time also keeps on increasing with scale factor
making the power received as lesser by same
factor . Both these effects cancel each other and as
there is no change in energy of a photon once
emitted it means luminosity distance in my
solution is same as comoving distance or physical
distance.
Integrating both sides gives us the coordinate time
elapsed between the two events of a photon
emission and absorption
We will use this equation in next sections to verify
my model against observed data of luminosity
distance versus redshifts.
3.4 Stability of Einstein’s Field equations and
cosmological constant
Relationship between redshift and scale factor is
derived easily as
Copyright © 2014: Sudesh Kumar
When Einstein was working on field equations of
general relativity he was very much bothered by
an aspect of his theory. It was assumed at that
time that the Universe was made up of stars
(galaxies and other large scale structures were not
[email protected]
Page 9
discovered yet). The distribution of stars seemed
uniform throughout space. It was also assumed
that this distribution was stable and had not
changed much with time or was likely to change
into the far future. The stars were assumed to be
long-lived, and evenly distributed around us in all
directions.
This presented a grave problem for Einstein: his
field equations presented an unstable solution! If
you have a roughly (but not perfectly) uniform
distribution of matter, then spacetime is going to
curve due to the presence of that matter. And
once spacetime is curved, those regions with
slightly more matter than others are going to
preferentially attract more and more matter, and
will grow over time, leading to collapse of the
entire universe very quickly. It was already known
at that time that universe was at least billions of
years old, while the field equations were telling
him that universe cannot survive so long and all we
should have by now is some very dense regions of
mass (term black hole was not yet invented) and
extremely large voids of space. Einstein knew
this wasn’t the case for our Universe, so there
must be something wrong in his equations.
He knew the laws of gravity were for real, but
something in his equations wasn’t properly
accounted for. As far as Einstein could tell, stars
pretty much stayed where they were over time.
Because they weren’t all collapsing to form regions
of enormous mass and huge voids there had to be
something in the nature that stops this collapse or
at least extends it for prolonged periods of time
for us to see what we see today.
He proposed that there was an intrinsic property
of space itself, some kind of constant of nature
responsible for this. This constant would
counteract the ever increasing curvature of space
time completely or at least would slow it down.
Thus he introduced this constant in his field
equations and it was called cosmological constant.
Later on he admitted this as the biggest blunder of
his life.
As it turns out in this paper today almost hundred
years later, indeed there was no need for such a
constant because nature has a very smart trick up
Copyright © 2014: Sudesh Kumar
its sleeve to keep the universe stable. As increasing
mass density create wrinkles in spacetime and
tries to bring everything together, nature keeps on
shrinking its basic fabric of spacetime, erasing the
wrinkles and keeping the distances fixed.
I feel delighted to having discovered this trick of
nature. It’s like finding biggest secret of a great
magician.
3.5 River of spacetime and particle anti-particle
asymmetry
It turns out that the universe is contracting at all
scales from the largest to the smallest. This implies
that there is a preferred direction of time, an
arrow of time, as has been speculated long but
never really substantiated with a sound model. It
would not be in-appropriate if we call this as the
river of spacetime while flows in one direction,
smaller and faster. Even at sub atomic level this
river of spacetime pushes all fundamental particles
to go in one direction. Could this possibly explain
the mystery behind lack of anti-matter in
universe? Anti-particles are theorized as nothing
but particles going back in time and because of
contraction of space at all scales it would create an
asymmetry in time making it difficult for particles
to travel in opposite direction.
3.6 CMB and Element Abundances
It would not be very prudent for me to speculate
regarding the origin of CMB or element
abundances at this stage as more research is
needed in this area considering there are many
issues in observed data and current explanation
(refer Appendix D). I would defer this to my future
research work.
3.7 Dark energy and dark Matter
My model makes dark energy redundant
straightaway by explaining the redshifts and all
other related observations without any
cosmological constant. It does not explain the
anomalous rotational curves specifically but as it
turns out there is another explanation for these
curves in standard general relativity making dark
matter also redundant. Please see appendix A for
details of the explanation.
[email protected]
Page 10
3.8 Forces of nature
Metric contraction of space impacts everything
which is dependent on distances scales and rate of
time.
Most obvious is the (pseudo) force of gravity. It
will keep on increasing with time as it depends on
inverse of radial distance squared.
When we can look back at events in time, we must
keep in mind that all objects were less dense by
two powers and weighed lesser by two powers of
scale factor due to reduction in gravitational force.
As all other fundamental forces of nature will also
get impacted, it might have some surprising
implications for element formations in the
universe in the past and in future.
3.9 Particle Physics
Particle physics and cosmology are tightly linked as
it has been believed so far that universe and all the
elementary particles in it were created in a hot and
dense environment. If my model is correct then it
means that big bang never happened and the
elementary particles were not created in a hot and
dense environment of a big band but maybe in a
cold and diffused state. I believe the particle
physicists need to look at this possibility and start
exploring new directions for fundamental particle
creation.
4. Observational proofs for my model
Physics is an exact science with measurements
confirming or invalidating the predictions of
hypotheses and theories to great levels of
accuracy. This does not mean we can measure
everything to an infinite degree of precision. The
challenge is not the technology or accuracy of
instruments but the nature itself puts some
constraints on the measurements. At the smallest
scales Heisenberg’s uncertainty principle prohibits
us from measuring position and momentum
precisely simultaneously and at the largest scales
we are constrained by the hugeness of the
measurement scales. There is no way we can
measure the mass or distance of a far-off galaxy
directly and we have to rely on measurement of
observables like flux or redshift which may be
Copyright © 2014: Sudesh Kumar
directly linked to the mass or distance of the
galaxy but we don’t know the exact relationship
and we have to make a guess. Statistics provides
some help here but there are also we have many
challenges like selection bias, small sample size,
confirmation bias, systematic errors etc. Another
challenge is that the relation between the
observables and the physical properties of galaxies
and other objects in the universe is dependent on
the theoretical model. If we are trying to confirm
or negate a model based on some observation
which itself depends directly or indirectly on the
model then the whole argument becomes
somewhat circular in nature.
Next sections discuss some of the possible tests for
the confirmation of my model in detail. For all the
tests we will rely on statistics and calculate
goodness-of-fit and AIC to compare my model
with observed data objectively based on these
scores.
4.1 Type I-a Supernovae Luminosity versus
redshift
Distance-redshift relation is one of the
fundamental tests that can be used as a
differentiator between the models as different
models predict different distances for a given
redshift. This difference is more pronounced in
case of high redshifts (
). As is known widely
now that type I-a Supernovae are excellent
standard candles with very little scatter in intrinsic
luminosity observed.
Excellent measurements of high redshifts have
been done by many teams independently. The SCP
"Union2.1" SN Ia compilation is a compilation of
many such studies bringing together data for 833
SNe, drawn from 19 datasets including data from
Noble prize winners Supernova Cosmology team
and High Z Supernova team. Of these, 580 SNe
pass usability cuts. I have used this dataset as the
test for my model.
I have used only one free parameter to fit the data
and kept the equations free of Hubble parameter.
The equations used are given below.
Since data in SCP Union 2.1 is for distance
modulus, the free parameter is log10(C/2H)
[email protected]
Page 11
See Table 1 for the summary of results.
If we can find a class of light sources with a
common value for the absolute luminosity per unit
See below the plot of distance modulus versus and
fitness of data with the model
area , then their surface brightness should be
found to decrease with redshift precisely as
predicted by a model.
The key obstacle to performing this test is the
definition of a standardized unit of SB which can
be observed at a range of redshifts.
The following correlation has been empirically
shown for elliptical galaxies:
Larger galaxies have fainter effective
surface brightnesses. Mathematically
speaking:
(Djorgovski
& Davis 1987) where
radius, and
Figure 2: Distance modulus versus redshift data from SCP Union
2.1 compilation. Two additional data points for highest redshift
SNe SCP-0401 and SN UDS10Wil discovered after the
compilation have been added to check the model fit to data at
higher z values.
4.2 Tolman Surface Brightness Test
The Tolman surface brightness test was conceived
in the 1930s to check the viability of and to
compare new cosmological models. Tolman’s test
compares the surface brightness of galaxies as a
function of their redshift. Such a comparison was
first proposed in 1930 by Richard C. Tolman as a
test of whether the universe is expanding or static.
is the effective
is the mean surface
brightness (In flux per unit area) interior
to . Another way to define this relation
is to use logarithm scale for the linear
radius and magnitude scale for surface
brightness.
.This
relation is also known as Kormendy
relation.
More luminous elliptical galaxies have
larger central velocity dispersions. This is
called the Faber–Jackson relation (Faber
& Jackson 1976). Analytically this is:
. This is analogous to the Tully–
Fisher relation for spirals.
In a simple (static and flat) universe, the light
received from an object drops inversely with the
square of its distance, but the apparent area of the
object also drops inversely with the square of the
distance, so the surface brightness would be
independent of the distance. In an expanding
universe, surface brightness reduces by fours
powers of redshift
In my model the surface brightness should reduce
by two powers of redshift
Copyright © 2014: Sudesh Kumar
If central velocity dispersion is correlated to
luminosity, and luminosity is correlated with
effective radius, then it follows that the central
velocity dispersion is positively correlated to the
effective radius. This three way relationship is
called the fundamental plane and enables us to
calculate any one of the three parameters if we
know the other two.
As it is very difficult to find the velocity dispersions
for far away galaxies, we cannot use Faber Jackson
relation or fundamental plane. Kormendy Relation
is thus a prime candidate for finding a standard
definition of surface brightness. If the relation is
[email protected]
Page 12
valid for galaxies at all redshifts (for a certain types
of galaxies) then this means that we can compare
surface brightness of galaxies at low redshifts with
those at higher redshifts having same linear radius.
Unfortunately this relation has not been
established to a good degree of accuracy at all
redshifts for any type of cosmological object. This
practically means there are no standard candles
for surface brightness like we have ‘Type I-a
Supernovae’ for luminosity. Till the time such a
relationship is established with good degree of
accuracy it’s a waste of time to use this as a test.
Some cosmologists have tried nevertheless and
done some tests but the results did not match the
theory and the anomalies were attributed to
evolution. See Appendix E for details. You can see
these observations also match my model
predictions if we assume evolution.
4.3 Time Dilation
accurately within the framework of general theory
of relativity. It does not need any dark matter or
dark universe to be able to explain the current
observational data. It does not have issues like
flatness problem, or horizon problem. It does not
conflict with the presence of large scale structures
as universe is not finite in my model providing
ample time for these structures to evolve.
Almost all current observational fits the standard
model, the tired light model and my model, except
for supernovae redshifts and time dilation which is
not predicted in static universe model. So on the
basis of supernova data we can rule out the tired
light model with confidence.
Very soon the data will be available for high
redshift supernovae and we will be able to
differentiate between my model and standard
model and I am very sure that my model will prove
to be correct.
Time dilation in look back time exists in standard
model also and has been confirmed as increased
light curve widths of the supernova, but it can be
shown that it is only apparent and not real in
standard model (see Appendix C).
My model on the other hand stipulates that time
was actually running slower in distant past
compared to today. Time dilation in look back time
is real.
This can be a real differentiator between my
model and standard model. Question is how we
can verify if time was really running slower in past?
There must be something which can be measured
to confirm this.
5. Conclusion
General theory of relativity has proved itself time
and again in last 100 years as the simple yet
accurate description of nature of spacetime. Only
area where it was not coming out as an elegant
description of reality was the redshift in light
coming from far off galaxies. It turns out the
general relativity was not inaccurate but the
metric and its interpretation were at fault. I am
convinced that my metric and model describes the
beautiful, simple and elegant nature of spacetime
Copyright © 2014: Sudesh Kumar
[email protected]
Page 13
Appendix A: Rotational Curves and Dark Matter
Anomalous rotation curves of stars in galaxies are
attributed to some unknown matter called dark
matter because (supposedly) visible matter
present in the galaxies fails to account for larger
than expected rotational velocities of stars far
from the centre of the galaxy. As per the Newton’s
laws the gravitation acceleration
of a star
circling at a distance
Here
from the centre is given by
is the total mass enclosed within the
radius
Centrifugal acceleration
required to balance
this gravitational acceleration is given by
But is it true that GR also does not explain these
velocities? Surprisingly the answer is GR can
explain the rotational velocities easily without any
amount of dark matter.
Relativity treats mass and energy at par. Mass can
be converted to energy and vice versa by the
formula
Not only this, in General Relativity, energy of a
system must be counted, along with its mass to
calculate the gravitational acceleration.
Unfortunately it seems so far no one has really
considered the energy associated with the angular
motion of the galaxies, while calculating the
expected rotational velocities.
A typical galaxy like M31 can be considered as a
disk of gas whose moment of inertia at a given
radius
Here
from centre can be calculated as
is the tangential velocity of the star also
known as rotational velocity. In a stable orbit both
the accelerations should be same but in opposite
directions. We can derive the value of rotational
velocity as
Here M is the mass enclosed within the radius
Rotational kinetic energy for a body with moment
of inertia is given by
Here
Clearly with increasing distance from the core of
the galaxy and outside the central bulge the
velocities should decrease with distance as the
halos are sparse in mass density.
Many measurements of the rotational velocities
have been made in our neighbouring galaxy M31
and many more such galaxies and in all the cases
the velocities were found to be roughly constant
with increasing distance even outside the bulge.
This has been a puzzle for quite some time now
and even GR corrections to the Newtonian
equations have not been able to explain the
anomalies forcing cosmologists to invent an
unknown matter called dark matter which must be
having mass to create gravitational acceleration
needed but which is not visible.
Copyright © 2014: Sudesh Kumar
is the effective angular velocity at radius .
Using the energy mass relation we can calculate
the mass equivalent
of this kinetic energy
Finally the correct equation for rotational velocity
becomes
Only challenge that remains then is to calculate
effective angular velocity of as a function of
radius . Iteration method prescribed below is one
of the solutions.
[email protected]
Page 14
If we know the mass and angular velocity of the
core then we can start from there and keep on
moving outwards by an infinitesimal radial
distance and calculate the effective angular
velocity as follows
curve also predicts the velocities to actually go up
beyond 30 Kpc.
By taking the infinitesimal radial distance to be
sufficiently small we can eliminate from the
equation giving us
Carignan et al have calculated the rotational
speeds of stars in out nearest neighbour M31
galaxy also known as Andromeda galaxy. I have
used that data to check the fit with my model. See
details below.
Figure 3:
Appendix B: Statistical methods
We have used
as a measure of goodness-of-fit
of the data to the model. It is calculated as
For the purpose of the analysis I used the mass
and density profile as calculated by Tamm et al. (3)
See table 2 for mass and density profile. This was
used to calculate the mass enclosed within a given
radius.
I started the iteration at the core of the M31
galaxy assuming mass of
(Bender et al.
Here
being measured while
is the predicted value of
2005) and rotating at an angular velocity of
radians per second (equivalent to a
the parameter, while
denotes the measurement
is the observed value of the parameter
complete rotational cycle of approximately 292
years). I also assumed the core has a radius of
meters. This assumption does not have any
plus systematic error in ith measurements of total
N measurements. Basically this measure tells us
how many standard deviations each data point lies
from the model. Optimum value of
should be N.
bearing on the results as any change in this can be
compensated by changing the value of angular
velocity of the core.
Significantly higher or lesser value indicates
problems with the theory or the measurements.
I moved away from the core in increments of 0.01
Kpc and calculated the effective angular velocity at
each such distance using the equation derived
above. Using the value of angular velocity thus
calculated I calculated the rotational velocity at
each step and plotted the curve on a graph as
Relativistic Velocity curve. I also plotted the
Newtonian Velocity curve and data points fetched
from Carignan et al. BY looking at the figure below
it is clear that the relativistic velocity curve is fit
with the observations within the error limits
without any dark matter whatsoever. Relativistic
Copyright © 2014: Sudesh Kumar
We have also used Akaike Information Criterion
(AIC) to differentiate between my model and other
models which is defined as
Here p is the number of free parameters used to
fit the model to the data.
Appendix C: Time dilation in standard cosmology
Time dilation in standard cosmology is not very
intuitive and demands a brief discussion
[email protected]
Page 15
Wilson in his 1939 paper provided the (rather
inappropriate) theoretical foundation for the time
dilation and stretching of light-curve of
Supernovae. He wrote: “At the present time, it is not
it ample clear that cosmological redshift cannot at
all be compared with the kinematical Doppler
redshift of SR.
possible to decide observationally whether the redshift is
a true Doppler effect, representing relative motion, or
whether it’s a hitherto unrecognized phenomenon of a
different kind, such as, for instance, the gradual
dissipation of photonic energy. The answer to this
question is, of course, important in cosmology theory. If,
now, the redshift is a Doppler effect, then two events
separated by a time interval
for an observer in a
Davis and Lineweaver show in their paper that we
can observe galaxies having recession velocities
greater than speed of light and it still does not
violate special relativity. They analyse apparent
magnitudes of Supernovae and rule out the special
relativistic Doppler interpretation of cosmological
redshifts at a confidence level of
.
nebula whose velocity of recession is V will appear to a
terrestrial observer to be separated in time by an
Davis et al have also explained the difference
between cosmological redshift and Special
Relativistic Doppler shift with a counter intuitive
consequence that a galaxy at a constant proper
distance can have a non-zero redshift. This can
never happen in SR.
interval
Hence the light- curve of a
supernova occurring in such a nebula should appear to
be expanded along the time axis in the ratio
with respect to the “standard” light-curve given by
relatively near-by objects”.
Cosmological redshift and the redshift due to
Doppler-effect are two totally different things.
Most theoreticians today agree on this as Wiener
in his book cosmology writes: “These results are
frequently interpreted in terms of the familiar Doppler
effect. However, the interpretation of the cosmological
redshift as a Doppler shift can only take us so far. In
particular, the increase of wavelength from emission to
absorption of light does not depend on the rate of
change of a(t) at the times of emission or absorption, but
on the increase of a(t) in the whole period from emission
to absorption.”
Maria Luiza Bedran also writes in his paper: “There
are two distinct causes for the spectral shift of the light
emitted (or absorbed)by a galaxy: the kinematical
Doppler effect of special relativity (SR) and the redshift
caused by the expansion of the universe, governed by
general relativity (GR). These two effects cannot be
distinguished from one another by observing the
spectrum of the galaxy or other light source. The Doppler
shift of SR is due to the relative velocity between source
and observer, and can be negative (blueshift) or positive
(redshift), depending on whether the galaxy moves
radially toward or away from us. The general relativistic
effect is always positive, because the universe is
expanding.”
Michael Weiss (1994) has explained the
cosmological redshift beautifully in Physics FAQ
available at
http://math.ucr.edu/home/baez/physics/Relativity
/GR/hubble.html. Reading the explanation makes
Copyright © 2014: Sudesh Kumar
I summarize the differences between redshift
caused by the expansion of the universe and
kinematic redshift Doppler Effect below.
1. Redshift caused by Doppler Effect
depends on the velocity of the emitter at
the time of photon emission while
cosmological redshift depends on the
value of the scale factor at the time of
emission as well as that at the time of
absorption.
2. While it is impossible to have redshift
of greater than 1 in Doppler Effect due to
speed limit of the emitter (nothing can
travel faster than the speed of light) there
is no such limitation in Cosmological
redshift. Doppler redshift can be used as
an approximation to cosmological redshift
for low redshift galaxies.
3. Conceptually Doppler motion and
expansion of space are two totally
different phenomena. First one is the
motion through space while second one is
not a motion at all.
Considering all these points, we reach at the
conclusion that space expansion is not akin to
recessional motion and hence we cannot apply the
principles of SR and hence cannot derive the time
dilation as a consequence of SR.
[email protected]
Page 16
Even if assume for a moment that such a
conclusion can be drawn, then we also have to
consider the length contraction effect of SR, which
would demand that all distant galaxies should
appear contracted in radial direction making their
shapes more and more elliptical with increasing
redshifts. No such effect is observed in distant
galaxies proving that the inference of time dilation
as Special relativistic is incorrect.
The real reason for the apparent time dilation is
the increased distance, which photons emitted
later have to travel when compared to photons
emitted earlier. This increased distance makes the
photons emitted later reach later at the point of
observation, creating an illusion of time dilation at
source. This is not same as the real time dilation of
SR. We will see in later sections that this is a very
critical point.
Appendix D: What’s wrong with Standard
cosmology and big bang?
Most contemporary cosmologists believe that the
universe as we know it was created some 15 billion
years ago in an immense explosion called Big Bang.
The universe, they say, began in a single instant
and in a fraction of a second it expanded trillion
times, creating all the space, matter, and energy
that now make up the galaxies and stars. The
current description of the universe as per the
accepted model of cosmology is bizarre and
mysterious. There is an unknown type of matter
called dark matter, which has not been confirmed
in any experiment or observations. There is some
mysterious energy called dark energy which has
some unknown source and ways for its production.
The current concept of the universe, despite being
bizarre, attempts to answer most of the questions
regarding origin and fate of universe. Despite the
efforts of the cosmologists, the current description
of the universe is most certainly wrong. I have
tried to compile in this section from the literature
various issues highlighted by many known
cosmologists.
1. Large scale structures
In the past few decades crucial observations have
contradicted few assumptions and predictions of
the Big Bang. The Big Bang supposedly occurred
Copyright © 2014: Sudesh Kumar
about fifteen billion years ago; this means that
nothing in the cosmos can be older than this.
Prior to 1989, it was commonly assumed that
virialized galaxy clusters were the largest
structures in existence, and that they were
distributed more or less uniformly throughout the
universe in every direction. However, since the
early 1980s, more and more structures have been
discovered.
In 1983, Adrian Webster identified the Webster
LQG, a large quasar group consisting of 5 quasars.
The discovery was the first identification of a largescale structure, and has expanded the information
about the known grouping of matter in the
universe.
In 1987, Robert Brent Tully identified the Pisces–
Cetus Supercluster Complex, the galaxy filament in
which the Milky Way resides. It is about 1 billion
light years across. That same year, an unusually
large region with no galaxies has been discovered,
the Giant Void, which measures 1.3 billion light
years across.
Based on redshift survey data, in 1989 Margaret
Geller and John Huchra discovered the "Great
Wall", a sheet of galaxies more than 500 million
light-years long and 200 million wide, but only 15
million light-years thick. The existence of this
structure escaped notice for so long because it
requires locating the position of galaxies in three
dimensions, which involves combining location
information about the galaxies with distance
information from redshifts.
Two years later, astronomers Roger G. Clowes and
Luis E. Campusano discovered the Clowes–
Campusano LQG, a large quasar group measuring
two billion light years at its widest point. This was
the largest known structure in the universe at the
time of its announcement.
In April 2003, another large-scale structure was
discovered, the Sloan Great Wall.
In August 2007, a possible super void was detected
in the constellation Eridanus. It coincides with the
'CMB cold spot', a cold region in the microwave
sky that is highly improbable under the currently
[email protected]
Page 17
favoured cosmological model. This super void,
could cause the cold spot, but to do so it would
have to be improbably big, possibly a billion lightyears across, almost as big as the Giant Void
mentioned above.
1. Yadav et al give an upper limit to the
scale of homogeneity in the concordance
cosmology as approx. 370 Mpc, meaning
that universe should not have any large
structures larger than this.
Another large-scale structure is the Newfound
Blob, a collection of galaxies and enormous gas
bubbles that measures about 200 million light
years across.
2. The Huge-LQG, newly discovered LQG
from the DR7QSO catalogue, has 73
member quasars. MgII absorbers in
background quasars provide independent
corroboration of this extraordinary LQG.
The characteristic size of
In recent studies the universe appears as a
collection of giant bubble-like voids separated by
sheets and filaments of galaxies, with the
superclusters appearing as occasional relatively
dense nodes. This network is clearly visible in the
2dF Galaxy Redshift Survey.
In 2011, a large quasar group was discovered,
U1.11, measuring about 2.5 billion light years
across.
On January 11, 2013, another large quasar group,
the Huge-LQG, was discovered, which was
measured to be four billion light-years across, the
largest known structure in the universe that time.
“While it is difficult to fathom the scale of this LQG, we
can say quite definitely it is the largest structure ever
seen in the entire universe," lead author Roger
Clowes, of the University of Central Lancashire in
England, said in a statement. "This is hugely exciting,
not least because it runs counter to our current
understanding of the scale of the universe."
The newly discovered LQC is so enormous, in fact,
that theory predicts it shouldn't exist, researchers
said. The quasar group appears to violate a widely
accepted assumption known as the cosmological
principle, which holds that the universe is
essentially homogeneous when viewed at a
sufficiently large scale.
Calculations suggest that structures larger than
about 1.2 billion light-years should not exist,
researchers said.
"Our team has been looking at similar cases which add
further weight to this challenge, and we will be
continuing to investigate these fascinating phenomena,"
Clowes said. Key points from Clowes paper are
Copyright © 2014: Sudesh Kumar
Mpc is well in
excess of the Yadav et al. (2010)
homogeneity scale, and the long
dimension from the inertia tensor of
Mpc is spectacularly so. It
appears to be the largest feature so far
seen in the early universe. Even the
“main” set alone, before the change of
direction leading to the “branch” set,
exceeds the homogeneity scale. This
Huge-LQG thus challenges the assumption
of the cosmological principle.
3. Its excess mass, compared with
expectations for its (main + branch)
volume, is
, equivalent
to 1300 Coma clusters,
super-clusters, or
50 Shapley
20 Sloan Great Walls.
In November 2013 Horvath et al discovered the
Hercules–Corona Borealis Great Wall, an even
bigger structure twice as large as the former. It
was defined by mapping of gamma-ray bursts. The
structure is a galaxy filament, or a huge group of
galaxies assembled by gravity. It is about 10 billion
light-years (3 Gpc) at its longest dimension, which
is approximately 1/9 (10.7%) of the diameter of
the observable universe, 7.2 billion light-years (2.2
Gpc; 150,000 km/s in redshift space) wide, but
only 900 million light-years (300 Mpc) thick, and is
the largest known structure in the universe. It is at
redshift 1.6–2.1, corresponding to a distance of
approximately 10 billion light-years away, and is
located in the sky in the direction of its namesake
constellations Hercules and Corona Borealis.
Prior to the discovery of the Hercules–Corona
Borealis Great Wall, the largest scale at which the
[email protected]
Page 18
universe showed evidence of hierarchical structure
was on the scale of super clusters and filaments.
At larger scales, around 250–300 million lightyears, no more fractal structuring is apparent; this
was called the "End of Greatness". The
homogeneity exhibited at this scale and the
apparent normal density of the universe (as
determined by the cosmic microwave background)
implied an upper homogeneity scale about 4 times
as large (1 to 1.2 billion light years; 307 to 370
Mpc). Yadav et al suggested that the tips of the
scales might be as well to 260/h Mpc based on the
fractal dimension of the universe, consistently
smaller than the homogeneity scale above. Some
scientists say that the maximum size of structures
was somewhere around 70-130/h Mpc based on
the measure of the homogeneity scale. No
structures are expected to be larger than the scale
in accordance to the homogeneous and isotropic
distribution of matter in the universe. The
Hercules–Corona Borealis Great Wall is more than
eight times larger than the scale, greatly exceeding
the homogeneity scale. In accordance with this,
the structure would still be heterogeneous as
compared to the other parts of the universe even
at the scale of the "End of Greatness", thereby
putting the cosmological principle into further
doubt.
Based on our current knowledge about the
creation process and average velocities of the
galaxies, we know that such mammoth assemblies
cannot be created in less than 100 billion years. As
per the current model, the universe was perfect
and smooth at the time of Big Bang and there is no
proposed mechanism in the model that predicts
creation of such enormous structures that we
observe today; definitely not in the time frame the
model admits since the universe has been created.
Bernard J.T. Jones in his paper writes “Our theories
for the large scale structure of the universe are being
seriously challenged by the growing amount of data”.
Well known Cosmologist P.J.E. Peebles states in his
paper on voids “The apparent inconsistency between
the theory and observations of void is striking enough to
be classified as a crisis for the CDM model. It may be
resolved within the model through a demonstration of
an acceptable theory of galaxy formation. Or it may
drive an adjustment to the model.” Clearly he is not
Copyright © 2014: Sudesh Kumar
willing to accept that the standard model itself
may be wrong but rather hopes that the theory
can be somehow adjusted to match the
observation.
Eric J. Lerner reviews Large Scale Structure
formation in standard model.
“The large scale structure of the universe is
inhomogeneous at all scales that have been observed. In
particular, galaxies are organized into filaments and
walls that surround large voids that are apparently
nearly devoid of all matter. These void typically have
diameters around 140-170Mpc (taking
H=70km/sec/Mpc) and occur with some regularity.
These vast structures pose acute problems for the Big
Bang theory, for there simply is not enough time to form
them in the hypothesized 14 Gy since the Big Bang, given
the observed velocities of galaxies in the present-day
universe. Measurements of the large scale bulk
streaming velocities of galaxies indicate average
velocities around 200-250km/sec. The well-known
smoothness of the Hubble relation also indicates intrinsic
velocities in this same range, as do the observation of
relatively narrow filaments of galaxies in redshift-space,
which would be widened by high intrinsic velocities.
Since the observed voids have galactic densities that are
10% or less of the average for the entire observed
volume, nearly all the matter would have to be moved
out of the voids. An average particle will have to move
d= D/8 Mpc, where D is the diameter of the void. For
void diameters of 170Mpc, d=21Mpc. For a final galaxy
velocity of 220km/sec, travel time would be 87Gy or
-1
6.3H , the assumed time since the Big Bang, taking this
to be 13.7Gy. Of course this is a crude estimate, since in
the Big Bang theory, distances to be covered would be
smaller early in the universe's history, reducing travel
time. On the other hand, no physical process could
produce instantaneous velocities, so velocities would
also presumably be smaller in the past. This is especially
true if acceleration is by gravitational attraction, since
time would have to pass before substantial gravitational
concentrations are built up from assumed homogenous
initial conditions of the Big Bang.”
To summarize on the basis of size and volume of
large scale structures alone, the standard model of
cosmology is ruled out entirely. The situation is
very similar to the one in medieval history, where
common perception (due to influence of Church)
was that earth was created 6000 years ago but the
observational evidence was indicating that earth
[email protected]
Page 19
was billions of years old. Eventually truth prevailed
and everyone agrees today that earth is billions of
years old. It’s a matter of time before everyone
will have to agree that universe has to be older
than at least 100 Gy, which is not possible to
explain in current model of cosmology.
2 Unknown dark energy and dark matter
As we have discussed in earlier section, standard
model failed to account for the old age of the
universe and to fix this problem cosmological
constant dubbed as dark energy was added to the
FRW equations. No know physical law or process
recognizes such a form of energy. Also to account
for the large scale structures observed, it was
hypothesized that the matter we observe
(luminous matter) is only a fraction of the total
matter in the universe. Remaining invisible matter
called dark matter is something which we can’t see
but which has gravitational properties like ordinary
matter. This dark matter is what caused the large
scale structures. This matter can’t also be nonluminous baryonic matter (protons, neutrons etc.)
as that would mean that the standard model
prediction for primordial elements is incorrect.
Even after introducing this unknown matter the
standard model still failed to account for the huge
large scale structures as discussed earlier.
It has been more than three decades since these
unknown dark matter and dark energy were
predicted to exist but no laboratory or observation
confirmed their existence. Most cosmologists
today believe that chance of finding these bizarre
entities is slim in near future.
Some people might cite the high rotational
velocities as the independent proof of existence of
dark matter, but the argument is not correct as the
high rotational velocities can be explained very
well using standard general relativity alone
without any need for dark matter. See Appendix A
for pure GR explanation of rotational velocities
without any dark matter.
3 CMB
Discovery of CMB was claimed as an ultimate
proof of the Big Bang. It was called the smoking
gun, the relic radiation left over from the violent
Copyright © 2014: Sudesh Kumar
explosion that created the universe. Many high
accuracy experiments were done in last decade to
measure the temperature anisotropies of the
nearly perfect black body radiation and based on
these measurements the primordial baryon
density was calculated. It was claimed that this
density was in excellent agreement with the
desired baryon density for the production of
observed abundance of light elements as per the
BBN. This was hailed as independent proof that
BBN and the overall standard model of cosmology
was correct. Despite what most cosmologists
believe, there are many observations indicating
that CMB may not be really the proof of Big Bang
and standard model.
Eric J. Lerner writes on CMB
“Recent measurements of the anisotropy of the CBR by
the WMAP spacecraft have been claimed to be a major
confirmation of the Big Bang theory. Yet on examination
these claims of an excellent fit of theory and observation
are dubious. First of all, the curve that was fitted to the
data had seven adjustable parameters, the majority of
which could not be checked by other observations.
Fitting a body of data with an arbitrarily large number of
free parameters is not difficult and can be done
independently of the validity of any underlying theory.
Indeed, even with seven free parameters, the fit was not
statistically good, with the probability that the curve
actually fits the data being under 5%, a rejection at the 2
s level. Significantly, even with seven freely adjustable
parameters, the model greatly overestimated the
anisotropy on the largest angular scales. In addition, the
Big Bang model's prediction for the angular correlation
function did not at all resemble the WMAP data. It is
therefore difficult to view this new data set as a
confirmation of the Big Bang theory of the CBR.”
Dr Eric J Lerner provides a very interesting and
plausible alternative explanation for source of the
CMB. Please see his website and book for details.
Next we review 2 papers by Gerrit L. Verschuur
titled “High Galactic Latitude Interstellar Neutral
Hydrogen Structure and Associated (WMAP) High
Frequency Continuum Emission” and “On the
Apparent Associations between Interstellar
Neutral Hydrogen Structure and (WMAP) High
Frequency Continuum Emission.”
The abstract of the first paper itself gives clues
about possible source of CMB anisotropy. He
[email protected]
Page 20
writes “Spatial associations have been found between
interstellar neutral hydrogen (HI) emission morphology
and small-scale structure observed by the Wilkinson
Microwave Anisotropy Probe (WMAP) in an area
bounded by l = 60 & 180 deg, b = 30 & 70 deg, which was
the primary target for this study. This area is marked by
the presence of highly disturbed local HI and a
preponderance of intermediate- and high-velocity gas.
The HI distribution toward the brightest peaks in the
WMAP Internal Linear Combination (ILC) map for this
area is examined and by comparing with a second area
on the sky it is demonstrated that the associations do
not appear to be the result of chance coincidence. Close
examination of several of the associations reveals
important new properties of diffuse interstellar neutral
hydrogen structure. In the case of high-velocity cloud MI,
the HI and WMAP ILC morphologies are similar and an
excess of soft X-ray emission and H-alpha emission have
been reported for this feature. It is suggested that the
small angular-scale, high frequency continuum emission
observed by WMAP may be produced at the surfaces of
HI features interacting one another, or at the interface
between moving HI structures and regions of enhanced
plasma density in the surrounding interstellar medium. It
is possible that dust grains play a role in producing the
emission. However, the primary purpose of this report is
to draw attention to these apparent associations
without offering an unambiguous explanation as to the
relevant emission mechanism(s).”
Astrophysicists Kate Land and Anze Slosar
conducted an analysis of Verschuur’s study that
was published in the Dec. 10, 2007, edition of The
Astrophysical Journal. They concluded that
Verschuur’s correlation of the radio emissions
from nearby hydrogen and the WMAP data was
nothing more than a coincidence.
“Notoriously, by eye, one can often think they see
correlations between patterns,” Land said. “But one
doesn’t really see the anti-correlations. So two maps (of
the sky) that just fluctuate randomly can appear
correlated.”
In the second paper Verschuur gives some
statistical evidence for the correlation between
the Hydrogen structures and possible mechanism
for the emissions, proving the assertion by Land
and Slosar inaccurate. The abstract reads:
“Galactic neutral hydrogen (HI) within a few hundred
parsecs of the Sun contains structure with an angular
distribution that is similar to small-scale structure
observed by the Wilkinson Microwave Anisotropy Probe
(WMAP). A total of 108 associated pairs of associated HI
and WMAP features have now been catalogued using HI
data mapped in 2 km/s intervals and these pairs show a
typical offset of 0.8◦. A large-scale statistical test for a
direct association is carried out that casts little
additional light on whether these small offsets are
merely coincidental or carry information. To pursue the
issue further, the nature of several of the features within
the foreground HI most closely associated with WMAP
structure are examined in detail and it is shown that the
cross-correlation coefficient for well-matched pairs of
structures is of order unity. It is shown that free-free
emission from electrons in unresolved density
enhancements in interstellar space could theoretically
produce high-frequency radio continuum radiation at the
levels observed by WMAP and that such emission will
appear nearly flat across the WMAP frequency range.
Evidence for such structure in the interstellar medium
already exists in the literature. Until higher angular
resolution observations of the high-frequency continuum
emission structure as well as the apparently associated
HI structure become available, it may be difficult to rule
out the possibility that some if not all the small-scale
structure usually attributed to the cosmic microwave
background may have a galactic origin.”
See below some of the figures from the Verschuur
‘s second paper, which show direct association
between the Hydrogen structures within our
galaxy, and anisotropies reported by WMAP.
What Kate Land and Anze Slosar failed to notice is
the fact that WMAP did not consider the Hydrogen
structures in the CMB anisotropy map and even if
there is no correlation between the structures and
the anisotropies the anisotropy map is definitely
corrupted due to the emissions from such
structures which must be removed before any
conclusion about the CMB anisotropies can be
drawn.
Copyright © 2014: Sudesh Kumar
[email protected]
Page 21
two forms of emission are virtually perfectly aligned. This is
source #74 in Table 1. (d) The data in the first three plots are
here combined into one plot, which shows the very high degree
of association between the two forms of emission for what is
clearly a complex morphology at three distinct velocity regimes.
Figure courtesy: Gerrit L. Verschuur
Fig. 4 (a) The left-hand figure shows the total HI content
integrated from −150 to +30 km/s for an area encompassing HI
feature MII seen at (l,b)= (184◦,65◦). The ILC contour levels
overlain are from +0.03 mK in steps of 0.02 mK. In order to
illustrate the challenges posed by comparing ILC data to the HI
data, the right-hand figure (b) displays the HI total column
density data in contour map form. In the identification of HI
peaks associated with specific ILC peaks, the HI data in contour
maps were used and the positions and amplitudes determined
from that database. This figure does reveal several close
associations in the area around (l,b) = (204◦,55◦), which are
shown in detail in Fig. D.2. Figure courtesy: Gerrit L. Verschuur
New research by astronomers in the Physics
Department at Durham University suggests that
the conventional wisdom about the content of the
Universe may be wrong. Graduate student U.
Sawangwit and Professor Tom Shanks looked at
observations from the Wilkinson Microwave
Anisotropy Probe (WMAP) satellite to study the
remnant heat from the Big Bang. The two
scientists find evidence that the errors in its data
may be much larger than previously thought,
which in turn makes the standard model of the
Universe open to question.
Sawangwit and Shanks used astronomical objects
that appear as unresolved points in radio
telescopes to test the way the WMAP telescope
smoothes out its maps. They find that the
smoothing is much larger than previously believed,
suggesting that its measurement of the size of the
CMBR ripples is not as accurate as was thought. If
true this could mean that the ripples are
significantly smaller, which could imply that dark
matter and dark energy are not present after all.
Another mystery related to CMB is puzzling the
cosmologists. On very large scales, the cosmos
seems to have a certain lop-sidedness. That slight
asymmetry is reflected in temperature fluctuations
much larger than any galaxy, aligned on the sky in
a pattern glibly called "the axis of evil.”
Fig.5: This illustrates how the ILC contours around (l,b) =
(204◦,55◦) relate to the existence of three distinct peaks in the
HI emission derived from data at three different velocities that
are located in the area illustrated in Fig. 2. (a) The HI data in the
velocity range −50 to −48 km/s are compared to the ILC
contours. The HI structure at (l,b) = (201◦,56.◦6) is hardly visible
at all in the map of total HI content in Fig. 2(a) but is directly
associated with the ILC peak, catalogued as Source #79 in Table
1. (b) The HI data in the velocity range −40 to −38 km/s are
compared to the ILC contours and reveals a clear association
between HI and ILC structure at (l,b) = 202◦,54.◦6. (c) The HI
data are integrated from +1 to +3 km/s and the contours in the
Copyright © 2014: Sudesh Kumar
Starkman et al in their paper summarize the
problem of this large scale correlations in their
paper “THE ODDLY QUIET UNIVERSE: HOW THE
CMB CHALLENGES COSMOLOGY’S STANDARD
MODEL”
“The inflationary CDM model has many successes. The
ability to fit the peaks and troughs of the medium and
high-CMB TT angular power spectrum with just a few
parameters is remarkable. However, for the lowest few
multipoles and the largest angular scales, the
observations disagree markedly with the predictions of
the theory. Examining the lowest interesting multipoles
(the quadrupole and octopole) of the best full sky CMB
map, we find that they appear unexpectedly correlated
[email protected]
Page 22
with each other. The plane defined by the quadrupole
and the three planes defined by the octopole are nearly
parallel to each other. They are nearly perpendicular to
the plane of the Solar System (ecliptic). They point
essentially at the dipole – the direction of our motion
through the CMB. Finally, they are oriented (with respect
to their shared axis) such that the ecliptic carefully
separates the strongest extrema in the north from the
weaker extrema of the south. (Any review of CMB
anomalies would include multiple other examples, some
of which may well be connected to the above.)”
Chris Vale suspects the alignment is being caused
by an enormous group of galaxies known as the
Shapley supercluster, which lies about 450 million
light years away and spans an area of sky at least
1000 times the apparent size of the full moon. The
gravity of this supercluster could warp the CMB in
such a way that some of the temperature variation
in the dipole could "spill over" into the quadrupole
and the octupole. "The dipole variation is hundreds of
times bigger than the quadrupole, so only a little need
spill over," says Vale.
But if Vale's idea is correct, it raises a new
question. The measured quadrupole signal is
already much smaller than expected by theory,
and Vale's mechanism would mean that some of
that signal is actually spillover from the dipole. So
the true quadrupole must be even smaller, and no
one knows how that could have happened. "I might
have solved one problem but created another," admits
Vale.
More than enough data is available which suggests
that CMB is not exactly as it is claimed to be, and
it’s a matter of belief more than anything now, as
to what it actually represents. Those who believe
in standard model do not want to believe that
their inference about CMB is plain wrong; that it’s
not the relic radiation it’s claimed to be. Those
who do not believe in standard model on the other
hand, believe some kind of inter-galactic medium
is generating this radiation that’s why it has
imprint of the local structures. This is not a good
situation as science should not work on beliefs but
rather on concrete scientific proofs based on
observations and measurements. Current data
related to CMB, definitely tell us only one thing.
We have no idea what it really is! Believing
otherwise is fooling ourselves and unless we stop
Copyright © 2014: Sudesh Kumar
that we will never be able to really figure out the
true source of CMB.
4 Abundance of light elements
4
3
7
Abundance of light elements He, He, D and Li in
nature has peculiar values which the theory of
stellar nucleosynthesis has failed to account for.
Big Bang Nucleosynthesis is considered best
explanation at present for the abundance of light
elements and considered as a strong proof in
favour of standard model of cosmology over other
models. But is it really true that BBN is the best
theory for the abundance of these isotopes or
there has been a subliminal discounting of other
theories by the scientific community which may
give better explanation and predictions? We
review some of these theories below, proposed by
some of the renowned physicists.
First we review the works of Eric J Lerner who has
done extensive review of the BBN and proposed a
new theory for the production of light elements
called Plasma Nucleosynthesis.
Review of BBN by Eric J Lerner
“Big Bang Nucleosynthesis (BBN) predicts the abundance
of four light isotopes(4He, 3He, D and 7Li) given only the
density of baryons in the universe. These predictions are
central to the theory, since they flow from the hypothesis
that the universe went through a period of high
temperature and density--the Big Bang. In practice, the
baryon density has been treated as a free variable,
adjusted to match the observed abundances. Since four
abundances must be matched with only a single free
variable, the light element abundances are a clear-cut
test of the theory. In 1992, there was no value for the
baryon density that could give an acceptable agreement
with observed abundances, and this situation has only
worsened in the ensuing decade.
The observational picture has improved the most for 7Li
and D, and there is now no assumed baryon density that
will provide a good fit to just those two abundances
alone. In 1992, there were no measures of D abundance
at high redshift and therefore at remote times. The
"primordial" value for D abundance was calculated back
from the present-day observed values of 1.65x10⁻⁵
relative to H by assuming the D was destroyed by
recycling through stars. Delbourg-Salvador et al, for
example calculated that the primordial value was
-5
perhaps 6x10 .
[email protected]
Page 23
However, since 1998, D abundances have been
measured in five high redshift QSO absorption line
systems. Since the same systems show low abundances
of heavy elements known to be created by stars, they are
assumed to be close to a "primordial" or early- galactic
abundance. The weighted average of these abundances
-5
is 2.78+-0.29x10 , much lower than the values that had
been anticipated by BBN theorists a decade ago.
According to BBN predictions, this range of D
abundances would correspond to a range of
-10
baryon/photon number density h of from 5.9-6.4x10 .
Lithium abundances in metal poor Pop II stars are also
considered to be a measure of pre-galactic or at least
early galactic abundances and exhibit a remarkably
small variation (about 5%). Lithium abundances as a
result can be very accurately measured as 1.23+0.680.32x10-10, relative to H, where the errors are 2 s limits.
BBN prediction based on 7Li abundance imply a firm
-10
upper limit on h, the baryon photon ratio, of 3.9x10 ,
which is completely inconsistent with the prediction
based on D.
A "best fit" h to these two abundances alone would be
-10
4.9x10 . Since this would predict values that are excess
of 4s from observations for both 7Li and D, this pair of
observations alone would exclude BBN at beyond a 6s
level.
There is no plausible fix to this problem, which has been
recognized by BBN theorists, but not ever as a challenge
to the validity of the theory itself. Attempts to
hypothesize some stellar process that reduce the 7Li
abundance by a factor of 2 or more are rendered totally
implausible by the observed 5% variation in existing
7
abundances. No plausible process could reduce the Li
abundance so precisely in a wide range of stars differing
widely in mass and rotation rates.
The situation becomes considerably worse for BBN when
4
He is also considered. There are extensive
4
measurements so He abundances in low-metallicity
galaxies, yet the estimates of a minimal, or "primordial "
value for 4He vary considerably, for reasons we will
consider in section V. These various values determine a
percentage of 4He by weight of 21.6+-0.], 22.3+-0.2,
22.7+-0.5, 23.4+-0.3, or 24.4+-0.2.
By comparison, the BBN prediction for 4He abundance
with the "best fit" value of h=4.9x10⁻¹⁰ is 24.4, which
would be compatible only with one of the estimates of
primordial 4He from observations. It should be noted
that this highest value was only obtained by arbitrarily
excluding several of the galaxies that have the lowest
4
He abundances and is therefore not an unbiased,
statistically valid estimate. For the other cited values, the
Copyright © 2014: Sudesh Kumar
BB prediction is excluded at between a 3 s and 10 s level.
Indeed, a value as high as 24.4 is excluded at a 3 s level
on the basis of even individual low-metalicity galaxies,
such as UM461 (21.9+-0.8).
While there is considerable controversy over
interpretation of measurements of 3He abundances in
the present-day galaxy, these measurements only add to
the difficulties of BBN. Measurements indicating an
3
-5
abundance of He/H of 1.1+-0.2x10 make this an upper
limit on the "primordial" value, since it is generally
3
agreed that stars, on net, produce He. For BBN, this in
-10
turn implies that h>6.0x10 , making worse the conflicts
4
with the observed values of lithium and He.
3
Even ignoring He, the current observations of just three
of the four predicted BBN light elements preclude BBN at
a level of at least 7 s. In other words, the odds against
BBN being a correct theory are about 100 billion to one.
It is important to emphasize that BBN is an integral part
of the Big Bang theory. Its predictions flow from the
basic assumption of the Big Bang, a hot dense origin for
the universe. If BBN is rejected, the Big Bang theory must
also be rejected.
Recently, Big Bang theorists have interpreted precision
measurement of the anisotropy of the CBR as providing a
direct measurement of the baryon density of the
universe.(The CBR will be examined in more detail in
section IV). These calculations imply h=6.14+-0.25 x10⁻¹⁰,
a D abundance of 2.74+-0.2x10⁻⁵, a 7Li abundance of
3.76+1.03-0.38x10⁻¹⁰ and a 4He abundance of 24.84+-.04
%. While much has been made by Big Bang advocates of
the agreement with D observations, overall this makes
matters still worse for the validity of BBN, for the 7Li
4
value alone is now excluded at a 7 s level, and the He is
excluded at a 2 s level even for the highest estimate and
at between a 4 s and 12 s level for the other estimates.
Very conservatively, this increases the odds against BBN,
and therefore against the Big Bang itself, being a valid
theory to above 2 x10-14 to one. “
It is clear that standard model has not been really
accurate and consistent in predicting the
primordial abundances. Another reality one must
consider is that such predictions have some degree
of speculation in them as there is no way these
predictions can be tested in lab experiments here
on earth, at least not in next few decades. Till
such predictions are tested in environments which
are understood very well, any tall claim of this as
proof for standard cosmology is far-fetched.
Appendix E: Tolman Surface Brightness Test
[email protected]
Page 24
Pahre, Djorgovski, and de Carvalho3 applied the
Tolman test by studying the SB of elliptical galaxies
in 3 clusters up to z=0.4. It was concluded that the
data are in good agreement with the expectations
for an expanding Universe, while the nonexpanding model was ruled out at the better of 5sigma significance level. Lerner et al have already
shown that this is not correct and same data fits
the tired-light model also. We demonstrate here
that same data can be fit to my model as well.
In the absence of velocity dispersion
measurements for ellipticals at larger redshifts, the
authors have chosen to utilize a projection of the
FP, the Kormendy relation (Kormendy 1977)
between the effective angular radius and the
mean SB
intercept of this relation at
and used the
= 1 kpc as the
standard condition. As calculating
from
involves dependence on some cosmology, the
authors have chosen the expanding Universe
model, adopting =75km
,
For
we get
See table 4 for values of linear radii corresponding
to different redshifts
Now assuming the same Kormendy relation holds
good for my model as well we calculate the
corrected SB for my model as follows. We
calculate the differential SB as
and
enclosed by that radius. They have
assumed the relation of
While in my model angular diameter distance is
same as luminosity distance and relation between
linear radius and angular radius is same
,
.
The Kormendy intercept found by the authors at
is given in table 3
Unfortunately, they used the same SBs computed
for the expanding case to test also the
nonexpanding one. Clearly, to make a fair test all
the transformations from apparent to physical
sizes must be properly computed for my model as
well. We will do a detailed analysis for data in K
band for all the three models.
add that to the SB value of standard model for
linear radius of 1 Pc. Next we add k+e (evolution)
corrections to the standard model SB value as
given in table 5. Also given are theoretical values
for both models.
Goodness of fit score
is 1.2 for my solution and
2.81 for standard model. Clearly my model fits the
data better.
First of all we need to convert the linear radius of 1
Kpc in standard model to linear radius in my
model. In standard model angular diameter
distance is related to luminosity distance as
And linear radius is related to angular radius as
Figure 6:
Copyright © 2014: Sudesh Kumar
[email protected]
Page 25
References
Bender et al. HST STIS spectroscopy of the triple nucleus of M31: two nested disks in Keplerian rotation around a
Supermassive Black Hole. http://arxiv.org/abs/astro-ph/0509839
Bender, Ralf; Ziegler, Bodo. The Redshift Evolution of the Stellar Populations in Elliptical Galaxies. http://arxiv.org/abs/astroph/9604125
Bunn, Emory F.; Hogg, David W. The kinematic origin of the cosmological redshift. http://arxiv.org/abs/0808.1081
Burles et al. Big-Bang Nucleosynthesis: Linking Inner Space and Outer Space. http://arxiv.org/abs/astro-ph/9903300
Capria Marco, Mamone. PHYSICS BEFORE AND AFTER EINSTEIN http://www.dmi.unipg.it/~mamone/pubb/PBAE.pdf
Carignan et al. THE EXTENDED H i ROTATION CURVE AND MASS DISTRIBUTION OF M31. http://iopscience.iop.org/15384357/641/2/L109/fulltext/20255.text.html
Chilingarian et al. Analytical approximations of K-corrections in optical and near-infrared bands.
http://arxiv.org/abs/1002.2360
Chown, Marcus. 'Axis of evil' warps cosmic background. New Scientist.
http://www.newscientist.com/article/dn8193#.VGXsCMkhNVA
Clowes et al. A structure in the early universe at z ~ 1.3 that exceeds the homogeneity scale of the R-W concordance
cosmology. http://arxiv.org/abs/1211.6256
Conley et al. The Supernova Legacy Survey 3-year sample: Type Ia Supernovae photometric distances and cosmological
constraints. http://xxx.lanl.gov/abs/1010.4743
Crawford, David F. Observational evidence favors a static universe. http://arxiv.org/abs/1009.0953
D’Onofrio et al. The Fundamental Plane of Early Type Galaxies in Nearby Clusters from the WINGS Database.
http://arxiv.org/abs/0804.1892
Davis, Tamara M.; Lineweaver, Charles H. Expanding Confusion: common misconceptions of cosmological horizons and the
superluminal expansion of the Universe. http://arxiv.org/abs/astro-ph/0310808
Dodelson, Scott. Modern Cosmology. Elsevier Science.
Durham astronomers' doubts about the 'dark side'. http://phys.org/news195720060.html
Fasano et al. The scaling relations of early--type galaxies in clusters I. Surface photometry in seven nearby clusters.
http://arxiv.org/abs/astro-ph/0203013
Feigelson, Eric D., Babu, G. Jogesh. Statistical Methods for Astronomy. http://arxiv.org/abs/1205.2064
Francis et al. Expanding Space: the Root of all Evil? http://arxiv.org/abs/0707.0380
Freedman et al. Final Results from the Hubble Space Telescope Key Project to Measure the Hubble Constant.
http://arxiv.org/abs/astro-ph/0012376
Goldhaber et al. Timescale Stretch Parameterization of Type Ia Supernova B-band Light Curves. http://arxiv.org/abs/astroph/0104382
Goldhaber et al. Timescale Stretch Parameterization of Type Ia Supernova B-band Light Curves. http://arxiv.org/abs/astroph/0104382
Hogg, David W. Distance measures in cosmology. http://arxiv.org/abs/astro-ph/9905116
Horvath et al. Possible structure in the GRB sky distribution at redshift two. http://arxiv.org/abs/1401.0533
Horvath et al. The largest structure of the Universe, defined by Gamma-Ray Bursts. http://arxiv.org/abs/1311.1104
Copyright © 2014: Sudesh Kumar
[email protected]
Page 26
Hutsemekers et al. Mapping extreme-scale alignments of quasar polarization vectors. http://arxiv.org/abs/astro-ph/0507274
Jones et al. The Discovery of the Most Distant Known Type Ia Supernova at Redshift 1.914. http://arxiv.org/abs/1304.0768
Kjaegard et al. The Fundamental Plane for cluster E and S0 galaxies. http://arxiv.org/abs/astro-ph/9511139
Kormendy, J. 1977, ApJ, 218, 333
Lerner et al. UV surface brightness of galaxies from the local Universe to z ~ 5. http://arxiv.org/abs/1405.0275
Lerner, Eric J. The Big Bang Never Happened. http://bigbangneverhappened.org
Longhetti et al. The Kormendy relation of massive elliptical galaxies at z~1.5. Evidence for size evolution ?
http://arxiv.org/abs/astro-ph/0610241
Moles et al. On the use of scaling relations for the Tolman test. http://arxiv.org/abs/astro-ph/9802131
Nigoche-Netro et al. The Kormendy Relation for early-type galaxies. Dependence on the magnitude range.
http://arxiv.org/abs/0805.0961
Padmanabhan, T. ADVANCED TOPICS IN COSMOLOGY: A PEDAGOGICAL INTRODUCTION.
http://ned.ipac.caltech.edu/level5/March06/Padmanabhan/Nabhan_contents.html
Pahre et al. A Tolman Surface Brightness Test for Universal Expansion, and the Evolution of Elliptical Galaxies in Distant
Clusters. http://arxiv.org/abs/astro-ph/9511061
Peacock, J.A.: A diatribe on expanding space. http://arxiv.org/abs/0809.4573
Perlmutter et al. Measurements of Omega and Lambda from 42 High-Redshift Supernovae. http://arxiv.org/abs/astroph/9812133
Perlmutter et al. Measurements of Omega and Lambda from 42 High-Redshift Supernovae. http://arxiv.org/abs/astroph/9812133
Perlmutter et al. Measurements of the Cosmological Parameters Omega and Lambda from the First 7 Supernovae at z >=
0.35. http://arxiv.org/abs/astro-ph/9608192
Ram Gopal Vishwakarma. Do recent supernovae Ia observations tend to rule out all the cosmologies?
http://arxiv.org/abs/astro-ph/0511628.pdf
Rees, M. J.; Weinberg, S.: 1993, New Scientist, 17 April, 32
Reid et al. THE PICTURE OF OUR UNIVERSE: A VIEW FROM MODERN COSMOLOGY.
http://ned.ipac.caltech.edu/level5/Sept02/Reid/Reid_contents.html
Riess et al. Time Dilation from Spectral Feature Age Measurements of Type Ia Supernovae. http://arxiv.org/abs/astroph/9707260
Riess et al. Type Ia Supernova Discoveries at z>1 From the Hubble Space Telescope: Evidence for Past Deceleration and
Constraints on Dark Energy Evolution. http://arxiv.org/abs/astro-ph/0402512
Rubin et al. Precision Measurement of The Most Distant Spectroscopically Confirmed Supernova Ia with the Hubble Space
Telescope. http://arxiv.org/abs/1205.3494
Sandage, Allan; Lubin, Lori M. The Tolman Surface Brightness Test for the Reality of the Expansion. I. Calibration of the
Necessary Local Parameters. http://arxiv.org/abs/astro-ph/0102213
Sandage, Allan; Lubin, Lori M. The Tolman Surface Brightness Test for the Reality of the Expansion. IV. A Measurement of the
Tolman Signal and the Luminosity Evolution of Early-Type Galaxies. http://arxiv.org/abs/astro-ph/0106566
Sawangwit et al. Cross-correlating WMAP5 with 1.5 million LRGs: a new test for the ISW effect.
http://arxiv.org/abs/0911.1352
Sawangwit, U.; Shanks, T. Beam profile sensitivity of the WMAP CMB power spectrum. http://arxiv.org/abs/0912.0524
Copyright © 2014: Sudesh Kumar
[email protected]
Page 27
Schade et al. Evolution of Cluster and Field Ellipticals at 0.2<z<0.6 in the CNOC Cluster Survey. http://arxiv.org/abs/astroph/9604032
Springer et al. The large-scale structure of the Universe. http://arxiv.org/abs/astro-ph/0604561
Starkman, Glenn D. The Oddly Quiet Universe: How the CMB challenges cosmology's standard model. http://arxiv.org/abs/1201.2459
Steigman, Gary. Primordial Nucleosynthesis. http://arxiv.org/abs/astro-ph/0308511
Sullivan et al. SNLS3: Constraints on Dark Energy Combining the Supernova Legacy Survey Three Year Data with Other Probes.
http://xxx.lanl.gov/abs/1104.1444
Supernova Cosmology Project. http://supernova.lbl.gov/Union/
Suzuki et al. The Hubble Space Telescope Cluster Supernova Survey: V. Improving the Dark Energy Constraints Above z>1 and
Building an Early-Type-Hosted Supernova Sample. http://arxiv.org/abs/1105.3470
Tristram , Matthieu; Ganga , Ken. Data analysis methods for the cosmic microwave background.
http://arxiv.org/abs/0708.1429
Vale, Chris. Local Pancake Defeats Axis of Evil. http://arxiv.org/abs/astro-ph/0509039
Verschuur, Gerrit L. High Galactic Latitude Interstellar Neutral Hydrogen Structure and Associated (WMAP) High Frequency
Continuum Emission. http://arxiv.org/abs/0704.1125
Verschuur, Gerrit L. On the Apparent Associations between Interstellar Neutral Hydrogen Structure and (WMAP) High
Frequency Continuum Emission. http://arxiv.org/abs/1002.1661
Weinberg, Steven. Cosmology. Oxford University Press.
Wilson, O.C. 1939, ApJ, 90, 634
Yadav J.K., Bagla J.S., Khandai N., 2010, MNRAS, 405,2009
Lerner et al. UV surface brightness of galaxies from the local Universe to z ~ 5. http://arxiv.org/abs/1405.0275
Moles et al. On the use of scaling relations for the Tolman test. http://arxiv.org/abs/astro-ph/9802131
Table 1:
Data Set
N
No of Free Parameters
DOF
SCP union 2.1
580
1
579
AIC
604
1.04
606
Table 2:
Region
Mean Radius
(Kpc)
Luminosity Range
L⊙
Bulge
Disc
Inner Halo
Outer Halo
0.64
9.3
4.0
40
1.45
2.02
0.61
0.05
4.2
3.1
2.9
2.1
Table 3:
Cluster
z
Coma
0.024
20.19
0.12
Copyright © 2014: Sudesh Kumar
18.84
0.06
15.63
0.11
[email protected]
Page 28
Abell 2390
0.23
Abell 851
0.407
22.95
0.16
20.3
0.12
16.01
0.19
16.36
0.09
Table 4:
Cluster
Coma
Abell 2390
Abell 851
Redshift (z)
0.024
0.23
0.401
Linear Radius in Std Model (Pc)
1
1
1
Linear Radius in my model (Pc)
0.987
1.368
1.761
Table 5:
k+e
corrections
Cluster
Z
Coma
0.024
0.11
Abell 2390
0.23
0.19
Abell 851
0.407
0.09
0.06
0.5
0.88
Copyright © 2014: Sudesh Kumar
Standard Model
Observed
Observed
for
R = 1Pc
corrected
for R =
1Pc
15.63
15.69
16.01
16.51
16.36
17.24
My Model
Predicted
Differential
SB due to
increased R
Observed
for
R = 1PC
-0.014
15.64
16.53
0.34
15.67
17.11
0.61
15.75
corrected
for R =
1Pc
15.73
Observed
Predicted
corrected
for R =
1Pc
corrected
for R =
1Pc
15.75
15.7
16.17
16.53
16.14
16.44
[email protected]
Page 29
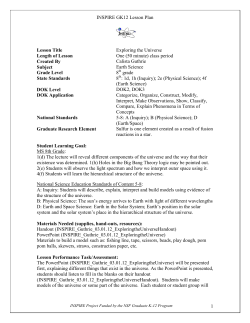


© Copyright 2026