
Sankhy¯ a : The Indian Journal of Statistics
Sankhyā : The Indian Journal of Statistics
Special Issue on Statistics in Biology and Health Sciences
2007, Volume 69, Part 3, pp. 494-513
c 2007, Indian Statistical Institute
°
Semiparametric Estimation of Hazard Function for Cancer
Patients
Ivana Horová, Zdeněk Pospı́šil and Jiřı́ Zelinka
Masaryk University, Brno, Czech Republic
Abstract
The main aim of this paper is to model and study the survival of cancer patients. First, a parametric form of hazard function is proposed. This model
results from a recent model of cancer cells population dynamics given in the
paper Kozusko and Bajzer (Mathematical Biosciences, 2003) and depends on
several parameters. The method of estimating such parameters is described
as well. On the other hand, the nonparametric methods seem to be appropriate for survival data. Among them, the methods of kernel estimation
of hazard functions are very effective ones. But there is a serious difficulty
with them, namely the choice of a smoothing parameter. We propose an
alternative method for the bandwidth selection based on the aforementioned
parametric method. The theory developed is applied to four data sets.
AMS (2000) subject classification. Primary 62F99, 62G99, 62P10.
Keywords and phrases. Hazard function, kernel estimation, Gompertzian
growth, parameter estimation.
1
Introduction
The goal of the paper is to analyse survival data on cancer patients by
both parametric and nonparametric methods. We propose a parametric form
of the hazard function for cancer patients based on a simple and acceptable
assumption that the hazard depends on proliferation speed of cancer cells.
We also describe a method for parameter estimation.
The nonparametric methods seem to be more appropriate for survival
analysis because there are rarely sound reasons for choosing a particular
parametric model. A very effective nonparametric method is kernel estimation of the hazard function. The properties of these estimates have been
Semiparametric estimation of hazard function
495
investigated by many authors with different techniques; see e.g. RamlauHansen (1983), Tanner and Wong (1983), Tanner and Wong (1984), Yandell
(1983), Tanner (1983), Uzunogullari and Wang (1992), Müller and Wang
(1990a), Müller and Wang (1990b), Müller and Wang (1994), Jiang and
Marron (2003).
Nevertheless, there is a serious difficulty with kernel method, namely
the determination of the smoothing parameter (bandwidth). Some of the
proposed methods for optimal bandwidth selection depend on the hazard
function being estimated. Therefore, one needs an “initial” estimation of
the unknown hazard function and its second derivative, and the parametric
method developed can serve this purpose.
The organization of the paper is as follows. The next section reviews
the notions of survival analysis from probabilistic, deterministic and statistical points of view. The third section introduces a parametric form of the
hazard function along with interpretation of parameters and methods for
their estimation. The fourth section summarizes a kernel estimate of the
hazard function, and the fifth section presents a new method for estimating
the optimal bandwidth. The theory developed is applied to four data sets in
Section 6. A brief discussion and suggestions for further research conclude
the paper in Section 7.
2
Survivor and Hazard Functions
Survival analysis involves analysis of survival time or lifetime described
by the random variable T , which is interpreted as the time from the beginning of follow-up to the death (or, to any event under consideration like
development of a particular symptom, relapse after remission of a disease,
see Collett (2003), Hougaard (2001)). Let us denote the cumulative distribution function of T by F , i.e., F (x) = P(T < x). A survival process can
also be characterized by the survival function (e.g., Chaubey and Sen, 1996)
F̄ = F̄ (x) = P(T ≥ x) = 1 − F (x),
which is the probability that an individual survives for a time greater or equal
to x, or by the hazard function λ = λ(x) describing the probability that an
individual survives at most a short time interval ∆x under the condition
that s/he survived till time x, that is expressed by the formula
P(x ≤ T < x + ∆x|T ≥ x) = λ(x)∆x.
496
I. Horová, Z. Pospı́šil, J. Zelinka
Dividing the last equality by ∆x and taking the limit as ∆x → 0, we obtain
λ(x) = −
F̄ 0 (x)
,
F̄ (x)
where 0 denotes the derivative of the function indicated. Since F̄ (0) = 1, the
survival function can be expressed by the formula
½ Z x
¾
F̄ (x) = exp −
λ(t)dt .
(2.1)
0
A slightly different approach for a survival process is described in what
follows. Let us imagine a cohort of size N0 and suppose that the cohort
dies out with the time dependent death rate µ = µ(x), i.e., the size of the
cohort N = N (x) at time x evolves according to the initial value problem
for ordinary differential equation
N 0 = −µ(x)N,
Thus
N (0) = N0 .
½ Z
N (x) = N0 exp −
x
¾
µ(t)dt .
0
(2.2)
The survival function F̄ can be considered as the quotient of surviving
individuals from the cohort
F̄ (x) =
N (x)
.
N0
(2.3)
Now, comparing the equations (2.1), (2.2) and (2.3), we can see that the
hazard function λ corresponds to the death rate µ, i.e.,
λ(x) = −
N 0 (x)
.
N (x)
(2.4)
The relationship between survival analysis and population dynamics are discussed in detail in Pospı́šil (2004).
Now, let T1 , T2 , . . . , Tn be independent and identically distributed lifetimes with distribution function F . Let C1 , . . . , Cn be independent and
identically distributed censoring times with distribution function G, which
are usually assumed to be independent of lifetimes. In the random censorship model, we observe (Xi , δi ), i = 1, . . . , n, where Xi = min(Ti , Ci ), and
Semiparametric estimation of hazard function
497
δi = 1{Xi =Ti } indicates whether the ith observation is censored or not. It
follows that the {Xi } is independent and identically distributed with survival function L̄ satisfying L̄(x) = F̄ (x)Ḡ(x). The likelihood function, which
depends on the hazard function λ and on the censoring process is given by
the expression
½ Z Xi
¾
n ³
´δi
Y
¡
¢1−δi ¡
¢δ
L(λ) =
λ (Xi )
exp −
G(Xi ) i (2.5)
λ(t)dt G0 (Xi )
0
i=1
according to Hougaard (2001). A more convenient form of it is the logarithmic one given by
− log L(λ)
n µZ
X
=
i=1
0
Xi
¶ X
n µ
G(Xi )
0
δi log 0
λ(t)dt − δi log λ(Xi ) −
+ log G (Xi )
G (Xi )
i=1
= `(λ) + const,
(2.6)
where `(λ) and const represent the first and the second sum, respectively.
Hence, the dependence on the censoring process is expressed just by an
additive constant.
Kaplan and Meier (1958) proposed the so-called product-limit estimate
of the survival function:
Y µ n − j ¶δ(j)
ˆ
,
(2.7)
F̄ (x) =
n−j+1
X(j) <x
where X(j) denotes the jth order statistics of X1 , . . . , Xn , and δ(j) is the
corresponding indicator of the censoring status. Let x1 , x2 , . . . , xm be all of
the discontinuity points of F̄ˆ such that x0 = 0 < x1 < x2 < · · · < xm ≤ X(n) .
Collett (2003) introduced the Kaplan-Meier type estimate of the hazard
function
P
δ(i)
λ̂(x) =
X(i) =xj
n
P
(xj+1 −xj )
,
for x ∈ [xj , xj+1 ), j = 0, 1, . . . , m − 1;
1{X(i) ≥xj }
i=1
(2.8)
and Nelson (1972) proposed the modified empirical survival function of observation times by
n
1 X
1{Xi ≤x} .
L̄n (x) = 1 −
n+1
i=1
(2.9)
498
I. Horová, Z. Pospı́šil, J. Zelinka
3
A Hazard Function for Cancer Patients
We start with an assumption that the risk depends on the changes in the
organism rather than on its status, i.e., the hazard is proportional to a rate
of proliferation of cancer cells. In particular, denoting by y = y(x), a time
dependent size of cancer cell population (number of cells, tumour volume or
something similar), we assume
λ(x) = βy 0 (x),
(3.1)
where β denotes the positive rate of proportionality. There are many models
of tumour growth; for a recent survey and a reference list, see Araujo and
McElwain (2004).
Kozusko and Bajzer (2003) showed that under not very restrictive conditions, the classical Gompertzian model of tumour growth represents a consequence of a more sophisticated model of cancer cell proliferation. Another
advantage of the Gompertzian model is its tractability. These reasons represent the basis for choosing the Gompertz function to be a model of cancer
growth. The function is the solution of the following initial value problem
for the ordinary differential equation:
y
y(0) = y0 .
y 0 = −ay log ,
b
The parameters y0 and b denote the initial and the maximal possible size of
the population of cancer cells, respectively. The parameter a represents an
analogy of intrinsic growth rate appearing in population dynamics models;
it can be interpreted as a maximal possible increase of a tumour size in a
unit of time. The solution of the initial value problem together with the
assumption (3.1) yields the hazard function in the form
o
n
∗
(3.2)
λ(x) = λ(x, a, t∗ , λ∗ ) = λ∗ exp 1 − a(x − t∗ ) − e−a(x−t ) ,
where
µ
1
b
t = log log
.
a
y0
βab
λ =
,
e
∗
∗
Since all of the parameters a, b, y0 , β are positive and b À y0 , the parameters
λ∗ and t∗ are also positive. Straightforward calculations imply
0 = lim λ(x) ≤ lim λ(x) < max {λ(x) : x > 0} = λ∗ = λ (t∗ ) ,
x→∞
x→0+
Z
0
∞
λ(t)dt < ∞.
Semiparametric estimation of hazard function
499
These formulae can be interpreted in the following way. A majority of deaths
does not occur immediately after including a patient into a study. The maximal risk λ∗ comes at some time t∗ after the diagnosis (initial time). All of the
patients need not die due to cancer causes (since lim F̄ (x) > 0 according
x→∞
to (2.1)). These properties are in conformity with clinical observations.
The parameters a, t∗ , λ∗ of the function λ given by (3.2) can be estimated
by the maximum likelihood method, i.e., by a maximization of the function
(2.5) or, equivalently, by a minimization of the function
`(λ) = `(a, t∗ , λ∗ )
(3.3)
defined in (2.6). The minimum can be achieved by an iterative method. For
doing it, we need initial estimates ã, t˜∗ , λ˜∗ of the corresponding parameters.
We start with the Kaplan-Meier type estimate λ̂ of the hazard function,
cf. (2.8). We split the interval [0, X(n) ) into several subintervals I1 , . . . , Ip of
equal length. Let J be the subinterval with the maximal number of deaths,
i.e.,
X
X
δi = max
δi : j = 1, 2, . . . , p ;
Xi ∈J
Xi ∈Ij
the symbols X(n) , Xi , δi were defined in the Introduction. The empirical
Kaplan-Meier type hazard function λ̂ can be approximated over the interval
J by the quadratic regression function λ̂(x) ≈ Ax2 + Bx + C. The power
expansion of the function (3.2) up to the quadratic term near the maximizing
value t∗ is
µ
a2
∗
∗ 2
λ(x) ≈ λ 1 − (x − t ) .
2
Roughly speaking, these two quadratic functions should coincide on the interval J. Hence, comparison of the coefficients and some algebra yield initial
estimates of the parameters, which can be used for starting the iterative
minimization of the function (3.3).
The actual hazard function can be more complicated. There need not be
unique cause of death in a group of patients. For example, cell populations
of local recurrence and distant failure may grow with different rates (i.e.,
different values of the parameter a) or they may have different limit sizes
(i.e., different values of the parameter b and, consequently, of the maximal
hazard λ∗ ), patients may be subjected to a treatment in different stages of
the disease (different y0 ’s, i.e., different times of maximal hazard t∗ ). To deal
500
I. Horová, Z. Pospı́šil, J. Zelinka
with such situations, we suppose that the cohort of patients be split up into
k sub-cohorts with sizes N1 , N2 ,. . . , Nk , and that each sub-cohort evolves
with its specific dynamics:
¾
½ Z x
λj (t)dt , j = 1, 2, . . . , k,
Nj (x) = αj N0 exp −
0
Pk
where αj > 0, j=1 αj = 1, cf. (2.1), (2.3). Consequently, the survival and
the hazard functions for the complete cohort are given by the formulae
F̄c (x) =
k
X
j=1
and
λc (x) = −
N 0 (x)
N (x)
=
½ Z
αj exp −
k
P
j=1
x
λj (t)dt
0
¾
© Rx
ª
αj λj (x) exp − 0 λj (t)dt
k
P
j=1
(3.4)
,
(3.5)
© Rx
ª
αj exp − 0 λj (t)dt
respectively; λc (x) is called composed hazard function. We suppose that
each of the “partial” hazard functions λj is expressed by (3.2), i.e., λj (x) =
λ(x, aj , t∗j , λ∗j ). Therefore,
λc (x) = λc (x, α1 , a1 , t∗1 , λ∗1 , . . . , αk , ak , t∗k , λ∗k )
(3.6)
and k four-tuples of parameters αj , aj , λ∗j , t∗j should be estimated. A
splitting-up of patients into sub-cohorts (i.e., estimation of parameters αj )
may be carried out according to some clinical indications, and the parameters
for each of the sub-cohorts may be estimated by minimization of the function
(3.3). The estimates obtained in this way are used as initial approximations
for iterative minimization of the logarithmic likelihood function
`c (α1 , a1 , t∗1 , λ∗1 , . . . , αk , ak , t∗k , λ∗k ),
(3.7)
cf. (2.6). Let us denote the minimizing values of respective parameters by
α̂j , âj , t̂∗j , λ̂∗j , j = 1, 2, . . . , k, and
λ̂c (x) = λc (x, α̂1 , â1 , t̂∗1 , λ̂∗1 , . . . , α̂k , âk , t̂∗k , λ̂∗k ).
(3.8)
The described method of parameter estimation was tested on simulated
data. The simulated cohort included 250 patients with lifetimes generated
Semiparametric estimation of hazard function
501
by using the hazard function (3.5) with k = 2 and parameters shown in Table 1; the censoring times were taken from uniform distribution on (10, 250).
One hundred data sets were generated, and for each of them, the described
parameter estimation was applied. The procedure yielded results in 99 cases;
the minimum of the logarithmic likelihood function was not achieved in only
one case. The convergence depends on precision of initial approximation
and suitable initial values can be found by a non-algorithmic “manual trialand-error” method, which cannot be implemented for a huge number of data
sets. The estimated parameters are compared with their true values in Table 1. We can see that the parameters a2 , t∗2 , λ∗2 for the second cohort lie
in the corresponding estimated interquartile range, while a1 , t∗1 , λ∗1 do not.
This phenomenon may be caused by the fact that the size of the first cohort
is four times less than the one of the second cohort (see the values of α1
and α2 in Table 1) and that the minimization of the likelihood function for
the composed hazard function (3.7) may suppress an accuracy of parameter
estimation for a minor cohort. Nevertheless, the present method allows to
estimate a smooth function approximating the hazard function, which is the
main aim of the paper.
Table 1. Parameters used for simulations and characteristics
of estimated parameters
Estimates
4
Parameter
Median
Q0.25
Q0.75
α1 = 0.2
α2 = 0.8
a1 = 0.02
a2 = 0.06
t∗1 = 70
t∗2 = 100
λ∗1 = 0.1
λ∗2 = 0.005
0.20
0.80
0.004
0.065
528
99
42.3
0.0051
0.19
0.79
0.0011
0.060
256
97
4.3
0.0043
0.21
0.80
0.0046
0.072
587
101
121.1
0.0059
Kernel Estimates of the Hazard Function
Let [0, T ], T > 0, be such an interval for which L(T ) < 1, where L is a
cumulative distribution function of the Xi ’s. Let λ be a twice continuously
differentiable function on [0, T ]. The family of such functions is denoted by
C 2 [0, T ].
502
I. Horová, Z. Pospı́šil, J. Zelinka
The usual kernel estimate of the hazard function λ is defined by
n
1X
K
λ̂h,K (x) =
h
i=1
µ
x − X(i)
h
δ(i)
n−i+1
(4.1)
(see Müller and Wang, 1990a), Müller and Wang, 1990b, Müller and Wang,
1994), where K is a kernel and h = h(n) is a sequence of non-random positive
numbers; h is called a smoothing parameter or a bandwidth. Usually, K is
a real valued function on R, which is symmetric and integrated to unity. A
well-known choice for K is the Epanechnikov kernel given by the formula
3
K(x) = (1 − x2 )1[−1,1] .
4
Concerning the choice of the bandwidth, modified cross-validation methods can be applied (see e.g. Marron and Padgett, 1987, Uzunogullari and
Wang, 1992, Nielsen and Linton, 1995). The rate of convergence for the
cross-validation method is rather slow. This motivates a search for improved
methods of bandwidth selection. In Gonzales et al. (1996), methods of bootstrap bandwidth selection have been developed. Other methods can also be
found in Sarda and Vieu (1991), Patil (1993a), Patil (1993b), Patil et al.
(1994). Our idea of bandwidth selection is related to the idea of plug-in
rule studied in Müller and Wang (1990b), Müller and Wang (1994). But our
approach is different from previously published approaches because we use
only “one stage plug-in”, and the parametric method makes it possible to
estimate an optimal bandwidth.
We begin with some notation and definitions. Let us denote
V (K) =
Z1
2
K (x)dx,
D2 =
0
−1
Λ=
ZT
0
ZT ³
λ(x)
dx, β2 =
L̄(x)
Z1
´2
λ00 (x) dx,
(4.2)
x2 K(x)dx.
−1
The global quality of the estimate (4.1) can be described by the Mean
Integrated Square Error (M ISE),
´ Z
³
M ISE λ̂h,K =
0
T
³
´2
E λ̂h,K (x) − λ(x) dx,
Semiparametric estimation of hazard function
503
where E denotes the expectation. It can be shown (Müller and Wang, 1990a)
that the leading term M ISE(λ̂h,K ) of M ISE(λ̂h,K ) takes the form
´ 1
³
V (K)Λ
M ISE λ̂h,K = h4 β22 D2 +
.
(4.3)
4
nh
Under assumptions that h → 0, nh → ∞ as n → ∞ and λ ∈ C 2 [0, T ],
p
the consistency of the estimate λ̂h,K can be proved, i.e. λ̂h,K → λ on [0, T ]
(Müller and Wang, 1990a). Minimizing M ISE(λ̂h,K ), with respect to h,
yields what we define as an asymptotically optimal bandwidth hopt . We
easily find that
µ
ΛV (K) 1/5
.
(4.4)
hopt = n−1/5
β22 D2
An obvious difficulty of finding such an optimal bandwidth is that hopt
depends on the unknowns Λ and D2 . This problem will be addressed in the
next section.
Nevertheless, some useful conclusions can be drawn. Firstly, the optimal
bandwidth will converge to zero as the sample size increases, but at a very
slow rate. Secondly, since the term D2 measures, in a sense, the rapidity of
fluctuations in the hazard function λ, it can be seen from (4.4) that smaller
values of h will be appropriate for more rapidly fluctuating hazard functions.
Substituting the value of hopt from (4.4) back into the formula (4.3), we
obtain (see, e.g., Horová et al., 2006)
´ 5
³
¡
¢1/5
M ISE λ̂h,K = n−4/5 T (K) D2 Λ4
,
(4.5)
4
where the functional T (K) is defined by
2/5
T (K) = β2 V (K)4/5 .
For
instance, the value of T (K) for the Epanechnikov kernel is equal to
p
.
5
81/15625 = 0.3491. The formula (4.5) shows the rate of the convergence
for the optimal value of the bandwidth.
Following Müller and Wang (1990a), the asymptotic (1 − α) confidence
interval is given by
(
)1/2
³
λ̂h,K (x)V (K)
α´
λ̂h,K (x) ±
,
(4.6)
Φ−1 1 −
(1 − Ln (x))hn
2
where Φ is the normal cumulative distribution function.
504
I. Horová, Z. Pospı́šil, J. Zelinka
5
A New Method for Estimating Optimal Bandwidth
Let us draw attention to the formula (4.4). If we find suitable estimates
of D2 and Λ, we can have an estimator ĥopt of hopt . Since L̄n (x) → L̄(x) in
probability,
1/5
ZT
1
V
(K)
λ(x)
h̃opt = n− 5 2
dx
(5.1)
β2 D2
L̄n (x)
0
is some estimate of hopt . The essence of the proposed method consists in
evaluating quantities
D2 =
ZT
0
¡
¢2
λ00 (x) dx,
Λn =
ZT
0
λ(x)
dx
L̄n (x)
by means of the parametric method investigated in Section 3.
Let λ̂ denote a parametric estimate of λ and
D̂2 =
ZT ³
0
´2
λ̂ (x) dx,
00
Λ̂n =
ZT
0
λ̂(x)
dx,
L̄n (x)
Λ̂ =
ZT
λ̂(x)dx.
(5.2)
0
Substituting these computed quantities back into formula (5.1), we arrive at
the estimate ĥopt of hopt
ĥopt = n
− 51
Ã
V (K)Λ̂n
β22 D̂2
!1/5
.
(5.3)
Since D̂2 → D2 , Λ̂n → Λ, λ̂(x) → λ(x), for x ∈ [0, T ], in probability (see
Lehmann and Casella, 1998) as n → ∞, the formula (5.3) is a consistent
estimate of hopt .
From the definition (2.9) of Ln , it is clear that
1
≤ L̄n (x) ≤ 1 on [0, T ],
n+1
and then
Λ̂ ≤ Λ̂n ≤ (n + 1)Λ̂ .
Thus (5.3) provides estimates of lower and upper bounds for the set of acceptable bandwidths given by ĥl ≤ ĥopt ≤ ĥu , where
Semiparametric estimation of hazard function
ĥl = n
−1/5
Ã
V (K)Λ̂
β22 D̂2
!1/5
, and ĥu =
µ
n+1
n
¶1/5 Ã
V (K)Λ̂
β22 D̂2
!1/5
505
. (5.4)
Let the hazard function λ be of the form (3.5) with known parameters
and the censoring times originate from the uniform distribution on a known
interval. Then, we are able to evaluate D2 , Λ and, consequently, to evaluate hopt by the formula (4.4). This gives the optimal bandwidth for the
simulated data described in Section 3 as hopt = 17.41. For each out of the
99 generated data sets with successfully estimated parameters, the estimate
ĥopt was evaluated. The median value of the estimates is 16.7, lower and
upper quartiles are 15.7 and 17.7, arithmetic and geometric means are 20.3
and 18.3. Hence, the procedure of optimal bandwidth estimation appears to
be working well.
Remark. When estimating near 0 or T , the boundary effects can occur
because the “effective support” [x−h, x+h] of K{(x−u)/h} is not contained
in [0, T ]. This can lead to negative estimates of the hazard function near
endpoints. In such cases, it may be reasonable to truncate λ̂h,K below at 0,
that is to consider λ̂h,K (x) = max(λ̂h,K (x), 0). Similar considerations can
be made for the confidence intervals. The boundary effects can be avoided
by using kernels with asymmetric supports (Müller and Wang, 1990a).
6
Applications
In this section, applications of the procedure described above will be presented. The data we are going to deal with have been kindly provided by the
Masaryk Memorial Cancer Institute in Brno, Czech Republic (Soumarová
et al., 2002a, Soumarová et al., 2002b, Horová et al., 2004) and by the
Radiotherapy Department, Hospital of České Budějovice, Czech Republic
(Dolečková et al., 2006).
The period from the time origin to the death of a patient is the survival
time; survival times for those, who have been alive at the end of study, are
right censored.
The first data set (BRB) involves 236 patients with breast carcinoma.
The study has been carried out based on the records of women, who had
received the breast conservative surgical treatment and radiotherapy as well
506
I. Horová, Z. Pospı́šil, J. Zelinka
at the Masaryk Memorial Cancer Institute in Brno in the period 1983–1994.
The patients with clinical stages I and II breast cancer carcinoma only have
been included in this study. Of the complete set of 236 patients, there are
47 (19.9%) deaths from cancer.
The second data set (BRCB) involves 152 patients with the same diagnosis and treatment, but patients were treated at the Hospital of České
Budějovice in the period 1990 – 1996. Of the complete set of patients, there
are 32 (21.1%) deaths from cancer.
The third study (USB) is concerned with the retrospective study of 49
patients with uterine sarcoma treated at the Masaryk Memorial Cancer Institute from 1990 till 1999. All of the patients had a surgical treatment, and
21 patients (42.9%) died from cancer.
The last data set (UCB) involves 222 patients with uterine carcinoma.
These patients were treated during the period 1980–1998 at the Masaryk
Memorial Cancer Institute. All of the patients had a surgical treatment and
only patients of the first clinical stage have been included in this study. Of
the complete set of patients, there are 27 (12.2%) deaths from cancer.
The characteristics of treated data sets are summarized in Table 2.
Table 2. Characteristics of the data sets; n = number of patients,
T = maximal follow up in months, nd = number of deaths,
pd = percentage of deaths
Set of patients
BRB
BRCB
USB
UCB
n
236
152
49
222
T
220
172
149
279
nd
47
32
21
27
pd
19.9
21.1
42.9
12.2
The first step of each analysis consists of estimation of parameters for the
hazard function λ̂c (3.8) by the method described in Section 3. The data sets
were split into sub-cohorts by presence/absence of local recurrence and by
the clinical stage of disease. This stratification of data helps to obtain initial
values of parameters α1 and α2 for numerical minimization of the likelihood
function (3.7); it need not have clinical significance. The parameters of
the function (3.2) were estimated for each sub-cohort of different data sets.
These estimates serve as initial values for the estimates of parameters of the
composed hazard function λc (3.5). All of the computations in this step have
been conducted using the R software (R Development, 2003). The estimated
parameters for each of the data sets are summarized in Table 3.
Semiparametric estimation of hazard function
507
Table 3. Estimated parameters of hazard function λ̂c (3.5) with their
standard errors (in brackets) for different data sets
Data set
BRB
BRCB
USB
UCB
Sub-cohort (i)
αi
ai
t∗i
λ∗i
1
0.1304
(0.0332)
0.02383
(0.0621)
80.07
(231)
0.1168
(0.64)
2
0.8696
(0.0332)
0.06274
(0.0188)
99.57
(7.11)
0.003313
(0.001)
1
0.9832
(0.0424)
0.02477
(0.0138)
44.14
(15.6)
0.002589
(0.000731)
2
0.0168
(0.0424)
0.05778
( )
106.5
( )
0.06499
( )
1
0.4949
(0.635)
0.1387
(0.0632)
9.673
(4.63)
0.05111
(0.0955)
2
0.1598
(0.386)
0.2958
(0.18)
44.94
(3.31)
0.09520
(0.329)
3
0.3453
(0.574)
0.2752
(0.172)
73.63
(2.84)
0.02493
(0.062)
1
0.5697
(1.71)
0.04587
(0.0169)
24.88
(8.25)
0.003575
(0.0116)
2
0.4303
(1.71)
0.03768
(0.0181)
125.7
(19.4)
0.004030
(0.018)
The Hessian matrix for the BRCB set is nearly singular, the minimum
of the logarithmic likelihood function is apparently flat, and, consequently,
standard errors for the estimates of a2 , t∗2 , λ∗2 could not be evaluated. This
is one more illustration of the fact that the estimation of hazard function
parameters for a non-abundant cohort is quite a hazardous task.
Consider the formula (4.1) with the Epanechnikov kernel. The optimal
bandwidth is given by the formula (4.4), and the interval Hn = [hl , hu ] of
suitable bandwidths is given by the inequalities (5.4). Simple calculations
give V (K) = 0.6, β2 = 0.2. The values D2 , Λn and Λ can be approximated
by
Z T
Z T
Z T
¡ 00 ´2
λ̂c (x)
λ̂c (x) dx, Λ̂n =
D̂2 =
dx, and Λ̂ =
λ̂c (x)dx (6.1)
0 L̄n (x)
0
0
(cf. (5.2)). All of the integrals and derivatives have been computed using
the MAPLE software. The lower bounds hl , upper bounds hu and estimates
ĥopt of hopt have been evaluated for each data sets by using formulae (5.3)
508
I. Horová, Z. Pospı́šil, J. Zelinka
3
x 10
3.5
λ
3
2.5
2
1.5
1
0.5
0
60
50
40
30
20
h
10
0
20
40
60
80
100
120
140
160
180
200
220
months
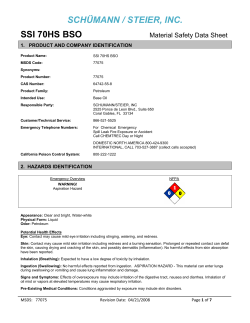
Figure 1: The dependence of the estimate λ̂h,K on bandwidth h. Patients
set is BRB and hl = 18.0, hu = 53.7, ĥopt = 20.3.
and (5.4). These computed values have been used to obtain the estimate
λ̂h,K by formula (4.1) and the corresponding 0.95 confidence limits by (4.6);
all of the computations have been done using the Matlab software.
Figure 1 illustrates the effect of the bandwidth on the shape of the estimate λ̂h,K for BRB data. When x varies in an interval I = [0, T ] of the
real line, the family of estimates {λ̂h,K , h ∈ [hl , hu ]} can be considered as a
surface in 3D-space. The estimate corresponding to ĥopt is highlighted in the
figure. The figure shows a very wide range of smoothing, from nearly the raw
data (very wiggly thin lines) to the over-smoothed estimates. This family
of smoothed curves models different features of the data visible at different
levels of smoothing. We may conclude that the estimate corresponding to
ĥopt yields a suitable smooth estimate.
The optimal bandwidth lies close to the lower bound because the estimate
of the upper bound is rather rough.
Semiparametric estimation of hazard function
1
5
509
x 10 3
4.5
0.95
4
3.5
0.9
3
2.5
0.85
2
1.5
0.8
1
0.5
0.75
0
50
100
150
200
0
250
0
50
100
150
200
250
Figure 2: Kaplan-Meier and parametric estimates of survival function (left),
parametric λ̂c and kernel estimate λ̂h,K of the hazard function (right). Patients set is BRB, ĥopt = 20.3.
3
1
6
0.95
5
0.9
4
0.85
3
0.8
2
0.75
1
0.7
0
20 40 60 80 100 120 140 160 180 200
0
x 10
0
20 40 60 80 100 120 140 160 180 200
Figure 3: Kaplan-Meier and parametric estimates of survival function (left),
parametric λ̂c and kernel estimate λ̂h,K of the hazard function (right). Patients set is BRCB, ĥopt = 41.1.
Figures 2–5 show the shapes of the estimates of survival functions and
hazard functions for each data set with the following features.
(i) In the left panel, the Kaplan-Meier estimate (dashed lines) of the survival function is presented together with the estimate obtained by using
the parametric model (solid line) (3.8).
510
I. Horová, Z. Pospı́šil, J. Zelinka
(ii) In the right panel, the estimate λ̂h,K of λ with bandwidths ĥopt (dashed
line) is presented. In order to compare the kernel estimate with the
estimate of the hazard function λ̂c (solid line) derived from the dynamical model, we include both the estimates in one figure. Moreover, it is
seen that the parametric function lies within the domain of confidence
interval (dotted line) obtained by using (4.6).
1
0.035
0.95
0.03
0.9
0.025
0.85
0.8
0.02
0.75
0.7
0.015
0.65
0.01
0.6
0.005
0.55
0.5
0
50
100
0
150
0
50
100
150
Figure 4: Kaplan-Meier and parametric estimates of survival function (left),
parametric λ̂c and kernel estimate λ̂h,K of the hazard function (right). Patients set is USB, ĥopt = 6.5.
x 10
3.5
1
3
3
0.95
2.5
0.9
2
1.5
0.85
1
0.8
0.5
0
0.75
0
50
100
150
200
250
300
0
50
100
150
200
250
300
Figure 5: Kaplan-Meier and parametric estimates of survival function (left),
parametric λ̂c and kernel estimate λ̂h,K of the hazard function (right). Patients set is UCB, ĥopt = 38.4.
Semiparametric estimation of hazard function
7
511
Discussion
The estimates of the hazard function obtained by the parametric and
the nonparametric methods presented in sections 3, 4 and 5 are close to
each other. Namely, the parametric estimate of the hazard function lies
within the confidence limits of the kernel-based nonparametric estimate.
This observation indicates that the described method may provide a suitable
tool to evaluate death risk of cancer patients.
Parametric estimation of the hazard function presents an alternative way
of estimating an optimal bandwidth for kernel estimates; this has been done
in Section 5. The main advantage of this approach is the fact that an optimal bandwidth can be estimated even in the case of a small number of
observations. On the other hand, a nonparametric estimate can be a basis
for estimation of hazard function parameters; one can search for parameters
minimizing a distance between a function estimated by the kernel method
and the parametric version of it. This idea suggests a type of iterative
method alternating between parametric estimation giving an optimal bandwidth for kernel method and more precise approximation of parameters using
the kernel estimate.
Biological or clinical relevance of parameters appearing in the functions
(3.2) and (3.5) should be a subject of further discussion with oncologists. The
parameters may serve as a heuristic tool for classification of various cancer
types or for comparison of different treatment methods. A remarkable fact
is that the estimates of the parameters a1 and a2 in the data sets BRB and
BRCB for patients with the same disease are not very different; thus these
parameters may characterize a disease.
Acknowledgements. Research of the first and the third authors was partially supported by MŠMT, LC06024. Research of the second author was
partially supported by the Grant No. 201/01/0079 of the Grant Agency of
the Czech Republic.
References
Araujo, R.P. and McElwain, D.L.S. (2004). A history of the study of solid tumour
growth: the contribution of mathematical modelling. Bull. Mathematical Biology,
66, 1039–1091.
Chaubey, Y.P. and Sen, P.K. (1996). On smooth estimation of survival and density
functions. Statist. Decisions, 14, 11–22.
512
I. Horová, Z. Pospı́šil, J. Zelinka
Collett, D. (2003). Modelling Survival Data in Medical Research. Chapman & Hall/CRC,
Boca Raton.
Dolečková, M., Horová, I., Budı́ková, M. and Hon, Z. (2006). Breast carcinoma:
statistical evaluation (in Czech). Proceedings of XXX. BOD, 41–45.
Gonzales-Mantiega, W., Cao, R. and Marron, J.S. (1996). Bootstrap selection
of the smoothing parameter in nonparametric hazard rate estimation. J. Amer.
Statist. Assoc., 91, 1130–1140.
Horová, H., Růžičková, J., Ježková, B., Horová, I., Budı́ková, M. and Dörr,
A. (2004). Adjuvant radiotherapy in the treatment of the carcinoma of uterus of
the first clinical stage (in Czech, English summary). Česká a slovenská gynekologie,
5, 366–371.
Horová, I., Zelinka, J. and Budı́ková, M. (2006). Estimates of hazard functions for
carcinoma data sets. Environmetrics, 17, 239–255.
Hougaard, P. (2001). Analysis of Multivariate Data. Springer-Verlag, Heidelberg.
Jiang, J. and Marron, J.S. (2003). SiZer for censored density and hazard estimation.
preprint.
Kaplan, E.L. and Meier, P. (1958). Nonparametric estimation from incomplete observations. J. Amer. Statist. Assoc., 53, 457–481.
Kozusko, F and Bajzer, Ž. (2003). Combining Gompertzian growth and cell population dynamics. Mathematical Biosciences, 185, 153–167.
Lehmann, E.L. and Casella, G. (1998). Theory of Point Estimation. Springer, New
York.
Marron, J.S. and Padgett, W.J. (1987). Asymptotically optimal bandwidth selection
for kernel density estimators from randomly right-censored samples. Ann. Statist.,
15, 1520–1535.
Müller, H.G. and Wang, J.L. (1990a). Nonparametric analysis of changes in hazard
rates for censored survival data: an alternative to change-point models. Biometrika,
77, 305–314.
Müller, H.G. and Wang, J.L. (1990b). Nonparametric locally adaptive hazard smoothing. Probab. Theory Related Fields, 85, 523–538.
Müller, H.G. and Wang, J.L. (1994). Hazard rate estimation under random censoring
with varying kernels and bandwidths. Biometrics, 50, 61–76.
Nelson, W. (1972). Theory and applications of hazard plotting for censored data.
Technometrics, 14, 945–966.
Nielsen, J.P. and Linton, O.B. (1995). Kernel estimation in a nonparametric marker
dependent hazard model. Ann. Statist., 23, 1735–1748.
Patil, P.N. (1993). Bandwidth choice for nonparametric hazard rate estimation. J.
Statist. Plann. Inference, 35, 15–30.
Patil, P.N. (1993). On the least squares cross-validation bandwidth in hazard rate
estimation. Ann. Statist., 21, 1792–1810.
Patil, P.N., Wells, M.T. and Marron, J.S. (1994). Some heuristics of kernel based
estimators of ratio functions. J. Nonparametr. Statist., 4, 203–209.
Pospı́šil, Z. (2004). Hazard function: a deterministic point of view. Summer School
Datastat03, Proceedings, Folia Fac. Sci. Nat. Univ. Masaryk. Brunensis, Mathematica 15, I. Horová, ed., Masaryk University, Brno, 315–324.
Semiparametric estimation of hazard function
513
R Development Core Team. (2003) R: A language and environment for statistical
computing. R Foundation for Statistical Computing, Vienna,
http://www.R-project.org/ .
Ramlau-Hansen, H. (1983). Counting processes intensities by means of kernel functions. Ann. Statist., 11, 453–466.
Sarda, P. and Vieu, P. (1991). Smoothing parameter selection in hazard estimation.
Statist. Probab. Lett., 11, 429–434.
Soumarová, R., Horová, H., Růžičková, J., Čoupek, P., Šlampa, P., Šeneklová,
Z., Petráková, K., Budı́ková, M. and Horová, I. (2002). Local and distant
failure in patients with stage I and II carcinoma of the breast treated with breastconserving surgery and radiation therapy (in Czech, English summary). Radiačnı́
onkologie, 2, 17–24.
Soumarová, R., Horová, H., Šeneklová, Z., Růžičková, J., Horová, I., Budı́ková,
M., Šlampa, P. and Kalábová, R. (2002). Treatment of uterine sarcoma. Arch. Gynecol. Obstetrics, 266, 92–95.
Tanner, M.A. (1983). A note on the variable kernel estimator of the hazard function
from randomly censored data. Ann. Statist., 11, 994–998.
Tanner, M.A. and Wong, W.H. (1983). The estimation of the hazard function from
randomly censored data by the kernel method. Ann. Statist., 11, 989–993.
Tanner, M.A. and Wong, W.H. (1984). Data-based nonparametric estimation of the
hazard function with applications to model diagnostics and exploratory analysis. J.
Amer. Statist. Assoc., 79, 174–182.
Uzunogullari, U. and Wang, J.L. (1992) A comparison of hazard rate estimators for
left truncated and right censored data. Biometrika, 79, 297–310.
Yandell, B.S. (1983). Nonparametric inference for rates with censored survival data.
Ann. Statist., 11, 1119–1135.
Ivana Horová, Zdeněk Pospı́šil and Jiřı́ Zelinka
Department of Mathematics and Statistics
Faculty of Science
Masaryk University
Kotlářská, CZ 611 37
Brno, Czech Republic
E-mail: [email protected]
[email protected]
[email protected]
Paper received April 2007; revised April 2008.


© Copyright 2026