
Capital flows and the risk-taking channel of monetary policy Valentina Bruno
Capital flows and the risk-taking channel of monetary policy
Valentina Brunoa, , Hyun Song Shinb∗†
a
American University; b Bank for International Settlements
November 20, 2014
Abstract
Adjustments in bank leverage act as the linchpin in the monetary transmission mechanism
that works through fluctuations in risk-taking.
In the international context, we find evidence
of monetary policy spillovers on cross-border bank capital flows and the US dollar exchange rate
through the banking sector. A contractionary shock to US monetary policy leads to a decrease in
cross-border banking capital flows and a decline in the leverage of international banks.
Such a
decrease in bank capital flows is associated with an appreciation of the US dollar.
Keywords: Bank leverage, monetary policy, capital flows, risk-taking channel
JEL classification: F32, F33, F34
∗
Corresponding author: Hyun Song Shin, Bank for International Settlements, Centralbahnplatz 2, CH4002 Basel, Switzerland.
†
Forthcoming in the Journal of Monetary Economics. We are grateful to the editor Urban Jermann and
the referee for their comments and guidance. We thank Christopher Sims, John Taylor, Jean-Pierre Landau,
Guillaume Plantin, Lars Svensson and Tarek Hassan for comments on an earlier version of this paper. We
also thank participants at the 2012 BIS Annual Conference, Bank of Canada Annual Research Conference,
2013 and 2014 AEA meetings and presentations at the Monetary Authority of Singapore, Bank of Korea
and at the Central Bank of the Republic of Turkey. We are grateful to Jonathan Wallen for his capable
research assistance. The views expressed here are those of the authors, not necessarily those of the Bank for
International Settlements.
Capital flows and the risk-taking channel of monetary policy
1.
1
Introduction
Low interest rates maintained by advanced economy central banks have led to a lively
debate on cross-border monetary policy spillovers and the possible transmission channels.
We examine one such channel: the banking sector. Banks are intermediaries whose financing
costs are closely tied to the policy rate chosen by the central bank. If funding costs affect
decisions on how much exposures to take on, monetary policy will then affect the economy
through greater risk-taking by the banking sector.
Borio and Zhu (2012) coined the term “risk-taking channel” of monetary policy to denote
the impact of monetary policy on the willingness of market participants to take on risk
exposures, thereby influencing financial conditions and ultimately influencing real economic
decisions. Our focus in this paper is on the operation of the risk-taking channel through
the banking sector. We ask how banking sector leverage fluctuates in the face of changing
financial conditions and track the consequences domestically and internationally.
Comovement of exchange rates and leverage connect the domestic and global impact of
risk taking. Gourinchas and Obstfeld (2012) conduct an empirical study using data from
1973 to 2010 for both advanced and emerging economies on the determinants of financial
crises. They find that two factors emerge consistently as the most robust and significant
predictors of financial crises, namely a rapid increase in leverage and a sharp real appreciation
of the currency. Lund-Jensen (2012) presents similar evidence. These findings hold both
for emerging and advanced economies.
Schularick and Taylor (2012) similarly highlight
the historical evidence on financial vulnerability, especially that associated with the size of
the banking sector. Thus, one way to frame the debate on international monetary policy
spillovers is to ask how monetary policy influences bank leverage, cross border flows and the
exchange rate.
The response to this question ties together two strands in the empirical literature. In
a domestic context, Bekaert, Hoerova and Lo Duca (2013) conduct a vector autoregression
(VAR) study that shows a close relationship between the policy rate chosen by the Federal
Reserve (the target Fed Funds rate) and measured risks given by the VIX index of implied
volatility on US equity options. They show that a cut in the Fed Funds rate is followed by a
dampening of the VIX index. In particular, they show that a loosening of monetary policy
reduces the volatility risk premium in stocks after about three quarters with a persistent
Capital flows and the risk-taking channel of monetary policy
2
effect lasting from more than two years.
Meanwhile, in an international context, an earlier paper by Eichenbaum and Evans (1995)
found that a contractionary shock to US monetary policy leads to persistent appreciation
in the US dollar both in nominal and real terms, with a maximum impact that does not
occur until at least 24 months after the shock. This finding has been dubbed the delayed
overshooting puzzle due to its apparent contradiction with the instantaneous appreciation
implied by uncovered interest parity (UIP).
Our contribution is to show that the findings of Bekaert et al. (2013) and Eichenbaum
and Evans (1995) may be seen as two sides of the same coin. Banking sector leverage is the
linchpin that connects these two sets of results. By tying together these two sets of findings
under a common framework, our analysis sheds light on the links between the domestic and
international dimensions of monetary policy transmission.
The investigation is guided by the model of cross-border banking developed in our earlier
paper on global liquidity (Bruno and Shin (2014)), that incorporates known institutional
features of cross-border banking to construct a “double-decker” model of global banks. In
this setting, regional banks borrow in US dollars from global banks in order to lend to local
corporate borrowers.
Thus, bank-to-bank credit plays a key role in propagating capital
flows. The regional banks could either be the regional branches or subsidiaries of the global
banks or locally owned banks.
In turn, the global banks finance cross-border lending to
regional banks by tapping US dollar money market funds in financial centers.
[INSERT FIGURE 1 HERE]
In our model, when the US dollar interest rate falls, the spread between the local lending
rate and the US dollar funding rate increases. Such lower dollar funding costs have spillover
effects on global financial conditions because they lead to greater cross-border liabilities and
consequently more permissive credit conditions in recipient economies.
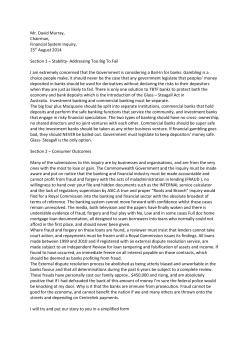
Figure 1 shows evidence of the acceleration of bank capital flows through the bank leverage channel. The left panel of Figure 1 plots cross-border debt liabilities classified by type
of counterparty.
Cross-border liabilities where both the creditor and debtor are banks
grew rapidly in the years before the 2008 crisis. The amounts involved were economically
significant before the crisis. The right hand panel of Figure 1 shows cross-border bank-tobank liabilities as a proportion of all private credit.
At the peak in 2007, bank-to-bank
Capital flows and the risk-taking channel of monetary policy
3
cross-border liabilities accounted for 20% of total private credit.
In this paper, we conduct VAR exercises to shed light on the domestic and international
transmission channels of monetary policy through the bank-to-bank lending explained in
Bruno and Shin (2014) and illustrated in Figure 1. Two sets of results trace the interactions
of the domestic and international channels of monetary policy transmission.
In the domestic dimension, a decline in US dollar bank funding costs results in an increase
in bank leverage through the mitigation of volatility risk. In fact, banking sector leverage
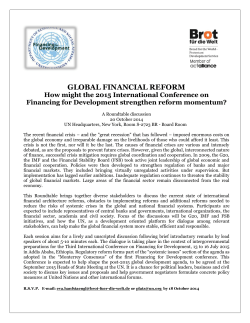
is closely tied to risk measures, such as the VIX index as also illustrated in Figure 2.
[INSERT FIGURE 2 HERE]
The left hand panel of Figure 2 plots the leverage series of the US broker dealer sector
from 1995Q4. Leverage increases up to 2007, and then falls abruptly with the onset of the
financial crisis. The right panel of Figure 2 shows how US broker dealer leverage is closely
associated with the risk measure given by the VIX index of the implied volatility in S&P
500 stock index option prices from Chicago Board Options Exchange (CBOE). The dark
squares in the scatter chart are the observations after 2007 associated with the crisis and its
aftermath.
The scatter chart adds weight to theories of bank leverage based on measured risk, such as
Value-at-Risk presented in Adrian and Shin (2010, 2014). Adrian and Shin (2014) document
that Value-at-Risk (VaR) is an important empirical determinant of financial intermediary
leverage. In turn, VaR relative to total assets (“unit VaR”) is shown to capture market risk
measures, such as the implied volatility of the equity option prices as given by the VIX. In our
setting, the unit VaR series reflects the risk environment of the recent past, which financial
intermediaries take into account when they decide on their risk exposure. The findings in
Adrian and Shin (2014) imply that financial intermediaries can be seen as following a rule
of thumb whereby they manage their balance sheets actively so as to maintain VaR equal to
their equity in the face of rapidly changing market conditions. At the same time, Bekaert
et al. (2013) have shown that risk aversion is closely tied to monetary policy actions. The
VIX can therefore be seen as the empirical link between monetary policy and bank leverage
decisions. In turn, these leverage decisions have macro implications.
The close relationship between leverage and the VIX Index also provides a point of
contact between Gourinchas and Obstfeld (2012) who point to the importance of leverage
Capital flows and the risk-taking channel of monetary policy
4
and Forbes and Warnock (2012) who have highlighted the explanatory power of the VIX
index for gross capital flows.
In the international dimension, we find evidence of monetary policy spillovers in crossborder capital flows through the banking sector. An expansionary shock to US monetary
policy increases cross-border bank capital flows through higher leverage of international
banks. Such an increase in cross-border flows is associated with a depreciation of the US
dollar over a prolonged period of time. In keeping with the earlier findings in Eichenbaum
and Evans (1995), a decline in the Fed Funds rate leads to a depreciation in the U.S. dollar
after about 14 quarters, while an increase in leverage is followed by a depreciation of the US
dollar from 3 quarters but which persists for 20 quarters or more.
Taken together, the key contribution of our paper is to show that banking sector leverage
is a candidate channel for the transmission of monetary policy to exchange rate changes
and cross-border bank capital flows. Doing so provides additional context to the delayed
overshooting puzzle. In particular, our results suggest that the delayed overshooting effect
is amplified by the banking channel. We point to the influence on US dollar exchange
rates of not only the monetary policy channel, but also of the channel working through the
behavior of financial intermediaries in the face of fluctuating risk. Given the close relationship
between leverage and measured risks, our findings bridge the domestic channel of monetary
policy studied by Bekaert et al. (2013) and the international channel of monetary policy in
Eichenbaum and Evans (1995).
Further corroboration of the importance and relevance of the banking channel in monetary transmission comes from the strength of the empirical results during our sample period
(1995 - 2007) chosen to coincide with the era of global banking expansion. For the same
VAR exercises for the sample period 1986 to 1995 that excludes the period of rapid banking
sector growth, the key impulse response relationships that drive our main conclusions no
longer hold. This difference in findings across the two periods provides further evidence in
support of the bank-to-bank transmission mechanism during the period running up to the
2008 crisis.
Our VAR exercises complement micro studies of the risk-taking channel, showing how
credit standards are influenced by the central bank policy rate.
For instance, Jim´enez,
Ongena, Peydr´o and Saurina (2012) using data from Europe find that a low policy rate
induces thinly capitalized banks to grant more loans to ex ante riskier firms. Maddaloni and
Capital flows and the risk-taking channel of monetary policy
5
Peydr´o (2011) find that low rates erode lending standards for both firms and households.
Using US survey data, Dell’Ariccia, Laeven and Suarez (2013) find that low interest rates are
associated with riskier lending according to the internal ratings used by the banks themselves.
Compared to these micro studies on lending standards, our complementary approach provides
a backdrop to the individual loan decisions by showing how risk-taking overall is affected
by monetary policy.
Our paper is part of recent active research on how exchange rates
are influenced by financial factors which inject medium term forces in addition to traditional
macroeconomic fundamentals. A good example is Gabaix and Maggiori (2014), who develop
a framework for the determination of exchange rates in financial markets via capital flows
and the risk-bearing capacity of financiers.
Our VAR exercise also complements the study of investor portfolio flows in Foot and
Ramadori (2005), who use VAR methods to decompose the transitory price impact of flows
from the permanent component of price impact. Their results show that the impact of
investor order flow on the exchange rate is persistent. In particular, investor order flows are
related to short-medium term variation in expected currency returns, while macroeconomic
fundamentals better explain long-term returns and values.
The findings in this paper paint a consistent picture of the fluctuations in “global liquidity” and what role monetary policy has in moderating global liquidity. By identifying
the mechanisms more clearly, we hope that policy debates on the global spillover effects
of monetary policy may gain a firmer footing.
The BIS report on global liquidity (BIS
(2011)) served as a catalyst for further work in this area, and our paper can be seen as one
component of the analytical follow-up to this report.
2.
Evidence from VARs
Our empirical investigation consists of recursive vector autoregressions (VAR) examining
the dynamic relationship between the CBOE VIX index of implied volatility on the S&P
index options, the real Feds Funds target rate of the US Federal Reserve, and a proxy for
the leverage of global banks. The real Fed Funds target rate is computed for the end of the
quarter as the target Fed Funds rate minus the CPI inflation rate.
The leverage of the US broker dealer sector from the US Flow of Funds series published by
6
Capital flows and the risk-taking channel of monetary policy
the Federal Reserve serves as our empirical proxy for global bank leverage.1 Since the focus
is on investigating spillover effects on cross-border bank-lending, our empirical counterpart
for global bank leverage should ideally be measured as the leverage of the broker dealer
subsidiaries of the global banks that facilitate cross-border lending. Shin (2012) shows that
the European global banks were central in banking sector capital flows in the years before
the crisis of 2008. However, the reported balance sheet data for European banks are the
consolidated numbers for the holding company that includes the much larger commercial
banking unit, rather than the wholesale investment banking subsidiary alone.
For the
reasons discussed in Adrian and Shin (2010, 2014), broker dealers and commercial banks
will differ in important ways in balance sheet management. To the extent that US broker
dealers dance to the same tune as the broker dealer subsidiaries of the European global
banks, we may expect to capture the main forces at work.
In the VAR model, we also include the US dollar exchange rate (in log differences) as a
prelude to our more detailed examination of the international dimension of the risk-taking
channel and cross-border effects.
The US dollar exchange rate is measured by the Real
Effective Exchange Rate (REER) of the US dollar, which is a trade-weighted index of the
value of the dollar, obtained from the IMF’s IFS database. An increase in REER indicates
an appreciation of the US dollar relative to its trade-weighted basket of other currencies.
The sample consists of quarterly data from the fourth quarter of 1995 to the last quarter
of 2007 in order to examine the workings of the risk-taking channel on the up-swing of the
global liquidity cycle. The fourth quarter of 2007 marks the beginning of the financial crisis,
and our empirical results turn out to be sensitive to the zero lower bound on the policy rate
after the crisis, as explained below.
Our chosen sample period coincides with the period when banking sector growth was
strong in the run-up to the 2008 crisis and conforms most closely to the model of Bruno and
Shin (2014), where the transmission of financial conditions occurs through the fluctuations
in lending across the global banking system.
1
Leverage is obtained from (1) “total liabilities” (FL664190005.Q) and (2) “total liabilities and equity”
(FL664194005.Q) of the US broker dealer sector from the Flow of Funds. Leverage is defined as 2/(2 — 1).
Capital flows and the risk-taking channel of monetary policy
7
2.1. Set-up
The selection of the number of variables carefully considers the tradeoff between using
a parsimonious model to avoid overfitting, while guarding against omitted variable bias
that can undermine the interpretation of the results of the VAR. Sims (1980) and Stock
and Watson (2001) describe the tradeoffs that are entailed in the selection of variables in
the VAR. In our case, the selection of variables is motivated by the interaction between
measured risks and banking sector leverage. Our interest is focused especially on the way
that monetary policy interacts with measured risks and the risk-taking behavior of banks.
To capture the core mechanisms that involve financial intermediaries, the model includes
both the VIX index and the broker-dealer leverage variable.
We identify the impact of shocks by writing the vector autogression in recursive form.
For the data series {yt } consisting of the vector yt of the variables of interest, the system is
specified as
A(L)yt = εt
(1)
where A(L) is a matrix of polynomial in the lag operator L, and εt is a vector of orthogonalized disturbances. For the four variable VAR, the Cholesky restrictions result in the following
exclusion restrictions on contemporaneous responses in the matrix A to fit a just-identified
model:
0
0
a11 0
a21 a22 0
0
A=
a31 a32 a33 0
a41 a42 a43 a44
(2)
The ordering of the variables imposed in the recursive form implies that the variable with
index 1 is not affected by the contemporaneous shocks to the other variables, while variable 2
is affected by the contemporaneous shock to variable 1, but not variables 3 and 4. In general,
the recursive form implies that a variable with index j is affected by the contemporaneous
shocks to variables with index i < j, but not by the contemporaneous shocks to variables
with index k > j. Thus, slower moving variables (like the Fed Funds target rate) are better
candidates to be ordered before fast moving variables like REER and the VIX Index, which
Capital flows and the risk-taking channel of monetary policy
8
adjust instantaneously to news.2 The Fed Funds target rate reflects the periodic decision
making process at the Federal Reserve and the slowly evolving implementation of monetary
policy. The order of our VAR model is also consistent with the mechanism in Bruno and
Shin (2014), where a decrease in the cost of borrowing or other risk measures is reflected
in banks’ balance sheet management. Specifically, the adjustment of broker dealer (book)
leverage will reflect the speed of the balance adjustment of market-based intermediaries and
may be characterized as intermediate sluggishness.
Formal lag selection procedures (Hannan and Quinn information criterion (HQIC) and
the Bayesian information criterion (BIC)) suggest one lag.
However, the Lagrange mul-
tiplier test for autocorrelation in the residuals of the VAR shows that a model with two
lags eliminates all serial correlation in the residuals. Therefore the VAR is specified with
two lags. A stable VAR model requires the eigenvalues to be less than one and the formal
test confirms that all the eigenvalues lie inside the unit circle.
The results display boot-
strapped bias-corrected confidence intervals based on 1000 replications with a small-sample
degree-of-freedom adjustment when estimating the error variance-covariance matrix.
2.2. Evidence from Impulse Response Functions
Figure 3 presents the impulse response functions from our four variable recursive VAR
with 90 percent confidence bands.3 The ordering of the four variables is (1) Fed Funds target
rate (2) broker dealer leverage (3) VIX and (4) US dollar REER. Figure 3 is organized so
that the rows of the matrix indicate the variable whose shock we are following and the
columns of the matrix indicate the variable whose response we are tracking. Each cell of the
tables graphs the impulse responses over 20 quarters to a one-standard-deviation variable
shock identified in the first column.
[INSERT FIGURE 3 HERE]
Figure 4 groups the key panels for the narrative. Consider first the impact of a shock to
the Fed Funds target rate, interpreted as a monetary policy shock and examine the impact
of the shock on the leverage of the US broker dealer sector.
2
The right panel of Figure 4
Some caution is necessary even here, as explained in Stock and Watson (2001), since the realism of the
assumptions underlying the recursive identification of shocks may depend on the frequency of the time series.
3
Results are robust to 95% bootstrapped confidence intervals.
Capital flows and the risk-taking channel of monetary policy
9
shows that a positive Fed Funds target rate shock leads to a decline in leverage after a fairly
long lag of around 10 quarters and remains significant until quarter 17. The impact reaches
a maximum response of -0.47 at quarter 12. When measured against the sample average of
21.94 for leverage, a one standard deviation shock to the Fed Funds rate entails a decline in
leverage to around 21.5.
The other panels reveal related aspects of the mechanism. The left panel of Figure 4
shows that tighter monetary policy raises the VIX Index from quarter 4, which corroborates
the finding in Bekaert et al. (2013) who find a similar effect on the VIX Index starting
between months 9 and 11.
Our distinctive finding is the middle panel in Figure 4, which shows that an increase in
the VIX index lowers bank leverage. This panel provides indirect support for the proposition
that the banking sector’s balance sheet management is driven by risk measures such as Valueat-Risk, as argued by Adrian and Shin (2010, 2014). Thus, the conjunction of the first two
panels tells the story underlying the final panel - of how an increase in the US dollar bank
funding costs results in a decline in bank leverage.
[INSERT FIGURE 4 HERE]
Finally, in anticipation of our examination of the international dimension to the risktaking channel, Figure 3 shows that a positive Fed Funds target rate shock leads to an
appreciation of the US dollar after a fairly long lag.
This result is consistent with the
“delayed overshooting puzzle” found in Eichenbaum and Evans (1995) who find that a contractionary shock to US monetary policy leads to persistent appreciation in nominal and
real US dollar exchange rates, with an impact that does not occur contemporaneously but
which comes between 24 and 39 months after the initial shock depending on the currency
pair considered. The incremental contribution of our findings is to show that intermediary
leverage amplifies the transmission of monetary policy to exchange rate changes.4 We will
return to this aspect in Section 3.
4
When omitting both the VIX and the broker-dealer leverage variables, the effect of Fed fund rate on
USD exchange rate is significant in the medium term. However, it is no longer significant in the long term.
This evidence is in contrast to the four-variable VAR that includes VIX and bank leverage, where bank
leverage has an effect on USD exchange rate in the medium term and monetary policy has an effect in the
long term. This result shows that the delayed overshooting effect driven by monetary policy is amplified by
the banking channel.
Capital flows and the risk-taking channel of monetary policy
10
Our sample period stops in 2007 due to the crisis, a structural break. The crisis period
presents special challenges in the VAR estimation, especially since the post-crisis period is
associated with the Fed Funds rate pressed against the zero lower bound (see Liu, Waggoner and Zha (2011) and Kilian (2011)). The VAR using an extended sample period that
encompasses the zero lower bound period show markedly weaker VAR impulse responses,
and many of the impulse response functions associated with shifts in the Fed Funds target
rate fail to show significant effects.
All the evidence points to a structural break in the
relationships driving our key macro variables.
Bekaert et al (2013) also find a similar structural break, suggesting that shifts in the
autoregressive slope parameters may also have offsetting effects on the impulse response
functions. Specifically, they find that the impact of monetary policy is quantitatively weaker
when the sample period is extended to encompass the crisis period. They argue that such a
weaker statistical power is due to both measurement problems and high volatility of the VIX.
They also find that monetary policy reacts significantly to uncertainty in some cases when
the post crisis period is included. These findings are consistent with David and Veronesi
(2014), who find that a rise in option-implied volatility predicts a subsequent decline in the
interest rates in a bivariate VAR that includes the financial crisis period. For these reasons,
the results reported in this paper should be seen as applying mainly for the boom period
preceding the onset of the crisis.
By using the VXO index, which is a precursor of the VIX index, it is possible to extend
the sample back to 1986. The VARs using this earlier sample show much smaller impact
of banking sector leverage, and the impulse responses are not statistically significant.
In
the context of banking sector developments at the relevant time, these findings confirm that
the bank-to-bank transmission mechanism operated strongly only during the period running
up to the 2008 crisis. The earlier sample period of 1986 - 1995 does not show a similarly
active role for the global banking system in the cross-border transmission of monetary policy.
Results are reported in Figure A.1 of the online Appendix.
Regulatory barriers prevented U.S. commercial banks from expanding their operations
into securities activities (Section 20 of the Glass—Steagall Act of 1933). Regulatory barriers
gradually disappeared from 1987 when the Federal Reserve authorized bank holding companies to establish subsidiaries, which could underwrite corporate debt securities up to a 5%
revenue limit. A major milestone was passed in 1995 when the House Banking Committee
Capital flows and the risk-taking channel of monetary policy
11
approved a bill that would repeal Glass—Steagall. In 1999 the Gramm-Bliley Act, also known
as the Financial Services Modernization Act, allowed bank holdings to conduct securities activities without limit in subsidiaries separate from their commercial banks. The timing of
the de-regulation fits well with our finding of a possible structural break in the mid to late
1990s.5
Overall, our initial evidence shows that during the 1995 - 2007 period, the risk-taking
channel of monetary policy operated strongly in a domestic context whereby permissive
monetary policy is followed by a period of lower measured risks and expanded bank lending
risk-capacity.
In the next section, we will investigate the international dimension of the
spillover effects of US monetary policy and how such a lower dollar funding cost results in
higher cross-border bank flows through the internal capital markets of global banks.
2.2.1.
Variance Decompositions
The above findings establish that monetary policy has a medium-run (two to three years)
impact on broker leverage and VIX, and that broker dealer leverage has a statistically significant effect on the US dollar exchange rate. The effects are not only statistically significant,
but also economically significant. Figure 5 shows what fraction of the structural variance
of the four variables in the VAR is due to monetary policy shocks or BD leverage shocks.
Monetary policy shocks account for almost 30% of the variance of VIX Index and between
10% and 20% of the variance of BD leverage at horizons longer than 10 quarters. In contrast,
monetary policy shocks are less important drivers of the variance of US dollar exchange rate
as given by REER.
[INSERT FIGURE 5 HERE]
BD leverage shocks account for more than 20% of the variance of the exchange rate and
for almost 40% of the variance of the Fed Funds rate at horizons longer than 10 quarters. BD
leverage shocks also count for about 20% of the variance of VIX at horizons longer than 15
quarters. Our variance decomposition reveals a considerable degree of interactions between
5
We are grateful to the referee for this observation.
Capital flows and the risk-taking channel of monetary policy
12
the variables in our model, and points to the importance of the leverage cycle of the global
banks as a key determinant of the transmission of monetary policy shocks.
2.2.2.
Alternative Measures of Monetary Policy Shocks
Figure 6 shows the impulse-response functions for alternative measures of monetary policy
on REER, VIX and BD-leverage in the four-variable VAR with 2 lags and 1000 bootstrapped
standard errors. The considered monetary policy shocks are residuals from a Taylor rule,
M1 growth and nominal effective Fed Funds rate.
[INSERT FIGURE 6 HERE]
The first alternative measure of monetary policy stance is the difference between the
nominal Fed Funds target rate and the Fed Funds rate implied by a backward looking
Taylor rule. The Taylor rule rate assumes the natural real Fed funds and the target inflation
rate to be 2%, while the output gap is computed as the percentage deviation of real GDP
(from the IFS) from potential GDP (from the Congressional Budget Office). As shown by
the top row of Figure 6, our qualitative conclusions when using the Fed Funds target rate
as the monetary policy shock remain unchanged.
A positive interest rate shock leads to
an appreciation of the US dollar after a lag of 10 quarters, and the relation is consistent
with a decline in banking sector leverage after around 7 quarters. In turn, the “risk-taking
channel” is clearly evident in the middle cell of the top row, where a monetary policy shock
is associated with greater measured risks after two quarters.
We consider two further alternative measure of monetary policy shocks, shown in the
second and third rows of Figure 6. One alternative measure is the growth rate of the US M1
money stock, where a positive shock to M1 corresponds to monetary policy loosening. In this
specification, the qualitative conclusions persist in the impulse responses for the exchange
rate and the banking sector leverage. The impact on the VIX dissipates more quickly than
for the other monetary shock measures.
One reason for the qualitative difference of the
M1 variable may be the greater search for safe assets during periods when markets become
turbulent, as investors seek out bank deposits rather than riskier claims.
Our third measure of monetary policy shock is the nominal effective Federal Funds rate,
which measures actual transactions prices used in the Fed Funds market of interbank lending,
rather than the Fed Funds target rate itself. Our earlier conclusions using the Fed Funds
Capital flows and the risk-taking channel of monetary policy
13
target rate are robust to this variation. To the extent that the difference between the Fed
Funds target rate and the effective Fed Funds rate are small, high frequency deviations, our
results are perhaps not surprising.
2.2.3.
Additional Robustness Checks
A series of robustness exercises for our VARs are reported in the separate online appendix
of the paper. The sensitivity of the recursive VAR to alternative orderings of the variables
is a perennial theme in VAR analysis. The selection and ordering of the variables in our
VAR follows the bank-to-bank mechanism outlined in Bruno and Shin (2014). Furthermore,
the different degrees of inertia inherent in our selected variables give some basis for the
specification of our VAR analysis (see Kilian (2011) for discussion of this point).
separate appendix to our paper displays various robustness exercises.
The
Figure A.2 of the
appendix illustrates the alternative ordering: (1) Fed Funds target rate (2) broker dealer
leverage (3) REER and (4) VIX, where the two price variables REER and VIX are switched.
Our key findings on the risk-taking channel remain unchanged to such an alternative order.
Figure A.3 in the appendix also reports the impulse responses for the VAR when the Fed
Funds rate is ordered last to investigate within-quarter policy responses of the Fed Funds
rate to VIX or bank leverage.6
In the VAR with the ordering: (1) broker dealer leverage
(2) VIX (3) REER and (4) Fed Funds target rate, our key results on the risk-taking channel
are again qualitatively unchanged.
Our results remain unchanged if the nominal effective exchange rate (NEER) replaces
the real effective exchange rate (REER), as shown in Figure A.4 in the appendix.
Our findings are also robust to the inclusion of the growth of US industrial production
in the VAR, which examines the impact of macroeconomic conditions as a backdrop to
monetary policy. Our results reported in Figure A.5 in the appendix indicate that including
industrial production does not alter the main conclusions on the mechanism of the risk-taking
channel through the leverage of the broker dealer sector.
6
We thank Chris Sims for suggesting this alternative ordering for our robustness tests.
Capital flows and the risk-taking channel of monetary policy
3.
14
International Dimension
This section focuses on the international dimension of the transmission mechanism of
monetary policy.
Taylor (2013) argued that the potential for monetary policy spillovers
operating through divergent policy interest rates has led to an enforced coordination of
interest rate policy among central banks who fear that failure to follow suit in lowering
rates would undermine other macro objectives.
The role of global banks that channel
wholesale funding across borders is perhaps the most important channel for such transmission
of financial conditions. For instance, Cetorelli and Goldberg (2012) have found that global
banks respond to changes in US monetary policy by reallocating funds between the head
office and its foreign offices, thus contributing to the international propagation of domestic
liquidity shocks.
[INSERT FIGURE 7 HERE]
Figure 7 uses data from the BIS locational banking statistics to plot the foreign currency
assets and liabilities of BIS-reporting banks, classified according to currency. The top plot
represents the US dollar-denominated assets of BIS-reporting banks in foreign currency, and
hence gives the US dollar assets of banks outside the United States.
The bottom plot
in Figure 7 gives the corresponding US dollar-denominated liabilities of banks outside the
United States. It is clear from Figure 7 that the US dollar plays a much more prominent
role in cross-border banking than does the euro, sterling or yen.
[INSERT FIGURE 8 HERE]
To gain some perspective on the size of the US dollar assets in Figure 7, compare the
total assets series next to the aggregate commercial banking sector in the United States,
which is given in Figure 8. US dollar assets of banks outside the US exceeded $10 trillion
in 2008Q1, briefly overtaking the US chartered commercial banking sector in terms of total
assets. So, the sums are substantial. It is as if an offshore banking sector of comparable
size to the US commercial banking sector is intermediating US dollar claims and obligations.
Shin (2012) shows that the European global banks account for a large fraction of the US
dollar intermediation activity that takes place outside the United States.7
7
A BIS (2010) study describes how the branches and subsidiaries of foreign banks in the United States
Capital flows and the risk-taking channel of monetary policy
15
As shown earlier by Figure 1, capital flows through the international banking system was
a very substantial proportion of total cross-border debt flows. Such banking flows have also
played a major role in the expansion of domestic lending. At the peak in 2007, for instance,
bank-to-bank cross-border liabilities accounted for 20% of total private credit and for over
30% of the percentage of global GDP. The large weight of the banking sector prior to 2008
lends weight to the bank-to-bank mechanism in Bruno and Shin (2014). Rey (2013) also
documents the rapid increase in credit flows relative to FDI and portfolio equity flows.
3.1. Structural VAR Analysis of Cross-Border Banking Flows
We now turn our attention to the cross-border dimension.
In order to address the
international dimension of monetary policy spillovers, the existing list of VAR variables
expands to include a measure of cross-border banking sector flows into our existing VAR
analysis that is consistent with the model in Bruno and Shin (2014).
In particular, the
analyisis focuses on the cross-border lending by banks to other banks, as given by the BIS
banking statistics.
The choice of our capital flow variable conforms to the mechanism in Bruno and Shin
(2014) which builds on the institutional features underpinning the international banking
system. In particular, global and local banks operate in a “double-decker” model of banking
where regional banks borrow in US dollars from global banks in order to lend to local
corporate borrowers. In turn, the global banks finance cross-border lending to regional
banks by tapping US dollar money market funds in financial centers.
In this setting, when the US dollar risk-free rate interest rate falls, the spread between
the local lending rate and the U.S. dollar funding rate increases. The resulting lower dollar
funding costs leads to an acceleration of bank capital flows and more permissive credit
conditions in recipient economies. An implication of the model is that the loosening of US
monetary policy will result in greater cross-border liabilities, with spillover effects on global
financial conditions through the bank leverage channel.
We measure international banking flows as the growth (log difference) in cross-border
borrow from money market funds and then channel the funds to their headquarters. See also Baba, McCauley
and Ramaswamy (2009), McGuire and von Peter (2009), IMF (2011) and Shin (2012), who note that in the
run-up to the crisis, roughly 50% of the assets of U.S. prime money market funds were obligations of European
banks.
Capital flows and the risk-taking channel of monetary policy
16
loans of BIS-reporting banks on banking sector counterparties, as measured by the difference between Table 7A (all borrowers) and Table 7B (non-bank borrowers) from the BIS
Locational Bank Statistics. Global banks account for most of the international exposures.
Since European banks have a pivotal role in the transmission of global liquidity (see Shin
(2012)) and the US dollar is the currency underpinning the global banking system, this variable is a good proxy for banking claims of global banks that use US dollar wholesale funding.
This measure fits our objective to capture the activities of the internationally active banks
that were instrumental in channeling dollar funding globally.
The model uses the following Cholesky ordering: (1) Fed Funds target rate (2) broker
dealer leverage (3) BIS banking flows (4) VIX and (5) US dollar REER. Capital flows reflect
the speed of balance adjustment of the intermediaries so they order between the Fed Funds
rate and the market variables, but after the broker dealer leverage. Figure 9 presents the
impulse responses together with bootstrapped bias-corrected 90% confidence bands for the
model with two lags.8 As before, Figure 9 is organized so that the rows of the matrix indicate
the shocked variable and the columns of the matrix indicate the response variable. Each
cell of the tables gives the impulse responses over 20 quarters to a one-standard-deviation
variable shock identified in the first column.
[INSERT FIGURE 9 HERE]
Figure 9 reveals how capital flows through the banking sector are an important element
of the narrative of the risk-taking channel. Figure 10 gathers six of the panels for a more
succinct summary of the relationships. The top two left panels of Figure 10 show the impact
of lower cost of borrowing (Fed Funds rate) and Value-at-Risk measures (VIX) on banking
sector leverage, as already documented in Figure 3.
[INSERT FIGURE 10 HERE]
The other panels in Figure 10 show the mechanism of how the risk taking channel of
monetary policy impact capital flows and the US dollar exchange rate through the banking
sector.
8
Results are robust to 95% bootstrapped confidence intervals.
Capital flows and the risk-taking channel of monetary policy
17
The top right panel in Figure 10 shows that an increase in broker dealer leverage leads
to an immediate marked increase in cross-border bank flows and a long term increase after
3 quarters, persisting over the entire 20 quarters. Such a vehement increase in cross-border
flows is associated with US currency depreciation that starts at quarter 3 and lasts until
quarter 11 and starts again after quarter 17 (bottom left panel). The last two panels together
show that monetary policy eventually leaves its mark on the US dollar exchange rate and
the capital flows funded by the US dollar. Figure A.6 presented in the appendix confirms
the our results are robust to an alternative ordering of the variables.
Importantly, the bank leverage effect explored here seems to be tied to the special role of
the US dollar. In fact, when replicating our results by using other currencies, the leverage
channel does not have amplification effects for the exchange rate of currencies other than the
US dollar. This provides additional illustration of the role of the US dollar as the currency
underpinning the global banking system, based on US dollar wholesale funding (see Bruno
and Shin (2014))
Overall, the empirical regularities uncovered in our VAR results show the risk-taking
channel of monetary policy and its impact on financial and real variables through bank
leverage. Bank leverage is thus the linchpin that translates lower measures of risk (lower cost
of borrowing and Value-at-Risk) into greater cross-border banking flows and local currency
appreciation.
Such empirical features corroborate the finding in Eichenbaum and Evans
(1995) that the US dollar tends to depreciate over a protracted period when the US dollar
funding cost declines.
Our complementary evidence shows that the impact of monetary
policy works through the bank leverage channel.
Our results are also consistent with the findings in Gourinchas and Obstfeld, who conduct
an empirical study using data from 1973 to 2010 and find that two factors emerge consistently
as the most robust and significant predictors of financial crises, namely a rapid increase in
leverage and a sharp real appreciation of the currency. Shularick and Taylor (2012) similarly
highlight the role of leverage in financial vulnerability, especially that associated with the
banking sector.
Capital flows and the risk-taking channel of monetary policy
4.
18
Concluding Remarks
The main contribution of our paper relative to earlier studies is in highlighting the role
of the banking sector in the cross-border transmission of monetary policy.
Our findings
underline the role of banks as intermediaries whose financing costs are closely tied to the
policy rate chosen by the central bank.
If funding costs affect decisions on how much
exposures to take on, monetary policy will then affect the economy through greater risktaking by the banking sector. Given the pre-eminent role of the U.S. dollar as the currency
that underpins the global banking system, our findings suggest that the impact of the policy
rate chosen by the Federal Reserve has an international dimension, as well as a domestic
one.
The role played by the U.S. dollar in the global banking system suggests that the value of
the U.S. dollar may thus be a bellwether for global financial conditions, as recently suggested
by Lustig, Roussanov and Verdelhan (2012) and Maggiori (2010).
More broadly, the role of the US dollar in the global banking system opens up important
questions on the transmission of financial conditions across borders. In a financial system
with interlocking claims and obligations, one party’s obligation is another party’s asset.
When global banks apply more lenient conditions on local banks, the more lenient credit
conditions are transmitted to the recipient economy. In this way, more permissive liquidity
conditions in the sense of greater availability of credit will be transmitted across borders
through the interactions of global and local banks. Calvo, Leiderman and Reinhart (1993,
1996) famously distinguished the global “push” factors for capital flows from the countryspecific “pull” factors, and emphasized the importance of external push factors in explaining
capital flows to emerging economies in the 1990s. Eickmeier, Gambacorta and Hofmann
(2013) and Chen et al. (2012) are two papers in a recent literature that has attempted
to elucidate the concept of “global liquidity” that was first formally studied by the official
sector in the BIS study on global liquidity (BIS (2011)). Conversely, during times of crises,
the deleveraging of the global banks is associated with “dollar shortages” as documented by
Baba, McCauley and Ramaswamy (2009) and McGuire and von Peter (2009).
The results in our paper suggest that further research on the impact of the risk-taking
channel of monetary policy may yield insights into the transmission of global liquidity conditions across borders. One key question is to what extent future episodes of cross-border
Capital flows and the risk-taking channel of monetary policy
19
financial spillovers will resemble the banking sector-led model examined in this paper. The
fact that banking sector leverage has been subdued since the crisis suggests that the future
channels of transmission will not be bank-driven, but instead involve alternative mechanisms
- perhaps through the market for debt securities (Shin (2013)).
One contribution of our
paper has been to establish a benchmark for comparison during a period when banking sector activity was particularly strong; alternative channels can be gauged relative to such a
benchmark.
Capital flows and the risk-taking channel of monetary policy
20
References
Adrian, T., Shin, H.S., 2010. Liquidity and Leverage. Journal of Financial Intermediation
19, 418-437.
Adrian, T., Shin, H.S., 2014. Procyclical Leverage and Value-at-Risk. Review of Financial
Studies 27 (2), 373-403.
Baba, N., Robert, N.M., Ramaswamy, S., 2009. US Dollar Money Market Funds and Non-US
Banks. BIS Quarterly Review March 2009, 65-81.
Bank for International Settlements, 2011. Global liquidity — concept, measurement and
policy implications. CGFS Papers 45, Committee on the Global Financial System
(http://www.bis.org/publ/cgfs45.pdf).
Bekaert, G., Hoerova, M., Lo Duca, M., 2013. Risk, Uncertainty and Monetary Policy.
Journal of Monetary Economics 60 (7), 771-788.
Borio, C., Zhu, H., 2012. Capital regulation, risk-taking and monetary policy: a missing
link in the transmission mechanism? Journal of Financial Stability 8 (4), 236-251.
Bruno, V., Shin, H.S., 2014. Cross-Border Banking and Global Liquidity. Forthcoming in
the Review of Economic Studies.
Calvo, G. A., Leiderman, L., Reinhart, C., 1993. Capital Inflows and Real Exchange Rate
Appreciation in Latin America: The Role of External Factors. IMF Staff Papers 40 (1),
108-151.
Calvo, G. A., Leiderman, L., Reinhart, C., 1996. Capital Flows to Developing Countries in
the 1990s: Causes and Effects. Journal of Economic Perspectives 10, Spring 1996, 123-139.
Cetorelli, N., Goldberg, L. S., 2012. Banking Globalization and Monetary Transmission.
Journal of Finance 67(5), 1811-1843.
Chen, S., Liu, P., Maechler, A., Marsh, C., Saksonovs, S., and Shin, H. S., 2012. Exploring
the dynamics of global liquidity. IMF Working Paper, WP/12/246.
David, A., Veronesi, P., 2014. Investors’ and Central Bank’s Uncertainty Embedded in Index
Options. Review of Financial Studies, 27 (6), 1661-1716.
Dell’Ariccia, G., Laeven, L., and Suarez, G., 2013. Bank Leverage and Monetary Policy’s
Risk-Taking Channel: Evidence from the United States. IMF Working Paper, WP/13/143.
Eichenbaum, M., Evans, C. L., 1995. Some Empirical Evidence on the Effects of Shocks to
Monetary Policy on Exchange Rates. Quarterly Journal of Economics 110 (4), 975-1009.
Eickmeier, S., Gambacorta, L., Hofmann, B., 2014. Understanding Global Liquidity. European Economic Review 68, 1-18.
Capital flows and the risk-taking channel of monetary policy
21
Forbes, K. J., Warnock, F. E., 2012. Capital Flow Waves: Surges, Stops, Flight and Retrenchment. Journal of International Economics 88 (2), 235-251.
Froot, K., Ramadori, T., 2005. Currency Returns, Intrinsic Value, and Institutional-Investor
Flows. Journal of Finance 60 (3), 1535 - 1566.
Gabaix, X., Maggiori, M., 2014. International Liquidity and Exchange Rate Dynamics.
NBER Working Paper, No. w19854.
Gourinchas, P. O., Maurice, O., 2012. Stories of the Twentieth Century for the Twenty-First.
American Economic Journal: Macroeconomics 4 (1), 226-65.
Jim´enez, G., Ongena, S., Peydr´o, J.-L., Saurina, J., 2014. Hazardous Times for Monetary
Policy: What Do Twenty-Three Million Bank Loans Say about the Effects of Monetary
Policy on Credit Risk-Taking? Econometrica 82 (2), 463-505.
Kilian, L., 2011. Structural Vector Autoregressions. University of Michigan, mimeo.
Liu, Z., Waggoner, D., Zha, T., 2011. Sources of Macroeconomic Fluctuations: A RegimeSwitching DSGE Approach. Quantitative Economics 2 (2), 251-301.
Lustig, H. N., Nikolai, L. R., Adrien, V., 2014. Countercyclical Currency Risk Premia.
Journal of Financial Economics, 111 (3), 527-553.
Lund-Jensen, K., 2012. Monitoring Systemic Risk Based on Dynamic Thresholds. IMF
Working Paper No. 12/159.
Maddaloni A., Peydro, J.-L., 2011. Bank Risk-Taking, Securitization, Supervision, and Low
Interest Rates: Evidence from Euro-Area and US Lending Standards. Review of Financial
Studies 24, 2121-2165.
Maggiori, M., 2010. The U.S. Dollar Safety Premium. Working paper, NYU.
McGuire, P., Goetz, V. P., 2009. The US Dollar Shortage in Global Banking. BIS Quarterly
Review, March 2009, Bank for International Settlements.
Rey, H., 2013. Dilemma not Trilemma: The global financial cycle and monetary policy
independence. Jackson Hole Economic Symposium.
Schularick, M., Taylor, A. M., 2012. Credit Booms Gone Bust: Monetary Policy, Leverage
Cycles, and Financial Crises, 1870-2008. American Economic Review 102, 1029-61.
Shin, H. S., 2012. Global Banking Glut and Loan Risk Premium. Mundell-Fleming Lecture,
IMF Economic Review 60 (2), 155-192.
Shin, H. S., 2013. The Second Phase of Global Liquidity and Its Impact on Emerging
Economies. Remarks at 2013 Federal Reserve Bank of San Francisco Asia Economic Policy
Conference.
Capital flows and the risk-taking channel of monetary policy
22
Sims, C. A., 1980. Macroeconomic and Reality. Econometrica 48, 1-48.
Stock, J. H., Watson, M. W., 2001. Vector Autoregressions. Journal of Economic Perspectives 15, 101-115.
Taylor, J. B., 2013. International Monetary Coordination and the Great Deviation. Journal
of Policy Modeling 35 (3), 463-472.
23
Capital flows and the risk-taking channel of monetary policy
Bank to Bank Liabilities as Percentage of Private Credit
Percent of Private Credit
Trillion US dollars
Categories of Cross-border Liabilities by Counterparty (All countries)
45.0
40.0
Non-bank to Non-bank
35.0
Non-bank to Bank
30.0
Bank to Non-bank
25.0
Bank to Bank
20.0
25%
All
Developed
20%
Developing
15%
10%
15.0
10.0
5%
5.0
Figure 1: Cross-border liabilities by type of counterparty. Left panel shows cross-border debt liabilities by pairwise classification of borrower and lender. “Bank to bank” refers to cross-border claims of banks
on other banks (BIS banking statistics table 7A minus 7B). “Bank to non-bank” refers to cross-border claims
of banks on non-banks (BIS table 7B). Claims of non-banks are from BIS international debt security statistics, tables 11A and 11B). The right panel shows cross-border bank-to-bank debt liabilities as percentage of
total private credit in recipient economy. GDP and private credit data are from the World Bank.
2012
2011
2010
2009
2008
2007
2006
2005
2004
2003
2002
2001
2000
1999
1998
1997
2012
2011
2010
2009
2008
2007
2006
2005
2004
2003
2002
2001
2000
1999
1998
1997
1996
1995
1996
0%
1995
0.0
24
Capital flows and the risk-taking channel of monetary policy
35.0
35.0
2007Q2
30.0
BD leverage
30.0
25.0
20.0
25.0
20.0
15.0
15.0
10.0
10.0
2011Q4
2010Q4
2009Q4
2008Q4
2007Q4
2006Q4
2005Q4
2004Q4
2003Q4
2002Q4
2001Q4
2000Q4
1999Q4
1998Q4
1997Q4
1996Q4
1995Q4
5.0
2.0
2.2
2.4
2.6
2.8
3.0
3.2
3.4
3.6
3.8
4.0
log_vix(-1)
Figure 2: The left panel plots the leverage of the US broker dealer sector from the Federal Reserve’s Flow of
Funds series (1995Q4 - 2012Q2). Leverage is defined as (equity + total liabilities)/equity. The right panel
plots the scatter chart of US broker dealer leverage against the log VIX index lagged one quarter. The dark
shaded squares are the post-crisis observations after 2007Q4 (Source: Federal Reserve and CBOE)
25
Capital flows and the risk-taking channel of monetary policy
Recursive
VAR
Impact of (↓)
Ordering
1
On Fed Funds
2
On BD Leverage
1
3
4
On VIX
On US dollar REER
.05
1
.005
.5
.5
0
0
0
0
-.5
-.05
-.5
Fed Funds
-.005
-1
0
5
10
15
20
.5
0
5
10
15
0
20
1.5
5
10
15
20
5
10
15
20
0
5
10
15
20
0
5
10
15
20
10
15
20
.005
1
0
0
.01
.05
0
0
.5
-.5
-.005
0
BD Leverage
-1
-.05
0
5
10
15
20
.4
0
5
10
15
20
0
.5
.15
0
.1
.2
5
10
15
20
.005
0
0
.05
-.5
-.005
-.2
0
-1
-.4
-.01
VIX
0
5
10
15
20
0
5
10
15
20
0
1
5
10
15
20
.04
.02
.2
.02
.5
.01
0
0
0
-.2
0
-.02
US dollar
REER
-.4
-.5
0
5
10
15
20
-.04
0
5
10
15
20
-.01
0
5
10
15
20
0
5
Figure 3: Impulse response functions in recursive VAR. This figure presents estimated impulseresponse functions for the four variable recursive VAR (Fed Funds, BD leverage, VIX and REER) and 90
percent bootstrapped confidence intervals for the model with two lags, based on 1000 replications.
Impact of Fed Funds
on VIX
Impact of VIX
on BD Leverage
Impact of Fed Funds
on BD Leverage
1
.5
.05
.5
0
0
0
-.5
-.5
-.05
-1
-1
0
5
10
15
20
0
5
10
15
20
0
5
10
15
20
Figure 4: Impulse response functions in recursive VAR. This figure presents three panels from the
impulse response functions of the four variable VAR (Fed Funds, BD leverage, VIX and REER) illustrating
the impact of a Fed Funds target rate shock on the leverage of the US broker dealer sector. A positive Fed
Funds target rate shock leads to a decline in broker dealer leverage, via the fall in the VIX index. The panels
show 90 percent bootstrapped confidence intervals for the model with two lags, based on 1000 replications.
26
Capital flows and the risk-taking channel of monetary policy
Variance decomposition: impact of Fed Funds shocks
On US dollar REER
On VIX
On BD Leverage
1
1
On Fed Funds
1
1
.5
.5
.3
.2
.2
.1
.1
.07
0
0
0
0
5
10
15
20
0
5
10
15
0
0
20
5
10
15
20
0
5
10
15
20
Variance decomposition: impact of BD Leverage shocks
On US dollar REER
On VIX
On BD Leverage
On Fed Funds
1
1
1
1
.5
.4
.3
.2
.2
.1
.1
0
0
0
5
10
15
20
.2
0
0
5
10
15
20
0
0
5
10
15
20
0
5
10
15
20
Figure 5: Variance Decomposition. This figure presents variance decompositions from the four variable
VAR giving the fractions of the structural variance due to Fed Fund or Leverage shocks for the four variables
REER, VIX, BD Leverage and Fed Fund (model with 2 lags).
Capital flows and the risk-taking channel of monetary policy
27
Impact of monetary policy shocks
On Exchange Rate
On VIX
On BD Leverage
Taylor Rule residual as monetary policy shock
.01
1
.05
.5
.005
0
0
0
-.5
-1
-.005
-.05
0
5
10
15
20
0
5
10
15
0
20
5
10
15
20
10
15
20
15
20
M1 growth as monetary policy shock
.005
.05
1
0
0
.5
-.005
-.05
0
-.01
-.1
0
5
10
15
-.5
0
20
5
10
15
20
0
5
Nominal effective Fed Funds rate as monetary policy shock
.006
.5
.05
.004
0
.002
0
-.5
0
-.002
-.05
0
5
10
15
20
-1
0
5
10
15
20
0
5
10
Trillion Dollars
Figure 6: Alternative definitions of monetary policy shocks. This figure shows the impulse-response
functions and 90 percent confidence bands for alternative monetary policy shocks on REER, VIX and BDleverage in the four-variable model with two lags and 1000 bootstrapped standard errors. Monetary policy
shocks considered are residuals from a Taylor rule, M1 growth and nominal effective Fed Funds rate.
12.0
U.S. dollar assets of
banks outside US
10.0
8.0
Euro assets of banks
outside eurozone
6.0
Sterling assets of
banks outside UK
4.0
2.0
Yen assets of banks
outside Japan
0.0
-2.0
Yen liabilities of banks
outside Japan
-4.0
Sterling liabilities of
banks outside UK
-6.0
-8.0
Euro liabilities of banks
outside eurozone
-10.0
Jun.2010
Sep.2009
Dec.2008
Mar.2008
Jun.2007
Sep.2006
Dec.2005
Mar.2005
Jun.2004
Sep.2003
Dec.2002
Mar.2002
Jun.2001
Sep.2000
Dec.1999
Mar.1999
-12.0
U.S. dollar liabilities of
banks outside US
Figure 7: Foreign currency assets and liabilities of BIS reporting banks by currency (Source: BIS locational
banking statistics, Table 5A)
Capital flows and the risk-taking channel of monetary policy
Trillion
Dollars
11.0
28
2008Q1
10.0
US chartered
commercial
banks' total
financial
assets
9.0
8.0
7.0
US dollar
assets of
banks outside
US
6.0
5.0
4.0
3.0
2010Q2
2009Q1
2007Q4
2006Q3
2005Q2
2004Q1
2002Q4
2001Q3
2000Q2
1999Q1
2.0
Figure 8: US dollar foreign currency claims of BIS-reporting banks and US commercial bank total assets
(Source: Flow of Funds, Federal Reserve and BIS locational banking statistics, Table 5A)
29
Capital flows and the risk-taking channel of monetary policy
Recursive
VAR
Impact of (↓)
Ordering
1
On Fed Funds
2
3
On BD Leverage
On BIS bank flows
4
5
On VIX
On USD REER
.05
1
.005
.5
.005
.5
0
0
0
0
-.005
0
-.5
Fed Funds
-.01
-.5
0
5
10
15
20
0
5
10
15
-.05
0
20
5
10
15
-.005
20
1.5
0
5
10
15
0
20
5
10
15
20
.05
0
.005
1
.01
0
.5
0
-.5
0
BD
Leverage
0
-.005
-.05
-1
-.5
0
5
10
15
20
.4
5
10
15
20
0
5
10
15
20
0
1
.04
.05
.5
.02
0
0
0
-.05
5
10
15
20
0
5
10
15
20
0
5
10
15
20
10
15
20
10
15
20
.01
.005
.2
BIS
Bank
flows
-.01
0
0
0
-.005
-.2
-.5
0
5
10
15
.4
-.1
-.02
0
20
5
10
15
20
.5
0
5
10
15
0
20
5
10
15
20
.01
.1
.005
.2
0
0
.05
0
0
-.5
-.2
-.01
0
-.005
VIX
-.4
-1
0
5
10
15
20
0
5
10
15
20
.4
0
5
10
15
20
0
5
10
15
20
0
5
.02
.01
.02
.2
.5
.005
.01
0
0
USD
REER
0
-.005
-.4
-.01
0
5
10
15
20
0
-.02
0
-.2
0
5
10
15
20
-.04
0
5
10
15
20
-.01
0
5
10
15
20
0
5
Figure 9: Impulse response functions in recursive VAR. This figure presents estimated impulseresponse functions for the five variable structural VAR (Fed Funds, BD leverage, BIS bank flows, VIX
and REER) and 90 percent bootstrapped confidence intervals for the model with two lags, based on 1000
replications.
–––––––––––––––––––––––––––––––––––––––
––––––––––––––––––––––––––––––––––––––—
Capital flows and the risk-taking channel of monetary policy
Impact of Fed Funds
on BD Leverage
Impact of VIX
on BD Leverage
30
Impact of BD Leverage
on BIS bank flows
.5
.5
.01
0
0
0
-.5
-.5
-.01
-1
0
5
10
15
20
Impact of BD Leverage
on REER
0
5
10
15
0
20
Impact of Fed Funds
on BIS bank flows
5
10
15
20
Impact of Fed Funds
on REER
.005
.005
.005
0
0
0
-.005
-.005
-.01
0
5
10
15
20
-.005
0
5
10
15
20
0
5
10
15
20
Figure 10: Impulse response functions in recursive VAR. This figure presents six panels from the
impulse response functions of the five variable VAR (Fed Funds, BD leverage, BIS bank flows, VIX and
REER) illustrating the impact of a Fed Funds target rate shock on BIS bank capital flows and REER. A
positive Fed Funds target rate shock leads to decline in bank capital flows, via the fall in the leverage of the
banking sector. The panels show 90 percent bootstrapped confidence intervals for the model with two lags,
based on 1000 replications.


© Copyright 2026