
Member States progress towards the EU2020 targets: State of Play... A G
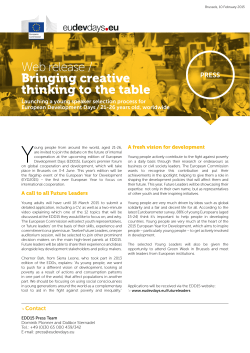
IPOL
DIRECTORATE-GENERAL FOR INTERNAL POLICIES
EGOV
ECONOMIC GOVERNANCE SUPPORT UNIT
AT A GLANCE
Member States progress towards the EU2020 targets: State of Play (November 2014)
Employment rate
R&D Target
Greenhouse Gas Emissions
Renewable Energy
(% of population aged 20 to 64 )
(% of GDP)
(% of final energy consumption)
Target
(Index 1990 = 100 for EU28
2005 = 100 for Member States)
2011
2012
2013
Target
3.00
3.00
1.50
1.00
3.00
3.00
3.00
2.00
1.21
2.00
3.00
1.40
1.53
0.50
1.50
1.90
2.30
1.80
2.00
2.50
3.76
1.70
2.70
2.00
3.00
1.20
4.00
4.00
n.n.t.:
83.2
89.5
108.8
94.6
93.2
91.3
108.8
89.1
88.4
89.6
88.9
93.2
87.1
78.5
104.4
98.8
96.5
84.3
103.2
90.6
88.4
109.3
91.0
94.8
99.2
95.4
91.1
90.0
86.7
Member states
2011
2012
2013
Target
EU (28 countries)
Belgium
Bulgaria
Czech Republic
Denmark
Germany
Estonia
Ireland
Greece
Spain
France
Croatia
Italy
Cyprus
Latvia
Lithuania
Luxembourg
Hungary
Malta
Netherlands
Austria
Poland
Portugal
Romania
Slovenia
Slovakia
Finland
Sweden
United Kingdom
68.5
67.3
62.9
70.9
75.7
76.3
70.6
63.8
59.6
62.0
69.3
57.0
61.2
73.4
66.3
66.9
70.1
60.7
61.6
77.0
75.2
64.5
68.8
62.8
68.4
65.0
73.8
79.4
73.6
68.4
67.2
63.0
71.5
75.4
76.7
72.2
63.7
55.0
59.6
69.4
55.4
61.0
70.2
68.1
68.5
71.4
62.1
63.1
77.2
75.6
64.7
66.3
63.8
68.3
65.1
74.0
79.4
74.2
68.4
67.2
63.5
72.5
75.6
77.1
73.3
65.5
52.9
58.6
69.6
57.2
59.8
67.2
69.7
69.9
71.1
63.2
64.8
76.5
75.5
64.9
65.4
63.9
67.2
65.0
73.3
79.8
74.9
75.0
73.2
76.0
75.0
80.0
77.0
76.0
69.0
70.0
74.0
75.0
62.9
67.0
75.0
73.0
72.8
73.0
75.0
70.0
80.0
77.0
71.0
75.0
70.0
75.0
72.0
78.0
80.0
n.n.t.:
21 November 2014
2011
1.97
2.15
0.55
1.56
2.97
2.80
2.34
1.53
0.67
1.32
2.19
0.75
1.21
0.46
0.70
0.90
1.41
1.20
0.70
1.89
2.68
0.75
1.46
0.49
2.43
0.67
3.64
3.22
1.69
2012
2.01
2.24
0.62
1.79
3.03
2.88
2.16
1.58
0.69
1.27
2.23
0.75
1.26
0.43
0.66
0.90
1.16
1.27
0.87
1.97
2.81
0.89
1.37
0.48
2.58
0.81
3.43
3.28
1.63
2013
2.02
2.28
0.65
1.91
3.05
2.94
1.74
n.a.
0.78
1.24
2.23
0.81
1.25
0.48
0.60
0.95
1.16
1.41
0.85
1.98
2.81
0.87
1.36
0.39
2.59
0.83
3.32
3.21
1.63
82.1
94.4
113.8
93.1
89.0
93.7
132.0
88.3
84.5
86.5
89.2
86.3
83.2
71.7
103.7
100.8
97.7
81.9
102.4
92.0
87.4
100.5
90.2
95.6
99.0
89.2
90.8
86.7
88.0
n.a.
n.a.
n.a.
n.a.
n.a.
n.a.
n.a.
n.a.
n.a.
n.a.
n.a.
n.a.
n.a.
n.a.
n.a.
n.a.
n.a.
n.a.
n.a.
n.a.
n.a.
n.a.
n.a.
n.a.
n.a.
n.a.
n.a.
n.a.
n.a.
80
85
120
109
80
86
111
80
96
90
86
111
87
95
117
115
80
110
105
84
84
114
101
119
104
113
84
83
84
Authors: Annamaria Forgacs and Zoltan Kemendy, contact: [email protected]
2011
12.90
5.20
14.60
9.30
24.00
11.60
25.60
6.60
10.90
13.20
11.30
15.40
12.30
6.00
33.50
20.20
2.90
9.10
0.70
4.30
30.80
10.40
24.50
21.20
19.40
10.30
32.70
48.80
3.80
2012
14.10
6.80
16.30
11.20
26.00
12.40
25.80
7.20
13.80
14.30
13.40
16.80
13.50
6.80
35.80
21.70
3.10
9.60
2.70
4.50
32.10
11.00
24.60
22.90
20.20
10.40
34.30
51.00
4.20
2013
Target
n.a.
n.a.
n.a.
n.a.
n.a.
n.a.
n.a.
n.a.
n.a.
n.a.
n.a.
n.a.
n.a.
n.a.
n.a.
n.a.
n.a.
n.a.
n.a.
n.a.
n.a.
n.a.
n.a.
n.a.
n.a.
n.a.
n.a.
n.a.
n.a.
20.0
13.0
16.0
13.0
30.0
18.0
25.0
16.0
18.0
20.0
23.0
20.0
17.0
13.0
40.0
23.0
11.0
14.65
10.0
14.0
34.0
15.0
31.0
24.0
25.0
14.0
38.0
49.0
15.0
PE 528.741
Energy Efficiency1
Early School Leaving
Tertiary Education
Poverty/Social exclusion2
Member states
(Primary energy consumption - in
Mtoe)
2011
2012
2013
Target
(% pop aged 18-24 w/ at most
lower secondary)
2011
2012
2013
Target
(% of pop aged 30-34 w/ tertiary
educ. attainment)
2011
2012
2013
Target
(people at risk of poverty or social
exclusion, in thousands)
2011
2012
2013
Target
EU (28 countries)
Belgium
Bulgaria
Czech Republic
Denmark
Germany
Estonia
Ireland
Greece
Spain
France
Croatia
Italy
Cyprus
Latvia
Lithuania
Luxembourg
Hungary
Malta
Netherlands
Austria
Poland
Portugal
Romania
Slovenia
Slovakia
Finland
Sweden
United Kingdom
1596.4
51.6
18.6
40.6
18.5
294.7
6.1
13.7
27.0
121.4
245.5
7.9
162.6
2.6
4.3
5.8
4.5
23.1
0.9
66.3
31.9
96.3
21.9
34.8
7.2
16.2
34.1
47.8
190.4
13.4
12.3
11.8
4.9
9.6
11.7
10.6
10.8
13.1
26.3
11.9
4.1
18.2
11.3
11.6
7.4
6.2
11.2
22.7
9.1
8.3
5.6
23.0
17.5
4.2
5.1
9.8
6.6
15.0
34.6
42.6
27.3
23.7
41.2
30.7
40.2
49.7
29.1
41.9
43.3
24.5
20.3
46.2
35.9
45.7
48.2
28.1
23.4
41.1
23.8
36.5
26.7
20.4
37.9
23.2
46.0
46.8
45.8
1583.5
48.7
17.8
40.1
17.9
297.6
6.0
13.6
25.9
121.3
246.4
7.6
155.2
2.5
4.4
5.9
4.4
21.5
0.9
67.4
31.8
93.3
20.9
33.6
6.9
15.7
32.8
48.0
195.4
n.a.
n.a.
n.a.
n.a.
n.a.
n.a.
n.a.
n.a.
n.a.
n.a.
n.a.
n.a.
n.a.
n.a.
n.a.
n.a.
n.a.
n.a.
n.a.
n.a.
n.a.
n.a.
n.a.
n.a.
n.a.
n.a.
n.a.
n.a.
n.a.
1483.0
43.7
15.8
39.6
17.8
276.6
6.5
13.9
27.1
121.6
236.3
9.19
158.0
2.8
5.4
6.5
4.5
26.6
0.8
60.7
31.5
96.4
22.5
43.0
7.3
16.2
35.9
43.4
177.6
12.7
12.0
12.5
5.5
9.1
10.6
10.3
9.7
11.4
24.7
11.5
4.2
17.6
11.4
10.6
6.5
8.1
11.5
21.1
8.8
7.6
5.7
20.5
17.4
4.4
5.3
8.9
7.5
13.6
12.0
11.0
12.5
5.4
8.0
9.9
9.7
8.4
10.1
23.6
9.7
4.5
17.0
9.1
9.8
6.3
6.1
11.8
20.8
9.2
7.3
5.6
18.9
17.3
3.9
6.4
9.3
7.1
12.4
10.0
9.5
11.0
5.5
10.0
10.0
9.5
8.0
9.7
15.0
9.5
4.0
16.0
10.0
13.4
9.0
10.0
10.0
10.0
8.0
9.5
4.5
10.0
11.3
5.0
6.0
8.0
10.0
n.n.t.
35.8
43.9
26.9
25.6
43.0
32.0
39.5
51.1
31.2
41.5
43.5
23.7
21.7
49.9
37.2
48.6
49.6
29.9
24.9
42.2
26.3
39.1
27.8
21.8
39.2
23.7
45.8
47.9
47.1
36.9
42.7
29.4
26.7
43.4
33.1
43.7
52.6
34.9
42.3
44.1
25.6
22.4
47.8
40.7
51.3
52.5
31.9
26.0
43.1
27.3
40.5
30.0
22.8
40.1
26.9
45.1
48.3
47.6
40.0
47.0
36.0
32.0
40.0
42.0
40.0
60.0
32.0
44.0
50.0
35.0
26.0
46.0
34.0
48.7
66.0
30.3
33.0
40.0
38.0
45.0
40.0
26.7
40.0
40.0
42.0
40.0
n.n.t.
121742
2271
3693
1598
1039
16074
307
1319
3403
12791
11840
1384
17112
207
821
1011
84
3051
90
2598
1407
10196
2601
8630
386
1112
949
1538
14044
124523
2356
3621
1580
1057
15909
311
1378
3795
13090
11760
1384
18194
234
731
975
95
3188
94
2492
1542
10128
2667
8907
392
1109
916
1519
15078
122649
2286
3493
1508
1059
16212
313
n.a.
3904
12630
11229
1271
17326
240
702
917
96
3285
99
2650
1572
9748
2877
8601
410
1070
854
1602
15586
-20000
-380
:
:
:
:
:
:
-450
-1400
-1900
-150
-2200
-27
:
:
-6
-450
-6
:
-235
-1500
-200
-580
-40
-170
-140
:
:
Source: Eurostat (Extraction date: 20/11/2014), Overview of Europe 2020 Targets by the Commission, 2014 National Reform Programmes
1
Member States have set indicative national targets based on different indicators translated into absolute levels of primary energy consumption in million tonnes of oil equivalent (Mtoe).
Most of the Member States have set national targets based on a reduction in the number of people living in poverty or social exclusions (compared to 2008 levels); some Member States - whose target is not included in
this column - have set national targets based on different indicators related to the reduction in poverty/social exclusion (e.g. reduction in long-term unemployment for Germany, reduction in the at risk poverty rate after
social transfers for Estonia).
2
DISCLAIMER: This document is drafted by the Economic Governance Support Unit (EGOV) of the European Parliament based on publicly available information and is provided for information purposes only.
The opinions expressed in this document are the sole responsibility of the authors and do not necessarily represent the official position of the European Parliament. Reproduction and translation for non-commercial
purposes are authorised, provided the source is acknowledged and the publisher is given prior notice and sent a copy. © European Union, 2014
PE 528.741
2


© Copyright 2026