
Annual report
ANNUAL REPORT 2014 We shall renew our industry and provide superior sustainable solutions Contents About NCC.........................................................................2 Review by the President.........................................................4 Driving forces and business environment.................................6 Strategy...............................................................................8 Value generation for stakeholders........................................16 The NCC share..................................................................18 Geographical markets........................................................22 OPERATIONS Industrial...........................................................................24 Construction and civil engineering.......................................30 Development......................................................................36 SUSTAINABILITY NCC’s sustainability efforts.................................................42 Suppliers.......................................................................... 45 Employees.........................................................................46 Construction and civil engineering process...........................48 Customers..........................................................................50 Society..............................................................................50 FINANCIAL REPORT Reports of the Board of Directors..........................................52 Consolidated income statement...........................................60 Consolidated balance sheet................................................62 Parent Company income statement.......................................64 Parent Company balance sheet............................................65 Changes in shareholders’ equity..........................................66 Cash-flow statements..........................................................68 Notes................................................................................70 Distribution of unappropriated earnings..............................104 Auditors’ Report...............................................................105 Multi-year review..............................................................106 Quarterly data.................................................................109 CORPORATE GOVERNANCE Corporate governance report............................................ 110 Report on internal control.................................................. 114 Board of Directors and Auditors......................................... 116 Group Management......................................................... 118 Financial information/contacts...........................................120 Definitions The formal Annual Accounts, which have been signed by the Board of Directors and examined by the auditors, are pages 52–104. This is a translation of the original Swedish Annual Report 2014 of NCC. In case of any interpretation issues, the Swedish Annual Report shall prevail. NCC is one of the leading construction and property development companies in Northern Europe, with sales of SEK 57 billion and 18,000 employees. With the Nordic region as its home market, NCC is active throughout the value chain – developing and building residential and commercial properties, and construct ing industrial facilities and public build ings, roads, civil engineering structures and other types of infrastructure. NCC also offers input materials used in construction and accounts for paving and road services. NCC creates future environments for working, living and communication based on responsible construction operations that result in sustainable interaction between people and the environment. “Using the best innovative and sustainable solutions, we strengthen our position as one of the leading construction companies in Northern Europe.” Peter Wågström, President and CEO. 61,379 574 2,604 0.8 Orders received, SEK M Operating profit, SEK M Cash flow before financing, SEK M 22 Return on shareholders’ equity, % Debt/equity ratio, times NCC’S MARKETS, SHARE OF TOTAL NET SALES, % Finland Sweden 47% Norway 16% 16% Russia (St. Petersburg) Estonia, Latvia <1% Denmark 13% Germany 6% 2% 2 NCC 2014 ABOUT NCC Beyond Construction We are a construction and property development company, but we do not stop at CAD drawings, rebar and concrete. We look further than that. Constantly challenging ourselves to drive the development of how we can help make tomorrow better and create superior sustainable solutions. It pushes us to listen, share ideas and to partner with others. We shall renew our industry and provide supe rior sustainable solutions Read more about NCC’s vision and strategy on p. 8. NCC is one of the largest construction companies in the Nordic region with a market share of 5 percent. FOCUS ON INNOVATION At NCC, innovation is key to being able to shape superior sustainable solutions, regardless of whether this involves our own production and work environment or construction of future residential units and offices. Notable events at NCC during 2014 included developing solutions for environmentally com patible asphalt production, launching concepts for more socially sustainable suburbs, building increasing numbers of eco-labeled housing units and initiat ing a large-scale bridge-building pro ject without affecting traffic flows. NCC 2014 ABOUT NCC Three different businesses – for profitable growth INDUSTRIAL SHARE OF NCC TOTAL Net sales, 19 (19)% Capital employed, 17 (18)% Operating profit, 17 (15)% Average number of employees 24 (23)% CONSTRUCTION AND CIVIL ENGINEERING SHARE OF NCC TOTAL Net sales, 60 (60)% Capital employed, 13 (13)% Operating profit, 44 (36)% Average number of employ, 69 (71)% DEVELOPMENT SHARE OF NCC TOTAL Net sales, 21 (21)% Capital employed, 70 (69)% Operating profit, 39 (49)% Average number of employees, 7 (6)% 3 4 NCC 2014 REVIEW BY THE PRESIDENT A stable base for for higher profitability I am pleased to summarize another positive year for NCC. We are strengthen ing our position as one of the leading construction companies in Northern Europe. Activity has been high and we have continued to focus on business in which we can be involved at an early stage of the process, thereby forming the foundation for profitability and customer satisfaction. We are now into the final year of the strategy launched in 2012. The objectives and priorities we set up back then currently appear possible to achieve. We have raised our sales in Norway, taken initiatives to estab lish a position in the civil engineering market in Fin land and expanded our housing development business. This progress has involved focused and dedicated efforts that required considerable commitment through out the organization, and has made NCC one of the most profitable companies in the industry. Meanwhile, we are aware that continuing development and stream lining are necessary to defend our position, not least in terms of our largest business, construction and civil engineering. Scope for improvement With the exception of operations in Denmark, where our construction contract model has yielded higher profitability, there is room for improvement. With lower purchasing costs, a more varied platform range, and early and frequent collaboration with customers and other partners, we will not only be able to boost project profitability but also gain even more satisfied customers. Quite simply, we have to focus on the right business. This something I have seen many favorable examples of in 2014; for example, Tvärbanan (crosstown rail link) in Stockholm, which we completed earlier than scheduled and at a lower cost, and the Skandionkliniken (proton therapy clinic) partnering project in Uppsala, where we not only met but exceeded the customer’s ambitious expectations, as well as the housing project in Aarhus, Denmark, which we completed in cooperation with the investors Topdanmark Ejendom and PenSam. Even though I am not completely exultant about the profitability of our construction operations, there are reasons to be satisfied with orders received during the year, which were the highest since 2008. There has been an influx of a wide range of projects, notably in Sweden, where the order book in early 2015 was 25 percent higher than a year earlier. A stronger construction market also provides a robust foundation for our industrial operations, since the production of stone materials and asphalt is closely linked to higher construction volumes. A mild winter in 2014 also contributed to higher activity, per mitting us to raise our margins. However, activity in our commercial property devel opment business was flatter, notably in comparison with 2013, which admittedly was something of a record year with the completion of several major projects. This meant that we entered 2014 with a slim mer portfolio. But I am happy to see that we have restocked the portfolio in the form of major new pro jects, such as Torsplan 2 in Stockholm and the SCA building in Mölndal. Record-strong housing business One operation that certainly did not lack projects was the housing development business. In 2014, we noted an all-time record-high sales figure of 6,047 housing units, and at year-end we had 7,687 homes under construction, 20 percent higher than a year earlier, and exceeding the target of at least 7,000 units. Germany, St. Petersburg and Sweden are showing the most buoyant trends. In Finland, which saw sluggish demand in the private sec tor, we increased our sales to investors. The situation in Finland reflects the substantial dif ferences in our markets despite them being in such a limited area geographically. While other Nordic coun tries continue to grow, the Finnish economy con tracted for the third consecutive year, which, of course, adversely impacted construction and civil engineering investments. The consequences of mounting unrest in Russia – in the wake of the Ukraine crisis and tumbling oil prices – are difficult NCC 2014 5 REVIEW BY THE PRESIDENT “Innovative thinking characterizes all our operations, and is a significant factor in building tomorrow’s society.” to assess, except to say that major forces have been set in motion. However, rapid urbanization is a resilient trend that offers higher business potential. Irrespec tive of whether it is Copenhagen, Stockholm or St. Petersburg, local populations continue to rise each year, leading to a need for new housing and sustaina ble infrastructure solutions. Major responsibility As an industry leader, we have a responsibility to drive development towards a more sustainable society. Our customers demand sustainable solutions and we want those residing and working in our buildings to enjoy optimal conditions. Sustainability is a key, integral component of our business and we aim to be both a leader and a pioneer in this area. I am delighted that carbon emissions from our own operations have been reduced. We will also endeavor to serve as a role model in terms of business ethics and work environment. During the year, we initiated an extensive training program for all of our employees based on the NCC Compass, our tool to assist employees with advice and guidance on issues relating to gifts, business enter tainment, conflicts of interest and competition law. This is needed to ensure that nobody at NCC is una ware of the significance of maintaining high ethical standards in our company. Strengthening the company’s safety culture remains a top priority. I am pleased to see that since 2011 we have reduced occupational accidents by 45 percent. But more has to be done. Especially in view of the unfortunate fact that we suffered a fatal accident during the past year. Together, we must do everything in our power to prevent the recurrence of such a trag edy. It should be taken for granted that all NCC employees return home to their nearest and dearest every day. Tomorrow’s solutions Innovative thinking characterizes all of our operations and is a significant factor in our ability to continuously strengthen our offering and build tomorrow’s society. For example, we are focusing on: solutions that reduce the eco-footprint of our energy-intensive asphalt pro duction; innovations that facilitate and accelerate infrastructure construction in rapidly growing cities; and smart and effective housing that meets stringent environmental standards and the ever-more important social dimension. In efforts to develop innovative new solutions for our industry, we also cooperate with universities and colleges. For example, we employ seven industrial doctoral students to contribute positively to NCC’s development in projects involving maintenance-free bridges and geothermal piling. I can confirm that NCC has a good starting position for 2015. With a record-high order backlog in con struction operations, higher activity in our stone materials and asphalt production, and a new, higher level in our housing development business, conditions are favorable for continuing, positive growth. Together with a dedicated organization, I look forward to final izing a successful strategy and laying the basis for a new one, which will commence as of 2016. Solna, February 2015 Peter Wågström President and CEO 6 NCC 2014 DRIVING FORCES AND BUSINESS ENVIRONMENT Driving forces for long-term growth NCC’s operations are shaped by a number of international and industry- specific driving forces. Capitalizing on these by adapting the offering improves NCC’s ability to retain and strengthen its leading position in selected markets and create long-term, profitable growth. URBANIZATION SUSTAINABLE CONSTRUCTION There is a risk that the global use of energy for buildings and construction will continue to increase at a pace matching population growth and increasing household wealth. Accordingly, the ability to develop innovative, sustainable building solutions will be of major importance to opportunities to offset, and create resistance to, such factors as climate changes. NCC has a strong focus on sustainable construction and, for example, has participated in the development of the environmental certification system, BREEAM, in Sweden. NCC is also one of the construction companies in the Nordic region with the greatest experience of passive building projects, and all of NCC’s proprietarily built housing units are of a low-energy type. NCC also works to reduce the use of energy in existing buildings through its sustainable refurbishment concept, while continuously developing more energy-smart, climate-compatible and resource-efficient products and services, both independently and in partnership with customers. Combined with this, citizen dialogs and other social aspects are given greater scope in NCC’s solutions, both in new property projects and in the renewal of existing residential areas. The long-term objective is to be both the leader and a pioneer in this area. With forecasts indicating that nearly five billion people will live in the world’s cities in 20 years, increasingly stringent requirements are being placed on residential environments characterized by low environmental impact, security and a sustainable infrastructure. In certain cities, the pace of urbanization is currently so fast that infrastructure is being neglected. Stockholm, one of the fastest growing cities in Europe, has an acute need for a better infrastructure, more workplaces and more housing to be able to cope with the up to half a million additional people who are expected to move there by 2030. NCC develops innovative solutions that contribute to facilitating and accelerating infrastructure construction in cities, and to curtailing the environmental problems that result from increased infrastructure requirements. NCC is also working to satisfy the need for workplaces and efficient residential units on compact spaces, to meet the increasing demand for housing. DIGITALIZATION IT continues to be a productivity driver in the construction industry and, with VDC (Virtual Design and Construction), a major technology leap has been taken. VDC is used for construction projects of all shapes and sizes and leads to higher quality and reduced costs in project engineering, implementation and when handing over to customers. For several years, NCC has focused on improving its VDC skills. The technology has been used in more than 650 projects and NCC is the industry leader in its use, not only in the Nordic region but also globally. NCC 2014 DRIVING FORCES AND BUSINESS ENVIRONMENT GLOBALIZATION The globalization under way in various sectors is increasingly also impacting on the construction industry. In recent years, the element of international competition has intensified in the Nordic construction market, particularly due to the increased number of major infrastructure projects. NCC’s strong position in the Nordic region provides a solid platform for cooperation with other international players, in a bid to strengthen its competitiveness and thus be able to participate in the largest projects. Globalization also increases NCC’s opportunities to engage in more efficient purchasing. THE BATTLE FOR COMPETENCIES The ability to attract and retain well-educated and skilled employees is increasing in importance for many sectors, including the construction industry. The large wave of retirements that is imminent is intensifying competition for the existing competencies, while it continues to be difficult to get students to show an interest in technical programmers, such as construction engineering. In addition, globalization entails that employers have to cover an even larger labor market. Thanks to NCC’s focus on accumulating expertise in, for example, industrial construction, sustainable construction and VDC, the company has a competitive edge in the battle for the best employees. MARKET The Nordic construction market generated sales of SEK 1,237 billion (1,168) in 2014. NCC is one of the largest players, with a market share of 5 percent. The Nordic construction market is national, highly fragmented and characterized by intense local competition. In local markets, NCC competes with thousands of small building contractors. Large-scale civil engineering projects in the Nordic region are often procured in the face of international competition from Europe’s largest construction companies, with the really major projects frequently conducted in consortia. At the Nordic level, NCC’s main competitors are Skanska and Peab of Sweden, MT Højgaard of Denmark, Veidekke and AF-Gruppen of Norway and YIT and Lemminkäinen of Finland. In Sweden, JM is a competitor in residential development. In civil engineering projects and road construction, as well as asphalt and paving in the Nordic region, central government production units, such as Svevia in Sweden, are other significant competitors. In Denmark and Finland, Colas and CRH are also competitors in asphalt and stone materials. From a Nordic perspective, only a few major players serve the property development market, with NCC as one of the market leaders. Skanska is another major player. In local markets, other players may also be significant competitors, such as YIT and SRV of Finland. TOTAL CONSTRUCTION INVESTMENTS AND GDP GROWTH % SEK M 1,250,000 2.5 1,200,000 2.0 1,150,000 1.5 1,100,000 1.0 1,050,000 0.5 1,000,000 0 2011 2012 2013 2014 Total construction investments GDP growth MARKET SHARES, NORDIC REGION The Nordic construction market is highly fragmented. NCC is one of the largest construction companies in the Nordic region with a market share of 5 percent. The Nordic construction market generated sales of approximately SEK 1,237 billion in 2014. (Source: Euroconstruct.) NCC, 5% YIT, 1% Skanska, 5% JM, 1% PEAB, 4% AF Gruppen, 1% Veidekke, 2% MT Højgaard, 1% Lemminkäinen, 2% Other, 80% 7 8 NCC 2014 STRATEGY Stable ground for profitable growth NCC’s overriding objective is to create value for customers and share holders. NCC aims to be a leading player in the markets in which it is active, to offer sustainable solutions and to be the customer’s first choice. Vision s ituations, and provide guidance when decisions have to be made. Read more at: page 43. We shall renew our industry and provide superior sustainable solutions. HONESTY Business concept – responsible enterprise NCC develops and builds future environments for working, living and communication. Supported by its values, NCC and its customers jointly identify needsbased, cost-effective and high-quality solutions that generate added value for all of NCC’s stakeholders and contribute to sustainable social development. Core values The company’s values and Code of Conduct function as the backbone for the way NCC works and operates. They also jointly serve as a compass for how employ ees are to conduct themselves and act in everyday RESPECT TRUST PIONEERING SPIRIT Organization NCC conducts integrated construction and develop ment operations in the Nordic region, Germany, E stonia, Latvia and St. Petersburg. The company has three businesses – industrial, construction and civil engineering, and development – which are organized in seven business areas, several of which with distinct geographical links. NCC’S ORGANIZATION 2015 NCC AB Industrial NCC Roads Sweden Denmark Finland Norway St. Petersburg Construction and civil engineering NCC Construction Sweden NCC Construction Denmark NCC Construction Finland Development NCC Construction Norway NCC Housing NCC Property Development Sweden Denmark Finland Norway Germany Estonia Latvia St. Petersburg Sweden Denmark Finland Norway NCC 2014 9 STRATEGY NCC’s development Strategy 2012–2015 NCC’s strategy for the period 2012–2015 was adopted during 2011. The strategy is now entering its final year and a new strategy for the period 2016–2020 will be presented during 2015. To better understand the background to the current strategy, it is important to understand NCC’s past. NCC’s journey from an unprofitable and unstruc tured company at the beginning of the 2000s to today’s profitable and market-leading operation can be divided into three phases. The first phase com prised a powerful turnaround of the business, during which profitability was restored to the industry aver age through a process of reduced costs and higher efficiency. A consolidation of operations was imple mented during the next phase. Parts of the Group that were regarded as non-core operations, and investment properties, were sold and resources were freed up for initiatives in NCC’s prioritized construction and civil engineering markets in the Nordic region. Operations were concentrated additionally and synergies real ized. The third phase, in which NCC still remains, involves the creation of profitable growth, primarily organic, through focused efforts aimed at being able to sustainably capitalize on strong global trends. “NCC aims to achieve profitable growth and be a lead ing player in the markets in which it is active.” Being a leading player entails being among the top three com panies in the industry in terms of profitability and vol umes. The aim is to primarily grow organically and in existing markets but this may be supplemented with acquisitions. Three areas are prioritized for generat ing growth: growth in Norway in all business areas, establishing a presence in the civil engineering mar ket in Finland and expansion of the housing develop ment business in all markets. The strategy has been successful. NCC is now one of the most profitable companies in the sector with a return on equity of 22 percent. In order to reach this position, NCC has focused on a number of long-term strategic key issues throughout strategy period: SALES OCH PROFIT AFTER FINANCIAL ITEMS 2003–2014 Each business implements a series of activities within the framework of the Group-wide key strategic issues. NCC has changed during the period from an unprofitable and unstructured company into a profitable company that is a leading player in its market areas. 70,000 3,000 60,000 2,500 50,000 2,000 40,000 1,500 30,000 1,000 20,000 500 10,000 0 0 04 06 08 10 12 Net sales, SEK M Profit after financial items, SEK M 14 –500 • NCC is to be the customer’s first choice • NCC is to be a leader in its markets • Construction costs at NCC must be reduced to drive organic growth • Capitalizing on NCC’s synergies in terms of both support functions and between operations • Housing development is to be a Group-wide business • NCC is to be the leading society builder of sustaina ble environments Since NCC’s three businesses have different prerequi sites for growth, different growth targets have been set for the strategy period. For the industrial opera tions and the construction and civil engineering busi ness, the target for the end of the strategy period is that sales growth will at least double the GDP growth rate. For the housing development business, the target is that the number of housing units under production will amount to at least 7,000. 10 NCC 2014 STRATEGY Prioritized areas Growth in Norway in all business areas. The Norwe gian construction and civil engineering market is large and fragmented. NCC has a strong offering and excellent opportunities to expand in all of its businesses. RECONCILIATION GROWTH TARGETS INDUSTRIAL Target: ≥2 times GDP growth STATUS IN 2012–2014: 3.3% (2xGDP=5.1%) CONSTRUCTION AND CIVIL ENGINEERING Establishing a presence in the Finnish civil engineering market Target: ≥2 times GDP growth In Finland, NCC has long had a strong position in residential and office construction, but not as strong in civil engineering and infrastructure projects. Expansion in these areas would enable NCC to have the same strength in Finland as in the rest of the Nordic region. Expansion of the housing development business in all markets An important part of NCC’s strategy is to satisfy the underlying need for new housing resulting from the powerful urbanization of the Nordic region. NCC plans to develop and build more housing for private individuals by capitalizing on more efficient con struction processes, whereby advanced internal cooperation is of importance for generating profita ble growth. STATUS IN 2012–2014: 0.8% (2xGDP=5.1%) DEVELOPMENT Target:STATUS 2014: ≥ 7,000 housing units under construction 7,687 units STATUS 2014 NCC’s growth targets apply to the period 2012–2015. With one year of the strategy period left, NCC is poised to achieve the target of at least 7,000 housing units under construction. However, both the Industrial and the Construction and civil engineering operations are below the target of doubling GDP growth. Sales in the industrial business have been adversely impacted by a lower price for oil. Orders received in construction operations were favorable during 2014 and the conditions are in place for achieving the growth target in 2015. STRATEGY 2012–2015 PROFITABLE GROWTH Customer focus Leader in NCC’s markets Costs One NCC Industrial Construction and civil engineering Sales growth ≥ double GDP growth Sales growth ≥ double GDP growth Housing development business Sustainability Development ≥ 7,000 housing units under construction. Maintained level in the property development portfolio. NCC 2014 11 STRATEGY NCC’s business model NCC’s three different yet complementary businesses, together with a leading position in selected markets, generate significant competitive advantages when, for example, complex large-scale construction projects are being procured and implemented. Three different businesses with different business logic • T he industrial business has a process-oriented focus pursued within NCC Roads’ aggregate and asphalt production. This business ties up capital in pits and quarries, as well as in aggregates and asphalt plants, which have high fixed costs. • T he construction and civil engineering business is pursued within NCC’s Construction units. This business requires little tied-up capital, has a strong cash flow and is project oriented. •T he development business is pursued within NCC Housing and NCC Property Development. This business ties up capital in properties held for future development and ongoing projects. The develop ment business is transaction oriented and faces a greater market risk than NCC’s other businesses since it takes many years to deliver a project from the time the land is initially acquired. Synergies between the businesses At NCC, operational and financial synergies exist that generate value for customers and shareholders. The operational synergies comprise the industrial busi ness’s support of the construction and civil engineer ing business by providing stone materials, asphalt, paving and road services. For major roadworks, in particular, the synergies are significant. The develop ment business also provides construction contracts to the construction units when housing and commercial properties are under development. The financial synergies mainly comprise the fact that the construction and civil engineering business usu ally generates healthy cash flows, which are invested in the development businesses, thus generating a high return over time. The industrial business and the civil engineering business usually remain relatively stable when the economy recedes, while the construction and develop ment businesses are more cyclical. NCC’S BUSINESS MODEL CUSTOMER Industrial Construction and civil engineering Operating margin and return NCC GROUP Dividend to shareholders Cash flow Development 12 NCC 2014 STRATEGY NCC’S FINANCIAL OBJECTIVES NCC’s overriding objective is to create value for customers and shareholders. For shareholders, NCC aims to generate a healthy return under financial stability. During 2014, NCC achieved the target of a return on equity of at least 20 percent and the debt/ equity ratio was far below the limit of not more than 1.5 times shareholders’ equity. NCC has a strong financial position, which creates conditions for the operations to continue to grow without compromising on profitability. RETURN ON EQUITY TARGET FULFILLMENT The return on shareholders’ equity after tax shall amount to 20 percent. The Group has achieved its objective of 20 percent in four of the past five years. In 2014, NCC achieved the objective with a return of 22 percent. During 2014, shareholders’ equity was higher and earnings were slightly lower, due to a decline in profit from property projects. Return on shareholders’ equity, % 30 25 20 15 10 5 0 2010 2011 2012 2013 2014 Target DEBT/EQUITY RATIO OUTCOME Net indebtedness, defined as interest-bearing liabilities less cash and cash equivalents and interest- bearing receivables, shall not exceed 1.5 times shareholders’ equity. This is measured at the end of every quarter. The debt/equity ratio did not exceed 1.5 at the end of any of the quarterly periods in 2014 and totaled 0.8 (0.7) at year-end. The debt/equity ratio is affected by seasonal variations. More capital was tied up in the second and third quarters due to a high pace of activity in the asphalt and civil engineering operations. During the second and the fourth quarter, dividends are paid to NCC’s shareholders. During the year, NCC continued to focus on long-term financing to satisfy future borrowing requirements. DIVIDEND POLICY DIVIDEND PROPOSAL NCC’s dividend policy is to distribute at least half of after-tax profit for the year to the shareholders. The aim of the policy is to generate a healthy return for NCC’s shareholders and to provide NCC with the potential to invest in its operations and thus ensure that future growth can be created while maintaining financial stability. The proposed dividend for the 2014 financial year is that SEK 12.00 (12.00) be paid per share, divided into two payments. The proposed dividend for 2014 corresponds to 71 percent of profit after tax. Times 1.5 1.2 0.9 0.6 0.3 0 Q1 2 3 4 2010 Q1 2 3 4 Q1 2 3 4 Q1 2 3 4 Q1 2 3 4 2011 2012 2013 2014 Debt/equity ratio Target <1.5 SEK 20 16 12 8 4 0 2010 2011 2012 2013 2014 After-tax profit Dividend 50% of after-tax profit NCC 2014 13 STRATEGY NCC’S SUSTAINABILITY TARGETS CLIMATE AND ENERGY TARGET FULFILLMENT NCC’s climate impact is to be reduced continuously and the use of energy is to be derived from renewable sources. By 2015, NCC is to reduce its carbon emissions1) by at least 20,000 tons compared with 2013, and emissions will be capped at 4 tons of CO2e/SEK M in net sales. NCC’s total carbon emissions decreased by 15,365 tons of CO2e from the level prevailing in 2013, which entails that the emissions-to-sales ratio was 4.38, a reduction compared with the year-earlier level of 4.57. The transition from fossil fuels to renewable fuels in a number of NCC’s asphalt plants has played a major role. Tton CO2e NCC is to create healthy developed environments by minimizing the use of materials that can have a harmful impact on people or the environment. By 2015, NCC is to have at least 400 housing units in production that have prepared content declarations according to the Nordic Swan Ecolabel criteria. TARGET FULFILLMENT This was the first year when NCC monitored the number of housing units whose constituent products are declared according to the Nordic Swan Ecolabel criteria. During the year, 57 housing units had this type of product declaration, and another 390 units are under production. Accordingly, the target of 400 housing units has already been achieved. 5 240,000 4 180,000 3 120,000 2 6,000 1 0 2012 1) P ertains to direct emissions from our operations, known as Scope 1 of the Greenhouse Gas Protocol, and indirect emissions from electricity and heat, Scope 2. CHEMICALS AND SUSTAINABLE CHOICES OF MATERIALS Ton CO2e/SEK M 300,000 2014 2013 0 500 400 300 200 100 0 2014 Completed Under production Target % INCREASE RESOURCE EFFICIENCY, RECYCLING AND WASTE REDUCTION Portion of mixed waste, and landfill NCC’s product development is to be characterized by resource efficiency and the operations based on circular flows. Of the total amount of waste from construction sites, not more than 10 percent may be sent to landfill, and the portion of mixed waste may not exceed 30 percent. Recycled asphalt granulate The proportion of renewable and recycled materials and components in NCC’s product range is growing steadily. By 2015, recycled asphalt granulate is to account for at least 16 percent of NCC’s total production of asphalt. 40 TARGET FULFILLMENT 30 The proportion of recycled waste increased during 2014. Mixed waste now accounts for 27 (34) percent of the total amount of waste, and 10 percent (12) is disposed of in landfills. During 2014, NCC thus achieved the target set for 2015. 20 10 0 TARGET FULFILLMENT The proportion of recycled asphalt granulate from the production of asphalt has increased steadily over the years. With the 75 plants that currently handle granulate recycling, recycled granulate accounts for 16.5 percent (15.0) of total production of hot asphalt, an increase of nearly 50 percent since 2010. The target of at least 16 percent was thereby achieved. 2013 2014 Mixed waste Landfill Target, mixed waste Target, landfill Recycled asphalt granulate, % 25 20 15 10 5 0 2010 2011 2012 2013 2014 Target WORK ENVIRONMENT TARGET FULFILLMENT Accident frequency A good work environment and a safe workplace are highly prioritized areas and NCC works systematically to eliminate the number of accidents. NCC has adopted a zero vision regarding occupational accidents. Accident frequency is calculated as the number of worksite accidents resulting in one day or more of absence from ordinary work per million worked hours. As a result of the company’s structured safety efforts, accidents at NCC’s workplaces decreased to 8.0 (10.6), a reduction of 45 percent since 2011. One fatality occurred within Construction Sweden in February 2014. 15 12 9 6 3 0 2011 2012 2013 2014 14 NCC 2014 AVSNITTSMARKERING NCC 2014 AVSNITTSMARKERING Bridge construction that is scarcely noticeable Just north of Stockholm by the E4 Expressway at Rotebro, Sweden’s busiest road junction, NCC is replacing two highway bridges. In terms of bridge engineering, this bridge-building project differs from others because NCC is not building a temporary bridge but using one of the new bridges for traffic while the old bridges are demolished and the new one is built. Subsequently, the 325-meter bridge will be moved laterally into position. This ensures that the large flow of traffic, with six lanes, is retained and that safety is high for motorists and bridge builders throughout the construction period. But what makes the project remarkable is that it is scarcely noticeable. While construction is in progress, the vehicles rush by as usual and, under the bridges, inter-city trains speed by. MAJOR GAINS FOR SOCIETY This is the first time that this solution has been used on such a large scale in Sweden. The solution contributes major gains for society in the form of reduced productivity losses, unimpacted travel time, less emissions and fewer accidents. Since costs have been reduced and the bridge process has become smoother, the Transport Administration is a very satisfied customer. Rotebro is also the first earthworks and civil engineering project in Sweden to be environmentally certified for both project engineering and execution under the international certification system CEEQUAL. By the time the project is complete in 2015, it will have answered a total of 200 environmental questions from CEEQUAL. 1 st environmental certification under CEEQUAL 325 meters long bridge will be moved in place in July 2015 15 16 NCC 2014 VALUE GENERATION FOR STAKEHOLDERS Value generation for stakeholders through continuous dialog By tracking and analyzing the trends and driving forces affecting NCC’s busi ness environment and through continuous dialog with its stakeholders, NCC can continue to generate profitable growth that also creates stakeholder value. NCC’S STAKEHOLDERS Shareholders and the financial market Society Customers NCC Suppliers NCC’s stakeholders are shareholders and the financial market, customers, suppliers, employees and other members of society. The dialog with these stakehold ers is an important basis for operations and also helps to ensure that NCC can continue to create value for its stakeholders. In day-to-day work, tens of thousands of meetings between people and a continuous exchange of ideas and experience take place that benefit us in our continued development All these meetings gener ate added value and contribute to the long-term devel opment of the operations. Shareholders and financial market NCC generates long-term value for shareholders by paying dividends and growing with a healthy return on invested capital. During 2014, the price of the NCC share rose 18 percent, and the Board proposes a divi Employees dend of SEK 12 per share. Over a five-year period, NCC has generated a total return of 183 percent for its shareholders, compared with an average return of 89 percent for the Nasdaq Stockholm exchange (SIX Return Index) during the same period. NCC regularly meets its investors, analysts, the credit market and shareholders. Shareholder dialogs take place at, for example, capital market days, Annual General Meetings, with the help of the Annual Report and through other forms of communication. In recent years, an ever greater interest in green transactions has been noted in terms of both the prod ucts delivered by NCC and also of investors wishing to find companies with a sustainable strategy. These investors require that the companies or projects that they loan to or invest in have ambitious environmental aims. As early as 2012, NCC entered into a long-term NCC 2014 17 VALUE GENERATION FOR STAKEHOLDERS borrowing agreement with the Nordic Investment Bank in an amount of SEK 500 M. This was based on the construction of energy-efficient office buildings within NCC Property Development. NCC has con cluded that this part of the investor market will grow and be an interesting addition financially, while also serving as an important driving force in efforts to guide the switch to the sustainable society. Customers NCC’s customers are central and local governments, as well as private-sector companies and private indi viduals. NCC has made a long-term commitment to contributing to its customers’ success by delivering sustainable buildings and structures. Since construc tion and civil engineering projects are complex and often extend over long periods, close cooperation and dialog with customers is required to shape more effi cient projects and processes, while ensuring that everyone works towards the same sustainable targets. Through strategic partnering, the efficiency of this cooperation can be enhanced, ensuring that the pro jects can be delivered on time, with the right quality and cost and lead to more satisfied customers. Certain customers are large clients who regularly commission NCC, while others are one-time purchas ers. Since all customers are equally important to the company, it is vital that a straightforward dialog is pur sued to ensure that customer expectations are met. NCC also regularly performs thorough market and customer satisfaction surveys to better understand the customers’ needs and preferences. When planning new residential areas, NCC sends invitations to attend information meetings and engage in dialog. Suppliers Developing sustainable and competitive purchasing is a key issue for us. Group purchases of goods and ser vices currently total about SEK 40 billion. In addition to direct purchases of materials, significant amounts of energy, consumables and various types of construc tion contracts and consulting services are purchased. On top of financial value, NCC contributes, through cooperation with suppliers, to the development of products and services and to improved processes. Since the company is a major developer, large num bers of subcontractors are commissioned, and it is essential that there are competent suppliers who can deliver what NCC requires. NCC also builds value through the transfer of competencies and various types of cooperative projects. NCC endeavors to continuously examine its suppli ers on the basis of financial, social and environmental criteria. Employees One of the key issues for NCC is attracting the best talents, while simultaneously successfully developing and retaining current employees. Competent and motivated employees lead to superior profitability and more satisfied customers. By offering competitive employment conditions, good opportunities for competency development and a pleasant and stimulating work environment, value is created for the employees. NCC implements annual employee-satisfaction surveys to identify views and obtain improvement proposals. All employees also undergo annual career development discussions. Society NCC is a large employer with international operations and participates in the development of the physical environment of communities. NCC is also engaged in social issues linked to the company’s operations. In Sweden, NCC has for several years actively participated in discussions on the condi tions for residential construction and has construc tively provided valuable insights and experiences, including proposals to speed up the decision-making and construction process. NCC also engages in con tinuous dialog with various interest organizations and participates actively in various forums and organiza tions that pursue issues linked to the company’s oper ations, such as the various Green Building Councils in the Nordic region. VALUE GENERATION FOR STAKEHOLDERS SEK M 2014 2013 56,898 57,830 –42,522 –43,484 –8,956 –8,863 Economic value generated Customers Economic value distributed Suppliers Employees Lenders State (expensed tax and social security fees) Shareholders’ equity Economic value retained 1) Proposed dividend. –370 –279 –3,211 –3,214 –1,2941) –1,294 545 696 18 NCC 2014 NCC SHARE The NCC share NCC’s shares were initially listed on the Stockholm Stock Exchange in 1988, under the Nordstjernan name. The shares are traded on Nasdaq Stockholm/Large Cap. Share performance and trading During 2014, stock markets continued to show a stable and posi tive trend. The Nasdaq Stockholm exchange ended the year up by 12 percent and an increase of 18 percent was noted for the Series B NCC share. This may be compared with the Nasdaq sector index, which rose 23 percent during the same period. The year-end price of the NCC share corresponded to market capitalization of SEK 26.7 billion. During the year, a total of about 179 million (166) NCC shares were traded in a total of 992,507 (781,139) completed transactions at a total value of SEK 40 billion (27.9). The Nasdaq Stockholm exchange accounted for 95 percent (95) of trading in Series A NCC shares. For Series B shares, Nasdaq Stockholm accounted for 49 percent (51) of trading, which means that other marketplaces accounted for 51 percent (49). The turnover rate for Series A shares was 10 percent (10) on all marketplaces and 9 percent (10) on Nasdaq Stockholm. The turnover rates for Series B shares were 214 percent (204) in total and 103 percent (104) on Nasdaq Stockholm. The turn over rate for Nasdaq Stockholm as a whole declined to 66 per cent (67) during the year. Ownership structure Nordstjernan AB is the largest NCC shareholder. During the year, Länsförsäkringar fund management, Skandia Liv and the US fund iShares joined the list of the ten largest shareholders. The proportion of foreign shareholders declined to 21 percent (22) of the share capital, with the US and UK accounting for the largest holdings. The current list of shareholders is available on www.ncc.se. SHAREHOLDER CATEGORIES, PERCENTAGE OF SHARE CAPITAL Share repurchases and conversions NCC did not buy back any shares in 2014. The company holds 592,500 Series B shares to cover its commitments under longterm incentive programs. In 1996, holders of Series A shares were provided with the opportunity to convert their Series A shares to B shares. A total of 37.8 million shares have been con verted since 1996. Written requests regarding conversion must be submitted to the Board of Directors. Dividend and dividend policy NCC’s dividend policy is to distribute at least half of profit after taxes as dividends. For 2014, the Board proposes a dividend of SEK 12.00 (12.00) per share, divided into two payments. The proposed dividend amounts to SEK 1,294 M (1,294), corre sponding to 71 percent of profit after tax. The total return in 2014 (based on the share performance and dividend paid in rela tion to the price of NCC’s share at the beginning of the year) was approximately 24 percent (64) for Series B NCC shares. The Nasdaq Stockholm average, according to Six Return Index, was 16 percent (28). THE NCC SHARE IN 2014 Total number of shares1) Swedish Mutual funds, 18% Swedish private individuals, 12% Foreign shareholders, 21% Pension savings funds,10% Insurance companies, 3% Other shareholders, 12% Series B shares 26,023,097 81,820,225 Voting rights 10 votes 1 vote Total share turnover, including late entries, millions 2.5 176.7 – of which, on Nasdaq Stockholm 2.4 85 Total value of share turnover, SEK M 554 39,500 – of which, on Nasdaq Stockholm 528 18,900 Turnover rate, % – total, all marketplaces 10 214 – on Nasdaq Stockholm 9 103 Share price at start of year, SEK 209.50 209.90 Share price at year-end, SEK 245.20 246.80 Highest price paid, SEK 249.20 248.60 Lowest price paid, SEK 198.00 197.60 Beta value 0.96 1.09 Paid-out dividend, SEK 12.00 12.00 Total return, including dividend, % 23.53 24.09 1) Excluding treasury shares. SHARE-PRICE TREND AND TURNOVER, 2014 SEK Private companies, 24% Series A shares Number of shares, thousands 275 35,000 250 28,000 225 21,000 200 14,000 175 7,000 150 Jan Feb Mar Apr May Jun NCC B Nasdaq Stockholm Jul Aug Sep Oct Nov Dec Number of shares traded in thousands Nasdaq Stockholm Construction & Materials Source: Six and Fidessa 0 NCC 2014 19 NCC SHARE FIVE-YEAR TREND IN NCC SHARES DISTRIBUTION OF SHARES BY HOLDING, DECEMBER 31, 20141) 2010 2011 2012 2013 2014 Market price at year-end, NCC B share, SEK 147.80 121.00 136.20 209.90 246.80 Market capitalization, SEK M 16,005 13,136 14,706 22,748 26,720 Earnings per share, SEK1) 14.05 12.08 17.51 18.40 Ordinary dividend, SEK 10.00 10.00 10.00 12.00 12.002) 17.01 Dividend yield, % 6.8 8.3 7.3 5.7 4.9 Total return, %3) 30 –11 21 64 24 Number of shares outstanding at year-end (millions) 108.4 108.4 108.0 107.8 107.8 Key figures per share are presented in the Multi-year review on p. 108. 1) After tax and full dilution. 2) Proposed dividend. 3) Share performance and dividend paid in relation to the price of NCC’s share at the beginning of the year 1–500 No. of shareholders Percentage of total no. of shareholders 76.7 5,437,797 5,352 12.3 4,416,464 4.1 1 001–10 000 4,234 9.7 11,340,812 10.4 10 001–100 000 396 0.9 12,368,506 11.4 100 001–1 000 000 104 0.3 32,698,133 30.7 0.1 41,581,610 38.4 100 107,843,322 100 1 000 001– 13 Total 43,524 1) Excluding treasury shares. (Source: Euroclear Sweden AB.) Percentage of Nordstjernan No. of shares on Dec. 31, 1999 63,111,682 –35,403,560 Total Series A and Series B Swedbank Robur funds 45,324,140 108,435,822 AMF Insurance & Funds 35,403,560 Norges Bank InvestmentManagement Share buybacks 2000–2013 –6,627,892 Sale of treasury shares 2005–2011 –6,627,892 6,035,392 Number of shares outstanding at Dec 31, 2013 27,708,122 Conversion of Series A to Series B shares 2014 –1,685,025 Number of shares outstanding at Dec 31, 2014 26,023,097 6,035,392 80,135,200 107,843,322 420,392 81,820,225 107,843,322 260,230,970 81,820,225 342,051,195 76 24 100 100 Percentage of voting rights Percentage of share capital Closing price Dec. 31, 2014 Market capitalization, SEK M 24 76 245.20 246.80 6,381 20,193 26,574 6.8 2.2 4,444,989 4,865,381 4.5 2.5 4,682,545 4,682,545 4.3 1.4 0.7 2,399,747 2,403,986 2.2 2,000,887 1.8 0.7 1,440,211 1,440,211 1.3 0.4 1,318,309 1,318,309 1.2 0.4 927,598 1,256,431 1.2 1.2 1,181,764 1,181,764 1.1 0.3 22,981,894 26,762,459 49,744,353 45.8 75.0 58,098,969 54.15 25.0 Länsförsäkringar fund management Skandia Liv 328,833 3,041,203 55,057,766 Total number of shares outstanding 26,023,097 81,820,225 107,843,322 Buyback of company shares Total number of shares 592,500 592,500 TOTAL RETURN, 2010–2014 SEK Number of shares, thousands SEK 300 40,000 400 225 30,000 300 150 20,000 200 75 10,000 100 0 2010 2011 NCC B Nasdaq Stockholm 2012 2013 Number of shares traded in thousands Nasdaq Stockholm Construction & Materials Source: SIX and Fidessa 2014 0 0 2010 2011 2012 NCC B SIX Return Index SIX Building & Construction (eff) Source: SIX 0.05 0.00 26,023,097 82,412,725 108,435,822 100.0 100.0 (Source: Euroclear Sweden AB.) SHARE-PRICE TREND AND TURNOVER, 2010–2014 65.1 7,426,661 1,972,457 Lannebo funds Total ten largest shareholders 23,168,178 21.4, 7,426,661 4,239 Total other Number of voting rights 968,178 Total Share Voting no. of shares capital rights 28,430 SHB funds iShares funds 1,685,025 Number Series B 22,200,000, SEB funds Conversion of Series A to Series B shares 2000–2013 5.0 33,424 OWNERSHIP STRUCTURE AT DECEMBER 31, 2014 SERIES A AND B SHARES Series B shares Percentage of share capital 501–1 000 Number Series A Series A shares No. of shares 2013 2014 20 NCC 2014 AVSNITTSMARKERING Better life in the suburbs with Bertta In Finland, like the other Nordic countries, many suburbs to major cities are in acute need of upgrading. However, because most of the properties are privately owned, it is difficult for the municipalities to pursue a refurbishment program. To solve this problem, NCC developed Bertta, a compact multi-family dwelling that can be built on a car park or a backyard. Desolate empty spaces are transformed into an attractively populated area. By selling land to NCC, the property owner also receives funds that can be used to refurbish the existing buildings. STABLE AND SOCIALLY SUSTAINABLE The mix of new-built and upgraded older buildings creates variation for the residents, which increases the purchasing power of the population thus benefiting local companies. The suburb becomes more stable and socially sustainable. The first two Bertta buildings were completed in 2014 in the Vantaa suburb of Myyrmäki. Another five buildings are under way or are planned. The reason why the Bertta concept needs so little land is that the two bottom floors are used as a parking building. If the building is erected on an existing parking lot, three stories are used as a parking building, to meet the parking needs of the new tenants. 23 Stories on which there are parking facilities are built into the buildings 25% of the population in Finnish cities lives in suburbs NCC 2014 AVSNITTSMARKERING 21 22 NCC 2014 GEOGRAPHICAL MARKETS NCC’s geographical markets NCC occupies a strong market position in all segments in Sweden. In the other Nordic countries, as well as Estonia, Latvia, Germany and St. Petersburg, NCC’s positions vary and offer potential for strengthening, both geographically and within various segments. NCC IN SWEDEN Sweden is NCC’s largest market by far and NCC is a market leader in most sectors, including civil engineering, building construction, housing development, property development and stone materials, asphalt, paving and road services. Large customer groups are central and local governments and major companies in areas including the mining industry, as well as private customers who buy housing. Orders received: 32,023 (27,560) Order backlog: 26,429 (22,366) Net sales: 26,831 (30,547) Operating profit: 1,252 (1,648) Capital employed: 8,348 (7,382) Number of employees: 9,517 (9,988) NCC IN NORWAY In Norway, NCC has a large civil engineering operation that constructs roads, tunnels, bridges and other types of infrastructure. NCC also develops and constructs offices, housing and other buildings, and has a substantial stone materials, asphalt, paving and road service operation. Large customer categories include the Norwegian central government, municipalities, property companies and other major companies. Orders received: 9,789 (9,691) Order backlog: 8,857 (7,641) Net sales: 8,989 (10,172) Operating profit: 175 (198) Capital employed: 3,938 (3,453) Number of employees: 2,348 (2,418) NCC IN DENMARK In Denmark, NCC is a major player in offices, housing and other buildings, as well as stone materials, asphalt, paving, energy improvement and road services. NCC has also developed a number of housing and property projects. Major customers include the central government, municipalities, various investors and private customers. Orders received: 8,077 (7,683) Order backlog: 8,153 (5,995) Net sales: 7,576 (5,671) Operating profit: 428 (239) Capital employed: 3,557 (3,847) Number of employees: 2,086 (2,114) NCC IN GERMANY In Germany, NCC builds housing. NCC is active in a number of selected metropolitan regions in the country. Orders received: 3,899 (3,255) Order backlog: 4,227 (3,256) Net sales: 3,170 (2,508) Operating profit: 328 (229) Capital employed: 1,268 (877) Number of employees: 715 (686) NCC 2014 GEOGRAPHICAL MARKETS NCC’s three different businesses NCC IN FINLAND NCC in Finland focuses on residential and building construction. Establishment of a civil engineering operation in Finland is in progress. NCC is a leading developer of business parks, with several projects under way in the Helsinki region. In recent years, NCC has expanded its presence in stone materials, asphalt, paving and road services. INDUSTRIAL, PAGES 24–27 STONE MATERIALS, ASPHALT, PAVING AND ROAD SERVICES Orders received: 5,736 (7,381) Order backlog: 5,343 (6,514) Net sales: 9,230 (8,181) Operating profit: 277 (267) Capital employed: 3,296 (3,039) Number of employees: 2,557 (2,786) ST. PETERSBURG NCC develops and constructs housing in St. Petersburg, Russia. NCC also has asphalt and paving operations. Orders received: 1,697 (1,290) Order backlog: 1,659 (1,800) Net sales: 913 (633) Operating profit: 148 (108) Capital employed: 852 (779) Number of employees: 402 (356) CONSTRUCTION AND CIVIL ENGINEERING, PAGES 30–35 ALL OF NCC’S CONSTRUCTION, FROM HOUSING TO INFRASTRUCTURE NCC IN THE BALTIC COUNTRIES In Estonia and Latvia, NCC constructs housing. Construction has been concentrated to the capital cities of Tallinn (Estonia) and Riga (Latvia). Orders received: 160 (118) Order backlog: 110 (89) Net sales: 157 (111) Operating loss: –4 (–11) Capital employed: 491 (527) Number of employees: 28 (12) INDUSTRIAL CONSTRUCTION AND CIVIL ENGINEERING HOUSING DEVELOPMENT PROPERTY DEVELOPMENT All amounts are stated in SEK millions (SEK M). DEVELOPMENT, PAGES 36–41 DEVELOPMENT OPERATIONS FOR HOUSING AND COMMERCIAL PROPERTIES 23 24 NCC 2014 OPERATIONS / INDUSTRIAL INDUSTRIAL – STONE MATERIALS, ASPHALT, PAVING AND ROAD SERVICES Industrial operations are conducted in the NCC Roads business area. The core operation is the production of stone materials and asphalt, as well as asphalt paving and road services. Stronger position with new organization NCC’s industrial business is based on a distinct value chain involving the production of stone materials, asphalt, paving and road services. The various parts are integrated with NCC’s construction and civil engineering operations. NCC 2014 25 OPERATIONS / INDUSTRIAL SHARE OF NCC TOTAL 2014 IN BRIEF Sales in industrial operations increased slightly in 2014, primarily as a result of higher sales of stone materials. Asphalt sales matched the 2013 level. Operating profit rose 13 percent to SEK 459 M, with the increase primarily resulting from higher earnings in road services operations. 12.1 6.2 Sales, SEK Bn 0.5 Operating profit, SEK Bn Asphalt (million tons) 28.3 Stone materials (million tons) Net sales, 19 (19)% Capital employed, 17 (18)% Operating profit, 17 (15)% Average number of employees, 24 (23)% KEY DATA SEK M Net sales Operating profit Capital employed Average no. of employees Stone materials, 1,000 tons1) Asphalt, 1,000 tons1) 2014 2013 12,153 11,999 1% 459 406 13% 3,619 3,557 2% 4,26 4,119 3% 28,272 27,395 3% 6,216 6,257 –1% Change, % 1) Sold volume The initial link in the value chain consists of a hightech industrial process in which stone materials are produced both for the building materials industry and the contractors involved in earthworks and civil engi neering. The basic stone material is extracted primar ily from proprietary quarries and is used in the pro duction of asphalt, which is the second link in the chain. The production of asphalt is an industrial pro cess that takes place in proprietary asphalt plants. The asphalt is used in various types of road surfacing in the third link, referred to as paving. The final link in the value chain is maintenance of road networks, frequently in multi-year road-service contracts. NCC delivers stone materials and asphalt to everything from garage driveways and small roads to major infrastructure projects. Deliveries are also made to other construction and civil engineering oper ations, with aggregates used when laying foundations for housing, offices and industrial sites, as well as in the concrete industry. The operations are primarily concentrated to the Nordic countries, where NCC is the leading player in the industry. Distribution between the various mar kets is relatively constant and tracks trends in the con struction market. Sweden is the largest single market, accounting for about half of sales. Asphalt and paving operations are also conducted on a smaller scale in the St. Petersburg area. Customers are found in both the private sector and in municipal and central government administrations. The private market accounts for the largest portion of the customer base. In an effort to meet the public sec tor’s need for long-term solutions, NCC offers total- package undertakings – referred to as function con tracts – which include long-term resources planning for paving and multi-year servicing and maintenance contracts for road networks. In 2014, NCC continued its long-term strategic efforts to attain local market leadership, to secure access to aggregates from proprietary quarries close THE VALUE CHAIN NCC’s industrial business is based on a distinct value chain with four steps – stone materials, asphalt production, asphalt paving and road services. The four components are linked in a highly integrated processing chain. STONE MATERIALS ASPHALT PAVING ROAD SERVICES 26 NCC 2014 OPERATIONS / INDUSTRIAL to urban areas and to increase coordination within the business area and strengthen its customer focus. NCC Roads is the market leader in the Nordic region. During the year, the business area was reor ganized into three Nordic divisions – stone materials, asphalt and road services. The change has stream lined the organization and created better conditions for a pan-Nordic approach to operations. The business area strengthened its position and leveraged the econ omies of scale provided by the Nordic organization. The divisions can focus more on business develop ment and satisfying the future needs of customers, with the ambition of becoming the customers’ first choice. STRATEGIC FOCUS AREAS 2012–2015 STRENGTHEN POSITION through increased efficiency and production of proprietary products DEVELOP POSITION in the value chain • recycling • road services EXPAND in Norway GROWTH OBJECTIVE The target for the industrial business is for sales growth during the strategy period to correspond to at least double the GDP growth rate. Products and methods for reduced environmental impact Customers are becoming increasingly environmen tally aware and are demanding more products and services with a lower environmental impact, primarily in terms of carbon dioxide. This was also shown by the results of the latest customer survey implemented by NCC in all Nordic markets towards the end of 2014. NCC focuses proactively on energy-efficiency initia tives to reduce its environmental impact. Energy-effi cient paving techniques, asphalt recycling and alterna tive fuels are some of the initiatives that have been introduced. A higher number of total-package undertakings enables more long-term and efficient resource plan ning. Lengthy contract periods facilitate optimization of asphalt paving from a lifecycle perspective, thus benefiting customers while NCC’s product develop ment moves towards more sustainable solutions. NCC has a number of accredited road-related labo ratories in the Nordic region, in which extensive R&D activities are pursued. Among other products, these facilities develop the many different types of paving that NCC produces to reduce its environmental impact. Products and methods that reduce the adverse impact on the environment have been developed and concentrated under the NCC Green Concept ® name, of which NCC Green Asphalt ® is the best known. This is a production method that results in significantly lower carbon-dioxide emissions than the conventional production of hot asphalt. ACTIVITIES IN 2014 The restructured organization for NCC Roads, with three Nordic divisions, was launched on January 1. During the year, the business area focused on capitalizing on the economies of scale that the revamped Nordic organization and the business’s market-leading position offer. In addition, work continued on key issues prioritized in recent years. Roads United – the new joint working approach and the IT system designed to boost synergism in the business area and integration with customers – was implemented throughout the Nordic countries. Operations underwent extensive technological development. Several operational areas were digitalized, with mobile solutions deployed in all markets. A Nordic-wide operational system has begun to take shape. The system will include all aspects of quality, safety and environment, thereby also facilitating complete documentation regarding customers, suppliers and subcontractors. NCC Recycling – the establishment of a network of recycling terminals for construction and civil engineering materials continued, as did efforts to further develop operations to ensure that recycling terminals can handle all types of construction waste. NCC is strengthening its position in recycling and will be able in the future to manage all of its construction waste from a natural eco-cycle approach. New technology has begun to be applied in stone materials operations in an effort to inventory and calculate material volumes in rock pits and gravel quarries. Camera drones have taken over the former manual operations. Calculating precision has improved considerably, a decisive factor for effective and efficient production planning. The drones also offer safety benefits, since steep-sided quarries represent hazardous work environments. Excavation operations (blasting) were expanded in Sweden in 2014. Machinery resources are being increasingly relocated across larger geographical areas, while substantially expanding the customer base. Capital rationalization initiatives have significantly raised production efficiency and reduced equipment utilization in asphalt operations. Higher energy conversion and asphalt granulate recycling contributed to enabling NCC to conduct operations with an ever-decreasing environmental impact. Road services – Nordic coordination aimed at enhancing internal efficiency – continued and a major strategic shift was initiated. This entails that operations do not focus solely on conventional road service contracts and other services, but also on developing a broader product portfolio that includes offerings in various service areas. One example is NCC ViaSafe ® in the safety area. NCC 2014 27 OPERATIONS / INDUSTRIAL GEOGRAPHIC MARKETS, SHARE OF NET SALES Distribution among markets is relatively constant and tracks the trend in the construction market. No major changes occurred in the distribution of net sales in relation to 2013. Sweden, 51 (50)% Denmark, 18 (18)% Finland, 11 (11)% Norway, 19 (19)% St. Petersburg, 1 (2)% PRODUCT MIX, SHARE OF NET SALES Asphalt and paving account for most of sales in the industrial operation. Of the remainder, stone materials and road s ervices represent half each. Stone materials, 17 (17)% Asphalt and paving, 64 (63)% Road services, 19 (20)% Self-draining asphalt reduces the risk of floods Climate change means that flooding and overloads of sewage systems are becoming increasingly common. NCC has developed products and methods to prevent flooding. NCC Permavej® is one example of asphalt paving that self-drains rainwater into the soil. Beneath the asphalt lies a specially developed stone materials product, NCC DrænStabil ®, with properties that ensure that the water quickly and readily penetrates the soil. CUSTOMER MIX, SHARE OF NET SALES The customer base is evenly distributed between the private sector and municipal and public-sector administrations. Central government, 26 (27)% Municipalities/county councils, 18 (19)% Private customers, 49 (47)% Internal in NCC, 7 (7)% MARKET STONE MATERIALS The aggregates market is generally highly fragmented. Securing access to stone materials from proprietary quarries requires a long-term strategy and is critical to a sustainable stone materials operation. The general trend is that it is becoming more difficult to be granted quarry permits and processing periods are getting longer. It normally takes five to ten years to open a new operation. ASPHALT AND PAVING Competition in the asphalt production market primarily consists of other nationwide companies. On the other hand, numerous local players are active in paving operations. The maintenance market for road networks is growing in pace with increased road traffic, offering potential for future asphalt operations. The energy requirements for roduction are significant and energy prices are highly volp atile. Action is being taken to reduce energy dependence and gain control over energy costs, and through initiatives to satisfy customer demands for lower carbon emissions. ROAD SERVICE The competitive pressure in road services is intensifying. Although the market was previously dominated by government-owned companies, public-sector operators are now exposed to greater competition and are losing their market shares to private players. In Finland, central government road service operations have been privatized and a similar process is under way in Norway. The only central government company remaining in this area is the Swedish one, which also has operations in Norway. 28 NCC 2014 AVSNITTSMARKERING NCC 2014 AVSNITTSMARKERING The Swan has landed in Copenhagen Those living in one of the 38 apartments in NCC’s new multi-family building at Krøyers Plads have a beautiful view of Copenhagen Harbor. They also have the privilege to stay in Denmark’s first Nordic Swan Ecolabeled housing facility. Compliance with the Nordic Swan Ecolabel entails that the building meets stringent requirements in terms of minimum eco-footprint, approved construction materials, healthy indoor environment, energy efficiency and favorable economy. NCC has 390 Nordic Swan Ecolabeled apartments and single-family homes under production. The building at Krøyers Plads is Denmark’s first and was constructed by NCC in 2014. Among other features, it offers 40 percent higher energy efficiency than required by Danish law. MILESTONE FOR A SUSTAINABLE SOCIETY The factors that prompted NCC to select the Nordic Swan Ecolabel include the fact that most individuals in the Nordic countries are aware of what it represents. The Nordic Ecolabel has been used since 1989 on such products as detergents, household appliances and toys, as well as on building materials. Swan ecolabeling for multi-family buildings, single-family homes and preschools is relatively new, and as yet not so many people know that it exists. But that will soon change. NCC has an ambitious goal and views housing construction as a significant milestone in a more sustainable community. In Denmark, the plan is that all new housing constructed in the future will be Nordic Swan labeled. Next up are row houses on Havnevigen at the Islands Brygge dock, with occupancy scheduled for November 2015. 40% 38 higher energy efficiency 38 new Nordic Swan Ecolabeled housing units 29 30 NCC 2014 OPERATIONS / CONSTRUCTION AND CIVIL ENGINEERING CONSTRUCTION AND CIVIL ENGINEERING – ALL NCC’S CONSTRUCTION, FROM HOUSING TO INFRASTRUCTURE NCC’s construction and civil-engineering operations comprise the four business areas – NCC Construction Sweden, NCC Construction Denmark, NCC Construction Finland and NCC C onstruction Norway. Leading construction operation for a sustainable society NCC’s construction units create value by understanding the customer’s operations and social development requirements. NCC is frequently involved at an early stage in the planning of new infrastructure, housing areas and public places, and can thus utilize its collective know-how in project engineering, planning and construction processes. NCC 2014 31 OPERATIONS / CONSTRUCTION AND CIVIL ENGINEERING 2014 IN BRIEF The construction market in Sweden, Norway and Denmark improved during 2014. Orders received for NCC’s construction operations rose 13 percent and the order backlog advanced SEK 6 billion to SEK 38.6 billion. Sales in 2014 fell slightly due to NCC having a lower order backlog in early 2014 compared with 2013. Operating profit improved 25 percent, with a higher operating margin in all of NCC’s construction units. 38.5 4,000 Sales, SEK Bn 1.2 umber of construction N projects Operating profit, SEK Bn SHARE OF NCC TOTAL Net sales, 60 (60)% Capital employed, 13 (13)% Operating profit, 44 (36)% Average number of employees 69 (71)% KEY DATA 2014 2013 Change, % Orders received 43,938 38,865 13% Net sales 38,472 39,163 –2% 1,215 976 25% Average no. of employees 11,952 12,853 –7% Cash flow before financing 1,275 312 309% SEK M Operating profit Each day, construction operations meet customers from both the private and public sectors. Ideas are realized in interaction with municipalities, county councils, government agencies and public-utility hous ing companies in the public sector, and with retail, industrial and service companies in the private sector. Internal partnership projects are also conducted on a daily basis with NCC Property Development, which develops commercial properties, and NCC Housing, which builds housing. The NCC Roads business area, which produces stone materials, asphalt and lays asphalt paving, is another key partner in earthworks and infrastructure projects. By understanding the customer’s operations and business, combined with an awareness of what is pos sible to develop and construct, NCC and the customer can add value – not only for the customer – but also for the customer’s customer. For example, NCC constructs many schools, public baths, offices and housing every year and thus creates opportunities for efficient processes, development of platforms and knowledge of best practice. The com bined know-how is valuable for customers who, per haps, build a school once in a decade. Platforms and processes are abstract concepts, but require that NCC adopts a systematic approach to and procedures for purchasing, Virtual Design and Con struction (VDC), production planning and risk man agement, for example. NCC adds value for clients by having well-developed planning and production processes and cooperative formats based on dialog and shared goals. When com bined with an understanding of customer processes and challenges, sustainable solutions are created offering substantial value for society. Nordic base NCC has Northern Europe as its base and conducts construction and civil engineering operations in Norway, Denmark, Sweden, Finland, St. Petersburg, Estonia and Latvia. In Sweden, NCC is one of the very largest players in the market, with a major geographic spread and a strong local presence. NCC is a leader in several strategic areas, including partnering, purchasing and VDC. Orders received are relatively evenly divided between the construction of housing, buildings and infrastructure. NCC in Norway has a long tradition of civil engi neering, with roads, tunnels and infrastructure pro viding a stable base, but also builds housing, commer cial premises and public buildings such as schools and hospitals. Norway is a definite growth area for the NCC Group. In Denmark, NCC is one of the large con struction and civil engineering companies in a frag mented market, with operations in building and civil engineering construction, residential construction and services. In line with the Group’s strategy for profitable growth, NCC is establishing civil engineering opera tions at a plant in Finland in an effort to become a comprehensive contractor in this market too. Cur rently, NCC is strong primarily in housing and office construction in Finland. St. Petersburg has a substantial underlying need for new housing. Residential production has increased sharply in recent years, making St. Petersburg one of NCC’s largest housing markets. 32 NCC 2014 OPERATIONS / CONSTRUCTION AND CIVIL ENGINEERING Cash flow permits investment NCC’s construction and civil engineering operations pursue thousands of projects in the Nordic countries. The core construction competency consists of being able to lead and coordinate suppliers, subcontractors and materials procurement in multi-varied projects, ranging all the way from mains refurbishment in multi-family buildings to major nationwide infrastructure projects. Building production ties up relatively little capital and normally generates continuous cash flow that also supports NCC’s potential to develop offices and hous ing, and to produce stone materials and asphalt, which are more capital intensive. Strategy for profitable growth The construction and civil engineering business is the backbone of NCC’s operations and contributes to the Group’s overriding objective of profitable growth and being the customer’s first choice, through efficient production, innovative capacity and market leader ship. With sustainable processes, products and ser vices, NCC enhances it market presence in well-de fined growth areas in the market. A number of key strategic areas offer potential for strengthening competitiveness. Partnering, VDC, platforms and coordinated purchasing contribute to more efficient operations and create customer value. For the past few years, NCC has focused on improv ing its skills in such areas as project development, platforms and VDC. It has also developed extensive knowledge in a form of collaboration known as part nering and is now a leader in this field. Best worldwide in partnering During 2014, NCC strengthened its organization with new partnering managers to enable it to offer strategic partnering to an even higher degree. Strategic part nering entails that the parties create long-term cus tomer relations and lengthier framework agreements extending over a number of projects. This permits the parties to work in a more structured format and share best practices, while the repetition enhances quality and reduces costs. Efficient risk management is essential Risk management is based on well-functioning shared business systems and well-developed procedures for tendering new projects. During 2014, NCC took initia tives to strengthen control of major projects. With firmer management and control, profitability is improved at the same time as the risk of project losses are reduced. An increase in the margin by one-per centage-point has a significantly larger impact on earnings than a 5–10 percent increase in volume. Knowledge is concentrated in platforms NCC’s platforms are developed to match customer requirements and provide proven functionality and cost-effective methods. NCC’s knowledge of planning, production and best practices is collected in the plat forms. By being a large construction company, NCC can develop project engineering and planning tools, and platforms. Economies of scale can also be achieved by negotiating volume discounts when pur chasing goods and services. The platforms have defined technical solutions and governing project engineering requirements, as well as instructions for choosing effective production methods. This results in production becoming more repetitive, which provides opportunities for continu ous improvement. The platform approach simplifies project engineering, purchasing and construction, ultimately enabling greater control of costs, quality and sustainability performance. STRATEGIC FOCUS AREAS, 2012–2015 ACTIVITIES IN 2014 GROWTH OBJECTIVE The target for the construction and civil engineering business is to raise sales by a minimum of twice the gdp growth rate at the end of the strategic period in 2015. 1. Infrastructure cooperation in the Nordic countries. NCC interacts across national boundaries as part of efforts to meet rising international competition in a vibrant Nordic infrastructure market. FOCUS The work environment and safety are always the foremost priorities. The development of VDC, operational systems, risk management and purchasing operations provides a basis for efficient operations and market competitiveness. EXPAND AND ESTABLISH OPERATIONS Construction and civil engineering operations in Norway are expanding through organic growth and corporate acquisitions. Meanwhile in Finland, civil engineering operations are being established as a supplement to construction activities. 2. Shared structures for operational systems in the Nordic countries with joint control and benchmark points, as well as a joint structure for risk and possibility assessment. 3. Advance positions in VDC. Undertake flagship projects in all countries. In consultation with customers, use NCC Project Studio to plan construction projects at an early stage. 4. IT management in additional central areas provides a foundation for more efficient operations and improved cooperation among the countries. NCC 2014 OPERATIONS / CONSTRUCTION AND CIVIL ENGINEERING Taina Sunnerborg, the customer at Telge Fastigheter, and Matti Virrki, NCC Best worldwide in strategic partnering Södertälje, Sweden, is the site of the world’s foremost cooperative construction project. In 2014, NCC and Telge Fastigheter received the 2014 prize for the world’s best strategic partnering collaboration. The prize was awarded in San Francisco by the International Partnering Institute, which promotes the dissemination of good partnering. Since 2008, Telge Fastigheter and NCC have cooperated in a partnering agreement covering the development and construction of 22 public-service buildings, such as schools, preschools, sports arenas and residential homes for the elderly, with a value of almost SEK 1 billion. 22 public-sector buildings since 2008 with a value of nearly SEK 1 billion GEOGRAPHIC MARKETS, SHARE OF NET SALES PRODUCT MIX, SHARE OF NET SALES CUSTOMER MIX, SHARE OF NET SALES Sweden is the largest market for NCC’s construction and civil engineering operations, accounting for 54 percent (55) of sales. Lower production in NCC Construction Sweden and NCC Construction Norway resulted in a slight adjustment of the breakdown of net sales compared with 2013. Housing continues to account for a large share of the product mix. During 2014, infrastructure rose in primarily Norway and Sweden. The segment “Other” includes schools and hospitals. Private customers remain the dominant customer category for construction and civil engineering operations. The remaining customer groups declined slightly compared with the preceding year. Sweden, 54 (55)% Infrastructure, 17 (15)% Internal in NCC, 16 (17)% Denmark, 11 (9)% Earthworks, 10 (12)% Government, 13 (14)% Finland1), 17 (17)% Housing, 25 (23)% Norway, 18 (19)% Industrial and processing plants, 8 (10)% Public utility housing companies, 8 (8)% 1) Including St. Petersburg, Estonia and Latvia. Offices, 13 (14)% Business centers, etc., 5 (5)% Other, 22 (21)% Municipalities/county councils, 22 (23)% Private customers, 41 (38)% 33 34 NCC 2014 OPERATIONS / CONSTRUCTION AND CIVIL ENGINEERING NCC has developed platforms in all business areas and can offer solutions ranging from sports centers, swimming complexes, offices and logistics facilities to roads, schools and housing. Practice makes perfect Having constructed a large number of sports halls, NCC has identified the solutions and functions that work best. This experience is embedded in the plan ning of each new project. NCC’s sports halls are based on a flexible basic design that can easily be adapted to meet the requirements of the particular sport and facil ity size. A common feature of all varieties is high built-in functionality, starting with the players’ demands and the administration’s need for smooth maintenance. Functions, technical solutions and materials offer consistently high quality and performance, thus also facilitating environmental certification, indoor climate declarations and climate offsetting in the sports hall. Nordic Swan Ecolabel housing An example of where progress in technology and sus tainability go hand in hand is NCC’s Design Duo and Design Quattro housing products. NCC can build well-designed Nordic Swan ecolabeled housing at a low price, with short construction periods. Thanks to pre-project engineering and a controlled and stand ardized construction process, the customer receives a quality-assured product with minimum energy con sumption and a predictable construction period. ordic Swan ecolabeled housing confirms the poten N tial of the full utilization of a platform-based approach. VDC helps the customer Nowadays, VDC – Virtual Design and Construction – is a self-evident aid in many projects and is about to transform the construction process. Applying VDC, NCC can initiate an early dialog with the customer and all those involved in the project for a joint review of what is to be delivered. Even before construction start-up, customers can commence planning their par ticular activities and management based on virtual, computerized models. VDC largely involves how parties to a construction project collaborate, the work methods used and how work is monitored. NCC has created the NCC Project Studio to promote and develop cooperation and quality. Aided by computer models, the project studio gathers project participants to visualize, optimize and evaluate the planned products. The result is efficient, quality-as sured and controlled products optimized throughout the entire process, from initial concept to management. NCC has used VDC in over 650 projects and is thus the industry leader, not only in the Nordic countries but also globally. VDC is used in all types of construc tion projects, from housing and building construction to civil engineering and infrastructure projects. To keep ahead, NCC provides in-house training to employees in this application area, and completed a comprehensive training course jointly with Stanford University in 2014. Passive buildings can be constructed even in an arctic climate NCC constructed a passive building in Kiruna, Sweden, where winter temperatures average minus ten degrees. Since a passive building is extremely energy efficient, it offers major personal and environmental savings in areas with a cold climate. The project was nominated for the Swedish Construction of the Year, 2015 award. 55 kWh per sqm/yr NCC 2014 35 OPERATIONS / CONSTRUCTION AND CIVIL ENGINEERING Systematic work for greater safety Work environment activities at NCC are characterized by persistence and intense determination to realize the Group’s zero vision – meaning zero accidents at work. NCC’s systematic work environment efforts encompass all processes, starting from early planning and project engineering and then extending through out the construction stage, all in a bid to minimize identified risks and manage any remaining risks in a structured manner. An efficient and smoothly functioning building pro ject is always marked by low sickness absence and few work-related injuries. Operational planning and con trol include effective supervision and monitoring of the work environment, health and safety. NCC devotes considerable resources to training, support and the monitoring of safety measures in all countries in which it operates. Attitudes toward health, safety and the environment proceed from NCC’s values and permeate the entire organization’s approach and performance in these matters. For the fourth consecutive year, NCC arranged NCC Awareness Day during which all employees par ticipate and discuss safety issues. Feedback from this event contributes to enhancing the work environment at all of the company’s workplaces. Sustainability at all stages Construction operations act on a broad front to achieve a more sustainable society. These actions range from resource conservation at the construction stage, controlling purchasing, providing energy-effi cient buildings and housing with a healthy indoor cli mate, and solutions for greater security, to ethical action in everyday work to permit life-cycle assess ments of operations. NCC continuously develops its sustainability activi ties, for which the environment, people and economy are the three pillars. NCC has well-developed methods for constructing low-energy and passive buildings, aimed at satisfying customer requirements for more energy-efficient build ings. NCC is one of the Nordic construction companies with the most extensive experience in passive housing, and all proprietary housing is of the low-energy type. By carefully analyzing completed projects NCC, lays the foundation for developing zero-energy and plus-energy housing. MARKET The recovery in Europe was uneven and growth remained low at 0.8 percent in 2014. Growth is expected to rise slightly in 2015 to 1.4 percent. The primary factor under lying the slow growth rate was weaker development in Germany. Lower demand from the euro zone, plus a fall in exports to Russia, were factors that impacted on German output and exports. Stable Swedish demand The Swedish economy showed relatively favorable growth of almost 2 percent in 2014, which is expected to rise to 3 percent in 2015. Households acted as the primary locomotive in the economy. Affordable housing loans and a stable labor market were the key growth factors. Conditions in the construction market were buoyant, with growth anticipated again for 2015. In particular, investments in new housing contributed to the positive trend in 2014. However, residential construction is expected to level off and show moderate growth in 2015. The construction of offices, commercial premises and public buildings is expected to strengthen during 2015, driven mainly by the private sector. Civil engineering construction is expected to gain momentum during 2015 when several major construction projects commence. Slow improvement in Denmark Following several years of economic crisis, Denmark is slowly making a comeback. Renewed confidence in the future is reflected in rising prices for buildings, higher job creation and lower unemployment. The Danish construction market improved during 2014 in housing and other areas. The housing segment is also expected to develop well in 2015. Healthy market activity was particularly notable in Copenhagen and Aarhus. The expectations are that demand for other types of buildings will remain at a similar level in 2015, while demand in the civil engineering segment has declined slightly. Growth has leveled out in Norway Following a period of positive development for the Norwegian economy, growth has stabilized at a moderate level due to lower investment in onshore industry, a leveling-off in the oil industry, weaker international growth and lower employment. The Norwegian construction market is expected to remain buoyant in 2015, notably in civil engineering. Housing sales in the secondary market have risen but there has been no increase yet for new housing. Other building construction is expected to grow in 2015, driven by public sector investment, while p rivate investment is expected to decline. Access to funding has improved but unrest in the oil market is a negative contributory factor. Weak trend in Finland The Finnish economy is struggling with a loss of competitiveness and structural problems in the IT, telecom and forest-products industries, compounded by higher unemployment. Construction activity in Finland is flat. In 2014, there were about 25,000 housing starts, a year-on-year decline of 10 percent, and the number is expected to fall further in 2015. Consumer demand is weak, but the activity of housing funds and other investors has supported residential construction. The civil engineering market declined in 2014 and the outlook for next year is made bleaker by factors including reduced funding for road maintenance and lower housing production. 36 NCC 2014 OPERATIONS / DEVELOPMENT DEVELOPMENT – DEVELOPMENT OPERATIONS FOR HOUSING AND COMMERCIAL PROPERTIES Development operations, which encompass housing and commercial property, are conducted in the NCC Housing and NCC Property Development business areas. Developing future residential and work environments The foundation of all professional property development involves under standing customer needs and, on this basis, creating favorable residential and work environments. Extensive urbanization and the growth of large cities continue to drive demand for sustainable cost-effective, high-quality residential and commercial properties. Flexible solutions and advanced expertise in sustainable property development contribute to NCC’s ability to provide attractive offerings to discerning customers and investors. The value chain in NCC’s housing and property devel opment business extends from project concept and analysis to land acquisition, concept development, pro duction and ultimately sales, whereby capital is released for new development projects. NCC is devel oping and constructing the communities of tomorrow. Long-term responsibility, in which the sustainability issue is high on the agenda, enhances the benefits for NCC’s customers and for municipalities and investors, by contributing to the positive development of urban areas and property values. Both development operations and residential and commercial properties are capital intensive activities, which means that NCC’s insight into the areas in the various markets that can provide maximum return is a vital factor. The development process is conducted in close cooperation with customers, municipalities, landowners, architects and other stakeholders. A customer-driven process The basis of all professional urban development involves the ability to develop solutions based on c ustomer insights and to create favorable residential environments and effective office and commercial environments. The business concept is to develop appropriate land sites for new, sustainable residential NCC 2014 37 OPERATIONS / DEVELOPMENT SHARE OF NCC TOTAL 2014 IN BRIEF Sales and earnings declined in NCC’s development operations because fewer and smaller commercial property projects were recognized in profit in 2014. During the year, however, construction was started on several new commercial property projects, primarily in Sweden. Sales and earnings in the housing development business increased in 2014. Housing sales were robust, with NCC started more housing projects. 13.3 7,687 Sales, SEK Bn 1.1 Operating profit, SEK Bn ousing units in H production 17 Commercial properties Net sales, 21 (21)% Capital employed, 70 (69)% Operating profit, 39 (49)% Average number of, employees, 7 (6)% KEY DATA 2014 2013 Net sales 13,260 13,841 –4% Orders received1) 12,480 10,921 14% SEK M Operating profit Capital employed Average no. of employees Change, % 1,087 1,318 –18% 15,292 13,847 10% 1,214 1,170 4% 1) Refers solely to NCC Housing and work environments in which buildings are adapted to customer requirements and to an area’s unique conditions and circumstances. In 2014, a keener focus on customer needs and purchasing power contributed to NCC’s capacity to offer products that match the demand. Meeting customers wherever they are and making the offering as visible and accessible as possi ble were prioritized through a greater presence in, for example, digital media. STRATEGIC FOCUS AREAS, 2012–2015 • • • • • xpand the housing development business e focused and balanced portfolio wider product mix develop critical mass in major urban areas more efficient processes Focus on additional customer segments NCC’s housing customers consist primarily of individ uals who invest in an own home. Meanwhile, investors are becoming an increasingly significant target group that is displaying greater interest in housing projects in a number of markets. Companies seeking new offices, logistics or retail parks represent an expand ing customer segment, confirming the advantage of the broad range and considerable expertise of NCC’s development operations, thereby promoting urban centers that become attractive for both residents and companies. The aim of NCC’s development operations is to stay one step ahead of the market and to identify attractive and creative development projects for municipalities and urban centers. In 2014, NCC was appointed as one of eight companies to develop an ini tial 1,500 housing units and 1,000 workplaces in Frihamnen – Gothenburg’s new urban district. Housing development NCC is the leading housing developer in Northern Europe. Housing development operations are pursued in eight geographic markets in the Nordic countries, Germany, St. Petersburg and the Baltic countries. This geographic area is experiencing continuous ACTIVITIES IN 2014 In housing development, the priority is to widen the product mix by means of more innovative concepts, such as rental apartments that, among other gains, offer the potential for higher package sales to investors. In 2014, the number of package deals increased in Sweden and other markets. In the development business of commercial properties, the focus is on raising leasing rates and identifying new projects. Seven new projects were started in 2014. Sustainable development is central in the Group’s endeavor to systematically optimize conditions for future owners and users of NCC-constructed housing and commercial premises. NCC is the Scandinavian property developer that has BREEAM certified most buildings. Over the course of 2014, accessibility to digital forums was improved for new and existing housing customers. Visualization technology enables customers to virtually visit the homes that capture their attention. NCC 2014 OPERATIONS / DEVELOPMENT opulation growth, and rising inflows into major urban p regions. There is healthy demand for sustainable, cost-effective high-quality housing that can be devel oped and sold to private customers and investors. Since the robust urbanization trend entails that growth is focused on urban centers, NCC is continu ing its strategy of operating in major metropolitan areas that display significant growth and a stable, local labor market that creates demand for new housing. Construction systems – shorter lead times, plus higher quality and lower cost In 2014, NCC continued to focus on creating shared construction systems for housing production, thus generating economies of scale due to lower costs, bulk purchasing and higher quality. By using shared con struction systems in its markets, NCC will be able to develop sustainable and attractive housing that is cost-efficient, while retaining flexibility. Process flexi bility is extremely important. When developing groupbuilt single-family dwellings or large areas of multi family dwellings, dividing the project into several smaller stages is crucial to efforts to generate time and cost savings. GEOGRAPHIC MARKETS, HOUSING UNDER PRODUCTION Sweden , 27 (23)% Denmark, 3 (5)% The diagram shows housing for both private customers and investors. In 2014, NCC had housing starts in all markets, primarily in Sweden, Germany, St. Petersburg and Finland. The share of housing units under construction rose in G ermany, St. Petersburg and Sweden as a result of healthy demand, but declined in Finland and Denmark. Norway, 3 (3)% Estonia and Latvia, 2 (2)% St. Petersburg, 28 (25)% Germany, 21 (22)% Finland, 16 (20)% PORTFOLIO OF DEVELOPMENT RIGHTS, ONGOING AND COMPLETED HOUSING Number 16,000 Of the total portfolio of 31,300 (33,200) development rights, approximately 16,800 (16,900) have made considerable progress in the development process, with building permits or detailed development plans in place, thus continuing to provide favorable potential for project starts in the years ahead. For the remaining portion of the development rights portfolio, most have a general plan for residential development in place. During 2014, the share subject to general plans declined, while the share of ongoing production and not planned increased. The successful pursuit of work on detailed development planning and creating attractive residential environments in cooperation with municipalities accounts for a major share of value generation in housing development. The percentage figure denotes NCC’s total development rights. 35% 28% 12,000 19% 8,000 9% 4,000 8% 1% n Bu i pe ldin rm g it pr On od go uc in tio g n C o pr m od ple uc te tio d n ta ile d pl a an pl De er G en ot pl al an ne d 0 N 38 HOUSING DEVELOPMENT Development rights in NCC, housing starts and housing units sold for proprietary use and to the investor market HOUSING DEVELOPMENT, PRIVATE CUSTOMERS GROUP 2014 2013 2014 2013 Housing starts 4,503 3,715 1,445 1,095 Housing units sold 4,575 3,747 1,472 1,129 Housing under construction 5,952 4,831 1,735 1,552 Sales rate, units under construction, % 58 47 100 98 Completion rate, units under construction, % Development rights of which options 2014 2013 31,300 33,200 9,800 13,200 HOUSING DEVELOPMENT, INVESTOR MARKET 45 49 65 38 Housing units recognized in profit 3,661 2,951 1,393 903 Completed housing units, not recognized in profit 438 717 Housing units for sale (ongoing and completed) 2,812 2,884 In 2014, NCC sold 6,047 (4,876) housing units, of which 1,472 (1,129) were in projects sold to investors. 3,661 (2,951) housing units for private customers were completed and recognized in profit. Market conditions in 2014 permitted a higher number of housing starts for both private customers and investors, mainly in Sweden, Germany and St. Petersburg. The total number of housing starts in 2014 rose to 5,948 (4,810), of which 1,445 (1,095) were in projects for investors. A complete and more detailed table is available on www.ncc.se NCC 2014 OPERATIONS / DEVELOPMENT A simple and secure transaction NCC aims to assist customers as soon as possible in their new home investment by offering various secu rity packages. The packages include insurance poli cies, warranties and services that protect and help customers before and after they purchase their NCC home. The various features include cover for double housing costs, unemployment or illness. Customers are increasingly finding their new home via NCC’s websites or portals linked to them. Visuali zation tools allow customers to virtually explore the housing units they are interested in and to choose their options for the selected apartment. A shared platform with a user-friendly interface has been implemented in all of NCC’s markets, adding to customer willingness to buy a new home at an early stage of a project. Sustainable housing NCC’s overall target is that those who invest in and move into an NCC home should be provided with con ditions conducive to a sustainable lifestyle, in which ecological values interact well with social and eco nomic values. Looking beyond homes, the develop ment of sustainable communities is a prerequisite for this. In Sweden, the Norra Sigtuna Town project was awarded the 2014 Green Building Award for the sus tainable development of a new district. This was given in recognition of a unique planning process, incorpo rating a vision-driven work method in which the resi dents participated right from the start in creating the new urban district. The process represents a creative mix of person-to-person dialog and professional analy ses to shape a new urban center with the right materi als, energy and water management plus high social values. A healthy indoor environment is another important feature of sustainable housing. NCC has drawn up a chemicals procurement strategy to avoid building materials that are hazardous to the environment and health. A building’s qualification for the Nordic Swan Ecolabel is confirmation that it is a low-energy build ing with a good indoor environment; that the construc tion process is eco-friendly; and that materials selec tion was made with considerable attention to public health and the environment. Since 2013, NCC in Swe den has embraced the concept of certifying multi family dwellings and single-family homes with the Nordic Swan Ecolabel. Buildings are also certified under the SGBC label. Denmark’s first Swan Ecolabe led multifamily dwelling was completed in 2014 by NCC in Copenhagen, while construction of Norway’s first Swan Ecolabeled multifamily dwelling has com menced in Bergen. Since the home user’s behavior is also a key factor in determining the eco-performance of a home, those who move into an NCC-built home receive support regarding how the unit should be utilized and cared for in a sustainable manner over the long-term. NCC also offers various tools to assist customers in con trolling and limiting their energy consumption; thus helping them to save money and reduce their environ mental impact. THE HOUSING MARKET General market conditions remained stable during 2014, a year that was characterized by a continued, gradual recovery. The most favorable market conditions were noted in Sweden, Germany and St. Petersburg and demand remains resilient, particularly in Sweden. The Russian economic climate deteriorated during the year and the GDP forecast for the country was repeatedly downgraded. St. Petersburg, however, remains vibrant. Continuing inward migration and a rising population are exerting a positive influence on the St. Petersburg market. Despite the instability characterizing Russia during the year, there is still a positive attitude towards overseas development companies and optimism among customers regarding property investments. Sales to the investment market have become an increasingly significant factor in housing development operations and, in 2014, a number of major package deals were completed in Finland, Sweden and Germany. There are definite signs in Sweden that this market area offers considerable potential for NCC. The Finnish housing market continued to weaken in 2014, due to negative GDP growth and a slackening consumer price index. A minor GDP increase is expected in 2015. Households are squeezed by unemployment and low real wage increases. Overall, housing prices have remained unchanged since 2011, but the number of housing transactions fell in 2014 and the market is expected to remain challenging in 2015. Swedish consumer confidence is growing, with a slight rise in house prices, which may be expected to bolster growth in 2015 and 2016, when unemployment is expected to decline. Market conditions in Gothenburg and Stockholm were healthy in 2014, but customers are cautious and only buy close to or after the completion of the home. The market in Copenhagen is showing a very buoyant recovery while the rest of the Danish market is slower. Property prices edged up in Norway, but falling oil prices affected the economy. The Latvian and Estonian economies continue to report the fastest growth rates among EU countries. HOUSING CONSTRUCTION IN THE NORDIC REGION, NUMBER OF CONSTRUCTION STARTS OF APARTMENTS AND SINGLE-FAMILY HOUSES In Sweden and Denmark, there were more housing starts in 2014, while fewer were started in Finland and Norway. 000s 40 30 20 10 0 Sweden 2011 Denmark 2012 Source: Euroconstruct 2013 Finland 2014 Norway 39 40 NCC 2014 OPERATIONS / DEVELOPMENT Commercial properties significance of the office for the company’s brand, access and peripheral services; values that contribute to boosting the attractiveness of the urban district and customers, while enhancing the value for investors. In 2014 – for the seventh successive year – the annual Real Estate Awards survey of the international financial magazine Euromoney deemed NCC Property Develop ment to be the best property developer in the Nordic countries. NCC Property Development develops and sells com mercial properties in defined growth markets in Sweden, Norway, Denmark and Finland. Operations focus on sustainable office, retail and logistics proper ties in attractive locations, and are characterized by expertise with in-depth understanding of specific cus tomer requirements. Since property development is a protracted process, it is crucial to build up trend insights in an effort to pre dict the demands and requirements of tomorrow’s cus tomers. Analyses must point in the right direction in terms of geographic locations and types of property that customers are likely to choose for their workplaces in five to ten years’ time. NCC works systematically in accumulating insight through, for example, future studies, customer interviews and trend monitoring. Mega-trends, such as urbanization and competition for talent, strengthen NCC’s potential to develop urban centers offering attractive offices, commercial centers and, not least, support for smoothly function ing infrastructure around growth centers. NCC guides municipalities and companies in developing and building needs-based commercial spaces. This guidance takes into consideration such values as the Customer requirements represent the core of profitable property development NCC endeavors to inspire, support and provide consul tancy to companies seeking new offices. This research-based customer offering – called Future Office – is a needs-based process through which NCC cooperates closely with the customer in creating a flexible workplace that not only create conditions for efficient operations, but also improve the work situa tion for the customer’s employees in terms of health, work environment and comfort. Customers seeking new offices have a number of selection criteria ranging from space efficiency, price, and transport links for customers and employees to needs-based workspaces close to stores, gyms and COMPLETED LEASING CONTRACTS PER SEGMENT m2 Sweden Denmark Finland Norway Total Offices 30,023 24,006 3,724 5,379 63,132 976 65 3,715 Retail Logistics 4,756 2,530 Other 552 Total 34,081 2,530 141 24,071 693 7,580 5,379 71,111 Source: NCC PROPERTY DEVELOPMENT PROJECTS1) Country (number) Completion rate, % Leasable space, square meters Leasing rate, % Sweden (5) 37 85,285 59 Denmark (7) 85 40,227 58 Finland (3) 64 24,098 40 Norway (2) 74 29,011 100 Total (17)2) 56 178,621 63 1) T he table refers to ongoing or completed property projects that have not yet been recognized as revenue. In addition to these, NCC is working on leasing (rental guarantees/supplementary sales prices) for seven previously sold and profit- recognized property projects. A complete and more detailed table is available in the year-end report on www.ncc.se 2) C ompleted and commenced projects at year-end included four projects for which sales contracts were signed but have not yet been recognized as revenue. PRODUCT MIX 2014, SHARE OF NET SALES The retail segment was the largest segment for NCC Property Development during 2014. In 2013, there were a number of major profit-recognized office projects that had no counterparts during 2014. “Other” comprises rental revenues and other revenues. Although this item accounted for a larger share of sales during 2014, it remained unchanged compared with 2013 in absolute terms. Offices, 33 (59)% Retail, 47 (28)% Logistics, 0 (0)% Other, 20 (13)% NCC 2014 41 OPERATIONS / DEVELOPMENT restaurants. Other criteria may be that the property is environmentally certified and that the location reflects the company’s brand. When NCC develops a commercial property, a detailed analysis is conducted to ensure an excellent commercial location that can offer substantial cus tomer flows, as well as premises that are optimized to sell the tenant’s products or services. For a customer that works with warehouse and logistics solutions, the location and a highly efficient goods flow are two of the most important criteria. NCC’s know-how in optimizing warehouses, combined with standardized solutions for warehouse buildings, provides highly favorable conditions for offering the optimal solution for every customer. Sustainable property development NCC is at the cutting edge of sustainable property development and eco-certifies all of its properties, while supporting the environmental work of tenants by signing green leases. Among Scandinavian prop erty developers, NCC has certified most buildings using the international BREEAM and DGNB environ mental certification systems. At year-end, 41 of NCC’s commercial properties were BREEAM certified, or were about to be. Currently, two commercial property projects in the early stage of NCC’s portfolio are seek ing BREEAM Outstanding certification, a world-class level that only about a dozen office buildings world wide have received. A somewhat different example of sustainable property development is Portland Towers in Copenhagen, which has been transformed from cement silos to modern offices. And not only people are welcome; a bird nesting-box has been built on the roof, which hopefully will attract peregrine falcons. The falcon nesting-box is included in Portland Towers’ environmental certification and is an example of how responsible property development can strengthen local flora and fauna. THE PROPERTY MARKET A town center takes shape During 2014, construction began on a modern, needsbased office property for SCA in Mölndal, near Gothenburg. NCC’s building is the starting point of the transformation underway in Mölndal town center. NCC is not only building office properties and SCA’s innovation center in the area, it is also involved in developing the Mölndal city center, with the vision of creating an attractive town center with a mix of commercial and housing facilities, as well as public places. 24,400 square meters office space The property sector is part of the global financial industry and NCC’s offering of properties as an investment competes on the same conditions as other investment alternatives. The investor market comprises national and international players, such as pension managers, property funds or property and insurance companies. The single most important criterion for potential investors is to gain an excellent yield in relation to an acceptable risk level. With continuing low yields on alternative investments, demand for attractively located, environmentally certified, space-efficient properties is on the rise and is expected to remain firm in the years ahead. All Nordic metropolitan areas continue to show strong demand for modern workplaces, leading generally to a stable price level, a trend that favors NCC. Although the healthy economic situation and stable markets of the Nordic countries attract international investors, the volumes derive primarily from domestic players with a considerable need for suitable investments. The Nordic transaction market in 2014 saw a high level of activity, with interest primarily directed towards objects in the major metropolitan centers or attractive suburbs. The transaction volume on the Nordic property market during the year totaled SEK 301 billion (184), of which Sweden accounted for SEK 148 billion (92). OFFICE MARKETS IN THE NORDIC REGION, 20141) Vacancy rate, % Rent, m2/year Required yield, % 5.0 Stockholm 6.5 2,750 SEK Oslo 4.5 2,900 NOK 5.0 12.1 1,300 DKK 4.8 9.5 270 EUR 6.7 Copenhagen Helsinki 1) Refers to the inner city. Source: Newsec 42 NCC 2014 SUSTAINABILITY The best sustainable solutions NCC’s sustainability efforts are based on the company’s vision – to renew our industry and provide superior sustainable solutions. Through working together with customers and suppliers, and through active engagement in society, the company contributes to a sustainable future. As a leading industry player, NCC is involved in and driving development toward a more sustainable soci ety. This means actively contributing to reduced use of resources and the development of new technical solutions, products and work methods that contribute to society’s sustainable development in terms of eco nomic, environmental and social values. This is also aimed at breaking traditional work patterns and creat ing new collaborative paths with other players and stakeholders in society. NCC develops concepts that promote social sustainabil ity in, for example, the refurbishment and renewal of exist ing residential areas. NCC’s sustainable refurbishment concept plays an important role in this process. Through collaboration with tenants, municipalities and other local participants, secure and economically sustainable solu tions are created. Residents do not just get to influence the decision-making process in their own neighborhood, they also gain job opportunities during the refurbishments. NCC also offers trainee positions and apprenticeship schemes as part of many other types of projects. The construction industry uses huge quantities of material resources and energy, both in its own opera tions and in those products and services that it sup plies to society. A proactive approach is required to today’s challenges to transform the construction sec tor into a long-term, sustainable industry. NCC works purposefully to reduce both its own and its suppliers’ and customers’ environmental impact. Through working continuously with the development of additional energy-efficient, climate-compatible and resource-efficient products and services, on its own and together with customers, environmental impact is minimized and society will develop in a more sustain able direction. NCC also plays a key role in society and actively contributes to meeting demands to build new housing as a result of the increased pace of urbanization. For example, the company has developed new business models for renovating objects from the Million Homes Program (public housing project of the 1960s and 70s), with the aim of achieving increased social and economic integration. In addition, NCC is working to strengthen the industry’s reputation through the active use of tools that help to prevent the risk of car tels, bribery and corruption. NCC 2014 43 SUSTAINABILITY Organization and governance The CEO is ultimately responsibility for NCC’s sus tainability efforts. The SVP Corporate Sustainability is responsible for their implementation and has a staff that works daily with sustainability issues. The unit cooperates with other functions in the organization, such as representatives of the company’s business areas as well as purchasing and HR functions. NCC’s environmental efforts are based on four over riding focus areas and are controlled by the Group’s SVP Corporate Sustainability in cooperation with the environmental and sustainability managers for each business area. The group meets regularly and sets shared targets, while following up developments regarding environmental efforts. Values that form the foundations of the business NCC’s values and Code of Conduct are the basis for all actions in our operations. Together, they act as a com pass for employees and business partners, and provide guidance to daily operations. These four values are prerequisites for achieving NCC’s vision – to renew our industry and provide superior sustainable solutions. HONESTY – We are true to ourselves and our stakeholders – We conduct business in a correct and responsible manner – We make sure our stakeholders can always rely on NCC RESPECT – We value diversity and treat others respectfully – We cooperate, value the opinion of others and stand behind our decisions – We use all our resources with care TRUST – We trust each other, say what we mean and do what we say – We have the courage to be forthright and clear – We honor our commitments and strive towards high standards on quality, ethics and sustainability PIONEERING SPIRIT – We take initiative, work proactively and with energy – We have the courage to think and work in new ways – We drive development together with our stakeholders NCC’s code of conduct NCC’ Code of Conduct is based on the company’s val ues and on voluntary initiatives adopted by NCC, such as the World Economic Forum Partnering Against Corruption (PACI) and the UN Global Compact, an initiative that sets out principles for managing human rights, work methods, the environment and corrup tion. All employees receive regular training in the Code of Conduct’s fundamentals and are expected to comply with these principles in their daily work. NCC’s Executive Management Group is responsible for compliance with the Code of Conduct, which is continuously followed up within the framework of operating activities. NCC Compass NCC Compass, which is easily accessible on NCC’s intranet and also as an app, guides employees on issues concerning gifts, business entertainment, con flicts of interest and competition law. In addition to guidelines and general advice, the tool has an “Ask Me” and a “Tell Me” function. The Ask Me function was created to assist employees in always making the right decisions. It provides simple and concrete advice with the aim of preventing incorrect behavior. The Ask Me function is managed by 45 specially trained employees, known as navigators, who are available throughout the company to answer questions in the local language. The goal is that the employees always ask first, if they are unsure of what to do. All questions are documented and followed up to enable procedures and guidelines to be clarified and devel oped wherever uncertainty prevails. The Ask Me function handles about 30 questions per year, of which 60 percent pertain to gifts and busi ness entertainment. Frequently asked questions and answers are compiled on NCC Compass. The Tell Me function is a whistle-blower function through which employees can report their suspicions about behaviors and actions that contradict the Code of Conduct. NCC guarantees that whatever is said or written will be handled as confidential information and that it will not reveal the identity of the person who submitted the report. All reports submitted via the Tell Me function are investigated in an impartial and thorough manner by specially trained internal resources jointly with external expertise, to guarantee legally secure treat ment thus protecting both the reporting party and the individual reported. This year more than 20 incidents were reported through the Tell me function, of which nine had grounds for investigation. The incidents con cerned areas, such as theft and fraud. During the year, an external Tell me function was also created with the aim of dealing with any external reports that arrived. An extensive training initiative has been started to establish and generate understanding for the issues addressed by NCC Compass. Thus far, about 7,500 salaried employees and 300 blue-collar workers have received training and, in 2015, all remaining employ ees will undergo training. The course is provided online and is based on real cases and issues. Anti-bribery partnership Together with the Swedish Association of Local Authorities and Regions (SALAR), the Swedish Anti-corruption Institute (IMM), the Swedish Construction Federation, the Swedish Construction Clients and other construction companies, NCC is participating in a project to prepare guidelines for con struction companies when working with municipali ties and county councils. NCC is also a member of the Corporate Supporters Forum, an industry forum operated by Transparency International Sweden. 44 NCC 2014 SUSTAINABILITY Significant issues For the fifth consecutive year, NCC is presenting a sustainability report in accordance with the interna tional framework of the Global Reporting Initiative (GRI) and, this year, for the first time, the report has been prepared in line with the updated G4 guidelines. Internal analyses of strategic issues, the driving forces in society and the results of stakeholder dialogs (see page 16) lead to a definition of the sustainability issues that are most significant for NCC. The method for defining these significant issues fol lows the GRI G4 guidelines and comprises identifica tion, prioritization and validation. Regular checks will be carried out with NCC’s stakeholders to ensure that NCC’s priorities are rele vant for the market, society and NCC. IDENTIFICATION PRIORITIZATION VALIDATION Initially, a general list of significant issues was prepared, which was based on identified drivers in society, the GRI’s aspects, the UN Global compact, existing and future regulatory frameworks, strategic issues, etc. Internal workshops were carried out with all functional areas. By gaining support for the issues in our own operations and benchmarking against industry standards, the issues were analyzed based on their impact on business activities and stakeholders. Validating the identification of the right issues entailed utilizing previously conducted surveys of customers, suppliers, employees and investors as well as gaining the support of Executive Management Group. Continued validation and updating is performed continuously through stakeholder dialogs in daily operations. SIGNIFICANT ISSUES The significant issues can be grouped according to economic, environmental and social responsibility, they are linked to the entire operation and pervade every link of the value chain. SUPPLIERS Competition Anti-corruption Supplier evaluation EMPLOYEES ccupational health O and safety Non-discrimination Recruitment Diversity and equal opportunity Equal pay for men and women Recruitment and competency development Development of human capital CONSTRUCTION AND CIVIL ENGINEERING PROCESS F inancial performance Energy Carbon dioxide emissions M aterials and chemicals Biodiversity Waste and resource efficiency Compliance with environmental legislation Environmental performance of products and services CUSTOMERS Customer satisfaction Environmental performance of products and services SOCIETY Recruitment Training and education Biodiversity Local communities Financial responsibility Social responsibility Environmental responsibility ABOUT THIS REPORT AND THE CONTACT PERSON For the fifth consecutive year, NCC is presenting a sustainability report in accordance with the international framework of the Global Reporting Initiative (GRI). Although the Sustainability Report has not been audited by a third party, NCC is of the opinion that the information in the 2014 Annual and Sustainability Reports, together with information on the NCC website, fulfills the GRI disclosure requirements for G4 Core. Unless otherwise stated, all the information pertains to the entire NCC Group during 2014. The GRI index is available on NCC’s website www.ncc.se/griindex. Contact: Senior Vice President Corporate Sustainability Christina Lindbäck. NCC 2014 45 SUSTAINABILITY SUPPLIERS Highly efficient, responsible purchasing Each year, NCC makes purchases valued in billions of SEK from an array of suppliers. Therefore, the pur chasing area is of great significance, NCC places great importance on developing how suppliers’ opera tions are audited from a sustainability perspective. Developing responsible and sustainable purchasing is a key issue for NCC. The purchasing of material and services accounts for about two thirds of the NCC Group’s expenses. Group purchases of goods and ser vices currently total about SEK 40 billion. The purchases are made through more than 50,000 suppliers. The purchasing volumes mainly comprise services and materials relating to excavation and transportation, staffing, consultants, installation, foun dations, prefabricated concrete and steel, as well as construction materials. NCC coordinates and organizes purchasing cen trally to raise efficiency, boost profitability and lower costs. Historically, competition in the market for building materials and subcontracting has been very weak, since construction companies have usually pur chased materials and services locally. This is also one of the reasons why construction costs have exceeded CPI increases for so many years. The Group’s purchasing function controls and coor dinates strategic purchasing. Suppliers deal with One NCC, which is the same throughout the company, thereby increasing control over purchasing. This makes NCC stronger in negotiations and lowers costs. Another positive effect of coordinated purchasing is that the number of suppliers and range of items declines, which also has an impact on cost savings. Continuous audits Over the years, NCC has built up a stable international supplier base outside the Nordic region, in part by establishing its own purchasing offices in various loca tions worldwide. Close partnerships with suppliers in the international market enable NCC to raise the relia bility and efficiency of its supplier chain. The aim is to continue increasing the proportion purchased from suppliers outside the Nordic region. To monitor and develop international suppliers, NCC focuses on audits of social responsibility, quality, the environment and the work environment. During the year, a review and update of the audit tool for inter national suppliers were initiated. NCC applies a 12-month supplier-assessment audit cycle for all inter national suppliers who deliver to the Nordic region to ensure compliance with and development in these areas. Serious supplier deviations that are not recti fied after having been commented on, lead to the termination of the partnership. NCC combines its own audits conducted by in-house personnel with those of consultants who conduct third-party audits within the framework of NCC’s affil iation to the Business Social Compliance Initiative (BSCI) and the UN’s Global Compact, for example. 46 NCC 2014 SUSTAINABILITY EMPLOYEES With safety as the top priority Competent and motivated employees contribute to NCC’s success. The company retains existing employ ees and attract new ones by providing a stimulating workplace with high safety levels. Everyone can impact worksite safety. Speaking up when something is not sufficiently safe contributes to a safer work environment. NCC’s Time-out system means exactly that, reacting and acting when people find themselves in risky situations, so that the prob lem can be corrected and work can progress safely. A positive work environment and a safe workplace are highly prioritized areas and NCC works systemati cally to eliminate the number of accidents, in order to achieve its zero-accident target. A key part of these efforts is to establish a shared safety culture, and cre ate an environment in which everybody reacts to and acts on work environment shortcomings and incorrect behavior. Worksite accidents at NCC have been reduced by 45 percent since 2011 as a result of the company’s structured safety efforts. Safe worksites are also about safe and secure terms of employment. In all of our markets, with the excep tion of Russia and the Baltic countries, NCC has col lective agreements that regulate minimum wages, working hours and employees’ rights in relation to the employer. In Russia, employee interests are instead monitored through government agencies and inspec tors. In the Baltic countries, minimum wages and other terms are regulated through national legislation. Joint safety discussions NCC’s Awareness Day is organized once each year. On this day, production stops throughout NCC and employees gather in groups at their own workplaces to discuss safety. Health and safety issues are raised at the same time for discussion at all of the company’s workplaces and employees discuss, for example, how accidents can be avoided. The 2014 Awareness Day, which was held at the start of September, focused on orderliness. 1,700 improvement proposals were submitted Recruiting for the future One of the really key issues for NCC is attracting the best talents, while simultaneously developing and retaining current employees. Competent and moti vated employees generate greater profitability and increase customer satisfaction. The construction industry continues to face a major need for recruitment, and NCC is taking an active role in securing future access to competencies. For exam ple, the company is involved in a high-school course together with Kunskapsskolan, which offers a threeyear technology program at a number of locations in Sweden. During the course, students will have continu ous company contact, including trainee positions, field trips and lectures by experts from NCC. NCC also sponsors Mattecentrum, which provides math support to junior and senior high school pupils free of charge. During the year, NCC also continued to work with the Technical Leap project, whereby senior high school pupils are offered trainee positions while receiving insight into and boosting interest in the engineering profession. Broad skills development NCC is a knowledge-intensive organization, where education and skills development are central issues. Training courses are provided annually in a range of areas and at many different levels. These include everything from project-manager courses to site manager certifications and NCC’s proprietary fore NCC 2014 SUSTAINABILITY man school, which has been in operation for several years, and which provides new types of development opportunities for skilled workers. Diversity contributes to creativity and innovation NCC works actively to enhance diversity and coun ter discrimination. Diverse backgrounds, skills, experiences and ideas contribute to creativity and new solutions. The company’s Code of Conduct states that all employees are to be treated equally – regardless of ethnicity, gender, age, religion, sexual orientation, lifestyle or other attributes. NCC also participates in several mentor programs, including Mentor Bygg, through the Swedish Con struction Federation, with the aim of increasing the percentage of women in the industry. It is just as important to recruit additional women as it is to retain, support and develop the women who already work at NCC. The women’s network Stella has a vital role to play in this effort. Since its start in 1998, Stella has worked to highlight women’s skills and the percentage of women both generally and in leading positions. NCC also actively promotes an increase in the percentage of employees with different ethnic back grounds by participating in local integration projects aimed at offering immigrants training and trainee positions to prepare them work in, for example, construction and civil engineering. The Silent Book is spreading across the industry This is a unique book on safety and has reduced accidents at NCC’s own construction sites. It is called the Silent Book and has been distributed to all of NCC’s employees. The book uses pictorial information to describe safe working practices at construction sites. As the book is completely devoid of any text, its information reaches everybody who works on a construction site, irrespective of the language they speak. As part of spreading an industry-wide safety mindset, NCC is initiating a cooperation with the industry and employer organization the Swedish Construction Federation (BI). A new issue is being printed of the Silent Book and it will become available for the majority of Swedish construction industry. Employee survey forms the foundation for improvements Workforce satisfaction and the employees’ view of the company are tracked via an employee survey – the Human Capital Index (HCI). The HCI includes questions on motivation, well-being, work satisfac tion and loyalty so as to provide input to NCC’s con tinuous improvement efforts. NCC’s results outper form the industry index in most of its markets. The 2014 survey illustrates, for example, that an extremely high and, this year, increasing percentage of employees (HCI score of 80) is of the opinion that there is an awareness at their worksites of the risks to health and safety that are linked to operations, and that there is substantial involvement in these issues among all employees. To a considerable degree, the respondents regard NCC as a company that focuses on sustainability efforts (HCI score of 74) and that their immediate superior acts in line with NCC’s values (HCI score of 84). The improvements in these areas reflect the local development efforts at the worksites. Focus on traffic safety During the year, the new NCC ViaSafe concept was launched for increased road safety and improved traffic flows. This pertains to various services in conjunction with work on and near streets and roads. NCC is responsible for the entire process, from plans for traffic control devices and permits from government agencies to putting out correct traffic barriers and signage. This initiative is based on NCC’s vision of zero work-environment accidents and increased demand for this type of competence. Increased safety and better traffic flows provide significant socioeconomic gains and also have a positive impact on the environment. 47 48 NCC 2014 SUSTAINABILITY CONSTRUCTION AND CIVIL ENGINEERING More efficient processes reduce environmental impact The construction industry has a major environmental impact and, accordingly, NCC works actively to influ ence social development in a sustainable direction. One example is the new work method for capitalizing on human social values and interests in conjunction with the redevelopment of residential areas. One of the cornerstones of all construction is obtain ing resources. Projects require building materials and technical installations in many different forms. NCC works closely with its suppliers to source material choices that are as sustainable as possible. NCC’s operations should be characterized by effi cient use of resources. The operations endeavor to close the eco-cycle of the various materials. One of the company’s long-term goals is that no recyclable waste is to be disposed of in landfills and, instead, should be recycled or reused. The percentage of renewable and recyclable materials and components in NCC’s prod uct range should also grow. Toward circular flows Life-cycle analyses help to optimize the usage of mate rials in production. Through increasing resource effi Recycling generates new material and reduces environmental impact NCC Recycling, NCC’s Nordic concept for recycling, comprises a major strategic initiative aimed at reducing environmental impact. Recycling terminals, where used material such as stone materials, gravel, sand and soil products are processed and sold as new products, are increasingly being established in the various markets. Development of the concept is continuing and, in the near future, the recycling terminals will be able to accept all types of construction waste. This means that NCC will be able to manage all of its own building materials. At present, a total of three terminals are in operation in Sweden, Denmark and Finland. In 2015, one new terminal will open in Denmark and one in Sweden. ciency in construction processes, the amount of recy cled material should gradually increase and waste quantities diminish. In many parts of NCC’s operations, the recycling of construction and civil engineering material form a core part of the business. One example is the NCC Recycling business concept. Since the recycling of asphalt and other materials is more energy and cost effective than new production, NCC is continuously improving its recycling capacity in an increasing num ber of asphalt plants, thus permitting more ecocy cle-adjusted operations. In 2014, recycled asphalt granulate accounted for 16.5 percent (15.0) of hot asphalt production. Reduced emissions and renewable sources NCC’s goal is to continuously reduce the company’s climate impact by reducing emissions of greenhouse gases in both its operations and the products offered to the market. Increasingly optimized energy con sumption and a transition to more environmentally compatible energy sources are high on the agenda. Low-energy and passive buildings featuring advanced energy technology in which renewable energy are given far greater scope can be seen in, for example, solar cells and bedrock heat. Because the energy requirements of asphalt produc tion are significant, which entails a major impact on the environment, NCC launched a method for heating asphalt plants with wood pellets a couple of years ago in order to reduce carbon emissions. During 2014, 12 NCC asphalt plants in Sweden and Norway were con verted to the use of wood pellets. The goal is for the majority of NCC’s 29 asphalt plants in Sweden to run on wood fuel within five years. In 2014, NCC also reduced its carbon emissions from asphalt production in the Nordic region by using recycled asphalt and increasing production of NCC Green Asphalt. Currently, NCC has 75 plants that recycle asphalt and of these 40 have been remodeled to produce NCC Green Asphalt. Phasing out hazardous substances NCC’s objective is to be able to produce content- declared buildings and civil-engineering structures that comprise environmentally sound and sustainable products – a development that, in the long term, will result in buildings being designed to a greater extent NCC 2014 49 SUSTAINABILITY to allow for their input materials to be recycled upon expiry of their useful life. In addition to applying the rules and regulations set forth by the EU, such as REACH, NCC uses various tools and databases that provide solid guidance on how to phase out the most hazardous substances. A crucial link in the transition to thoroughly sound and recycla ble products is to impose the appropriate requirements on suppliers and to work with traceability throughout the entire production chain – an effort that has been further intensified by NCC’s purchasing organization. NCC has been using well-known product-selection systems for many years. In the environmental certifica tion of projects, logbooks have been developed in which selected products are described. In addition to log books, the BASTA, ChemXchange and Byggvaru EMISSIONS FROM NCC’S OPERATIONS bedömning tools are used primarily to make the right product choices. Ecosystem services in urban development Ecosystem services have become increasingly impor tant to sustainable urban development. Ecosystem ser vices refers to the functions of ecosystems that benefit mankind, that is those that maintain or improve peo ple’s well-being, for example, wetland water purifica tion or the use of vegetation for thermal control. Ecosystem services are of major socioeconomic significance and active management of these services will benefit NCC’s business. For example, Urban vege tation helps lower the temperature on hot summer days, which equates to lower energy costs due to reduced cooling needs. DIRECT ENERGY USE 2014 2013 Greenhouse gas emissions CO2e (1,000 tons) 249 265 Gasoline, 0.4% – of which, scope 11) 221 239 Gas, 14.1% – of which, scope 22) 28 26 56,867 57,823 4.38 4.57 Net sales, SEK M CO2e (ton)/SEK M 1) 2) Diesel, 44.7% Pertains to direct emissions from NCC’s operations. Pertains to indirect emissions from electricity and heat. INDIRECT ENERGY USE 2014 2013 240,729 219,134 District heating 41,278 46,521 District cooling 85 283 282,092 265,938 MWh Electricity Total Oil, 28.5% The table shows NCC’s usage of purchased energy. Other, 12.3% The diagram shows NCC’s energy usage of various fuels. 50 NCC 2014 SUSTAINABILITY CUSTOMERS The best sustainable solutions NCC’s products and services have an impact on the environment and society even after the conclusion of the project. Accordingly, a key part of operations comprises cooperation with customers to secure sustainability aspects in the utilization phase. NCC offers customers climate-friendly solutions through, for example, what are known as Green Tenders. NCC was the first company in the construc tion industry to launch this type of alternative tender as early as in 2010, and has since developed the ten ders to encompass an ever broader product portfolio. A sustainable offering list is attached to every tender exceeding SEK 50 M. The customer can then choose to utilize NCC’s expertise in Green Construction and receive a tangible environmentally compatible offer. The aim is to make it easier for customers to act sustainably, in both the construction process and in utilization. Under the Green Tenders initiative, customers are offered, for example, energy-efficient and environmen tally compatible establishment of workplaces, climate- declared buildings and climate compensation. In 2014, an updated version of Green Tenders was launched, which comprises more services than the purely climate related. With time, Green Tenders will become standard at NCC and will comprise additional aspects of an economic and social character. Certification as a tool for assessment NCC offers its customers all the types of environmen tal certifications that are available to both buildings and civil-engineering structures. The company plays an active role and is one of the founders of Green Building Councils in Denmark, Finland, Norway, Sweden and Estonia. Green Building Councils work to promote green building and to develop and influence environmental and sustainability efforts in the indus try. In its proprietarily developed projects, NCC adheres to BREEAM for commercial buildings and city districts (in Denmark, NCC adheres to the G erman system, DGNB) and the Nordic Swan Ecola bel and SGBC certification for residential projects. If customers so wish, LEED is also used. Our civil-engineering projects adhere to the CEEQUAL certification system. Within the NCC Roads business area, NCC has also started to intro duce an environmental stamp on quarries – NCC Green Quarry. The environmental stamp, which has already been introduced to some 70 quarries in the Nordic region, comprises the measurement and moni toring of energy usage, transportation, recycling, noise and dust, as well as communication with neigh bors and other stakeholders. SOCIETY A visible role in sustainable social development NCC plays a major role in society and actively contributes to sustainable social development.These efforts focus on minimizing the company’s own impact, for example in the form of emissions, but also on contributing to identifying sustainable solutions to society’s problems. For some years, NCC has actively participated in the Swedish debate concerning the conditions for increased residential construction. With experience gained from the Nordic countries and Germany, where NCC is the largest housing developer, the com pany has constructively mediated valuable insights and experience with proposals for a faster decision and construction process. Research and development that contribute to society NCC also conducts extensive R&D work that is decen tralized and conducted within each business area. This pertains to everything from knowledge-acquisi tion research to more industrially oriented product and method development – usually in close coopera tion with customers and suppliers. NCC also engages in continuous cooperation with various universities and colleges and employs about seven industrial PhD candidates every year, who con structively contribute to NCC’s strategic development. In Sweden, NCC also has six professors who are attached on a part-time basis to a number of institutes of technology, thus providing a valuable network con nection to academic researchers. During the year, the company participated in several strategic research programs, both nationally and internationally. NCC 2014 AVSNITTSMARKERING Wood makes asphalt sustainable NCC has developed and a patent is pending for an innovation that enables large-scale use of wood pellets in asphalt production. The initiative marks a change in the industry. Every year, 21 million tons of hot asphalt is produced in the Nordic region, and NCC is responsible for about one third. To date, heating oil and gas have been the primary fuels in asphalt plants. By switching to renewable fuels, such as wood pellets, for all of the Nordic region’s asphalt plants, the asphalt industry as a whole would be able to reduce carbon-dioxide emissions by 460,000 tons, corresponding to emissions from 280,510 cars each year*. RAPID CONVERSION AT NCC During 2014, NCC converted 12 of its asphalt plants in Sweden and Norway to using wood pellets. Over 2015 and 2016, the plan is to convert some ten additional plants to operating on renewable fuel. A total of 22 kg of carbon dioxide is emitted per ton of asphalt produced using heating oil. Accordingly, by the end of 2016, NCC will have reduced emissions of fossil-fuel carbon dioxide emissions from its asphalt production by about 50,000 tons. *B ased on a diesel-driven car that consumes 0.052 l/km and is driven 12,180 km/yr, which is equal to 1,647 tons of CO2 per car per year. 12 f NCC’s asphalt plants o use wood pellets 51 52 NCC 2014 FINANCIAL REPORT Report of the Board of Directors The Board of Directors and the President of NCC AB (publ), corpo rate registration number 556034-5174 and headquartered in Solna, hereby submit the annual report and the consolidated financial state ments for the 2014 fiscal year. GROUP RELATIONSHIP Since January 2003, NCC AB has been a subsidiary of Nordstjernan AB, corporate registration number 556000-1421. OPERATIONS NCC is one of the leading construction and property development companies in Northern Europe. NCC develops and constructs resi dential and commercial properties, industrial facilities and public buildings, roads, civil engineering structures and other types of infrastructure. NCC also offers input materials used in construction, such as stone material and asphalt, and provides paving and road ser vices. Operations are mainly conducted in the Nordic region. In Ger many, NCC focuses primarily on housing. In St. Petersburg, NCC builds housing and has an asphalt and paving operation. OPERATIONS DURING THE YEAR Market The Swedish construction market improved in all segments during 2014. In Norway, infrastructure investments contributed to an expanding civil-engineering market. The Finnish market remained weak. In Denmark, growth is primarily arising in the metropolitan regions of Copenhagen and Aarhus in the housing and other build ings segments, in both new builds and refurbishment. In NCC Roads’ markets, demand for asphalt and stone material was generally favorable during the year. Due to the mild weather towards the end of 2014, production could continue later in the year. In Fin land, market conditions for asphalt och stone material were more restrictive than in the other markets. The market trend in Russia has become more uncertain due to political developments during the year. The market trend in NCC’s housing markets generally remained favorable. In Sweden and Germany, demand was healthy with rising prices. In Finland, demand was weaker, but there was demand from the investor market and from the private market for small and reason ably priced housing units. In Norway, housing prices increased slightly but a declining price for oil had an adverse impact on the econ omy. The weaker economic situation in Russia has not yet impacted demand for housing units in St. Petersburg, which has a stable labor market with low unemployment. Demand for housing remains favora ble in Copenhagen. For commercial properties in Sweden, demand in the leasing mar ket was favorable, vacancy rates low and interest from investors high. In Copenhagen, there is pressure on rent levels because of high vacancy rates in the portfolio of old office units. Vacancies were sta ble in Oslo since few new office projects were completed in 2014. In Helsinki, transaction volumes were high but demand in the leasing market was weak. Changes among senior executives In March 2014, Jacob Blom, was appointed the new HR Director and a member of Executive Management Group. Jacob Blom had served as acting HR Director since November 2013, succeeding Mats Petters son who left the company at year-end 2013. Jacob Blom has long standing experience in the field of the Human Resources both from NCC in Denmark and other companies. Jyri Salonen was appointed new Business Area Manager for NCC Roads and a member of the Executive Management Group in Decem ber 2014. He assumed his new position on February 1, 2015. Jyri Salonen has been Division Manager at NCC Road Services since January 2014 following four years as Business Unit Manager for NCC Roads in Finland. He was employed as the Finance and Business Control Manager of NCC Roads in F inland in 2008. Until February 1, 2015, NCC Roads’ Business Area Manager, Göran Landgren, remains at NCC at Group level with responsibility for special initiatives and pro jects. Göran Landgren reports to President and CEO Peter Wågström. Orders received Orders received amounted to SEK 61,379 M (56,979). Orders received were higher in NCC’s Construction units in Sweden, Den mark and Norway. NCC Housing reported an increase in orders received, while NCC Construction Finland and NCC Roads noted declines. NCC Roads registered more infrastructure projects in the year-earlier period. Exchange-rate changes increased orders received by SEK 445 M compared with the preceding year. Orders received for proprietary housing projects for private cus tomers amounted to SEK 11,295 M (9,029). During 2014, 4,503 ORDERS RECEIVED AND ORDER BACKLOG PROFIT/LOSS AFTER FINANCIAL ITEMS Orders received during 2014 were higher than in 2013, primarily for housing units. During 2013, orders received rose, primarily because of more housing project starts as well as an increase in other buildings. Orders received were slightly lower in 2012 compared with the historically high level noted in 2011, mainly due to a decline in orders received by the Construction units in Sweden, Denmark and Finland. In late 2011, demand for housing stagnated while demand for other building projects and civil engineering projects continued to rise throughout the year. Orders received were high during 2010, primarily because of strong demand for housing. A decline in profit was noted in the final quarter of the year, mainly because NCC Property Development profit-recognized a number of property projects during the fourth quarter of 2013. The start of the year was seasonally weak. During the second quarter of 2014, all business areas reported strong earnings, apart from NCC Property Development. Earnings increased in the third quarter, primarily as a result of higher earnings from NCC Housing. SEK billion SEK M 60 1,500 50 1,200 900 40 600 30 300 20 0 10 0 –300 2010 2011 Orders received Order backlog 2012 2013 2014 –600 Q1 2010 Q2 2011 2012 Q3 2013 Q4 2014 NCC 2014 53 FINANCIAL REPORT (3,715) housing units for private customers and 1,445 (1,095) units for the investor market were started. During the year, 4,575 (3,747) housing units were sold to private customers and 1,472 (1,129) units to the investor market. Orders received for proprietary property development projects amounted to SEK 1,996 M (2,309). The order backlog rose SEK 7,140 M compared with the preceding year to SEK 54,777 M. Changes in exchange rates had a positive impact of SEK 211 M on the order backlog. Net sales Net sales totaled SEK 56,867 M (57,823). The decline was due to lower sales in NCC Construction units in Sweden, Norway and Fin land, and in NCC Property Development. Fewer projects were recog nized in profit, which explains the lower net sales in NCC Property Development. NCC Roads reported higher sales, particularly in its aggregate operations. The volumes of stone material rose year-onyear mainly as a result of healthy performance in Sweden and Nor way. An increased number of profit-recognized housing units for pri vate customers resulted in higher net sales for NCC Housing compared with the preceding year. Exchange-rate changes increased sales by SEK 626 M compared with 2013. Operating profit Operating profit amounted to SEK 2,604 M (2,679). All business areas reported higher earnings year-on-year, with the exception of NCC Property Development, which reported fewer profit-recognized projects. The greatest earnings improvement was attributable to NCC Housing, which recognized more housing units in profit during the year. The total operating profit for NCC’s Construction units was higher than in the preceding year and the operating margin was also higher. In 2013, impairment losses on projects in NCC Construction Norway had a negative impact on earnings. NCC Roads operating profit improved compared with 2013, primar ily as a result of improved earnings within road services. Despite higher sales of stone material, earnings from stone material declined due to higher costs in Denmark and costs for the development of recycling operations. The asphalt operations reported another strong year with a margin that matched the preceding year. NCC Housing’s operating profit was higher than in 2013 as a result of an increase in the number of profit-recognized housing units for private customers, a higher margin on units sold to the investor mar ket and sales of land. NCC Property Development’s operating profit was lower than in the preceding year. During the year, seven (11) projects were recog nized in profit. In 2013, projects were recognized in profit at a better margin. “Other and eliminations” amounted to an expense of SEK 157 M (expense: 21), of which eliminations of inter-company gains accounted for expense of SEK 18 M (income: 66). Profit after financial items totaled SEK 2,234M (2,400). Due to higher interest rates in Russia, net financial items declined to an expense of SEK 370 M (expense: 279). Profit after tax for the year amounted to SEK 1,838 M (1,989). The effective tax rate for NCC was 18 (17) percent. FINANCIAL POSITION Profitability The return on equity after tax was 22 percent (26). Total assets Total assets amounted to SEK 38,987 M (38,793). Net indebtedness Net indebtedness amounted to SEK 6,836 M (5,656), of which net indebtedness in ongoing projects in Swedish housing associations and Finnish housing companies accounted for SEK 1,963 M (1,714). The reason for the higher net indebtedness was that tied-up capital increased, primarily in housing projects, while the pension debt rose. Cash flow Cash flow before financing was SEK 574 (1,661). Cash flow from changes in working capital amounted to a negative SEK 928 M (posi tive: 211). Cash flow from property and housing projects matched the preceding year. Higher sales of housing projects during the year facilitated more starts, thus increasing investments by the same rate. During the year, lower sales of property projects were offset by lower investments. Cash flow from operating activities declined compared with 2014, mainly due to a decrease in interest-free financing. Also refer to the Cash flow statements on p. 68. Equity/assets and debt/equity ratio On December 31, the equity/assets ratio was 23 percent (22). The debt/equity ratio amounted to a multiple of 0.8 (0.7). Seasonal effects The operations of NCC Roads and certain activities within NCC’s Construction units are affected by seasonal variations caused by cold weather conditions. The first and final quarters are normally weaker than the rest of the year. BUSINESS AREAS NCC Construction Sweden Orders received by NCC Construction Sweden amounted to SEK 24,899 M (20,348). The upswing was primarily due to an increased number of housing projects, as well as to a higher number of projects in the other buildings and civil engineering segments. Operating profit amounted to SEK 640 M (637). Lower production was offset by improvements in project margins. NCC Construction Denmark Orders received by NCC Construction Denmark amounted to SEK 5,587 M (4,929). The increase was due to a higher level of orders received in the housing segment. The higher sales and the continued healthy profitability resulted in an earnings improvement to SEK 281 M (208). NCC Construction Finland Orders received amounted to SEK 5,799 M (6,491). The decline was due to lower demand in the other buildings and housing segments. Operating profit improved to SEK 148 M (127) as a result of improved margins. NCC Construction Norway Orders received rose to SEK 7,653 M (7,098). The increase derived from a rise in orders received in civil engineering, as a result of two large-scale civil engineering projects registered in the fourth quar ter, and from housing, which increased from a low level. Operating profit was SEK 146 M (3). In the preceding year, earnings were adversely impacted by impairment losses on projects in a number of other building projects. NCC Roads Net sales totaled SEK 12,153 M (11,999). The increase was primarily attributable to higher stone material sales, as a result of healthy development in Sweden and Norway. Operating profit amounted to SEK 459 M (406). The increase was mainly attributable to improved earnings in road services. Despite higher sales, earnings from stone material declined due to increased costs in Denmark and costs for developing recycling operations. The asphalt operations had another strong year with a margin that matched the preceding year. 54 NCC 2014 FINANCIAL REPORT NCC Housing A total of 4,575 (3,747) housing units were sold to private customers and 1,472 (1,129) to the investor market. Housing sales to private cus tomers rose the most in Sweden and St. Petersburg, but also in Ger many and Latvia, while sales in Estonia, Norway and Denmark were on par with the year-earlier period. However, sales declined in Fin land. During the year, construction started on a total of 4,503 (3,715) housing units for private customers and 1,445 (1,095) units for the investor market. Higher sales facilitated an increase in housing starts for private customers. The number of profit-recognized housing units was 3,661 (2,951) for private customers and 1,393 (903) for the investor market. The number of unsold, completed housing units at year-end was 438 (717). The number of housing units under construction totaled 7,687 (6,383), including 5,952 (4,831) units for private customers. The sales rate for units under construction for private customers was 58 per cent (47) and the completion rate was 45 percent (49). The sales rate for units under construction for investors was 100 percent (98) and the completion rate was 65 percent (38). The number of development rights at year-end was 31,300 (33,200), including 9,400 (11,200) located in Sweden. Assets in housing pro jects increased to SEK 13,246 M (12,625), primarily as a result of more ongoing projects. Operating profit amounted to SEK 918 M (605). Earnings were higher than in the year-earlier period as a result of an increase in the number of profit-recognized housing units for private customers, a higher margin on units for the investor mar ket and sales of land. Earnings in the preceding year were negatively impacted by the sale of rental units and land, impairment of land and restructuring costs in Sweden. NCC Property Development Sales for NCC Property Development amounted to SEK 3,125 M (4,811). Operating profit declined compared with 2013 to SEK 169 M (713). Seven (11) projects were recognized in profit, of which five in Finland and two in Denmark. Earnings from previous sales and sales of land also contributed to earnings. The operating net for the year was SEK 68 M (68). At year-end 2014, NCC had 17 (17) completed and ongoing projects that had not been recognized in profit, with total project costs amounting to SEK 5.4 billion (5.0). Costs incurred in all ongoing pro jects amounted to SEK 3.0 billion (3.0), equal to a completion rate of 56 percent (60), while the leasing rate was 63 percent (74). Leases were signed for 71,100 square meters (120,100) during the year. BRANCHES OUTSIDE SWEDEN The NCC Construction Sweden business area conducts operations via a branch in Norway. NCC also has a branch in Denmark, as well as a branch in Singapore connected to two completed projects for which the guarantee periods have not yet expired. ENVIRONMENTAL IMPACT The Group conducts operations subject to permit and reporting obli gations in accordance with the Environmental Code, which involve the Swedish Parent Company and Swedish subsidiaries. Of the Group operations subject to permit and reporting obligations, it is mainly the asphalt and gravel pit operations conducted by NCC Roads that affect the external environment, as well as the construction and civil engineering operations conducted by NCC’s Construction units. Within NCC Roads, quarries and harbors are subject to permit obli gations, while asphalt production is generally subject to reporting obligations. Permits for quarries are renewed continuously. NCC Roads also conducts recycling operations that are subject to permit obligations. Some of these also include landfills, which are also sub ject to permit obligations. The external environmental is mainly impacted by emissions to air, waste generation and noise. No signifi cant injunctions according to the Environmental Code exist. COMPETITION ISSUES In 2011, NCC’s internal investigation confirmed suspicions stated by the Norwegian Competition Authority concerning infringement of competition laws in the Trondheim area during 2005–2008. The Nor wegian Competition Authority announced in March 2013 its ruling in the case entailing that NCC was obligated to pay approximately NOK 140 M (approx. SEK 150 M) in competition-infringement fees. Subse quently, NCC appealed the Norwegian Competition Authority’s rul ing to the Oslo District Court, which issued its verdict on February 19, 2014, entailing a reduction of the competition-infringement fee from NOK 140 M to NOK 40 M (SEK 43 M). This verdict has been appealed. More information is available in Note 30, Other provisions. In the wake of the Finnish asphalt cartel, during the period 19942002, which was finally concluded in court and regulated in 2009 with respect to competition-infringement fees, NCC and other construc tion companies have received damage claims from a number of municipalities and the Road Authority in Finland. For NCC Roads’ Finnish company, this means that the claim for approximately EUR 71 M is directed at the company, jointly with the other construction companies concerned. These claims are being heard in general courts of law. In November 2013, the Helsinki District Court handed down rulings in a number of the claims for damages in progress at the Court. NCC Roads’ Finnish company was ordered to pay approxi mately EUR 1 M, including interest and process costs. The company has reserved a reasonable amount for damages. PERSONNEL The average number of employees in the NCC Group during the year was 17,669 (18,360). The reduction in the workforce was mainly due to fewer employees in NCC Construction Sweden, and also to fewer employees in NCC Construction Finland. ORDERS RECEIVED, NET SALES AND EARNINGS PER BUSINESS AREA ORDERS RECEIVED SEK M NET SALES OPERATING PROFIT 2014 2013 2014 2013 2014 24,899 20,348 20,788 21,530 640 637 NCC Construction Denmark 5,587 4,929 4,330 3,546 281 208 NCC Construction Finland 5,799 6,491 6,621 6,680 148 127 NCC Construction Norway 7,653 7,098 6,733 7,408 146 3 NCC Roads 10,526 12,311 12,153 11,999 459 406 NCC Housing 12,480 10,921 10,135 9,030 918 605 3,125 4,811 169 713 63,885 65,003 2,761 2,700 NCC Construction Sweden NCC Property Development Total 66,944 62,097 2013 Other and eliminations –5,565 –5,118 –7,019 –7,180 –157 –21 Group 61,379 56,979 56,867 57,823 2,604 2,679 NCC 2014 55 FINANCIAL REPORT NCC SHARE At December 31, 2014, NCC’s registered share capital consisted of 26,023,097 Series A shares and 82,412,725 Series B shares. The shares have a quotient value of SEK 8.00 each. The Annual General Meeting (AGM) on April 2, 2014 authorized the Board, until the next Meeting, to buy back a maximum of 867,486 Series B shares and to transfer a maximum of 303,620 Series B shares to participants of the long-term performance-based incentive program that was resolved for introduction at the 2014 AGM. NCC did not exercise the mandate to buy back Series B shares in 2014. The company already held 592,500 Series B treasury shares. Series A shares carry 10 votes and Series B shares one vote each. All shares provide the same entitlement to participation in the compa ny’s assets and profit and to an equally large dividend. At the request of the holder, Series A shares can be converted into Series B shares. Such a request must be made in writing to the Board of Directors, which takes decisions on such matters on a continuous basis. After a conversion decision is made, this is reported to Euroclear Sweden AB for registration. Conversions become effective when the shares are registered. During the year, 1,685,025 Series A shares were con verted to Series B shares. The number of NCC shareholders at year-end was 43,524 (37,727), with Nordstjernan AB as the largest individual holder accounting for 21 percent (22) of the share capital and 65 percent (65) of the voting rights. No other shareholder accounts for more than 10 percent of the voting rights. The ten largest shareholders jointly account for 46 per cent (45) of the share capital and 75 percent (73) of the voting rights. On December 10, 2014, NCC signed a five-year revolving credit facility for EUR 400 M. The transaction replaced a previous credit facility of EUR 325 M signed on February 1, 2012. Should any major changes occur in NCC AB’s ownership structure, meaning if a share holder other than Nordstjernan AB acquires more than 30 percent of voting rights in NCC AB, or if NCC AB is delisted from the Nasdaq Exchange, the credit facility may be terminated by the lenders. During 2011, Nordstjernan, NCC’s principal owner, extended an offer to senior executives to acquire call options in NCC at market terms and conditions. The options corresponded originally to a total of 51,223 Series B shares in NCC AB. The call options covered by the issue had a term of 3.3 and 5.3 years, with redemption in spring 2014 and spring 2016 at a strike price of SEK 200 and SEK 250, respec tively. The terms and conditions of the options have been gradually recalculated due to the dividends paid on NCC shares since spring 2011. At the end of 2014, what remained were options comprising 33,275 Series B NCC shares, with a term until spring 2016 and a strike price of SEK 193.34. MAJOR ONGOING PROJECTS Projects exceeding SEK 300 M NCC’s share of order value Completion rate, Dec 31, 2014, % Estimated year of completion Campus, housing, offices and stores in Copenhagen DK 1,918 48 2017 Norrström Tunnel, Stockholm SE 1,729 97 2015 Tunnel construction, Sandvika-Wøyen NO 1,226 0 2019 Shopping center and travel hub, Matinkylä FI 1,216 40 2016 Subway depot, Stockholm SE 1,192 29 2017 National Highway 4, Hadeland NO 1,173 54 2016 Railway tunnel, Larvik NO 1,069 75 2016 Tunnel construction, Gvammen-Aarhus NO 1,068 1 2019 Offices, Stockholm SE 1,041 72 2015 Svealandsbanan railway line, Strängnäs-Härad SE 943 6 2018 E18, highway, Knapstad-Retvet NO 879 18 2016 DK 806 22 2016 NO 720 63 2017 Multimedia building, Aarhus DK 675 95 2015 University hospital, new construction and refurbishment, Linköping SE 637 95 2015 Administrations building, Uppsala SE 570 2 2017 Pulp mill, Värö SE 500 10 2016 Housing project, Aarhus Suspension bridge, Narvik Refurbishment of housing units, Copenhagen DK 498 1 2018 Retail and housing, Baerum NO 474 94 2015 Traffic hub, Bergen NO 471 45 2015 FI 462 18 2016 University, new construction, Tampere Housing units and parking garage, Copenhagen DK 458 70 2015 NO 429 96 2015 Hospital, Copenhagen DK 422 0 2017 E4 expressway, Rotebro, road bridges, Stockholm SE 418 81 2015 Offices, Lillehammer Housing development project, Malmö SE 416 1 2018 Energy facility, Copenhagen DK 401 93 2017 Construction and excavation works, Copenhagen DK 401 89 2015 Local hospital, new construction, Gothenburg SE 399 88 2015 Tunnel, supplementary works on structure, Stockholm SE 395 54 2016 ORDERS RECEIVED BY PROJECT SIZE, 2014, NCC’S CONSTRUCTION UNITS Dam safety measures, Höljes SE 394 80 2015 College of Music, Stockholm SE 391 46 2016 Projects of SEK 100–300 M increased most in percentage terms during the year and projects exceeding SEK 100 M accounted for more than half of the orders received for the year. The diagram reflects SEK 44 billion of the total orders received of SEK 61 billion. The Group’s total orders received also include orders received by NCC Roads and NCC Housing. Offices, Oslo NO 350 67 2015 <5 SEK M, 7 (5)% 5–10 SEK M, 5 (5)% 10–25 SEK M, 9 (10)% 25–50 SEK M, 11 (14)% 50–100 SEK M, 15 (17)% 100–300 SEK M, 28 (24)% >300 SEK M, 25 (25)% Healthcare center, Järvenpää FI 347 2 2016 Public baths, Malmö SE 341 64 2015 329 75 2017 Energy facility, Copenhagen DK Track maintenance depot, Stockholm SE 310 33 2015 Logistics facility, Vänersborg SE 307 42 2015 56 NCC 2014 FINANCIAL REPORT Significant risks and uncertainties The global economy has entered a recovery phase, during which ever stronger economic indicators and growth forecast are emanating from the US, while the growth rate in debt-laden Europe is being impeded by the need of fiscal consolidation, which, for example, has led to a conflict between Greece and other members of the eurozone. The increase in geopolitical uncertainty deriving from the conflict in Ukraine also seems to be having an adverse impact on the climate for investment. However, since Europe’s largest economy, Germany, has managed to get its export sector moving and to raise consumer confi dence, this could fuel development in other European countries. In the event of increased uncertainty, future developments may have an impact on the measurement of certain items that are based on assess ments and estimations. Values that may be impacted include land held for future development and ongoing property development and hous ing projects. RISK MANAGEMENT AND RISKS Through its business operations, NCC is exposed to various risks, both operational and financial. The operational risks relate to the day-to-day operations. These could be purely operative, apply to tenders or project development, seasonal exposure or assessments of the earnings capac ity of a project. Operational risks are managed within the framework of the internal control established by NCC. The business areas assess and manage their risks using operational systems and developed processes and procedures. The Group’s financial risks such as interest-rate, cur rency, refinancing, liquidity and credit risks are managed centrally in order to minimize and control the risk exposure. Customer-credit risks are handled within each business area. A centralized insurance func tion is responsible for Group-wide non-life and liability insurance, pri marily property and contractor’s insurance. This function also per forms preventive risk-management work together with the business areas, thus resulting in cost-efficiency and coordination of insurable risks. The risk that NCC fails to comply with its Code of Conduct is managed by the Compliance function within CSR. The most significant risks for NCC and the activities that are implemented to manage these risks in a manner that NCC deems efficient are described below. RISK ACTIVITY PRICE The stagnation in price increases for building materi als during recent years has gradually transformed into certain price hikes in some of NCC’s markets. During a shift in economic conditions, there is a risk that prices for input materials and services will increase, and that these cannot be offset by higher prices for NCC's products and services, or by increased effi ciency. Purchases of materials and services account for about two-thirds of NCC's costs. For NCC Roads, raw material costs comprise about one-third of the price for paved asphalt, where the largest input material is the oil product bitumen followed by aggregate prod ucts. Since 2013, NCC has further centralized and enhanced its purchasing pro cesses by establishing a Group-wide purchasing function that governs and coordinates all purchasing. The aim of this organization is to additionally increase efficiency, while reducing purchasing costs and improving profitabil ity. A prerequisite for success in this effort is that the organization fully uti lizes NCC-approved suppliers and ensures that cooperation between the pur chasing organization and the projects is further improved. The number of NCC-approved suppliers is increasing. For a number of years, NCC’s Construction units have worked to increase the efficiency of the construction process, such as by using platforms that c reate greater purchasing volumes for individual products or by coordinating purchases of materials and services in the Nordic region and through interna tional purchases. In these efforts, the purchasing function, in part through non-Nordic procurements, is an important feature and the financial key to gaining control over the price trend. The use of joint platforms is also a prerequisite for NCC Housing and NCC Property Development’s ability to gain control over production costs. NCC Roads purchases bitumen from several international suppliers. Pur chasing and logistics involving bitumen are coordinated between Sweden, Denmark, Finland and Norway. Agreements with customers normally include price clauses that reduce NCC Roads’ exposure to risks. When entering into fixed-price agreements with customers, the price of bitumen is hedged with banks. In several markets, NCC Roads is self-sufficient in terms of aggregate products, in part through holdings of strategically located quarries. SEASONAL EFFECTS The NCC Roads business area is subject to major sea sonal variations. This is clearly evident in sales for the business area in the various quarters over an extended period. Within the asphalt operations, most procure ment is conducted during the spring, and asphalt pro duction and paving activities are conducted during the summer half year. Warm autumn weather could have a positive impact on production, while long, cold winters have negative effects on earnings. To manage these risks, NCC Roads offers the entire value chain of roadrelated products and services. For example, running and maintenance opera tions and also the recycling initiative, the establishment of a network of recy cling terminals for construction and civil engineering debris, supplement the paving operation during the year. DEVELOPMENT Proprietary project development of both residential and commercial properties includes a development and sales risk, in addition to construction contract risk, which are handled by NCC’s Construction units. If mismanaged, this risk could lead to higher tied-up cap ital and also losses. NCC possesses housing and property development competencies. Every pro ject concept must be adapted to local market preferences and the regulatory requirements arising in planning work. State-of-the-art skills are required to optimize the timing of projects and to guide them through, for example, munici pal administration and possible appeal processes. NCC has limited the markets in which the Group is active and expanding. Proprietary housing and property projects are developed primarily in large growing cities in the Nordic countries, as well as in Germany and St. Petersburg. NCC has also consciously decided to refrain from excessively niche-oriented projects intended for narrow target groups, since earnings in this sector have historically not matched the higher inherent risks. Risk limitation is achieved through demands concerning leasing rates for commercial properties and pre-sales of housing before a project is started. Tied-up capital is reduced through early payment by customers. MARKET RISKS NCC 2014 57 FINANCIAL REPORT RISK ACTIVITY O P E R AT I O N A L R I S KS CONSTRUCTION CONTRACT RISK For a building contractor, the principal operational risk limitation is normally during the contract-ten dering process. NCC adopts a selective tendering policy, which is particularly important in a declin ing market, when a company may be tempted to accept low-margin or high-risk projects in order to maintain employment. However, in a growing mar ket, it is important to be selective since an exten sive tendering volume could result in a shortage of internal and external resources for handling all projects, which could lead to both weaker internal control and increased costs. When selecting suitable contracts, NCC assigns priority to projects whose risks are identified, and thus manageable and calculable. Most risks, such as contract risks and technological and production-related risks, are best man aged and minimized in cooperation with the customer and other players dur ing early stages of the project. Various types of cooperative formats, such as NCC Partnering, are ways of managing risk. Project control is of decisive importance to minimizing problems and thus costs. A number of the Group’s units are quality and environmentally certified. A shortage of labor and certain competencies may arise during certain periods due to competition, but also due to a growing generation shift. Consequently, it is vital that NCC works actively to recruit and retain the right personnel and to have an organization with broad competencies, in order to secure the company’s ability to deliver. BREACHES OF CODE OF CONDUCT NCC’s operations are normally established locally and are in many cases dominated by a few players. In a few isolated cases, NCC employees have engaged in efforts to distort the competitive situa tion in breach of the company’s ethical standards and applicable law. The construction industry has a poor reputation concerning its involvement in brib ery and corruption. For several years, NCC has provided training in NCC’s core values and compe tition law. Procedures have been developed to identify and monitor employees who may be in a situation where they are exposed to the risk of collaboration with competitors. Since 2013, NCC has developed its compliance program in order to provide further guidance to enable its employees to act correctly and properly. FINANCIAL RISK TAKING Financial risk taking should be viewed against the capital requirements of NCC’s various operations. Contracting operations normally generate a posi tive cash flow at the early stage of projects. NCC Roads has capital tied up in fixed assets, quarries, crushing plants, asphalt plants, paving machinery and road services. To the extent possi ble, investments that achieve the maximum capac ity utilization are sought. Proprietary housing and property development ties up capital throughout the course of the pro jects; firstly, through investment in land, then dur ing the development phase and finally during the sale of the project. Overall, the financial risk taking is controlled by the ceiling for the debt/ equity ratio that applies for the Group. NCC’s Construction units must normally not have any financial net debt but should instead continuously generate liquidity surplus. Industrial and development operations tie up capital in their individual operation. NCC Roads ties up capital in plants, gravel quarries and various types of equipment, while NCC Housing and NCC Property Development tie up capital in development projects (redevelopment, ongoing and completed projects). In NCC Roads, the seasonal variations in tied-up capital is extensive. The operations in the three capital-intensive business areas are controlled by imposing internal caps on tied-up capital. These are revised c ontinuously but are intended to apply over a medium-long period. FINANCIAL RISKS Financial risks involve interest-rate, currency, refi nancing, liquidity, credit and counterparty risks. NCC’s finance policy for managing financial risks has been adopted by NCC’s Board of Directors and constitutes a framework of guidelines and rules in the form of risk mandates and limits for finance activities. Within the NCC Group’s organization, finance activities are centralized to Corporate Finance, partly in order to monitor the Group’s overall financial risk positions, partly to achieve cost-effectiveness and economies of scale and to accumulate exper tise, while protecting Group-wide interests. The Group’s financial risks are managed by the Group’s internal bank. Customer-credit risks are handled within each business area. For a more comprehensive description of financial instruments and financial risk management, see Note 39, Financial instru ments and financial risk management. RISK OF ERRORS IN FINANCIAL REPORTING RISK OF ERRORS IN PROFIT RECOGNITION In projects with construction contracts, NCC nor mally applies percentage-of-completion profit rec ognition. This means that profit is recognized in parallel with completion, before the final result is established. The risk that the final profit will deviate from percentage-of-completion is min imized through NCC’s project-management model. The project management model, which is part of NCC’s operational control, ensures on a continuous basis the necessary production estimates, reconciliation of work performed, final forecasts and follow-up of all construction projects on which profit recog nition is based. If the final result of a project is expected to be negative, the entire loss from the project must immediately be charged against earnings, regardless of the project’s completion rate. When the outcome of a construc tion project cannot be calculated in a reliable manner, due to uncertainty in the project, revenue recognition must only occur in the amount corresponding to the recognized project costs. ESTIMATES AND ASSESSMENTS Since the recognition of certain items is based on estimates and assessments, these items are subject to uncertainty. Market conditions have a particular impact on the value of land held for future develop ment and ongoing property development and hous ing projects. These items are recognized on the basis of what are current, difficult-to-assess assumptions, such as sales prices, production costs, land prices, rent levels, yield requirements and the timing of production starts and/or sales. NCC continuously monitors developments in the market and tests the assump tions made on an ongoing basis. Refer also to critical estimates and assess ments in Note 1. 58 NCC 2014 FINANCIAL REPORT SENSITIVITY AND RISK ANALYSES Change Effect on profit after financial items, SEK M (annual basis) Effect on return on equity, (percentage points) Effect on return on capital employed (percentage points) Comments NCC’s Construction units Volume +/–5% 158 1.5 0.9 Operating margin +/–1 percentage point 385 3.6 2.1 47 0.4 0.3 For NCC’s Construction operations, a onepercentage-point increase in the margin has a significantly larger impact on earnings than a 5-10 percent increase in volume. This reflects the importance of pursuing a selective tendering policy and focusing on risk management in early project stages. NCC Roads Volume +/–5% Operating margin +/–1 percentage point 122 1.1 0.7 Capital rationalization +/–10% 10 0.1 0.3 Volume +/–10% 146 1.4 0.8 Operating margin +/–1 percentage point 101 1.0 0.5 NCC Roads’ operations are affected by such factors as price levels and the volume of produced and paved asphalt. An extended season due to favorable weather conditions increases volumes and, because the proportion of fixed costs is high, the affect on the margin is considerable. NCC Housing For proprietary housing projects within NCC Housing, the major challenge is to have the right products in the market and to guide them through the planning process so they arrive in the market at the right time. NCC Property Development Sales volume, projects +/–10% 30 0.3 0.2 Sales margin, projects +/–1 percentage point 30 0.3 0.2 Change in interest rate, net indebtedness* +/–1 percentage point 19 0.5 Volume change, net indebtedness SEK M 13 NCC Property Development’s earnings are predominantly determined by sales. Opportunities to sell property projects are largely affected by the leases signed with tenants, whereby an increased leasing rate facilitates a higher sales volume. The value of a property is also determined by the difference between operating expenses and rent levels, which means that a change in the rent levels or operating economy of projects in progress could change the value of such projects. Group Change in equity/assets ratio –5 percentage points 0.1 6.2 0.4 The NCC Group had a healthy financial position in 2014. Net indebtedness was higher at the end of the year than in 2013, but on average over the year it was on par with 2013. * Excluding pension liability according to IAS 19. NOMINATION WORK Ahead of the 2015 Annual General Meeting (AGM), NCC’s Nomina tion Committee comprises Viveca Ax:son Johnson (Chairman of the Board of Nordstjernan AB), Marianne Nilsson (Executive Vice Presi dent of Swedbank Robur AB), and Johan Strandberg (Analyst at SEB Fonder), with Viveca Ax:son Johnson as Chairman. Tomas Billing, Chairman of the NCC Board of Directors, is a co-opted member of the Nomination Committee but has no voting right. REMUNERATION The Board of Directors’ motion concerning guidelines for determin ing salary and other remuneration of the Chief Executive Officer and other members of the company’s management (Executive Manage ment Group). The Board has evaluated the application of the guidelines for sal ary and other remuneration of the CEO and other members of the company’s management (Executive Management Group), as resolved by the 2014 AGM, and the applicable remuneration structures and remuneration levels in the company. As a result of the evaluation of the total remuneration package for the Executive Management Group, the Board proposes that the 2015 AGM adopts the current guidelines for 2015. These guidelines encompass the Executive Management Group, including the CEO. The objective of the guidelines for salary and other remuneration of the Executive Management Group is to enable NCC to offer mar ket-based remuneration that facilitates the recruitment and retention of the best possible competencies within the NCC Group. The aim is that the total remuneration package will support NCC’s long-term strategy. The amount payable to the Executive Management Group comprises fixed salary, variable remuneration, the long-term perfor mance-based incentive program, pension and other benefits. Fixed salary. When determining the fixed salary, the individual executive’s sphere of responsibility, experience and achieved results are to be taken into account. The fixed salary is to be revised either annually or every second year. Short-term variable remuneration. The short-term variable remuneration must be maximized and related to the fixed salary, as well as based on the outcome in relation to established targets, with financial targets accounting for by far the greatest proportion. The reason for paying variable remuneration is to motivate and reward value-generating activities that support achievement of NCC’s longterm operational and financial objectives. NCC 2014 59 FINANCIAL REPORT Assuming that the long-term performance-based incentive program is adopted by the 2015 AGM, the short-term variable remuneration payable to the CEO will be maximized at 50 percent of fixed salary and the amount payable to other members of the Executive Management Group will be maximized at 30–40 percent of fixed salary. The variable shortterm remuneration is to be revised annually. It is estimated that the company’s undertakings in relation to the executives concerned will cost the company a maximum of SEK 17.8 M, including social security fees. Should the AGM not vote in favor of a long-term performancebased incentive program, the variable remuneration payable to the CEO will be maximized at 60 percent of fixed salary and that for other members of the Executive Management Group will be maximized at 40–50 percent of fixed salary, which is equal to a maximum cost of SEK 22.4 M including social security fees. Pensions and other benefits. NCC is endeavoring to move gradually towards defined-contribution solutions, which entail that NCC pays contributions that represent a specific percentage of the employee’s salary. Members of the Executive Management Group active in Sweden are entitled, in addition to basic pension, which is normally based on the ITP plan, to receive a defined-contribution supplementary pension for salary increments exceeding 30 income base amounts. The income base amount for 2015 is SEK 58,100. Members of the Executive Management Group active in another country are covered by pension solutions in accordance with local practices. NCC is endeavoring to achieve a harmonization of the retirement age of Members of the Executive Management Group at 65 years. Other benefits. NCC provides other benefits to members of the Executive Management Group in accordance with local practices. The combined amount of such benefits in relation to total remuneration may constitute only a limited value and correspond essentially to the costs normally arising in the market. Periods of notice and severance pay. A member of the Executive Management Group who terminates employment at NCC’s initiative is normally entitled to a 12-month period of notice combined with severance pay corresponding 12 months of fixed salary. During the said 12 months, the severance pay is deductible from remuneration received from a new employer. The period of notice is normally six months if employment is terminated on the initiative of the employee. These guidelines may be disapplied by the Board if there is special reason to do so in individual cases. Long-term performance-based incentive plan The Board proposes that the AGM resolve to introduce a long-term performance-based incentive program for senior executives and key personnel within the NCC Group (LTI 2015). The proposal essentially matches the long-term performance-based incentive programs earlier adopted for 2014, 2013 and 2012. A total of 148 employees are included in LTI 2014. The Board is of the opinion that incentive programs of this type are of benefit to the company’s long-term development. The purpose of the LTI programs is to ensure a focus on the company’s long-term return on equity and to minimize the number of worksite accidents. It is proposed that LTI 2015 encompass a total of approximately 200 participants within the NCC Group. More detailed information on the proposal and earlier long-term incentive programs is available at www.ncc.se. Also refer to Note 5, Number of employees, personnel expenses and remuneration of senior executives. CORPORATE GOVERNANCE REPORT The Corporate Governance Report is included as a separate section of NCC’s 2014 Annual Report and does not constitute a feature of the formal annual report documentation; refer to the Corporate Governance section on pages 110–115. SIGNIFICANT EVENTS AFTER THE BALANCE SHEET DATE On January 23, 2015, NCC announced the start of its own staffing company to manage work peaks. With its own company, NCC will gain full insight and control over agreements and be able to ensure compliance with rules, guidelines and NCC’s Code of Conduct. The staffing company will be headquartered in Poland. The new company, NCC Montage, will commence operations in August 2015. The company will successively replace the capacity that NCC currently insources from external staffing companies. This corresponds to five to ten percent of the total number of blue-collar workers at NCC. The operations will be established in Poland and be used when needs arise in projects under way in the Nordic countries where NCC is active. The operations that were previously performed by NCC Construction Finland and NCC Housing in St. Petersburg will be merged into a single unit. The new unit will be part of NCC Housing. The organizational changes apply from January 27, 2015. Financial reporting is being changed effective January 1, 2015. In 2014, the construction operations in St. Petersburg accounted for 6 percent of NCC Construction Finland’s sales. In conjunction with the Board meeting in January 2015, NCC’s Board of Directors decided on an exception from NCC’s policy for hedging exchange-rate risks. The policy entails that the financing of assets may occur in local currency. The approved exception from the policy entails that the CEO, within an established limit, is able to decide not to ruble-hedge assets in Russia. See also Note 39 Financial instruments and financial risk management OUTLOOK NCC expects that the Nordic construction market will grow slightly in 2015 and the strongest growth are expected in the Norwegian and Swedish markets. In Finland, the market is expected to remain weak in 2015. NCC believes that an increase in construction, primarily residential construction, will boost demand for stone material. The asphalt market also has the potential for growth in 2015. Demand in road services is stable but the market is characterized by intense competition. For 2015, NCC expects generally healthy demand in the housing market, primarily in Sweden and Germany. In Finland, demand is expected to be weak in 2015. The transaction volume in NCC’s property markets improved in the preceding year and volumes are expected to remain on par with 2014. PROPOSED DIVIDEND Since January 1, 2002 and January 1, 2009, respectively, NCC Construction Sverige AB and NCC Boende AB have been conducting operations on a commission basis on behalf of NCC AB. The Board proposes a dividend of SEK 12.00 (12.00) per share, divided into two payments. The proposed record date for the first payment of SEK 6.00 is March 26, 2015 and the proposed date for the second payment of SEK 6.00 is October 27, 2015. The dividend is in line with NCC’s dividend policy and corresponds to 71 percent of profit after tax for the 2014 fiscal year. If the AGM approves the Board’s motion, it is estimated that the first dividend will be paid via Euroclear Sweden AB on March 31, 2015 with the second payment on October 30, 2015. The Board’s statement regarding the proposed dividend and the buyback of NCC’s own shares will be available on the company’s website and be distributed to shareholders at the AGM. Net sales and earnings AMOUNTS AND DATES PARENT COMPANY Commission agreement Invoicing for the Parent Company amounted to SEK 19,614 M (23,357). Profit after financial items was SEK 1,338 M (1,723). The change was mainly due to lower dividends from subsidiaries and to impairment losses from participations in Group companies. In the Parent Company, profit is recognized when projects are completed. The average number of employees was 6,610 (7,173). Unless otherwise indicated, amounts are stated in SEK millions (SEK M). The period referred to is January 1–December 31 for incomestatement items and December 31 for balance-sheet items. Roundingoff differences may arise. 60 NCC 2014 FINANCIAL REPORT Consolidated income statement with comments SEK M Note 2014 2013 1, 19, 36 Net sales 2, 3 56,867 57,823 Production costs 5, 6, 8, 15, 25 –51,176 –52,027 Gross profit Selling and administrative expenses 5, 6, 7, 15 Result from sales of owner-occupied properties Impairment losses and reversal of impairment losses, fixed assets 8, 15 Result from sales of Group companies 9 Result from participations in associated companies and joint ventures Operating profit 3, 10 Financial income Financial expense 8 Net financial items 12 Profit after financial items 5,691 5,796 –3,117 –3,130 20 6 7 3 8 1 2,604 2,679 46 75 –416 –354 –370 –279 2,234 2,400 Tax on net profit for the year 24 –396 –411 NET PROFIT FOR THE YEAR 13 1,838 1,989 1,835 1,986 Attributable to: NCC’s shareholders Non-controlling interests 3 3 1,838 1,989 17.01 18.40 17.01 18.40 Total number of issued shares 108.4 108.4 Average number of shares outstanding before dilution during the year 107.8 107.9 Average number of shares after dilution 107.8 107.9 Total number of shares outstanding before dilution at year-end 107.8 107.8 Net profit for the year Earnings per share Before dilution Profit after tax, SEK After full dilution Profit after tax, SEK Number of shares, millions Consolidated statement of comprehensive income with comments SEK M Note Net profit for the year 2014 2013 1,838 1,989 Items that have been recycled or could be recycled to profit for the year1) Translation differences during the year in translation of foreign operations 138 Hedging of exchange-rate risk in foreign operations –85 Tax attributable to hedging of exchange-rate risk in foreign operations 24 Fair value changes for the year in cash flow hedges Fair-value changes in cash flow hedges transferred to net profit for the year Tax attributable to cash flow hedges 24 –18 19 4 –41 6 –19 13 13 –4 24 1 –497 187 Items that cannot be transferred profit for the year Revaluation of defined-benefit pension plans Tax attributable to items that cannot be transferred to profit for the year 109 –41 –388 146 Other comprehensive income during the year –364 147 Total comprehensive income for the year 1,474 2,136 1,471 2,133 Attributable to: NCC’s shareholders Non-controlling interests Total comprehensive income for the year 1) Also refer to the specification of the item Reserves in shareholders’ equity, p. 67. 3 3 1,474 2,136 NCC 2014 61 FINANCIAL REPORT NET SALES Net sales amounted to SEK 56,867 M (57,823). The decline was due to lower sales in NCC Construction units in Sweden, Norway and Fin land, and in NCC Property Development. During 2014, fewer projects were recognized in profit than in 2013, which explains the lower net sales in NCC Property Development. For NCC Roads, sales were higher than in 2013, primarily as a result of higher sales in stone material operations. The volumes of stone material rose year-on-year mainly as a result of strong performance in Sweden and Norway in the fourth quarter. An increased number of profit-recognized hous ing units for private customers resulted in higher net sales for NCC Housing compared with the preceding year. Exchange-rate changes increased sales by SEK 626 M compared with 2013. GROSS PROFIT Gross profit includes impairment losses and reversal of impairment losses in a combined amount of SEK 4 (17) M. In 2014, impairment losses on properties held for future development amounted to SEK 4 M (2). The preceding year included SEK 23 M of impairment losses on projects and land in NCC Housing, primarily in Denmark. Refer also to Note 8, Impairment losses and reversal of impairment losses. OPERATING RESULTS Operating profit amounted to SEK 2,604 M (2,679). All business areas reported higher earnings year-on-year, with the exception of NCC Property Development, which reported fewer and lower earn ings from profit-recognized projects. The greatest earnings improve ment was attributable to NCC Housing, which recognized more hous ing units in profit during the year. The total operating profit for NCC’s Construction units was higher than in the preceding year because the operating margin was higher for all units. In 2013, impairment losses on projects in NCC Construction Norway had a negative impact on earnings. NCC Roads operating profit improved NET SALES AND EARNINGS Net sales declined during 2014, due to lower sales in NCC Construction units in Sweden, Norway and Finland, and in NCC Property Development. Earnings were lower during 2014 because of lower earnings from NCC Property Development, while other business areas noted higher earnings. SEK billion SEK M 60 3,000 50 2,500 40 2,000 30 1,500 20 1,000 0 2010 2011 2012 2013 Net sales, SEK billion Profit after financial items, SEK M 2014 0 compared with 2013, primarily because of higher earnings within road services. Despite a rise in sales of stone material, earnings from stone material declined due to higher costs in Denmark and costs for developing recycling operations. The asphalt operations reported another strong year with a margin that matched the preceding year. NCC Housing’s operating profit was higher than in 2013 as a result of an increase in the number of profit-recognized housing units for pri vate customers, a higher margin on units sold to the investor market and sales of land. Earnings in the preceding year were negatively impacted by the sale of rental units and land, impairment of land and restructuring costs in Sweden. NCC Property Development’s operat ing profit was lower than in the preceding year. During the year, seven (eleven) projects were recognized in profit. In 2013, projects were recognized in profit at a better margin. Changes in exchange rates had a positive impact on operating profit of SEK 30 M compared with previous year. NET FINANCIAL ITEMS Net financial items declined due to higher financial costs resulting from a higher interest-rate situation in Russia. TAXATION The effective tax rate for NCC, 18 (17) percent, was in line with prior years. Refer also to Note 24, Tax on net profit for the year, deferred tax assets and deferred tax liabilities. OTHER COMPREHENSIVE INCOME The change in other comprehensive income derived mainly from net profit for the year and the revaluation of defined-benefit pension plans in which the actuarial gains were lower in 2014. Any tax effects of the above transactions are recognized separately; refer also to Note 24, Tax on net profit for the year, deferred tax assets and deferred tax l iabilities. 62 NCC 2014 FINANCIAL REPORT Consolidated balance sheet with comments SEK M Note 2014 2013 1,802 1, 19, 36 ASSETS Fixed assets Goodwill 15 1,865 Other intangible assets 15 389 267 Owner-occupied properties 16 774 704 Machinery and equipment 16 2,487 2,502 Participations in associated companies 18 52 9 Other long-term holdings of securities 21 156 131 247 Long-term receivables 23 434 Deferred tax assets 24 237 249 Total fixed assets 39 6,395 5,910 Current assets Property projects 25 5,059 5,251 Housing projects 25 13,246 12,625 Materials and inventories 26 746 673 Tax receivables 24 35 92 Accounts receivable 39 7,178 7,377 Worked-up, non-invoiced revenues 27 1,066 918 1,415 1,325 932 Prepaid expenses and accrued income Other receivables 23 1,013 Short-term investments 21 242 143 Cash and cash equivalents 38 2,592 3,548 Total current assets 39 32,592 32,883 38,987 38,793 TOTAL ASSETS SHAREHOLDERS’ EQUITY Share capital 28 Other capital contributions Reserves 867 867 1,844 1,844 –182 –206 Earnings brought forward including profit for the year 6,318 6,152 Shareholders’ equity 8,847 8,658 Non-controlling interests Total shareholders’ equity 20 17 8,867 8,675 LIABILITIES Long-term liabilities Long-term interest-bearing liabilities 29, 35 6,957 7,029 Other long-term liabilities 32 548 299 Provisions for pensions and similar obligations 30, 31 585 125 Deferred tax liabilities 24, 30 268 414 Other provisions 30 2,017 2,070 Total long-term liabilities 39 10,376 9,937 Current liabilities Current interest-bearing liabilities 29, 35 Accounts payable 2,526 2,515 3,960 4,096 Tax liabilities 24 117 58 Invoiced revenues, not worked up 27 4,408 4,264 Accrued expenses and deferred income 34 3,952 3,888 Other current liabilities 32 4,782 5,360 Total current liabilities 39 19,745 20,181 Total liabilities 30,121 30,118 TOTAL SHAREHOLDERS’ EQUITY AND LIABILITIES 38,987 38,793 Assets pledged 37 1,510 1,482 Contingent liabilities 37 2,037 2,261 NCC 2014 63 FINANCIAL REPORT FIXED ASSETS Goodwill Materials and inventories NCC impairment tests goodwill annually or when indications of changes in value arise. No impairment losses were recognized dur ing 2014. A minor acquisition was implemented in NCC Construction Finland and had an impact on goodwill; otherwise, the goodwill value was only impacted by exchange-rate fluctuations. Refer also to Note 4, Acquisition of operations, and Note 15, Intangible assets. Other intangible assets Other intangible assets rose primarily due to strategic development projects in NCC Roads and NCC Housing. Machinery and equipment Machinery and equipment were on par with the preceding year. Investments in machinery primarily occurred in NCC Roads and in NCC Construction Norway. CURRENT ASSETS Property projects The value of property projects matched the preceding year. Refer also to Note 25, Properties classified as current assets. Volumes of asphalt and stone material in NCC Roads account for most of the materials and inventories and were higher than in the preceding year, which was primarily due to higher volumes of stone material. Accounts receivable Accounts receivable declined, primarily in NCC Construction Norway and NCC Roads. LONG-TERM LIABILITIES Provisions for pensions and similar obligations Provisions for pensions increased during the year. When calculating the pension liability, the discount interest rate has been reduced, thus resulting in a higher liability. CURRENT LIABILITIES Other current liabilities Other current liabilities were lower because advances from custom ers were higher in the preceding year, primarily related to property sales. Refer also to Note 32, Other liabilities. Housing projects Investments in ongoing housing projects increased compared with 2013, as a result of higher ongoing production in NCC Housing. Refer also to Note 25, Properties classified as current assets. CAPITAL EMPLOYED, SHARE PER BUSINESS AREA PROFITABILITY In the NCC Group, capital is tied up primarily by the development and industrial operations. During 2014, the return on equity declined due to lower earnings. The return on shareholders’ equity fell from 2010 to 2011 due to lower profitability in the Construction units in Sweden, Finland and Norway, and in NCC Property Development. NCC Construction Sweden, 5 (6)% % NCC Construction Denmark, 2 (2)% 40 NCC Construction Finland, 1 (1)% NCC Construction Norway, 5 (4)% NCC Roads, 17 (18)% NCC Property Development, 22 (20)% NCC Housing, 49 (49)% 30 20 10 0 2010 2011 2012 Return on shareholders’ equity Return on capital employed 2013 2014 64 NCC 2014 FINANCIAL REPORT Parent Company income statement with comments SEK M Note 2014 2013 1 Net sales 2, 33 Production costs 5, 6, 8 Gross profit Selling and administrative expenses 5, 6, 7 Operating profit 19,614 23,357 –17,728 –21,341 1,886 2,016 –1,304 –1,464 582 553 962 1,308 22 –2 Result from financial investments Result from participations in Group companies 8, 9 Result from participations in associated companies Result from other financial fixed assets 1 Result from financial current assets Interest expense and similar items 11 Profit after financial items 89 124 –318 –260 1,338 1,723 Appropriations 14 684 672 Tax on net profit for the year 24 –245 –240 1,777 2,155 2014 2013 NET PROFIT FOR THE YEAR Parent Company statement of comprehensive income SEK M Net profit for the year 1,777 2,155 Total comprehensive income during the year 1,777 2,155 The Parent Company income statement differs from the consolidated income statement in such ways as its presentation and designations of certain items, because the Parent Company’s income statement is compiled in accordance with the Annual Accounts Act while the Group complies with IFRS. The Parent Company comprises the oper ations in NCC AB, as well as NCC Construction Sverige AB and NCC Boende AB, which conduct their own operations on a commission basis on behalf of NCC AB. Invoicing for the Parent Company amounted to SEK 19,614 M (23,357). Profit after financial items was SEK 1,338 M (1,723). The change was mainly due to lower dividends from subsidiaries and to impairment losses from participations in Group companies. In the Parent Company, profit is recognized when projects are completed. The average number of employees was 6,610 (7,173). NCC 2014 65 FINANCIAL REPORT Parent Company balance sheet with comments SEK M Note 2014 2013 SEK M 1, 36 SHAREHOLDERS’ EQUITY AND LIABILITIES Fixed assets Shareholders’ equity Intangible fixed assets 175 75 Share capital 175 75 Statutory reserve Owner-occupied properties and construction in progress 18 17 Machinery and equipment 84 74 16 103 91 17 5,909 6,112 10 10 Financial fixed assets Receivables from Group companies Participations in associated companies 20 Receivables from associated companies Other long-term holdings of securities Deferred tax assets 24 Other long-term receivables Total financial fixed assets 22, 39 Total fixed assets Earnings brought forward 867 2,155 Total shareholders’ equity 7,931 7,432 348 392 Untaxed reserves 14 Provisions 185 175 184 5 5 Other provisions 87 83 Total provisions 42 56 Long-term liabilities Provisions for pensions and similar obligations 31 30 688 6,624 Liabilities to credit institutions 1,700 1,500 Liabilities to Group companies 1,061 1,061 225 505 Current liabilities 225 505 Advances from customers 29 9 29, 39 2,790 2,571 176 78 33 1,649 1,609 59 52 Accounts payable 2,092 1,756 59 52 Liabilities to Group companies 3,678 4,674 4 6 Accounts receivable 2,792 2,666 2,373 2,563 4 9 273 282 348 274 5,791 5,822 6,400 7,100 Tax receivables 27 Total current receivables 617 6,790 Receivables from Group companies Prepaid expenses and accrued income 2 686 6,700 Current receivables Receivables from associated companies 2 616 6,422 Liabilities to associated companies Other current receivables 4,235 6,391 184 Inventories, etc. 26 5,113 6,890 Work in progress on another party’s account Total inventories, etc. 1,041 Total unrestricted shareholders’ equity Total long-term liabilities 25 174 1,041 1,777 Properties classed as current assets Housing projects 174 Net profit for the year Current assets Materials and inventories 867 Unrestricted shareholders’ equity Other liabilities Total properties classified as current assets 28 Total restricted shareholders’ equity Tangible fixed assets Participations in Group companies 2013 Restricted shareholders’ equity 15 Total intangible fixed assets Total tangible fixed assets 2014 1 ASSETS Development expenses Note Short-term investments 38 Cash and bank balances 38 1,938 705 Total current assets 39 14,412 14,184 TOTAL ASSETS 36 21,112 20,974 The Parent Company balance sheet differs from the consolidated balance sheet in terms of presentation and certain designations of items, because the Parent Company’s balance sheet is prepared in accordance with the Annual Accounts Act while the Group complies with IFRS. Tax liabilities 45 573 448 Accrued expenses and deferred income Other liabilities 34 1,209 1,321 Total current liabilities 29, 39 9,425 9,891 TOTAL SHAREHOLDERS’ EQUITY AND LIABILITIES 36 21,112 20,974 Contingent liabilities 37 23,833 23,017 66 NCC 2014 FINANCIAL REPORT Changes in shareholders’ equity with comments GROUP SHAREHOLDERS’ EQUITY ATTRIBUTABLE TO PARENT COMPANY’S SHAREHOLDERS Share capital Other capital contributions Reserves Earnings brought forward Total Non-controlling interests Total share holders’ equity 867 1 844 –207 5,130 7,634 15 7,649 1,989 1,989 Other comprehensive income 143 143 3 146 Total comprehensive income 2,132 2,132 3 2,135 –7 –7 SEK M Opening balance, January 1, 2013 Net profit for the year Acquisition of non-controlling interests Transfer of depreciation of previously revalued assets –1 Repurchase of treasury shares Performance-based incentive program Total transactions with the Group’s s hareholders Shareholders’ equity on December 31, 2013 867 1 844 1 0 0 –28 –28 6 6 –1,080 –1 –1,108 –1,109 –206 6,152 8,658 Net profit for the year –7 –28 –1,080 Dividend 1,989 6 –1 –1,081 –1,109 17 8,675 1,838 1,838 Other comprehensive income 24 –391 –367 3 –364 Total comprehensive income 24 1,447 1,471 3 1,474 –1 –1,295 Performance-based incentive program Dividend Total transactions with the Group’s s hareholders Shareholders’ equity on December 31, 2014 867 1 844 –182 1,838 12 12 –1,294 –1,294 12 –1,282 –1,282 –1 –1,283 6,318 8,847 20 8,867 If previous accounting policies for pensions according to IAS 19 had been applied, shareholders’ equity would have been SEK 1,639 M higher and net indebtedness SEK 585 M lower at December 31, 2014. ACCOUNTING OF SHAREHOLDERS’ EQUITY IN ACCORDANCE WITH IFRS AND SWEDISH COMPANIES ACT Shareholders’ equity is divided into equity attributable to the Parent Company’s shareholders and non-controlling interests. Transfer of value in the form of dividends from the Parent Company and the Group is to be based on a statement prepared by the Board of Direc tors concerning the proposed dividend. This statement must take into account the prudence regulation contained in the Act, in order to avoid dividends being paid in an amount that exceeds what there is coverage for. CHANGE IN SHAREHOLDERS’ EQUITY The change in shareholders’ equity derives primarily from compre hensive income for the year, transactions with non-controlling inter ests and dividends to shareholders. In the Parent Company, the changes are attributable to comprehen sive income for the year and dividends to shareholders. SHARE CAPITAL On December 31, 2014, the registered share capital amounted to 26,023,097 Series A shares and 82,412,725 Series B shares. The shares have a quotient value of SEK 8.00 each. Series A shares carry ten votes each and Series B shares one vote each. OTHER CAPITAL CONTRIBUTIONS Pertains to shareholders’ equity contributed by the owners. TRANSLATION RESERVE The translation reserve includes all exchange-rate differences that arise from the translation of the financial statements of foreign opera tions that have compiled their reports in a currency other than that in which the consolidated financial statements are presented, in NCC’s case, SEK. The translation reserve also includes exchange-rate dif ferences that arise from the revaluation of liabilities and currency for ward contracts entered into as instruments intended to hedge net investments in foreign operations. FAIR VALUE RESERVE The fair value reserve includes the accumulated net change in the fair value of available-for-sale financial assets up to the time that such assets have been sold or their value impaired. HEDGING RESERVE The hedging reserve includes the effective portion of the accumu lated net change in the fair value of cash-flow hedging instruments attributable to hedging transactions that have not yet occurred. REVALUATION RESERVE The revaluation reserve arises from gradual acquisitions, acquisitions step by step meaning an increase in the fair value of previously owned share of net assets resulting from gradual acquisitions. EARNINGS BROUGHT FORWARD INCLUDING NET PROFIT FOR THE YEAR This item includes funds earned by the Parent Company and its sub sidiaries, associated companies, joint ventures and joint operations. NCC 2014 67 FINANCIAL REPORT PARENT COMPANY RESTRICTED SHAREHOLDERS’ EQUITY SEK M UNRESTRICTED SHAREHOLDERS’ EQUITY Share capital Statutory reserves Earnings brought forward 867 174 Opening balance, January 1, 2013 Appropriations of profits Net profit for the year Total share holders’ equity 4,114 1,221 6,376 1,221 –1,221 Total comprehensive income during the year 2,155 Buyback of company shares Dividend Performance-based incentive program –28 –1,080 –1,080 8 Shareholders’ equity on December 31, 2013 867 174 Appropriations of profits 2,155 2,155 –2,155 1,777 –1,294 Performance-based incentive program 867 2014 2013 –175 –161 Translation reserve Translation differences during the year in translation of foreign operations 138 Gain/loss on hedging of exchange-rate risk in foreign operations –85 –18 19 4 –104 –175 Tax attributable to hedging of exchange-rate risk in foreign operations Translation reserve, December 31 Fair value reserve Fair value reserve, January 1 5 5 Fair value reserve, December 31 5 5 Hedging reserve, January 1 –38 –52 Fair value changes for the year in cash flow hedges –41 6 Fair-value changes in cash flow hedges transferred to net profit for the year –19 12 Hedging reserve Tax attributable to cash flow hedges Hedging reserve, December 31 13 -4 –85 -38 Revaluation reserve Revaluation reserve, January 1 2 Transfer to earnings brought forward Translation reserve, December 31 3 –1 2 2 –206 –206 Total reserves Reserves, January 1 Change in reserves during the year – Translation reserve – Hedging reserve 71 –14 –47 14 –182 –206 – Revaluation reserve Reserves, December 31 5,113 1,777 16 1,777 7,931 CAPITAL MANAGEMENT SPECIFICATION OF THE ITEM RESERVES IN SHAREHOLDERS’ EQUITY Translation reserve, January 1 174 7,432 –1,294 16 Shareholders’ equity on December 31, 2014 GROUP 8 4,235 Total comprehensive income during the year Dividend 2,155 –28 –1 The aim of the NCC Group’s strategy is to generate a healthy return to shareholders under financial stability. The strategy is reflected in the financial objectives, which were as follows in 2014: • A return on equity after tax of 20 percent. In 2014, the return on equity was 22 percent. • A debt/equity ratio of less than 1.5. At December 31, 2014, the debt/equity ratio was 0.8. NCC’s subsidiary, NCC Försäkrings AB, as an insurance company, must have investment assets that cover technical reserves for own account. In 2014 and 2013, these requirements were fulfilled. Beside no other Group companies were subject to external capital require ments. For further information on the NCC Group’s financial objectives and dividend policy, see p. 12. 68 NCC 2014 FINANCIAL REPORT Cash flow statements with comments GROUP SEK M Note PARENT COMPANY 2014 2013 2014 2013 2,234 2,400 1,338 1,723 OPERATING ACTIVITIES Profit after financial items Adjustments for items not included in cash flow: – Depreciation/amortization 6 621 621 44 66 – Impairment losses and reversal of impairment losses 8 –194 17 –64 81 128 148 – Exchange-rate differences – Result from sales of fixed assets 153 –38 172 –2 –128 –429 –71 –188 –639 –325 – Other –175 40 20 9 Total items not included in cash flow 406 359 –538 –358 –367 –438 –177 –241 2,273 2,321 624 1,124 – Changes in provisions 30 – Group contributions Tax paid Cash flow from operating activities before changes in working capital Cash flow from changes in working capital Sales of property projects Investments in property projects Sales of housing projects 2,400 4,170 –2,255 –3,890 8,951 7,067 1,526 2,027 –9,712 –7,912 –1,328 –2,022 Other changes in working capital –313 775 118 –417 Cash flow from changes in working capital –928 211 316 –412 1,345 2,532 940 713 –27 –8 –16 –258 Investments in housing projects CASH FLOW FROM OPERATING ACTIVITIES INVESTING ACTIVITIES Acquisition of subsidiaries and non-controlling interests 4, 38 Sale of subsidiaries 38 4 Acquisition of buildings and land 16 –71 Sale of buildings and land Acquisition of other financial fixed assets –58 Sale of other fixed assets Cash flow from investing activities Cash flow before financing –9 –3 –3 25 9 2 –23 –28 –3 21 12 –749 –863 –153 –85 Sale of other financial fixed assets Acquisition of other fixed assets 93 69 78 5 3 –771 –870 –54 –341 574 1,661 887 372 –1,294 –1,080 –1,294 –1,080 325 359 FINANCING ACTIVITIES Dividend paid Repurchase of treasury shares –28 Group contributions paid Loans raised 765 1,022 –810 –723 8 –9 33 4 –6 –167 34 602 –120 –1,515 –741 –355 449 –941 920 532 821 38 3,548 2,634 7,805 6,984 –14 –6 38 2,592 3,548 8,337 7,805 242 143 2,833 3,691 8,337 7,805 Amortization of loans Increase(–)/Decrease(+) in long-term interest-bearing receivables Increase(–)/Decrease(+) in current interest-bearing receivables Increase(+) in non-controlling interests, etc. Cash flow for the year Exchange-rate difference in cash and cash equivalents Cash and cash equivalents, December 31 Short-term investments with a maturity exceeding three months Total cash and cash equivalents at year-end 1,415 –91 1 Cash flow from financing activities Cash and cash equivalents, January 1 –28 NCC 2014 69 FINANCIAL REPORT NET INDEBTEDNESS CASH FLOW FROM OPERATING ACTIVITIES Cash flow from operating activities was lower during the period com pared to previous year SEK 1,345 M (2,532), primarily due to lower interest-free financing. Cash flow from property and housing projects matched the preceding year. Higher sales of housing projects during the year facilitated more starts, and thus increased investments. During the year, lower sales of property projects were offset by lower investments. OTHER CHANGES IN WORKING CAPITAL GROUP SEK M PARENT COMPANY Net indebtedness (interest-bearing liabilities less cash and cash equivalents less interest-bearing receivables) on December 31 amounted to SEK 6,836 M (5,656). The average maturity period for interest-bearing liabilities, excluding loans in Finnish housing com panies and Swedish tenant-owner associations, as well as pension commitments according to IAS 19, was 34 (36) months at the end of the quarter. In December 2014, the Group’s syndicated loan facility was refinanced. The volume was increased from EUR 325 M to EUR 400 M and the maturity period extended from two to five years, with two one-year extension options. Accordingly, unutilized committed lines of credit amounted to SEK 4,774 M (3,869) and the remaining average maturity period on unutilized lines of credit was extended to 52 (33) months. 2014 2013 2014 2013 Increase(–)/Decrease(+) in inventories –63 –19 76 –179 Increase(–)/Decrease(+) in receivables 97 189 –286 452 Increase(+)/Decrease(–) in liabilities –348 606 288 –251 40 –439 Cash flow before financing 118 –417 Change in pension debt Increase(+)/Decrease(–) in net in work in progress Other changes in working c apital –313 775 NET INDEBTEDNESS TREND GROUP, SEK M 2014 Jan–Dec 2013 Jan–Dec Net indebtedness, January 1 –5,656 –6,467 574 1,661 Acquisition/sale of company shares –28 Dividend Cash flow from investing activities amounted to a negative SEK 771 M (neg: 870). Investments in machinery and equipment primarily occurred in NCC Roads and NCC Construction Norway. CASH FLOW FROM FINANCING ACTIVITIES Cash flow from financing was a negative SEK 1,515 M (neg: 741). Dividends had a negative impact of SEK 1,294 M (neg: 1,084) on cash flow. Total cash and cash equivalents including short-term investments with a maturity exceeding three months amounted to SEK 2,833 M (3,691). SPECIFICATION OF NET INDEBTEDNESS Long-term interest-bearing receivables Current interest-bearing receivables Cash and cash equivalents Total interest-bearing receivables and cash and cash equivalents Long-term interest-bearing liabilities Pensions and similar obligations Current interest-bearing liabilities Total interest-bearing liabilities Net indebtedness Cash and cash equivalents Net indebtedness –6,836 –5,656 –10 Net indebtedness, December 31 PARENT COMPANY Cash flow from operating activities in Parent Company was higher than in the preceding year, SEK 940 M (713). The increase was attrib utable to a reduction in capital tied-up in the development business and to an improvement in other working capital. The changes in working capital were primarily influenced by higher debt, lower inventories and an increased balance in work in progress. TREND IN NET INDEBTEDNESS, PER QUARTER 2014 2013 235 230 406 237 2,592 3,548 3,232 4,014 6,957 7,029 585 125 Net indebtedness is affected by seasonal variations. More capital is normally tied up during the second and third quarters due to high activity in asphalt and stone material operations, as well as in parts of NCC’s Construction units. The dividend to NCC’s shareholders is divided into two payment occasions, during the second and the fourth quarter. Net indebtedness increased during 2014 due to a rise in tied-up capital, primarily in housing projects. SEK M 2,526 2,515 10,000 10,068 9,670 8,000 6,836 5,656 6,000 of which, net indebtedness in ongoing projects in Swedish tenant owner associations and Finnish housing companies Interest-bearing liabilities 268 –1,080 Other changes in net indebtedness CASH FLOW FROM INVESTING ACTIVITIES GROUP, SEK M –460 –1,294 4,000 2,000 2,056 1,750 93 36 1,963 1,714 0 Q1 Q2 Q3 Q4 2011 Q1 Q2 Q3 Q4 2012 Q1 Q2 Q3 Q4 2013 Q1 Q2 Q3 Q4 2014 70 NCC 2014 FINANCIAL REPORT Notes CONTENTS NOTES PAGE Note 1 Accounting policies 70 Note 2 Distribution of external net sales 76 77 Note 3 Reporting by operating segments Note 4 Acquisition of operations 78 Note 5 Number of employees, personnel expenses and remuneration of senior executives 79 Note 6 Depreciation/amortization 82 Note 7 Fees and remuneration to audit firms 82 Note 8 Impairment losses and reversal of impairment losses 82 Note 9 Result from participations in Group companies 82 Note 10 Operating expenses by type of cost 82 Note 11 Interest expense and similar items 82 Note 12 Net financial items 82 Note 13 Effects on income statement of exchange-rate changes 83 Note 14 Appropriations and untaxed reserves 83 Note 15 Intangible assets 83 Note 16 Tangible fixed assets 84 Note 17 Participations in Group companies 85 Note 18 Interests in associated companies and joint ventures 87 Note 19 Interests in joint operations 87 Note 20 Participations in associated companies 88 Note 21 Financial investments 88 Note 22 Financial fixed assets 88 Note 23 Long-term receivables and other receivables 89 Note 24 Tax on profit for the year, deferred tax assets and deferred tax liabilities 89 Note 25 Properties classed as current assets 90 Note 26 Materials and inventories 91 Note 27 Construction contracts 92 Note 28 Share capital 92 Note 29 Interest-bearing liabilities 92 Note 30 Other provisions 92 Note 31 Pensions 93 Note 32 Other liabilities 95 Note 33 Work in progress for a third party and net sales 95 Note 34 Accrued expenses and deferred income 95 Note 35 Leasing 95 Note 36 Transactions with related companies 96 Note 37 Pledged assets, contingent liabilities and guarantee obligations 96 Note 38 Cash flow statement 97 Note 39 Financial instruments and financial risk management 98 Note 40 Information about the Parent Company 103 Note 41 Events after the balance sheet date 103 NOTE 1 ACCOUNTING POLICIES The NCC Group applies the International Financial Reporting Standards (IFRS) as adopted by the EU and the interpretive statements issued by the International Financial Reporting Interpretations Committee (IFRIC). The Group also applies the Swedish Annual Accounts Act (1995:1554), the recom mendation RFR 1 ( January 2013), Additional Accounting Regulations for Groups and statements issued by the Swedish Financial Reporting Board. The Annual Report and the consolidated financial statements were approved for issue by the Board of Directors on February 27, 2015. The consolidated income statement and balance sheet and the Parent Company’s income state ment and balance sheet will be presented to the Annual General Meeting on March 24, 2015 for adoption. NEW IFRS AND AMENDMENTS TO IFRS TO BE APPLIED FROM 2014 The following amendments to IFRS became effective as of the 2014 fiscal year: • I FRS 11 Joint Arrangements is a new standard for recognition of joint ven tures and joint operations. The new accounting policy entails that joint ven tures are to be recognized according to the equity method instead of the pre vious proportional method. However, the proportional method will continue to be applied for joint operations. Since the new standard is expected to have a marginal impact on NCC’s financial statements, NCC will not be restating comparative figures for 2013. Additional new IFRSs and amended IFRSs that are to be applied as of 2014 or later are: • IFRS 10 Consolidated Financial Statements • IFRS 12 Disclosure of Interests in Other Entities • Amended IAS 27 Separate Financial Statements • Amended IAS 28 Investments in Associates and Joint Ventures • Amendment to IAS 32 Financial Instruments: Presentation • Amendment to IAS 39 Financial Instruments: These amendments have had no or only a minor impact on NCC’s financial statements. NEW IFRS AND AMENDMENTS TO IFRS WHOSE APPLICATION HAS YET TO COMMENCE The amendments below to IFRS do not become effective until the 2015 fiscal year and have not been applied in the preparation of these financial statements. • S upplement to IAS 19, Employee Benefits. Defined benefit plans: Employee Contributions. • IFRIC 21 Levies These amendments are expected to have no or only a minor impact on NCC’s financial statements. IFRS 15 Revenue From Contracts with Customers, assuming it is approved by the EU, will be applied as of 2017 and is a new policy-based standard for recogni tion of income. According to IFRS 15, all performance obligations are to be identified on the basis of one or more combined agreements, a transaction price should be determined and subsequently the transaction price is to be allocated among every performance obligation. Thereafter, a performance obligations is to be recognized as revenue either over time or at one point in time. NCC is cur rently investigating the effects, apart from expanded disclosure requirements, that this standard could have on the consolidated financial statements. Other amended standards that are to begin being applied from 2016 and there after, assuming EU approval, are as follows: • I FRS 9 Financial Instruments is expected to have an impact on disclosures in NCC’s financial statements. • Amendment to IAS 16 and IAS 41: Bearer Plants • A mendment to IAS 16 and IAS 38: Clarification of Acceptable Methods of Depreciation and Amortization • A mendment to IAS 10 and IAS 28: Sale or Contribution of Assets between an Investor and its Associate or Joint Venture • A mendment to IAS 11: Accounting of Acquisitions of Interests in Joint O perations • Amendment to IAS 27: Equity Method on Separate Financial Statements. T hese amendments are expected to have no or only a minor impact on NCC’s financial statements. PARENT COMPANY ACCOUNTS COMPARED WITH CONSOLIDATED FINANCIAL STATEMENTS The Parent Company has prepared its annual report in accordance with the Annual Accounts Act (1995:1554) and recommendation RFR 2 (January 2014) Accounting for Legal Entities as well as statements issued by the Swedish NCC 2014 71 FINANCIAL REPORT Financial Reporting Board. As of 2013, the Parent Company recognizes Group contributions received and granted as appropriations, which is in accord with the alternative rule in RFR 2. For tax reasons, the Swedish Financial Reporting Board has granted exemption from the requirement that listed parent compa nies must report certain financial instruments at fair value. NCC applies the exemption rules and has thus refrained from reporting certain financial instru ments at fair value. The accounting policies presented below differ from those used in the consolidated financial statements: • Subsidiaries • Associated companies • Joint arrangements • Construction contracts and similar assignments • Leasing • Income taxes • Financial instruments • Pensions • Borrowing costs The differences are presented under the respective headings below. Participations in associated companies are consolidated in accordance with the equity method. NCC’s share in associated companies relates to their operations and its share in the results of associated companies is recognized in profit or loss as “Result from participation in associated companies,” which is part of operating profit. Amounts are recognized net after taxes. In the Parent Company, associated companies are recognized at acquisition value less any impairment losses. Dividends received are recognized as revenue. CONSOLIDATED FINANCIAL STATEMENTS Elimination of intra-Group transactions Receivables, liabilities, revenues and costs, as well as unrealized gains and losses, that arise when a Group company sells goods or services to another Group company are eliminated in their entirety. Unrealized losses are eliminated in the same way as unrealized gains, but only insofar as there are no impairment requirements. This also applies to joint arrangements and associated companies, in an amount corresponding to the Group’s holding. Refer to Note 36, Transac tions with related companies. The consolidated financial statements include the Parent Company and the companies and operations in which the Parent Company, directly or indirectly, has a controlling interest, as well as joint arrangements and associated companies. Purchase method As of January 1, 2010, the acquisition of business operations is handled in accordance with the purchase method. This method entails that the acquisition of a subsidiary is regarded as a transaction whereby the Group indirectly acquires the subsidiary’s assets and takes over its liabilities. The fair value on the date of acquisition of the acquired identifiable assets and assumed liabili ties, as well as any non-controlling interests, is determined in the acquisition analysis. In the event of a business combination in which transferred compensation, any non-controlling interests and the fair value of previously owned interests (in connection acquisitions achieved in stages) exceed the fair value of the acquired assets and assumed liabilities that are recognized separately, the dif ference is recognized as goodwill. When the difference is negative, what is known as a bargain acquisition, this is recognized directly in profit or loss. Acquired and divested companies are included in the consolidated income statement, balance sheet and cash flow statement during the holding period. Subsidiaries Companies in which the Parent Company has a controlling influence, in prac tice through a direct or indirect holding carrying more than 50 percent of the voting rights, are consolidated in their entirety. Controlling influence is defined as power over the investee, the right to variable returns from its involvement with the investee and the ability to exercise its power over the investee to affect the investor's returns. Shares in subsidiaries are recognized in the Parent Com pany at acquisition value (cost). Should the recoverable value of shares in sub sidiaries fall below the fair value, an impairment loss is recognized. Dividends received are recognized as revenue. For information on NCC’s subsidiaries, refer to Note 17, Participations in Group companies. Non-controlling interests In companies that are not wholly owned subsidiaries, non-controlling interests are recognized as the share of the subsidiaries’ equity held by external share holders. This item is recognized as part of the Group’s shareholders’ equity. Non-controlling interests are recognized in profit or loss. Information about the share of profit attributable to non-controlling interests is disclosed in conjunc tion with the consolidated income statement. The effects of transactions with non-controlling interests are recognized in shareholders’ equity if they do not give rise to a change in controlling influence. Associated companies Associated companies are defined as companies in which the Group controls 20–50 percent of the voting rights. Companies in which the Group owns less than 20 percent of voting rights but exercises a significant influence are also classified as associated companies. Refer to Note 18 for information about the Group’s participations in associated companies, and Note 20 for the Parent Company’s participations in associated companies. Joint arrangements Joint arrangements in NCC are defined as projects conducted in forms similar to those of a consortium, meaning subject to joint control. This could take the form of, for example, jointly owned companies that are governed jointly. Joint arrange ments are divided into joint ventures, which are consolidated according to the equity method, or into joint operations, which are consolidated according to the proportional method. For additional information, see Note 18, Interests in associ ated companies and joint ventures, and Note 19, Interests in joint operations. In the Parent Company, joint arrangements are recognized at acquisition value less any impairment losses. Dividends received are recognized as revenue. Internal pricing Market prices are applied for transactions between Group entities. Foreign subsidiaries, associated companies and joint arrangements Foreign subsidiaries, associated companies and joint arrangements are recog nized using the functional currency and are translated to the reporting currency. For NCC, the functional currency is defined as the local currency used in the reporting entity’s accounts. The Parent Company’s functional currency is SEK. The reporting currency is defined as the currency in which the Group’s overall accounting is conducted, in NCC’s case SEK. REVENUE With the exception of contracting assignments, the Group recognizes revenues in profit or loss when, among other factors, the material risks and rewards asso ciated with ownership have been transferred to the purchaser. Construction contracts and similar assignments Percentage-of-completion income recognition of construction projects Application of the percentage-of-completion method entails income recognition in pace with the degree of completion of the project. To determine the amount of income worked up at a specific point in time, the following components are required: • Project revenue – Revenues related to the construction contract. The revenues must be of such a character that the recipient can credit them to income in the form of actual payment received or another form of payment. • Project cost – Costs attributable to the construction assignment, which corre spond to project revenues. • Completion rate (worked-up rate) – Recognized costs in relation to estimated total assignment costs. The fundamental condition for income recognition based on percentage of com pletion is that project revenues and costs can be quantified reliably. As a consequence of income recognition based on the percentage-of-comple tion method, the trend of earnings of ongoing projects is reflected immediately in the financial statements. Percentage-of-completion income recognition is subject to a component of uncertainty. Due to unforeseen events, the final profit of the projects may occasionally be higher or lower than expected. It is particularly dif ficult to anticipate profit at the beginning of the project period and for technically complex projects or projects that extend over a long period. For projects that are difficult to forecast, revenue is recognized in an amount corresponding to the worked-up cost, meaning that zero earnings are entered until the profit can be reliably estimated. As soon as this is possible, the project switches to the percentage-of-completion method. Provisions posted for potential losses are charged against income for the rele vant year. Provisions for losses are posted as soon as they become known. 72 NCC 2014 FINANCIAL REPORT Balance-sheet items such as “worked up, non-invoiced revenues” and “Invoiced revenues, not worked up” are recognized in gross amounts on a pro ject-by-project basis. Projects for which worked-up revenues exceed invoiced revenues are recognized as current assets, while projects for which invoiced revenues exceed worked-up revenues are recognized as a current interest-free liability. Refer to Note 27 Construction contracts. The following example illustrates how the percentage-of-completion method is applied. On January 1 of Year 1, NCC receives a contract regarding the con struction of a building. The project is estimated to take two years to complete. The contract price is 100 and the anticipated profit from the project is 5. On December 31 of year 1, NCC’s costs for the project amount to 47.5, in line with expectations. Since NCC has completed half of the work and the project is pro ceeding as planned, NCC recognizes half of the anticipated profit of 5, that is 2.5, in the accounts for Year 1. Income recognition on completion means that profit is not recognized until the end of Year 2, or the beginning of Year 3, depending on when the final financial settlement with the customer was agreed. Profit Income recognition on completion According to percentage-of-completion Year 1 Year 2 0 5 2.5 2.5 Contracts connected to operation and maintenance agreements with a central government, county council or municipality For agreements that contain both a contract and an operation and maintenance service, the revenue must be allocated to the various parts. Depending on how the payment is to be made, NCC may either receive a financial asset in accord ance with a predetermined payment plan or an intangible asset providing the right to possible payment. The payments must be discounted. The part that pertains to the contract-related service is recognized on a per centage-of-completion basis. Due to the above classification, the operation and maintenance part is recognized as revenue on an even basis over the term of the contract or when the benefits are transferred to NCC. Work in progress in the Parent Company NCC does not apply percentage-of-completion profit recognition in the Parent Company. Projects that are not completed on the balance-sheet date are recog nized in the Parent Company accounts as work in progress. The invoicing amount is equivalent to the amount billed to the customer, including amounts withheld by the customer in accordance with contract terms. Advances not matched by work performed reduce the invoiced amount. Costs incurred by a particular construction worksite include: • C ost of installation materials, consumption materials and construction tools. • Wages, salaries and remuneration, including social security fees, for supervi sors and other staff on site. • C ost of subcontracts and other external and internal services. • E xternal and internal machine rentals and transport costs. Work in progress on another party’s account comprises the difference between invoicing and costs incurred. Income is recognized when the project is com pleted. As a result of this accounting method, this entry may include profits not entered as income. When a project is expected to incur a loss, a provision is posted for such a loss. For details, refer to Note 33, Work in progress on another party’s account and net sales. Proprietary housing projects Profit from proprietary housing projects is recognized at the time the housing unit is transferred to the end customer. Profit from sales of housing units to investors Profit from sales of housing units to investors is recognized at the time when material risks and rewards are transferred to the acquirer, which normally coin cides with the transfer of the right of ownership. Housing projects sold prior to completion of construction may, if certain con ditions have been met, be recognized as profit in two separate transactions; one for the development of land and housing, within NCC Housing, on condition that the risks and rewards have been transferred, and the second one for the con struction contract, within NCC’s construction units, in pace with completion. Result from sales of development properties NCC’s sales include revenues from sales of properties classed as current assets. Sales also include rental revenues from properties classed as current assets. Property sales are recognized at the time when material risks and rewards are transferred to the purchaser, which normally coincides with the transfer of ownership rights. Property projects sold before construction is completed may, if certain conditions have been met, be recognized as profit in two separate transactions when the property (land or land with ongoing construction) is sold and, at the same time, a separate agreement is signed with the purchaser con cerning the construction of a building or completion of the ongoing construc tion. The first transaction – sale of a property project – which is recognized in NCC Property Development, comprises the realization of a property value that has been accumulated at several levels, such as site acquisition, formulation of a detailed development plan, design of a property project, receipt of a building per mit and leasing to tenants. This value accumulation is finally confirmed by means of the sale. The second transaction is the contracting assignment, meaning imple mentation of construction work on the sold property. The first transaction is recognized as profit, provided that the material risks and rewards are deemed to have been transferred, in the manner stated above, and the second transaction is recognized as profit within NCC Construction units in pace with the degree of completion of the project. It could also be the case that property projects are sold with guarantees of certain leasing to tenants or with a stipulation that a supplementary purchase consideration be paid when a certain leasing rate has been achieved. In connection with the date of sale, any rental guarantees are recognized as prepaid income, which is then recognized as reve nue as rental activity progresses. The supplementary purchase consideration is recognized as revenue when the agreed leasing rate has been achieved. Result from sales of owner-occupied properties These items include the realized result of sales of owner-occupied properties. Selling and administrative expenses include costs for the company’s own sales work. Earnings are charged with overhead costs for both completed and nonimplemented transactions. See the income statement. DEPRECIATION/AMORTIZATION Straight-line depreciation according to plan is applied in accordance with the esti mated useful life, with due consideration for any residual values at the close of the period, or after confirmed depletion of net asset value in those cases when the asset does not have an indefinite life. Goodwill and other assets that have an indefinite life are not amortized but subject to systematic impairment testing. NCC applies so-called component depreciation, whereby each asset with a consid erable value is divided into a number of components that are depreciated on the basis of their particular useful life. Depreciation/amortization rates vary in accordance with the table below: Intangible fixed assets Usufructs In line with confirmed depletion of net asset value Software 20–33 percent Other intangible assets 10–33 percent Tangible fixed assets 1,4–10 percent Land improvements 3,7–5 percent Pits and quarries In line with confirmed depletion of net asset value Fittings in leased premises 14–20 percent Plant and equipment 5–33 percent The distribution of the depreciation/amortization posted in profit or loss and bal ance sheet is presented in Comments to the income statement, Note 6, Deprecia tion/amortization, Note 15, Intangible assets and Note 16, Tangible fixed assets. IMPAIRMENT LOSSES This section does not apply to impairment of inventories, assets that arise during the course of a construction assignment, deferred tax assets, financial instru ments, assets connected to pensions or assets classified as investments available for sale, since the existing standards for these types of assets contain specific requirements regarding recognition and valuation. When necessary, although at least once a year, NCC conducts impairment testing. An impairment requirement arises when the recoverable amount is less than the carrying amount. The distribution of impairment losses in the income state ment and balance sheet is described in comments to the income statement, Note 8, Impairment losses and reversal of impairment losses, Note 15, Intangible assets, and Note 16, Tangible fixed assets. The term impairment is also used in connection with revaluations of properties classed as current assets. Valuations of these properties are based on the lowest value principle and comply with IAS 2 Inventories. LEASING In the consolidated financial statements, leasing is classified as either financial or operational. Financial leasing exists if the financial risks and rewards associated with ownership are essentially transferred to the lessee. All other cases are regarded as operational leasing. Financial leasing Assets leased in accordance with financial leasing agreements are capitalized in the consolidated balance sheet as of the date on which the agreement was con cluded and the asset delivered. Corresponding obligations are entered as longterm and current liabilities. Operating leases Operational leasing is recognized in profit or loss. Leasing fees are distributed on the basis of use, which could differ from the leasing fee paid during the year under review. For further information on leasing, refer to Note 35. In the Parent NCC 2014 73 FINANCIAL REPORT Company, all leasing agreements are recognized according to the rule for oper ational leasing. TAXES Income tax comprises current and deferred tax. Taxes are recognized in profit or loss, except when the transactions are recognized in other comprehensive income, with the relating tax effect recognized in comprehensive income. Cur rent tax is tax that is to be paid or received during the current fiscal year. This also includes adjustments of current tax attributable to prior periods. Deferred tax is recognized on the basis of temporary differences between recognized and taxable values of assets and liabilities. For information on tax on current-year profit and deferred tax assets and liabilities, refer to Note 24. Deferred tax assets and liabilities are calculated on the basis of the tax rate determined for the following year in each particular country. When changes occur in tax rates, the change is recognized in profit or loss in the consolidated financial statements. In the Parent Company, untaxed reserves are recognized that consist of the taxable temporary difference arising because of the relationship between reporting and taxation in the legal entity. Untaxed reserves are recognized gross in the balance sheet and the change is recognized gross in profit or loss, as an appropriation. Group contributions received and paid are recognized in the Parent Company’s profit or loss as appropriations. RECOGNITION OF OPERATING SEGMENTS An operating segment is part of the Group that conducts business operations from which it generates revenues and incurs costs and for which independent financial information is available. Furthermore, the earnings of an operating segment are followed up by the chief operating decision maker, who in NCC’s case is the President, for evaluation of results and for allocating resources to the operating segment. The reporting of operating segments concurs with the reports presented to the President. Also refer to Note 3 Recognition of operat ing segments. EARNINGS PER SHARE The calculation of earnings per share is based on the Group’s net profit for the year attributable to Parent Company shareholders and on the weighted average number of shares outstanding during the year. The calculation of earnings per share is not affected by preferred shares or convertible debentures, since the Group has no such items. INTANGIBLE ASSETS Intangible assets are recognized at acquisition cost less accumulated impair ment losses and amortization. Goodwill arises from acquisitions of companies and operations. Goodwill is not amortized. Goodwill in foreign operations is valued in the particular func tional currency and is converted from this functional currency to the Group’s reporting currency at the exchange rates prevailing on the balance sheet date. Usufructs consist primarily of the right to utilize rock pits and gravel quar ries, which are depreciated in parallel with confirmed depletion of net asset value based on volumes of extracted stone and gravel. For the distribution of value, refer to Note 15 Intangible assets. TANGIBLE FIXED ASSETS NCC’s property holdings are divided into: • Owner-occupied properties • Properties classed as current assets Properties classed as current assets are held for development and sale as part of operations. The principles applied for the categorization, valuation and profit recognition of properties classed as current assets are presented under the Current assets section below. Owner-occupied properties Owner-occupied properties are held for use in the Company’s own operations for the purpose of production, the provision of services or administration. Also refer to Note 16, Tangible fixed assets. Machinery and equipment Machinery and equipment is recognized at acquisition value less accumulated depreciation and any impairment losses. FINANCIAL FIXED ASSETS Financial fixed assets are recognized at fair value or amortized cost. Impair ment losses are posted if the fair value is less than the acquisition cost. Also see the “Financial instruments” section on page 74. For information on the value and type of assets, refer to Note 22 Financial fixed assets. The Parent Company recognizes shares in Group companies at acquisition cost and, where applica ble, taking into account write-ups or impairment losses. CURRENT ASSETS Properties classed as current assets Group property holdings recognized as property and housing projects are valued as inventories when the intention is to sell the properties on completion. Property projects are measured at the lower of acquisition value and net realizable value. Property projects are defined as properties held for development and sale within NCC Property Development. Housing projects pertain to unsold residential prop erties, unsold portion of proprietary residential properties with ownership rights, undeveloped land and properties held for future development in NCC Housing. Property projects Property projects within NCC Property Development are divided as follows: • Properties held for future development • Ongoing property projects • Completed property projects For a distribution of values, refer to Note 25, Properties classed as current assets. Properties held for future development, property development Properties held for future development consist of NCC’s holding of land and development rights intended for future property development and sale. Proper ties comprising leased buildings are classified as properties held for future devel opment in cases where the intention is to demolish or refurbish the buildings. Ongoing property projects Properties held for future development are reclassified as ongoing property projects when a definitive decision is taken about a building start and when the activities required in order to complete the property project have been initiated. An actual building start is not necessary. Ongoing property projects include properties under construction, extension or refurbishment. Ongoing property projects are reclassified as completed property projects when the property is ready for occupancy, excluding adjustments to tenant requirements in those properties whose premises are not fully leased. The reclas sification is effective not later than the date of approved final inspection. If a pro ject is divided into phases, each phase must be reclassified separately. In this con text, a phase always comprises an entire building that can be sold separately. Completed property projects Completed property projects can only be derecognized from the balance sheet as a result of a sale or, if they remain unsold, by being reclassified as managed properties. Valuation of commercial property projects The acquisition value of commercial property projects includes expenditure for the acquisition of land and for building design/property development, as well as expenditure for construction, extension or refurbishment. Expenditure for bor rowing costs related to ongoing projects is capitalized. Other borrowing costs are expensed on a current account basis. Property development means that the input of the developer – NCC Property Development – is concentrated to the activities that do not pertain to actual construction. These activities are evalua tion of project concepts, acquisition of land, work on the detailed development plan, project development, leasing and sale. These activities are conducted by the company’s own employees and by external architects and other technical consultants. Development expenditure is capitalized when it pertains to land or properties owned by NCC or over which it has control. Commercial property projects are recognized continuously in the balance sheet at the lower of acquisition value and net realizable value, which is the sell ing value (market value) less estimated costs for completion and direct selling costs. The market value of completed property projects is calculated in accordance with the yield method, which means that the continuous yield (operating net) on the property at full leasing is divided by the project’s estimated yield require ment. Unleased space in excess of normal vacancy is taken into account in the form of a deduction from the value based on the assumed leasing rate. The market value of ongoing property projects is calculated as the value in completed condition, as described above, less the estimated remaining cost of completing the project. Properties held for future development that are included in the project port folio, meaning ones that are held for development and sale, are normally valued in the same manner as ongoing projects, as described above. Other properties held for future development are valued on the basis of a value per square meter of development right or a value per square meter of land. Housing projects Housing projects within NCC Housing are divided between: • Properties held for future development, housing • Capitalized project development costs • Ongoing proprietary housing projects • Completed housing units 74 NCC 2014 FINANCIAL REPORT For a distribution of values, refer to Note 25, Properties classed as current assets. The reclassification from properties held for future development to ongoing pro jects occurs when a decision to initiate construction has been taken. Properties held for future development, housing Properties held for future development are NCC’s holdings of land and develop ment rights for future housing development. Properties with leased buildings are classified as properties held for future development if the intention is to demolish or refurbish the property. Properties held for future development are valued taking into consideration whether the properties will be developed or sold on. The valuation of land and development rights for future development is based on a capital investment appraisal. This appraisal is updated with regard to the established sales price and cost trend when the market and other circumstances so require. In those cases when a positive contribution margin from the development cannot be obtained taking into consideration normal contract profit, an impairment loss is recognized. In cases where properties are to be sold on, the holdings must be measured at the established market value. Capitalized project development costs Development expenditure is capitalized when it pertains to land or properties owned by NCC or over which it has control. Ongoing proprietary housing projects The unsold portion of housing projects for which the purchasers, following acquisition, will directly own their portion of the project, meaning they will have ownership rights, is recognized as a housing project. Completed housing units Project costs for completed unsold residential properties are reclassified from ongoing housing projects to unsold residential properties at the date of final inspection. Completed unsold housing units are measured at the lowest of acquisition value and net realizable value. Properties classed as current assets transferred from subsidiaries Due to the commission relationship between NCC AB and NCC Construction Sweden AB or NCC Boende AB, certain properties included in housing projects are recognized in NCC AB’s accounts, even if the ownership right remains with NCC Construction Sweden AB until the properties are sold to customers. INVENTORIES Inventories are measured at the lower of acquisition value and net realizable value. For a distribution of inventory values, refer to Note 26 Materials and inventories. FINANCIAL INSTRUMENTS Acquisitions and divestments of financial instruments are recognized on the date of transaction, meaning the date on which the company undertakes to acquire or divest the asset. Financial instruments recognized on the asset side of the balance sheet include cash and cash equivalents, loan receivables, accounts receivable, finan cial investments and derivatives. Accounts payable, loan payables and deriva tives are recognized under liabilities. Financial guarantees such as sureties are also included in financial instruments. A financial asset or financial liability is recognized in the balance sheet when the company becomes a party to the instrument’s contractual terms and condi tions. Accounts receivable are recognized in the balance sheet when invoices have been sent. Accounts payable are recognized when invoices have been received. A financial asset is derecognized from the balance sheet when the contrac tual rights have been realized or extinguished. The same applies to portions of financial assets. A financial liability is derecognized from the balance sheet when the contractual obligation has been fulfilled or otherwise terminated. This also applies to part of the financial liability. Financial instruments are classified in the following categories for measure ment: Financial assets at fair value through profit or loss, Investments held to maturity, Loan receivables and accounts receivable and Available-for-sale finan cial assets, Financial liabilities at fair value through profit or loss and Other financial liabilities. When entered for the first time, a financial instrument is classified on the basis of the purpose for which the instrument was acquired. This classification determines how the financial instrument is measured follow ing the first reporting occasion, as described below. Cash and cash equivalents comprise cash funds and immediately available balances at banks and equivalent institutions, as well as short-term investments with a maturity of less than three months at the date of acquisition and that are exposed to only a minor risk of value fluctuation. Financial assets at fair value through profit or loss This category includes the Group’s derivative instruments with a positive fair value and short-term investments. Changes in fair value are recognized among net financial items in profit or loss. All instruments included in this category are available for sale. Derivative instruments that function as identified and effec tive hedging instruments are not included in this category. For an account of hedging instruments, see Hedge accounting below. Investments held to maturity Investments intended to be held to maturity comprise interest- bearing securi ties with fixed or calculable payments and a determined maturity that were acquired with the intention and possibility of being held to maturity. Invest ments intended to be held to maturity are measured at amortized cost. Assets with a remaining maturity exceeding 12 months after the balance-sheet date are recognized as fixed assets. Other assets are recognized as current assets. Loans and accounts receivable Loans and accounts receivable are measured at amortized cost, meaning the amount expected to be received less an amount for doubtful receivables, which is assessed on an individual basis. Since the expected maturity of an account receivable is short, a nominal value without discounting is recognized. Accounts receivable are measured on an ongoing basis. As soon as it is doubt ful that an invoice will be paid, a provision is made for the amount. Although each invoice is measured individually, provisions are noted for invoices that are more than 60 days overdue unless special circumstances apply. Provisions are made for all invoices that are more than 150 days overdue if payment is not secured. Available-for-sale financial assets This category includes financial assets that do not fall into any of the other cate gories, or those assets that the company has elected to classify into this cate gory. Holdings of shares and participations that are not recognized as subsidiar ies, associated companies or joint arrangements are recognized here. These assets are measured at fair value. Impairment losses are posted when testing shows that impairment is required. Financial liabilities at fair value through profit or loss This category includes the Group’s derivative instruments with a negative fair value, with the exception of derivative instruments that function as identified and effective hedging instruments. Changes in fair value are recognized among net financial items. Other financial liabilities Loans and other financial liabilities, such as accounts payable, are included in this category. Liabilities are recognized at amortized cost. Hedge accounting NCC applies hedge accounting in the following categories: Hedging of exchange-rate risk in transaction flows, Hedging of net investments and Hedg ing of the Group’s interest maturities. Hedging of exchange-rate risk in transaction flows Currency exposure associated with future flows is hedged by using currency forward contracts. The currency forward contract that hedges this cash flow is recognized at fair value in the balance sheet. When hedge accounting is applied, the change in fair value attributable to changes in the exchange rate for the currency forward contract is recognized in other comprehensive income, after taking tax effects into account. Any ineffectiveness is recognized in profit or loss. When the hedged flow is recognized in profit or loss, the value change of the currency forward contract is moved from other comprehensive income to profit or loss, where it offsets the exchange-rate effect of the hedged flow. The hedged flows can be both contracted and forecast transactions. Hedging of net investments Group companies have currency hedged their net investments in foreign sub sidiaries within NCC Housing and NCC Property Development. In the consoli dated financial statements, the exchange-rate differences on these hedging positions, after taking tax effects into account, are moved directly to other com prehensive income, insofar as they are matched by the year’s translation differ ences within other comprehensive income. Any surplus amount, so-called inef fectiveness, is recognized among net financial items. NCC uses currency loans and currency forward contracts to hedge net investments. Hedging of the Group’s interest maturities Interest-rate derivatives are used to manage the interest-rate risk. Hedge accounting occurs in cases where an effective hedging relationship can be proved. The value change is recognized in other comprehensive income after taking tax effects into account. Any ineffectiveness is recognized among net financial items. What NCC achieves by hedging interest rates is that the varia ble interest on parts of the Group’s financing becomes fixed interest. Embedded derivatives An embedded derivative is a part of either a financial agreement or a commer cial put or call contract that is equivalent to a financial derivative instrument. An embedded derivative must be recognized separately only if: • t he economic characteristics and risks of the embedded derivative are not closely related to the characteristics and risks of the host contract’s cash flow, and • a separate “stand alone” derivative with the same terms as the embedded derivative meets the definition of a derivative, and NCC 2014 75 FINANCIAL REPORT • t he hybrid (combined) instrument is not measured at fair value in the balance sheet, apart from where changes in this fair value are recognized in profit or loss. If the contractual terms and conditions meet the criteria for an embedded deriv ative, this, in common with other financial derivatives, is measured at fair value, with changes in value recognized in profit or loss. Receivables and liabilities in foreign currency Receivables and liabilities in foreign currency are restated at the exchange rates prevailing on the balance-sheet date. Exchange differences arising from the translation of operational receivables and liabilities are recognized in operating profit, while exchange differences arising from the translation of financial assets and liabilities are recognized in net financial items. Financial instruments in the Parent Company Financial instruments in the Parent Company are recognized at acquisition value less any impairment losses and taking into account earnings effects accrued up to fiscal year-end. In respect of the qualitative and quantitative risk information, reference is made to the disclosures made for the Group above, since Group-wide risk management is applied for the Group. CASH AND CASH EQUIVALENTS Cash and cash equivalents consist of cash, bank balances and short-term invest ments with a maturity of less than three months at the date of acquisition. EQUITY Recognition of Group and shareholder contributions Group contributions and shareholder contributions in the Parent Company are recognized in accordance with their financial impact. Group contributions received and granted are recognized as appropriations. Group contributions granted are recognized as a part of the investment in the subsidiary and are thus subject to customary impairment testing. Repurchase of shares The repurchase of shares (treasury shares), including repurchase costs, has been charged directly against retained earnings. Similarly, the sale of such shares results in an increase in retained earnings. Refer to Note 28 Share capi tal, for more information on treasury shares. REMUNERATION TO EMPLOYEES Share-based remuneration Instrument issued under the NCC Group’s share-based remuneration plan com prise share awards and synthetic (cash-settled) shares. The fair value of allotted share awards is recognized as a personnel cost accompanied by a corresponding increase in shareholders’ equity. The fair value is estimated at the date of allotment by means of an adjustment of the discounted value of the future dividends for which the plan participants will not qualify. Synthetic shares give rise to an undertaking in relation to the employee, which is measured at fair value and recognized as a cost accompanied by a cor responding increase in liabilities. The fair value of the synthetic shares com prises the market price of the Series B NCC share at the particular financial report occasion adjusted by the discounted value of the future dividends for which the plan participants will not qualify. At each financial report occasion, the Parent Company makes an assessment of the probability of whether the performance targets will be achieved. Costs are calculated on the basis of the number of shares and synthetic shares that are estimated to be settled at the close of the vesting period. When settlement of the share awards and synthetic shares occurs, social security fees have to be paid for the value of the employees’ benefit. These vary in the different countries in which NCC is active. During the period in which the services are performed, provisions are also posted for these calculated social security fees based on the fair value of the share awards and the syn thetic shares, respectively, on the reporting date. To satisfy NCC AB’s undertakings in accordance with the option programs, NCC AB has repurchased Series B shares. These are recognized as treasury shares and thus reduce shareholders’ equity. For a description of the NCC Group’s share-based remuneration program, refer to Note 5 p. 80. Post-employment remuneration NCC differentiates between defined-contribution pension plans and definedbenefit pension plans. Defined-contribution plans are pension plans for which the company pays fixed fees to a separate legal entity and does not assume any obligations for payments of additional fees, even if the legal entity lacks suffi cient assets to pay benefits accrued for employment up to and including the balance-sheet date. Other pension plans are defined-benefit plans. Country Defined-benefit pension obligations Defined-contribution pension obligations Sweden Denmark Finland Norway Germany Other countries There are several defined-contribution and defined-benefit pension plans in the Group, some of which are secured through assets in dedicated foundations or similar funds. The pension plans are financed through payments made by the various Group companies. Calculations of defined-benefit pension plans are based on the Projected Unit Credit Method, whereby each term of employment is considered to create a future unit of the total final obligation. All units are computed separately and, combined, represent the total obligation on the bal ance-sheet date. The principle is intended to provide linear expensing of pen sion payments during the term of employment. The calculation is made annu ally by independent actuaries. The calculation is made annually by independent actuaries. When there is a difference between how pension costs are estab lished in the legal entity and in the Group, a provision or receivable for Swedish pension plans is recognized for the payroll tax based on this difference. Accord ingly, the value of the defined-benefit liability is the present value of anticipated future disbursements using a discount rate that corresponds to the interest stated in Note 31 Pensions. The interest rate on first-class housing bonds is used as the basis for calculating the discount interest rate. Swedish definedbenefit pension obligations are funded in the NCC Group’s Pension Foundation. For funded plans, the fair value of plan assets reduces the computed obligation. Changes in plan assets and obligations stemming from experience-based adjustments and/or changes in actuarial assumptions, known as actuarial gains and losses, are recognized directly in other comprehensive income in the period in which they arise. This reporting method is applied for all identified defined-benefit pension plans in the Group. The Group’s disbursements related to defined-benefit pen sion plans are recognized as an expense during the period in which the employ ees perform the services covered by the fee. The Parent Company is covered by the ITP plan, which does not require any payments by the employees. The difference, compared with the principles applied by the Group, pertains mainly to how the discounting rate is deter mined, the fact that the calculation of defined-benefit obligations is based on the current salary level without assuming future pay rises and the fact that all actu arial gains and losses are recognized in profit or loss when they arise. Severance payments In conjunction with notice of employment termination, a provision is posted only if the company is contractually obliged to terminate an employment posi tion before the normal time, or when payments are made as an offering to encourage voluntary termination. For cases in which the company implements personnel cutbacks, a detailed plan is prepared that covers at least the work place concerned, positions, and the approximate number of affected employees and disbursements for every personnel category or position, as is a time sched ule for the plan’s implementation. If severance payment requirements arising from personnel cutbacks extend beyond 12 months after fiscal year-end, such payments are discounted. PROVISIONS Provisions differ from other liabilities in that there is a degree of uncertainty concerning when payment will occur or concerning the size of the amount required to settle the provision. Provisions are recognized in the balance sheet when a legal or informal commitment exists due to an event that has occurred, it is probable that an outflow of resources will be required to settle the commit ment and the amount can be estimated reliably. Guarantee commitments Provisions for future costs arising due to guarantee commitments are recog nized at the estimated amounts required to settle the commitment on the bal ance-sheet date. The computation is based on calculations, executive manage ment’s appraisal and experience from similar transactions. Other provisions Provisions for restoration costs are posted when such obligations arise. Provi sions are posted for that portion of restoration that arises for start-up of a quarry and construction of plants at pits and quarries, and on current account when activities are related to additional extractions at pits and quarries. A provision for restructuring is recognized when a detailed or formal restructuring plan has been established and the restructuring has either started or been announced publicly. No provisions are posted for future operat ing expenses. 76 NCC 2014 FINANCIAL REPORT BORROWING COSTS Borrowing costs attributable to qualifying assets are capitalized as a portion of the capitalized asset’s acquisition value when the borrowing costs total a signifi cant amount. A qualifying asset is an asset that takes a substantial period of time to get ready for its intended use, which in NCC’s case is more than a year. For NCC, the capitalization of borrowing costs is most relevant in the construc tion of property and housing projects. Other borrowing costs are expensed on current account in the period in which they are incurred. In the Parent Com pany, borrowing costs are expensed in their entirety in the period in which they are incurred. ASSETS PLEDGED NCC recognizes collateral pledged for company or Group liabilities and/or obli gations as pledged assets. These may be liabilities, provisions included in the balance sheet or obligations not included in the balance sheet. The collateral may be related to assets entered in the balance sheet or mortgages. Assets are recognized at the carrying amount and mortgages at nominal value. Shares in Group companies are recognized at their value in the Group. For information on types of collateral, refer to Note 37 Pledged assets, guar antees and guarantee obligations. CASH FLOW STATEMENT The cash flow statement is prepared using the indirect method, in accordance with IAS 7, Statement of Cash Flows. The recognized cash flow includes only transactions that involve cash payments and disbursements. For information on the effects on cash flow of acquired and divested subsidiaries, refer to Note 38 Cash flow statement. CRITICAL ESTIMATES AND ASSESSMENTS Estimates and assessments that affect the Group’s accounting records have been made on the basis of what is known when the Annual Report was issued. The estimates and assessments may, at a later date, be changed because of, for example, changes in factors in the business environment. Particular attention must be paid to this during economic conditions characterized by major uncer tainty in terms of the construction market and the global financial market, which has been the case during recent years. The assessments that are most critical to NCC are reported below. Percentage-of-completion profit recognition A fundamental condition for being able to estimate percentage-of-completion profit recognition is that project revenues and project costs can be established reliably. This reliability is based on such factors as compliance with NCC’s sys tems for project control and that project management has the necessary skills. The assessment of project revenues and project costs is based on a number of estimates and assessments that depend on the experience and knowledge of project management in respect of project control, training and the prior man agement of projects. There is a risk that the final result will differ from the profit accrued based on percentage-of-completion. At year-end, recognized revenues amounted to SEK 46.9 billion (45.4); refer to Note 27 Construction contracts. Profit recognition of property development projects Property sales are recognized as of the time when significant risks and rewards are transferred to the purchaser. The actual timing of profit recognition depends on the agreement with the purchaser and could occur when signing the agreement, at a certain leasing rate, on completion or when the right of own ership is transferred, or a combination of these variables. This is determined from agreement to agreement and is subject to elements of estimations and assessments, and also applies to both direct sales of a property and indirect sales via the sale of companies. Valuation of properties classed as current assets NCC’s properties classed as current assets are recognized at the lower of acqui sition value and net realizable value. In 2014, impairment losses on properties classed as current assets amounted to SEK 4 M (25), which can be compared with their year-end carrying amount of SEK 18.3 billion (17.9). The assessment of net realizable value is based on a series of assumptions such as sales prices, production costs, the price of land, rent levels and yield requirements plus the possible timing of production start and/or sale. NCC con tinuously monitors developments in the market and tests the assumptions made on an ongoing basis. In some cases, the difference between the carrying amount and the esti mated net realizable value is of a minor value. A change in the assumptions made could give rise to an additional impairment requirement. Valuation of goodwill Goodwill is measured at the lower of cost and recoverable amount. Goodwill in the Group is valued at SEK 1.9 billion (1.8). Several assumptions and estimations are made concerning future conditions, which are taken into account when calculating the discounted cash flow upon which the estimated recoverable amount has been based. Important assump tions include expected growth, margins and the weighted average cost of capi tal. If these assumptions change, the value of the remaining goodwill could be affected; refer to Note 15 Intangible assets, for information on the assumptions and estimations made. Valuation of receivables NCC’s accounts receivable, including receivables for sold property projects, amount to SEK 7.5 billion (7.7); refer to Note 39 Financial instruments and financial risk management. Receivables are measured at fair value, which is affected by several assess ments, of which the one that is most important to NCC is credit risk and thus any need to post provisions for doubtful receivables. Although each receivable must be valued individually, for receivables that are more than 60 days past due special circumstances are generally required for a provision not to be posted in full or in part. Guarantee commitments At year-end, the guarantee provision amounted to SEK 1.4 billion (1.5); refer to Note 30 Provisions. Provisions for future costs due to guarantee commitments are recognized at the amount expected to be required to settle the commitment on the balance-sheet date. This estimate is based on calculations, assessments by company management and experiences gained from past transactions. Pension obligations NCC’s net pension obligation amounts to SEK 0.6 billion (0.1) Recognized amounts are affected by changes in the actuarial assumptions that form the foundation for calculations of plan assets and pension obligations. These actuarial assumptions are described in Note 31 Pensions, as is a sensitiv ity analysis. Guarantee obligations, legal disputes, etc. Within the framework of its regular business operations, NCC occasionally becomes a party to legal disputes. In such cases, an assessment is made of NCC’s obligations and the probability of a negative outcome for NCC. NCC’s assessment is made on the basis of the information and knowledge currently possessed by the company. In one or two cases, these are difficult assessments and the final outcome could differ from the estimation made. NOTE 2 DISTRIBUTION OF EXTERNAL NET SALES GROUP PARENT COMPANY 2014 2013 2014 2013 32,305 32,872 17,419 20,727 Industrial operations 11,370 11,177 Housing development projects 10,134 9,026 2,194 2,618 Property development projects 2,962 4,649 19,614 23,357 17,419 20,739 Construction and civil engineering Other Total 96 99 56,867 57,823 12 Sales distributed by business segment1) NCC Construction Sweden NCC Housing Total 1) For the distribution of consolidated sales, refer to Note 3. 2,194 2,618 19,614 23,357 NCC 2014 77 FINANCIAL REPORT NOTE 3 REPORTING BY OPERATING SEGMENTS NCC’s business operations are divided into seven operating segments based on the parts of the organization monitored by the President and CEO, who is the chief operating decision maker. Each operating segment has a president who is responsible for the daily operations and regularly reports on the results of the segment’s performance to the Executive Management Group. Based on this reporting procedure, the following segments have been identified: NCC Construction Sweden, Denmark, Finland and Norway, which construct housing, offices, other buildings, industrial facilities, roads and other types of infrastructure. NCC Roads’ core business is the production of stone materials and asphalt, as well as asphalt paving and road services in the Nordic region and St. Petersburg. NCC Housing develops and sells housing in selected markets in the Nordic region, Germany, Estonia, Latvia and St. Petersburg. NCC Property Development develops and sells commercial properties in defined growth markets in Sweden, Norway, Denmark and Finland. All transactions between the various segments is conducted on a purely com mercial basis. The segment report recognizes Swedish pension costs using Swedish accounting standards and adjustments to IFRS are made in “Other and eliminations.” Occasionally, “Other and eliminations” may also recognize cer tain items, primarily impairment losses and provisions, attributable to the activ ities conducted in the segments. NCC Construction Sweden Denmark Finland Norway NCC Roads NCC Housing NCC Property Development Total segments External net sales 18,408 3,488 4,227 6,181 11,370 10,134 3,058 56,867 Internal net sales 2,379 842 2,394 552 783 1 68 7,019 –7,019 20,788 4,330 6,621 6,733 12,153 10,135 3,125 63,885 –7,019 56,867 –146 –23 –13 –110 –386 –21 –4 –703 –5 –708 –4 –5 169 2,761 GROUP, 2014 Total net sales Depreciation/amortization Impairment losses and reversal of impairment losses Share in associated company profits Operating profit 640 281 148 146 11 –2 459 918 Other and eliminations Group 56,867 –5 1) 8 8 –157 Financial items 2,604 –370 Profit after financial items 2,234 Capital employed 991 421 287 1,013 3,619 10,508 4,784 21,622 –2,687 18,935 Finland Norway NCC Roads NCC Housing NCC Property Development Total segments Other and eliminations Group 57,823 NCC Construction GROUP, 2013 Sweden Denmark External net sales 19,129 2,857 4,134 6,752 11,177 9,026 4,746 57,821 2 Internal net sales 2,401 688 2,546 656 822 4 65 7,182 –7,182 21,530 3,546 6,680 7,408 11,999 9,030 4,811 65,003 –7,180 57,823 –179 –19 –15 –101 –365 –15 –3 –698 –5 –703 7 –23 –2 –17 6 –5 1 605 713 2,700 –21 2,679 Total net sales Depreciation/amortization Impairment losses and reversal of impairment losses Share in associated company profits Operating profit 6 637 208 127 3 406 -172) Financial items –279 Profit after financial items Capital employed 2,400 1,250 309 271 803 3,557 9,856 3,991 20,035 –1,691 18,345 1) 2014 includes impairment losses on property projects totaling SEK 5 M. 2) 2013 includes impairment losses of housing projects totaling SEK 23 M. OTHER AND ELIMINATIONS 2013 2014 External net sales NCC’s Head office, results from minor subsidiaries and associated companies, as well as the remaining portions of NCC International Eliminations of inter-company gains Other Group adjustments (essentially comprising the difference in accounting policies pertaining to Swedish pensions between the segments and the Group) Total Operating profit External net sales Operating profit –231 2 –215 –18 66 93 –157 127 2 –21 78 NCC 2014 FINANCIAL REPORT Note 3 Reporting by operating segments, cont’d GEOGRAPHICAL AREAS1) ORDERS RECEIVED 2014 Sweden ORDER BACKLOG 2013 32,023 27,560 2013 2014 2014 2013 26,831 30,547 NUMBER OF EMPLOYEES 2014 2013 CAPITAL EMPLOYED 2014 2013 2014 FIXED ASSETS 2013 2) 2014 2013 1,252 1,648 9,517 9,988 8,348 7,382 2,171 2,027 Denmark 8,077 7,683 8,153 5,995 7,576 5,671 428 239 2,086 2,114 3,557 3,847 1,427 1,331 Finland 5,736 7,381 5,343 6,514 9,230 8,181 277 267 2,557 2,786 3,296 3,039 345 313 Norway 9,789 9,691 8,857 7,641 8,989 10,172 175 198 2,348 2,418 3,938 3,453 1,425 1,432 Germany 3,899 3,255 4,227 3,256 3,170 2,508 328 229 715 686 1,268 877 80 72 St. Petersburg 1,697 1,290 1,659 1,800 913 633 148 108 402 356 852 779 67 99 160 118 110 89 157 111 –4 –11 28 12 491 527 Estonia and Latvia 26,429 22,366 OPERATING PROFIT NET SALES 1) R efer also to pages 22-23, NCC’s geographical markets. 2) P ertains to fixed assets that are not financial instruments, deferred tax assets, assets pertaining to post-employment remuneration and rights arising in accordance with insurance agreements. NOTE 4 ACQUISITION OF OPERATIONS Taltekon in Finland was acquired during the second quarter. Taltekon offers technical consulting services and will strengthen installation technology exper tise within NCC Construction Finland. During the second quarter, the assets of Namek were also acquired, thus strengthening NCC Construction Sweden’s position in Gällivare in preparation for investments in urban transformation and mining that are occurring in Malmberget. NCC Roads acquired Grenland in Sweden during the third quarter. The com pany conducts quarry operations and was acquired to further strengthen mar ket positions. From the effective date of the acquisitions until December 31, these opera tions contributed SEK 26 M to consolidated net sales and SEK 1 M to profit after tax. Had the acquisitions become effective on January 1, 2014, company management estimates that consolidated net sales would have been SEK 24 M higher and profit after tax SEK 3 M higher. ACQUIRED OPERATIONS’ NET ASSETS MEASURED AT FAIR VALUE AT ACQUISITION SEK M Acquisition within NCC Construction Finland Intangible assets Acquisition within NCC Roads Other Total 13 1 15 Tangible assets 1 1 2 Inventories 1 1 Accounts receivable and other receivables 4 1 5 Cash and cash equivalents 8 1 9 Accounts payable and other liabilities 3 3 Deferred tax liabilities 2 4 Net identifiable assets and liabilities 9 Consolidated goodwill 14 Purchase consideration including acquired cash and cash equivalents 23 4 11 11 8 20 2 16 2 36 CONSOLIDATED GOODWILL Goodwill amounted to SEK 16 M and was attributable to strengthened market positions. ACQUISITION-RELATED EXPENDITURE Acquisition-related expenditure amounted to SEK 0 M. These expenses have been recognized as other operating expenses in the consolidated income statement. PURCHASE CONSIDERATION SEK M Cash and cash equivalents 27 Purchase consideration 36 The acquired cash balances amounted to SEK 9 M. NCC 2014 79 FINANCIAL REPORT NOTE 5 NUMBER OF EMPLOYEES, PERSONNEL EXPENSES AND REMUNERATION OF SENIOR EXECUTIVES AVERAGE NUMBER OF EMPLOYEES 2013 2014 Number of employees of whom men Number of employees of whom men 6,610 5,868 7,173 6,411 – Boards of Directors 23.7 17.5 2,922 2,718 2,793 2,578 – Other senior executives 12.5 10.6 Senior executives in the Group pertain to the senior executives in the Parent Company together with Presidents of subsidiaries with employees. Percentage of women, % Distribution of company management by gender Parent Company Sweden Group total, including subsidiaries Subsidiaries Sweden Norway 2,349 2,152 2,440 2,251 Finland 2,507 2,040 2,714 2,244 Denmark 2,086 1,812 2,114 1,843 Germany 715 550 686 533 Russia 402 277 356 243 Estonia and Latvia 2013 2014 78 59 84 67 Total in subsidiaries 11,059 9,608 11,188 9,759 Group total 17,669 15,476 18,360 16,170 Parent Company – Board of Directors 30.0 22.2 – Other senior executives 28.6 28.6 WAGES, SALARIES AND OTHER REMUNERATION DISTRIBUTED BETWEEN MEMBERS OF THE BOARD AND SENIOR EXECUTIVES1) AND OTHER EMPLOYEES 2013 2014 Board of Directors and senior executives (of which, bonus) Other employees Total Board of Directors and senior executives (of which, bonus) Other employees Total Parent Company Sweden 45 3,073 3,118 42 3,157 3,199 Total in Parent Company 45 3,073 3,118 42 3,157 3,199 (2.9) (5.5) Social security expenses – of which, pension costs Pension commitment Group total 1,369 9 294 303 19 96 262 271 8,863 8,945 37 8,860 8,956 (11.8) 82 (13.2) Social security expenses 2,815 – of which, pension costs 724 Pension commitment 1,366 9 37 2,803 702 55 1) The senior executives category comprises 14 individuals (15) in the Parent Company, and 48 (47) in subsidiaries. EMPLOYMENT CONDITIONS AND REMUNERATION OF SENIOR EXECUTIVES The Chairman of the Board and other Board members elected by the Annual General Meeting receive director fees only in an amount resolved by the Annual General Meeting. No pensions are paid to Board members. No fee is paid to the Nomination Committee or Board committees. Remuneration for the CEO is proposed by the Chairman of the Board and decided by the Board. Remuneration for other senior executives in the Execu tive Management Group is proposed by the CEO and approved by the Chairman of the Board. Remuneration for the CEO and other senior executives consists of basic sal ary, variable remuneration, share-based payment, other benefits and pensions. The term “other senior executives” pertains to the senior executives who, together with the CEO, constitute the Executive Management Group, as well as those senior executives who are not members of the Executive Management Group but who report directly to the CEO. At the beginning of 2014, there were 13 other senior executives and 14 at the end. Of these, ten were employed by the Parent Company and four by subsidiaries. VARIABLE REMUNERATION The maximum variable remuneration payable to CEO Peter Wågström in 2014 amounted to 40 percent of his basic salary. The variable remuneration was based on financial targets established by the Board. The expensed amount per taining to 2014 corresponded to 12 percent of his basic salary, meaning SEK 711,478. In 2013, SEK 1,762,497 was expensed. Variable remuneration for other senior executives in 2014 corresponded to a maximum of 30 to 40 percent of basic salary based on the outcome of established, primarily financial, targets. The above maximum percentage for the CEO and other senior executives are adjusted downwards by ten percentage points for participants in LTI 2014. The provision posted for variable remuneration payments to other senior execu tives during 2014 corresponded to 3–23 percent (12–37) of basic salary. PENSION CONDITIONS FOR THE CEO CEO Peter Wågström has a defined-contribution pension plan with the pre mium amounting to 30 percent of his basic salary. Peter Wågström’s retirement age is 62. PENSION CONDITIONS FOR OTHER SENIOR EXECUTIVES Other senior executives employed in Sweden are covered by a defined-benefit ITP plan with a retirement age of 65 and, in accordance with the current policy, of a supplementary defined-contribution pension obligation of 30 percent of pen sionable salary exceeding 30 income base amounts. In addition, in accordance with the former policy for which no new subscriptions are permissible, four sen ior executives are encompassed by a supplementary pension plan with retire ment ages of 60 or 62. The supplementary pension plan is paid until the age of 65 and has a target pension of 70 percent of pensionable salary. Pensionable sal ary is defined as the senior executive’s average basic salary over a vesting period of at least ten years. The earned benefit is vested and secured in a pen sion foundation. The company has undertaken to pay the ITP plan in full on condition that the senior executive remains in service until the agreed age of retirement. For other senior executives employed outside Sweden, the various pension conditions in those countries of employment will apply. 80 NCC 2014 FINANCIAL REPORT Note 5 Number of employees, personnel expenses and remuneration of senior executives, cont’d. REMUNERATION, PROVISIONS AND OTHER BENEFITS IN 2014 SEK 000s Total salary, remuneration and benefits 4) Chairman of the Board Tomas Billing of which, b enefits of which, variable remuneration 5) of which, provision for share-based remuneration 6) Pension cost Pension commitment 918 Member of the Board Antonia Ax:son Johnson1) 113 Member of the Board Viveca Ax:son Johnson1) 355 Member of the Board Carina Edblad1) 355 Member of the Board Olof Johansson 469 Member of the Board Sven-Olof Johansson 469 Member of the Board Ulla Litzén 469 Member of the Board Christoph Vitzthum 469 President and CEO Peter Wågström 8,913 53 711 2,232 1,800 611 Other senior executives (ten individuals) 32,842 362 2,227 6,165 6,897 18,061 Total Parent Company 45,372 415 2,938 8,397 8,697 18,672 17,712 802 1,499 3,274 2,188 10,613 63,084 1,217 4,437 11,671 10,885 29,285 Total salary, remuneration and benefits 4) of which, b enefits of which, variable remuneration 5) of which, provision for share-based remuneration Pension cost Pension commitment Other senior executives employed by subsidiaries (four individuals) Total senior executives REMUNERATION, PROVISIONS AND OTHER BENEFITS IN 2013 SEK 000s Chairman of the Board Tomas Billing 805 Member of the Board Antonia Ax:son Johnson 443 Member of the Board Ulf Holmlund2) 114 Member of the Board Olof Johansson 443 Member of the Board Sven-Olof Johansson 443 Member of the Board Ulla Litzén 443 Member of the Board Christoph Vitzthum President and CEO Peter Wågström 443 8,691 55 1,762 947 1,683 568 Other senior executives (eight individuals)3) 30,367 336 3,746 2,614 7,794 15,192 Total Parent Company 42,192 391 5,508 3,561 9,477 15,760 Other senior executives employed by subsidiaries (five individuals) 17,664 618 2,754 1,662 3,344 10,436 Total senior executives 59,856 1,009 8,262 5,223 12,821 26,196 1) Antonia Ax:son Johnson resigned and Viveca Ax:son Johnson and Carina Edblad were elected at the AGM on April 2, 2014. 2) Ulf Holmlund resigned at the Annual General Meeting on April 9, 2013. 3) The number of senior executives employed in the Parent Company in 2013 was nine until October, and thereafter eight. 4) Remuneration and benefits pertain to vacation compensation, reduced working hours, company vehicles and, where appropriate, severance pay. Director fees were raised following a resolution at the 2013 and 2014 AGMs. The amounts in the tables are subject to accrual accounting. 5) Variable remuneration pertains to the amounts expensed for each fiscal year. 6) Amount reserved during the year for the ongoing LTI programs 2012, 2013 and 2014. SEVERANCE PAY NCC and Peter Wågström are subject to a mutual period of notice of employ ment termination of six months. Severance pay will amount to 18 months. Other senior executives are normally subject to 12 months’ notice from NCC, or six months’ notice if the senior executive resigns of his/her own accord. Other sen ior executives are normally entitled to 12 months of severance pay, if their employment is terminated by NCC. Remuneration will be reduced by an amount corresponding to any remuneration received from a new employer or own busi ness. During the period of notice, senior executives may not take up a new posi tion with another employer or conduct their own business activities without NCC’s written consent. SHARE-BASED REMUNERATION In April 2014, the AGM resolved, in accordance with the Board’s motion, to establish a long-term performance-based incentive plan for senior executives and key personnel within the NCC Group (“LTI 2014”). The purpose of LTI 2014 is to ensure a focus on NCC’s long-term return on equity and to provide prereq uisites for retaining and recruiting key personnel. LTI 2014 is a three-year performance-based plan under which the partici pants have been allotted, free of charge, performance-based share awards, that provide entitlement to Series B shares, and performance-based synthetic shares that provide entitlement to cash remuneration. In view of the introduc tion of LTI 2014, the maximum short-term variable remuneration payable to the participants have been adjusted downwards by five or ten percentage points of their basic salary. LTI 2014 will run parallel in all respects to the LTI program that was adopted by the 2013 AGM. Performance targets The number of shares and the cash amount that will finally be allotted/dis bursed depends on the extent to which certain predetermined targets are achieved during the performance period (January 1, 2014 through December 31, 2016). The targets that have been set for LTI 2014 comprise the average return on equity in relation to seven benchmark companies during the vesting period, as well as a reduction in the number of worksite accidents at the end of 2016. For achievement of the first target, 100 percent will be allotted/disbursed if the return exceeds the second best benchmark company, while 25 percent will be allotted/disbursed if the return matches the median for the benchmark category. In between these figures, allotment/disbursement will occur linearly. For assessment of the second target, an established benchmark figure for the industry will be used based on the number of occupational accidents resulting in one day’s absence or more from ordinary work per million working hours. At the end of 2013, NCC’s comparative figure was 10.6. Allotment/disbursement of 100 percent will occur if the ratio for 2016 is less than 5, while 25 percent will be allotted/disbursed if the ratio is less than 8.0. In between these figures, allot ment/disbursement will occur linearly. For any disbursement from LTI 2014, a further requirement is that the NCC Group report a pretax profit. NCC 2014 81 FINANCIAL REPORT Allotment The participants are divided into three categories: CEO; members of the Execu tive Management Group and business area management and other key person nel. The allotment value is 50 percent of annual salary for the CEO, 30 percent of annual salary for members of the Executive Management Group and either 15 percent or 30 percent of annual salary for other key personnel. The share price that is to form the basis for calculating the number of share awards and synthetic shares is to correspond to the average last price paid dur ing a period of ten trading days immediately following the 2014 AGM, a period when the share is traded ex-rights to dividends (SEK 225.66). Scope and costs of the program Assuming a share price of SEK 210 and the maximum outcome in accordance with LTI 2014 in terms of both shares and cash amount, it is estimated that the cost of LTI 2014, including costs for social security fees, will amount to SEK 57.0 M, corresponding to approximately 0.25 percent of the total number of shares in the company. The value that a participant may receive at maximum allotment of Series B shares and maximum cash payment is limited to an amount per share that cor responds to 400 percent of the share price, calculated on the basis of the aver age last price paid during a period of ten trading days immediately following the 2014 AGM, a period when the share is traded ex-rights to dividends. Repurchase of treasury shares In order to cover commitments in accordance with LTI 2014, meaning to cover costs for securing delivery of Series B shares, including costs for social secu rity fees and payments on the basis of the synthetic shares, the AGM resolved to authorize the Board to make decisions on one or several occasions during the period up to the following AGM to buy back a maximum of 867,486 Series B shares. The shares are to be acquired on NASDAQ Stockholm and may only be acquired at a price within the registered span of share prices at the particular time, by which is meant the span between the highest price paid and the lowest asked price. The shares are to be paid for in cash. FAIR VALUE AND ASSUMPTIONS SHARE AWARDS LTI 2012 2013 2014 Group Fair value on date of valuation, SEK 000s Share price, SEK Parent Company Group Parent Company 9,962 5,359 5,064 2,406 123.30 123.30 123.30 123.30 Redemption price, SEK 0 0 0 0 Options duration, year 0.5 0.5 1.5 1.5 Risk-free interest rate, % 2.20 2.20 3.95 3.95 SHARE AWARDS LTI 2013 2013 2014 Group Fair value on date of valuation, SEK 000s Share price, SEK Parent Company Group Parent Company 6,081 3,192 2,860 1,364 144.97 144.97 144.97 144.97 Redemption price, SEK 0 0 0 0 Options duration, year 1.5 1.5 2.5 2.5 2.20 2.20 3.95 3.95 Risk-free interest rate, % SHARE AWARDS LTI 2014 2014 Parent Company Group Fair value on valuation date, SEK 000s Share price, SEK 3,691 2,038 225.66 225.66 Redemption price, SEK 0 0 Options duration, year 2.5 2.5 Risk-free interest rate, % 2.20 2.20 Transfer of treasury shares In order to secure delivery of Series B shares in accordance with LTI 2014, the AGM resolved to permit the transfer of no more than 303,620 Series B shares to the participants of LTI 2014. The prerequisites and conditions for allotment are listed below, according to which all share awards will be regulated through physical delivery of the shares. Dividend has been calculated as a five-year average of NCC AB’s dividends. All fair values and assumptions are the same for all participants in the program. LTI 2012 PERSONNEL EXPENSES FOR SHARE-BASED REMUNERATIONS The performance period pertaining to LTI 2012 expired on December 31, 2014. The performance pertaining to the predetermined targets will be evaluated and reported in conjunction with the 2015 Annual General Meeting. The prerequisites and conditions for allotment are listed below. GROUP Share awards Outstanding at the beginning of the period Allocated during the period Transferred from Group companies Share awards Synthetic shares 241,762 241,762 115,081 115,081 90,740 90,740 48,004 48,004 – – 2,282 2,282 Forfeited during the period –25,229 –25,229 –3,621 –3,621 Outstanding at the end of the period 307,273 307,273 161,746 161,746 0 0 0 0 Puttable at the end of the period Group All share awards and synthetic shares have a redemption price of SEK 0. Outstanding share awards and synthetic shares have a remaining contract term of two and a half years to a half year. Parent Company Group Parent Company 3 Share awards 12 9 6 Synthetic shares 21 12 11 5 9 6 5 3 Total personnel expenses for share-based remunerations 42 27 22 11 Total carrying amount pertaining to liability for synthetic shares 34 18 13 6 Total real value of the liability pertaining to vested benefits 34 18 13 6 Social security expenses PARENT COMPANY Synthetic shares 2013 2014 82 NCC 2014 FINANCIAL REPORT NOTE 6 DEPRECIATION/AMORTIZATION GROUP NOTE 9 R ESULT FROM PARTICIPATIONS 2014 2013 2014 2013 Intangible assets –44 –36 –12 –7 Owner-occupied properties –26 –26 –1 –1 –638 –641 –31 –58 Machinery and equipment 1) Total depreciation/ amortization –708 –703 –44 –66 1) of which, depreciation of leased equipment in the Group amounts to 87 (83). GROUP GROUP 2014 Capital gain/loss on sale 2014 2013 3 –135 Reversal of impairment losses 2013 PwC Audit in addition to the audit assignment 1 Other assignments 1 18 7 3 7 GROUP Total fees and remuneration to auditors and audit firms 2 2 22 21 7 Total cost of production, and selling and administration costs PARENT COMPANY 2014 63 –81 Impairment losses and reversal of impairment losses, fixed assets –111 –121 –64 –65 –108 –53 Total –8 –5 –53 –11 25 –5 –318 –260 2014 2013 11 52 5 6 Interest income on loans and accounts receivable 17 6 Interest income on bank balances 10 8 Net profit on financial assets/liabilities available for sale Other financial income 7 –17 55,157 Interest expense to credit institutions Interest income on investments held to maturity –5 54,293 Interest expense, Group companies Interest income on financial assets held for trading Result from participations in subsidiaries Total –7 2013 GROUP Owner-occupied properties 25 NOTE 12 NET FINANCIAL ITEMS –2 Shares in subsidiaries 703 5 2013 –23 –4 708 2014 Other financial items Production costs Properties held for future development in NCC Property Development 11,541 PARENT COMPANY Exchange-rate differences OF IMPAIRMENT LOSSES Housing projects –19 11,807 INCOME STATEMENT ITEMS Interest expense, others NOTE 8 IMPAIRMENT LOSSES AND REVERSAL 2013 42,915 –72 NOTE 11 INTEREST EXPENSE AND SIMILAR Financial portion of pension cost GROUP 41,846 Change in inventories Reversal of impairment losses Auditing assignments are defined as the statutory audit of the annual accounts and the consolidated financial statements and of the bookkeeping as well as of the administration of the Board of Directors and the CEO, and also audit and other examinations conducted pursuant to agreement or contract. This includes other duties that the company’s auditors are obliged to conduct and advice or other assistance required due to observations made during such examinations or during the performance of such other duties. All other work is defined as other assignments. 2014 2013 Impairment losses 8 1,308 2014 Depreciation/amortization 1 Other auditors Auditing assignments 962 BY TYPE OF COST Personnel costs 1 –81 199 Production-related goods and services, plus raw materials and supplies 18 2013 1,389 NOTE 10 O PERATING EXPENSES DISTRIBUTED Audit firms Auditing assignments 2014 1,095 –197 Impairment losses PARENT COMPANY 2013 PARENT COMPANY Dividend Total NOTE 7 FEES AND REMUNERATION TO AUDIT FIRMS 2014 IN GROUP COMPANIES PARENT COMPANY 63 –81 Financial income Interest expense on financial liabilities measured at amortized cost 1 2 2 46 75 –310 –286 Interest expense on financial liabilities held for trading –21 –8 Net loss on financial assets/liabilities held for trading –8 –4 Net exchange-rate changes –6 –3 –71 –53 Financial expense –416 –354 Net financial items –370 –279 –7 –4 Other financial expenses Of which, changes in value calculated using valuation techniques NCC 2014 83 FINANCIAL REPORT NOTE 13 EFFECTS ON PROFIT AND LOSS NOTE 14 APPROPRIATIONS AND UNTAXED RESERVES OF EXCHANGE-RATE CHANGES APPROPRIATIONS 2014 exchange rates 20131) 2014 Exchangerate effect 56,241 56,867 626 2,574 2,604 30 Accumulated depreciation in excess of plan Profit after financial items 2,195 2,234 39 – machinery and equipment Net profit for the year 1,806 1,838 32 Tax allocation reserve GROUP Net sales Operating profit PARENT COMPANY AVERAGE EXCHANGE RATE JAN–DEC Country EU Norway Russia SEK Currency 100 DKK 2014 2013 2014 2013 122.02 116.00 127.35 119.37 1 EUR 100 NOK YEAR-END RATE 9.10 8.65 9.48 8.90 108.89 110.94 105.04 105.85 0.18 0.22 0.13 0.21 1 RUR 2013 2014 2013 348 392 348 392 13 231 Reserve in work in progress 1) Figures for 2014 converted at 2013 exchange rates. Denmark 2014 UNTAXED RESERVES 44 103 Group contributions received 639 325 Total 684 672 NOTE 15 INTANGIBLE ASSETS GROUP PARENT COMPANY ACQUIRED INTANGIBLE ASSETS 2014 Recognized acquisition value on January 1 Goodwill Usufructs Other Total other Development expenses 2,056 214 270 484 86 Investments 16 23 136 158 111 Divestment and scrapp –2 –6 Reclassifications Translation differences during the year Recognized acquisition value on December 31 Accumulated amortization on January 1 58 –5 –1 13 –7 6 6 6 12 2,128 251 403 654 198 0 –115 –100 –215 –11 Divestment and scrappage 4 Through company divestments Translation differences during the year Accumulated impairment losses on January 1 Translation differences during the year Accumulated impairment losses on December 31 1 1 –5 –8 –2 –3 –12 –32 –44 –12 –1 –127 –136 –263 –23 –255 –2 0 –2 0 Amortization according to plan during the year Accumulated amortization on December 31 4 –6 –261 –2 0 –2 0 Residual value on January 1 1,802 97 170 267 75 Residual value on December 31 1,865 123 266 389 175 GROUP PARENT COMPANY ACQUIRED INTANGIBLE ASSETS 2013 Recognized acquisition value on January 1 Goodwill Usufructs Other Total other Development expenses 2,080 200 183 383 39 14 85 99 47 2 2 Investments Translation differences during the year Recognized acquisition value on December 31 Accumulated amortization on January 1 Translation differences during the year –24 2,056 214 270 484 86 1 –102 –75 –177 –4 –2 –2 –1 Amortization according to plan during the year Accumulated amortization on December 31 Accumulated impairment losses on January 1 Translation differences during the year Accumulated impairment losses on December 31 –13 –23 –36 –7 0 –115 –100 –215 –11 –254 –2 0 –2 0 –2 0 –2 0 –1 –255 Residual value on January 1 1,827 96 108 204 35 Residual value on December 31 1,802 97 170 267 75 84 NCC 2014 FINANCIAL REPORT Note 15 Intangible assets, cont’d IMPAIRMENT TESTING OF GOODWILL IN CASH-GENERATING UNITS Goodwill amounting to SEK 1,865 M is included in NCC’s balance sheet. The item is distributed as follows among NCC’s business areas: Unit 2013 2014 NCC Construction Sweden 401 401 NCC Construction Denmark 117 109 NCC Construction Finland 70 52 NCC Construction Norway 263 265 NCC Roads 993 952 NCC Housing NCC Group 22 22 1,865 1,802 Impairment requirement testing for goodwill is conducted every year. Impair ment testing is based on the future cash flow of the units, taking into account the market’s yield requirement and their risk profile. Cash flow was based on forecasts established by company management. When deemed necessary, the forecasts have been established with a greater emphasis on the immediate period ahead (five years). The following key assumptions were used: Long-term growth: In all cases, a long-term sustainable growth rate of 2.0 (2.0) percent has been assumed when the forecast period is over, which reflects anticipated long-term growth in the market. Subject to the exceptions specified below, it is assumed that the growth rate also applies to sales during the fore cast period. Operating margin: The forecast operating margin has been assumed to equal the average for the most recent three years, except for NCC Construction Norway. During recent years, a number of acquisitions have taken place in NCC Construction Norway, which is why the operating margin has been established on the basis of the average for the past five years, to reflect the estimated mar gin. Working capital and reinvestment requirement: The requirement has been assumed to match the figure for 2014, with a growth rate equal to the sustaina ble long-term growth rate. Discount interest rate: The weighted average cost of capital, WACC, is calcu lated for the various units on the basis of beta value and local conditions in respect of market interest rates and tax, as well as a market-based capital struc ture for the various operations. The latter is based on the operational risk and the opportunities to leverage the operation. The discount interest rates for the different cash-generating units vary between 5.4 and 11.9 percent before tax and 4.2 and 8.7 percent after tax. On the basis of NCC’s scenario as a whole, the discount interest rate amounts to 8.3 (8.9) percent before tax and 6.5 (6.9) per cent after tax. NCC’s impairment testing reveals no impairment requirement for goodwill. As of January 1, 2014, NCC Roads was divided into three divisions with oper ations across country borders. This meant that the income statement, balance sheet and cash flow are not monitored by country. Since the balance sheet is not reported at division level, all goodwill was transferred from individual countries to NCC Roads’ business area level. Accordingly, impairment testing for 2014 for NCC Roads was implemented at the business area level and shows no impair ment requirements. Risk analysis: The difference between the value in use and the carrying amount is lowest for NCC Construction Norway. The sensitivity analysis of the assumptions used in the impairment testing shows that a change in one of these by 0.5 percentage points independently would not necessitate any impairment. OTHER INTANGIBLE ASSETS Usufructs include the right to use gravel and rock pits for a determined period. The periods may vary but the rights normally pertain to long periods. Amortization of quarries occurs in pace with confirmed depletion of net asset value, based on the volume of extracted rock and gravel. The item Other consists mainly of software and licenses. The periods of use range from three to five years and amortization is applied on a straight-line basis. AMORTIZATION IS INCLUDED IN THE FOLLOWING LINES IN THE INCOME STATEMENT GROUP 2014 2013 Production costs –32 –28 Selling and administrative expenses –12 –7 –44 –36 Total NOTE 16 TANGIBLE FIXED ASSETS GROUP 2014 Recognized acquisition value on January 1 Investments Total Owneroccupied properties Construction in progress Machinery and equipment Machinery and equipment Total 1,290 16 7,590 8,896 26 552 578 751 804 3 43 46 1 1 –18 –320 –338 –3 –15 –18 –7 –66 –73 –143 –155 –69 –69 89 106 7,903 9,241 27 511 537 53 Increase through acquisitions Divestment and scrappage Decrease through company divestments PARENT COMPANY Owneroccupied properties Reclassifications –9 Translation differences during the year 17 –4 Recognized acquisition value on December 31 1,326 Accumulated impairment losses and depreciation on January 1 –602 –5,089 –5,691 –9 –478 –488 14 251 265 2 14 16 2 46 48 69 69 Divestment and scrappage Decrease through company divestments Reclassifications 12 63 86 149 Translation differences during the year –16 –72 –88 Depreciation during the year –26 –638 –664 –1 –31 –32 –564 –5,416 –5,980 –9 –426 –435 Accumulated write-ups on January 1 1 1 Accumulated write-ups on December 31 1 1 Accumulated impairment losses and depreciation on December 311) Residual value on January 1 688 16 2,502 3,206 17 74 91 Residual value on December 31 762 12 2,487 3,262 18 84 103 298 298 –55 –67 Carrying amount of financial leasing 1) Accumulated impairment losses on December 31 –12 NCC 2014 85 FINANCIAL REPORT Note 16 Tangible fixed assets, cont’d GROUP Owneroccupied properties 2013 Recognized acquisition value on January 1 Investments Divestment and scrappage PARENT COMPANY Construction in progress Machinery and equipment Total Owneroccupied properties 1,245 5 7,197 8,447 22 519 46 12 898 956 3 38 41 –387 –398 –4 –4 –7 –7 –11 Decrease through company divestments Reclassifications 10 –1 Translation differences during the year 5 –108 7,590 8,896 26 552 578 –8 –424 –432 3 3 1,290 –589 –4,803 –5,391 8 313 321 6 6 Decrease through company divestments Reclassifications –6 –6 41 38 –26 –641 –666 –1 –58 –59 –602 –9 –478 –488 –2 Reversed impairment losses 7 Depreciation during the year Accumulated impairment losses and depreciation on December 311) 541 –108 Recognized acquisition value on December 31 Translation differences during the year Total –4 Accumulated impairment losses and depreciation on January 1 Divestment and scrappage 16 Machinery and equipment 7 5,089 5,691 Accumulated write-ups on January 1 1 1 Accumulated write-ups on December 31 1 1 Residual value on January 1 657 5 2,395 3,057 15 94 108 Residual value on December 31 688 16 2,502 3,206 17 74 91 279 279 –55 –85 Carrying amount of financial leasing –30 1) Accumulated impairment losses on December 31 NOTE 17 PARTICIPATIONS IN GROUP COMPANIES CARRYING AMOUNT PARENT COMPANY Name of company, Corp. Reg. No., Registered office Ownership share, %1) No. of participations2) 2014 2013 Real estate companies: NCC Property Development BV, 33.213.877, Netherlands NCC Property Development Nordic AB, 556743-6232, Solna 93 100 1 Total participations in real estate companies CARRYING AMOUNT PARENT COMPANY Ownership share, %1) No. of participations2) 2014 2013 Kallax Cargo AB, 556565-1147, Solna 100 2 1 1 Kungsplattan AB, 556713-0850, Solna Name of company, Corp. Reg. No., Registered office 4 4 100 1 1 1 961 960 Kvarntorget Bostad AB, 556729-8541, Uppsala 100 1 1 1 965 965 LLC NCC Center, INN7841457408, Russia 100 LLC NCC Ostland, INN7802379530, Russia 100 LLC NCC Real Estate, INN7841322136, Russia 100 LLC NCC Village, INN7842398917, Russia 100 Luzern AB, 556336-4727, Lund 100 1 NCC Aktivt Boende AB, 556889-1393, Solna 100 1 100 1 Other companies: 5 Alsike Utvecklings AB, 556245-9452, Uppsala 100 16 2 2 Anjo Bygg AB, 556317-8515, Halmstad 100 9 29 29 Bergnäsets Ställningsmontage i Luleå AB, 556393-2838, Luleå 100 1 Däldehög AB, 556268-5700, Gothenburg 100 9 1 1 Eeg-Henriksen AB, 556399-2642, Stockholm 100 5 1 1 Ekängens Handelsträdgård AB, 556188-6903, Solna 100 1 4 4 NCC Beckomberga nr 1 AB, 556617-6243, Stockholm 80 1 NCC Boende AB, 556726-4121, Solna 100 100 1 1 NCC Boende Holding 1 AB, 556761-3459, Solna 100 1 NCC Boende Holding 2 AB, 556795-2089, Solna 100 1 NCC Boende Holding 3 AB, 556795-2287, Solna 100 1 NCC Boende Holding 4 AB, 556824-7901, Solna 100 1 NCC Boende Holding 5 AB, 556824-7919, Solna 100 1 NCC Boende Holding 6 AB, 556824-7927, Solna 100 1 Elpolerna i Malmö AB, 556720-5934, Malmö Frösunda Exploaterings AB, 556430-1876, Solna Frösunda Exploaterings KB, 916636-6451, Stockholm 1 Fågelbro Mark AB, 556234-0868, Stockholm 100 200 30 30 Hercules Grundläggning AB, 556129-9800, Stockholm 100 196 59 59 Jaktbacken AB, 556908-8932, Solna 100 1 JCC Johnson Construction Company AB, 556113-5251, Solna 100 1 85 85 9 9 3 3 1 1 4 1 82 82 86 NCC 2014 FINANCIAL REPORT Note 17 Participations in group companies, cont’d. CARRYING AMOUNT PARENT COMPANY Name of company, Corp. Reg. No., Registered office NCC Boende Holding 7 AB, 556824-8230, Solna NCC Boende Holding 8 AB, 556824-8248, Solna NCC Boende Holding 9 AB, 556845-8797, Solna NCC Boende Holding 10 AB, 556845-8821, Solna NCC Boende Holding 11 AB, 556866-8692, Stockholm NCC Boende Holding 12 AB, 556887-7079, Solna NCC Boende Holding 13 AB, 556966-2835, Solna NCC Boende Holding 14 AB, 556973-2273, Solna NCC Boende Holding 15 AB, 556987-3770, Solna Ownership share, %1) No. of participations2) 100 1 1 100 100 100 100 100 100 100 100 CARRYING AMOUNT PARENT COMPANY Ownership share, %1) No. of participations2) 2014 2013 NCC Purchasing Group AB, 556104-9932, Solna 100 2 1 1 NCC Rakennus Oy, 1765514-2, Finland 100 4 392 392 1 NCC Roads Holding AB, 556144-6732, Solna 100 275 1,637 1,635 1 NCC Södra Ekkällan AB, 556679-8780, Solna 100 1 1 1 1 NCC Treasury AB, 556030-7091, Solna 100 120 16 16 1 NCC Utvikling AS, 980 390 020, Norway 100 8 3 3 1 Nils P Lundh AB, 556062-7795, Solna 100 1 1 Norrströmstunneln AB, 556733-7034, Solna 100 1 1 Nybergs Entreprenad AB, 556222-1845, Gotland 100 10 11 11 1 24 24 10 10 2014 65 60 2013 65 60 Name of company, Corp. Reg. No., Registered office NCC Bolig AS, 32 65 55 05, Denmark 100 5 456 456 Samset AB, 556931-8644, Stockholm NCC Bolig AS, 997 671 783, Norway 100 8 41 41 Siab Investment AB, 556495-9079, Stockholm 100 115 SIA NCC Housing, 40003941615, Latvia 100 160 Sintrabergen Holding AB, 556498-1248, Stockholm 100 3 Ställningsmontage och Industritjänst i Södra Norrland AB, 556195-2226, Solna 100 2 Svelali AB, 556622-7517, Halmstad 100 1 Svenska Industribyggen AB, 556087-2508, Stockholm 100 1 Söderby Park Fastigheter HB, 916630-4817, Stockholm 100 100 NCC Construction Danmark A/S, 69 89 40 11, Denmark NCC Construction Norge AS, 911 274 426, Norway 100 100 NCC Construction Sverige AB, 556613-4929, Solna 100 NCC Deutschland GmbH, HRB 8906 FF, Germany 400 17,500 500 116 161 55 52 100 410 410 NCC Elamuarendus, 11398856, Estonia 100 6 6 NCC Försäkrings AB, 516401-8151, Solna 100 500 78 78 NCC Hyresboende AB, 556889-1401, Solna 100 1 NCC Hällevik AB, 556749-6251, Solna Tipton Ylva AB, 556617-6326, Stockholm 1 1 100 1 NCC Industries AB, 556001-8276, Stockholm Total participations in other companies 4,944 5,146 100 15 22 22 NCC International AB, 556033-5100, Solna Total participations in Group companies 5,909 6,112 100 1,000 41 258 NCC International Danmark A/S, 26 708 621, Denmark NCC Kaninen Projekt AB, 556740-3638, Solna 303) NCC Komponent AB, 556627-4360, Solna 100 1 NCC Nordic Construction Company AB, 556065-8949, Solna 100 3,809 1,018 1,018 1 1) The ownership share corresponds to the shareholding. 2) Number of shares in thousands. 3) Remaining 70 percent of the company owned by NCC Property Development AB. NCC essentially owns 100 percent of all subsidiaries, whereby these are consoli dated in their entirety according to the acquisition method. NCC’s assessment is that there is no controlling influence in holdings in which the ownership share amounts to 50 percent or less. The amended control concept in IFRS 10 has not resulted in any change in this assessment. Companies for which ownership shares and number of shares have not been specified were divested, merged or liquidated during the year. Only directly owned subsidiaries is specified. The number of indirectly owned subsidiaries is 184 (188). NCC 2014 87 FINANCIAL REPORT NOTE 19 P ARTICIPATIONS IN ASSOCIATED NOTE 18 P ARTICIPATIONS IN ASSOCIATED COMPANIES AND JOINT OPERATIONS COMPANIES AND JOINT VENTURES GROUP Carrying amount on January 1 2014 2013 9 9 Adjustment for amended accounting policies, IFRS 11 45 Divestment of associated companies –3 Share in associated company profits1) 1 –1 52 9 Carrying amount on December 31 Name of company, Corp. Reg. No., Registered office Agder Bygg Gjennvinnings AS, 880 704 532, Norway No. of participations2) 2014 2013 50 1 1 Asfalt & Maskin, 960 585 593, Norway 50 2 2 Glysisvallen AB, 556315-5125, Hudiksvall 50 1 1 1 Hercules-Trevi Foundation AB, 556185-3788, Stockholm 50 1 1 Kalati SIA, 40003783689, Riga 50 PULS Planerad Underhållsservice AB, 556379-1259, Malmö 50 15 23 Oraser AB, 556293-2722, Stockholm 50 1 6 Sjaellands Emulsionsfabrik I/S,18004968, Roskilde 50 Other NCC-owned associated companies 12 (12) Total 50 50 3 3 4 1 3 2 2 1 1 52 9 1) The ownership share corresponds to the proportion of votes for the total number of shares. 2) Number of shares in thousands. 2013 75 254 –69 –226 6 28 17 62 Current assets 755 634 Total assets 772 696 Long-term liabilities 195 270 Current liabilities 351 231 Total liabilities 546 501 Net assets 226 195 The joint operations category also includes partly owned contracts, for which NCC has a contractual joint influence together with the other partners. GROUP 7 25 Östhammarkrossen KB, 916673-1365, Uppsala Profit 2014 SPECIFICATION OF JOINT OPERATIONS PULS-ISAB Relining i Skandinavien AB, 556813-5890, Mölndal SHH Hyresproduktion AB, 556889-3746, Stockholm Expenses Fixed assets CARRYING AMOUNT Ownership share, %1) GROUP Revenue 1) Participations in associated companies’ profit after tax and non-controlling interests in associated companies. GROUP The consolidated financial statements include the items below that constitute the Group’s interests in the joint operations net sales, costs, assets and liabilities. Shareholding, % Arandur OY 33 ARC konsortiet 50 Bolig Interessentskabet Tuborg Nord 50 Entreprise 23 konsortiet 50 Entreprise 26 konsortiet 50 Fløng-2 Konsortiet 50 Fortis DPR, konsortie 50 GR2012 Konsortiet I/S 50 Holding Big Apple Housing Oy 50 Milman Miljömuddring 50 Kiinteistö Oy Polaristontti 2 50 Kiinteistö Oy Polaristontti 3 50 Langebro 2 50 M11-Entreprenør 50 Holding Metrokeskus Oy 50 Norvikudde, konsortie 50 NVB Beckomberga KB 25 NVB Sköndalsbyggarna AB 33 NVB Sköndalsbyggarna II AB 33 NVB Sköndalsbyggarna KB 33 NVB Sköndalsbyggarna II KB 33 Elinegård Utvecklings AB 50 NFO konsortiet I/S 50 NCC- LHR Gentofte Konsortiet 50 NCC-MJEkonsortie I/S 50 NCC-SMET konsortiet 50 Polaris Business Park Oy 50 Stora Ursvik KB 50 Tipton Brown AB 33 Öhusen, KB 50 Örestad Down Town P/S 60 88 NCC 2014 FINANCIAL REPORT NOTE 20 PARTICIPATIONS IN ASSOCIATED COMPANIES NOTE 21 FINANCIAL INVESTMENTS PARTICIPATIONS IN ASSOCIATED COMPANIES INCLUDED IN FINANCIAL FIXED ASSETS GROUP Name of company, Corp. Reg. No., Registered office Ownership share, %1)3) No. of participations2) Oraser AB, 556293-2722, Stockholm 50 1 6 6 PULS Planerad Underhålls Service AB,556379-1259, Malmö 50 15 8 8 Stora Ursvik KB, 969679-3182 Stockholm 50 156 144 33 Total 125 23 Interest-bearing securities 115 109 Total 156 131 115 21 Investments held to maturity 2013 2 Other 6 (9) 40 Available-for-sale financial assets Unlisted securities 2014 Fastighets AB Strömstaden, 556051-7202, Norrköping Tipton Brown AB, 556615-8159, Stockholm 2013 Financial investments classified as fixed assets CARRYING AMOUNT PARENT COMPANY 2014 15 15 1 1 185 175 Short-term investments classified as current assets Financial assets at fair value through profit or loss Interest-bearing securities Investments held to maturity Interest-bearing securities 127 122 Total 242 143 Investments held to maturity have an established interest rate ranging from 1.0 (1.6) percent to 4.0 (4.0) percent, and have due dates ranging from 2 (1) years to 3 (3) years. During the year, financial fixed assets were impaired by SEK 0 M (0). 1) The ownership share corresponds to the proportion of votes for the total number of shares. 2) Number of shares in thousands. 3) See Note 17 for a description of controlling influence. 3) For a description of controlling interest, see Note 17. Companies for which ownership shares and number of shares have not been specified were divested during the year. NOTE 22 FINANCIAL FIXED ASSETS PARENT COMPANY, 2014 Recognized acquisition value on January 1 Assets added Reclassifications Assets removed Recognized acquisition value on December 31 Participations in Group companies Receivables, Group companies Participations in associated companies and joint ventures Receivables, associated companies and joint ventures Other longterm securities Other long-term receivables Total 14,766 10 473 185 11 141 15,586 23 12 35 –136 –265 –401 –290 14,363 Accumulated write-ups on January 1 268 Accumulated write-ups on December 31 268 Accumulated impairment losses on January 1 199 Reclassifications 136 217 185 11 –10 –302 131 14,918 268 268 8,922 Reversal of impairment losses Impairment losses for the year –2 10 –297 –1 –6 –2 –9,228 199 265 401 –135 –135 Accumulated impairment losses on December 31 8,723 –33 –1 –6 –2 –8,764 Residual value on December 31 5,909 10 185 184 5 129 6,422 Participations in Group companies Receivables, Group companies Participations in associated companies and joint ventures Receivables, associated companies and joint ventures Other longterm securities Other long-term receivables Total 14,762 10 467 192 11 193 15,634 –52 –328 141 15,586 PARENT COMPANY, 2013 Recognized acquisition value on January 1 Assets added Assets removed Recognized acquisition value on December 31 273 6 –269 14,766 279 –7 10 473 185 11 Accumulated write-ups on January 1 268 268 Accumulated write-ups on December 31 268 268 Accumulated impairment losses on January 1 9,108 Assets removed 268 Impairment losses for the year –81 Accumulated impairment losses on December 31 8,922 Residual value on December 31 6,112 –297 –1 –6 –2 –9,414 268 –81 10 –297 –1 –6 –2 –9,228 175 184 5 139 6,624 NCC 2014 89 FINANCIAL REPORT NOTE 23 LONG-TERM RECEIVABLES NOTE 24 TAX ON NET PROFIT FOR THE YEAR, DEFERRED AND OTHER RECEIVABLES TAX ASSETS AND DEFERRED TAX LIABILITIES GROUP GROUP 2014 2013 94 92 17 Current tax cost Derivative instruments held for hedging purposes 223 23 Deferred tax revenue/cost Other long-term receivables 117 114 Long-term receivables classified as fixed assets 434 247 Long-term receivables classified as fixed assets Receivables from associated companies and joint ventures Receivables from divested property and housing projects PARENT COMPANY 2014 2013 2014 2013 –420 –364 –249 –192 24 -47 4 –48 –396 –411 –245 –240 Tax on net profit for the year Total recognized tax on net profit for the year Other receivables classified as current assets Receivables from associated companies and joint ventures 70 41 Receivables from divested property and housing projects 129 139 Advance payments to suppliers Derivative instruments held for hedging purposes Other current receivables Other receivables classified as current assets 4 6 221 87 589 659 1,013 932 GROUP PARENT COMPANY 2013 2014 Effective tax Tax, % Pretax profit Tax according to company’s current tax rate Effect of other tax rates for non-Swedish companies Profit 2,234 Non-taxable revenues Tax, % 2,400 Profit Tax, % Profit 2,022 –22% –528 –1% –29 –1% –33 5 –1% –15 –1% –22 –2% –36 –1% –46 –1% –23 5% 110 7% 148 11% 248 12% 288 –5 1% 22 –10% –240 –1 Tax effect resulting from previous non-capitalized tax loss carryforwards 1% –445 28 2% 36 1% 20 5 –18% –22% –527 –1 Tax attributable to prior years Other –22% 2,395 –492 Tax effect resulting from utilization of non-capitalized tax loss carryforwards Average tax rate/recognized tax Profit –22% Changed tax rates in Denmark 2015 and in Finland, Norway and Denmark 2014 Other non-tax-deductible costs Tax, % 2013 2014 4 –396 –17% –411 –12% –245 Current tax has been calculated based on the nominal tax prevailing in the country concerned. In so far as the tax rate for future years has been changed, the new rate is used for calculating deferred tax. TAX ITEMS RECOGNIZED DIRECTLY IN OTHER COMPREHENSIVE INCOME CHANGE IN DEFERRED TAX IN TEMPORARY DIFFERENCES AND TAX LOSS CARRYFORWARDS GROUP GROUP 2014 2013 Current tax in hedging instruments 19 4 Deferred tax on cash flow hedging 13 –4 Deferred tax attributable to the revaluation of definedbenefit pension plans 109 –41 Total 141 –41 PARENT COMPANY 2014 2013 2014 2013 –165 –51 83 131 Recognized tax on net profit for the year 19 –32 4 –48 Changed tax rates in Denmark 2015 and in Finland, Norway and Denmark 2014 5 –15 Tax items recognized in other comprehensive income 13 86 83 Opening carrying amount Tax item attributable to revaluation of defined-benefit pension plans recognized in Other comprehensive income 109 Translation differences –12 Other Closing carrying amount –45 –7 –14 –31 –165 90 NCC 2014 FINANCIAL REPORT Note 24 Tax on net profit for the year, deferred tax assets and deferred tax liabilities, cont’d. ASSETS GROUP LIABILITIES 2014 2013 27 33 Tangible fixed assets Financial fixed assets Non-completed projects 2014 2013 2014 2013 –28 –14 –28 –14 –595 Properties held for future development Untaxed reserves NET –511 27 33 –595 –511 –38 –53 –38 –53 –166 –174 –166 –174 126 Provisions 173 126 173 Personnel benefits/pension provisions 133 34 133 34 Tax loss carryforwards 365 304 365 304 Other 117 104 –20 –12 97 92 Deferred tax asset/deferred tax liability 816 600 –847 –764 –31 –165 –382 –351 382 351 434 249 –465 –414 –31 –165 Offsetting Net deferred tax asset/tax liability ASSETS PARENT COMPANY Provisions Personnel benefits/pension provisions Net deferred tax asset/tax liability LIABILITIES 2014 2013 81 5 86 NET 2014 2013 77 81 77 6 5 6 83 86 83 2014 2013 Temporary differences between the carrying amount and the taxable value of directly owned participations do not normally arise for participations held as business assets in Swedish companies. Nor is this the case for the participations owned by NCC companies in other countries. Within the Group, there are also non-capitalized tax loss carryforwards corresponding to SEK 0.1 billion (0.2). These mainly derive from operations conducted outside Sweden, primarily in Germany. During the year, it was possible to capitalize a portion of previously non-capitalized loss carryforwards. NOTE 25 P ROPERTIES CLASSIFIED AS CURRENT ASSETS GROUP, 2014 Recognized acquisition value on January 1 Investments Properties held for future development Ongoing property projects Completed property projects Total property projects 2) Properties held for future development, housing Housing units in production Completed housing units Total housing projects3) Total 2,276 1,996 1,065 5,337 6,556 5,315 1,286 13,157 18,494 364 1,615 38 2,017 2,068 7,300 284 9,652 11,669 Increase through acquisitions Divestment and scrappage 95 –97 –1,208 –878 –2,183 –118 –511 –200 519 –192 Translation differences during the year 76 53 37 Recognized acquisition value on December 31 2,108 2,256 Accumulated impairment losses on January 1 Divestment and scrappage –51 0 –390 –390 –1,685 586 1,169 70 –122 166 –222 –101 –21 –344 –178 781 5,145 6,304 6,246 1,119 13,669 18,814 –34 –85 –370 –12 –150 –532 –617 11 4 4 15 9 9 9 113 112 –390 11 Translation differences during the year –1 3 Accumulated impairment losses on December 31 44 –1 112 1 –9 –1 –5 –15 –21 –255 –12 –155 –422 –507 –3 –6 –4 –4 0 –41 –85 Impairment losses for the year1) –10,754 –1,599 Decrease through divestments Reclassifications 95 –8,571 –6,854 Decrease through divestments Reclassifications 95 –4 Residual value on January 1 2,224 1,996 1,031 5,251 6,186 5,303 1,136 12,625 17,876 Residual value on December 31 2,064 2,256 740 5,059 6,049 6,234 963 13,246 18,305 1) Impairment losses are included in “Production costs” in the income statement. 2) Pertains primarily to properties classified as current assets recognized in NCC Property Development. 3) Pertains primarily to properties classified as current assets recognized in NCC Housing. NCC 2014 91 FINANCIAL REPORT Note 25 Properties classified as current assets, cont’d. GROUP, 2013 Recognized acquisition value on January 1 Properties held for future development, housing Housing units in production Completed housing units Total housing projects3) Total 5,401 7,119 4,183 990 12,292 17,694 3,634 1,288 6,531 83 7,902 11,536 Properties held for future development Ongoing property projects Completed property projects Total property projects 2) 2,231 2,675 495 328 3,111 195 Investments Increase through acquisitions 270 Divestment and scrappage –159 –3,166 –504 –3,829 –441 –139 –640 865 86 14 15 14 Recognized acquisition value on December 31 2,276 1,996 –48 0 Accumulated impairment losses on January 1 1,256 –92 –7 43 –37 –18 1 –54 –11 1,065 5,337 6,556 5,315 1,286 13,157 18,493 –33 –81 –401 –3 –150 –554 –635 5 48 48 Reclassifications 16 –1 –1 –2 –2 –21 –34 –85 –370 –2 Accumulated impairment losses on December 31 –232 63 43 Impairment losses for the year1) –232 –1,411 Divestment and scrappage Translation differences during the year –10,759 –1,045 –232 Translation differences during the year 270 –6,930 –5,444 Decrease through divestments Reclassifications 270 –9 –7 –3 –51 0 –12 Residual value on January 1 2,183 2,675 462 5,321 6,718 4,180 Residual value on December 31 2,224 1,996 1,031 5,251 6,186 5,303 7 7 –10 –12 –2 –23 –25 –150 –532 –617 840 11,738 17,059 1,136 12,625 17,876 1) Impairment losses are included in “Production costs” in the income statement. 2) Pertains to properties classified as current assets recognized in NCC Property Development. 3) Pertains primarily to properties classified as current assets recognized in NCC Housing. 2013 2014 PARENT COMPANY Properties held for future development Recognized acquisition value on January 1 Investments Divestment and scrappage Reclassifications Completed housing units Participations in tenant-owner associations Total ousing h projects Properties held for future development Completed housing units 101 258 161 39 28 520 119 214 67 11 281 –24 –263 –83 –370 –29 –237 Participations in tenant-owner associations Total housing projects 333 161 453 –266 2 19 Recognized acquisition value on December 31 118 42 79 239 21 101 258 161 520 Accumulated impairment losses on January 1 –9 –6 0 –15 –9 –9 0 –18 0 –15 Divestment and scrappage 3 Accumulated impairment losses on December 31 Residual value on January 1 Residual value on December 31 –9 –6 0 92 252 109 36 3 –15 –9 –6 161 505 110 205 0 315 79 225 92 252 161 505 1) Impairment losses are included in “Production costs” in the income statement. NOTE 26 M ATERIALS AND INVENTORIES GROUP NOTE 27 C ONSTRUCTION CONTRACTS PARENT COMPANY 2014 2013 Stone material 421 376 Building materials 169 152 Other 156 146 Total 746 673 2014 2013 59 52 59 52 WORKED-UP, NON-INVOICED REVENUES GROUP Worked-up revenues from ongoing contracts Invoicing for ongoing contracts Total 2014 2013 14,560 16,040 –13,494 –15,123 1,066 918 2014 2013 INVOICED REVENUES, NOT WORKED UP GROUP Invoicing for ongoing contracts Worked-up revenues from ongoing contracts Total 36,730 33,658 –32,322 –29,394 4,408 4,264 Worked-up revenues from ongoing projects including recognized gains less recognized loss reserves amounted to SEK 46,882 M (45,434). Advanced pay ments received amounted to SEK 2,603 M (2,932). Amounts withheld by the customer amounted to SEK 752 M (749). 92 NCC 2014 FINANCIAL REPORT NOTE 28 S HARE CAPITAL NOTE 29 INTEREST-BEARING LIABILITIES Changes in share capital 1988 Start of year Split, 1:4 Number of shares Share capital, SEK M 6,720,000 672 20,160,000 Directed placement in connection with the acquisition of ABV GROUP 407 Financial lease liabilities 1991 Conversions of debentures 1,449,111 36 Liabilities pertaining to Swedish tenant-owner associations and Finnish housing companies 1993 Conversions of debentures 468,928 11 Liabilities to associated companies Directed placements in connection with acquisition of minority-held NK shares 1,838,437 46 New issue 19,841,991 496 Conversions of debentures 13,394,804 335 1997 Directed placements, in connection with the acquisition of Siab 28,303,097 708 2004 Reduction of share capital1) 2014 End of year 1994 –1,844 108,435,822 867 1) The quotient value was changed from SEK 25.00 to SEK 8.00. Holding of Series B shares 2000 Repurchases 2,775,289 2001 Repurchases 699,300 2002 Repurchases 2,560,800 2003 Repurchases 2005 Sales –4,840,998 3 2006 Sales –843,005 2007 Sales –330,251 2011 Sales 2012 Repurchases 415,500 2013 Repurchases 177,000 2014 End of year 592,500 –21,138 26,023,097 82,412,725 108,435,822 Series A shares carry ten voting rights each and Series B shares carry one voting right. A specification of changes in shareholders’ equity is presented on p. 66. The Board of Directors proposes an ordinary dividend of SEK 12.00 per share, making a total of SEK 1,294,119,864 to be distributed in two payments of SEK 6.00 each. 7,029 Current portion of liabilities to credit institutions and investors 1,140 1,095 Liabilities pertaining to Swedish tenant-owner associations and Finnish housing companies 1,239 1,291 40 30 104 98 Current liabilities Liabilities to associated companies Other current liabilities 3 1 Total 2,526 2,515 Total interest-bearing liabilities 9,483 9,544 1) Including reloaning of SEK 1,700 M (1,500) from the NCC Group’s Pension Foundation. For repayment schedules and terms and conditions, refer to Note 39 Financial instruments and financial risk management. Interest-bearing long-term liabilities pertaining to pensions are recognized in the balance sheet under Provisions for pensions and similar obligations. FINANCIAL LEASING For information on payment schedules for financial leasing liabilities, also see Note 35 Leasing. PARENT COMPANY Conversion of Series A to Series B shares 2000–2013 Series A Series B Total Series A and Series B 63,111,682 45,324,140 108,435,822 –35,403,560 35,403,560 Share repurchase 2000–2013 Sale of treasury shares 2005–2013 –6,627,892 –6,627,892 6,035,392 6,035,392 27,708,122 80,135,200 Conversion of Series A to Series B shares 2014 –1,685,025 1,685,025 26,023,097 81,820,225 107,843,322 Number of voting rights 107,843,322 260,230,970 81,820,225 342,051,195 Percentage of voting rights 76 24 100 Percentage of share capital 24 76 100 245.20 246.80 6,381 20,193 Closing price Dec. 31, 2014 Market capitalization, SEK M 2013 Reloaning from the NCC Group’s Pension Foundation 1,700 1,500 Total 1,700 1,500 3,296 4,161 Total 3,296 4,162 Total interest-bearing liabilities 4,996 5,662 Group companies Other current liabilities 1 For repayment schedules and terms and conditions, refer to Note 39 Financial instruments and financial risk management. GROUP, 2014 On January 1 Provisions during the year Reclassification No. of shares on Dec. 31, 2013 No. of shares on Dec. 31, 2014 2014 NOTE 30 O THER PROVISIONS SERIES A AND B SHARES No. of shares on Dec. 31, 1999 745 6,957 Total Current liabilities Number 1,032 85 The shares are distributed into the following classes: Total 179 330 Long-term liabilities Series B 5,690 193 266 Other long-term loans The share capital is divided into 108,435,822 shares with a quotient value of SEK 8.00 each. During the year, 1,685,025 (2,425,764) Series A shares were converted to Series B shares. Series A 5,381 85 Financial leasing, current portion Number of shares 2013 Long-term liabilities Liabilities to credit institutions and investors1) 16,259,454 2014 26,574 Amount utilized during the year Guarantees Other Total 1,535 535 2,070 401 219 620 1 –9 –8 –456 –190 –646 –61 Reversed, unutilized provisions –56 –5 Reclassifications –91 91 0 32 10 42 1,366 651 2,017 Translation differences On December 31 NCC 2014 93 FINANCIAL REPORT Note 30 Other provisions, cont’d. NOTE 31 P ENSIONS Guarantees Other Total 1,722 713 2,435 367 158 525 1 –1 0 Amount utilized during the year –511 –308 –819 Reversed, unutilized provisions –56 –28 –84 GROUP, 2013 On January 1 Provisions during the year Reclassification Reclassifications Translation differences On December 31 PARENT COMPANY, 2014 On January 1 Provisions during the year Amount utilized during the year –1 –1 13 3 14 1,535 535 2,070 Guarantees Other Total 631 56 686 141 –30 111 –155 –27 –182 Reclassifications –67 67 On December 31 549 66 616 Guarantees Other Total 846 28 874 29 28 PARENT COMPANY, 2013 On January 1 Provisions during the year Amount utilized during the year –244 On December 31 631 56 –244 56 686 SPECIFICATION OF OTHER PROVISIONS AND GUARANTEES GROUP PARENT COMPANY 2014 2013 2014 2013 Restoration reserve 149 144 Other 502 391 66 56 Other provisions 651 535 66 56 Guarantee commitments 1,366 1,536 549 631 Total 2,017 2,070 616 686 The NCC Group has defined-benefit pension plans in Sweden and Norway. In Sweden, NCC’s pension commitment comprises largely the ITP plan that covers employees born prior to 1979. The plan provides retirement pension based on the final salary and is funded in NCC Group’s Pension Foundation. The number of paid-up holders and pensioners is about 70 percent of the total portfolio. In addition, there are five small defined-benefit plans, of which several are blocked from new earnings. Four of these plans are funded in NCC Group’s Pension Foundation and the fifth is insured in a life insurance company. The Board of Directors of NCC Group Pension Foundation consists of an equal number of representatives for the NCC Group and employees covered by the ITP plan. The Board holds meetings four times per year and addresses the Foundation’s quarterly accounts, investment strategy, reference portfolio and sensitivity analyses. Under certain conditions, the NCC Group can request compensation from the Foundation for pension payments. There are no mini mum funding requirements for the IPT2 plan. The risks associated with the Swedish pension plans are: • I nterest-rate risks; with lower interest rates and the resulting lower discount rate, the debt will increase. • S alary increase risk; the debt will increase with higher salary increases. • Volatility of assets; the portfolio mostly contains share funds, which can rise and fall sharply in the short term, but the long-term aim of the portfolio is to generate the best possible return. • Useful life assumption; the longer the individuals covered by the plan live, the higher the commitment. In Norway, the commitment comprises two small pension systems pertaining to supplementary pensions that are not funded and where no new vesting occurs. Since the plans are small, with no new earning capacity, the risks in these plans are significantly smaller than described above. In 2013, the defined-benefit plans were redeemed in Norway and were replaced by defined-contribution plans. PENSION COST GROUP GUARANTEE COMMITMENTS Guarantee provisions pertain to anticipated future costs. To estimate a future guarantee cost, individual assessments are made from project to project. Stand ard percentage rates are used for the calculation of the size of the future cost, whereby the standard percentage is varied depending on the nature of the pro ject. In order to eliminate various risks, a provision for guarantee claims is posted at the rate at which the risks are expected to arise after having been identified. Initially, the guarantee cost is posted for each project. This means that the cost can be recognized and booked gradually for each project. The longest maturity for a guarantee provision is ten years, while most of them have maturities of approximately two to three years. RESTORATION RESERVE The restoration reserve is attributable to NCC Roads. The provisions are intended to cover future costs for restoring pits and quarries used to mine aggregates and stone. The provisions are posted continuously, once the future costs have been identified. Accordingly, the reserves are utilized at the same rate as restoration occurs. OTHER The provisions comprise additional costs plus uncertainty in projects as well as outstanding disputes and legal matters. Part of the provisions is intended to cover losses arising in operations and is utilized gradually as the project is worked up. The Norwegian Competition Authority has investigated the sus pected transgressions of competition legislation. The suspicions pertain to price collusion in the asphalt industry between Kolo Veidekke and NCC Roads AS in two areas during the years 2005–2008. NCC’s internal investigation con firmed the suspicions in respect of breaches of competition legislation in the Trondheim area during the period in question. The Oslo District Court issued its verdict on February 19, 2014, according to which the competition-infringe ment fee was reduced from NOK 140 M as handed down earlier by the Norwe gian Competition Authority to NOK 40 M (SEK 43 M). This verdict has been appealed. 2014 2013 Defined-benefit plans: Current service cost 127 133 Interest expense 175 147 Estimated return on plan assets –175 –140 Total cost of defined-benefit plans 127 140 Total cost of defined-contribution plans 597 562 Payroll taxes and yield tax Total cost of post-employment remuneration 47 81 771 783 Current service cost is recognized in operating profit and the interest-rate com ponent, together with the anticipated return on plan assets, is recognized in net financial items. NCC secures commitments for disability pensions and family pensions for white-collar employees in Sweden through insurance in Alecta. According to a statement from the Swedish Financial Reporting Board, UFR 3, Classification of ITP plans financed through insurance in Alecta, this constitutes a multiemployer defined-benefit plan. For the 2014 fiscal year, NCC did not have access to the type of information required for reporting its proportional share of the plan’s commitment, plan assets and costs, which makes it impossible to report these plans as defined-benefit plans. Accordingly, the ITP (individual supple mentary pension) plans that are secured through insurance in Alecta are rec ognized as a defined-contribution plan. The NCC Group’s share of the total s avings premium for ITP2 in Alecta is 0.32 percent (0.18). The collective solvency rate consists of the market value of Alecta’s assets as a percentage of its insurance obligations, calculated in accordance with A lecta’s actuarial accounting methods and assumptions, which do not comply with IAS 19. The collective solvency rate is normally allowed to vary between 125 and 155 percent. If Alecta’s collective solvency rate falls below 125 percent or exceeds 155 percent, measures must be taken to create conditions for return ing the solvency rate to the normal interval. In the event of low solvency, one measure can be to raise the agreed price for new subscriptions and increase existing benefits. In the event of high solvency, one measure can be to intro duce premium reductions. At the end of 2014, Alecta’s surplus in the form of its collective solvency rate was 144 percent (129). 94 NCC 2014 FINANCIAL REPORT Note 31 Pensions, cont’d. DEFINED-BENEFIT OBLIGATIONS AND THE VALUE OF PLAN ASSETS GROUP 2014 2013 Obligations secured in full or in part in funds: GROUP Present value of defined-benefit obligations 5,220 4,314 Fair value of plan assets 4,748 4,380 Net value of obligations funded in full or in part 472 –66 Payroll tax/employer contributions 112 189 Net amount in balance sheet (obligation +, asset –) 585 125 Net amount is recognized in the following balance-sheet items: Fixed assets 1 Provisions for pensions and similar obligations 583 125 Net amount in balance sheet (obligation +, asset –) 585 125 Sweden 572 111 Norway 12 13 585 125 Net amount is distributed among plans in the following countries: Net amount in balance sheet (obligation +, asset –) SENSITIVITY ANALYSIS, PERCENTAGE IMPACT ON THE SIZE OF THE OBLIGATION AT DECEMBER 31, 2014 Discount interest rate, 0.5 percentage points change GROUP Obligation for defined benefit plans on January 1 Benefits paid 2014 2013 4,314 5,097 –154 –142 Current service cost plus interest expense 303 279 Settlements –16 –932 Actuarial gains and losses on changed demographic assumptions 31 61 Actuarial gains and losses on changed financial assumptions 742 1 5,220 4,314 Exchange-rate differences Obligation for defined benefit plans on December 31 –50 –8.2 10.2 4.2 –3.0 Anticipated inflation, 0.5 percentage points change 7.6 –6.1 Useful life assumption at 65 years, 1 year change 3.9 –3.1 The above sensitivity analysis does not constitute a forecast from the company but only a mathematical calculation. The sensitivity analysis is based on a change in an assumption, while all other assumptions remain constant. In practice, it is not probable that this will occur and any changes in the assumptions could be correlated. When calculat ing the sensitivity analysis, the same method is used as in the calculation of the pension liability in the balance sheet. The Group estimates that approximately SEK 5 M will be paid in 2015 to funded and unfunded defined-benefit plans. PENSION COSTS Fair value of plan assets on January 1 Contribution by employer 2014 2013 4,380 4,901 6 21 –8 –8 Compensation –12 –33 Estimated return 175 Benefits paid Settlements Actuarial gains and losses 140 –857 207 267 4,748 4,380 Exchange-rate differences Fair value of plan assets on December 31 –50 The plan assets comprise: Swedish stock market, listed International stock market, listed 724 630 1,209 932 Hedge funds, listed 559 514 Interest-bearing securities, listed 556 804 Interest-bearing securities, unlisted 1,700 1,500 Fair value of plan assets on December 31 4,748 4,380 There is no effect of the lowest funding requirements or asset ceiling. ACTUARIAL ASSUMPTIONS, WEIGHTED AVERAGE VALUE, % GROUP 2014 2013 Discount interest rates, % 2.85 4.0 Future salary increases, % 3.0 3.0 Anticipated inflation, % 1.5 1.5 20.8 23.4 Useful life assumption at 65 years, years 2013 Proprietary costs, excluding interest expense 171 204 Interest expense 108 52 Cost of proprietary pension payments 279 256 Proprietary pension payments Pension payments through insurance Insurance premiums 141 153 Subtotal 420 409 Payroll tax on pension costs Pension costs during the year 67 61 487 470 2014 2013 CAPITAL VALUE OF PENSION OBLIGATIONS Capital value of pension obligations pertaining to proprietary pension payments on January 1 CHANGE IN PLAN ASSETS GROUP 2014 PARENT COMPANY Weighted average maturity for the plans is 27 years (27). Decrease, % Future salary increases, 0.5 percentage points change PARENT COMPANY CHANGE IN OBLIGATION FOR DEFINED BENEFIT PLANS Increase, % 3,025 2,908 Cost, excluding interest expense, charged against profit 171 204 Interest expense 108 53 –128 –140 3,176 3,025 Pension payments Capital value of pension obligations pertaining to proprietary pension on December 31 FAIR VALUE OF ESPECIALLY DETACHED ASSETS PARENT COMPANY Fair value of especially detached assets on January 1 Return on especially detached assets 2014 2013 3,807 3,464 340 373 Payment to/from pension foundations Fair value of especially detached assets on December 31 –30 4,147 3,807 1,551 1,252 Fair value of especially detached assets distributed as: Shares Funds 448 411 Interest-bearing receivables 2,148 2,144 Fair value of especially detached assets on December 31 4,147 3,807 The NCC Group’s Pension Foundation has an interest-bearing receivable of SEK 1,700 M (1,500) from NCC AB. Otherwise, the pension foundation has no financial instruments issued by the company or assets used by the company. NCC 2014 95 FINANCIAL REPORT Note 31 Pensions, cont’d. NOTE 34 A CCRUED EXPENSES AND PREPAID INCOME NET PENSION OBLIGATION PARENT COMPANY GROUP 2013 2014 PARENT COMPANY 2014 2013 2014 2013 2,165 2,110 910 930 1 1 Capital value of pension obligations pertaining to proprietary pension on December 31 3,176 3,025 Payroll-related costs Fair value of especially detached assets on December 31 4,147 3,807 Financial expenses 22 36 973 784 Prepaid rental revenues 11 10 2 2 Surplus on especially detached assets Net recognized pension obligation ASSUMPTIONS FOR DEFINED-BENEFIT OBLIGATIONS PARENT COMPANY 2014 2013 Discount interest rate on December 31 3.84 3.84 The pension calculations are based on the salary and pension level on the balance-sheet date. 2013 Other long-term liabilities 7 5 98 51 Liabilities, property acquisitions 215 185 Other long-term liabilities 228 59 Total 548 299 2,603 2,932 161 35 Derivative instruments held for hedging Other current liabilities Advances from customers Liabilities to associated companies Derivative instruments held for hedging Liabilities, property acquisitions 219 1,213 1,195 218 365 Administrative costs 99 64 6 5 221 176 Operating and sales costs Other expenses 127 77 74 19 3,952 3,888 1,209 1,321 NOTE 35 L EASING 2014 Liabilities to associated companies 94 Project-related costs Total NOTE 32 O THER LIABILITIES GROUP Prepaid revenues from rental guarantees 2 545 930 Other current liabilities 1,472 1,460 Total 4,782 5,360 In Sweden, there are framework agreements for the financial leasing of cars and trucks, with some related administrative services. The agreements are based on variable interest rates. NCC recommends purchasers and has the opportunity to extend leasing agreements. In Finland, Norway and Denmark, framework agreements have been con cluded for the operational leasing of cars and trucks, including related adminis trative services. The agreements are based on variable interest rates. A sepa rate agreement is required for the acquisition of leased objects and the extension of leasing agreements. Within NCC Roads and Construction Norway, there are framework agree ments for the operational leasing of production equipment. The agreements are based on variable interest rates and pertain to Sweden, Norway, Denmark and Finland. In 2006, a sale-leaseback agreement was signed with the German finance group HSH Nordbank and its associated company AGV pertaining to properties in the Sonnengarten area of Berlin. At the same time, an 18-year lease was signed, which is recognized as an operational lease. GROUP NOTE 33 W ORK IN PROGRESS ON ANOTHER PARTY’S ACCOUNT AND NET SALES PARENT COMPANY Leasing contracts that expire: Within one year 2013 19,664 19,143 260 237 19,924 19,380 –18,428 –17,867 153 96 –18,275 –17,771 1,649 1,609 Invoicing during the year 20,158 20,819 Future minimum leasing fees Invoiced but not recognized as profit on January 1 19,380 21,918 Less interest charge Invoicing excluding withheld amount Total invoicing Costs incurred excluding reserve for losses Reserve for losses Total costs incurred Total work in progress on another party’s account Profit-recognized invoicing Less: Invoiced but not recognized as profit on December 31 Total revenues –19,924 –19,380 19,614 23,357 2013 Financial lessee 2014 Withheld amount 2014 Later than one year but earlier than five years 35 38 263 241 Future minimum leasing fees: Within one year Later than one year but earlier than five years 99 99 202 181 Present value of future minimum leasing fees: Within one year Later than one year but earlier than five years 98 96 199 178 301 280 Reconciliation of future leasing fees and their present value: Present value of future minimum leasing fees –4 –6 297 274 Variable fees included in net profit for the year: Interest on leased machinery and equipment 5 6 Total 5 6 96 NCC 2014 FINANCIAL REPORT Note 35 Leasing, cont’d. Note 36 Transactions with related companies, cont’d. OPERATING LEASES PARENT COMPANY GROUP 2014 PARENT COMPANY 2013 2014 2013 2,065 2,862 920 1,057 Transactions with Group companies Sales to Group companies Interest income from Group companies Future minimum leasing fees – lessor (leased premises) 79 116 111 121 1,095 1,389 Interest expense to Group companies Dividend from Group companies Distributed by maturity period: Later than one year but earlier than five years 2013 Purchases from Group companies Operational lessor Within one year 2014 26 4 61 15 5 3 Later than five years 11 28 10 35 Long-term receivables from Group companies Current receivables from Group companies 10 10,703 10,339 Interest-bearing liabilities to Group companies 3,296 4,161 Operating liabilities to Group companies 1,423 1,574 21,922 20,818 8 14 24 46 Operational lessee Contingent liabilities for Group companies Future minimum leasing fees – lessee Transactions with associated companies and joint arrangements Leasing contracts that expire: 10 Sales to associated companies and joint arrangements Within one year 369 337 62 63 Later than one year but earlier than five years 773 710 144 205 Later than five years 463 427 The year’s cost for operational leasing amounts to 751 599 62 63 NOTE 36 T RANSACTIONS WITH RELATED COMPANIES The main companies that are closely related to the NCC Group are the Nord stjernan Group, companies in the Axel Johnson Group, the FastPartner Group and associated companies and joint arrangements. The Parent Company has a close relationship with its subsidiaries; refer to Note 17, Participations in Group companies. For information on NCC’s senior executives, refer to Note 5, Number of employees, personnel expenses and remuneration of senior executives. For transactions pertaining to NCC Group’s Pension Foundation, refer to Notes 31 and 39. Transactions involving NCC’s associated companies and joint arrangements were of a production nature. The transactions were conducted on normal market terms. GROUP 2014 2013 Purchases from associated companies and joint arrangements Dividend from associated companies and joint arrangements 184 184 Current receivables from associated companies and joint arrangements 4 9 Operating liabilities to associated companies and joint arrangements 4 6 Contingent liabilities to associated companies and joint arrangements 54 8 Transactions with the Nordstjernan Group Sales to the Nordstjernan Group Purchases from the Nordstjernan Group Current receivables from the Nordstjernan Group Purchases from associated companies and joint arrangements 371 120 45 64 1 Long-term receivables from associated companies and joint arrangements 94 92 Current receivables from associated companies and joint arrangements 78 60 125 115 Operating liabilities to associated companies and joint arrangements 12 12 Contingent liabilities to associated companies and joint arrangements 11 21 Transactions with the Nordstjernan Group Sales to the Nordstjernan Group Purchases from the Nordstjernan Group Current receivables from the Nordstjernan Group Operating liabilities to the Nordstjernan Group 1 394 59 40 3 1 Transactions with the Axel Johnson Group Purchases from the Axel Johnson Group NOTE 37 P LEDGED ASSETS, CONTINGENT LIABILITIES AND GUARANTEE OBLIGATIONS Dividend from associated companies Interest-bearing liabilities to associated companies and joint arrangements 8 467 1 Operating liabilities to the Nordstjernan Group Transactions with associated companies and joint arrangements Sales to associated companies and joint arrangements 5 Long-term receivables from associated companies and joint arrangements GROUP Property mortgages 1,112 1,095 298 279 Chattel mortgages Assets subject to liens, etc. Restricted bank funds Total 2014 2013 0 0 6 43 30 1,452 1,410 Other assets pledged: Other 58 72 Total 58 72 0 0 1,510 1,482 0 0 21,922 20,818 1,839 2,081 1,839 2,081 69 112 69 112 129 68 2 6 Total assets pledged 688 593 Contingent liabilities Own contingent liabilities: 52 Transactions with the Axel Johnson Group Guarantees on behalf of Group companies Purchases from the Axel Johnson Group Deposits and concession fees 6 2013 For own liabilities: 2 70 2014 Assets pledged 10 1 PARENT COMPANY 5 Other guarantees and contingent liabilities Held jointly with other companies: Liabilities in consortiums, trading companies and limited partnerships NCC 2014 97 FINANCIAL REPORT Note 37 Pledged assets, contingent liabilities and guarantee obligations, cont’d. GROUP Total guarantees and guarantee obligations ACQUISITION OF FIXED ASSETS PARENT COMPANY 2014 2013 2014 2013 2,037 2,261 23,833 23,017 ASSETS SUBJECT TO LIENS Pertains to leased equipment in the form of vehicles and trucks. GUARANTEES ON BEHALF OF GROUP COMPANIES Sureties on behalf of Group companies have mainly been issued as collateral for: • utilized guarantee limits with banks and insurance companies, • NCC Treasury AB’s borrowing, • construction period financing for tenant-owner associations formed by NCC and • fulfillment of construction-contract agreements. DEPOSITS AND CONCESSION FEES Deposit guarantees constitute collateral for investments and concession fees paid to tenant-owner associations formed by NCC. Such guarantees shall be relinquished as soon as one year has passed after the final acquisition cost for the tenant-owner association’s building has been established. PARENT COMPANY Cash and bank balances 2014 2013 2,591 2,775 773 2,592 3,548 2014 2013 1,938 705 Short-term investments 6,400 7,100 Total according to cash flow statement 8,337 7,805 The short-term investments have been classified as cash and cash equivalents based on the following considerations: • They are subject to an insignificant risk of value fluctuation. • They can easily be converted into cash funds. • T hey have a maturity of not more than three months from the date of acquisition. ACQUISITION OF SUBSIDIARIES AND NON-CONTROLLING INTERESTS According to the acquisition analyses, the value of acquired assets and l iabilities was as follows: GROUP 2014 Goodwill 16 Intangible fixed assets 15 Tangible fixed assets 2 Inventories 1 Accounts receivable and other current receivables 5 Cash and cash equivalents INFORMATION ABOUT INTEREST PAID Group Interest received during the year amounted to SEK 44 M (71). Interest paid during the year amounted to SEK 371 M (383). Parent Company Interest received during the period amounted to SEK 84 M (124). Interest paid during the period amounted to SEK 286 M (242). Operating activities Short-term investments Total according to balance sheet and cash flow statement Parent Company Acquisitions of intangible and tangible fixed assets during the year amounted to SEK 155 M (88), of which SEK 0 M (0) was financed through loans. Since the Parent Company has only insignificant amounts of cash and cash equivalents in foreign currency, no exchange-rate differences in cash and cash equivalents arose during the year. GROUP CASH AND CASH EQUIVALENTS Cash and bank balances Group Acquisitions of intangible and tangible fixed assets during the year amounted to SEK 820 M (923), of which SEK 0 M (0) was financed through loans. Acquisition of subsidiaries and non-controlling interests total SEK 27 M (8), of which SEK 0 M (0) had no effect on cash flow. Sales of subsidiaries and noncontrolling interests amounted to SEK 0 M (0), of which SEK 0 M (0) had no effect on cash flow. CASH FLOW ATTRIBUTABLE TO PARTICIPATIONS IN JOINT OPERATIONS NOTE 38 C ASH FLOW STATEMENT GROUP Note 38 Cash flow statement, cont’d. 2013 9 Long-term liabilities –1 Accounts payable and other current liabilities –7 Non-controlling interests 8 Deferred tax liability –4 Purchase considerations 36 Acquired cash and cash equivalents –9 Impact on the Group’s cash and cash equivalents 27 8 8 Change in working capital Investing activities 2014 2013 66 49 –51 –77 21 –21 Financing activities –54 13 Total cash flow –18 –36 2014 2013 CASH AND CASH EQUIVALENTS UNAVAILABLE FOR USE GROUP Restricted bank funds 43 30 Cash and cash equivalents in joint ventures 93 120 136 150 2014 2013 131 132 Total cash and cash equivalents unavailable for use TRANSACTIONS THAT HAD NO EFFECT ON PAYMENTS GROUP Acquisition of assets through financial leasing 98 NCC 2014 FINANCIAL REPORT Note 39 Financial instruments and financial risk management, cont’d. NOTE 39 F INANCIAL INSTRUMENTS AND FINANCIAL RISK MANAGEMENT MATURITY STRUCTURE, TIED-UP CAPITAL, 20141) INTEREST-BEARING LIABILITIES FINANCE POLICY (PRINCIPLES FOR RISK MANAGEMENT) Through its business operations, the Group is exposed to financial risks. These financial risks are defined as refinancing, liquidity, interest-rate, exchange-rate, credit, counterparty risks and guarantee capacity risks. NCC’s finance policy for managing financial risks has been decided by NCC’s Board of Directors and constitutes a framework of guidelines and rules in the form of risk mandates and limits for finance activities. Within the NCC Group’s decentralized organization, finance activities are centralized to NCC Group Treasury, partly in order to monitor the Group’s over all financial risk positions, partly to achieve cost-effectiveness and economies of scale and to accumulate expertise, while protecting Group-wide interests. Within NCC, risks associated with the Group’s interest and exchange rates, credit, refinancing, counterparty and liquidity are managed by NCC’s internal bank, NCC Treasury AB. Customer-credit risks are handled within each busi ness area. CONTRACTUAL CONDITIONS Matures Amount Proportion, % 2015 2,526 27 2016 2,749 29 2017 829 9 2018 834 9 2,316 24 20192) 2020 9 2021– Total 219 2 9,483 100 1) Excluding pension obligations according to IAS 19. 2) Of which, reloaning from the NCC Group’s Pension Foundation accounted for SEK 1,700 M. NCC has established the following investor-related market-financing programs: NCC is subject to a financial covenant in the form of the debt/equity ratio that is associated with the syndicated credit facility that was signed with a group of banks. In December, the Group’s syndicated loan facility was refinanced. The volume increased from EUR 325 M to EUR 400 M and the maturity period extended from two to five years, with two one-year extension options. NCC s atisfies the financial covenants. MARKET FINANCING PROGRAMS Limit REFINANCING RISK The refinancing risk is defined as the risk that NCC will not be able to obtain financing at a given time or that creditors will have difficulty in fulfilling their commitments. NCC strives to spread its risk among various sources of financing (market-financing programs, bank loans and other loan structures) in order to secure the Group’s long-term access to borrowed capital. NCC’s policy for its refinancing risk is to ensure that the borrowing port folio has a maturity structure that minimizes the Group’s exposure from the perspective of the refinancing risk. The maturity periods must be well-diversi fied over time. The norm concerning distribution is that the weighted average remaining maturity must be at least 18 months. At December 31, capital was tied up for 31 months (32) for total interest-bearing liabilities less pension obli gations according to IAS 19. Financing of SEK 2,271 M (2,036) pertaining to construction by Finnish housing companies and Swedish tenant-owners’ associ ations is linked to each particular housing development project and capital was tied up for 22 months (18), in financing reflects this relationship. Excluding loans in Finnish housing companies and Swedish tenant-owners’ associations, as well as pension obligations according to IAS 19, the capital is tied up for 34 months (36). Utilized Nom. value SEK M Commercial paper (CP) program in Finland EUR 300 M Commercial paper (CP) program in Sweden SEK 4,000 M 50 Medium Term Note (MTN) in Sweden1) SEK 5,000 M 4,308 Total 4,358 1) Of which a nominal amount of SEK 2,950 M listed on Nasdaq Stockholm. Of NCC’s total interest-bearing liability, excluding pension obligations accord ing to IAS 19, investor-related loans accounted for 46 percent (48). LIQUIDITY RISKS To achieve adequate flexibility and cost-effectiveness, while ensuring that future financing requirements are satisfied, the Group’s payment capacity con sists essentially of committed lines of credit. NCC’s finance policy states that the Group’s payment capacity must correspond to at least 7 percent of annual consolidated sales, with at least 5 percent of this in the form of unutilized com mitted lines of credit. Payment capacity is defined as the Group’s cash and cash equivalents, short-term investments and unutilized committed lines of credit, less market-financing programs with a remaining maturity of less than three months. At the end of the year, the volume of unutilized committed lines of credit amounted to SEK 4,774 M (3,869), with a remaining average maturity of 4.4 years (2.8). Available cash and cash equivalents are invested in banks or in interest-bearing instruments with good credit ratings and a liquid secondary market. At December 31, the Group’s cash and cash equivalents, including short-term investments, amounted to SEK 2,833 M (3,691). Payment capacity on December 31, corresponded to 13 percent (13) of sales. The table below shows the Group’s financial liabilities (including interest payments) and net settled derivative instruments classified as financial liabilities. For financial instruments carrying variable interest rates, the interest rate pertaining on the balance-sheet date has been used. Amounts in foreign currency have been translated to SEK based on the exchange rate applying on the balance-sheet date. The amounts in the tables are the contractual undiscounted cash flows. ANALYSIS OF MATURITIES (AMOUNTS INCLUDING INTEREST)1) 2013 2014 Total <3 months 3 months –1 year 1–3 years 3–5 years >5 years Total <3 months 3 months –1 year 1–3 years 3–5 years >5 years Reloaning from the NCC Group’s Pension Foundation 1,904 41 82 1,781 59 64 1,670 Interest-bearing liabilities 5,501 77 1,228 2,732 1,450 14 6,183 195 1,091 3,248 1,525 124 Interest-bearing liabilities in Finnish housing companies and Swedish tenant-owners’ associations2) 2,343 96 1,176 832 8 231 2,109 285 1,046 600 6 172 308 1 108 165 34 289 2 103 138 46 36 63 11 25 56 17 2,324 4,106 3,264 Financial lease liabilities Interest-rate swaps 116 6 Accounts payable 3,960 3,960 14,132 4,140 Total 2,589 3,874 3,284 1,793 99 1 4,096 4,096 245 14,569 4,579 1) Excluding pension obligations according to IAS 19. 2) T he due obligations for interest-bearing liabilities in unsold completed projects in Finnish housing companies is defined as the due date for the long-term loan agreements. However, the loans will be redeemed in pace with sales of the housing units. 296 NCC 2014 99 FINANCIAL REPORT Note 39 Financial instruments and financial risk management, cont’d. The table below shows the Group’s gross settled derivatives. The amounts in the table are the contractual undiscounted cash flows. ANALYSIS OF MATURITIES (AMOUNTS INCLUDING INTEREST) 2013 2014 3 months Total <3 months - 1 year 1–3 years 3–5 years 3 months Total <3 months - 1 year >5 years 1–3 years 3–5 years >5 years Currency forward contracts and cross-currency swaps – outflow –11,420 –379 –212 –11,199 –9,857 –959 –158 –225 – inflow 11,518 6,395 4,432 407 284 11,216 9,904 944 141 227 98 17 –19 28 72 17 47 –15 –17 2 Net flow from gross settled derivatives –6,378 –4,451 INTEREST-RATE RISKS MATURITY STRUCTURE, INTEREST TERM 20141) The interest-rate risk is the risk that changes in market rates will adversely affect NCC’s cash flow or the fair value of financial assets and liabilities. NCC’s main financing sources are shareholders’ equity, cash flow from operating activities and borrowing. Interest-bearing borrowing exposes the Group to an interest-rate risk. NCC’s finance policy for the interest-rate risk is that the weighted average remaining maturity of borrowing portfolio1) when exposure is reduced by the maturity for cash and cash equivalents 2) should normally be 12 months subject to a mandate to deviate from this figure by +/– 6 months, and that the interest-rate maturity structure of the borrowing portfolio should be adequately spread over time. If the interest-rate terms of available borrowing vehicles are not compatible with the desired structure for the loan portfolio, interest swaps are the main instruments used to adapt the structure. In the financial statements, hedge accounting is applied when there is an effective con nection between the hedged loan and interest-rate swaps. The average interest-rate maturity of the corporate borrowing portfolio1) reduced by interest-rate exposure associated with cash and cash equivalents 2) was 13 months (14), including interest-rate swaps linked to the borrowing port folio. Cash and cash equivalents 2) amounted to SEK 2,740 M (3,623) and the average interest-rate maturity for these assets was 2 months (1). At the end of 2014, NCC’s interest-bearing gross debt excluding pension obli gations according to IAS 19 amounted to SEK 9,483 M (9,544) and the average interest-rate maturity was 11 months (11). Excluding loans in Finnish housing companies and Swedish tenant-owners’ associations, as well as the pension obli gations according to IAS 19, the gross liability amounted to SEK 7,213 M (7,508) and the average interest-rate maturity was 13 months (14), including interest-rate swaps linked to the borrowing portfolio. On December 31, 2014, NCC had interest-rate swaps linked to the borrowing portfolio with a nominal value of SEK 1,771 M (1,800). Other interest-rate swaps, intended for the hedging of the interest-rate risk in a leasing contract, had a nominal value of SEK 332 M (312). At the same date, the interest-rate swaps (linked to the borrowing portfolio) had a negative fair value of SEK 77 M (neg: 26) net, comprising assets of SEK 0 M (0) and liabilities of SEK 77 M (26). The other interest-rate swaps had a negative fair value of SEK 33 M (neg: 36) net, comprising liabilities of SEK 33 M (36). The interest-rate swaps linked to the borrowing portfolio have expiration dates ranging from 1.4 (0.7) to 5.0 years (4.7). The other interest-rate swaps have expiration dates of 2.5 years (3.5). An increase in interest rates by one percentage point would result in a negative change of SEK 14 M (neg: 8) in net profit for the year, assuming the interest-bearing assets and liabilities that existed on the balance-sheet date, excluding the pension obligations according to IAS 19. Other components in net profit for the year would have been SEK 6 M (7) higher and shareholders’ equity SEK 31 M (37) higher as an effect of an increase in the fair value of the Group’s interest-rate swaps. 1)Corporate borrowing portfolio: Interest-bearing liabilities excluding the Finnish housing companies and Swedish tenant-owners’ associations, as well as excluding the pension obligations according to IAS 19, including interest-rate swaps linked to the borrowing portfolio. 2) C ash and cash equivalents and short-term investments excluding cash and cash equivalents in Swedish tenant-owners’ associations. INTEREST-BEARING LIABILITIES, INCL. INTEREST-RATE SWAPS Matures Amount Proportion, % 2015 7,146 75 2016 1,000 11 2017 550 6 2018 608 6 2019 121 1 2020 2021– Total 58 1 9,483 100 1) Excluding pension obligations according to IAS 19. EXCHANGE-RATE RISKS The exchange-rate risk is the risk that changes in exchange rates will adversely affect the consolidated income statement, balance sheet or cash flow statement. TRANSACTION EXPOSURE In accordance with the finance policy, transaction exposure must be eliminated as soon as it becomes known. Contracted and probable forecast flows are hedged, mainly by using currency forward contracts. Contracted net exposure in each cur rency is hedged at a rate of 100 percent. Forecast net exposure is hedged succes sively over time, which entails that the quarters that are closest in time are hedged to a greater extent than the following quarters. Accordingly, each quarter is hedged on several occasions and is covered by several hedged contracts that have been entered into at different times. The target is to hedge 90 percent of the forecast for the current quarter and 70 percent of the forecast for the following quarter, followed by 50, 30 and 10 percent, respectively, in the following quarters. In the financial statements, hedge accounting is applied when the requirements for hedge accounting are fulfilled. The table below shows the Group’s net outflows of various currencies, and the hedged portion, during the year. COUNTER-VALUE IN SEK M 2014 Currency Net outflow Of which, hedged Hedged portion, % Net outflow Of which, hedged EUR 910 742 82 902 733 81 Other 166 46 28 142 88 62 1,076 788 73 1,044 821 79 Total 2013 Hedged portion, % During 2014, no cash-flow hedges were closed, because it was no longer proba ble that the expected cash flow would be achieved. Transaction exposure has been hedged through currency forward contracts. The forward contracts used to hedge contracted and forecast transactions are classified as cash flow hedges. The fair value of currency forward contracts used for hedging transaction exposure amounted to SEK 11 M (7). Of this amount, assets of SEK 15 M The table below shows forecast currency flows during 2015–2016, the outstanding hedge position at year-end and the hedged portion. COUNTER-VALUE IN SEK M Currency EUR Target value % Q1 2015 Q2 2015 Q3 2015 Q4 2015 Q1 2016- TOTAL Hedged Hedged Hedged Hedged Hedged Hedged Net out- Hedge portion, Net out- Hedge portion, Net out- Hedge portion, Net out- Hedge portion, Net out- Hedge portion, Net out- Hedge portion, flow position % flow position % flow position % flow position % flow position % flow position % 141 129 91 90 132 92 70 70 150 75 50 50 130 39 30 30 107 11 10 659 346 52 10 The outstanding hedge position (nominal volume) at year-end in terms of contracted net currency flows had a value of SEK 14 M (117), of which SEK 11 M (66) will fall due within three months. 100 NCC 2014 FINANCIAL REPORT Note 39 Financial instruments and financial risk management, cont’d. (9) and liabilities of SEK 4 M (2) have been recognized in the balance sheet. The hedges fulfill effectiveness requirements, meaning that all changes resulting from changed exchange rates are recognized in other comprehensive income. Should the SEK depreciate 5 percent in relation to the EUR, with all other variables remaining constant, the result would be a negative change of SEK 14 M (neg: 14) in net profit for the year, due to losses arising when trans lating accounts payable in EUR. According to NCC’s finance policy, the Group’s assets are to be matched in local currency. External and internal borrowing in the NCC Group occurs pri marily through the central treasury unit and is then transferred to the business areas and subsidiaries in the form of internal loans. Lending is denominated in local currency, while external financing largely occurs in SEK and EUR. Parts of the Group’s loans and liquidity are converted through currency derivatives into the currencies of the Group’s assets. In January 2015, the Board of Direc tors resolved to grant exception from this policy entailing that the CEO, within an established limit, is able to decide not to ruble-hedge assets in Russia. Refer also to Note 41, Events after balance-sheet date. The following tables illustrate NCC’s financing and the currency swap agree ments for financing. The stated values include underlying capital amounts. INTEREST-BEARING LIABILITIES 2014 1) Counter-value in SEK M EUR NOK Amount Proportion, % 1,661 17 448 5 SEK 7,374 78 Total 9,483 100 FINANCING VIA CURRENCY DERIVATIVES1) 2014 Counter-value in SEK M Sell DKK –851 Sell EUR –2,856 Sell NOK –2,696 Sell RUB –829 Buy PLN 15 Net –7,217 1) Currency swaps and cross-currency swaps TRANSLATION EXPOSURE The main rule of NCC’s finance policy is that the Group’s translation exposure should not be hedged. Development operations, such as NCC Property Develop ment and NCC Housing, are exempt from this rule and, for these operations, currency hedging is permissible. In those cases where hedging occurs, not more than 90 percent of foreign net assets may be hedged, without taking the tax effect into account. The President and CEO may decide on the hedging of foreign net assets in selected companies in excess of the above guidelines. 1) Excluding pension obligations according to IAS 19. The table below shows the Group’s net investments in NCC Property Development and NCC Housing, and hedging positions per currency, plus the hedged portion both with and without taking tax effects into account. COUNTER-VALUE IN SEK M Currency 2013 2014 Net investment Hedge position before tax Hedged portion before tax % Hedge position after tax Hedged portion after tax % Net investment Hedge position before tax Hedged portion before tax % Hedge position after tax Hedged portion after tax % 69 DKK 567 481 85 375 66 502 445 89 347 EUR 1,322 1,123 85 876 66 1,099 939 85 732 67 233 200 86 156 67 258 219 85 171 66 23 24 107 19 83 NOK RUB LVL Total 2,145 1,828 85 1,426 Net assets are hedged through the raising of loans and through currency forward contracts. The carrying amount of loans and currency forward con tracts (including underlying capital amounts) used as hedging instruments at December 31, was SEK 1,828 M (1,644), of which SEK 569 M (534) for loans and SEK 1,260 M (1,110) for currency forward contracts. Hedge accounting is applied when the criteria for hedge accounting are met. An exchange-rate loss of SEK 85 M (loss: 18) before tax has been recognized in other comprehensive income. For more information on hedge accounting, refer to Note 1 Accounting policies, Hedging of net investments. The hedges fulfill effectiveness require ments, meaning that all changes resulting from changed exchange rates are recognized in other comprehensive income. At December 31, 2014, a 5-percent depreciation of the SEK in relation to other currencies would result in a change of SEK 108 M (94) in shareholders’ equity and a change of SEK 0 M (0) in net profit for the year in respect of unhedged translation exposure. 67 12 44 41 91 32 71 1,915 1,644 86 1,282 67 party risks pertaining to cash and cash equivalents and short-term investments amounted to SEK 2,833 M (3,691). Credit risks in accounts receivable The risk that the Group’s customers will not fulfill their obligations, meaning that payment is not received from the customers, is a credit risk. The credit r ating of the Group’s customers is checked, whereby information on the cus tomers’ financial position is obtained from various credit information compa nies. For major accounts receivable, the risk of credit losses is limited through various types of collateral, such as bank guarantees, blocks on building loans, Parent Company guarantees and other payment guarantees. AGE ANALYSIS OF ACCOUNTS RECEIVABLE INCLUDING RECEIVABLES FOR DIVESTED PROPERTY PROJECTS Credit and counterparty risks in financial operations NCC’s investment regulations for financial credit risks are revised continuously and characterized by caution. Transactions are only entered into with credit worthy counterparties with credit ratings of at least A-(Standard & Poor’s) or the equivalent international rating, as well as local banks with a minimum rating equal to the creditworthiness of the country in which NCC has operations. ISDA’s (International Swaps and Derivatives Association) framework agree ment on netting is used with all counterparties with respect to derivative trad ing. The investment regulations specify maximum credit exposures and maturi ties for various counterparties. Total counterparty exposure with respect to derivative trading, calculated as the net receivable per counterparty, amounted to SEK 493 M (191) at the end of 2014. The net receivable per counterparty is calculated in accordance with the market valuation method (FFFS 2007:1). Calculated gross exposure to counter 2013 2014 CREDIT RISKS Gross Provision for doubtful receivables Gross Provision for doubtful receivables Not due accounts receivable 6,128 6,204 Past-due accounts receivable 1–30 days 598 691 Past-due accounts receivable 31–60 days 83 190 1 Past-due accounts receivable 61–180 days 132 14 230 20 584 203 398 158 7,525 217 7,712 180 Past-due accounts receivable > 180 days Total Collateral for accounts receivable was received in an amount of SEK 0 M (0). NCC 2014 101 FINANCIAL REPORT Note 39 Financial instruments and financial risk management, cont’d. PROVISION FOR DOUBTFUL RECEIVABLES 2014 2013 214 On January 1 180 Provision for the year 101 77 Reversal of previously posted impairment losses –66 –110 Translation differences On December 31 3 –2 217 180 CARRYING AMOUNT AND FAIR VALUE OF FINANCIAL INSTRUMENTS The carrying amount and the fair value of financial instruments are presented in the following table. In NCC’s balance sheet, mainly short-term investments held for resale and derivatives are measured at fair value. Short-term invest ments are valued according to prices quoted on a well-functioning secondary market for the same instruments. Fair-value measurement for currency-forward contracts and cross-currency swaps is based on published forward rates in an active market. The measure ment of interest-rate swaps is based on forward interest rates based on observa ble yield curves. The discount has no significant impact on the m easurement of derivatives. For financial instruments recognized at amortized cost (accounts receiva bles, other receivables and cash and cash equivalents, accounts payable and other interest-free liabilities) the fair value are deemed to agree with the c arrying amount. For long-term holdings of securities and short-term invest ments held to maturity, the fair value is based on the price listed in a well-func tioning secondary market. For short and long-term bond loans listed on Nasdaq Stockholm, the fair value was calculated according to prices listed in a wellfunctioning secondary market. The fair value for unlisted long-term bonds and long-term liabilities to credit institutions, was calculated by discounting future cash flows with current market rates for similar financial instruments. It has been deemed that the fair value of other long-term and short-term interest-bear ing liabilities did not materially deviate from the carrying amount. CLASSIFICATION OF FINANCIAL INSTRUMENTS Financial assets measured at fair value through profit or loss1) GROUP, 2014 Derivatives used in hedge accounting Accounts and loan receivables Other long-term holdings of securities Long-term receivables 223 Accounts receivable Prepaid expenses and accrued income Other receivables 194 Short-term investments 115 27 115 40 Financial liabilities measured at fair value through profit or loss1) Other liabilities 27 156 160 350 7,178 7,178 7,178 2 2 2 324 545 545 10,223 242 40 0 Long-term interest-bearing liabilities2) Other long-term liabilities Total fair value 350 2,592 532 Total carrying amount 127 127 Cash and cash equivalents Total assets Investments held to maturity Available-forsale financial assets 86 12 Provisions for pensions and similar obligations 242 243 2,592 2,592 0 11,065 11,070 6,957 6,957 7,059 450 548 548 585 585 585 Current interest-bearing liabilities 2,526 2,526 2,531 Accounts payable 3,960 3,960 3,960 Accrued expenses and deferred income Other current liabilities 55 Total liabilities GROUP, 2013 0 141 0 Financial assets measured at fair value through profit or loss1) Derivatives used in hedge accounting Accounts and loan receivables Other long-term holdings of securities Long-term receivables 23 Accounts receivable Prepaid expenses and accrued income –2 Other receivables 72 Short-term investments 21 14 Long-term interest-bearing 22 22 546 707 707 0 0 118 15,046 15,305 15,412 Investments held to maturity Available-forsale financial assets Financial liabilities measured at fair value through profit or loss1) Other liabilities Total carrying amount Total fair value 108 23 131 134 145 168 168 7,377 7,377 7,377 1 –1 –1 254 340 340 122 Cash and cash equivalents Total assets 22 106 143 143 3,548 3,548 0 11,706 11,709 7,029 7,029 7,140 248 299 299 3,548 114 14 11,325 230 23 0 liabilities2) Other long-term liabilities 47 4 Provisions for pensions and similar obligations 125 125 125 Current interest-bearing liabilities 2,515 2,515 2,517 Accounts payable 4,096 4,096 4,096 Accrued expenses and deferred income Other current liabilities Total liabilities 0 9 1 36 46 46 11 23 932 966 966 28 14,981 15,076 15,189 67 1) Held for resale. 2) Reloaning of SEK 1,700 M (1,500) from NCC’s Pension Foundation is included. 0 0 0 102 NCC 2014 FINANCIAL REPORT Note 39 Financial instruments and financial risk management, cont’d. PARENT COMPANY, 2014 Derivatives used in hedge accounting Accounts and loan receivables Receivables from associated companies Available-for-sale financial assets Other liabilities 184 Other long-term holdings of securities 5 Total carrying amount Total fair value 184 184 5 5 20 20 20 2,792 2,792 2,792 2,369 2,373 2,373 4 4 4 116 116 116 Short-term investments 6,400 6,400 6,400 Cash and bank balances 1,938 1,938 1,938 0 13,832 13,832 Long-term liabilities to credit institutions1) 1,700 1,700 1,700 Long-term liabilities to Group companies 1,061 1,061 1,061 29 29 29 2,092 2,092 2,092 3,648 3,678 3,678 4 4 4 Other long-term receivables Accounts receivable Current receivables from Group companies 4 Current receivables from associated companies Other current receivables Total assets 4 13,823 5 Other long-term liabilities Accounts payable Current liabilities to Group companies 31 Current liabilities to associated companies Total liabilities PARENT COMPANY, 2013 31 0 0 8,533 8,564 8,564 Derivatives used in hedge accounting Accounts and loan receivables Available-for-sale financial assets Other liabilities Total carrying amount Total fair value 184 184 Receivables from associated companies 184 Other long-term holdings of securities 5 Other long-term receivables 24 Accounts receivable Current receivables from Group companies 3 Current receivables from associated companies 5 5 24 24 2,666 2,666 2,666 2,560 2,563 2,563 9 9 9 67 67 67 7,100 7,100 7,100 705 705 705 0 13,323 13,323 Long-term liabilities to credit institutions1) 1,500 1,500 1,500 Long-term liabilities to Group companies 1,061 1,061 1,061 9 9 9 1,756 1,756 1,756 Other current receivables Short-term investments Cash and bank balances Total assets 3 13,315 5 Other long-term liabilities Accounts payable 4,664 4,674 4,674 Current liabilities to associated companies Current liabilities to Group companies 6 6 6 Other current liabilities 1 1 1 8,997 9,007 9,007 Total liabilities 10 10 0 0 1) Reloaning of SEK 1,700 M (1,500) from NCC’s Pension Foundation is included. The classification categories Financial assets measured at fair value through profit and loss, Investments held to maturity and Financial liabilities measured at fair value through profit and loss are not applicable for the Parent Company. No reclassification of financial assets and liabilities among the above categories was effected during the year. In the following tables, disclosures are made concerning how fair value was determined for the financial instruments that are continuously measured at fair value and the financial instruments not recognized at fair value in NCC’s bal ance sheet. When determining fair value, assets have been divided into the fol lowing three levels. No transfers were made between the levels during the period and no significant changes were made with respect to measurement methods, data or assumptions used. Level 1: i n accordance with prices quoted on an active market for the same instruments. This category does not apply for the Parent Company. Level 2: on the basis of directly or indirectly observable market data that is not included in Level 1. Level 3: o n the basis of input data that is not observable in the market (which is not applicable for NCC). NCC 2014 103 FINANCIAL REPORT Note 39 Financial instruments and financial risk management, cont’d. 2013 2014 GROUP Level 1 Level 2* Total 417 417 Level 1 Level 2 Total 93 93 Financial assets measured at fair value Financial assets measured at fair value through profit or loss – Derivative instruments held for trading – Securities held for trading 115 115 21 21 Derivative instruments used for hedging purposes 27 27 14 14 Available-for-sale financial assets 40 40 23 23 247 234 484 846 255 130 385 Financial assets not recognized at fair value Investments held to maturity 247 Total assets 362 234 Financial liabilities measured at fair value Financial liabilities measured at fair value through profit and loss – Derivative instruments held for trading 118 118 28 28 Derivative instruments used for hedging purposes 141 141 67 67 Financial liabilities not recognized at fair value Other liabilities (interest-bearing liabilities) 3,015 6,575 9,590 3,116 6,541 9,657 Total liabilities 3,015 6,834 9,849 3,116 6,636 9,752 PARENT COMPANY Level 1 Level 2* Total Level 1 Level 2 4 4 3 3 0 4 4 0 3 3 31 31 10 10 0 31 31 0 10 10 2013 2014 Total Financial assets measured at fair value Derivative instruments used for hedging purposes Total assets Financial liabilities measured at fair value Derivative instruments used for hedging purposes Total liabilities *Trading with cross-currency swaps and currency forward contracts in ruble is deemed to occur in an active market and will therefore remain in Level 2. On December 31, 2014, NCC had cross-currency swaps and currency forward contracts in ruble with a negative nominal value of SEK 829 M. On December 31, 2014, the fair value of the cross-currency swaps and the currency forward contracts was a positive SEK 334 M (pos: 24). OFFSETTING FINANCIAL INSTRUMENTS NCC has binding netting arrangements (ISDA agreements) with all counter parties for derivative trading, whereby NCC can offset receivables and liabili ties should a counterparty become insolvent or in another event. The following table sets out the gross financial assets and liabilities recognized and the amounts available for offsetting. 2013 2014 GROUP Recognized gross amount1) Amount included in an offset agreement Net amount after offset agreement 1) Financial assets Financial liabilities Financial assets Financial liabilities 444 259 107 95 –179 –179 –61 –61 265 80 46 34 T he recognized gross amount of financial assets includes SEK 223 M for derivatives measured at fair value through profit or loss in long-term receivables, SEK 194 M in other receivables and SEK 27 M in derivatives used in hedge accounting for other receivables. The recognized gross amount of financial liabilities includes SEK 12 M for derivatives measured at fair value through profit or loss for other long-term liabilities, SEK 106 M for other current liabilities, SEK 86 M for derivatives used in hedge accounting for other long-term liabilities and SEK 55 M in other current liabilities. The Parent Company’s derivatives pertain to holding in the Group’s internal bank, NCC Treasury AB, that is offsettable. 2013 2014 PARENT COMPANY Recognized gross amount Amounts possible for offsetting Net amount Financial assets Financial liabilities Financial assets Financial liabilities 4 31 3 10 –4 –4 –3 –3 0 27 0 7 NOTE 40 INFORMATION ABOUT THE PARENT COMPANY NCC AB, Corporation Registration Number 556034-5174, is a limited liability com pany registered in Sweden, with its Head Office in Solna. NCC AB’s shares are listed on the Stockholm Exchange (Nasdaq Exchange Stockholm/Large Cap List). The address to the Head Office is NCC AB, Vallgatan 3, SE-170 80 Solna, Sweden. The consolidated financial statements for 2014 relate to the Parent Company and its subsidiaries, jointly designated the Group. The Group also includes shareholdings in associated companies and joint ventures. NCC AB is consolidated as a subsidiary in Nordstjernan AB’s consolidated finan cial statements. Nordstjernan AB accounts for 21.4 percent of the share capital and 65.2 percent of the voting rights in NCC AB. Nordstjernan AB, Corporate Registra tion Number 556000-1421, has its registered Head Office in Stockholm. NOTE 41 E VENTS AFTER BALANCE SHEET DATE On January 23, 2015, it was announced that NCC will start its own staffing company to manage work peaks. With its own company, NCC will gain full insight and control over agreements and be able to ensure compliance with rules, guidelines and NCC’s Code of Conduct. The staffing company will be headquartered in Poland. The new company, NCC Montage, will commence operations in August 2015. The company will successively replace the capacity that NCC currently insources from external staffing companies. This corresponds to between 5–10 percent of the total number of blue-collar workers at NCC. The operations will be established in Poland and used when needs arise in projects under way in the Nordic countries where NCC is active. The operations that were previously performed by NCC Construction Finland and NCC Housing in St. Petersburg will be merged into a single unit. The new unit will be part of NCC Housing. The organizational changes apply from January 27, 2015. Financial reporting is being changed from January 1, 2015. In 2014, the construction operations in St. Petersburg accounted for six percent of NCC Construction Finland’s sales. In conjunction with the Board meeting in January 2015, NCC’s Board of Direc tors decided on an exception from NCC’s policy for hedging exchange-rate risks. The policy entails that the financing of assets occurs in local currency. The approved exception from the policy entails that the CEO, within an established limit, is able to decide not to ruble-hedge assets in Russia. See also Note 39, Finan cial instruments and financial risk management. 104 NCC 2014 FINANCIAL REPORT Appropriations of profits The Board of Directors proposes that the available funds 6,890,226,184 be appropriated as follows: Ordinary dividend to shareholders of SEK 12.00 per share 1,294,119,864 To be carried forward 5,596,106,320 Total, SEK 6,890,226,184 The total amount of the proposed dividend is calculated based on the number of outstanding shares on February 27, 2015. The Board of Directors and the CEO hereby give their assurance that the Annual Report and the consolidated financial statements have been compiled in compliance with the European Parliament’s and Council of Europe’s Regulation (EC) No. 1606/2002 dated July 19, 2002 regarding the application of international accounting standards and with generally acceptable accounting practices and thus provide a fair and accurate impression of the financial position and earnings of the Group and the Parent Company. The Reports of the Board of Directors for both the Group and the Parent Company accurately review the Group’s and the Parent Company’s operations, financial positions and earnings and describe the significant risks and uncer tainties facing the Parent Company and the companies included in the Group. The Annual Report and the consolidated financial statements were approved for issue by the Board of Directors on February 27, 2015. The consolidated income statement and balance sheet and the Parent Company’s income statement and balance sheet will be presented to the Annual General Meeting on March 24, 2015 for adoption. Solna, February 27, 2015 Tomas Billing Chairman of the Board Viveca Ax: son Johnson Board member Carina Edblad Board member Olof Johansson Board member Sven-Olof Johansson Board member Ulla Litzén Board member Christoph Vitzthum Board member Karl-Johan Andersson Board member Employee representative Lars Bergqvist Board member Employee representative Karl G Sivertsson Board member Employee representative Peter Wågström President and CEO Our audit report was submitted on February 27, 2015 PricewaterhouseCoopers AB Håkan Malmström Authorized Public Accountant NCC 2014 105 FINANCIAL REPORT Auditors’ Report To the Annual General Meeting of NCC AB (publ), Corp. Reg. No. 556034-5174 REPORT ON THE ANNUAL ACCOUNTS AND CONSOLIDATED ACCOUNTS We have audited the annual accounts and consolidated accounts of NCC AB (publ) for the year 2014. The company’s annual accounts and consolidated accounts are included in the printed version of this document on pages 52–104. Responsibilities of the Board of Directors and the CEO for the annual accounts and consolidated accounts The Board and the CEO are responsible for the preparation and fair presentation of these annual accounts and consolidated accounts in accordance with International Financial Reporting Standards , as adopted by the EU, and the Annual Accounts Act, and for such inter nal control as the Board of Directors and the CEO determine is nec essary to enable the preparation of annual accounts and consolidated accounts that are free from material misstatement, whether due to fraud or error. Auditor’s responsibility consolidated accounts have been prepared in accordance with the Annual Accounts Act and present fairly, in all material respects, the financial position of the Group as of December 31, 2014 and of their financial performance and cash flows in accordance with Interna tional Financial Reporting Standards, as adopted by the EU, and the Annual Accounts Act. The Report of the Board of Directors is consist ent with the other parts of the annual accounts and consolidated accounts. We therefore recommend that the annual meeting of shareholders adopt the income statement and balance sheet for the Parent Com pany and the Group. REPORT ON OTHER LEGAL AND REGULATORY REQUIREMENTS In addition to our audit of the annual accounts and consolidated accounts, we have examined the proposed appropriations of the com pany’s profit or loss and the administration of the Board of Directors and the CEO of NCC AB for the year 2014. Our responsibility is to express an opinion on these annual accounts and consolidated accounts based on our audit. We conducted our audit in accordance with International Standards on Auditing and generally accepted auditing standards in Sweden. Those standards require that we comply with ethical requirements and plan and per form the audit to obtain reasonable assurance about whether the annual accounts and consolidated accounts are free from material misstatement. An audit involves performing procedures to obtain audit evidence about the amounts and disclosures in the annual accounts and consol idated accounts. The procedures selected depend on the auditor’s judgement, including the assessment of the risks of material mis statement of the annual accounts and consolidated accounts, whether due to fraud or error. In making those risk assessments, the auditor considers internal control relevant to the company’s preparation and fair presentation of the annual accounts and consolidated accounts in order to design audit procedures that are appropriate in the circum stances, but not for the purpose of expressing an opinion on the effec tiveness of the company’s internal control. An audit also includes evaluating the appropriateness of accounting policies used and the reasonableness of accounting estimates made by the Board of Direc tors and the CEO, as well as evaluating the overall presentation of the annual accounts and consolidated accounts. We believe that the audit evidence we have obtained is sufficient and appropriate to provide a basis for our audit opinion. Responsibilities of the Board of Directors and the CEO Opinions Opinions In our opinion, the annual accounts have been prepared in accord ance with the Annual Accounts Act and present fairly, in all material respects, the financial position of the parent company as of December 31, 2014 and of its financial performance and its cash flows for the year then ended in accordance with the Annual Accounts Act. The The Board of Directors is responsible for the proposal for appropria tions of the company’s profit or loss, and the Board and the CEO are responsible for administration under the Companies Act. Auditor’s responsibility Our responsibility is to express an opinion with reasonable assurance on the proposed appropriations of the company’s profit or loss and on the administration based on our audit. We conducted the audit in accordance with generally accepted auditing standards in Sweden. As a basis for our opinion on the Board of Directors’ proposed appropriations of the company’s profit or loss, we examined the Board of Directors’ reasoned statement and a selection of supporting evidence in order to be able to assess whether the proposal is in accordance with the Companies Act. As a basis for our opinion concerning discharge from liability, in addition to our audit of the annual accounts and consolidated accounts, we examined significant decisions, actions taken and cir cumstances of the company in order to determine whether any mem ber of the Board of Directors or the CEO is liable to the company. We also examined whether any member of the Board of Directors or the CEO has, in any other way, acted in contravention of the Companies Act, the Annual Accounts Act or the Articles of Association. We believe that the audit evidence we have obtained is sufficient and appropriate to provide a basis for our audit opinion. We recommend to the annual meeting of shareholders that the profit be appropriated in accordance with the proposal in the statutory administration report and that the members of the Board of Directors and the CEO be discharged from liability for the financial year. Stockholm, February 27, 2015 PricewaterhouseCoopers AB Håkan Malmström Authorized Public Accountant 106 NCC 2014 FINANCIAL REPORT Multi-year review INCOME STATEMENT, SEK M Net sales Production costs Gross profit 2005 2006 49,506 55,876 2007 2009 IFRIC 15 2009 57,465 51,817 56,005 2010 2011 2012 49,420 52,535 57,227 –45,158 –50,729 –52,572 –52,005 –46,544 –50,263 –44,487 4,347 5,147 5,825 5,460 5,273 5,742 4,933 –47,721 4,814 –51,724 5,503 Selling and administrative expenses –2,677 Result from property management 17 Result from sales of managed properties 92 Result from sales of owner- occupied properties 19 Impairment losses on fixed assets –94 Result from sales of Group companies –5 Competition-infringement fee Result from participations in associated companies 49 Operating profit 1,748 –2,795 –5 58,397 2008 IAS 19 2012 57,227 2013 2014 57,823 56,867 –51,731 –52,027 5,495 5,796 –51,176 5,691 –3,059 –3,197 –3,035 –3,035 –2,682 –2,774 –2,978 –2,988 –3,130 –3,117 22 –22 7 19 –245 415 –175 15 –76 8 10 –7 5 –95 10 –7 5 –95 2 –2 7 –38 3 3 –2 6 3 –2 6 6 7 20 29 2,392 11 2,790 9 2,219 –1 2,150 –1 2,619 4 2,254 5 2,017 5 2,537 5 2,519 1 2,679 8 2,604 9 3 Financial income Financial expense Net financial items Profit after financial items 116 –284 –168 1,580 116 –245 –129 2,263 131 –313 –182 2,608 615 –449 166 2,385 70 –526 –456 1,694 78 –592 –514 2,105 99 –345 –246 2,008 76 –284 –208 1,808 74 –348 –274 2,263 74 –315 –241 2,277 75 –354 –279 2,400 46 –416 –370 2,234 Tax on profit for the period Profit for the period –393 1,187 –555 1,708 –357 2,252 –565 1,820 –432 1,262 –449 1,656 –481 1,527 –496 1,312 –364 1,899 –367 1,910 –411 1,989 –396 1,838 Attributable to: NCC’s shareholders Non-controlling interests Profit for the period 1,178 9 1,187 1,706 1 1,708 2,247 4 2,252 1,809 11 1,820 1,261 1 1,262 1,654 1 1,656 1,524 4 1,527 1,310 2 1,312 1,894 5 1,899 1,905 5 1,910 1,986 3 1,989 1,835 3 1,838 2005: Earnings increased, primarily as a result of a strong housing market in the Nordic region and also because of improved profitability in the Nordic contracting operations. Impairment losses of approximately SEK 220 M were incurred for such assets as goodwill, property projects and associated companies. 2006: A boom in the Nordic region gave rise to high activity, resulting in rising sales and earnings. Sales of housing, above all else, contributed to the healthy earnings, as did contracting operations, which showed increased profitability. Costs of SEK 186 M for the NCC Complete development project were charged against earnings. 2007: The economic boom in combination with strong earnings from property development operations contributed to the highest earnings in NCC’s history and all of the financial objectives were achieved. Costs of SEK 645 M for the NCC Complete development project were charged against earnings, as was a competition-infringement fee of SEK 175 M. Operating profit included SEK 383 M from the sale of the Polish asphalt and stone material operations. 2008: NCC reported historically high earnings and all of the financial objec tives were achieved. This was also the year that the housing market came to an abrupt halt and a recession started, which was compounded by a global finan cial crisis. Impairment losses and restructuring costs totalling SEK 741 M were charged against earnings. The divestment of NCC’s share in the Polish conces sion company AWSA contributed SEK 493 M to earnings. 2009: The year was characterized by recession and reduced demand in the Nordic construction market. While volumes declined, margins remained healthy. Although sales of housing units were favorable, they were impacted by price discounts. Earnings were charged with SEK 192 M for impairment losses on land and unsold housing units. 2010: The economic recovery had a favorable impact on the year’s earnings. The lower volume was due mainly to fewer completed and handed over projects in NCC Housing and NCC Property Development, a reduction in orders received by the Construction units in 2009 and a cold winter, which resulted in delays and lower activity. 2011: The market trend was positive in 2011 and demand was favorable in the building, civil engineering and housing operations. Favorable earnings were reported, primarily as a result of more completed and handed over projects in NCC Housing and high volumes in NCC Roads thanks to a long season. SEK 172 M was charged against profit for impairment losses on goodwill in Finland and land in Denmark and Latvia. 2012: Operating profit was high, where development business accounted for 45 percent due to more completed and handed over projects. Construction and civil-engineering operations reported higher sales and earnings than in the preceding year. 2013: The construction market strengthened slightly during the second half of 2013 and operating profit for the year improved thanks to more completed and handed over projects in NCC Property Development. The Norwegian operation reported weaker earnings due to impairment losses on projects. 2014: Operating profit for the year was strong. Continued favorable housing sales in NCC Housing, higher earnings in all Construction units and NCC Roads were offset by fewer projects recognized in profit in NCC Property Devel opment. However, activity was lower in the commercial property development operations, particularly compared with 2013, which was somewhat of a record year with several major completed projects. REVISED ACCOUNTING POLICIES – IFRIC 15. COMPARATIVE FIGURES FOR 2009 HAVE BEEN RECALCULATED. AMENDED ACCOUNTING POLICY – IAS 19 COMPARATIVE FIGURES FOR 2012 HAVE BEEN RECALCULATED. In the Annual Report, comparative figures for 2009 have been recalculated due to the application of IFRIC 15, Agreements for the Construction of Real Estate, as of January 1, 2010. This applies for all tables and figures pertaining to 2009, unless otherwise stated. In brief, the change entails that revenues and earnings from the sale of property and housing projects are normally not to be recognized until the property or the home has been sold, completed and handed over to the customer. This usually results in recognition of a sale being delayed compared with the past. Application of IFRIC 15 also affects assets and liabilities. Among other consequences, tenant owner associations and Finnish housing companies, are recognized, in contrast to the past, in NCC’s balance sheet. This primarily increases interestbearing liabilities but also has an impact on NCC’s other key figures. Changes have occurred in the reporting of employee benefits, for which the revised IAS 19 has been applied since January 1, 2013. Comparative figures for 2012 have been recalculated. In brief, the amendment of IAS 19 entailed that the opportunity to utilize the corridor method has been discontinued, wherby actuarial gains and losses arising must be recognized directly in Other comprehensive income in the period they arise. Furthermore, the return on plan assets must be calculated using the same rate as the discount rate for the pension commitment. The interest-rate component in the pension commitment and the anticipated return on plan assets are now recognized in net financial items. NCC 2014 107 FINANCIAL REPORT BALANCE SHEET, SEK M IFRIC 15 2008 2011 2012 1,750 120 1,613 115 1,607 167 1,827 204 647 1,910 647 1,910 576 1,816 596 2,209 10 9 9 7 227 1,338 6,139 227 1,366 6,166 203 1,378 6,016 203 1,397 6,035 2,145 8,553 474 8,323 3,439 11,377 624 7,820 4,018 15,060 624 7,794 2,835 8,363 514 6,355 2,840 2,956 1,854 841 638 1,361 153 1,919 20,848 852 1,532 173 1,253 22,961 1,048 1,979 483 1,685 27,645 1,169 1,778 215 1,832 30,108 TOTAL ASSETS 27,110 30,603 34,069 SHAREHOLDERS’ EQUITY Shareholders’ equity Non-controlling interests Total shareholders’ equity 6,785 94 6,879 6,796 75 6,870 2,004 392 199 Current assets Property projects Housing projects Materials and inventories Accounts receivable Worked-up, non-invoiced revenues Prepaid expenses and accrued income Other receivables Short-term investments Cash and cash equivalents Total current assets LIABILITIES Long-term liabilities Long-term interest-bearing liabilities Other long-term liabilities Deferred tax liabilities Provisions for pensions and similar obligations Other provisions Total long-term liabilities Current liabilities Current interest-bearing liabilities Accounts payable Tax liabilities Invoiced revenues, not worked up Accrued expenses and deferred income Other current liabilities Total current liabilities Total liabilities TOTAL SHAREHOLDERS’ EQUITY AND LIABILITIES 2006 2007 2008 1,772 61 71 865 1,937 1,700 113 65 796 1,940 1,651 96 21 640 1,774 1,772 122 12 682 1,975 1,772 122 12 682 1,975 1,750 120 44 47 25 10 265 1,246 6,263 242 2,739 7,642 250 1,968 6,424 2,005 4,395 502 7,137 1,955 5,979 443 7,934 2,737 IAS 19 2012 2013 2014 1,827 204 1,802 267 1,865 389 662 2,395 662 2,395 704 2,502 774 2,487 8 9 9 9 52 182 1,431 5,739 173 1,750 6,511 158 1,859 7,114 158 615 5,870 131 496 5,910 156 671 6,395 2,835 10,137 514 6,340 2,931 8,745 537 6,481 4,475 9,860 557 7,265 5,321 11,738 655 7,725 5,321 11,738 655 7,725 5,251 12,625 673 7,377 5,059 13,246 746 7,178 1,459 777 804 910 782 782 918 1,066 1,119 1,602 215 1,919 33,193 844 1,472 286 1,831 23,959 982 1,747 286 2,317 25,935 988 1,425 741 2,713 25,366 1,114 1,151 285 796 26,414 1,544 1,277 168 2,634 31,844 1,544 1,277 168 2,634 31,844 1,325 1,024 143 3,548 32,883 1,415 1,048 242 2,592 32,592 36,247 39,359 29,976 31,970 31,104 32,924 38,958 37,713 38,793 38,987 7,207 30 7,237 6,840 25 6,865 6,243 25 6,268 7,667 18 7,685 7,470 18 7,488 8,111 21 8,132 8,286 11 8,297 8,974 15 8,988 7,634 15 7,649 8,658 17 8,675 8,847 20 8,867 2,023 561 461 1,590 816 431 2,620 837 492 2,721 837 436 2,941 558 710 2,972 558 641 2,712 921 439 3,850 643 669 7,102 841 725 7,102 841 436 7,029 299 414 6,957 548 268 143 1,611 4,348 119 2,157 5,321 112 2,729 5,678 42 3,190 7,180 42 3,029 7,065 18 3,023 7,250 18 2,932 7,121 1 2,722 6,796 6 2,619 7,788 9 2,435 11,113 393 2,435 11,208 125 2,070 9,937 585 2,017 10,376 1,052 4,520 137 552 4,874 170 1,701 4,974 101 2,929 4,356 140 7,036 4,356 140 391 3,545 38 1,739 3,536 38 1,546 3,414 449 1,585 4,131 60 2,141 4,659 122 2,141 4,659 122 2,515 4,096 58 2,526 3,960 117 4,367 4,823 4,971 5,300 4,784 4,516 4,250 4,092 4,176 4,241 4,241 4,264 4,408 3,271 2,535 15,883 20,231 4,592 3,400 18,411 23,732 5,177 4,371 4,231 5,106 21,154 22,202 26,832 29,382 4,234 5,474 26,026 33,090 3,598 3,682 2,954 4,117 15,041 17,361 22,291 24,482 3,336 3,341 16,177 22,973 3,277 3,611 16,839 24,627 3,748 3,945 18,855 29,968 3,748 3,945 18,856 30,063 3,888 5,360 20,181 30,118 3,952 4,782 19,745 30,120 27,110 30,603 34,069 39,359 29,976 31,104 32,924 38,958 37,713 38,793 38,987 36,247 2005: NCC Property Development divested managed properties and received payment for properties sold in the preceding years, which led to a reduction in total assets. All financial objectives were achieved and net indebtedness was reduced to SEK 0.5 billion. 2006: Sales of property projects within NCC Property Development resulted in the increase in long-term receivables from sales of property projects. Invest ments in land for housing projects increased. All financial objectives were achieved and net indebtedness was reduced to SEK 0.4 billion. 2007: Capital tied-up in property projects increased at NCC Property Develop ment, and in housing projects within NCC’s Construction units in Sweden, Den mark and Finland. 2008: Continued increase in tied-up capital, primarily in housing operations. 2009: Total assets declined as a result of an intensified focus on cash flow and tied-up capital, resulting in higher sales of property and housing projects. 2010: Increased investments in properties held for future development were offset by higher sales of housing units, which resulted in a decrease in housing projects. NCC’s positive cash flow resulted in an increase in cash and cash 2009 IFRIC 15 2009 2010 ASSETS Fixed assets Goodwill Other intangible assets Managed properties Owner-occupied properties Machinery and equipment Participations in associated companies Other long-term holdings of securities Long-term receivables Total fixed assets 2005 31,970 equivalents and short-term investments. Interest-bearing liabilities were a mortized. 2011: Continued investments in housing projects at NCC Housing and in prop erty projects at NCC Property Development resulted in an increased need for financing, which is the main reason for the rise in net indebtedness by SEK 3.5 billion. 2012: Total assets increased mainly due to continued investment in housing and property projects in the development operation. Cash and cash equivalents also increased due to higher payment preparedness. 2013: Continued investments in housing projects in NCC Housing generated an increase in total assets. Cash and cash equivalents were at a high level thanks to healthy cash flow in the fourth quarter. 2014: Total assets were slightly higher than in 2013. Tied-up capital continued to increase in housing operations through investments in housing projects within NCC Housing. The financial targets were achieved, the return on equity was 22 percent and the debt/equity ratio was 0.8. 108 NCC 2014 FINANCIAL REPORT Multi-year review, cont. KEY DATA Financial statements, SEK M Net sales Operating profit Profit after financial items Profit for the year Investments in fixed assets Investments in property projects Investments in housing projects1) Cash flow, SEK M Cash flow from operating activities Cash flow from investing activities Cash flow before financing Cash flow from financing activities Change in cash and cash equivalents Profitability ratios Return on shareholders’ equity, % Return on capital employed, % Financial ratios at year-end, SEK M Interest-coverage ratio, times Equity/assets ratio, % Interest-bearing liabilities/total assets, % Net indebtedness Debt/equity ratio, times Capital employed at year-end Capital employed, average Capital turnover rate, times Share of risk-bearing capital, % Closing interest rate, %2) Average period of fixed interest, years2) Closing interest rate, %3) Average period of fixed interest, years3) Order status, SEK M Orders received Order backlog Per share data, SEK Profit after taxes, before dilution Profit after taxes, after dilution Cash flow from operating activities, after dilution Cash flow before financing, after dilution P/E ratio, before dilution Dividend, ordinary Extraordinary dividend Dividend yield, % Dividend yield excl. extraordinary dividend, % Shareholders’ equity before dilution Shareholders’ equity after dilution Share price/shareholders’ equity, % Share price at year-end, NCC B IAS 19 2012 2013 2014 57,227 2,537 2,263 1,899 1,345 2,692 8,997 57,227 2,519 2,277 1,910 1,345 2,692 8,997 57,823 2,679 2,400 1,989 1,055 3,890 7,912 56,867 2,604 2,234 1,838 987 2,255 9,712 1,547 –857 2,404 491 1,916 –26 –906 –932 2,774 1,838 –26 –906 –932 2,774 1,838 2,532 –870 1,661 –741 914 1,345 –771 574 1,515 –956 20 19 17 16 23 15 28 17 26 15 22 14 5.0 23 15 1,784 0.2 12,217 15,389 3.6 25 4.5 1.8 6.9 26 14 431 0.1 12,390 12,033 4.1 28 4.6 1.5 2.3 0.1 7.4 25 17 3,960 0.5 13,739 13,101 4.0 27 4.2 0.8 2.7 0.1 7.0 23 24 6,061 0.7 18,241 16,632 3.4 25 3.6 1.1 2.4 0.1 7.5 20 26 6,467 0.8 17,285 15,755 3.6 21 3.6 1.1 2.4 0.1 7.8 22 25 5,656 0.7 18,345 18,005 3.2 23 3.3 1.2 2.7 0.1 6.4 23 26 6,836 0.8 18,935 18,531 3.1 23 2.8 1.1 1.8 0.1 45,957 34,084 46,475 35,951 54,942 40,426 57,867 46,314 55,759 45,833 55,759 45,833 56,979 47,638 61,379 54,777 16.69 16.69 11.63 11.63 15.26 15.26 14.05 14.05 12.08 12.08 17.51 17.51 17.62 17.62 18.40 18.40 17.01 17.01 9.51 10.75 7 11.00 10.00 15.1 1.18 –1.64 3 4.00 30.60 26.17 10 6.00 59.39 54.96 8 6.00 22.35 17.84 11 10.00 –14.27 –22.17 10 10.00 –0.24 –8.61 8 10.00 –0.24 –8.61 8 10.00 23.46 15.40 11 12.00 12.47 5.32 15 12.004) 8.1 5.1 5.1 6.8 8.3 7.3 7.3 5.7 4.9 4.3 62.86 62.69 298 187.50 7.9 66.48 66.48 209 139.00 8.1 63.10 63.10 78 49.50 5.1 70.72 70.70 167 118.25 5.1 68.91 68.90 172 118.25 6.8 74.81 74.80 198 147.80 8.3 76.41 76.41 158 121.00 7.3 82.97 82.97 164 136.20 7.3 70.58 70.58 193 136.20 5.7 80.24 80.24 262 209.90 4.9 82.04 82.04 301 246.80 108.4 1.2 108.4 0.3 108.4 108.4 108.4 108.4 108.4 108.4 108.4 0.4 108.4 0.4 108.4 0.6 108.4 0.6 107.2 108.1 108.4 108.4 108.4 108.4 108.4 108.4 108.0 108.0 107.8 107.8 2005 2006 2007 2008 2009 49,506 1,748 1,580 1,187 901 626 2,140 55,876 2,392 2,263 1,708 798 1,049 3,908 58,397 2,790 2,608 2,252 780 1,493 5,392 57,465 2,219 2,385 1,820 983 2,210 5,010 51,817 2,150 1,694 1,262 584 1,054 1,262 2,046 69 2,115 2,745 –596 2,171 –514 1,657 2,307 –666 1,031 134 1,165 –763 432 128 –306 –178 298 147 18 17 27 24 34 28 6.9 25 12 496 0.1 10,032 10,930 4.5 26 4.8 1.1 11.5 22 9 430 0.1 9,565 10,198 5.5 24 4.8 2.6 52,413 32,607 IFRIC 15 2009 2010 2011 2012 56,005 2,619 2,105 1,656 584 1,215 3,193 49,420 2,254 2,008 1,527 667 1,533 3,171 52,535 2,017 1,808 1,312 1,257 2,333 7,529 3,318 –481 2,837 2,827 –1 6,440 –481 5,960 5,549 399 2,423 –489 1,935 1,504 396 27 23 18 17 25 17 10.2 21 10 744 0.1 10,639 10,521 5.6 23 5.2 1.8 7.0 19 15 3,207 0.5 12,456 11,990 4.8 20 5.9 1.6 4.5 26 11 754 0.1 11,034 12,659 4.1 28 4.5 1.8 57,213 36,292 63,344 44,740 51,864 40,426 11.07 10.86 15.80 15.74 20.75 20.73 18.88 19.52 13 5.50 10.00 10.9 20.03 15.29 12 8.00 10.00 9.6 3.9 63.30 62.60 225 142.50 Number of shares, millions Total number of issued shares5) Treasury shares at year-end Total number of shares outstanding before dilution at year-end Average number of shares outstanding before dilution for the period Market capitalization before dilution, SEK M 106.4 108.0 108.3 108.4 108.4 108.4 108.4 108.4 108.2 108.2 107.9 107.8 15,282 20,242 14,999 5,209 12,809 12,809 16,005 13,136 14,706 14,706 22,625 26,574 Personnel Average number of employees 21,001 21,784 21,047 19,942 17,745 17,745 16,731 17,459 18,175 18,175 18,360 17,669 1) A s of 2007, investments are included in the unsold share of ongoing proprietary housing projects. As of 2008, costs incurred are included prior to project start. Figures for 2005 to 2008 are not IFRIC 15 adjusted. 2) E xcluding liabilities attributable to Swedish tenant-owner associations and Finnish housing companies and pension obligations in accordance with IAS 19. For definitions of key figures, see page 121. 3) Pertains to liabilities of Swedish tenant-owner associations and Finnish housing companies. 4) Dividend for 2014 pertains to the Board of Directors’ motion to the AGM. 5) All shares issued by NCC are common shares. Figures for 2005 to 2011 are not IAS 19 adjusted, Employee benefits. NCC 2014 109 FINANCIAL REPORT Quarterly data FULL YEAR QUARTERLY AMOUNTS, 2014 SEK M Q1 Q2 Q3 Q4 FULL YEAR QUARTERLY AMOUNTS, 2013 2014 Q1 Q2 Q3 Q4 2013 Group Orders received 13,223 17,303 12,383 18,469 61,379 12,348 18,108 12,160 14,363 56,979 Order backlog 50,798 56,657 54,609 54,777 54,777 46,917 52,079 51,065 47,638 47,638 9,832 13,479 14,796 18,760 56,867 10,084 13,535 13,129 21,073 57,823 Operating profit/loss –162 677 989 1,101 2,604 –217 526 823 1,547 2,679 Operating margin, % –1.7 5.0 6.7 5.9 4.6 –2.2 3.9 6.3 7.3 4.6 –239 576 881 1,017 2,234 –276 457 748 1,472 2,400 1,986 Net sales Profit/loss after financial items Profit/loss for the period attributable to NCC’s Shareholders: –185 447 695 877 1,835 –215 362 611 1,229 Cash flow before financing –960 1,267 –627 3,428 574 –950 1,402 –227 4,240 1,661 –6,572 –8,760 –9,823 –6,836 –6,836 –7,250 –9,722 –9,893 –5,656 –5,656 Earnings per share after dilution, SEK –1.71 4.14 6.45 8.13 17.01 –1.99 3.35 5.67 11.39 18.40 Average number of shares outstanding after dilution during the period, million 107.8 107.8 107.8 107.8 107.8 108.0 107.9 107.8 107.8 107.9 20,348 Net indebtedness NCC Construction Sweden Orders received 4,935 7,758 5,233 6,974 24,899 3,535 6,893 4,715 5,205 Order backlog 16,947 19,562 19,941 20,321 20,321 16,271 17,570 17,334 16,211 16,211 4,195 5,145 4,854 6,594 20,788 4,659 5,592 4,947 6,332 21,530 Operating profit 49 146 182 263 640 57 145 192 243 637 Operating margin, % 1.2 2.8 3.8 4.0 3.1 1.2 2.6 3.9 3.8 3.0 348 384 472 991 991 573 642 767 1,250 1,250 Net sales Capital employed NCC Construction Denmark Orders received Order backlog Net sales Operating profit Operating margin, % Capital employed 820 1,803 1,212 1,752 5,587 2,128 859 571 1,370 4,929 4,401 5,384 5,482 6,056 6,056 4,179 4,443 4,167 4,447 4,447 883 963 1,094 1,390 4,330 759 806 784 1,196 3,546 50 65 67 99 281 39 47 55 67 208 5.7 6.8 6.1 7.1 6.5 5.2 5.8 7.1 5.6 5.9 349 275 327 421 421 310 214 251 309 309 NCC Construction Finland Orders received 1,180 2,229 831 1,558 5,799 1,090 2,717 739 1,945 6,491 Order backlog 5,454 6,082 5,166 4,927 4,927 5,164 6,404 5,353 5,630 5,630 Net sales 1,350 1,790 1,664 1,817 6,621 1,423 1,752 1,698 1,808 6,680 Operating profit 27 41 39 41 148 19 25 38 45 127 Operating margin, % 2.0 2.3 2.3 2.2 2.2 1.3 1.4 2.2 2.5 1.9 295 249 281 287 287 265 234 260 271 271 Capital employed NCC Construction Norway Orders received 1,770 1,038 1,055 3,790 7,653 1,758 2,013 1,701 1,626 7,098 Order backlog 6,792 6,287 5,865 7,258 7,258 6,993 7,235 6,968 6,364 6,364 Net sales 7,408 1,498 1,587 1,659 1,989 6,733 1,703 1,780 1,671 2,253 Operating profit/loss 4 24 75 44 146 13 –115 28 77 3 Operating margin, % 0.3 1.5 4.6 2.2 2.2 0.8 –6.4 1.7 3.4 0.0 996 915 1,104 1,013 1,013 930 957 808 803 803 12,311 Capital employed NCC Roads Orders received 3,045 3,082 2,291 2,108 10,526 2,645 3,865 2,801 3,001 Order backlog 6,715 7,894 6,155 4,608 4,608 5,067 5,507 5,003 4,598 4,598 Net sales 1,217 3,271 4,044 3,620 12,153 1,156 3,185 4,242 3,416 11,999 Operating profit/loss –389 255 407 186 459 –468 230 538 106 406 Operating margin, % –32.0 7.8 10.1 5.1 3.8 –40.5 7.1 12.6 3.1 3.4 Capital employed 3,337 4,313 4,510 3,619 3,619 2,801 3,777 3,806 3,557 3,557 NCC Housing Orders received 2,568 3,030 3,041 3,842 12,480 1,794 3,252 2,628 3,247 10,921 Order backlog 15,172 16,572 17,292 16,575 16,575 12,264 14,357 15,440 14,200 14,200 1,342 2,032 2,236 4,524 10,135 1,329 1,524 1,506 4,670 9,030 Operating profit Net sales 46 156 237 480 918 61 45 15 483 605 Operating margin, % 3.4 7.7 10.6 10.6 9.1 4.6 3.0 1.0 10.3 6.7 10,885 11,181 11,360 10,508 10,508 10,215 10,619 10,537 9,856 9,856 738 579 645 1,164 3,125 609 656 102 3,443 4,811 49 40 36 43 169 78 152 8 475 713 3,653 4,118 4,518 4,784 4,784 5,097 5,552 6,085 3,991 3,991 Capital employed NCC Property Development Net sales Operating profit Capital employed The asphalt and civil-engineering operations of NCC Roads and certain activities within NCC’s Construction units are affected by seasonal variations in their production caused by cold weather conditions. The first quarter is normally weaker than the rest of the year. 110 NCC 2014 CORPORATE GOVERNANCE REPORT Corporate governance report NCC AB is a Swedish public limited liability company whose shares are registered for trading on Nasdaq Stockholm. NCC AB is gov erned in accordance with Swedish company law and the regulations of Nasdaq Stockholm, which include the Swedish Code of Corporate Governance (for further information concerning the Code, refer to www.corporategovernanceboard.se). NCC has applied the Code since it was introduced in 2005. This report has been issued by the Board of Directors but is not part of the formal Annual Report documentation. This is how NCC is governed GENERAL SHAREHOLDER MEETINGS SHARE STRUCTURE AND VOTING RIGHTS The procedures for notifying shareholders of General Meetings are stipulated in the Articles of Association. Official notice of meetings shall be made in the form of an announcement in Post- och Inrikes Tidningar and on the company’s website www.ncc.se. Confirmation that the Official notice has been issued will be announced in Dagens Nyheter and Svenska Dagbladet. According to the Swedish Companies Act, notice of the Annual General Meeting (AGM) shall be issued not earlier than six weeks and not later than four weeks prior to the Meeting. Notice of Extraordinary General Meetings (EGMs) convened to address amendments to the Articles of Association shall be issued not earlier than six weeks and not later than four weeks prior to the Meeting. Notice of other EGMs shall be issued not earlier than six weeks and not later than two weeks prior to the Meeting. General Meetings may be held in the municipalities of Stockholm, Solna or Sigtuna. At General Meetings, shareholders may be accompanied by not more than two advisors, on condition that the shareholder has given the company prior notice of this. NCC shares are issued in two series, designated Series A and Series B shares. Each Series A share carries ten votes and each Series B share carries one vote. All shares provide the same entitlement to participation in the company’s assets and profit and to an equally large dividend. For a breakdown of the number of shares and voting rights, as well as the shareholder structure, see p. 18–19. On request, Series A shares may be converted into Series B shares. A written conversion request must be submitted to the company’s Board, which makes continuous decisions on conversion matters. After a conversion decision is made, this is reported to Euroclear Sweden AB for registration. Conversions become effective when the shares are registered. NCC’S CONTROL STRUCTURE 2014 GENERAL SHAREHOLDER MEETINGS (43,524 SHAREHOLDERS) COMPOSITION OF THE BOARD The Board shall consist of not fewer than five and not more than ten members elected by the AGM. The employees are represented on the Board. The Board Members are elected for a period of one year. During 2014, seven Board Members were elected by the AGM. The Board also included three representatives and two deputies for the employees. For information on individual Members of the Board, see pp. 116–117. BOARD OF DIRECTORS 7 elected members 3 employee representatives CEO Executive Management Group (13 members) STAFF UNITS CHAIRMAN OF THE BOARD The Chairman of the Board is Tomas Billing (for details concerning the Chairman’s age, education, professional experience, assignments outside the company and holdings of shares in the company, refer to p. 117). The Chairman of the Board directs the work conducted by the Board and maintains continuous contact with the CEO, in order to continuously monitor the Group’s operations and development. The Chairman represents the company in ownership matters. The Chairman of the Board is a co-opted member of the Nomination Committee but has no voting right. BUSINESS AREAS NCC Construction Sweden NCC Construction Denmark NCC Roads NCC Construction Finland NCC Housing NCC Construction Norway NCC Property Development EXECUTIVE MANAGEMENT GROUP PRESIDENT AND CHIEF EXECUTIVE OFFICER The President and CEO of the company is Peter Wågström (for details concerning the CEO’s age, education, professional experience, assignments outside the company and holdings of shares in the company, refer to p. 119). The Board has established instructions for the division of duties between the Board and the CEO, and for financial reporting to the Board (also refer to “Board of Directors’ report on internal control,” pp. 114–115). DEPUTY CHIEF EXECUTIVE OFFICERS The company has not appointed any Deputy Chief Executive Officers. In 2014, NCC’s Executive Management Group consisted of the CEO, the Heads of NCC Construction Sweden, NCC Construction Denmark, NCC Construction Finland, NCC Construction Norway, NCC Property Development, NCC Housing and NCC Roads, plus the CFO and the Senior Vice Presidents for Corporate Communications, Human Resources and Corporate Legal Affairs. For information on the members of the Executive Management Group, see pp.118–119. The Executive Management Group mainly focuses on strategic and other Group-wide matters and generally meets once per month. NCC 2014 111 CORPORATE GOVERNANCE REPORT NOMINATION COMMITTEE AUDITORS The AGM elects a Nomination Committee whose task is to nominate candidates to the AGM for election as Chairman of the Meeting, Chairman of the Board and Board members, and to propose the fees to these officers. The Nomination Committee shall also nominate auditors and propose the fees to be paid to them. The Nomination Committee complies with the instructions adopted by the AGM. For the purpose of examining the company’s Annual Report, consolidated financial statements, accounting records and the company’s management by the Board and the CEO, the AGM appoints a maximum of three Authorized Public Accountants, with a maximum of three deputies. A registered firm of accountants may also be appointed auditor of the company. The Nomination Committee nominates auditors. Auditors are currently appointed for a period of one year. Until the close of the AGM in 2015, the registered firm of accountants PricewaterhouseCoopers AB is serving as NCC’s auditors. Authorized Public Accountant Håkan Malmström has been elected PricewaterhouseCoopers AB’s auditor-in-charge. For more information on the elected auditors, see pp. 117. EVALUATION OF THE BOARD AND AUDITORS INTERNAL GOVERNANCE AND CONTROL The Board of Directors is evaluated within the framework of the Nomination Committee’s work. In addition, the Board performs an annual evaluation of its work and the format for performing Board work, which also constitutes part of the Nomination Committee’s evaluation. The Board also assists the Nomination Committee in evaluating the work of the auditors. NCC’s operations require a considerable amount of delegated responsibility. Group-wide decision-making procedures are in place to clarify exactly who is entitled to make decisions at each stage of the decision-making process. In addition to strategic and organizational matters, the areas regulated include investments and divestments, rental and leasing agreements, financing, sureties, guarantees, the assessment of tenders and business agreements. On top of the rules of procedure for decision making, a number of other Group-wide control documents govern communication, finance, code of conduct, the environment and work environment. The number of ongoing projects in production varies from year to year but totals several thousands. The organization of each project varies according to the specific project’s size and complexity. Each project is led by a project manager who is responsible for product format, purchases, financial aspects, production, quality, completion and handover to the customer. Major projects are monitored on a monthly basis by the CEO, CFO and the Senior Legal Counsel. Tenders for projects exceeding SEK 300 M are subject to special assessment and must be approved by the CEO. Tenders for projects exceeding SEK 500 M must be confirmed by NCC AB’s Board. Proprietary housing and property projects representing an investment exceeding SEK 50 M must be approved by the CEO and such projects exceeding SEK 150 M must be authorized by NCC AB’s Board. Decisions regarding investments corresponding to less than SEK 50 M are the responsibility of the particular business area. CODE OF CONDUCT NOMINATION COMMITTEE Election and remuneration of the Board of Directors and auditors EXTERNAL AUDIT (Audit firm) INTERNAL CONTROL ENVIRONMENT GOVERNANCE OF BUSINESS AREAS The Group is composed of business areas. In all significant respects, the legal corporate structure matches the operational structure. Each business area is managed by a business area head and has a Board of Directors, of which, among others, NCC AB’s CEO, CFO and Senior Legal Counsel are members. For certain decisions, the approval of the CEO, NCC AB’s Board Chairman or Board of Directors is required. The decision-making procedure consists of proposals, endorsement, decisions and confirmation. A matter requiring a decision is normally processed by the entity that initiated the matter or which is responsible for it in terms of function. Many types of decisions are preceded by consultation. Country managers (the heads of NCC’s Construction units in each country and the heads of NCC’s Housing units in Germany and St. Petersburg) are responsible for initiating coordination in matters involving several NCC units in the particular country. The individual Group-staff heads are responsible for Group-wide functional issues that fall under the position and mandate of the individual head of Group staff. A comprehensive program to formulate and implement the values that are to hallmark NCC’s operations has been under way in recent years. These values have been translated into norms and rules governing how NCC employees are to behave in various situations. These rules are summarized in a Code of Conduct, which describes the requirements that NCC – the Board, management and all employees – have to meet in terms of behavior and conduct and that NCC in turn expects its business partners to respect. Every manager has an obligation, within his or her area of responsibility, to ensure that employees and business partners are informed about the contents of the Code of Conduct and the requirement that they be observed. NCC managers must always set a good example. Adherence to the Code of Conduct is followed up continuously as a natural part of ongoing operations. In 2014, NCC continued to refine its compliance program since a new Group-wide, needs-adapted process was launched in 2013. NCC Compass focuses on providing straightforward and tangible advice to the organization, in order to prevent the risk of irregularities. NCC Compass is available via NCC’s intranet (Starnet) and via a special mobile application. This enables all NCC employees to make use of the content of NCC Compass and seek guidance. NCC has also appointed and provided special training to about 45 employees in all business areas in business ethics and how NCC Compass is to be applied in various situations. These employees are called Navigators since their assignment is to assist employees at NCC to correctly navigate the areas covered by NCC’s Code of Conduct. NCC has also introduced advanced system support for the internal and external reporting of irregularities, all within the framework of the value-driven and transparent corporate culture that NCC is working to retain and refine. Moreover, NCC has undertaken a comprehensive overhaul of the operations and identified risk areas and risk processes. The purpose of NCC’s new procedures is to make it easier for employees to dare to ask questions in difficult situations, rather than letting ignorance or thoughtlessness lead them to take the wrong decisions or behave in an undesired manner. The work methods include guidelines covering such areas as how to handle the most prevalent risk situations. Implementation of the new methods that started in the form of training programs and discussions with NCC employees continued in 2014. All NCC’s employees are included in the training programs and to date, about 7,500 salaried employees and 700 blue-collar workers have completed the training. Employees who suspect unethical behavior or improper action should firstly report this to the immediate superior. A procedure for reporting anonymously is also in place. The function has two purposes: firstly, to protect the reporting party and, secondly, to make sure that the reported matter is dealt with securely. All tips containing sufficient information will result in an investigation and a written report compiled by an independent party. Disciplinary action will be taken where called for. IMPORTANT EXTERNAL RULES AND REGULATIONS • Swedish Companies Act • Listing agreement of Nasdaq Stockholm • Swedish Code of Corporate Governance • Annual Accounts Act • Bookkeeping Act INTERNAL RULES AND REGULATIONS • Articles of Association • Operating procedures for Board work • Division of work between Board/CEO • Decision-making procedures for Group and business areas • NCC’s Code of Conduct • NCC Compass • Policies, regulations, guidelines and instructions 112 NCC 2014 CORPORATE GOVERNANCE REPORT Corporate governance at NCC in 2014 ANNUAL GENERAL MEETING 2014 The 2014 Annual General Meeting (AGM) was held in Stockholm on April 2. 513 shareholders were present representing 56 percent of the share capital and 79 percent of the total number of votes. The minutes of the 2014 AGM and from previous AGMs are available at www.ncc. se/bolagsstyrning. The 2014 AGM passed the following resolutions, among others: Payment of a cash dividend of SEK 12.00 (12.00) per share for the 2013 fiscal year, distributed in two payments of SEK 6.00 each. Tomas Billing, Ulla Litzén, Olof Johansson, Sven-Olof Johansson and Christoph Vitzthum were reelected Members of the Board. Carina Edblad and Viveca Ax:son Johnson were elected new Board members. Reelection of Tomas Billing as Chairman of the Board. It was resolved that director fees be paid in a total amount of SEK 3,800,000, distributed in the amount of SEK 950,000 to the Chairman of the Board and SEK 475,000 to each other AGM-elected member. Viveca Ax:son Johnson (chairman), Marianne Nilsson and Johan Strandberg were elected members of the Nomination Committee. (see “Nomination Committee 2014” on p. 113). Guiding principles were adopted for determining the salary and other remuneration of the CEO and other members of the company’s management. The introduction of a long-term performance-based incentive plan (LTI 2014) for senior executives and key personnel was also resolved (see “Remuneration,” p. 58). To cover the commitment according to LTI 2014, the AGM author ized the Board, until the next Meeting, to buy back a maximum of 867,486 Series B shares and to transfer a maximum of 303,620 Series B shares to participants of LTI 2014. The Board had no reason to uti lize this mandate during 2014. Income statements and balance sheets for 2013 were adopted and dis charge from personal liability was granted to the Board and the CEO. WORK OF THE BOARD OF DIRECTORS In 2014, NCC’s Board held seven scheduled meetings, one non-sched uled meeting and the statutory meeting held directly after the AGM. The Board’s work focuses primarily on strategic issues, the adoption and follow-up of operational goals, business plans, the financial accounts, major investments and divestments, plus other decisions that, in accordance with NCC’s decision-making procedures, have to be addressed by the Board. Reporting on the progress of the compa ny’s operations and financial position was a standing item on the agenda. The Board has established operating procedures for its work and instructions for the division of duties between the Board and the CEO, as well as for financial reporting to the Board. The Board made a number of worksite visits in connection with Board meetings. In addition to the CEO and the CFO, other senior NCC executives par ticipated in Board meetings in order to present matters. NCC’s Sen ior Legal Counsel was secretary of the Board. On several occasions, the Board has evaluated the matter of estab lishing committees to deal with remuneration and audit-related issues. The Board has decided not to establish such committees and instead to address audit-related and remuneration issues within the framework of ordinary Board work (also see “Board of Directors’ report on internal control” on pp. 114–115). BUYBACK OF COMPANY SHARES NCC did not buy back any shares in 2014. NCC AB holds 592,500 Series B treasury shares to meet its obligations pursuant to longterm incentive programs. BOARD OF DIRECTORS 2014 BOARD MEETINGS AND ATTENDANCE 2014 Elected Independent in relation to the company and executive management Independent in relation to major shareholders Fee, SEK 000s Jan. 29 Apr. 2 Apr. 21) Apr. 28 Jun. 24 Jul. 17 Sep. 18 Oct. 23 Dec. 9 Board Members elected by the AGM Tomas Billing 1999 yes no Antonia Ax:son Johnson 3) 1999 yes no 918 113 – Viveca Ax:son Johnson 2) 2014 yes no 355 – – Carina Edblad 2) 2014 yes yes 355 – – Olof Johansson 2012 yes yes 469 Sven-Olof Johansson 2012 yes yes 469 Ulla Litzén 2008 yes yes 469 Christoph Vitzthum 2010 yes yes 469 Regular employee representatives Lars Bergqvist 1991 – Karl G. Sivertsson 2009 – Karl-Johan Andersson 2011 – 1) Statutory Board meeting. 2) Elected at the AGM on April 2, 2014. 3) Stepped down at the AGM on April 2, 2014. – – – – – – – NCC 2014 113 CORPORATE GOVERNANCE REPORT REMUNERATION OF EXECUTIVE MANAGEMENT According to the Swedish Code of Corporate Governance, the Board must establish a remuneration committee to prepare matters relating to remuneration and other terms of employment for executive man agement. If, as in the case at NCC, the Board considers it more appro priate, the entire Board may fulfill the duties of a remuneration com mittee. Guidelines for salary and other remuneration for the company’s senior executives are resolved by the AGM. Remuneration paid to the CEO is proposed by the Chairman and established by the Board. Remuneration of other senior executives is proposed by the CEO and approved by the Chairman. Remuneration of the CEO and other senior executives consists of a fixed salary, variable remunera tion, pension and other benefits. Short-term variable remuneration is decided by the Board. The variable remuneration potentially payable to the CEO and other senior executives is linked to predetermined and measurable criteria, which have also been designed to promote long-term value generation in the company. The maximum outcome of variable remuneration is also subject to distinct limits. In the Swed ish Code of Corporate Governance, it is stipulated that for agree ments signed as of July 1, 2010, the total amount of pay during a period of notice and severance pay may not exceed a sum correspond ing to two years of fixed salary. The Board follows up and evaluates application of the remuneration program applicable for senior execu tives. The term “other senior executives” pertains to the executives who, in addition to the CEO, comprise the Executive Management Group. A specification of salaries and other remuneration paid to Board members, the CEO and senior executives is presented in Note 5, p. 79. NOMINATION COMMITTEE 2014 At the AGM on April 2, 2014, Viveca Ax:son Johnson (Chairman of Nordstjernan AB), Marianne Nilsson (Executive Vice President of Swedbank Robur AB), and Johan Strandberg (Analyst at SEB Fonder), were elected members of the Nomination Committee, with Viveca Ax:son Johnson as Committee Chairman. Tomas Billing, Chairman of the NCC Board of Directors, is a co-opted member of the Nomination Committee but has no voting right. No remuneration was paid to members of the Nomination Committee. NOMINATION COMMITTEE’S PROPOSALS The Nomination Committee proposes reelection of the current Board members: Tomas Billing, Ulla Litzén, Christoph Vitzthum, Olof Johansson, Sven-Olof Johansson, Carina Edblad and Viveca Ax:son Johnson. The Nomination Committee proposes reelection of Tomas Billing as Chairman. A report on the Nomination Committee’s work and proposals ahead of the 2015 AGM is presented on NCC’s website www.ncc.se under the “Corporate Governance” tab. AWARDS During 2014, NCC AB’s Chairman of the Board Tomas Billing was awarded the Golden Gavel by The Swedish Academy of Board Direc tors for his 13 years of value-generating chairmanship in NCC. The Swedish Academy of Board Directors is a non-profit association devoted to promoting better board work in Swedish companies. THE BOARD OF DIRECTORS’ WORKING YEAR 2014 – IN ADDITION TO STANDING POINTS ON THE AGENDA SUCH AS BUSINESS PLANS, INVESTMENTS AND DIVESTMENTS, AS WELL AS FUNDING BOARD MEETING DECEMBER 9 •Strategy • Evaluation of the CEO’s work •Audit • Budget for 2015 • Workplace visit, Berlin DEC JAN NOV BOARD MEETING OCTOBER 23 • Quarterly report • Forecast for the year •Strategy UNSCHEDULED BOARD MEETING SEPTEMBER 18 • Investment and divestment cases BOARD MEETING JULY 17 • Semi-annual report BOARD MEETING JUNE 24 • Review of quarterly report • Accounting and conditions underlying budget 2015 • Workplace visit, Stockholm BOARD MEETING JANUARY 29 • Year-end accounts 2013 • Annual Report • Proposed distribution of profits • Motions to the AGM • Guidelines for salary and other remuneration • Corporate Governance Report • Definitive audit report FEB OCT MAR SEP APR AUG MAY JUL JUN BOARD MEETING APRIL 2 • Information prior to the AGM ANNUAL GENERAL MEETING APRIL 2 STATUTORY MEETING APRIL 2 • Company signatories appointed • Rules of procedure • Decision-making regulations • Instructions for the CEO BOARD MEETING APRIL 28 • Quarterly report • Forecast for the year • Insider Policy and logbook instructions 114 NCC 2014 CORPORATE GOVERNANCE REPORT Board of Directors’ report on internal control The Board’s responsibility for internal control is regulated in the Swedish Companies Act and in the Swedish Code of Corporate Governance. The Corporate Governance Report must contain disclosures concerning the principal features of the company’s internal control and risk-management systems in connection with financial reporting and the preparation of the consolidated financial statements. Information on this is provided in this section. 1 RISK-ASSESSMENT AND RISK-MANAGEMENT NCC applies a risk-assessment and risk-management method for ensuring that the risks to which the company is exposed, and that can impact the internal control and financial statements, are addressed within the processes that have been established. The material risks that have to be taken into account include market risks, operating risks and the risk of errors in financial recognition. With respect to the latter, systematic and documented updates occur once annually. The material risks that have to be considered mainly comprise the risk of errors in percentage-of-completion profit recognition and items based on assessments and estimates, such as valuations of land held for future development and ongoing propertydevelopment, goodwill and provisions. At NCC, risks are followed up in several different ways, including via: • Regular status checks with the Business Area Manager and financial manager of each particular business area. Representing NCC AB, these meetings are always attended by the CEO and the CFO. The status checks address such matters as orders received, earnings, major ongoing and problematical projects, cash flow and outstanding accounts receivable. The meetings also address tenders and major investments, in accordance with the decision-making regulations. •Minuted Board meetings in the various business areas, which are held at least five times per year. The members of each particular board include NCC AB’s CEO and CFO, as well as the Senior Legal Counsel. These meetings address the complete income statement, balance sheet and cash flow statement in terms of both outcome and forecast, or budget. Forecasts are formulated and are checked on three occasions: in connection with the quarters ending March, June and September, and in the following-year budget in November. The meetings also address tenders, investments and sales, in accordance with the decision-making regulations. Investments and divestments of properties exceeding SEK 150 M must be approved by NCC AB’s Board. All investments exceeding SEK 50 M must be approved by NCC AB’s CEO. • Major tenders to be submitted by the business area (exceeding SEK 300 M) must be approved by NCC AB’s CEO. Tenders exceeding SEK 500 M must be endorsed by NCC AB’s Board. Projects exceeding SEK 300 M are also monitored via the NCC Project Trend Report (PTR) system. • NCC AB’s Board receives monthly financial reports and NCC’s current financial status is presented at each Board meeting. Financial risk positions, such as interest rate, credit, liquidity, exchange rate and refinancing risks, are managed by the specialist function, NCC Corporate Finance. NCC’s finance policy stipulates that NCC Corporate Finance must always be consulted and, in cases where Corporate Finance sees fit, that it must manage financial matters. Risks that could also influence reporting include breach of NCC’s Code of Conduct and shortcoming in insurance coverage. These risks are monitored by the Compliance and Insurance function. For more information on control and governance at NCC, see the Group’s website www.ncc.se. The information also includes such documents as the Articles of Association and the Code of Conduct. CONTROL ENVIRONMENT CONTROL ACTIVITY RISK ASSESSMENT INFORMATION AND COMMUNICATION FOLLOW-UP 2 CONTROL ENVIRONMENT The Board has overall responsibility for the internal control of financial reporting. At NCC, a good control environment is characterized by the existence of and compliance with policies, guidelines, manuals and the documentation of work descriptions and accessibility to those to whom they pertain. For NCC, this means that the Board establishes rules of procedure for the Board’s work each year. The Board also prepares an instruction concerning the division of work between the Board and the CEO. According to this instruction, the CEO is responsible for the internal control and for contributing to an efficient control environment. According to the Companies Act, the Board is obligated to establish an Audit Committee. If the Board finds it more appropriate, the entire Board may fulfill the duties of the Audit Committee, the method applied in NCC’s case, since three independent Board members have auditing and accounting competencies. The fact that the Board is relatively small also facilitates this work. The NCC Group is a decentralized international organization with business areas structured in a corporate format based on company law rules for the governance of companies. At Board meetings, the CEO and, where applicable, subsidiary presidents present the matters that require treatment by the Board. Operational management of the Group is based on decision-making regulations within the NCC Group that are adopted annually by the Board. The decision-making regulations stipulate the matters that require the Board’s approval or confirmation. In turn, this is reflected in the corresponding decision-making regulations and attestation regulations applying for the subsidiaries. The basis for the internal control of financial reporting comprises everything that is documented and communicated in control documents, such as internal policies, guidelines and manuals. Major emphasis is placed on determining the policies that are to be Group-wide and those that are to be local. NCC 2014 115 CORPORATE GOVERNANCE REPORT 3 CONTROL ACTIVITIES At NCC, the management of risks is based on a number of control activities that are conducted at various levels for the companies and business areas. The purpose of the control activities is to ensure the efficiency of the Group’s processes and that the internal controls are adequate. For the business operations, operational control systems form the basis for the control structure established and these focus on important stages in the business operations, such as investment decisions, assessment of tenders and permission to start up projects. These occur in part via the IT systems that support the various operational processes and in part through appropriately designed manual controls intended to prevent, discover and correct faults and nonconformities. NCC attaches considerable weight to project follow-up. A strong focus is placed on ensuring the correctness of the business transactions included in the financial reporting. For a number of years, NCC has had several Shared Service Centers (SSC), in part NCC Business Services 4 INFORMATION AND COMMUNICATION Information and communication of policies, guidelines and manuals that are significant to NCC are available on NCC’s intranet (Starnet). The information under Starnet/Economy contains the financial reporting and also methodology, instructions and supporting documentation in the form of checklists etc. as well as overall time schedules. Starnet Economy is a living regulatory system that is updated regularly through the addition of, for example, new regulations concerning IFRS and Nasdaq Stockholm. NCC’s CFO has principal responsibility for Starnet/Economy. Starnet Economy includes the following: • Policies and regulations for the valuation and classification of assets, liabilities, revenues and expenses. • Definitions of the terms used within NCC. • Accounting and reporting instructions. • Framework for self-evaluation of internal controls. • The organization of the financial control function. • Time schedules for audit and reporting occasions, among others. • Decision-making regulations. • Attestation instructions 5 (NBS), which manages most of the transactions of the Nordic operations, and in part the Resources Services (HRS), which manages NCC’s payroll administration for the Nordic countries. There is also Group IT, which has central responsibility for the significant IT systems in NCC. All these functions require that their processes must include control activities that manage identified risks in a manner that is efficient for NCC in relation to the cost incurred. These units systematically and continuously develop their processes, by using control target matrixes that connect risks, control and measurement of efficiency, ensure that the control is documented and have proof of control being implemented (automatically or manually prepared) and that it works. SSC has considerable potential to reach a high level of maturity in internal control by monitoring that testing of the existing controls is efficient instead of being informal, meaning that controls exist but are not always documented or controls in standardized environment are documented but not tested. FOLLOW-UP Follow-ups to safeguard the quality of the internal controls are conducted in various ways within NCC. NCC has developed a system (framework) for documented self-evaluation of internal control. Self-assessments are performed regularly for NCC’s business areas, staff units and Group offices and comprise a component for the Board’s assessment of internal control. Operational control systems, the very basis of NCC’s operations, are evaluated through audits of the operations, following which any shortcomings are rectified. The internal controls are also followed up via Board work within the various business areas and, in cases where it is considered that targeted action is required, the financial control and controller organization is utilized. In view of the follow-ups conducted via the operational audits and through the financial control and controller organization, the Board is of the opinion that there is no need for a special internal examination function, except for the operational audits. As part of its audit of the financial statements and the administration, NCC’s auditor, PricewaterhouseCoopers AB, also examines a selection of NCC’s controls. The Board receives the auditors’ reports and meets the auditors twice annually, including one meeting without the presence of executive management. In addition, the Chairman of the Board has direct contact with the auditors on a number of occasions during the year. Prior to these meetings, views from the audit of the business areas and subsidiaries have been presented to the Board meetings held in the particular business area/subsidiary or to the respective business area management. The views that arise are to be addressed and followed up systematically within the particular unit. NCC’s auditor also reviewed the company’s nine-month report. All financial reporting must comply with the rules and regulations found on Starnet/Economy. Financial reporting occurs in part in the form of figures in the Group-wide reporting system and in part in the form of written comments in accordance with specially formulated templates. Instructions and regulations concerning both written and figure-based reporting are available on Starnet/Economy. The rules and regulations are updated regularly under the auspices of the CFO. Regular training programs and conferences are also arranged for management and financial control personnel in respect of joint principles concerning the requirements to which the internal control is subject. This is within the CFO’s sphere of responsibility. The status of the internal control set-up is reported annually at a meeting of the NCC AB Board. Such reporting also occurs at business area level. AUDITORS’ STATEMENT ON THE CORPORATE GOVERNANCE REPORT To the AGM of NCC AB, Corp. Reg. No. 556034-5174 It is the Board of Directors that is responsible for the 2014 Corpo rate Governance Report on pp. 110–115 and that it has been pre pared in accordance with the Annual Accounts Act. We have read the Corporate Governance Report and, based on this reading and our knowledge of the company and the Group, we believe that we have sufficient grounds for our opinions. This means that our statutory review of the Corporate Governance Report has a different orientation and a significantly more limited scope than the orientation and scope of an audit conducted in accordance with the International Standards on Auditing and generally accepted auditing practices in Sweden. In our opinion, a Corporate Governance Report has been prepared and its statutory content is consistent with the annual accounts and consolidated accounts. Stockholm, February 27, 2015 PricewaterhouseCoopers AB Håkan Malmström Authorized Public Accountant 116 NCC 2014 CORPORATE GOVERNANCE REPORT Board of Directors and Auditors 1 2 3 4 5 6 7 8 9 10 11 12 NCC 2014 117 CORPORATE GOVERNANCE REPORT 1. TOMAS BILLING 2. VIVECA AX:SON JOHNSON 3. OLOF JOHANSSON Chairman. Born 1963. Board member since 1999 and Chairman since 2001. President of Nordstjernan AB. Board member of BiJaKa AB and Parkinson Research Foundation. Previous experience includes President of Hufvudstaden AB and Monark Bodyguard AB. Shareholding in NCC AB: 20,600 Series A shares and 75,400 Series B shares. Born 1963. Board member since 2014. Viveca Ax:son Johnson has been Chairman of Nordstjernan AB since 2007. She has 17 years of experience from various positions in the Nordstjernan Group. Viveca is also Board member of Rosti AB and Antti Ahlström Perilliset Oy. Shareholding in NCC AB: 74,000 Series B shares, as well as 25,000 Series A shares and 44,000 Series B shares via private companies. Born 1960. Board member since 2012. Partner and COO of SveaNor Fastigheter AB. Chairman of Pangea Property Partners. Previously active in the Skanska Group for 16 years including in charge of Skanska’s project-development operations, 1996–2002. Shareholding in NCC AB: 4,000 Series B shares. 4. SVEN-OLOF JOHANSSON 5. ULLA LITZÉN 6. CHRISTOPH VITZTHUM Born 1945. Board member since 2012. President and principal owner of FastPartner AB since 1996. Board member of Allenex AB and Autoropa AB. Previous experience: own business and entrepreneur. Shareholding in NCC AB: 100,000 Series B shares via companies. Born 1956. Board member since 2008. Board member of Alfa Laval AB, Atlas Copco AB, Boliden AB, Husqvarna AB and AB SKF. Previous experience: President of W Capital Management AB (2001–2005) and Vice President of Investor AB (1996–2001). Shareholding in NCC AB: 3,400 Series B shares Born 1969. Board member since 2010. President and CEO of Oy Karl Fazer AB. Previous experience: VP Wärtsilä Services 2009–2013, Wärtsilä Power Plants (2006–2009), President of Wärtsilä Propulsion (2002–2006) and CFO at Wärtsilä Oyj Abp, Ship Power (1999–2002). Shareholding in NCC AB: 0 EMPLOYEE REPRESENTATIVES 7. CARINA EDBLAD 8. LARS BERGQVIST 9. LIS KARLEHEM Born 1963. Board member since 2014. Since 2011, she has been President of Färdig Betong AB. Carina has 25 years of experience from Skanska AB and she has worked in all phases of the construction process. She has been Line Manager and Chief of Staff in various operations in the Nordic region. Shareholding in NCC AB: 0 shares Born 1951. Construction engineer. Board member since 1991. Employed since 1975. Shop steward at NCC. Employee representative of Ledarna (Swedish Association of Supervisors). Other assignments: President of Byggcheferna (union of construction managers). Shareholding in NCC AB: 1,140 Series A shares and 200 Series B shares (including related-party holdings). Born 1963. Team leader Group IT. Deputy Board member since 2009. Employed since 1999. Employee representative of Unionen (formerly SIF, Swedish Industrial Salaried Employees’ Association). Shareholding in NCC AB: 0 10. KARL G. SIVERTSSON 11. MATS JOHANSSON Born 1961. Carpenter. Board member since 2010. Employed since 1986. Shop steward at NCC. Employee representative of Svenska Byggnadsarbetare förbundet (Swedish Building Workers’ Union). Other assignments: Vice Chairman of Svenska Byggnadsarbetareförbundet, Central Norrland Region, and deputy member of Federation Board of Svenska Byggnadsarbetareförbundet. Shareholding in NCC AB: 0 Born 1955. Carpenter. Deputy Board member since 2011. Employed since 1977. Construction carpenter and shop steward at NCC, as well as chief safety officer. Employee representative of Svenska Byggnads arbetareförbundet (Swedish Building Workers’ Union). Other assignments: Regular Board member of Byggnadsarbetareförbundet in the Småland/ Blekinge region. Shareholding in NCC AB: 100 Series B shares. AUDITORS – PRICEWATERHOUSECOOPERS AB HÅKAN MALMSTRÖM Auditor-in-charge. Born 1965. Other significant assignments: auditor of Axel Johnson AB, Karo Bio AB, Nordstjernan AB and Saab AB. SECRETARY OF THE BOARD HÅKAN BROMAN Born 1962. General Counsel at NCC AB. NCC AB’s Board Secretary since 2009. Shareholding in NCC AB: 500 Series B shares. 12. KARL-JOHAN ANDERSSON Born 1964. Paver. Board member since 2011. Employed since 1984. Shop steward at NCC. Employee representative of SEKO (Union for Employees in the Service and Communication Sectors). Other assignments: Member of SEKO’s Road and Rail Department in Skåne. Senior shop steward of the paving section in Skåne. Shareholding in NCC AB: 0 The details regarding shareholdings in NCC pertain to shares that were directly owned, owned via related parties or owned via companies at December 31, 2014. For updated information about shareholdings, see the Group’s www.ncc.se website, under investor relations, which includes information from the Swedish Financial Supervisory Authority’s insider register. 118 NCC 2014 CORPORATE GOVERNANCE REPORT Executive Management Group 1 2 3 4 5 6 7 8 9 10 11 12 13 NCC 2014 119 CORPORATE GOVERNANCE REPORT 1. PETER WÅGSTRÖM 2. ANN-SOFIE DANIELSSON 3. HÅKAN BROMAN Born 1964. President and CEO since 2011. Business Area Manager of NCC Housing (2009–2010). Employed by NCC since 2004. Previous experience includes: Business Area Manager of NCC Property Development (2007–2008), Head of NCC Property Development’s Swedish operations (2004–2006), various management positions in Drott (currently Fabege) (1998–2004) and various positions in Skanska’s real estate operations (1991–1998). Shareholding in NCC AB: 20,223 Series B shares (including related-party holdings) and 10,239 call options on Series B shares. Born 1959. Chief Financial Officier since 2007 and Financial Director since 2003. Employed by NCC since 1996. Previous experience includes: Finance Director and Group controller at NCC AB (1999–2003), Group Accounts Manager at NCC AB (1996–1999) and Group Accounts Manager at Nynäs AB (1993–1995) and Authorized Public Accountant at Tönnerviksgruppen and KPMG (1984–1992). Other assignments: Member of the Board of RNB Retail and Brands, as well as Bulten AB. Shareholding in NCC AB: 3,000 Series B shares. Born 1962. General Counsel in NCC AB since 2009. Employed by NCC since 2000. Previous experience includes: corporate lawyer at NCC International Projects and NCC Property Development (2000– 2008), corporate lawyer at ABB/Daimler Chrysler Transportation (1996– 2000), lawyer at Ekelunds advokatbyrå (1993–1996), positions in Swedish court system (1991–1993), active in the European International Contractors (EIC) (2001–2010) and Member of the Board (2008–2010). Shareholding in NCC AB: 500 Series B shares. 4. SVANTE HAGMAN 5. JOACHIM HALLENGREN 6. KLAUS KAAE Born 1961. Business Area Manager NCC Construction Sweden since 2012. Employed by NCC since 1987. Previous experience includes: Business Area Manager NCC Housing (2011–2012), Head of Stockholm/Mälardalen Region at NCC Construction Sweden and Head of Market and Business Development at NCC Construction Sweden. Other assignments: Board member of Swedish Construction Federation. Shareholding in NCC AB: 2,000 Series B shares and 3,839 call options on Series B shares. Born 1964. Business Area Manager NCC Housing since 2012. Employed by NCC since 1995. Previous experience includes: Business Area Manager NCC Property Development (2009–2013), Head of NCC Property Development’s Swedish operations (2007–2009), Regional Manager NCC Property Development Western Sweden (2004– 2007), Regional Manager NCC Property Development Southern Sweden (2003–2004), various positions within NCC’s Property Development operations (1995–2003). Shareholding in NCC AB: 0 Born 1959. Business Area Manager NCC Construction Denmark since 2012. Employed by NCC since 1985. Previous experience includes: Vice President of NCC Construction Denmark (2009–2012). Executive Director of NCC Construction Denmark 2002–2009. Member of the Board of Dansk Byggeri. Shareholding in NCC AB: 0 7. CAROLA LAVÉN 8. ANN LINDELL SAEBY 9. CHRISTINA LINDBÄCK Born 1972. Business Area Manager NCC Property Development since 2013. Employed by NCC since 2013. Previous experience includes Business Development Director at Atrium Ljungberg (2006–2013), Business Development Director at Ljungberg-Gruppen (2003–2006) and Property Manager for Stockholm/ Uppsala at Drott (1998–2003). Other assignments: Board member of BRIS. Shareholding in NCC AB: 0 Born 1962. Senior Vice President Corporate Communications since 2012. Employed by NCC since 2012. Previous experience includes Senior Vice President Corporate Communications at Fortum (2004–2012) and communications consultant and partner at Kreab Gavin Anderson (1998–2004). Shareholding in NCC AB: 0 Born 1963. Senior Vice President Corporate Sustainability, since 2013. Previous experience includes Senior Vice President Environmental Affairs at NCC AB 2010–2013, Quality and Environmental Manager, Ragn-Sells AB, 2002–2010, Assistant Undersecretary, Acting Permanent Undersecretary of State, Deputy Assistant Undersecretary, etc. at the Ministry of the Environment (1991–2002). Other assignments: Chairman of the Board of Miljömärkning Sweden AB, Nordic Swan Ecolabel. Shareholding in NCC AB: 0 10. JYRI SALONEN 11. JACOB BLOM 12. HARRI SAVOLAINEN Born 1965. Business Area Manager NCC Roads since February 1, 2015. Employed by NCC since 2007. Previous experience includes Division Manager of NCC Roads Services 2014, Business Unit Manager of NCC Roads in Finland 2009–2013, various positions at ExxonMobil and Esso in Finland. Shareholding in NCC AB: 0 Born 1970. Senior Vice President Human Resources since March 12, 2014. Employed by NCC since 2013. Previous experience includes Head of Business Support NCC Construction Denmark 2013–2014, Human Resources Director TDC Business & TDC Nordic 2009–2013, Human Resources Director NCC Construction Denmark 2008–2009, Human Resources Director at Merck Sharp & Dohme in Denmark and later in Sweden 2000–2005. Shareholding in NCC AB: 266 Series A shares. Born 1971. Business Area Manager NCC Construction Finland since 2012. Employed by NCC since 2001. Previous experience includes Regional Manager of NCC’s residential construction in Helsinki and various executive positions at NCC Construction Finland since 2001. Other assignments: Member of the Board of Ömsesidiga Pensionsförsäkringsbolaget Etera and Byggnadsindustri RT. Shareholding in NCC AB: 800 Series B shares. 13. HÅKAN TJOMSLAND Born 1964. Business Area Manager NCC Construction Norway since 2013. Employed by NCC since 1992. Previous experience includes Regional Head of NCC’s civil-engineering operations in Norway (2009–2013). District Manager in Civil Engineering Region (2003–2009). Prior to that, senior engineer and civil engineering manager at NCC Construction Norway. Shareholding in NCC AB: 0 CHANGES IN EXECUTIVE MANAGEMENT GROUP 2015: Göran Landgren was Business Area Manager of NCC Roads until February 1, 2015 when he was succeeded by Jyri Salonen. Göran is now responsible for special initiatives and projects in NCC AB. The details regarding shareholdings in NCC pertain to shares that were directly owned, owned via related parties or owned via companies at December 31, 2014. For updated information about shareholdings, see the Group’s www.ncc.se website, under investor relations, which includes information from the Swedish Financial Supervisory Authority’s insider register. 120 NCC 2014 Financial information/contact NCC will publish financial information regarding the 2015 fiscal year on the following dates: March 24 April 29 July 17 November 6 January 2016 Annual General Meeting Interim report January–March Six-month report January–June Interim report January–September Year-end report 2015 NCC’s interim reports are downloadable from the NCC Group’s web site, www.ncc.se, where all information regarding the NCC Group is organized in English and Swedish versions. The website also includes an archive of interim reports dating back to 2009 and annual reports dating back to 1996. NCC does not print or distribute its interim reports. The printed Annual Report is sent to those who request it. The price performance of NCC’s Series A and B shares, updated every 15th minute of each day of trading, is presented under the “Investor Relations” tab, as are relevant financial figures. Press releases issued by the Group, NCC AB, and local press releases from the various countries are available on the website. NCC’s financial information can be ordered either by using the order form available on the www.ncc.se website, by e-mailing ir@ncc. se, writing to NCC AB, SE-170 80 Solna, Sweden, or calling NCC AB at +46 8 585 510 00. The person at the NCC Group responsible for shareholder-related issues and financial information is Johan Bergman, Head of IR (Tel: +46 8 585 523 53; e-mail: [email protected]). ANNUAL GENERAL MEETING The AGM will be held on March 24, at 4: 30 p.m. Location: Grand Hôtel, Vinterträdgården, Royals entrance, Stall gatan 6, Stockholm. Notification can be made by post to the following address: NCC AB, Att: Agneta Hammarbäck, SE-170 80, Solna; via the Group’s website at www.ncc.se, by telephoning +46 8 585 521 10; or e-mailing [email protected]. Notification should include name, personal identification number or corporate registra tion number, address, telephone number and registered sharehold ing. Registration at the AGM will begin at 3: 30 p.m. The official notifi cation of the AGM is available on the NCC Group’s website, www.ncc. se, and was published in Post- and Inrikestidningar on February 17, 2014. Confirmation that the official notification had been issued was announced the same day in Dagens Nyheter and Svenska Dagbladet. NCC AB (publ), Corp. Reg. No. 556034-5174, Registered Head Office: Solna. Addresses to the companies in the NCC Group are available at www.ncc.se. SHAREHOLDER INFORMATION ON NCC.SE All financial information concerning the NCC Group and everything that concerns you as a NCC shareholder is available on NCC’s website under the Investor Relations tab. SHARE-PRICE INFORMATION Share-price information with a 15-minute delay is available and it will also be possible to see the total return (including reinvested dividends) and compare the performance of the NCC share with that of Nordic competitors. LIST OF ANALYSTS. Here, you will find a list of the analysts who regularly monitor NCC and their expectations of the company. SHAREHOLDER SERVICE. From our Shareholder Service, you can subscribe for the information you would like to receive and also decide the format in which you will receive it, on paper or by e-mail. MORE INFORMATION/ CONTACT PERSON. Johan Bergman Head of IR Tel: +46 8 585 523 53, E-mail: [email protected] Definitions/glossary FINANCIAL KEY FIGURES Return on capital employed: Profit after financial items including results from participations in associated companies following the reversal of interest expense in relation to average capital employed. Average period of fixed interest: The remaining period of fixed interest weighted by interest-bearing liabilities outstanding. Return on shareholders’ equity: Net profit for the year according to the income statement excluding non-controlling interests, as a percentage of average shareholders’ equity. Average interest rate: Nominal interest weighted by interest-bearing l iabilities outstanding on the balance-sheet date. Average shareholders’ equity: Average of the balances at January 1, March 31, June 30, September 30 and December 31. Capital employed: Total assets less interest-free liabilities including deferred tax liabilities. Average capital employed is calculated as the average of the balances at January 1, March 31, June 30, September 30 and December 31. Capital turnover rate: Net sales divided by average capital employed. Debt/equity ratio: Net indebtedness divided by shareholders’ equity. Dividend yield: The dividend as a percentage of the market price at year-end. Earnings per share, after taxes: Net profit for the year attributable to NCC shareholders divided by the weighted number of shares during the year in question. Equity/assets ratio: Shareholders’ equity as a percentage of total assets. Exchange-rate difference: Exchange-rate changes attributable to move ments in various exchange rates when receivables and liabilities in foreign c urrencies are translated into SEK. Exchange-rate effect: The impact of changes in various exchange rates on current reporting in NCC’s consolidated accounts on translation into SEK. Interest-coverage ratio: Profit after financial items plus financial expense divided by financial expense. Net indebtedness: Interest-bearing liabilities and provisions less financial assets including cash and cash equivalents. Net investments: Closing balance less opening balance plus depreciation and impairment losses less write-ups pertaining to fixed assets and properties classed as current assets. Net margin: Profit after net financial items as a percentage of net sales. Net sales: The net sales of construction operations are recognized in accord ance with the percentage-of-completion principle. These revenues are recog nized in pace with the gradual completion of construction projects within the company. For NCC Housing, net sales are recognized when the housing unit is transferred to the end customer. Property sales are recognized on the date on which significant risks and rewards are transferred to the buyer, which nor mally coincides with the transfer of ownership. In the Parent Company, net sales correspond to recognized sales from completed projects. Operating margin: Operating profit as a percentage of net sales. Operating net: Result from property management before depreciation. Order backlog: Period-end value of the remaining non-worked-up project revenues for projects received, including proprietary projects for sale that have not been completed. Orders received: Value of received projects and changes in existing projects during the period concerned. Proprietary projects for sale, if a decision to initi ate the assignment has been taken, are also included among assignments received, as are finished properties included in inventory. P/E ratio: Market price of the shares at year-end, divided by earnings per share after taxes. Profit margin: Profit after financial items as a percentage of net sales. Repurchase of treasury shares in share data: Treasury shares have been excluded from calculations of key figures based on the number of shares out standing. Production: NCC and Solberg. Photographers: Felix Gerlach p.9. Sten Jansin p.5, 116–118. Heath Korvola/Getty Images p.6. Krullfoto.dk p.27. Micke Lundström p.33. Erik Mårtensson p.3, 6, 7, 10, 14, 15, 20–30, 36, 42, 46, 47, front cover and back. Joanna Redman p.34. Tenjin Visuals p. 41. Per Pixel Petterson p.45. Pekka Stålnacke/bsmart p.51. Illustrator: Johan Reich p. 47. Print: Göteborgstryckeriet Return on total capital: Profit after financial items including results from participations in associated companies plus financial expense in relation to average total assets. Share of risk-bearing capital: Sum total of shareholders’ equity and deferred tax liabilities as a percentage of total assets. Total return: Share-price performance during the year plus dividend paid divided by share price at the beginning of the year. SECTOR-RELATED DEFINITIONS Buildings/other buildings: In descriptions of operations, this term pertains in part to commercial buildings, mainly offices, retail outlets, shopping malls, garages, hotels and industrial buildings and in part to public premises and buildings such as hospitals, schools, healthcare and care facilities and public administration buildings. Construction costs: The cost of constructing a building, including building accessories, utility-connection fees, other contractor-related costs and VAT. Construction costs do not include the cost of land. Detailed development plan: Municipal plan for the use of land in a certain area, which is legally binding and can form the foundation for the granting of building permits. Development rights: Estimated possibility to develop a site. With respect to housing, a development right corresponds to an apartment or semi-detached or detached house. Either ownership of a site or an option on ownership of the site concerned is a prerequisite for being granted access to a development right. For commercial properties, development rights are measured in square meters. Function contract: Usually a multi-year contract in which the customer imposes functional requirements rather than detailed requirements concern ing materials and design. General plan: Municipal plan for the use of land in a certain area, which is not legally binding and normally necessitates being followed up and defined in greater detail in detailed development plans. Leasing rate: The percentage of anticipated rental revenues that corresponds to signed leases (also called leasing rate based on revenues). NCC Partnering: A cooperation format applied in the construction and civil engineering industry, whereby the client, consultants and contractor establish open and trusting cooperation at an early stage of the process based on shared goals, joint activities and joint financial targets in order to optimize the project. Platforms: Group-wide standardized technical solutions. Have been developed for everything from sports arenas, offices, logistics facilities and bridges to single-family and multi-family housing. Properties: In descriptions of operations, “properties” refers to buildings, housing or land. Proprietary project: When NCC, for its own development purposes, acquires land, designs a project, conducts construction work and then sells the project. Pertains to both housing projects and commercial property projects. Required yield: The yield required by purchasers in connection with acquisi tions of property and housing projects. Operating revenues less operating and maintenance expenses (operating net) divided by the investment value. VDC: Virtual Design and Construction. NCC is one of the leading construction and property development companies in Northern Europe, with sales of SEK 57 billion and 18,000 employees. With the Nordic region as its home market, NCC is active throughout the value chain – developing and building residential and commercial properties, and constructing industrial facilities and public buildings, roads, civil engi neering structures and other types of infrastructure. NCC also offers input materials used in construction and accounts for pav ing and road services. NCC creates future environments for working, living and communication based on responsible construction operations that result in sustainable interaction between people and the environment. NCC AB SE-170 80 Solna, Sweden Tel: +46 (0)8 585 510 00 ncc.se


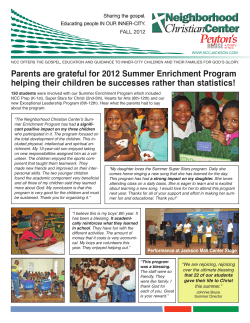

© Copyright 2026