
Prognostic Disclosure to Patients with Cancer near the End of... Background:
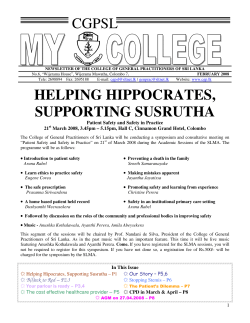
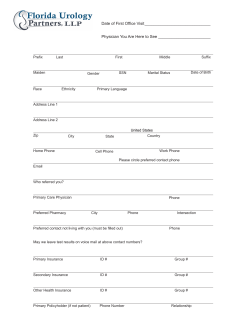
Article
Prognostic Disclosure to Patients with Cancer near the End of Life
Elizabeth B. Lamont, MD, MS, and Nicholas A. Christakis, MD, PhD, MPH
Background: Patients’ understanding of their prognosis informs
numerous medical and nonmedical decisions, but patients with
cancer and their physicians often have disparate prognostic expectations.
Objective: To determine whether physician behavior might contribute to the disparity between patients’ and physicians’ prognostic expectations.
Design:
Prospective cohort study.
Setting:
Five hospices in Chicago, Illinois.
Patients:
326 patients with cancer.
Intervention: Physicians formulated survival estimates and also
indicated the survival estimates that they would communicate to
their patients if the patients insisted.
Measurements:
Comparison of the formulated and communi-
cated prognoses.
Results:
For 300 of 311 evaluable patients (96.5%), physicians
were able to formulate prognoses. Physicians reported that they
would not communicate any survival estimate 22.7% (95% CI,
F
orty years ago, physicians did not inform most
patients with cancer of their diagnoses (1, 2). This
practice of nondisclosure is now generally considered
out of date, primarily because it may represent physician
paternalism that compromises patient autonomy. Indeed, almost all patients with cancer are now informed
of their diagnoses (3). Nevertheless, it is not clear how
many understand the survival implications, that is, the
associated prognosis. Because survival estimates often
strongly affect decisions about cancer treatment, especially at the end of life, patients need and often rightly
request prognoses when making such decisions (4 –7).
Studies that compare physicians’ prognostic estimates with those of patients often show a substantial
discrepancy between the two. In a study of 100 patients
with cancer who were undergoing treatment, Mackillop
and colleagues (8) found that one third of those with
metastatic cancer thought that they had local or regional
disease and were being treated for cure. Similarly,
Eidinger and Schapira (9) studied 190 patients being
treated for incurable metastatic cancer and found that
approximately one third thought that the treatment
1096 © 2001 American College of Physicians–American Society of Internal Medicine
17.9% to 27.4%) of the time, would communicate the same
survival estimate they formulated 37% (CI, 31.5% to 42.5%) of
the time, and would communicate a survival estimate different
from the one they formulated 40.3% (CI, 34.8% to 45.9%) of the
time. Of the discrepant survival estimates, most (70.2%) were
optimistically discrepant. Multivariate analysis revealed that older
patients were more likely to receive frank survival estimates, that
the most experienced physicians and the physicians who were
least confident about their prognoses were more likely to favor no
disclosure over frank disclosure, and that female physicians were
less likely to favor frank disclosure over pessimistically discrepant
disclosure.
Conclusions: Physicians reported that even if patients with cancer requested survival estimates, they would provide a frank estimate only 37% of the time and would provide no estimate, a
conscious overestimate, or a conscious underestimate most of the
time (63%). This pattern may contribute to the observed disparities between physicians’ and patients’ estimates of survival.
Ann Intern Med. 2001;134:1096-1105.
www.annals.org
For author affiliations, current addresses, and contributions, see end of text.
See editorial comment on pp 1142-1143.
would cure them. Weeks and colleagues (10), in their
analysis of 917 patients with metastatic colon cancer or
advanced non–small-cell lung cancer in the Study to
Understand Prognoses and Preferences for Outcomes
and Risks of Treatments, found that patients who had
optimistic misperceptions of their prognosis often requested medical therapies that most physicians would
consider futile (10). Their study suggests that in patients
with terminal cancer, optimistic prognostic estimates
may lead to choices of invasive but ineffective medical
therapies rather than perhaps more appropriate supportive care.
Previous studies do not clarify the reason for the
asymmetry between comparatively optimistic survival
estimates made by patients with cancer and the estimates made by their physicians. Do patients misinterpret or deny the poor prognoses that physicians give
them? Do physicians think one thing about patients’
prognoses but tell the patients something different? Although several factors may be operating simultaneously,
some research suggests that at least part of the discrepancy may be due to the generally optimistic prognostic
Prognostic Disclosure
estimates that physicians give their patients or to omission of prognostic discussions altogether (11).
Our principal objective was to evaluate how often
physicians favor communicating frank survival estimates
to patients with terminal cancer who request them. An
additional objective was to examine how specific patient
and physician characteristics are associated with physicians’ preferences (that is, their stated intentions) for
prognostic communication. To meet these objectives,
we interviewed physicians from several specialties who
referred their own patients with cancer to hospice terminal care. We asked them to provide us with their
most accurate estimate of how long their patients had to
live (formulated prognosis). We then asked them what
they would tell their patients if the patients insisted on
obtaining an estimate of how long they had to live (communicated prognosis). We compared these two survival
estimates and sought to explain discrepancies by evaluating several patient and physician variables in which we
had a substantive interest.
METHODS
Study Sample
We assembled a cohort of all patients with cancer
admitted to five outpatient hospice programs in Chicago, Illinois, during 130 consecutive days in winter and
spring 1996. We approached all hospices in the Chicago
area that admitted more than 200 patients per year, at
least 70% from within the Chicago city limits. Six hospices met these criteria, and five agreed to participate;
we estimate that most hospice patients in Chicago were
captured in our sample. Our research was approved by
the institutional review board at each participating hospice and was conducted in accordance with the regulations of these boards. Participating hospices usually notified us about patients on the day of admission. We
contacted referring physicians promptly to administer a
4-minute telephone survey about patient prognosis and
to collect other information.
A total of 767 patients were referred by 502 physicians during the study period and consented to the
study. The five hospices contributed 13%, 14%, 17%,
22%, and 34% of the sample, respectively. Of the 767
patients, 325 did not meet the entry criteria: Two hundred eighty-five had a noncancer diagnosis (an expected
percentage based on national data) (12, 13), and 40 had
www.annals.org
Article
physicians who were not appropriate participants (that
is, they had already responded to several previous cases
in the study). Thirty patients died before we were notified of admission. Because they died within a few hours
and their physicians’ predictions of survival would be
meaningless, we did not include them in our cohort. For
the remaining 412 eligible patients, we reached 38 physicians (9.2%) after the patient had died (and therefore
could not get a meaningful prognostic estimate); we
reached 8 physicians (1.9%) before the patient died, but
the physician declined to participate; and we failed to
reach 40 physicians (9.7%). However, for these 86 patients, we obtained basic physician and patient information and time of death.
We therefore successfully completed surveys with
physicians who cared for 326 of the 412 eligible patients
(a completion rate of 79.1%). Our analytic sample consists of these 326 patients, who were referred by 258
physicians. When we compared the 326 patients with
the 86 excluded patients, we did not find important
differences in age, sex, ethnicity, cancer type, or disease
duration or in their physicians’ sex, practice experience,
or specialty. While most participating physicians (83%
[214 of 258]) referred only 1 patient, a small number
referred more than 1 (range, 2 to 6 patients). The average number of patients per physician was 1.26.
Variables and Data Sources
We acquired information about patient age, sex,
ethnicity, religion, marital status, cancer diagnosis, and
comorbid conditions from the hospices. From the physician telephone survey, we obtained patients’ Eastern
Cooperative Oncology Group (ECOG) performance
status scores (a measure of debilitation that ranges from
0 to 4) (14) and duration of illness. We obtained patients’ dates of death from publicly available death registries or from the hospices. As of 30 June 1999, dates of
death were known for 96% of the cohort (313 of 326).
From the physician telephone survey, we also determined physicians’ experience with similar patients and
how well they knew the study patients (that is, the duration, recency, and frequency of their contact). From
publicly available records, we determined physicians’
specialty, years in practice, and board certification.
Our key questions involved 1) an estimate of the
patient’s prognosis (by asking the physicians to provide
19 June 2001 Annals of Internal Medicine Volume 134 • Number 12 1097
Article
Prognostic Disclosure
“your best estimate of how long you think this patient
has to live”) and 2) a comparable statement about what
the physician would tell the patient if the patient or
family insisted on receiving a specific estimate of survival. We refer to the first prognosis (the estimates of
survival given to us by the physicians) as the formulated
prognosis and the second prognosis (the estimates physicians would give to patients) as the communicated prognosis. By design, these two questions were separated by
20 questions that required approximately 2 minutes to
answer. Although physicians were not reminded of their
formulated prognosis when asked for the communicated
prognosis, it was provided if they requested it. Physicians were not asked to explain discrepancies between
their formulated and communicated prognoses. We also
asked physicians to quantify their confidence in their
formulated prognosis as a percentage, from 0% (no confidence) to 100% (complete confidence). The instrument is available from the investigators upon request.
Statistical Analysis
We created a multinomial disclosure variable capturing the four possible categories of prognostic disclosure that could result from comparison of the formulated and communicated prognoses. The categories were
1) no disclosure (the physicians formulated a prognosis
for the investigators but would not communicate any
temporally specific prognosis to the patient), 2) frank
disclosure (formulated prognosis was the same as communicated prognosis), 3) optimistically discrepant disclosure (formulated prognosis was shorter than communicated prognosis), and 4) pessimistically discrepant
disclosure (formulated prognosis was longer than communicated prognosis). To evaluate associations between
the multinomial disclosure variable and categorical and
continuous variables, we used chi-square tests and analysis of variance, respectively. We used multinomial logistic regression to model the multivariate effect of patient
and physician variables on the intended strategy of prognostic disclosure (15). This type of model describes the
relative odds, through conditional odds ratios, of being
in one category compared with another (the omitted
category, which was frank disclosure). Although 83% of
physicians referred only one patient to the cohort, we
adjusted our regression model to account for clustering
of patients within physicians (16). All analyses were per1098 19 June 2001 Annals of Internal Medicine Volume 134 • Number 12
formed by using Stata 6.0 (Stata Corp., College Station,
Texas).
Odds ratios may present difficulties when used to
characterize relationships, because they may seem to
overstate the relative risk when the frequency of an outcome is high. Therefore, we used a variation of a
method described elsewhere (17–19) to transform odds
ratios into relative risks for selected key comparisons.
These relative risks provide an additional, easier to
appreciate characterization of the relationship between
predictors of interest and the outcome being examined.
Such relative risks depend on specified vectors of covariates and would change if different vectors were specified.
Therefore, for illustrative purposes, we used the following fixed vector of covariate values, which were determined by their frequency (that is, mean, median,
mode), to report the relative risk for intended disclosure
behavior in physicians and patients: white female patient, 70 years of age, cancer diagnosis for 32 weeks,
ECOG performance status score of 3, 43 weeks of
follow-up, male general internist, physician in the lower
75% of practice experience, physician with more than
50% confidence in his or her prediction, physician who
had referred fewer than two patients to a hospice in the
past quarter, eight previous contacts between the patient–physician pair, and last physical examination 7
days before referral. We then performed selected comparisons of this vector and vectors that differed by one
covariate to calculate relative risks. These differing covariate values are as follows: 60-year-old patient, patient
with an ECOG performance status score of 2, female
physician, physician in the upper quartile of practice
experience, physician with less than 50% confidence in
his or her prediction, physician with experience treating
13 similar patients, and physician referring two or more
patients to a hospice in the previous quarter
Role of the Funding Sources
The funding sources had no role in the collection,
analysis, or interpretation of the data or in the decision
to submit the paper for publication.
RESULTS
Table 1 provides descriptive information about the
patient and physician sample. The mean age of patients
was 69.2 years (range, 19.6 to 98.1 years); 39.6% were
www.annals.org
Prognostic Disclosure
Article
Table 1. Characteristics of 326 Terminally Ill Hospice Patients and Their Physicians
Variable
Patient characteristics
Mean age (range), y
Male sex, %
Ethnicity, %
White
African American
Asian
Hispanic
Unknown
Marital status, %
Married
Single
Divorced
Widowed
Median disease duration, wk
Median performance status score*
Physician characteristics†
Male sex, %
Median time in practice, y
Board certification, %
Specialty, %
General internal medicine and geriatrics
Hematology–oncology
Other internal medicine
Family or general practice
Other
Median similar patients cared for in the
past 12 months, n
Referred !2 patients to hospice in the past
quarter, %
Median confidence in prediction, %
Patient–physician relationship
Median duration, wk
Median contacts in past 3 months, n
Median time since last physical
examination, d
Complete Sample
(n ! 326)
Frank Disclosure
(n ! 111)
No Disclosure
(n ! 68)
Optimistic Disclosure
(n ! 85)
Pessimistic Disclosure
(n ! 36)
69.2 (19.6–98.1)
39.6
71.5
33.3
65.9
44.1
70.0
42.4
66.0
41.7
51.8
19.6
2.2
4.3
22.1
50.4
23.4
1.8
1.8
22.5
48.5
16.2
1.5
5.9
27.9
58.8
20.0
1.2
3.5
16.5
55.6
19.4
2.8
5.6
16.7
43.4
16.7
10.3
29.6
32
3
39.6
16.0
11.3
33.0
32
3
55.4
18.5
10.8
15.4
32
3
35.8
16.0
6.2
42.0
32
3
45.7
17.1
14.3
22.9
32
2
80.2
17
82.7
85.7
15
83.5
74.1
19
79.3
79.1
18
80.6
68.1
14
73.9
37.0
23.2
18.1
13.8
7.9
42.9
22.0
18.7
11.0
5.5
33.3
33.3
15.8
10.5
7.0
39.4
18.2
15.1
18.2
9.1
33.3
33.3
9.5
14.3
9.5
3
3
4.5
3
5
33.0
70.0
28.6
75
31.0
50
35.8
75
60.9
75
43
8
32
7
39
10
78
7
52
10
7
7
7
7
7
* Performance status is measured on the Eastern Cooperative Oncology Group continuous scale of 0 to 4, with 0 indicating normal activity and 4 indicating completely
bedbound.
† Because these characteristics are reported at the physician level, the frequencies of disclosure type are given only for the first patient the physician referred in the cohort
(n " 258). For these characteristics, the column totals do not apply.
men; and the most frequent principal diagnoses were
lung cancer (28.5%), colorectal cancer (10.7%), breast
cancer (9.5%), and pancreatic cancer (8.0%). The median ECOG performance status score was 3 (corresponding to !50% of the day spent in bed).
The physicians had been practicing for a median of
17 years (range, 1 to 52 years), and 80.2% were men.
Their specialty distributions were general internal medicine and geriatrics (37.0%), medical oncology (23.2%),
nononcologic internal medicine subspecialties (18.1%),
family practice or general practice (13.8%), and other
(for example, surgeons or gynecologists) (7.9%). Although 23.2% of the physicians were medical oncologists, 31.9% of patients were referred by an oncologist,
www.annals.org
since physicians could refer more than one patient in the
cohort.
Of the 326 patients, 15 were missing data on prognostic disclosure. In 300 of the 311 remaining patients
(96.5%), the physicians (n " 241) formulated prognoses and were willing to share them with us. However,
physicians reported that in 22.7% (95% CI, 17.9% to
27.4%) of these cases (68 of 300), they would not communicate a temporally specific prognosis if asked by the
patients to provide one. In 37% (CI, 31.5% to 42.5%)
of these cases (111 of 300), physicians would communicate frank prognoses, and in 40.3% (CI, 34.8% to
45.9%) (121 of 300), they would communicate discrepant prognoses. Among the 121 patients who would have
19 June 2001 Annals of Internal Medicine Volume 134 • Number 12 1099
Article
Prognostic Disclosure
Figure 1. Relationship between formulated and
communicated survival.
The communicated survival and the formulated survival, in days, are
shown for a cohort of 232 patients at the time of initiation of homebased hospice care. For the remaining 68 patients in our sample of 300,
no prognosis would have been communicated. Not all points are visible
because some may overlap precisely. The diagonal line represents frank
disclosure. Patients above the diagonal line would receive knowingly
overestimated survival information, and patients below the diagonal line
would receive knowingly underestimated survival information.
received discrepant prognostic estimates from their physicians, 70.2% (85 of 121) would have received optimistically discrepant prognoses and 29.8% (36 of 121)
would have received pessimistically discrepant prognoses. In the 85 patients who would have received optimistically discrepant prognoses, physicians would have
overestimated prognosis by a median of 31 days. For
24.7% of these patients (21 of 85), physicians would
have overestimated prognosis by at least 60 days (range,
60 to 210 days). Analogously, for the 36 patients who
would have received pessimistically discrepant prognoses, physicians would have underestimated prognosis
by a median of 19 days.
Overall, the median formulated prognosis was 75
days and the median communicated prognosis (in the
232 patients who would have received one) was 90 days.
Thus, physicians would have overstated their formulated
prognoses to patients by a factor of 1.2 (90 days/75
days). Figure 1 illustrates the relationship between the
formulated and communicated prognoses among the
232 patients for whom physicians would communicate a
prognosis. The median actual survival of this sample was
26 days, much shorter than either the formulated or the
1100 19 June 2001 Annals of Internal Medicine Volume 134 • Number 12
communicated prognoses; given this short observed survival, physicians’ communicated prognoses would have
overstated actual survival by a factor of 3.5 (90 days/26
days). Figure 2 illustrates the relationship between actual survival and the survival patterns based on the physicians’ formulated and communicated prognoses.
Bivariate analyses showed that physicians’ own estimates of their patients’ survival horizons (their formulated prognoses) predicted their communicated prognoses. As shown in Table 2, patients who would have
had an optimistically discrepant prognosis communicated to them or no prognosis communicated to them
had the shortest anticipated survivals (81 days and 92
days, respectively), those who would have had frank
prognoses communicated to them had intermediate
anticipated survivals (117 days), and those who would
have had pessimistically discrepant prognoses communicated to them had the longest anticipated survivals (128
days) (P " 0.04 for this group of comparisons). In sum,
physicians’ communication of prognoses was related to
the prognoses they formulated. Various patient, physician, and patient–physician relationship variables were
important and significant in bivariate analyses and were
included in our multivariate model (data not shown).
However, we did not include physicians’ estimates of
patient survival (formulated prognosis) in the multivariate model because it was used to define the outFigure 2. Relationship between communicated,
formulated, and actual survival.
The differences between actual survival, formulated survival, and communicated survival in 300 terminally ill patients with cancer are shown.
The median actual survival was 26 days, the median formulated survival
was 75 days, and the median communicated survival was 90 days.
www.annals.org
Prognostic Disclosure
Table 2. Physicians’ Prognostic Disclosure and Estimated
Patient Survival*
Prognostic Communication
Category
Optimistic prognosis
No disclosure
Frank prognosis
Pessimistic prognosis
Total
Mean Formulated
Prognosis
patient, physician, and patient–physician relationship
variables. With increasing patient age, physicians were
more likely to favor frank prognostic disclosure than to
favor no disclosure or pessimistically discrepant disclosure. Each 10-year increase in age was associated with a
34% decrease in the relative odds of no disclosure (OR,
0.66 [CI, 0.48 to 0.91]). Based on typical covariate values, this corresponds to a relative risk (RR) of 0.74;
hereafter, all reported RRs correspond to the typical covariate values. Each 10-year increase in age was also associated with a 40% decrease in the relative odds of a
pessimistically discrepant disclosure (OR, 0.60 [CI, 0.40
to 0.91]; RR, 0.66). As patients’ functional status declined, the likelihood of their physicians’ favoring frank
disclosure rather than pessimistically discrepant disclosure increased; with each incremental increase in numerical ECOG score (representing a decline in performance
status), the relative odds that the patient’s physician
Patients
d
n
81
92
117
128
85
68
111
36
300
Article
* For comparisons between physicians’ mean formulated prognoses and their preferences for prognostic communication, P " 0.04.
come variable (20). Table 1 describes the variation of
patient and physician attributes according to disclosure
category.
Multinomial logistic regression revealed several factors associated with the four prognostic disclosure categories. Table 3 shows odds ratios (ORs) associated with
Table 3. Association of Patient, Physician, and Patient–Physician Characteristics with Physician Preference for
Prognostic Disclosure to Terminally Ill Patients with Cancer*
Characteristics
Patient
Age (per decade)
Male sex
Disease duration
Performance status score
Physician
Upper quartile of practice experience
Female sex
#50% confidence in prediction
Specialty
Hematology–oncology
Other internal medicine subspecialty
Other specialties
Family practice/general practice
Cared for similar patients in past 12
months (10-patient increments)
Referred !2 patients to hospice in the
past quarter
Physician–patient relationship
Duration (10-week units)
Number of contacts in past 3 months
Days since last examination
No Disclosure
Optimistic Disclosure
OR (95% CI)
RR
OR (95% CI)
0.66 (0.48–0.91)
1.85 (0.90–3.80)
1.00 (1.00–1.00)
1.16 (0.78–1.71)
0.74
0.85 (0.65–1.10)
1.79 (0.92–3.47)
1.00 (1.00–1.00)
0.95 (0.68–1.31)
0.60 (0.40–0.91)
1.68 (0.55–5.17)
1.00 (0.99–1.00)
0.58 (0.36–0.92)
2.90 (1.24–6.79)
2.96 (1.00–8.74)
4.42 (1.54–12.65)
2.34
1.18 (0.49–2.89)
2.67 (0.96–7.45)
1.26 (0.38–4.16)
0.94 (0.25–3.52)
16.96 (3.85–74.74)
1.29 (0.22–7.53)
1.86 (0.64–5.45)
1.13 (0.38–3.40)
1.99 (0.33–12.10)
1.04 (0.26–4.18)
0.90 (0.36–2.21)
0.68 (0.25–1.86)
1.21 (0.28–5.26)
2.08 (0.64–6.69)
0.63 (0.15–2.72)
1.19 (0.31–4.60)
0.63 (0.06–6.98)
1.60 (0.24–10.48)
0.98 (0.90–1.08)
0.99 (0.92–1.07)
1.11 (1.01–1.21)
1.11
1.02 (0.42–2.47)
2.14 (1.05–4.34)
11.04 (3.12–39.14)
7.57
1.01 (0.99–1.02)
0.99 (0.97–1.01)
0.99 (0.97–1.01)
1.01 (1.00–1.02)
0.98 (0.96–1.00)
0.99 (0.98–1.00)
3.12
RR
Pessimistic Disclosure
1.47
OR (95% CI)
RR
0.66
0.58
9.00
1.01 (1.00–1.03)
0.97 (0.93–1.00)
0.94 (0.89–0.99)
* The dependent variable has four categories: frank disclosure, no disclosure, optimistic disclosure, and pessimistic disclosure. The latter three are compared with the frank
disclosure category. All dichotomous variables are coded as 0 " absent and 1 " present. This model also contained dummy variables indicating the hospices and the patient’s
ethnicity (white, black, other, or unknown), which are not shown. The omitted (reference) category for physician specialty is geriatrics– general internal medicine.
Performance status is measured on the Eastern Cooperative Oncology Group (ECOG) continuous scale of 0 to 4, with 0 indicating normal activity and 4 indicating
completely bedbound. Relative risk (RRs) for associations with significant odds ratios (ORs) were calculated by using the following covariate values: 60-year-old patient,
patient with an ECOG performance status score of 2, female physician, physician in the upper quartile of practice experience, physician with less than 50% confidence in
his or her prediction, physician with experience treating 13 similar patients, and physician referring two or more patients to hospice in the previous quarter. The baseline
vector of covariates for RR determination is as follows: white female patient, 70 years of age, cancer diagnosis for 32 weeks, ECOG performance status score of 3, 43 weeks
of follow-up, male general internist, physician in the lower 75% of practice experience, physician with more than 50% confidence in his or her prediction and with experience
treating three similar patients, physician who had referred fewer than two patients to a hospice in the past quarter, eight previous contacts between the physician–patient pair,
and last physical examination 7 days before referral.
www.annals.org
19 June 2001 Annals of Internal Medicine Volume 134 • Number 12 1101
Article
Prognostic Disclosure
would favor pessimistically discrepant disclosure over
frank disclosure decreased by 42% (OR, 0.58 [CI, 0.36
to 0.92]; RR, 0.58).
Physicians in the upper quartile of practice experience had nearly three times the odds (OR, 2.90 [CI,
1.24 to 6.79]; RR, 2.34) of favoring no disclosure rather
than frank disclosure. Female physicians were more
likely to favor pessimistically discrepant disclosure (OR,
16.96 [CI, 3.85 to 74.74]; RR, 9.00) than frank disclosure. As physicians’ confidence in their formulated prognoses decreased, their preference for no disclosure increased. For example, physicians whose confidence in
their formulated prognoses was less than 50% had more
than four times the odds of favoring no disclosure over
frank disclosure (OR, 4.42 [CI, 1.54 to 12.65]; RR,
3.12). As physicians’ experience with similarly ill patients increased (as measured by the number of recent
similar patients or recent hospice referrals), so did their
likelihood of favoring some form of nonfrank prognostic
disclosure. For example, with each 10 similar patients
cared for in the past year, the relative odds of the physician’s favoring disclosure of a pessimistically discrepant
prognosis increased by 11% (OR, 1.11 [CI, 1.01 to
1.21]; RR, 1.11). Similarly, physicians who had referred
two or more patients to hospice programs in the past
quarter had 11 times the odds of favoring pessimistically
discrepant disclosure (OR, 11.04 [CI, 3.12 to 39.14];
RR, 7.57) and 2.14 (CI, 1.05 to 4.34; RR, 1.47) times
the odds of favoring optimistically discrepant disclosure
compared with physicians who referred fewer patients.
We evaluated for interactions between physician
specialty and patient ethnicity and between physician
specialty and physician sex but found no important or
significant associations. The interaction terms were not
included in the final model.
DISCUSSION
We found that physicians favored providing frank
survival estimates only 37% of the time to patients with
terminal cancer who had been referred for hospice palliative care and who might request such an estimate.
Furthermore, physicians favored providing an apparently knowingly inaccurate survival estimate for 40.3%
of patients and favored providing no survival estimate
for 22.7% of patients. In short, for all of these patients,
physicians were able and willing to formulate objective
1102 19 June 2001 Annals of Internal Medicine Volume 134 • Number 12
prognoses, whether accurate or not, but had difficulty
communicating them, even to insistent patients. These
results suggest that part of the reported discrepancy between patients and physicians on the issue of prognosis
may relate to physician nondisclosure or optimistic disclosure. In fact, the overall frequency of discrepant overestimation that we report (28%) is similar to that in
previous reports, which found that approximately one
third of patients with cancer overestimated their prognoses compared with their physicians (8, 9).
As shown in Figure 2, physicians’ predictions contain both conscious and unconscious optimism. The
survival prospects that physicians communicate to patients are more optimistic than the survival estimates
they formulate, but even the latter are more optimistic
than patients’ actual survival. This finding regarding the
accuracy of formulated prognoses is not the subject of
the current study but has been examined in previous
research (21–24). Our past work has shown that physicians’ formulated prognoses were accurate only 20% of
the time in patients referred for hospice palliative care
(21). The fact that the formulated and communicated
prognoses differ further supports the contention that
these are distinct behaviors of physicians caring for patients near the end of life, that both are (independently)
prone to error, and that both are relevant to the care
patients might receive. These stepwise optimistic prognoses may cause patients to become twice removed from
their actual survival. Although a median discrepancy of
15 days between the formulated and communicated
prognoses may seem small, we believe that it is important for at least three reasons: 1) It may represent conscious physician behavior; 2) it is relatively large in our
study, representing more than half of the true median
survival of 26 days; and 3) it occurs in addition to an
already overoptimistic formulated prognosis.
What accounts for this lack of support for explicit,
frank verbal communication about prognosis to dying
patients, even when the patients insist on such information? Several facts seem important. First, we found that
physicians with less than 50% confidence in their predictions had four times the odds of favoring no disclosure over frank disclosure compared with more prognostically confident physicians. Some previous research has
suggested that physician confidence is not associated
with prognostic accuracy itself—that is, that physicians
do not accurately perceive their own prognostic abilities
www.annals.org
Prognostic Disclosure
in formulating prognoses (25). Thus, although low confidence does not seem to be associated with prognostic
accuracy, it appears to influence the nature of the prognostic communication by decreasing the physician’s
likelihood of communicating a prognosis to his or her
patient.
Second, we found that physicians in the upper quartile of practice experience favor no disclosure over frank
disclosure and that physicians with previous experience
in the palliative care of dying patients favor disclosure of
knowingly inaccurate pessimistic prognoses rather than
frank prognoses. Additional research is required to clarify why increasing experience might discourage physicians from frank disclosure. One possibility is that the
wisdom born of experience suggests to physicians that it
is best not to provide patients with predictions. This
seems especially likely given the error in physicians’ formulated prognoses, as shown in Figure 2 and elsewhere
(21, 22). Experienced physicians may come to believe
that since they cannot formulate reliable prognoses, why
communicate them? They may also understand their
propensity to err optimistically in formulated prognoses
and try to correct for it by communicating more pessimistic prognoses to patients. However, older physicians
may favor prognostic nondisclosure because of an age–
period– cohort effect; the older physicians in our sample
received their medical education and training in the
1950s and 1960s, a time when nondisclosure of cancer
diagnoses was common, and this may explain their current disclosure styles (26).
Our study has several limitations. First, the assumption that physicians favored providing their patients
with “knowingly inaccurate” prognoses when the formulated and communicated prognoses differed may be
incorrect. The physicians may have forgotten the estimate given to the investigators earlier in the questionnaire, and the difference between what they told the
investigators and what they would favor telling the patients may have been unintentional. The short interval
between the two queries and the asymmetrical pattern of
the discrepancies (optimistic communication substantially predominated) suggest otherwise, however. Second, our categorization of physician preferences for
prognostic disclosure is based on a hypothetical situation
in which a patient insists on receiving a temporally specific prognostic estimate; therefore, it may not reflect
true clinical practice. Third, because the patients in our
www.annals.org
Article
sample had already been referred to hospice palliative
care, an event that has prognostic implications, it is not
known whether our results are generalizable to other
populations. However, if physicians infrequently provide frank disclosure to hospice patients with cancer
who request it, they may be even less likely to provide
it to inquiring nonhospice patients, with or without
cancer. Finally, although our response rate (79.1%) is
higher than that of typical physician surveys (27), it is
still less than 100%. This contributes to the potential
for nonresponse bias and suggests that caution should be
used when generalizing our results.
Our study has several implications. Previous studies
have shown that patients usually want prognoses (4 – 6)
and that they need them in order to make decisions that
are most in keeping with their true preferences for endof-life care (28, 29). Insofar as patients want and need
prognoses, and insofar as the medical profession is committed to respecting patient autonomy, frank communication about prognosis between physicians and inquiring
patients seems optimal. Clearly, however, communication of bad news needs to be handled tactfully and respectfully, and resources are available to guide physicians
in this challenge (11, 30, 31). Our study should not be
taken to support the deplorable practice of “truth
dumping.” Rather, we believe that physicians need to
face the difficulties involved when seriously ill patients
insist on temporally specific prognoses. Armed with
such information, patients might be better able to plan
for, and achieve, the kind of “good death” most Americans say they want (32, 33).
In general, we found that the propensity to avoid
frank disclosure was relatively homogeneously distributed among patients and physicians. That is, most types
of physicians tend to avoid frank disclosure for most
types of patients with cancer. This has implications for
the way we train physicians to break bad news about
serious illness, since it suggests that no specific type of
physician is prone to the behavior we have described and
no specific clinical situation is most problematic.
However, if this type of enhanced communication
between physicians and patients regarding prognoses at
the end of life is to be of real use to patients, the medical
profession will clearly need to improve the science of
prognostication, allowing fewer errors in the formulated
prognosis. What good does it do to encourage physicians to communicate information that is, after all, in19 June 2001 Annals of Internal Medicine Volume 134 • Number 12 1103
Article
Prognostic Disclosure
accurate? Several methods are available for enhancing
the accuracy of formulated prognoses, including using
statistical algorithms, averaging prognoses made by several physicians, and consulting more experienced colleagues or textbooks (21, 34, 35).
Studies show that although patients with cancer
want their physicians to provide detailed prognoses, they
also want their physicians to give them good news and
to be optimistic about their illnesses (4, 11, 36). The
paucity of frank disclosure seen in our study, for patients
in whom prognostic communication should theoretically present relatively few challenges, may indicate
the impossibility of this task. Nevertheless, physicians
report that they do not support frank disclosure for
most patients with terminal cancer who request specific
prognoses.
From University of Chicago Medical Center, Chicago, Illinois.
Acknowledgments: The authors thank Tammy Polonsky and Ellena
Linden for help in administering the survey and Ron Thisted and
Melinda Drum for statistical consultation.
Grant Support: By the Soros Foundation Project on Death in America
Faculty Scholars Program (Dr. Christakis), the Robert Wood Johnson
Clinical Scholars Program (034652) (Dr. Lamont), and the National
Institutes of Health (K12 AG-0048-09) (Dr. Lamont).
Requests for Single Reprints: Nicholas A. Christakis, MD, PhD,
MPH, University of Chicago Medical Center, 5841 South Maryland
Avenue, MC 2007, Chicago, IL 60637; e-mail, nchrista@medicine
.bsd.uchicago.edu.
Current Author Addresses: Drs. Lamont and Christakis: University of
Chicago Medical Center, 5841 South Maryland Avenue, MC 2007,
Chicago, IL 60637.
Author Contributions: Conception and design: N.A. Christakis.
Analysis and interpretation of the data: E.B. Lamont, N.A. Christakis.
Drafting of the article: E.B. Lamont, N.A. Christakis.
Critical revision of the article for important intellectual content: E.B.
Lamont, N.A. Christakis.
Final approval of the article: E.B. Lamont, N.A. Christakis.
Provision of study materials or patients: N.A. Christakis.
Statistical expertise: E.B. Lamont, N.A. Christakis.
Obtaining of funding: E.B. Lamont, N.A. Christakis.
Administrative, technical, or logistic support: N.A. Christakis.
Collection and assembly of data: E.B. Lamont, N.A. Christakis.
1104 19 June 2001 Annals of Internal Medicine Volume 134 • Number 12
References
1. Fitts WT, Ravdin IS. What Philadelphia physicians tell patients with cancer.
JAMA. 1953;153:901-4.
2. Oken D. What to tell cancer patients. A study of medical attitudes. JAMA.
1961;175:1120-8.
3. Novack DH, Plumer R, Smith RL, Ochitill H, Morrow GR, Bennett JM.
Changes in physicians’ attitudes toward telling the cancer patient. JAMA. 1979;
241:897-900. [PMID: 762865]
4. Kutner JS, Steiner JF, Corbett KK, Jahnigen DW, Barton PL. Information
needs in terminal illness. Soc Sci Med. 1999;48:1341-52. [PMID: 10369435]
5. Degner LF, Kristjanson LJ, Bowman D, Sloan JA, Carriere KC, O’Neil J, et
al. Information needs and decisional preferences in women with breast cancer.
JAMA. 1997;277:1485-92. [PMID: 9145723]
6. Davison BJ, Degner LF, Morgan TR. Information and decision-making preferences of men with prostate cancer. Oncol Nurs Forum. 1995;22:1401-8.
[PMID: 8539181]
7. Blanchard CG, Labrecque MS, Ruckdeschel JC, Blanchard EB. Information
and decision-making preferences of hospitalized adult cancer patients. Soc Sci
Med. 1988;27:1139-45. [PMID: 3206248]
8. Mackillop WJ, Stewart WE, Ginsburg AD, Stewart SS. Cancer patients’
perceptions of their disease and its treatment. Br J Cancer. 1988;58:355-8.
[PMID: 2460120]
9. Eidinger RN, Schapira DV. Cancer patients’ insight into their treatment,
prognosis, and unconventional therapies. Cancer. 1984;53:2736-40. [PMID:
6326993]
10. Weeks JC, Cook EF, O’Day SJ, Peterson LM, Wenger N, Reding D, et al.
Relationship between cancer patients’ predictions of prognosis and their treatment preferences. JAMA. 1998;279:1709-14. [PMID: 9624023]
11. Christakis NA. Death Foretold: Prophecy and Prognosis in Medical Care.
Chicago: Univ of Chicago Pr; 1999.
12. Christakis NA, Iwashyna TJ. Impact of individual and market factors on
the timing of initiation of hospice terminal care. Med Care. 2000;38:528-41.
[PMID: 10800979]
13. Christakis NA, Escarce JJ. Survival of Medicare patients after enrollment in
hospice programs. N Engl J Med. 1996;335:172-8. [PMID: 8657216]
14. Zubrod GC, Schneiderman M, Frei E, Brindley C, Gold GL, Shnider B, et
al. Appraisal of methods for the study of chemotherapy in man: comparative
therapeutic trial of nitrogen and mustard and triethylene thiophosphoramide.
Journal of Chronic Disease. 1960;11:7-33.
15. Agresti A. Categorical Data Analysis. New York: J Wiley; 1990:205-11.
16. McCullagh P, Nelder JA. Generalized Linear Models. 2nd ed. New York:
Chapman & Hall; 1999:125-9.
17. Altman DG, Deeks JJ, Sackett DL. Odds ratios should be avoided when
events are common [Letter]. BMJ. 1998;317:1318. [PMID: 9804732]
18. Zhang J, Yu KF. What’s the relative risk? A method of correcting the odds
ratio in cohort studies of common outcomes. JAMA. 1998;280:1690-1. [PMID:
9832001]
19. Davies HT, Crombie IK, Tavakoli M. When can odds ratios mislead? BMJ.
1998;316:989-91. [PMID: 9550961]
20. Firebaugh G, Gibbs JP. User’s guide to ratio variables. American Sociological
Review. 1985;50:713-22.
21. Christakis NA, Lamont EB. Extent and determinants of error in doctors’
prognoses in terminally ill patients: prospective cohort study. BMJ. 2000;320:
469-72. [PMID: 10678857]
22. Parkes CM. Accuracy of predictions of survival in later stages of cancer.
Br Med J. 1972;2:29-31. [PMID: 4111472]
www.annals.org
Prognostic Disclosure
23. Forster LE, Lynn J. Predicting life span for applicants to inpatient hospice.
Arch Intern Med. 1988;148:2540-3. [PMID: 3196122]
24. Evans C, McCarthy M. Prognostic uncertainty in terminal care: can the
Karnofsky index help? Lancet. 1985;1:1204-6. [PMID: 2860399]
25. Connors AF, Dawson NV, Speroff T, Arkes H, Knaus WA, Harrell FE, et
al. Physicians’ confidence in their estimates of the probability of survival: relationship to accuracy [Abstract]. Med Decis Making. 1992;12:336.
26. Hobcraft J, Menken J, Preston S. Age, period and cohort effects in demography: a review. In: Mason WM, Fienberg SE, eds. Cohort Analysis in Social
Research: Beyond the Identification Problem. New York: Springer-Verlag; 1985:
89-136.
27. Asch DA, Jedrziewski MK, Christakis NA. Response rates to mail surveys
published in medical journals. J Clin Epidemiol. 1997;50:1129-36. [PMID:
9368521]
28. Frankl D, Oye RK, Bellamy PE. Attitudes of hospitalized patients toward life
support: a survey of 200 medical inpatients. Am J Med. 1989;86:645-8. [PMID:
2729313]
29. Murphy DJ, Burrows D, Santilli S, Kemp AW, Tenner S, Kreling B, et al.
The influence of the probability of survival on patients’ preferences regarding
cardiopulmonary resuscitation. N Engl J Med. 1994;330:545-9. [PMID:
8302322]
30. Billings JA. Sharing bad news. In: Billings JA. Outpatient Management of
Article
Advanced Cancer: Symptom Control, Support, and Hospice-in-the-Home. Philadelphia: Lippincott; 1985.
31. Buckman R. How to Break Bad News: A Guide for Health Care Professionals. Baltimore: Johns Hopkins Univ Pr; 1992.
32. Steinhauser KE, Christakis NA, Clipp EC, McNeilly M, McIntyre L, Tulsky JA. Factors considered important at the end of life by patients, family, physicians, and other care providers. JAMA. 2000;284:2476-82. [PMID: 11074777]
33. Steinhauser KE, Clipp EC, McNeilly M, Christakis NA, McIntyre LM,
Tulsky JA. In search of a good death: observations of patients, families, and
providers. Ann Intern Med. 2000;132:825-32. [PMID: 10819707]
34. Knaus WA, Harrell FE, Lynn J, Goldman L, Phillips RS, Connors AF, et
al. The SUPPORT prognostic model. Objective estimates of survival for seriously
ill hospitalized adults. Study to understand prognoses and preferences for outcomes and risks of treatments. Ann Intern Med. 1995;122:191-203. [PMID:
7810938]
35. Poses RM, Bekes C, Winkler RL, Scott WE, Copare FJ. Are two (inexperienced) heads better than one (experienced) head? Averaging house officers’
prognostic judgments for critically ill patients. Arch Intern Med. 1990;
150:1874-8. [PMID: 2393319]
36. Christakis NA, Iwashyna TJ. Attitude and self-reported practice regarding
prognostication in a national sample of internists. Arch Intern Med. 1998;158:
2389-95. [PMID: 9827791]
I am very much against the inclusion of any cigarettes in the ration. Apart from
the very real objection to the continuous coughing and expectorating they cause,
they do, in fact, give rise to the very evils they are supposed to alleviate. They are
supposed to soothe the nerves, and one cigarette undoubtedly has this effect, but
the habit of smoking promotes irritability and makes its victim unable to do without
it. Since, in campaigns of this nature, men cannot depend on a constant supply of
cigarettes they are ill advised to pursue the habit. From my own experience the habit
can be abandoned and not missed a month afterwards . . . Doctors’ recommendations
on this subject are biased as they are all inveterate smokers.
John Bierman and Colin Smith
Fire in the Night: Wingate of Burma, Ethiopia and Zion
New York: Random House; 1999:261
Submitted by:
A.M. Clarfield, MD, FRCPC
Sara Herzog Hospital
Jerusalem, Israel 91351
Submissions from readers are welcomed. If the quotation is published, the sender’s name will be
acknowledged. Please include a complete citation (along with page number on which the quotation was
found), as done for any reference.–The Editor
www.annals.org
19 June 2001 Annals of Internal Medicine Volume 134 • Number 12 1105


© Copyright 2026