
EXCLUDED AND INVISIBLE THE STATE OF THE WORLD’S CHILDREN 2006
THE STATE OF THE WORLD’S CHILDREN 2006
EXCLUDED
AND INVISIBLE
THE STATE OF THE
WORLD’S CHILDREN
2006
© The United Nations Children’s Fund (UNICEF), 2005
Permission to reproduce any part of this publication
is required. Please contact the Editorial and
Publications Section, Division of Communication,
UNICEF NY (3 UN Plaza, NY, NY 10017) USA,
Tel: 212-326-7434 or 7286, Fax: 212-303-7985,
E-mail: [email protected]. Permission
will be freely granted to educational or non-profit
organizations. Others will be requested
to pay a small fee.
ISBN-13: 978-92-806-3916-2
ISBN-10: 92-806-3916-1
The Library of Congress has catalogued
this serial publication as follows:
The State of the World’s Children 2006
UNICEF, UNICEF House, 3 UN Plaza,
New York, NY 10017, USA
E-mail: [email protected]
Website: www.unicef.org
Cover photo: © UNICEF/HQ94-1393/Shehzad Noorani
Acknowledgements
This report would not have been possible without the advice and contributions of many inside
and outside of UNICEF who provided helpful comments and made other contributions. Significant
contributions were received from the following UNICEF field offices: Albania, Armenia, Bolivia,
Botswana, Brazil, Burkina Faso, Cambodia, Cameroon, China, Colombia, Dominican Republic,
Ecuador, Egypt, Guinea-Bissau, Jordan, Kenya, Kyrgyzstan, Madagascar, Malaysia, Mexico,
Myanmar, Nepal, Nigeria, Occupied Palestinian Territory, Pakistan, Papua New Guinea, Peru,
Republic of Moldova, Serbia and Montenegro, Sierra Leone, Somalia, Sudan, The former Yugoslav
Republic of Macedonia, Uganda, Ukraine, Uzbekistan, Venezuela and Viet Nam. Input was also
received from Programme Division, Division of Policy and Planning and Division of Communication
at Headquarters, UNICEF regional offices, the Innocenti Research Centre, the UK National
Committee and the US Fund for UNICEF.
Sincere thanks to Hanna Polak, Elena Poniatowska and Bethany Stevens for their special
contributions.
EDITORIAL
Patricia Moccia, Editor-in-Chief; David Anthony, Editor; Chris Brazier, Principal Writer;
Hirut Gebre-Egziabher; Paulina Gruszczynski; Tamar Hahn; Annalisa Orlandi; Meredith Slopen.
POLICY GUIDANCE
Elizabeth Gibbons, Chief, Global Policy Section, Division of Policy and Planning;
David Stewart, Senior Policy Advisor, Global Policy Section.
STATISTICAL TABLES
Trevor Croft, Chief, Statistical Information Section, Division of Policy and Planning;
Nyein Nyein Lwin; Edilberto Loaiza; Mary Mahy; Tessa Wardlaw, Sandi Zinmaw.
PRODUCTION AND TRANSLATION
Jaclyn Tierney, Production Editor; Allyson Alert; Marc Chalamet; Emily Goodman; Amy Lai;
Najwa Mekki; Lisa Mullenneaux; Carlos Perellón; Catherine Rutgers; Edward Ying, Jr.
PHOTO RESEARCH
Ellen Tolmie, Photography Editor; Nicole Toutounji.
COVER DESIGN
Michelle Siegel, Design Manager; Maggie Dich.
MAPS
National Geographic Society Mapping Services; Boris De Luca.
DESIGN AND PREPRESS PRODUCTION
Prographics, Inc.
PRINTING
Brodock Press
DISTRIBUTION
Aaron Nmungwun, Distribution Manager; Elias Salem; Chetana Hein.
THE STATE
OF THE
WORLD’S
CHILDREN
2006
1
2
Contents
Forewords
Kofi A. Annan
Secretary-General
of the United Nations ................vi
Ann M. Veneman
Executive Director, UNICEF ......vii
Chapter 1 ................................................1
Chapter 2 ..............................................11
Our Commitments to
Children
The Root Causes of
Exclusion
Summary ....................................................1
Summary..................................................11
PANELS
The Millennium Development Goals
are the central development objectives
of the Millennium agenda........................2
PANELS
Why children in the least developed
countries risk missing out......................13
Defining exclusion and invisibility
of children..................................................7
Chapter 3 ..............................................35
Chapter 4 ..............................................59
Chapter 5 ..............................................85
References ............................................89
Statistical Tables ..................................95
General note on the data ................96
Under-five mortality
rankings ..........................................97
Table 1: Basic Indicators ..................98
Table 2: Nutrition ............................102
Table 3: Health ................................106
Table 4: HIV/AIDS ............................110
Table 5: Education ..........................114
Table 6: Demographic
Indicators........................................118
Table 7: Economic Indicators ........122
Table 8: Women ..............................126
Table 9: Child Protection ................130
Summary Indicators ......................132
Measuring human development ..133
Table 10: The Rate of
Progress ........................................134
Index ....................................................138
Glossary ..............................................143
UNICEF Offices ....................................144
iv
FIGURES
1.1 Meeting the MDGs would transform
millions of children's lives in the
next 10 years ......................................4
1.2 Global progress towards reducing
under-five mortality by two thirds ....5
1.3 At current rates of progress on
the MDGs, millions of children
who could have been reached
will miss out........................................5
MAP
Education for All ......................................8
Income disparities and
child survival..........................................20
The marginalization of Roma
communities and their children ............24
Living with disability
by Bethany Stevens................................26
The Global Campaign on
Children and AIDS ..................................30
FIGURES
2.1 The least developed countries are
the richest in children ......................12
2.2 Children living in the poorest
countries are most at risk of
missing out on primary and
secondary school..............................14
2.3 Most of the countries where
1 in 5 children die before five have
experienced major armed conflict
since 1999..........................................14
2.4 ‘Fragile’ States are among the
poorest ..............................................15
2.5 Children account for an
increasing proportion of people
living with HIV ..................................16
2.6 In several regions, girls are more
likely to miss out on primary
school than boys ..............................19
MAP
A Decent Standard of Living ..................32
3
4
5
Invisible Children
Including Children
Working Together
Summary..................................................35
Summary..................................................59
Summary..................................................85
PANELS
Children of the streets
by Elena Poniatowska ............................42
Children and young people in
detention in Nigeria................................44
Early marriage and fistula......................47
The protective environment ..................52
The links between child protection
and the Millennium Development
Goals........................................................53
PANELS
Statistical tools for monitoring the
Millennium agenda for children............61
PANELS
UNGEI: Making the goal of gender
equality in education a reality................87
FIGURES
3.1 Birth registration in the developing
world..................................................37
3.2 Orphaned children under age 18 in
sub-Saharan Africa, Asia and Latin
America and the Caribbean ............40
3.3 Early marriage in the developing
world..................................................46
3.4 Total economic costs and benefits
of eliminating child labour over the
period 2000-2020 ..............................48
3.5 Forced commercial sexual
exploitation........................................49
3.6 Child labour in the developing
world..................................................50
3.7 Children in unconditional
worst forms of child labour
and exploitation................................51
MAP
Protecting Childhood..............................56
Monitoring the effectiveness of
budgets in meeting children’s rights
in South Africa ........................................66
The Child Rights Index: Assessing
the rights of children in Ecuador
and Mexico..............................................70
UNICEF principles and guidelines for
ethical reporting on children ................76
Child labour and corporate social
responsibility: The UNICEF-IKEA
project to combat child labour ..............78
Film-makers shine light on the lives
of excluded and invisible children ........80
FIGURES
4.1 Status of ratification of major
international treaties ........................63
4.2 Budgeting for a child’s right to
protection and development in
Zambia, 1991-2001............................65
4.3 Main activities of faith-based
organizations for orphans and
vulnerable children in southern
and eastern African countries..........73
MAP
Our Common Future ..............................82
Excluded and Invisible
v
© UN/DPI/Sergey Bormeniev
Message
from the United Nation
Secretary-General
of the United Nations
Since its inception, the United Nations has sought to build a better, safer, more peaceful world for the world’s
children and to press governments to uphold their responsibilities for the freedom and well-being of their
young citizens.
As we mark the UN’s 60th anniversary by reaffirming our commitment to the Millennium Declaration and the
Millennium Development Goals, we also reaffirm the centrality of children in our efforts. It is for future
generations, even more than our own, that the United Nations exists.
The publication of this year’s State of the World’s Children coincides with the beginning of UNICEF’s 60th
year. The report sheds light on lives in a world that is often hidden or neglected – a world of vulnerability and
exclusion. And it calls on all of us to speak up for the rights of children and to act on behalf of those who need
our protection.
Five years into our work on the Millennium Development Goals, we can see the many ways in which the goals
are about children. If we can get it right for children – if we can deliver on our commitments and enable every
child to enjoy the right to a childhood, to health, education, equality and protection – we can get it right for
people of all ages. I believe we can.
Kofi A. Annan
Secretary-General of the United Nations
vi
Foreword
© UNICEF/HQ05-0653/Nicole Toutounji
In the past, UNICEF’s annual State of the World’s Children report has
focused on specific issues such as HIV/AIDS, girls’ education, nutrition,
child labour and early childhood development. The cumulative story is
one of tremendous advances for children, but there are also areas
where progress is still vitally needed.
This year’s report highlights the millions of children who have not been
the beneficiaries of past gains, the ones who are excluded or ‘invisible’.
These are children without adequate access to education, to life-saving
vaccines, to protection. Despite enormous efforts to reach children with
needed services, millions continue to die every year.
The world has agreed upon a road map to a better future in the form of the Millennium Development Goals
(MDGs), which stem from the Millennium Declaration, adopted in 2000 by 189 countries. The goals set
quantitative targets to address extreme poverty and hunger, child and maternal mortality and HIV/AIDS and
other diseases, while promoting universal primary education, gender equality, environmental sustainability and
a global partnership for development by 2015. The MDGs serve as a framework to make the Millennium
Declaration’s vision of a world of peace, security, solidarity and shared responsibility a reality.
We are at a critical juncture in international efforts to achieve this vision. The stakes are high: If the MDGs are
met, an estimated 500 million people will escape poverty by 2015; 250 million will be spared from hunger; and
30 million children, who would not have lived past their fifth birthday, will survive.
Each of the MDGs is connected to the well-being of children – from eradicating extreme poverty and hunger to
providing clean drinking water. Failure to achieve these goals would have devastating consequences for the
children of this generation and for the adults they will become if they survive their childhoods.
At current rates of progress, for example, some 8.7 million children under five will die in 2015. However, if the
goal to reduce child mortality is met, an additional 3.8 million of those lives would be saved. Meeting the goals
is, therefore, a matter of life or death – of progress or a step backward – for millions of children. It will also be
crucial to the development of children’s countries and societies.
Our focus on meeting the MDGs, however, must not overlook the millions of children who, even if the goals are met,
will be left out. These are the children most in need: the poorest, the most vulnerable, the exploited and the abused.
Reaching these children – many of whom are currently beyond the reach of laws, programmes, research and
budgets – is a challenge. And yet, meeting our commitments to children will be possible only if we approach
the challenge head-on.
The MDGs are a catalyst for improved access to essential services, protection and participation for children,
but they are not an end in themselves. Children around the globe deserve our commitment and dedication to
helping provide them with a better world in which to live.
Ann M. Veneman
Executive Director
United Nations Children’s Fund
vii
1
Our Commitments to Children
T H E S TAT E O F T H E W O R L D ’ S C H I L D R E N 2 0 0 6
A Millennium agenda for children
Millions of children make their way through
life impoverished, abandoned, uneducated,
malnourished, discriminated against, neglected and vulnerable. For them, life is a
daily struggle to survive. Whether they live
in urban centres or rural outposts, they risk
missing out on their childhood1 – excluded
from essential services such as hospitals and
schools, lacking the protection of family and
community, often at risk of exploitation and
abuse. For these children, childhood as a
time to grow, learn, play and feel safe is, in
effect, meaningless.
© UNICEF/Zambia/2003/François d’Elbee
It is hard to avoid the conclusion that
we, the adults of the world, are failing in
our responsibility to ensure that every child
enjoys a childhood. Since 1924, when the
League of Nations adopted the Geneva
Declaration of the Rights of the Child, the
international community has made a series
of firm commitments to children to ensure
that their rights – to survival, health, education, protection and participation, among
others – are met.
The most far-reaching and comprehensive
of these commitments is the Convention
on the Rights of the Child, adopted by the
UN General Assembly in 1989 and ratified
by 192 countries. As the most widely
endorsed human rights treaty in history,
the Convention, together with its Optional
Protocols, lays out in specific terms the legal
duties of governments to children. Children’s
survival, development and protection are
now no longer matters of charitable concern
but of moral and legal obligation. Governments are held to account for their care of
children by an international body, the
Committee on the Rights of the Child, to
which they have agreed to report regularly.
In recent years, world leaders have not only
reaffirmed and expanded these commitments
SUMMARY
ISSUE: Meeting the Millennium Development Goals (MDGs) and the
broader aims of the Millennium Declaration would transform the lives
of millions of children, who would be spared illness and premature
death, escape extreme poverty and malnutrition, gain access to safe
water and decent sanitation facilities and complete primary schooling.
Though some regions and countries have fallen behind on the goals,
they can still be met.
The Member States of the United Nations are committed to meeting
the MDGs and have coalesced around a set of key initiatives to accelerate progress (see below). Putting these initiatives into practice will
demand renewed commitment to the Millennium agenda and additional resources. It will also require a much stronger focus on reaching
those children currently excluded from essential services and denied
protection and participation. Unless many more of these children are
reached, several of the MDGs – particularly the goal on universal primary education – will simply not be met on time or in full.
The children who are hardest to reach include those living in the
poorest countries and most deprived communities within countries and
those facing discrimination on the basis of gender, ethnicity, disability
or belonging to an indigenous group; children caught up in armed conflict or affected by HIV/AIDS; and children who lack a formal identity,
who suffer child protection abuses or who are not treated as children.
These children, the factors that exclude them and make them invisible,
and the actions that those responsible for their well-being must take to
safeguard and include them are the focus of The State of the World’s
Children 2006.
ACTION: To meet the Millennium Development Goals for children,
including the excluded and the invisible, the following is required:
• A massive push is needed to boost access to essential services for
those children and their families currently missing out. This includes
immediate interventions – dubbed ‘quick impact initiatives’ – that can
provide a vital kick-start to human development and poverty reduction.
• Longer-term initiatives that are rooted in a human rights-based
approach to development – many of which are already under way –
must be stepped up or launched at the same time as the immediate
interventions, helping to ensure that the latter are as effective as
possible. Building up national capacities, through strategies led by
national governments and local communities, is the best way to
ensure the sustainability of these initiatives over the longer term.
• Deeper approaches must be taken that give special attention to the
most vulnerable. This requires the participation of governments –
through legislation, budgets, research and programmes – along
with donors, international agencies, civil society and the media to
reach children who are most at risk of missing out on the
Millennium agenda.
1
but have also set specific time-bound goals
as a framework for meeting them. The
latest such commitments were made at the
Millennium Summit in September 2000,
from which the Millennium Declaration
and, subsequently, the Millennium
Development Goals (MDGs) emerged,
and at the UN General Assembly’s Special
Session on Children in May 2002, which
resulted in the outcome document ‘A World
Fit for Children’. These two compacts complement each other and, taken together,
form a strategy – a Millennium agenda –
for protecting childhood in the opening
years of the 21st century.
This year, The State of the World’s Children
will focus on the millions of children for
The Millennium Development Goals are the central development
objectives of the Millennium agenda
GOALS
1. Eradicate extreme hunger
and poverty
TARGETS, 2015
Reduce by half the proportion of people living on less than a
dollar a day
Reduce by half the proportion of people who suffer from hunger
2. Achieve universal primary
education
Ensure that all boys and girls complete a full course
of primary schooling
3. Promote gender equality
and empower women
Eliminate gender disparity in primary and secondary
education preferably by 2005, and at all levels by 2015
4. Reduce child mortality
Reduce by two thirds the mortality rate among children under five
5. Improve maternal health
Reduce by three quarters the maternal mortality ratio
6. Combat HIV/AIDS, malaria
and other diseases
Halt and begin to reverse the spread of HIV/AIDS. Halt and begin to
reverse the incidence of malaria and other major diseases
7. Ensure environmental
stability
Reduce by half the proportion of people without sustainable
access to safe drinking water
Achieve a significant improvement in the lives of at least
100 million slum dwellers by 2020
Integrate the principles of sustainable development into country
policies and programmes; reverse loss of environmental resources
8. Develop a global
partnership for development
Develop further an open trading and financial system that is rule-based,
predictable and non-discriminatory and that includes a commitment to
good governance, development and poverty reduction – nationally and
internationally
Address the least developed countries’ special needs, and the special
needs of landlocked and Small Island Developing States
Deal comprehensively with developing countries’ debt problems
through national and international measures to make debt sustainable
in the long term
In cooperation with the developing countries, develop decent and
productive work for youth
In cooperation with pharmaceutical companies, provide access to
affordable essential drugs in developing countries
In cooperation with the private sector, make available the benefits of
new technologies – especially information and communications
technologies
Sources: Adapted from United Nations, Millennium Declaration, 2000 and other UN sources.
2
T H E S TAT E O F T H E W O R L D ’ S C H I L D R E N 2 0 0 6
© UNICEF/HQ01-0540/Shehzad Noorani
whom these pledges of a better world
remain unfulfilled. The report assesses
global efforts to realize the MDGs, the central development targets of the agenda, and
demonstrates the marked impact that their
achievement would have on children’s lives
and future generations. It also explains how,
with the MDGs focused on national averages, children in marginalized communities
risk missing out on essential services such
as health care, education and protection.
It argues that children denied their right to
a formal identity, suffering child protection
abuses or facing early marriage, armed
combat and hazardous labour are among
those most at risk of exclusion from the
Millennium agenda.
Reaching the MDGs should benefit not only
the better off, but also those children who
are most in need, whose rights are most
abused and undervalued and who are
currently excluded from services, marginalized and unprotected by society and
the state. This is a report about those
children and ways to include them in
the Millennium agenda.
The Millennium agenda
and children
Seeking to promote human progress
through achievable goals
The Millennium Declaration is both visionary and pragmatic. Its vision is a world of
peace, equity, tolerance, security, freedom,
solidarity, respect for the environment and
shared responsibility in which special care
and attention is given to the vulnerable,
especially children.2 Its pragmatism lies in
its central premise: Human development
and poverty reduction are prerequisites for
such a world, but progress towards them, in
practical terms, is best made through specific, time-bound objectives that do not permit
governments simply to pass on responsibility to future administrations and generations.
Central to the agenda is a series of concrete
objectives for human development, the
MDGs, with a deadline of 2015 for the
accomplishment of several major development concerns: child survival, poverty,
hunger, education, gender equality and
empowerment, maternal health, safe water,
OUR COMMITMENTS TO CHILDREN
3
HIV/AIDS, malaria and other major
diseases, among other objectives.
Many of these goals share similar objectives
to those set at the 1990 World Summit for
Children, and every one of the MDGs is
connected to the well-being of children –
from eradicating extreme poverty and
hunger to protecting the environment for
future generations. Furthermore, the MDGs
have unified the international community
around a set of common development goals,
creating a rare opportunity to improve the
lives of children, who now make up more
than 40 per cent of the developing world’s
population and half the population in the
least developed countries.3
‘A World Fit for Children’ endorses all the
ambitions of the Millennium Declaration
and the MDGs. It enriches the Millennium
agenda by emphasizing the importance of
taking actions in the best interests of children to ensure that children are put first,
that every child is taken care of and that no
child is left out.4 The compact is based on
four main axes. The first, second and fourth
seek to promote healthy lives, provide quality education and combat HIV/AIDS, respectively. In effect, they articulate subtargets
and courses of action that will help achieve
the MDGs for children. The third axis
addresses protection for children against
conflict and all forms of abuse, exploitation
and violence. As this report attests, the lack
of these protections not only undermines a
child’s well-being, but also increases the risk
of exclusion from essential services.5
Meeting the Millennium
Development Goals
Reaching the MDGs will improve the lives
and prospects of millions of children
Achievement of the MDGs, though not a
panacea for childhood’s ills, would certainly
go a long way towards making the world a
better place for children. Simply put, if the
goals are met over the next 10 years, millions
of children will be spared illness, premature
death, extreme poverty or malnutrition and
will enjoy good-quality schooling, as well as
access to safe water and decent sanitation
facilities (see Figure 1.1).
The implications for children of missing
the MDGs would be grave
Missing the MDGs would have devastating
implications for the children of this generation, and for the adults they will become if
they survive their childhoods. At current
rates of progress, for example, 8.7 million
Figure 1.1: Meeting the MDGs would transform millions of children's
lives in the next 10 years
300
300
Millions of children
250
These projections refer to the number of children
who would gain access to essential services
between now and 2015 if the MDGs are met.
200
150
115
100
100
60
50
5.5
0
Children gaining
access to improved
sanitation by 2015
Children gaining
access to an
improved water
source by 2015
Under-fives gaining
access to adequate
nutrition by 2015
Children gaining
access to primary
education by 2015
Under-fives’ lives
saved in 2015 alone
Source: UNICEF projections based on data in Statistical Tables 1-10, pp. 95-137 of this report. Notes on the methodology
employed can be found in the References section, p. 89.
4
T H E S TAT E O F T H E W O R L D ’ S C H I L D R E N 2 0 0 6
Figure 1.2: Global progress towards reducing under-five mortality by two thirds*
At current rates of progress the goal will be reached 30 years late
Deaths per 1,000 live births
100
If trends in the
1990s roughly
continue, the goal
will not be met
until 2045.
80
60
Actual change
in U5MR
40
X
Global target
(35 per 1,000
live births)
When goal
should be met
20
0
1990
2004
2015
2030
2045
2055
*Trends relate to developing countries only. For a list of developing countries, see p. 132.
Source: UNICEF projections based on under-five mortality data in Statistical Table 1, p. 101 of this report. Notes on
methodology employed can be found in the References section, p. 89.
children under five will still die in 2015,
whereas if the target were met 3.8 million
of those lives would be saved in that year
alone.6 Similar calculations can be made for
most of the other MDGs (see Figure 1.3).
Meeting the goals is, therefore, a matter of
life or death, of development or regression,
for millions of children. It will also be
crucial to the progress of their countries
and societies.
The generational implications of missing
the targets would also be grave. Children in
the early years are particularly vulnerable:
Deprivation at this stage affects human
beings throughout their whole life cycle.
Those who are neglected or abused in the
first years of life suffer damage from which
they may never fully recover and that
may prevent them from reaching their full
potential as older children, adolescents and
Figure 1.3: At current rates of progress on the MDGs, millions of children
who could have been reached will miss out
200
Millions of children
170
These projections refer to the number of children
who could have enjoyed access to essential services
if the MDGs had been met, but are set to miss out if
current trends continue.
150
100
80
70
50
50
3.8
0
Children who could
have had access to
improved sanitation
by 2015
Children who could
have had access to
an improved
water source
by 2015
Under-fives who
could have enjoyed
adequate nutrition
by 2015
Primary-school-age Under-fives whose
children still missing lives could have been
out on primary
saved in 2015 alone
education in 2005
Source: UNICEF projections based on data in Statistical Tables 1-10, pp. 95-137 of this report. Notes on the methodology
employed can be found in the References section, p. 89.
OUR COMMITMENTS TO CHILDREN
5
eventually as adults. Malnutrition not only
weakens children physically, it also impairs
their ability to learn. Those who do not
complete primary school are less likely to
have the literacy, numeracy and cognitive
skills that improve their prospects of earning a decent income in adulthood. Children
orphaned by HIV/AIDS are also at risk of
missing out on school and the protection of
a family that is an essential element of their
development. Those subjected to violence,
abuse or exploitation may endure psychosocial trauma that can affect them throughout their adult lives.
But it is not only these children who will
suffer. Countries struggle to develop when
their citizens grow up malnourished, poorly
educated or ravaged by disease. These factors
perpetuate poverty and low productivity
and may lead to instability or even spill
over into violence and armed conflict. The
healthy development of children not only
safeguards their own well-being, it is also
the best guarantee of the future peace, prosperity and security that are central ambitions
of the Millennium agenda.
The MDGs can be achieved – but urgent
action is required
Though global progress towards the goals
since 2000 has fallen below aspirations in
some regions and countries, there is a broad
consensus that they can still be achieved – in
full and on time – provided that the necessary political will is demonstrated and the
appropriate action taken.
Over the course of 2005, the Member States
of the United Nations have coalesced
around a set of key initiatives to accelerate
progress towards the MDGs and to ensure
that the gains made are sustainable and irreversible. These recommendations form a
two-pronged strategy. First, a massive push
must boost access to essential services for
those children and families currently missing
out. These immediate interventions –
dubbed ‘quick impact initiatives’ – are outlined in detail in the 2005 report of the
Millennium Project, recommended in the
UN Secretary-General’s report, and were
endorsed by world leaders at the 2005
World Summit.7 If implemented, they can
6
provide a vital kick-start to human development and poverty reduction.
But they are only an initial step. Longerterm initiatives that are rooted in a human
rights-based approach to development,
many of which are already under way, must
be stepped up or launched at the same time
as the immediate interventions. This will
help ensure that the immediate interventions
are as effective as possible. Experience has
shown that top-down, supply-driven
approaches to development, though often
effective at increasing access to essential
services and goods in the short to medium
term, are not sustainable in the longer term.
If national capacities are not built up and
processes are not driven by national governments and local communities, even those
interventions that are initially successful risk
failure when international assistance diminishes or political priorities change.
The Millennium agenda:
A beginning, not an end
The Millennium agenda is a key
step towards meeting our commitments
to children in the 21st century
Adopting the recommended immediate
interventions and longer-term initiatives will
increase the chances that the MDGs will be
met by 2015. But in spite of the comprehensive nature of these strategies, there are millions of children who may not be reached
by these initiatives alone. These are the children who are currently beyond the reach of
laws, budgets, programmes, research and,
often, the governments, organizations and
individuals seeking to fulfil their rights. Not
only do these children face exclusion from
essential health-care services, education, safe
drinking water and decent sanitation in the
present, they are also likely to face exclusion
from full participation in society as adults.
Many of them suffer from protection violations that heighten the risk of their exclusion and make them, in effect, invisible.
As this report will attest, only deeper
approaches to child development, with
special attention given to the most vulnerable children, will enable us to fulfil our
commitments to children and ensure that
the MDGs benefit the poorest.
T H E S TAT E O F T H E W O R L D ’ S C H I L D R E N 2 0 0 6
The exclusion of these children, or any
children, from the services, protection
and opportunities that are theirs by right is
unacceptable. The principles of universality
and non-discrimination that underlie the
Convention on the Rights of the Child, the
Millennium Declaration and ‘A World Fit
for Children’ must provide the framework
for our actions concerning children and
adolescents. Our commitments to children
must not, under any circumstances, merely
pay lip service to these principles while tacitly accepting that some children will remain
hungry, in poor health and without education or protection from harm. Having ratified these binding international agreements,
national governments – and the international institutions and civil society organizations
that support them in their efforts – have
obligations, both moral and legal, to do their
utmost to ensure that no child is left out.
The Millennium agenda must, therefore,
be seen as a driving force, with 2015 as
a stepping stone, to providing universal
access to essential services, protection and
participation to children. To this end, those
countries falling behind on the MDGs, the
broader aims of the Millennium Declaration
and the protection values championed by ‘A
World Fit for Children’ must redouble their
efforts to meet them, with ample support
from donors and international agencies.
Similarly, those countries deemed to be on
course to meet specific goals, or the MDGs
as a whole, should not rest on their laurels
but strive to go beyond the headline targets
of the goals to meet the challenge of eliminating disparities in children’s health,
education and access to essential services.
The remaining chapters of this State of the
World’s Children report will highlight the
plight of the children in danger of being forgotten as the world focuses on achieving the
MDGs. Ironically, these are the very children likely to be most in need of care and
protection – the poorest and the most vulnerable, the exploited and the abused. As
the world continues to press ahead with
policies, programmes and funding to make
the vision outlined in the Millennium
Declaration a reality, it must not allow these
children, who are excluded, marginalized
and often invisible, to be forgotten.
Defining exclusion
and invisibility of children
For the purposes of this report, children are considered as excluded
relative to other children if they are deemed at risk of missing out on
an environment that protects them from violence, abuse and
exploitation, or if they are unable to access essential services and
goods in a way that threatens their ability to participate fully in society in the future. Children may be excluded by their family, the community, government, civil society, the media, the private sector and
other children.
The exclusion described in this report is closely related to the concept
of social exclusion. Like poverty, there is no commonly agreed-upon
definition of social exclusion, though it is a widely acknowledged phenomenon.a Governments, institutions, academics and international
organizations all view exclusion differently, yielding a rich, but
sometimes confusing, tapestry of perspectives. Yet amid the intellectual debates about the definition of exclusion, there is some degree
of consensus about its main factors and aspects.
There is broad agreement that exclusion is multidimensional,
including deprivations of economic, social, gender, cultural and
political rights, making exclusion a much broader concept than
material poverty. The concept of exclusion includes the reinforcing
socio-political factors that are the basis of discrimination and disadvantage within society, requiring a strong focus on the processes
and agents behind deprivation to guarantee inclusion and equality
of opportunity.
Beyond these broad principles, there is considerably less agreement
regarding the dimensions of exclusion. But there are three common
elements – relativity, agency and dynamics – that are widely regarded
as central:b
• Relativity: Exclusion can only be judged by comparing the circumstances of some individuals, groups and communities relative to
others at a given place and time.
• Agency: People are excluded by the act of some agent. This focus
on agency can help in the identification of the cause of exclusion
and ways to remedy it.
• Dynamics: Exclusion may be based on bleak future prospects, not
just current circumstances.
Exclusion from essential services and goods such as adequate food,
health care and schooling clearly affects children’s ability to participate in their communities and societies in both the present and the
future. But there are also other rights violations – particularly child
protection abuses and state neglect of children living outside the
family environment – that restrict children’s freedom and movement,
limiting their representation or identification as a child who holds
special rights. Like the dimensions of exclusion, these factors often
overlap and intertwine, each exacerbating the next until, at the
extremes, some excluded children are made invisible – denied their
rights, physically unseen in their communities, unable to attend
school and obscured from official view through absence from
statistics, policies and programmes.
See References, page 89.
OUR COMMITMENTS TO CHILDREN
7
Equality in Education:
The Universal Challenge
Millennium Development Goal 2, which calls
for every boy and girl to complete primary
schooling, is the only goal that is universal in
its scope. As such, it reminds the world
community of the need to focus explicitly on
those children who might currently be
excluded from the classroom.
Children living in the least developed
countries, the poorest communities, and
the most impoverished households are less
likely to be enrolled in, or be able to regularly
attend school, as are children in rural areas,
children with disabilities and those living in
areas affected by armed conflict. Children
from ethnic and linguistic minorities face
additional barriers as they struggle to learn
the language of instruction. Getting children
into school is only the beginning, however.
Ensuring that they attend school regularly and
complete their studies with the skills that will
allow them to achieve future success are the
ultimate objectives.
In many countries, girls are less likely to attend
school than boys, particularly at higher levels
of education. Gender parity for all levels of education, a key target of Millennium Development
Goal 3, is an essential component of transforming gender relations and guaranteeing that
boys and girls are provided with equal opportunities to reach their full potential. In 2005, 54
countries were found to require additional
efforts to achieve this goal.* They must be supported to undertake the initiatives to achieve
equality in education by 2015.
Ensuring that every child receives a primary
education will require additional resources,
but this goal cannot be seen as optional
or unattainable. Putting every boy and girl in
the world in a good-quality primary school
would cost between $7 billion and $17 billion
per year – a relatively small amount compared
to other government expenditures.** The benefits of such an investment would be immeasurable in terms of the health, productivity and
social well-being of children today and of
future generations.
* UNICEF, Progress For Children: A report card on gender parity and primary
education (No. 2), UNICEF, New York, June 2005.
** UN Millennium Project, Task Force on Education and Gender Equality,
Toward universal primary education: investments, incentives, and institutions,
Earthscan, London, 2005, p. 9.
8
T H E S TAT E O F T H E W O R L D ’ S C H I L D R E N 2 0 0 6
Education for All
OUR COMMITMENTS TO CHILDREN
9
2
The Root Causes of Exclusion
T H E S TAT E O F T H E W O R L D ’ S C H I L D R E N 2 0 0 6
The children most at risk of missing out on
the Millennium agenda, and on their rights
under the Convention on the Rights of the
Child, live in all countries, societies and
communities. An excluded child is one who
lives in an urban slum in Venezuela and
takes care of her four siblings; a Cambodian
girl living alone with her brothers because
her mother had to go elsewhere to find a
job; a Jordanian teenager working to help
his family and unable to play with his
friends; an orphan in Botswana who lost his
mother to AIDS; a child confined to a
wheelchair and unable to attend school in
Uzbekistan; or a young boy working as a
domestic in Nepal.
At first glance, these children’s lives may
appear poles apart: Each of them faces a
different set of circumstances and struggles
to overcome distinct obstacles. Yet they all
have something in common: They are
almost certainly excluded from essential
goods and services – vaccines, micronutrients, schools, health-care facilities, water
and sanitation, among others – and denied
the protection from exploitation, violence,
abuse and neglect, and the ability to participate fully in society, which is their right.
© UNICEF/HQ99-0808/ Roger LeMoyne
Exclusion harms children on many levels
At the national level, the exclusion of children from their rights to essential services is
often the product of macro factors, such as
mass poverty, weak governance, the uncontained spread of major diseases such as
HIV/AIDS, and armed conflict. At the subnational level, among vulnerable and marginalized groups, exclusion is also the result
of disparities in access to services on the
basis of income and geographic location,
and through overt discrimination on the
grounds of gender, ethnicity or disability.
Violations of protection rights – including
the loss or lack of a formal identity, the
SUMMARY
ISSUE: Exclusion acts against children in all countries, societies and
communities. At the national level, the root causes of exclusion are
poverty, weak governance, armed conflict and HIV/AIDS. Statistical
analyses of key MDG indicators related to child health and education show a widening gap between children growing up in countries
with the lowest level of development, torn by strife, underserved by
weak governments or ravaged by HIV/AIDS and their peers in the
rest of the developing world. These factors not only jeopardize
these children’s chances of benefiting from the Millennium agenda,
they also increase the risk that they will miss out on their childhood
and face continued exclusion in adulthood.
Because the MDGs are based on national averages, inequalities
among children within the same country that contribute to, and
result in, their exclusion may be obscured. Disaggregated data from
national statistics and household surveys indicate sharp disparities
in health-care and education outcomes on the basis of household
income and geographic location. Inequalities in children’s health,
rate of survival and school attendance and completion also fall
along the lines of gender, ethnicity or disability. These inequities
may occur because children and their caregivers are directly
excluded from services, because they live in areas that are poorer
and more poorly serviced, because of the high costs of access to
essential services, or because of cultural barriers such as language,
ethnic discrimination or stigmatization.
ACTION: Tackling these factors requires swift and decisive action
in four key areas:
• Poverty and inequality. Adjusting poverty-reduction strategies
and expanding budgets or reallocating resources to social investment will assist millions of children in the poorest countries
and communities.
• Armed conflict and ‘fragile’ States. The international community
must seek to prevent and resolve armed conflict and engage with
countries with weak policy/institutional framework to protect
children and women and provide essential services. Emergency
responses for children caught up in conflict should include
services for education, child protection and the prevention of
HIV transmission.
• HIV/AIDS and children. Greater attention should be given to the
impact of HIV/AIDS on children and adolescents and to ways of
protecting them from both infection and exclusion. The Global
Campaign on Children and HIV/AIDS will play a significant role in
this regard.
• Discrimination. Governments and societies must openly confront
discrimination, introduce and enforce legislation prohibiting it,
and implement initiatives to address exclusion faced by women
and girls, ethnic and indigenous groups and the disabled.
11
health and education – under-five mortality,
malnutrition, primary school enrolment,
among others – show a widening gap in the
health and education of children growing up
in countries with the lowest level of development, torn by strife or ravaged by HIV/AIDS,
compared with their peers in the rest of the
world. Without a concerted effort, children
in these countries will become even more
excluded over the next decade.
Figure 2.1: The least developed countries are the
richest in children
21%
Industrialized
countries
6%
37%
Developing
countries
11%
Least
developed
countries
49%
16%
0
10
20
30
40
50
Percentage
Under 18 population as a % of total population (2004)
Under 5 population as a % of total population (2004)
Source: UNICEF calculations based on data from United Nations Population Division.
absence of state protection for children
deprived of family support, the exploitation
of children and premature entry into adult
roles – also leave individual children
exposed to exclusion.
This chapter focuses on the factors that
cause children to be excluded from essential
services – mostly of health care and education – at the national and subnational levels.
These impediments, often long-standing and
deeply entrenched, are the product of economic, social, gender and cultural processes
that can be addressed and must be altered.
Even if they persist, our binding commitments to children compel us to take the necessary actions to mitigate their impact. (The
many factors that deprive children of protection against violations of their rights at
the individual level, which lessens their visibility in their societies and communities,
will be examined in Chapter 3).
Macro-level causes of exclusion
Poverty, armed conflict and HIV/AIDS are
among the greatest threats to childhood
today.1 They are also among the most
significant obstacles to the achievement of
the Millennium agenda for children at the
regional and country levels. Statistical analyses of key MDG indicators related to child
12
Children in the least developed countries
are most at risk of missing out
Children are disproportionately represented
among the poor, since the least developed
countries tend to have the youngest populations, and income-poor families tend to have
more children than richer ones. Poor children
are more likely to be engaged in labour,
which could mean missing out on an education and, as a result, on the opportunity to
generate a decent income that would allow
them to escape poverty in the future.2 Denied
a decent standard of living and, often, education, information and vital life skills, they are
vulnerable to abuse and exploitation.
Poverty reduction is a central objective of the
Millennium agenda, targeted explicitly in two
of the eight goals (MDG 1 and MDG 8), and
a significant factor in the other six. In MDG 1,
the primary aim is to reduce income poverty
by cutting in half the proportion of people
living on less than a dollar a day; in MDG 8,
a key objective is to address the special needs
of the least developed countries.
Raising incomes through economic growth
is an essential component of povertyreduction strategies and has been particularly successful in Asia since 1990.3 But
economic growth by itself is insufficient to
address the ways in which children experience material poverty – i.e., as deprivation
of essential services and goods. The extent
of this deprivation is appalling: More than
1 billion children suffer from one or more
extreme forms of deprivation in adequate
nutrition, safe drinking water, decent sanitation facilities, health-care services, shelter,
education and information.4
Children living in the least developed
countries are the most likely to face severe
T H E S TAT E O F T H E W O R L D ’ S C H I L D R E N 2 0 0 6
Why children in the least developed countries risk missing out
Least developed Developing
countries
countries
World
Survival
Under-five mortality rate (per 1,000 live births, 2004)
Infant mortality rate (per 1,000 live births, 2004)
155
98
87
59
79
54
36
27
26
42
31
31
75
76
78
28
46
49
38
54b
54b
36
33b
33b
Nutrition
Proportion of under-fives who are moderately or
severely underweight (percentage, 1996-2004a)
Proportion of under-fives suffering from moderate
or severe stunting (percentage, 1996-2004a)
Immunization
Proportion of one-year-old children immunized against
DPT3 (percentage, 2004)
Proportion of one-year-old children immunized against
HepB3 (percentage, 2004)
Health care
Proportion of under-fives with an acute respiratory infection
taken to a health provider (percentage, 1998-2004a)
Proportion of under-fives with diarrhoea receiving oral
rehydration and continued feeding (1996-2004a)
HIV/AIDS
Adult prevalence rate (15-49 years, end-2003)
Adults and children living with HIV (0-49, thousands, 2003)
3.2
12,000
1.2
34,900
1.1
37,800
Education and gender parity
Percentage of primary school entrants reaching grade 5
(administrative data, 2000-2004a)
Net primary school attendance ratio, boys (1996-2004a)
Net primary school attendance ratio, girls (1996-2004a)
Net secondary school attendance ratio, boys (1996-2004a)
Net secondary school attendance ratio, girls (1996-2004a)
65
60
55
21
19
78
76
72
40b
37b
79
76
72
40b
37b
52
27
65
43
67
49
71
59
35
17
84
71
59
61
86
71
63
74
Demographics
Life expectancy at birth (years, 2004)
Proportion of population urbanized (percentage, 2004)
Women
Adult literacy parity rate (females as a percentage of males, 2000-2004a)
Antenatal care coverage (percentage, 1996-2004a)
Skilled attendant at delivery (percentage, 1996-2004a)
Lifetime risk of maternal death, 2000 (1 in:)
Data refer to the most recent year available during the period specified.
Excludes China.
Sources: For a complete list of the sources used to compile this table, see Statistical Tables 1-10, pp. 95-137.
a
b
THE ROOT CAUSES OF EXCLUSION
13
Figure 2.2: Children living in the poorest countries
are most at risk of missing out on
primary and secondary school
92
Net secondary school
enrolment ratio,
girls (2000-2004*)
49**
26
91
Net secondary school
enrolment ratio,
boys (2000-2004*)
50**
30
96
Net primary school
enrolment ratio,
girls (2000-2004*)
83
65
95
Net primary school
enrolment ratio,
boys (2000-2004*)
88
71
0
20
Industrialized
countries
40
60
Percentage
Developing
countries
80
100
Least developed
countries
*Data refer to the most recent year available during the period specified.
** Excludes China.
Sources: Demographic and Health Surveys (DHS) and Multiple Indicator Cluster
Surveys (MICS).
Figure 2.3: Most of the countries where 1 in 5
children die before five have experienced
major armed conflict since 1999
200
Rwanda
203
Guinea-Bissau
203
Equatorial Guinea
204
Dem. Rep. of Congo
205
Mali
219
Somalia
225
Liberia
235
Afghanistan
257
Niger
259
Angola
260
Sierra Leone
283
50
100
150
200
250
300
Under-five deaths per 1,000 live births
No armed conflict
Major armed conflict
Sources: Data on child mortality: UNICEF, United Nations Population Division and United
Nations Statistics Division; Data on major armed conflicts: Stockholm International Peace
Research Institute, SIPRI Yearbook 2005.
14
Two MDG indicators – under-five mortality
and completion of primary education –
aptly illustrate the risks of exclusion faced
by children living in the least developed
countries. In 2004, 4.3 million children –
one out of every six live births – died before
the age of five in these countries alone.5
Although under-fives in the least developed
countries make up only 19 per cent of the
world’s under-fives, they account for over
40 per cent of all under-five deaths. Of
those who live to reach primary school age,
40 per cent of boys and 45 per cent of girls
will not attend school. Of those who enter
primary school, over one third will not
reach grade five; and around 80 per cent
of all children of secondary school age will
not attend secondary school.6
Armed conflict and poor governance
escalate the risk of exclusion for children
Chad
0
deprivation and, consequently, are among
those at greatest risk of missing out on the
Millennium agenda. The statistical evidence
of their impoverishment is alarming, particularly those indicators related to children
and women’s development and well-being
(see Panel: Why children in the least developed countries risk missing out, page 13).
In almost all cases, the least developed
countries are lagging far behind the rest
of the developing world.
Armed conflict causes children to miss out
on their childhood in a multitude of ways.
Children recruited as soldiers are denied
education and protection, and are often
unable to access essential health-care
services. Those who are displaced,
refugees or separated from their families
face similar deprivations. Conflict heightens the risk of children being exposed to
abuse, violence and exploitation – with
sexual violence often employed as a
weapon of war.7 Even those children who
are able to remain with their families, in
their own homes, may face a greater risk
of exclusion because of the destruction of
physical infrastructure, strains on healthcare and education systems, workers and
supplies, and increasing personal insecurity
caused by the conflict or its remnants –
such as landmines and unexploded
ordnance.
T H E S TAT E O F T H E W O R L D ’ S C H I L D R E N 2 0 0 6
The breakdown in governance that often
accompanies armed conflict and the destruction caused to public administration and
infrastructure are key reasons for the high
rates of under-five mortality and low rates
of educational participation and attainment.
But armed conflict is not the only form of
state failure. ‘Fragile’ States are characterized by weak institutions with high levels of
corruption, political instability and weak
rule of law.9 Such States often lack the
resources to adequately support an efficient
public administration.10 As the government
is often incapable of providing basic services
to its citizens, the standard of living in these
countries can degenerate both chronically
and acutely.
Tragically, these governance failures result in
children becoming more excluded from
essential services. Children living in countries that are unable to implement national
development strategies to meet the MDGs
will be among those most at risk of missing
out on whatever benefits are derived from
the Millennium agenda. One such country is
Haiti, already the poorest country in the
Americas by most indicators and plagued by
Figure 2.4: ‘Fragile’ States* are among the poorest
35,000
32,232
Gross national income per capita (US$, 2004)
Firm evidence of the impact of armed conflict on children’s exclusion is limited, in
part because of gaps in research and data
collection on the numbers of children
caught up in conflict. Nevertheless, the
available linkages are indicative of the
extent of exclusion – and alarming. Of the
12 countries where 20 per cent or more of
children die before the age of five, nine have
suffered a major armed conflict in the past
five years (see Figure 2.3: Most of the countries where 1 in 5 children die before five
have experienced major armed conflict since
1999, page 14), and 11 of the 20 countries
with the most elevated rates of under-five
mortality have experienced major armed
conflict since 1990. Armed conflict also has
devastating effects on primary school enrolment and attendance. For example, the nine
conflict-affected countries where 1 in 5 children dies before the age of five have an
average net primary school attendance ratio
of 51 per cent for boys and 44 per cent for
girls, well below the corresponding averages
of 60 and 55, respectively, for the least
developed countries as a whole.8
30,000
25,000
20,000
15,000
10,000
5,000
0
345
512
Least
developed
countries
‘Fragile’
States*
1,524
Developing
countries
Industrialized
countries
* Countries with weak policy/institutional frameworks. A list can be found in the
References section, p. 91.
Sources: World Bank, 2004 Country Policy and Institutional Assessment (CPIA), Overall
Rating, Fourth and Fifth Quintiles; and World Development Indicators 2005.
political violence for most of its recent history. The country has seen a further deterioration in child well-being amid the political
turmoil of the last two years. Access to education has been affected by hikes in school
fees, and some 60 per cent of rural households still suffer from chronic food insecurity, with 20 per cent extremely vulnerable.
Another example of a fragile State is
Somalia, a country that has long been
among the least developed. Its progress
on human development has been further
constrained by the lack of a functioning
national administration since 1991. Over
this 14-year period, progress on human
development has been scant, with rival
warring factions claiming jurisdiction over
specific territories. The result is starkly
apparent in education: The net primary
attendance ratio is lower than anywhere
else in the world, at just 12 per cent for
boys and 10 per cent for girls, according
to the latest estimates.11 The recent
re-establishment of schooling by many
THE ROOT CAUSES OF EXCLUSION
15
Figure 2.5: Children account for an increasing
proportion of people living with HIV
Industrialized
countries
26
CEE/CIS
34
Latin America
and Caribbean
38
East Asia and
Pacific
27
South Asia
30
Middle East and
North Africa
45
West and
Central Africa
53
39
8
Eastern and
Southern Africa
53
40
7
0
73
1
66
1
60
2
72
2
67
3
51
10
20
30
40
50
4
60
70
80
90
100
Percentage of total population living with HIV, 2003*
Women (15-49)
Men (15-49)
Children (0-14)
*Figures may not add up to 100% due to rounding.
Source: UNICEF calculations based on data from Joint United Nations Programme on
HIV/AIDS, Report on the Global HIV/AIDS Epidemic, 2004.
communities – with the support of international agencies – is a welcome development,
but years of underinvestment have left
Somalia lagging behind the rest of the
developing world in education.
Strengthening governance in fragile States is
considered by many, and with good justification, to be a prerequisite for meeting the
goals of the Millennium agenda. Donors
and international agencies may be wary of
increasing non-humanitarian assistance to
the government of a fragile State, but their
commitments to children must compel them
to engage with these States to ensure that
children’s rights are protected and their
needs met. The simple truth is that children
cannot wait until governance improves –
long delays may result in them missing out
on their childhood altogether.
HIV/AIDS is wreaking havoc with
children’s lives in the worst-affected
countries
Combating HIV/AIDS is a central objective
of the Millennium Development Goals,
specifically addressed in MDG 6. Children
16
living with or affected by HIV/AIDS, or in
countries with high prevalence rates, face an
extremely high risk of exclusion from access
to essential services, care and protection, as
parents, teachers, health workers and other
basic service providers fall sick and eventually die. The epidemic is tearing away at the
social, cultural and economic fabric of families, the first line of protection and provision
for children that safeguards against their
exclusion from essential services and exposure to harm. Some 15 million children have
already lost one or more parents to the disease, and millions more have been made
vulnerable as the virus exacerbates other
challenges to the health and development
of families, communities, provinces and,
in the worst-affected countries, whole
nations.12 Of those orphaned by AIDS,
12.1 million, or more than 80 per cent, are
in sub-Saharan Africa, reflecting not only
the region’s disproportionate burden of
HIV infection, but also the epidemic’s
relative maturity.13
The protracted illness and eventual death
of parents and other caregivers exert enormous pressures on children, who often have
to assume adult roles in treatment, care and
support. Surviving siblings can suffer stigma
and discrimination in their communities and
societies, experience greater exposure to
violence, abuse and exploitation and drop
out of school for a variety of reasons.
In addition to orphaning and the loss of
caregivers, lack of access to essential services and increased risk of missing out on
an education, HIV/AIDS also threatens the
very survival of children and young people.
Every day, nearly 1,800 children under 15
are infected.14 Children under 15 account
for 13 per cent of new global HIV infections
and 17 per cent of HIV/AIDS deaths annually.15 The pandemic has reversed the gains
in child survival made in many of the worstaffected countries and has dramatically
reduced average life expectancy in those
countries, particularly in southern Africa.16
With the pandemic spreading to more and
more countries and population groups, the
worst impact on children is still to come. It
is estimated that in 2004, almost 5 million
people became infected with HIV – the most
T H E S TAT E O F T H E W O R L D ’ S C H I L D R E N 2 0 0 6
© UNICEF/HQ02-0255/Thierry Geenen
in a single year since the pandemic began in
the early 1980s. Young people aged between
15 and 24 years now account for nearly one
third of people living with HIV/AIDS globally.17 Given that it can take up to a decade
for any decrease in HIV prevalence to be
translated into lower death rates from AIDS
– owing in large part to the slow roll-out
of antiretroviral treatments – deaths from
AIDS will continue and the number of
orphans will rise. In those countries where
HIV/AIDS is already at epidemic levels,
tackling the disease is imperative not only
to meet MDG 6, but also to reverse recent
increases in under-five mortality rates –
particularly in Eastern and Southern Africa
– and to reduce the risk of exclusion from
education and the protection of a family
environment for orphans and other
vulnerable children.
Subnational factors that can result
in exclusion
National aggregates fail to capture the full
picture of exclusion for children
Assessment of indicators related to children’s
well-being is most frequently undertaken at
the national level. There are a number of
reasons for this: The national level is the
fundamental unit of statistical analysis for
countries; estimates for national aggregates
are generally more widely available than for
any sub-country group; standardization of
statistics often requires national-level and
nationally funded survey programmes; and
international agencies also compile national
aggregates on key indicators related to the
Millennium agenda. The national government is also the signatory to international
commitments to children and the principal
trustee for their implementation.
However, assessing child well-being on the
basis of national aggregates alone has its
limitations. National averages are, by
nature, summary measures that most clearly
depict the situation of the majority; as such,
they do not provide a full picture. To gain a
more complete understanding of the exclusion that some children face within a country, disaggregated indicators derived from
national statistics or household surveys are
required. Data that are disaggregated geo-
graphically – as well as by gender, ethnic
group or other salient dimensions – are key
to identifying the risk of exclusion and are
immensely useful as a tool for programme
design. Disaggregated data are particularly
important for advocacy and policy purposes
in countries where the national averages
may indicate that, based on current trends,
some or all of the MDGs will be met.
Disaggregated national statistics or household surveys on children’s well-being are
not available in all countries. But the existing evidence, based on the Demographic
and Health Surveys (DHS) and Multiple
Indicator Cluster Surveys (MICS), is fairly
comprehensive and indicates a clear result:
Within countries, there are usually significant disparities in child well-being and
development across geographical and
other axes.
These disparities reflect exclusion in relative
terms, quantifying a child’s well-being compared to that of his or her peers. A country
with a high national average of primary
school attendance or enrolment, for example, may still face wide internal variations
owing to the marginalization of particular
segments of the population. One such counTHE ROOT CAUSES OF EXCLUSION
17
© UNICEF/HQ00-0140/Shehzad Noorani
try is Venezuela, where survey data from
DHS and MICS indicate that although net
primary school attendance approaches 94
per cent, almost 15 per cent of children of
primary school age living in the poorest 20
per cent of households miss out on primary
education, compared with less than 2 per
cent in the richest quintile.
One of the biggest risks for children is that,
with the MDGs being based on national
averages, such inequalities within countries
may be obscured. The magnitude of these
disparities can be great, and they risk being
ignored when MDG-based strategies are
being developed and implemented. This is
particularly true in countries where the
majority of children are afforded the minimum health-care and education thresholds
set out in the Millennium agenda. In such
settings, the sharp divide between the most
privileged children and those denied access
to essential services contributes to their
further marginalization and may in itself
be a root cause of discrimination.
Income inequalities threaten children’s
survival and development
In every developing country where disaggregated data by household income are avail18
able,18 children living in the poorest 20 per
cent of households are significantly more
likely to die before the age of five than those
living in the richest 20 per cent.
Latin America and the Caribbean is the
region with the highest inequalities in
household income in the developing world;
countries in this region also have among the
highest inequalities in child mortality. The
country with the greatest inequality in
under-five mortality is Peru, where children
living in the poorest quintile are five times
more likely to die before their fifth birthday
than children from the wealthiest 20 per
cent of the population.
Though disparities in under-five mortality
rates are not as sharply pronounced in
other regions, they can still be marked.
On average, a child born into the poorest
20 per cent of households is three times
more likely to die than a child born into the
richest quintile in East Asia and the Pacific
region, two and a half times more likely to
die in the Middle East and North Africa and
around twice as likely in the South Asia and
CEE/CIS regions. Although several of the
countries in these regions are either on track
or making good progress towards MDG 4,
the poorest children are still twice as likely
T H E S TAT E O F T H E W O R L D ’ S C H I L D R E N 2 0 0 6
to die before five as the richest children
(see Panel: Income disparities and child
survival, page 20).
Within countries, low income is a major
deterrent to primary school participation.
Children of primary school age from the
poorest 20 per cent of households in developing countries are 3.2 times more likely to
be out of primary school than those from
the wealthiest 20 per cent. Moreover, 77 per
cent of children out of primary school come
from the poorest 60 per cent of households
in developing countries; this disparity is
even greater in Latin America and the
Caribbean (84 per cent) and Eastern and
Southern Africa (80 per cent).19
Children living in rural areas and among
the urban poor often face a high risk of
exclusion
Rural areas tend to be poorer and more difficult to reach with health-care services and
education than urban areas. Accordingly, in
nearly all countries where household data
on child mortality rates are available, rural
children are more likely to die before the
age of five than their urban peers. Some 30
per cent of rural children in developing
countries are out of school, compared with
18 per cent of those living in urban areas,
and over 80 per cent of all children out of
primary school live in rural areas. Possible
barriers to their attendance include distance,
the likelihood that their parents are less educated or do not value formal education and
the failure of governments to attract good
teachers to the countryside.20
Geographic divides often overlap with
income inequality within urban communities. In many of the world’s cities, the most
impoverished citizens live in slums, tenements and shanty towns, areas which are
geographically separate from the most affluent. More than 900 million people live in
slums; most lack access to safe drinking
water, improved sanitation facilities,
sufficient living space and decent quality
housing with secure tenure.21 The exclusion
of children living in these communities –
which are often severely lacking in essential
services and state protection – can
sometimes approach levels experienced
in rural areas.22
Inequalities in children’s health, rate of survival and school attendance and completion
also fall along the lines of gender, ethnicity
Figure 2.6: In several regions, girls are more likely to miss out on primary school than boys
100
95 97
Male
Net primary school attendance
ratio, 1996-2004*
Female
87
80
80
98 100
90 89
90
84
96 98
84
75
60
65 65
61
55
40
20
0
West and
Central
Africa
Eastern and
Southern
Africa
South Asia
World
Middle East and
North Africa
CEE/CIS
East Asia
and the
Pacific
Latin America Industrialized
and the
countries
Caribbean
*Data refer to the most recent year available during the period specified.
Source: United Nations Children’s Fund, Levels, Trends and Determinants of Primary School Participation and Gender Parity, Working Paper, 2005.
THE ROOT CAUSES OF EXCLUSION
19
Income disparities and child survival
In 2004, an estimated 10.5 million children died before they reached age
a
five, most from preventable diseases.
Combating these unnecessary deaths
and meeting Millennium Development
Goal 4 – reduce child mortality by two
thirds between 1990 and 2015 – will be
a central focus for all those working
towards the fulfilment of the promises
of the Millennium agenda for children.
Addressing the inequalities and
disparities within countries must be
an essential component of all programmes and policies that aim to
reduce child mortality.
it is clear that children living in the
poorest 20 per cent of households are
significantly more likely to die during
childhood than those living in the
b
richest 20 per cent of the population.
In countries where household data
are available from surveys such as the
Demographic and Health Surveys and
the Multiple Indicator Cluster Surveys,
The least developed countries tend
to have lower inequalities in child
survival between rich and poor, with
mortality rates remaining high even
in the richest families. Countries in
sub-Saharan Africa, for example, have
lower levels of disparity in child
mortality rates than less impoverished
developing regions.
How likely is a poor child to be underweight
compared to a rich child?
Swaziland
Kenya
Rwanda
Lesotho
Mongolia
Dominican Republic
Guyana
Senegal
Trinidad and Tobago
Viet Nam
Suriname
Gambia
Zambia
Guinea-Bissau
Dem. Rep. of Congo
Myanmar
Sao Tome and Principe
Sudan (North)
Azerbaijan
Central African Rep.
Burundi
Angola
Comoros
Sierra Leone
Chad
Niger
Equatorial Guinea
Iraq
Lao People’s Dem. Rep.
Income disparities often translate into
disparities in the nutritional status of
children. Over 5.5 million children
under five die every year from
c
causes related to malnutrition.
Encompassing more than just hunger,
malnutrition can lead to weakened
immune systems when vitamin A is
lacking and a child is neither hungry
nor underweight. Even when it does
not cause death, malnutrition can
inflict lifelong damage on a child’s
health and development.
Equally 2 times 3 times 4 times 5 times
likely as likely as likely as likely as likely
In 13 countries where data are available, children from the poorest 20 per cent of the population are more than twice as likely to be underweight for their age, and in Swaziland
they are five times as likely to be underweight.
Source: UNICEF calculations based on data from Demographic and Health Surveys (DHS)
and Multiple Indicator Cluster Surveys (MICS).
20
T H E S TAT E O F T H E W O R L D ’ S C H I L D R E N 2 0 0 6
Vaccine-preventable diseases cause
more than 2 million deaths every
year, of which approximately 1.4
million occur in children under age
d
five. While huge strides have been
made worldwide to increase vaccination coverage, there is still room for
improvement. Tragically, the poorest
children are also at a disadvantage
when it comes to immunization.
The richest children are more than
twice as likely to have received the
measles vaccination as the poorest
20 per cent of children in Azerbaijan,
the Central African Republic, Chad,
the Democratic Republic of the
Congo, Niger and northern Sudan.
How likely is a poor child
to die before age 5,
compared to a rich child?*
6 times as likely
5 times as likely
Peru
South
Africa
4 times as likely
Indonesia
Egypt
3 times as likely
*Individual lines within the regional block
each represent a country surveyed.
Source: UNICEF calculations based on
data from Demographic and Health
Surveys (DHS) and Multiple Indicator
Cluster Surveys (MICS).
If income disparities are not
addressed, it is likely that the poorest
children will continue to make up a
disproportionate share of the child
mortality figures, even if national
goals are met. Overall, in 23 of the
56 countries with household surveys
allowing for disaggregation by
income, poorer children are more
than twice as likely to die before their
fifth birthday, with some of these
countries making progress towards
the goals at the national level and
others failing.
See References, pages 90-91.
India
Turkey
Cambodia
2 times as likely
East Asia
Pakistan
Jordan
and Pacific
Uzbekistan
South Asia
Chad
Haiti
No inequality Latin America
Middle East
CEE/CIS
Sub-Saharan
and North Africa
Africa
and Caribbean
How likely is a rich child to be vaccinated against
measles compared to a poor child?
Central African Rep.
Niger
Sudan (North)
Dem. Rep. of Congo
Azerbaijan
Chad
Cameroon
Togo
Viet Nam
Angola
Equatorial Guinea
Lao People’s Dem. Rep.
Sierra Leone
Côte d’Ivoire
Guinea
Iraq
Comoros
Kenya
Venezuela
Swaziland
Madagascar
Zambia
Burundi
Lesotho
Tajikistan
Dominican Republic
Sao Tome and Principe
Bolivia
Myanmar
Guyana
Mongolia
Uzbekistan
Rwanda
Equally
likely
Twice as
likely
3 times
as likely
Source: UNICEF calculations based on data from Demographic and Health Surveys (DHS)
and Multiple Indicator Cluster Surveys (MICS).
THE ROOT CAUSES OF EXCLUSION
21
© UNICEF/HQ99-1146/Tomislav Peternek
or disability. These inequities occur when
children and their caregivers are directly
excluded from services because they live in
areas that are poorer and more poorly
serviced, or because cultural barriers such
as language, ethnic discrimination or
stigmatization prevent them from receiving
needed services.
Discrimination against girls excludes them
from education
Gender discrimination is specifically
addressed by MDG 3, which promotes
gender equality and the empowerment of
women, with the attached target of eliminating gender disparity in education.
Education provides the opportunity for girls
(and boys) to become more empowered and
self-confident as they acquire the range of
knowledge, skills, attitudes and values critical to negotiating an equal place in society.
Gender inequality in education means that
for every 100 boys out of primary school,
there are 117 girls who also miss out on
primary education.23 While the gender gap
in primary education has been closing
22
steadily since 1980, many countries have
failed to meet the MDG 3 target of gender
parity in primary education by 2005, and
the regions with the highest gaps will have
to make even greater gains if gender parity
is to be achieved as part of universal primary school completion by 2015.
Gender gaps in secondary education are
even more pronounced: of 75 developing
countries surveyed by UNICEF, only 22
were on course to meet the MDG 3 target
of gender parity at the secondary school
level, while 25 were far from the goal.24
Girls’ exclusion from education in comparison to boys – especially in South Asia,
sub-Saharan Africa and the Middle East and
North Africa – is one of the clearest statistical indicators of gender discrimination.
But gender discrimination is both more subtle and all-pervasive than can be measured
in the statistics about gender parity in
schooling. Gender plays a major part in
determining which children end up being
excluded from essential services and are,
therefore, most at risk of missing out on the
Millennium agenda. Many of the groups of
T H E S TAT E O F T H E W O R L D ’ S C H I L D R E N 2 0 0 6
children considered in this report are not
taken beyond the reach of international
development efforts by their gender alone,
but their gender clearly plays a major part
in determining their vulnerability. Gender
discrimination also results in limited access
of women to basic health-care services,
which increases the risk of maternal and
child mortality.
Discrimination on the basis of ethnicity is
widespread
Ethnicity is a set of characteristics – cultural,
social, religious and linguistic – that forms
a distinctive identity shared by a community
of people. It is a natural expression of human
diversity and a source of strength, resilience
and richness in the human family. But when
a child faces discrimination because of ethnicity, the risk of exclusion from essential
services and protection rises sharply.
There are some 5,000 ethnic groups in the
world, and more than 200 countries have
significant minority ethnic or religious
groups. Most countries – around two thirds
– have more than one religious or ethnic
group that accounts for at least 10 per cent
of the population.26 Some ethnic groups are
spread across national borders – for
example, the Roma in Central and Eastern
Europe or residents of Chinese descent in
many countries in South-East Asia. Some
are minorities, accounting for a small proportion of the national population, while
others make up a significant share of the
population but have little power in society
as a result of their isolation and, very often,
deep historical disadvantage.27
© UNICEF/HQ01-0675/Alejandro Belaguer
Women’s disempowerment results in exclusion for their children. Mothers are generally
the first caregivers for children. In situations
and settings where they are denied access to
basic services, essential resources, or information, it is the children who suffer the
greatest exclusion. Impediments to progress
in the fight against gender discrimination
include the continued lack of good quality
data disaggregated by sex, the paucity of
financial and technical resources for
women’s programmes at both international
and national levels and the lack of representation in the political sphere.25
A common thread among ethnic groups is
that they often face considerable marginalization and discrimination. Almost 900 million people belong to groups that experience
disadvantage as a result of their identity,
with 359 million facing restrictions on their
religion. Around the world, some 334 million people face restrictions or discrimination related to their language. In over 30
sub-Saharan African countries (containing
80 per cent of the region’s population), for
instance, the official language is different
from the one most commonly used, and
only 13 per cent of children in these countries are taught in their mother tongue in
primary school.28
Discrimination on the basis of ethnicity
can erode self-worth and confidence in
THE ROOT CAUSES OF EXCLUSION
23
The marginalization of Roma communities and their children
The Roma population constitutes
Europe’s largest and most vulnerable
minority, estimated at between 7 and
9 million people. With no historical
homeland, roughly 70 per cent of
Roma live in Central and Eastern
Europe (CEE), and in former Soviet
Union countries. Nearly 80 per cent
live in countries that joined the
European Union (EU) in 2004 or are
in the process of negotiating EU
membership.a
Exclusion in all its dimensions –
social, political, economic or geographic – has affected Roma for centuries and has taken the form of overt
ethnic discrimination. Faced with prejudices and fears that they are an inferior and dangerous people, Roma
tend to live in ghettos, segregated
from the rest of society, and are even
barred from restaurants and other
public places.b
Roma are also among the most impoverished cultural groups in Central and
Eastern Europe. Research shows that
nearly 84 per cent of Roma in Bulgaria
and 88 per cent of Roma in Romania
live below the national poverty lines.
Poverty among Roma is even higher in
Hungary, with 91 per cent of the group
living below the national poverty line.c
Because of limited education, a low
level of skills and discrimination in the
labour market, in some Roma settlements not a single person is regularly
engaged in formal employment.d
Many Roma children attend separate
schools or are segregated when
attending mainstream schools. Roma
children attending Roma-only schools
find themselves in overcrowded classes as a result of geographic and socioeconomic segregation.e
As many as 75 per cent of Roma children in Central and Eastern Europe are
placed in special schools for the mentally disabled,f but not for genuine
health reasons. This practice, which is
common, is related to the economic
benefits that come with special education. In some CEE countries, children
who are sent to schools for the mentally challenged receive food subsidies,
educational materials and transportation, as well as room and board. Roma
parents often agree to place their children in special schools without fully
understanding the long-term consequences of their action, and even if
they do, some families think they have
no other alternatives.g
A study conducted in 2001 by the
Open Society Institute (Budapest), a
private grant-making foundation,
found that 64 per cent of Roma chil-
children and deprive them of opportunities
for growth and development, blunting the
promise that is every child’s birthright.
Prejudice at community and institutional
levels can restrict opportunities for members
of an ethnic group. In terms of career choices and advancement, access to political
office or community leadership, members
of ethnic minorities may find their participation in society limited – even where there
are laws prohibiting bias and exclusion.
Exclusion based on ethnicity can lead to
armed conflict and even ethnic violence –
witness the atrocities along ethnic lines
24
dren in the second grade placed in
special schools in Bulgaria, the Czech
Republic, Hungary and Slovakia were
considered ‘mentally challenged’.
Over a two-year period, the majority
of these students, when placed in
special-education pilot classes, were
able to meet the requirements of the
mainstream curriculum.h
As disturbing as it is, this picture
of exclusion is by no means
complete. For instance, in Serbia and
Montenegro, national statistics on
education do not always include the
most-excluded children. Issues affecting Roma girls are still not addressed
in Romania, where the greatest number of Roma people, between 1 and 2
million, live. Moreover, in Bosnia and
Herzegovina, attendance of Roma
children in schools is sporadic, and
they are almost completely absent
from the upper grades of primary
and secondary schools.
The education system is not the only
one that is failing Roma children.
More than half of the children abandoned in medical institutions in
Romania – 57 per cent – are of Roma
ethnic origin. Often lacking the appropriate identity documents and birth
certificates necessary for health insurance enrolment, Roma communities
being committed in Darfur, Sudan,
since 2003.
Indigenous children can face multiple
barriers to full participation in society
Indigenous peoples have many characteristics and experiences in common with ethnic
minorities, but they are distinct from them.
Indigenous communities are more likely
than ethnic minorities to insist on their right
to a separate culture linked to a particular
territory and their history. They have generally maintained their own language, culture
T H E S TAT E O F T H E W O R L D ’ S C H I L D R E N 2 0 0 6
and their children have very limited access to
health-care services and are heavily dependent on state welfare and other transfer payments. In Romania, Roma men and women
are less likely to have health insurance and to
be enrolled in a family physician’s practice
than their Romanian counterparts.
Efforts are being made to address the situation. The Roma Education Initiative (REI), a
project of the Open Society Institute, in cooperation with Children and Youth Programs in
New York, is attempting to eliminate discrimination in the school systems in CEE countries
– including reintegration of Roma children
from special schools into formal education
and enabling them to succeed in school on
equal terms with their peers – through a
three-year project launched in 2002.i The
Slovak Government has recently designed a
set of strategies that specifically recognize
and address the issues of the Roma minority.
Moreover, in 2004, UNICEF Romania, in partnership with the Romanian Federation of
NGOs Active in Child Protection Issues,
launched the “Leave No Child Out” campaign dedicated to combating discrimination
against Roma children and enhancing their
access to education. So far, the campaign has
reached about 65 per cent of the country’s
Roma population.
See References, page 91.
and social organization distinct from the
dominant trends of the societies in which
they live. They are also likely to identify
themselves as indigenous and be identified
as such by other groups.29 In certain countries, such as Bolivia, Denmark (Greenland)
and Guatemala, they represent the majority
of the population. There are some 300 million indigenous peoples in more than
70 countries, around half of whom live
in Asia.30
Indigenous children can suffer cultural discrimination and economic and political mar-
ginalization. They are often less likely to be
registered at birth and more prone to poor
health, to low participation in education
and to abuse, violence and exploitation.31
The Committee on the Rights of the Child
has expressed concern about the particular
position of indigenous children in Australia,
Bangladesh, Burundi, Chile, Ecuador, India,
Japan and Venezuela.32 Many of them
are still denied their rights under the
Convention on the Rights of the Child,
especially with regard to birth registration,
access to education and health-care services.
Information on the extent to which indigenous children are denied their rights to survival, health-care services and education
relative to the national average is limited.
Case studies in individual countries suggest
that infant and child mortality rates are
higher among indigenous groups than in
the national population. In the hill province
of Ratanakiri, Cambodia, for example,
infant mortality rates are more than twice
the national average, while in Australia the
mortality rate for indigenous infants is three
times the overall rate.33 Many factors contribute to these disparities, including environmental conditions, discrimination and
poverty. Health-care services – including
vaccination against preventable diseases –
are often lacking in areas inhabited by
indigenous peoples. In Mexico, for instance,
there are an estimated 96.3 doctors per
100,000 people nationally but only 13.8
per 100,000 in areas where indigenous
people make up 40 per cent or more of
the population.34
Indigenous children are less likely to be
registered at birth, in part owing to the
absence of information on the issue in their
mother tongue. This can result in chronically low levels of registered children at birth:
For example, in the Amazonian region of
Ecuador only 21 per cent of under-fives
have a birth certificate, compared with the
national average of 89 per cent.35 The distance to the nearest registration office and
the cost of the certificate can also be severe
deterrents. National legislation that prohibits
indigenous peoples from registering their
children with indigenous names can also
prove a strong disincentive to obtaining a
birth certificate; in Morocco, for example,
THE ROOT CAUSES OF EXCLUSION
25
Living with disability
by Bethany Stevens
I spent the first two weeks of my life
in a neonatal intensive care unit in
Bremerhaven, Germany, on a United
States military base. Shortly after I
took my first breath, a young captain
told my father that I had a condition
that would cause most people around
the world to take me to the top of a
mountain and leave me there.
The condition is a rare congenital
bone disease called osteogenesis
imperfecta, which affects only about
0.008 per cent of the world’s population.a It causes brittle bones resulting
in fractures and, in its most extreme
form, death. I have a moderate type
of osteogenesis imperfecta and have
only had 55 fractures. I have undergone 12 surgeries to strengthen my
legs through the insertion of metal
rods into my bone marrow, as well as
one attempt to prevent further curvature of my spine by fusing bone into
the curves.
In addition to the physical pain of
operations and fractures, I have been
plagued with feelings of shame and
self-contempt as a result of the social
stigma of disability. This is an issue
I continue to grapple with today as a
24-year-old law student. As a child, I
did not realize how significant the
social reality of being disabled was,
as I felt that I was a normal child
who simply had physical limitations.
Still, the reality of fracturing on a
random basis was frightening and
stressful to both my mother and
myself. When I was younger, my
mother believed that I might fracture
while playing so she isolated me
from my peers. I calculated how
much time I have spent alone, healing from various injuries, and came
up with seven years of my life – a
figure that does not include the years
prior to my schooling.
26
My first educational experience was
at the age of three when I began to
attend a preschool in Colorado, USA,
composed exclusively of disabled
children. I thought it would be wonderful to get to interact with my
peers, but our ability to socialize was
limited by their significantly more
extreme disabilities. A few years later
we moved to California, where I
began attending an elementary school
as the only disabled child integrated
with able-bodied students. I loved
school because it gave me the muchneeded opportunity to engage in
human interaction. But there were still
times when I felt socially isolated
because of my disability, particularly
when it came to socializing beyond
the confines of my school.
When I was eight years old, I was sent
to a school for disabled children to
receive top-quality physical therapy
following a re-rodding procedure on
my legs. While I received excellent
physical therapy, the education was
remedial at best. What I learned in my
first year of school was taught to me
a second time. It was a nice mental
hiatus, but I am glad and lucky that
my time there lasted only one year.
I returned to my small elementary
school in the mountains of California
and was content to interact with people of similar intellectual calibre. I
began to develop friendships, but had
to leave school for about a year to
receive a spinal fusion. While healing,
I was taught by a home-schoolteacher
for an hour a day. Again, I experienced a void in mental stimulation.
During the early 1990s, I enjoyed several years without experiencing any
substantial medical issues and
remained in school. But when I
entered adolescence and – like all chil-
T H E S TAT E O F T H E W O R L D ’ S C H I L D R E N 2 0 0 6
children my age – began to become
aware of my changing body and to
experience physical attraction to other
people, things took a turn for the
worse. I developed feelings of sexual
attraction at the same rate as my
peers, yet experienced a significant
temporal gap between having these
feelings and being able to express
them. I felt lost, alone and angry at
myself and the world.
I internalized feelings of hatred
towards my body, which I now
believe were garnered through
images of normalized beauty standards perpetuated by the media and
by social stigma. Nowhere did I find
positive images expressing the
humanity of disabled people – only
those in which we were depicted as
objects intended to provoke pity or
sympathy. My self-esteem plummeted, and I felt like I would never escape
from feelings of despair. These
intense emotions were exacerbated
by the fact that I had to leave all of
my good friends behind and go to a
school on the other side of town, as
the school my friends were going to
attend was inaccessible to disabled
students.
These feelings did not magically disappear when I moved across the
country to a small town in South
Carolina. If anything, they grew. From
the ages of 11 to 16 I hated myself;
when I looked in the mirror I would
cringe. This period of my life resonates with me today, as I can still
feel the scars of those experiences.
My life’s purpose became clear when
I began attending the University of
Florida. As a student, I developed a
passion for disability activism.
Through arguing points of equality,
beauty and pride in disability, I
internalized these ideas and developed the desire to catalyse positive
change for disabled people. I have
had the opportunity to represent the
United States at two international
conferences on disability rights in
Norway, published reports through
the United Nations and Rehabilitation
International, and organized large
campus events featuring various
notable disabled individuals.
Through these experiences, I came
to understand how the stigma related to disability leads to social and
economic oppression all over the
world. The reality is that the majority
of people, around 80 per cent in the
United States alone, will become disabled at some point in their lifetime.b
It is my professional aspiration to
initiate a national lobbying agency
that would work not only within the
established legal system, but also
through direct action to encourage
individuals, legislators and corporations to reconstruct the social
identity of disability.
Positive social evolution for disabled
persons can occur with education.
Information about issues affecting
the disabled could be added to public school curriculums, and training
sessions to raise awareness about
these issues could be mandated for
large companies, similar to race
and sexual harassment training.
Governments need to include disability issues in educational requirements. People often harbour
negative ideas about other groups of
people because of lack of awareness
and knowledge.
There is a duality in the need for a
cognitive revolution, existing within
able-bodied and disabled populations. All too often we internalize
negative stigmas concerning our
disability because we cannot see our
beauty. For most of my life I was the
only disabled person I knew, and I
found it truly difficult to look into the
mirror and see an aesthetically different person, and yet still see beauty. We need a sense of internal pride,
as much as society needs to accept
our abilities and assets. This realization has catalysed my desire to
compile a book about the beauty
in disability, featuring interviews
and photographs of both notable
and unknown disabled persons.
The book will be dedicated to all
disabled people who struggle to
see their beauty, much as I did for
so many years.
no longer internalize feelings of
shame about being disabled.
Bethany Stevens is a law student at
the University of Florida (UF) and
has been a disability activist for five
years. Ms. Stevens directed a campaign and petition process that
resulted in the opening of an accommodated testing centre for students
with disabilities at UF. She is the
president of the Union of Students
with Disabilities, founder of Delta
Sigma Omicron and recently
directed the Building a DisAbility
Movement conference hosted at UF.
See References, page 91.
After years of struggling to overcome the feeling of inadequacy and
shame that plagued my childhood
and early adulthood, I now believe
that being disabled is the best thing
that has ever happened to me. Never
would I have been afforded the wonderful opportunities I have experienced had it not been for my
disability. These opportunities and
the development of pride in my
existence came with a pivotal move
into my father’s home when I was 16
years old. He recognized my humanity and encouraged it to flourish,
teaching me how to drive and supporting my securing of a job. He
allowed me freedom that my mother
would have never condoned, and
with it I forged an identity that I love.
It is wonderful to finally love myself.
It is crucial that other parents of
children with disabilities allow their
children to obtain a sense of independence because it is necessary for
self-sufficiency. It is my hope that I
can assist those living with disability
in my community, as my father did
me, so that young people like me
THE ROOT CAUSES OF EXCLUSION
27
community – all act as disincentives to
school participation. When they attend
school, indigenous children often begin
their formal education at a disadvantage to
other children because they are unfamiliar
with the language of instruction. Research
indicates that it takes until the third grade
before their comprehension begins to
match that of children who speak the
dominant language.37
Neglect and stigmatization can result in
exclusion for children with disability
© UNICEF/HQ04-0971/Giacomo Pirozzi
There are an estimated 150 million children
with disabilities in the world, most of
whom live with the reality of exclusion.
The vast majority of children with disabilities in the developing world have no access
to rehabilitative health-care or support
services, and many are unable to acquire a
formal education.38 In many cases, disabled
children are simply withdrawn from community life; even if they are not actively
shunned or maltreated, they are often left
without adequate care. Where special provision is made for children with disabilities, it
often still involves segregating them in institutions – the proportion of disabled children
living in public institutions has increased,
for instance, in the countries of Central
and Eastern Europe since the onset of
political transition.39
Amazigh people must register their children
with a recognized Arabic name36 (see
Chapter 3: Invisible Children, for a fuller
discussion on the risk of exclusion from
birth registration).
In most countries, indigenous children have
low school enrolment rates. Scarce educational facilities, governments’ failure to
attract qualified teachers prepared to work
in the remote areas where many indigenous
people live and the perceived irrelevance of
much of the school curriculum for the local
28
Many disabilities in developing countries
are directly attributable to deprivations of
essential goods and services, especially in
early childhood. Lack of prenatal care adds
to the risk of disability, while malnutrition
can result in stunting or poor resistance to
disease. Disabilities resulting from poor
nutrition or lack of vaccines can be
addressed by concerted action and donor
support. The worldwide assault on polio – a
major cause of physical disability in the past
– has resulted in a dramatic reduction in the
disease, from 350,000 cases in 1988, when
the Global Polio Eradication Initiative was
launched, to 1,255 at the end of 2004.40
The disease is now endemic in only six
countries – Afghanistan, Egypt, India, Niger,
Nigeria and Pakistan – although transmission has been re-established in several countries. But despite this remarkable progress,
not every child has been reached, and the
T H E S TAT E O F T H E W O R L D ’ S C H I L D R E N 2 0 0 6
gains remain at risk of reversal until every
child is immunized.
Between 250,000 and 500,000 children are
still blinded each year by vitamin A deficiency, a syndrome easily prevented by oral supplementation costing just a few cents (given
every 4-6 months).41 Children involved in
hazardous labour or who have been conscripted as soldiers face greatly heightened
risks of disabling physical injury. Landmines
and explosive remnants of war continue to
maim or disable children even in countries
that are no longer in conflict. Of the 65
countries that suffered mine casualties
between 2002 and 2003, nearly two thirds
had not experienced active conflict during
the period.42
Regardless of the cause, or where they live,
children with disabilities require special
attention. Given the higher risk they face of
being excluded from school and within their
societies, communities and even households,
children living with disabilities are liable to
end up forgotten in campaigns for development that focus on statistical targets based
on national aggregates.
Tackling the root causes of
exclusion
The strategies to achieve the Millennium
agenda advanced in the reports of the
United Nations Millennium Project and of
the Secretary General address many of the
broad factors mentioned in this chapter and
call on governments, donors and international agencies to tackle them. Less emphasis is given, however, to specific measures
that would prevent exclusion for children
facing extreme poverty, armed conflict,
weak governance, HIV/AIDS, and discrimination in all its forms – particularly if,
despite the increased efforts of the international community, these factors persist over
the coming decade.
Children in the least developed countries
require special attention
Addressing the special – and urgent – needs
of the least developed countries has become
a priority objective for the international
community in recent years. In May 2001,
the Brussels Declaration and Programme of
Action for the Least Developed Countries
for the Decade 2001-2010 were endorsed by
the United Nations General Assembly. But
progress on the plan has not matched its
ambition. Despite significant advances by
some least developed countries towards
the plan’s individual goals, as a group they
have made only limited inroads towards
eradicating poverty and fostering sustainable development.
Reducing poverty in the least developed
countries will require greater efforts in five
major areas: national development strategies, official development assistance, full
debt cancellation, fair trade and enhanced
technical assistance from donors.43
Measures agreed in 2005 at both the
Group of Eight (G-8) Summit in July and
the World Summit in September will go
some way towards increasing official
development assistance and reducing external debt burdens for the least developed
countries. But for development strategies to
be truly effective and sustainable, they
require a stronger focus on children, who
account for around half of the population in
these countries. As Chapter 4 will attest,
poverty-reduction processes, and budgets in
particular, will need to be adjusted to
expand or reallocate resources for the social
development required to diminish the
deprivations faced by millions of children
living in the least developed countries. In
addition, even bolder initiatives may well be
required on official development assistance,
debt reduction and fair trade to ensure that
the Millennium agenda is met for the
world’s most impoverished nations.
Conflict resolution and prevention are
required to safeguard children and women
Preventing and resolving armed conflict are
central objectives of the peace and security
aims of the Millennium agenda, outlined in
detail in the Millennium Declaration. With
children and women most at risk from
armed conflict – accounting for around 80
per cent of all deaths among civilians due to
armed conflict since 199044 – conflict prevention and resolution are vital to ensure
their protection and access to essential services. Where conflict does occur, emergency
THE ROOT CAUSES OF EXCLUSION
29
The Global Campaign on Children and AIDS
Every minute, a child under 15 dies
of an AIDS-related illness.a Every
minute, another child becomes HIVpositive. Every minute, four young
people between the ages of 15 and
24 contract HIV.b
These stark facts underline the devastating impact that HIV/AIDS is
having on children and young people. The children of sub-Saharan
Africa are hardest hit, but unless the
HIV pandemic is halted and sent into
retreat, Asia is on course to have
higher absolute numbers of HIV
infections by 2010.c Millions of children, adolescents and young people
orphaned, made vulnerable or living
with HIV are in urgent need of care
and protection. If rates of HIV infection and AIDS-related deaths continue to rise, the crisis will persist for
decades, even as prevention and
treatment programmes expand.
HIV/AIDS is denying millions of
children their childhood. The disease
exacerbates the factors that cause
exclusion, including poverty, malnutrition, inadequate access to basic
social services, discrimination and
stigmatization, gender inequities
and sexual exploitation of women
and girls.
National governments committed
themselves to addressing the impact
of HIV/AIDS on children in the
Declaration of Commitment
endorsed at the United Nations
General Assembly Special Session
on HIV/AIDS in 2001. But progress
has been slow. Children are often
overlooked when strategies on
HIV/AIDS are drafted, policies formulated and budgets allocated. At the
2005 World Summit, world leaders
pledged to scale up responses to
30
HIV/AIDS through prevention, care,
treatment, support and mobilization
of additional resources.
The Global Campaign on Children
and AIDS – Unite for Children. Unite
against AIDS – launched in October
2005, is a concerted push to ensure
that children and adolescents are not
only included in HIV/AIDS strategies,
but become their central focus. An
overarching aim of the campaign is
to meet Millennium Development
Goal 6, which aims to halt and
reverse the spread of HIV/AIDS by
2015. Achievement of the campaign
goals will also have positive implications for the other MDGs.
Although global in reach, the campaign will have a strong focus on the
most-affected countries in subSaharan Africa, home to 24 of 25
countries with the world’s highest
levels of HIV prevalence.d The campaign seeks to provide a childfocused framework around country
programmes in four main areas,
dubbed the ‘Four Ps’:
Prevent infection among
adolescents and young people
Reduce HIV/AIDS risks and vulnerability by increasing access to and
use of youth-friendly and gendersensitive prevention information,
life skills and services.
Prevent mother-to-child HIV
transmission
Increase provision of affordable
and effective services that help
HIV-positive pregnant girls and
women avoid transmitting the
virus to their children. Prioritize
care, support and treatment programmes for HIV-infected children
and pregnant women.
T H E S TAT E O F T H E W O R L D ’ S C H I L D R E N 2 0 0 6
Provide paediatric treatment
Provide affordable paediatric HIV
drugs, such as cotrimoxazole, to
prevent opportunistic infections.
Protect and support children
affected by HIV/AIDS
Make sure a higher proportion of
the neediest children receive quality
family, community and government
support, including education, health
care, birth registration, nutrition and
psychosocial support.
The Global Campaign on Children
and AIDS involves partners from
every sector of the global community. It aims to unite as many people,
organizations and agencies as possible under its call to action. From the
outset, the campaign was positioned
within harmonized approaches,
especially the ‘Three Ones’ principles that were endorsed by a consensus of governments, international
organizations, donors and civil society; the WHO and UNAIDS ‘3 by 5’
Initiative, which aims to provide sustained treatment for 3 million people
living with HIV/AIDS; and national
poverty reduction strategies.
In partnership, governments and
agencies, activists and scientists,
corporations and community workers, and as many others as possible
will work through the campaign to
ensure that this is the last generation
of children that bears the bitter burden of HIV/AIDS.
See References, page 91.
responses should consist not only of providing essential services and goods, but also
preventing the separation of families and
helping to reunite them, initiating the
resumption of schooling, organizing child
protection and preventing HIV/AIDS.45
Children living in ‘fragile’ States must not
be forgotten
‘Fragile’ States require particular attention,
since a dysfunctional government will
complicate efforts to implement any policy
or obtain any non-humanitarian development assistance. Nonetheless, continued
engagement with governments of such
States – and also non-state actors who
may wield substantial power within these
countries – is often vital to safeguard children living in these countries from exclusion. Children must not be forgotten by
the international community because of
their countries’ failings.
A global campaign to mitigate the impact
of HIV/AIDS on children is under way
The international community is stepping up
its efforts to tackle HIV/AIDS through a
series of initiatives. These efforts are crucial
to check the spread of the disease and to
make treatment widely available. Far
greater attention must be given, however, to
the impact of the pandemic on children and
adolescents, especially girls, and to ways of
protecting them from both infection and
exclusion. To this end, UNICEF and its
partners have launched a global campaign
on children and AIDS (see Panel page 30).
Governments and societies must openly
address discrimination
Tackling discrimination requires a multipronged approach. Many elements of
discrimination are rooted in long-held societal attitudes, which often governments, civil
society and the media are reluctant to confront. Yet confront them they must, if they
are to fulfil their commitments to children.
Targeted initiatives to address the exclusion
faced by women and girls, ethnic and
indigenous groups and the disabled are
needed, along with legislation to prohibit
discrimination, and greater research on
these groups’ needs and well-being. Taken
by themselves, however, such measures may
only serve to reduce discrimination, not
tackle its root causes. For these initiatives to
bring about lasting change, they must be
accompanied by a courageous, open discussion – involving the media and civil society
– on societal attitudes that foster or tolerate
discrimination. The future of children at
risk of exclusion as a result of discrimination depends on such courageous action.
Swift and decisive action is required
A childhood cannot wait for extreme poverty to be eradicated, armed conflict to abate,
the HIV/AIDS pandemic to subside, or for
governments and societies to openly challenge attitudes that entrench discrimination
and inequalities. Once past, a childhood
can never be regained. For millions of children, their childhood and their future
depend on swift and decisive action being
taken now to address these threats.
THE ROOT CAUSES OF EXCLUSION
31
Extreme and Relative Poverty:
Precursors to Exclusion
MDG 1 focuses on halving extreme poverty
by 2015. While the most widely used
measure of poverty is the proportion of
people whose income is less than $1 a
day, poverty has multiple definitions and
numerous ways of affecting children.
Children experience extreme poverty
differently than adults: Child poverty
cannot be understood only in terms of
family income, and responses must take
children’s experiences into account. For
them, poverty is experienced as both
material and developmental deprivation.*
The exclusion resulting from poverty can
have lifelong impacts.
Children do not have to live in extreme
poverty to feel excluded. Research suggests
that when children do not consider themselves to be part of families whose material
conditions are close to what is considered
‘normal’ for their community, the impact
is greatly felt.** This relative deprivation is
based on the idea that people decide how
well off or deprived they are – what they
should deserve or expect – by comparing
themselves to others. Measuring the
distribution of wealth within a country or
territory by comparing the differences in
resources available to the wealthiest and
poorest sections of society is one simple
way to gauge inequality.
Even if the goal to end the extreme poverty
faced by millions is achieved, relative
deprivation – the inequality and exclusion
faced by children and their families – will
continue unless specific measures to
encourage equality and social mobility are
pursued, including the allocation of
resources for education, health care and
other interventions to ensure that the rights
of every child are fulfilled.
*
UNICEF, State of the World’s Children 2005, New York, 2004, p. 16.
**
See, for example, Christian Children’s Fund, Children in Poverty: The Voices
of Children, 2003.
32
T H E S TAT E O F T H E W O R L D ’ S C H I L D R E N 2 0 0 6
A Decent Standard of Living
THE ROOT CAUSES OF EXCLUSION
33
T H E S TAT E O F T H E W O R L D ’ S C H I L D R E N 2 0 0 6
Invisible Children
© UNICEF/HQ03-0011/Shehzad Noorani
Children risk becoming ‘invisible’ if their
right to protection is unmet
3
SUMMARY
The root causes of exclusion – extreme
poverty, poor governance, armed conflict,
HIV/AIDS, inequalities and discrimination –
have pernicious consequences beyond
excluding children from essential services.
They also foster conditions that heighten the
risk of children being exploited, neglected,
trafficked or abused. The breakdown in the
rule of law that often accompanies armed
conflict, for example, can leave children
exposed to sexual violence or exploitation.
Children orphaned or made vulnerable by
HIV/AIDS are not only at greater risk of
missing out on an education, they may
also face stigmatization and neglect in
their communities. Those who traffic
children look not in the rich suburbs but
in the slums and among the most destitute
for their victims.
ISSUE: At the extremes, children can become invisible, in effect disappearing from view within their families, communities and societies
and to governments, donors, civil society, the media and even other
children. For millions of children, the main cause of their invisibility is
violations of their right to protection. Firm evidence of the extent of
these violations is hard to acquire, but several factors appear central
to increasing the risk of children becoming invisible: the lack or loss
of formal identification; inadequate State protection for children without parental care; the exploitation of children through trafficking and
forced labour; and premature entry of children into adult roles such as
marriage, hazardous labour and combat. Children affected by these
factors include those not registered at birth, refugees and displaced
children, orphans, street children, children in detention, children in
early marriages, hazardous labour or combat, and trafficked and
indentured children.
By ratifying the Convention on the Rights
of the Child, governments pledged to safeguard children from harm, abuse, exploitation, violence and neglect. Yet for millions
of children, the violation of this right to
protection is the main cause of their exclusion. Many of them could claim membership in more than one of the groups
considered in this chapter. For example,
many children engaged in forced, hazardous
and exploitative labour have been trafficked, while large proportions of all the
children considered will not have been registered at birth. Marginalized and excluded,
children suffering from violations of their
right to protection have collided with the
very worst elements of adult experience,
from prostitution to hazardous labour, so
that the only element of their childhood that
remains is that which makes them more
vulnerable, more exploitable.
• Government commitment to child protection by providing budgetary
support and social welfare policies targeted at the most excluded
and invisible children.
ACTION: Making children visible requires creating a protective
environment for them. The key elements of a protective environment
include:
• Strengthening the capacity of families and communities to care for
and protect children.
• Ratification and implementation of legislation, both national and
international, concerning children’s rights and protection.
• Prosecution of perpetrators of crimes against children, and avoidance
of criminalizing child victims.
• An open discussion by civil society and the media of attitudes,
prejudices, beliefs and practices that facilitate or lead to abuses.
• Ensuring that children know their rights, are encouraged to express
them and are given vital life skills and information to protect themselves from abuse and exploitation.
• Availability of basic social services to all children without
discrimination.
• Monitoring, transparent reporting and oversight of abuses and
exploitation.
Key to building the protective environment is responsibility: All
members of society can contribute to ensuring that children do not
become invisible. While families and the State have the primary
responsibility for protecting children, ongoing and sustained efforts
by individuals and organizations at all levels are essential to break
patterns of abuse.
Children are visible in their families, communities and societies when their rights are
35
fully met, and they are provided with essential services and protection from harm.
Their visibility diminishes, however, when
they are deprived of parental care or face
violence or abuse within the home. They
also risk becoming less visible within their
communities and societies when they do not
attend school, are locked away in a workplace or are otherwise exploited, suffer
abuse or violence outside the family environment, or are simply not viewed or treated as children. Children may effectively
disappear from official view if their very
existence and identity is not legally or formally acknowledged and recorded by the
state or if they are routinely omitted from
statistical surveys, policies and programmes.
But we can also be blind to children’s plight
even when they are right in front of our
eyes, as is the case with children living and
working on the streets. All of these children,
without exception, require a level of protection that the world, until now, has manifestly failed to deliver.
At the extremes, these children in effect disappear from everybody’s view – they become
invisible in their communities and societies.
Firm evidence on the extent of the protection
violations that increase the risk of children
becoming invisible is hard to acquire, but
four factors appear central to many of them:
the lack or loss of a formal identity; inadequate State protection for children without
parental care; the exploitation of children
through trafficking and forced labour; and
children’s premature entry into adult roles,
such as marriage, hazardous labour and
combat. While these factors are not the only
ones that cause children to become invisible,
they are certainly among the most significant, with consequences that often extend
far beyond the years of childhood.
Loss or lack of a formal identity
or documentation
Every child is entitled to a formal identity,
including birth registration, the right to
acquire a nationality and the right to know
and be cared for by their parents. The
Convention on the Rights of the Child
makes it clear, in Articles 7 and 8, that it
is the duty of governments to ensure that
these rights are respected and enforced.
36
Without formal registration at birth or identification documents, children may find
themselves excluded from access to vital
services, such as education, health care and
social security. Reuniting families separated
from their children through natural disaster,
displacement or exploitation, such as trafficking, is often complicated by a lack of
formal documentation. Though many children may face exclusion because they do not
possess identity documents, the two groups
that appear most at risk are those unregistered at birth and those who have been
displaced or separated from their families.
Without birth registration, children are
invisible in official statistics
Exclusion operates from the very beginning
of life for the estimated 48 million children
in 2003 – 36 per cent of total births that
year – whose birth went unregistered.1
Having a child’s identity officially acknowledged and registered is a fundamental
human right, as stipulated by Article 7 of
the Convention on the Rights of the Child.
Registration enables a child to obtain a
birth certificate, which is the most visible
evidence of a government’s legal recognition
of the child as a member of society. A birth
certificate is also proof of the child’s fundamental relationship with parents and, generally, also determines nationality.
Birth registration may be needed for access
to services later in life, from a place in
school to treatment in a hospital. Cases of
child marriage where the spouse is believed
to be underage but the exact age cannot be
firmly established are almost impossible to
prosecute. Children who are unregistered at
birth may also miss out on any protection
that exists against premature conscription
into the armed forces or, if they come into
conflict with the law, against prosecution
and punishment as adults. When they grow
up, they may be unable to apply for a formal
job or a passport, open a bank account, get
a marriage license or vote. A birth certificate
may also be needed to obtain social security,
family allowances, credit and a pension.2
Although most countries have mechanisms
for registering births, the number of births
actually registered varies from country to
T H E S TAT E O F T H E W O R L D ’ S C H I L D R E N 2 0 0 6
Figure 3.1: Birth registration* in the developing world
100
92
Percentage of urban and rural annual births
registered by region, 1999-2004
Urban
Rural
60
80
77
80
62
59
55
56
47
44
40
44
35
33
28
35
28
25
20
0
Sub-Saharan
Africa
Eastern
and Southern
Africa
West and
Central
Africa
South Asia
East Asia
and Pacific
(excl. China)
Latin America
and Caribbean
Developing
countries
(excl. China)
Least
developed
countries
* Birth registration: Percentage of children under 5 years of age who were registered at the time of the survey. The numerator of this indicator
includes children whose birth certificate was seen by the interviewer or whose mother or caretaker says the birth has been registered.
Regional averages: These aggregates do not include all countries in each region. However, sufficient data covering more than 50 per cent of the
target population was available to generate the averages for the regions shown. Averages for East Asia and Pacific and the developing countries do
not include China.
Data range: Data refer to the most recent year available during the period specified.
Source: Multiple Indicator Clusters Surveys (MICS), Demographic and Health Surveys (DHS) and other national surveys.
country based on infrastructure, administrative capacity, available funds, access to the
population and technology for data management. The value of birth registration is often
overlooked due to the continuing lack of
awareness that registration is a critical
measure to secure the recognition of every
person before the law, to safeguard their
rights and to ensure that any violation of
these rights does not go unnoticed.3
Registration may not be seen as important
by society at large, by a government facing
severe economic difficulties, by a country at
war or by families struggling with day-today survival. It is often considered to be no
more than a legal formality, unrelated to
child development, health, education or protection. Other factors that influence birth
registration levels include the existence of an
adequate legislative framework, enforcement
of existing legislation on birth registration,
sufficient infrastructure to support the logis-
tical aspects of registration and the barriers
that families can encounter during registration, such as fees and distance to the nearest
registration centre.4
According to the latest UNICEF estimates,
on average over half – 55 percent – of births
in the developing world (excluding China)
each year go unregistered, a proportion that
rises to 62 per cent in sub-Saharan Africa.5
In South Asia, the share is higher still, at
70 per cent. Almost half the children in the
world who are denied their right to a legal
identity at birth live in this region: In
Bangladesh, only 7 per cent of all children
are registered at birth. There is wide variation in levels of birth registration, from the
Occupied Palestinian Territory and the
Democratic People’s Republic of Korea,
where virtually 100 per cent of births were
registered in 2004, to Afghanistan, Uganda,
and the United Republic of Tanzania, where
the rate is less than 7 per cent.6
INVISIBLE CHILDREN
37
During the same year, the total number of
people displaced within their own countries
by conflict or human rights violations
amounted to roughly 25 million.10
© UNICEF/HQ03-0121/Bill Lyons
Refugee and internally displaced children
face many risks, given the violence and
uncertainty surrounding both their flight
and their lives in the country and/or place
of asylum. They may become separated
from their families, lose their homes and
find themselves living in poor conditions
that jeopardize their health and education.
Unregistered births can serve as an indicator
of other forms of social marginalization and
disparity within countries or territories.
Unregistered children are more likely to be
the children of the poor: According to
household surveys from 2003, in the United
Republic of Tanzania children born into
families in the richest 20 per cent of the
population are over 10 times more likely to
be registered than those living in the poorest
20 per cent of households.7 Location is also
an important constraint on registration:
Rural children are 1.7 times more likely to
be unregistered than their urban peers.
Other factors that contribute to disparities
in birth registration include mothers’ education, loss of parents, religion and ethnicity.8
Refugee and displaced children and
women often lack visibility in their place
of refuge
At the end of 2004, roughly 48 per cent of
all refugees worldwide were children.9
38
Displacement complicates birth registration
and the issuance of travel documents, thereby compromising displaced persons’ right to
an identity. Both refugees and internally displaced people may have been forced to leave
their homes without proper documentation,
making it difficult to establish their identities. They may, therefore, be unable to
prove their right to receive basic social services, such as education or health care, or to
work in a different part of the country.11
The loss of family protection, and inadequate resources to address the needs and
challenges that refugee and internally displaced children face, can leave them at significant risk of military recruitment by
armed groups and forces, abuse and sexual
exploitation. Girls are especially at risk of
abduction, trafficking and sexual violence,
including rape used as a weapon of war.
Where the displacement is long term and the
affected children have a different ethnic or
linguistic background from people in the
host locality, they may face discrimination
and be deterred from school attendance as a
result.12 Upon return, both internally displaced people and refugees may find their
homes and their land taken over by others,
including local authorities, and may not be
able to prove their ownership of their property. They may also be rejected by their own
communities because they fled during the
crisis or violence while others remained.13
Primary responsibility for both refugee
and displaced children lies with national
governments. However, the Office of the
United Nations High Commissioner for
Refugees (UNHCR) has a mandate to assist
T H E S TAT E O F T H E W O R L D ’ S C H I L D R E N 2 0 0 6
and protect refugees, while the International
Committee of the Red Cross (ICRC) has
a mandate to assist internally displaced
people if displacement is a result of armed
conflict and internal violence. Unlike
refugees, however, internally displaced
persons are not protected by specific international conventions but only by a set of
guiding principles that are morally, not
legally, binding.
The international community and UNHCR
have developed a wealth of international
norms, policies and guidelines to improve
the protection and care of refugee women
and children. In practice, however, there is
still a gap in their application and implementation, due to resource constraints (both
financial and human) and to uneven priorities and accountability at the level of institutions, as well as within the international
community.14 When governments (both of
donor countries and countries that have
internally displaced people or host refugees)
and the collaborative international response
fail to allocate resources and implement
effective interventions targeted at displaced
women and children, these groups risk
being excluded and becoming invisible
within their place of refuge.
Inadequate state protection
for children requiring special
assistance
Families have the primary responsibility for
caring for and protecting their children. But
for numerous reasons – the loss of parents,
separation related to displacement, domestic
violence and abuse, extreme poverty, among
others – many children are deprived of a loving, caring family environment. When, for
whatever reason, family protection for children breaks down, States parties are obliged
under Articles 20 and 22 of the Convention
on the Rights of the Child to provide them
with special protection and assistance.
State failure to protect children without
parental care leaves them vulnerable and,
often, invisible
For all too many children, this assistance is
not forthcoming. Instead, they have to fend
for themselves in the adult world. It is no
surprise, then, that they often find themselves at risk of exclusion from essential
services and of being exploited.
Children who lack family protection, on a
temporary or permanent basis, are not the
only groups of children that States parties
have pledged to provide with special care
and attention. States are also bound under
Articles 20 and 40 of the Convention on the
Rights of the Child to protect children who
are already in their care, for example, in
institutions or detention. In the latter case,
it is the government’s duty to preserve the
dignity and worth of children who have
infringed the law. Again, the evidence available suggests that children in detention risk
being underserved by governments.
This section examines the risk of invisibility for three key groups of children who
require special assistance from State parties
and who often lack that protection:
orphaned children, street children, and
children in detention.
Loss of parents can leave children less
visible and less protected
Increasing numbers of children are forced
by the death of one or both parents to
assume responsibility, not only for their own
lives, but also for those of their younger
siblings, often with tragic consequences for
their rights and development.
At the end of 2003, there were an estimated
143 million orphans15 under the age of 18
in 93 developing countries.16 More than 16
million children were orphaned in 2003
alone. A major contributing factor to these
alarming figures is the HIV/AIDS pandemic,
without which the global number of
orphans would be expected to decline.17
Education is often among the first casualties
for an orphan. Children may drop out of
school because the domestic burdens upon
them become too great or because new caregivers within their community or extended
family are unprepared to meet the costs
attached to education. If that happens, they
also become more exposed to exclusion
from other services, including vital information about health, nutrition and life skills,
INVISIBLE CHILDREN
39
Figure 3.2: Orphaned children under age 18 in sub-Saharan Africa, Asia and Latin
America and the Caribbean
Total orphans as a percentage of all children under age 18
15
12
11.9
12.3
12.5
10.9 11.2
8.8
9
8.6
7.5
7.3
6.7
7.1
7.0
6.4
6
6.2
6.0
3
0
1990 1995 2000 2003 2010
1990 1995 2000 2003 2010
1990 1995 2000 2003 2010
Sub-Saharan Africa
Asia
Latin America and
the Caribbean
Note: Total orphans are children under age 18 whose mothers or fathers (or both) have died. The figures for 2010 are projections.
Source: Joint United Nations Programme on HIV/AIDS, United Nations Children’s Fund, United States Agency for International Development, Children on
the Brink 2004: A joint report of new orphan estimates and a framework for action, UNAIDS/UNICEF/USAID, New York, July 2004.
such as how to help protect themselves from
violence and abuse.
Orphaned children are much more vulnerable to protection violations. The death of a
parent, in situations where no adequate
alternative care systems are in place, opens
up a protection gap. Children living on
their own are at much greater risk of abuse
and exploitation. Assessments by the
International Labour Organization (ILO)
have found that orphaned children are much
more likely than non-orphans to be working
in commercial agriculture, as street vendors,
in domestic service and in the sex trade.
In the Ethiopian capital, Addis Ababa, for
example, 28 per cent of the child domestic
workers interviewed in one study were
orphaned.18 A study of children working –
many in prostitution – in Zambia found that
one third were single or double orphans.19
Though physically visible, street children
are often ignored, shunned and excluded
Street children are among the most physically visible of all children, living and working
40
on the roads and public squares of cities all
over the world. Yet, paradoxically, they are
also among the most invisible and, therefore, hardest children to reach with vital
services, such as education and health care,
and the most difficult to protect.
The term ‘street children’ is problematic as it
can be employed as a stigmatizing label. One
of the greatest problems such children face is
their demonization by mainstream society as
a threat and a source of criminal behaviour.
Yet many children living or working on the
streets have embraced the term, considering
that it offers them a sense of identity and
belonging. The umbrella description is convenient shorthand, but it should not obscure
the fact that the many children who live and
work on the street do so in multifarious
ways and for a range of reasons – and each
of them is unique, with their own, often
strongly felt, points of view.20
The exact number of street children is
impossible to quantify, but the figure almost
certainly runs into tens of millions across
the world.21 It is likely that the numbers are
T H E S TAT E O F T H E W O R L D ’ S C H I L D R E N 2 0 0 6
Most street children are not orphans.
Many are still in contact with their families
and work on the streets to augment the
household income. Many others have run
away from home, often in response to psychological, physical or sexual abuse. The
majority are male, as girls seem to endure
abusive or exploitative situations at home
longer (though once they do leave their
home and family, they are generally less
likely to return).23
Once on the street, children become vulnerable to all forms of exploitation and abuse,
and their daily lives are likely to be far
removed from the ideal childhood envisioned in the Convention on the Rights
of the Child. In some cases, those who are
entrusted to protect them become the perpetrators of crimes against them. Street children often find themselves in conflict with
the police and other authorities and have
been harassed or beaten by them. They have
been rounded up, driven outside city limits
and left there. And they have been murdered
by vigilantes in the name of ‘cleaning up the
city’, often with the complicity or disregard
of local authorities.
Children in detention should be among
those most visible to national authorities,
but they are often not treated like children
Logic would suggest that children held
within the criminal justice system should
be among the most visible children of all,
readily accessible to interventions that
ensure their access to health care, education
and protection. But often children in conflict with the law effectively cease to be
regarded as children. Instead, their perceived transgression is considered to
remove them from childhood protection,
exposing them to treatment either in exactly the same way as adult offenders or,
worse, to having their vulnerability as
children abused.
© UNICEF/HQ01-0614/ Shehzad Noorani
increasing as the global population grows
and as urbanization continues apace:
6 out of 10 urban dwellers are expected to
be under 18 years of age in 2005.22 Indeed,
every city in the world has some street children, including the biggest and richest cities
of the industrialized world.
Data on children in detention are scarce,
but estimates indicate that more than
1 million children are living in detention as
a result of being in conflict with the law.24
Yet in this area there is no excuse for the
lack of information. Unlike many of the
other children considered in this report,
children caught up in the criminal justice
system in most countries have been processed and are available to official scrutiny.
Nevertheless, it is clear that violent abuse of
children in detention is a widespread and
serious problem. In its 37th session, the
Committee on the Rights of the Child raised
a number of concerns about the procedures
for and protection of children caught up in
the justice system in Brazil, among other
countries, including reports of torture and
extrajudicial killings in detainment facilities.25
Children are at risk of violence while in
detention both before and after any trial
they may undergo. This can include physical
and sexual violence by adult detainees,
guards, police or other juvenile inmates. The
correctional regime is itself at times excessively violent, involving indefinite detention,
long periods of isolation or, alternatively,
co-mingling with adult prisoners in overcrowded and unsanitary conditions. In a
small number of countries, the death penalty is still applied to juvenile offenders. The
INVISIBLE CHILDREN
41
Children of the streets
by Elena Poniatowska
According to the ‘Estudio de Niños
Callejeros’ – an official study of
street children – there are 11,172
children living and working on the
streets in Mexico City, the world’s
largest city. They wash cars and
buses, run errands and carry soft
drinks. Boys hate being loaders.
Either they end up with spinal
injuries or are run down by cars.
Underlying it all is smog, heavy traffic and extreme poverty in addition
to violence, social disintegration and
environmental deterioration. Drugs
and delinquency are commonplace.
All those who pass by see them, but
they are invisible. They do not exist.
The police look at them without seeing them. Everything isolates them,
denounces them.
In the street the children wash windshields and swallow fire. Almost all
the passers-by are indifferent to the
magic in their faces and hands. They
wait for clients with their instruments in their hands, and in the
darkness the studs on their charro
outfits sparkle, their wide-brimmed
hats glitter. They are guitars, violins,
trumpets of Jericho, voices in search
of a listener, jugglers, clowns, magicians. The red light never stops for
them, and the show goes on until
three or four in the morning, especially on Fridays and Saturdays,
when couples feel romantic and give
them a few more pesos.
In the street, everything is raw:
reality, food, eyes, solidarity.
Nothing has to be elaborated.
Everything is thrown in their faces:
aggressive nicknames, ruthless
laughter, plunder, sneering, ridicule,
the scar that never heals, the manhandling, the crudeness.
School can bring further anguish for
these children, even the most innocent ones. It is hard for them to
retain what they are taught: They
have lost their capacity for concentration. Besides, they do not want to
know anything about roofs or walls:
What can compare to the street? The
street is an addiction.
Only the street is theirs. It compensates for loneliness, rejection, lack of
love. It lures them. It gives them the
money they never got at home. It
gives them rhythm, tempo and
immediate retribution. “I’m someone, I’m something, I just earned
my dinner.”
problem of violence against children in
detention is being addressed in the United
Nations Secretary-General’s Study on
Violence Against Children, the report of
which is due to be released in 2006.
According to a group of international
experts convened in April 2005 as part of
the UN Secretary-General’s study, the key
factors that facilitate violence against children in the justice system are:
• Impunity and lack of accountability by
law enforcement agents, institutions and
staff that are responsible for violence
against children.
42
Time is different for these children.
They do not care what day it is. The
days of the week trap them. The
hours are the hours of their disaster.
They know only two seasons, dry
and rainy. The rainy season (from
June to September) is the bad one
because afternoon paralyzes all
street activities. It is also impossible
to play ball, and that is one thing
they love.
Elena Poniatowska is a writer, journalist and professor, who, though
born in Paris, has lived in Mexico
since she was a child. She has written several celebrated books and is
the recipient of numerous awards
and honours, including a
Guggenheim Fellowship, an
Emeritus Fellowship from Mexico’s
National Council of Culture and Arts,
and the Mexican national award
for journalism.
• The overuse of detention, particularly
pre-trial detention, including the detention
of non-offenders.
• The lack of community-based alternatives
to the formal justice system and of alternatives to detention, including care and
protection systems.
• The lack of appropriate juvenile justice
systems, including appropriate facilities
and separation from adults.
• The lack of external controls on institutions, including effective independent
complaints and investigation procedures,
T H E S TAT E O F T H E W O R L D ’ S C H I L D R E N 2 0 0 6
independent monitoring and access by
non-governmental organizations.
• The ‘acceptability’ of violence in society,
leading to tolerance of violence at all
levels: family, school and community.
• The lack of training and sensitization
of law enforcement and juvenile justice
personnel.
• ‘Tough on crime’ policies, negative media
and discriminatory images of street
children and other socio-economically
disadvantaged children.26
Governments have a clear responsibility
to protect children in detention from abuse
and harm. But they must also question
whether a child should be in detention
at all. Detention should always be a last
resort: In many cases it is too readily adopted as an immediate response to antisocial or
disruptive behaviour by children and adolescents, as if removing them out of sight and
out of mind is a goal in itself, rather than
an unintended consequence.
Premature entry into adult roles
Childhood should be a separate space from
adulthood, a time when children can grow
and play, rest and learn. This distinction
embodies the spirit of the Convention on
the Rights of the Child, which delineates
rights that are particular to children as
distinct from adults.
Children engaged in adult roles are often
no longer viewed as children
In its Preamble, the Convention on the
Rights of the Child recognizes that children’s bodies and minds are less mature
than those of adults;27 consequently, roles
appropriate for adults may not be suitable
for children. Performing adult roles will
inevitably result in children missing out on
their childhood, and therefore facing a higher risk of exclusion and invisibility.
Children, especially girls, often take on
adult roles by caring for family members,
often siblings, or by working to contribute
to the family income. Being orphaned and
living in extreme poverty are two clear
examples of circumstances where children
may have little choice but to adopt these
roles. These children risk exclusion from
protection and essential services.
Adult roles often carry a high risk of injury
to children’s physical and mental well being.
This is particularly true of three types of
roles: combat, marriage and hazardous
labour. Children engaged in these activities
are not only prevented from having a childhood, but also often risk death or serious
injuries that can have lifelong consequences.
Obstacles to the reintegration of former
child soldiers can lead to their isolation
Hundreds of thousands of children are
caught up in armed conflict as combatants,
messengers, porters, cooks and sex slaves
for armed forces and groups.28 Some are
abducted or forcibly recruited; others are
driven to join by poverty, abuse and discrimination, or by the desire to seek revenge
for violence enacted against them and their
families.29 While under the control of the
armed groups, these children are excluded
from essential services and protection.
Ending the recruitment of child soldiers and
returning them to their families and communities is an obvious prerequisite for them to
gain inclusion and prevent further violations
of their rights. Disarmament, demobilization
and reintegration (DDR) programmes use a
variety of interventions, ranging from backto-school initiatives to psychosocial support.
Stigmatization can be reduced when reintegration support targets the community as a
whole. But despite these initiatives, many
obstacles to the full reintegration of child
soldiers remain.
Girls, in particular, may benefit less from
DDR initiatives. Save the Children reports
that since it began working with children
associated with armed groups in the
Democratic Republic of the Congo, fewer
than 2 per cent of children passing through
their programmes and interim care centres
have been girls, though they estimate that
40 per cent of all children involved with
armed groups are female. Similarly, in Sierra
Leone, less than 5 per cent of girls known to
INVISIBLE CHILDREN
43
have been involved in militias benefited
from DDR initiatives.30
Early marriage robs girls of their
childhood
Numbers of girl soldiers are routinely
underestimated, and girls are often not
considered real soldiers because they
perform mainly non-combat functions.
As a result, most of them return to their
communities without any formal assistance
or counselling, leaving them with a host
of unresolved psychosocial and physical
issues. Moreover, girls abducted or forcibly
recruited who return with babies born in
captivity may be rejected by their families
and communities because of the stigma
attached to rape and to giving birth to
so-called ‘war babies’ or ‘babies born of
rape’. For these girls, being marginalized
by DDR programmes represents an additional layer of invisibility to those imposed
by their involvement in conflict and
with militias.
Every year, millions of girls disappear into
early marriage – defined as formal marriages, or customary and statutory unions
recognized as marriage, before the age of
18. On marrying, a girl is expected to set
aside her childhood and assume the role of
a woman, embarking immediately upon a
life that includes sex, motherhood and all
the household duties traditionally expected
of a wife.
Although early marriage sometimes extends
to boys as well, the number of girls involved
is far greater. According to an analysis of
household survey data for 49 developing
countries conducted by UNICEF in 2005,
48 per cent of South Asian females aged 15
to 24 had married before age 18. (At 18, a
girl is still considered a child under the
Children and young people in detention in Nigeria
Her eyes welled up as she struggled
to hold back the flood of tears that
threatened to ruin her neatly pressed
coveralls. Soon the floodgates opened
as she recounted the details of the past
five and a half years spent in jail.
Nkeiruka became pregnant while
unmarried, which is considered a taboo
among the Igbo community in Nigeria
to which she belongs. In December
1999, the then 15-year-old Nkeiruka
gave birth unassisted at home, and her
child died as a result of complications.
Her uncle accused her of killing her
newborn, and Nkeiruka and her mother
Monica were arrested and taken to
prison in Anambra state. Now 21,
Nkeiruka faces an uncertain future:
Deprived of a formal education while in
prison and possessing few skills, she is
uncertain of the reception she and her
mother will receive from the community and family when they return home.
A proper investigation was never conducted, no evidence of the alleged
crime was found and the original case
44
file disappeared. Nkeiruka and her
mother slept in a cell with up to 37
women for around 1,971 days. “Much
like the many other children and young
people who are incarcerated in Nigeria,
they were forgotten,” says Nkolika
Ebede of the International Federation
of Women Lawyers in Anambra, who,
in a UNICEF-supported project, helped
secure their release.
Nkeiruka was one of over 6,000 children and teenagers in Nigeria who are
in prison or juvenile detention
centres.a About 70 per cent of them
are first-time offenders,b usually
arrested for misdemeanours such as
vagrancy, petty stealing, truancy or
simply wandering or hanging around
the streets. Others are detained at the
request of their parents or guardians,
who say that they are out of control.
Many of these children come from
broken homes and large poor families,
or are orphans. According to Uche
Nwokocha of the Society for the
Welfare of Women Prisoners in
T H E S TAT E O F T H E W O R L D ’ S C H I L D R E N 2 0 0 6
Enugu, children – some still quite
young – have been held in custody by
the police in the place of their parents.
Young people, especially girls, are
also victims of criminal acts such
as domestic violence, rape, sexual
exploitation and trafficking. However,
due to aberrations and delays in the
administration of justice, especially
during investigations leading to trial,
these child victims can find themselves in jail. Their parents are denied
access to them and they are deprived
of due process, detained under
deplorable conditions, put in contact
with adult criminals, at risk of
physical and sexual abuse, and often
denied their right to bail. Many children are forced to admit to being
older than they are or the police
change their ages on arrest warrants
in order to prosecute them as adults.
Prisons in Nigeria offer little educational or vocational training or recreational
facilities. For a while, Nkeiruka was
Convention on the Rights of the Child,
except in countries where the age of majority is lower.) The corresponding figures in
the 29 countries surveyed for Africa and 8
countries for Latin America and the
Caribbean are 42 per cent and 29 per cent,
respectively.31 The incidence varies widely
between countries as well as continents: In
sub-Saharan African countries surveyed, for
instance, Niger had the highest rate of
women between 20-24 who were married
by age 18 (77 per cent); in contrast, this rate
dropped to 8 per cent in South Africa.32
Some of these girls are forced into marriage
at a very early age, while others may accept
the marriage while being too young to
understand its implications or play any
active part in the choice of partner. Where
early marriage is practised, it is usually a
long-established tradition, making protest
not just difficult but barely possible. Early
taught soap-making and knitting, but
she says the classes abruptly stopped
in 2003. Limited or no counselling
services are available to detained juveniles. While in detention, about 90 per
cent of young people do not get proper meals, bedding or access to toilets
and bathing facilities, making them
vulnerable to sickness and disease.
Nkeiruka and her mother were lucky to
share the cell with women. Many other
female prisoners are housed in mixed
cells, increasing the risk of sexual
abuse and exploitation.
Where juvenile courts do not exist, children and youths are tried in adult
courts. Lacking the means to secure
legal representation, or to pay bail,
they often languish in jail for long periods. Juveniles in prison are often cut
off from family and friends, as a deepseated fear and distrust of the police
and justice system leads people to
shun those who come in contact with
the law, whether as perpetrators or victims. Stigmatization and rejection by
marriage tends to ensure that a woman is
firmly under male control, living in her husband’s household, and also supposedly
guards against premarital sex for women. In
many societies, the independence that can
emerge during adolescence is seen as an
undesirable attribute in women, who are
expected to be subservient: Early marriage is
therefore convenient because it effectively
cancels out the adolescent period, quenching
the sparks of autonomy and strangling the
developing sense of self.
Poverty is another factor underpinning early
marriage. Marriage can be seen as a survival
strategy for a girl – particularly if she marries an older and wealthier husband. In
West Africa, for example, a UNICEF study
in 2000 showed a correlation between economic hardship and a rise in early marriage,
even among some population groups that
do not normally practise it.33 There are also
society further affect the reintegration
of victims. During the five and a half
year incarceration, Nkeiruka received
only one visitor, a sibling, in the week
before her scheduled release date.
Since 2003, UNICEF Nigeria has helped
to promote improved treatment and
legal aid for juveniles in conflict with the
law. As part of the Juvenile Justice
Administration project – undertaken in
partnership with the National Human
Rights Commission, the Nigerian Bar
Association and local non-governmental
organizations – a pro bono service was
introduced and institutionalized for
lawyers renewing their licences with the
association. UNICEF has assisted in
supporting the training of magistrates,
police, prison officers, lawyers and
social workers in juvenile justice administration, which has strengthened the
provision of free legal services for children, young people and women.
The project, which aims to reduce the
number of children being detained,
was started in three pilot states in
southern Nigeria. By mid-2005, almost
600 children had benefited from the
project in these states, either by being
released from prison or detention centres, being granted bail, having their
cases dismissed or settled out of court,
receiving counselling or having the
project handle their ongoing case.
The number of children and young
people in detention has decreased as a
result of the project. The training of
magistrates has facilitated more careful
use of custodial sentencing of juveniles
to prison terms for minor offences.
Police officers are exercising restraint
in detaining juveniles in police cells for
minor offences and instead immediately take them to court for processing.
Given its success, the project is now
being implemented in nine additional
states throughout the country in a
strong partnership with the Nigeria
Police Service.
See References, page 92.
INVISIBLE CHILDREN
45
Figure 3.3: Early marriage* in the developing world
Percentage of women 20-24 who were married by age 18,
1986-2004
60
56
57
Urban
54
Rural
50
48
45
43
40
33
31
28
30
25
27
25
24
21
22
20
12
10
0
Sub-Saharan
Africa
Eastern
and Southern
Africa
West and
Central
Africa
South Asia
East Asia
and Pacific
(excl. China)
Latin America
and Caribbean
Developing
countries
(excl. China)
Least
developed
countries
* Early marriage: Percentage of women aged 20-24 that were married or in statutory or customary union recognized as marriage before
they were 18 years old.
Regional averages: These aggregates do not include all countries in each region. However, sufficient data was available for more than
50 per cent of the target population to generate the averages for the regions shown. Averages for East Asia and Pacific and the developing countries do not
include China.
Data range: Data refer to the most recent year available during the period specified.
Sources: Multiple Indicator Cluster Surveys (MICS), Demographic and Health Surveys (DHS) and other national surveys.
reports from East Africa that girls orphaned
by HIV/AIDS are increasingly being steered
towards early marriage by caregivers who
find it hard to provide for them.34
However it arises, early marriage jeopardizes
the rights of children and adolescents. The
right to free and full consent to marriage is
recognized in the Universal Declaration of
Human Rights, while Article 16 of the
Convention on the Elimination of All Forms
of Discrimination against Women stipulates
that “the betrothal and the marriage of a
child shall have no legal effect…”.35 Early
marriage can put an end to all educational
development and opportunities for children.
All too often it is the gateway to a lifetime
of domestic and sexual subservience.
Early marriage also has physical implications for young girls, notably premature
pregnancy and childbirth, which entail vastly increased risks of maternal and neonatal
mortality. Pregnancy-related deaths are
the leading cause of mortality for 15- to
46
19-year-old girls worldwide, whether they
are married or not. Those under 15 are five
times more likely to die than women in their
twenties.36 Their children are also less likely
to survive: If a mother is under 18, her
baby’s chance of dying in the first year of
life is 60 per cent higher than that of a baby
born to a mother older than 19.37
Children engaged in hazardous forms
of labour risk serious injury and often
miss out on an education
An estimated 246 million children between
5 and 17 are engaged in child labour,
according to the latest estimates from the
International Labour Organization (ILO).
Of these, nearly 70 per cent or 171 million
children were working in hazardous situations or conditions, such as in mines, with
chemicals and pesticides in agriculture or
with dangerous machinery. Some 73 million
of them are less than 10 years old.38 Their
physical immaturity leaves them more
exposed to work-related illnesses and
T H E S TAT E O F T H E W O R L D ’ S C H I L D R E N 2 0 0 6
Early marriage and fistula
At least 2 million young women in
the developing world suffer the
painful, humiliating and devastating
consequences of obstetric fistula.
Caused by complications during
childbirth, usually because the
young woman’s pelvis is too small
or because the baby is too big or
badly positioned, obstetric fistula
manifests itself as a hole between a
woman’s vagina and her bladder,
rectum or both, creating a constant
leakage of urine or faeces. Girls and
young women suffering from fistulas
are ostracized by their communities
and often abandoned by their families, forcing many to become desperate beggars.
Once widespread in Europe and
America, fistulas were eradicated by
modern medical care early in the
20th century. They are still common
in the developing world, however,
where malnutrition and stunted
growth make obstructed labour
more likely, where cultural practices
and poverty lead to early marriages
and early pregnancies, and where
health care is largely unavailable or
extremely limited.
Young girls are often pressured to
get pregnant soon after marriage
and may face a variety of barriers to
accessing contraceptive services. In
spite of laws against early marriage
in many countries, 82 million girls in
developing countries will be married
before they turn 18. Worldwide,
some 14 million women and girls
between 15 and 19 give birth each
year.
Teenage pregnancies are risky, and
the younger the girl, the higher the
risk. Girls under 15 are five times
more likely to die in childbirth than
women in their twenties. Many of
those who survive days of obstructed labour end up with fistula. Thus,
delaying a girl’s first pregnancy is a
critical strategy for reducing fistula
and maternal death, as well as an
important public health issue.
Fistula is preventable, and also treatable through surgery that costs
under $300. In 2003, the United
Nations Population Fund (UNFPA)
launched a Global Campaign to End
Fistula in response to emerging
evidence of the devastating impact
obstetric fistula has on women’s
lives. The campaign involves a wide
range of partners and currently operates in some 30 countries in subSaharan Africa and South Asia and
in some Arab States. The long-term
goal is to make fistula as rare in
injuries than adults, and they may be less
aware of the risks involved in their occupations and place of work. Illnesses and injuries
include punctures, broken or complete loss of
body parts, burns and skin disease, eye and
hearing impairment, respiratory and gastrointestinal illnesses, fever and headaches from
excessive heat in the fields or in factories.
Although the numbers of illnesses and
injuries from hazardous child labour are
highest by far for children working in the
agriculture sector – which employs two thirds
of all working children – the incidence of
developing nations as it is in industrialized countries today.
The campaign works to prevent
fistula from occurring, treat women
who are affected and help women
reintegrate into their communities
once they are healed. In Niger, 600
community health agents have
received basic training on fistula
prevention. In Nigeria, 545 women
have received surgery and dozens
of doctors and nurses have been
trained in fistula care. In Chad,
hundreds of women have been
taught new skills and received small
grants following surgery through an
income-generation project.
Each country that joins the campaign
passes through three steps. First,
national needs are assessed to determine the extent of the problem and
the resources required. Next, a
national response is formulated
based on needs identified. Finally,
programmes focusing on prevention,
treatment and reintegration of cured
patients into their communities are
implemented.
See References, page 92.
injuries for children is highest in construction and mining. One boy in every four and
more than one in every three girls working
in construction suffers work-related injuries
and illness; the corresponding incidences for
mining are a little more than one in every six
boys and one in every five girls.39
But it is not only injury, sickness and even
death that children risk when involved in
hazardous labour. They also often miss out
on an education that would provide the
foundation for future employment as an
INVISIBLE CHILDREN
47
© UNICEF/HQ04-1200/ Roger Lemoyne
Figure 3.4: Total economic costs and benefits of
eliminating child labour over the period
2000-2020
US$ billion, at purchasing
power parity
Economic costs
Education supply
Transfer implementation
Interventions
Opportunity costs
Total Costs
Economic benefits
Education
Health
Total benefits
493.4
10.7
9.4
246.8
760.3
5,078.4
28.0
5,106.4
Net economic benefit (total benefits – total costs) 4,346.1
Transfer payments
213.6
Net financial benefit
4,132.5
(net economic benefit – transfer payments)
Source: International Labour Organization, Investing in Every Child: An economic study on
the costs and benefits of eliminating child labour, International Programme on the
Elimination of Child Labour, ILO, Geneva, 2004.
48
adult in less dangerous occupations. As
Figure 3.4 clearly attests, the net economic
benefits of eliminating child labour, hazardous or not, for individuals and societies
would heavily outweigh the economic costs.
The scale of the worst forms of child labour
makes it an urgent issue for the Millennium
agenda, especially in the area of education.
Unless millions of children currently
working in hazardous conditions are
reached, the goals of attaining universal
primary education (MDG 2) and gender
parity in primary and secondary education
(a key indicator for MDG 3) will not be
reached. A key starting point will be to step
up efforts to eliminate immediately the
worst forms of child labour, as stipulated by
the International Labour Organization’s
Convention No. 182. Education that is safe,
accessible and of a high quality is the best
way to encourage families to send their
children to school and to prevent children
from engaging in hazardous labour.
T H E S TAT E O F T H E W O R L D ’ S C H I L D R E N 2 0 0 6
Exploitation of children
Figure 3.5: Forced commercial sexual exploitation
In the aftermath of the Indian Ocean
tsunami that struck in late December 2004,
there were fears that children, particularly
those separated from their parents, were
at risk of being trafficked and exploited.
Protection measures were immediately
adopted by international agencies and
national governments to prevent widespread
abuse. Nonetheless, incidents of exploitation
were reported, including a growth in the
recruitment of child soldiers. These incidents
underline the increased vulnerability of
children to exploitation when they are
deprived of family protection.
2%
98%
Women and girls
Men and boys
Source: International Labour Organization, ‘A Global Alliance against Forced Labour’, ILO,
Geneva, 2005.
Preventing the exploitation of children and
bringing the perpetrators to justice is one of
the most pressing issues on the international
agenda, but one that is not being given sufficient attention. In particular, the trafficking of children – who are then often forced
into commercial sex work, hazardous
labour or domestic service – is a widespread
aspect of the problem and merits special
attention by both national governments and
the international community. Children who
are victims of exploitation are arguably
among the most invisible, as their abusers
will prevent them from accessing services
even if these are made available.
more disempowered by being transported to
a place where they do not speak the local
language, making it much more difficult for
them to seek help or escape. Because they
are there illegally and without documents,
they may feel unable to trust the police or
other officials or to access the rights of citizens that entitle them to services.
Trafficked children are also almost invisible
to the eye of the statistician. Collecting data
Trafficking of children takes many different
forms. Some children are forcibly abducted,
others are tricked and still others opt to let
themselves be trafficked, seduced by the
promise of earnings but not suspecting the
level of exploitation they will suffer at the
other end of the recruiting chain. Trafficking
always involves a journey, whether within
a country – from the rural areas to a tourist
resort, for example – or across an international border. At the final destination,
trafficked children become part of an underground world of illegality into which they
effectively disappear.
The relocation takes children away from
their families, communities and support networks, leaving them isolated and utterly vulnerable to exploitation. Often they are even
© UNICEF/HQ01-0423/ Donna Decesare
Trafficking causes multiple rights
violations for children
INVISIBLE CHILDREN
49
those countries affected by conflict, they
can be directly abducted by militias.
Figure 3.6: Child labour* in the developing world
Sub-Saharan
Africa
• In East Asia and the Pacific, most trafficking is into child prostitution, though some
children are also recruited for industrial
and agricultural work. It is largely driven
by poverty and especially by the pull of
the wealthier countries in the region. Girls
are also recruited as mail-order brides and
for domestic service.
34
37
Eastern and
Southern Africa
29
34
West and
Central Africa
41
41
Middle East and
North Africa
7
9
Female
15
14
South Asia
East Asia and
Pacific (excl. China)
Male
10
11
Latin America
and Caribbean
8
11
Developing countries
(excl. China)
17
18
Least developed
countries
26
29
0
5
10
15
20
25
30
35
40
45
50
Percentage of children aged 5-14 involved
in child labour activities, 1999-2004
* Child labour: A child is considered to be involved in child labour activities under the
following classification: (a) children 5 to 11 years of age that during the week preceding
the survey did at least one hour of economic activity or at least 28 hours of domestic
work; (b) children 12 to 14 years of age that during the week preceding the survey did at
least 14 hours of economic activity or at least 42 hours of economic activity and domestic
work combined.
Regional averages: These aggregates do not include all countries in each region.
However, sufficient data was available for more than 50 per cent of the target population
to generate the averages for the regions shown. Averages for East Asia and Pacific and
the developing countries do not include China.
Data range: Data refer to the most recent year available during the period specified.
Source: Multiple Indicator Cluster Surveys (MICS) and Demographic and Health Surveys
(DHS).
about these children is notoriously difficult.
Although reliable global statistics are impossible to compile, it is estimated that trafficking affects about 1.2 million children each
year.40
Though the trafficking of children is a shadowy practice with neither particular rules
nor predictable sequences, some dominant
regional patterns are identifiable:
•• In
In West
West and
and Central
Central Africa,
Africa, the
the most
most comcommon
form
of
trafficking
is
an
extension
mon form of trafficking is an extension of
of
aa traditional
traditional practice
practice –– often
often aa survival
survival
strategy
strategy –– whereby
whereby children
children are
are ‘placed’
‘placed’ in
in
marginal
positions
within
other
marginal positions within other families.
families.
Increasingly,
Increasingly, this
this practice
practice is
is being
being used
used to
to
exploit
children’s
labour,
both
within
exploit children’s labour, both within and
and
outside
outside the
the home.
home. Children
Children are
are also
also traftrafficked
into
plantations
and
mines,
ficked into plantations and mines, and
and in
in
50
• In South Asia, trafficking forms part of the
immense child labour problem in the subcontinent, often related to debt bondage,
whereby a child is in effect ‘sold’ to pay off
a debt, frequently a debt deliberately
imposed by the exploiter with this in mind.
In addition, significant numbers of children
are trafficked for other purposes, including
into prostitution, carpet and garment factories, construction projects and begging.
• In Europe, children are mainly trafficked
from east to west, reflecting the demand
for cheap labour and child prostitution in
the richer countries of the continent.
There are organized criminal gangs
exploiting the open borders to channel
children into unskilled labour, work in the
entertainment sector and prostitution.
• In the Americas and the Caribbean, much
of the visible child trafficking is driven by
tourism and focused on coastal resorts,
again feeding a demand for child prostitution and easily exploitable labour.
Criminals who move drugs across borders
are reportedly becoming involved in
human trafficking as well.41
Often children trafficked into one form of
labour may be later sold into another, as
with girls from rural Nepal, who are recruited to work in carpet factories or hotels in
the city, but are then trafficked into the sex
industry over the border in India. In almost
all countries, the sex trade is the predominant form of exploitation of trafficked children, a practice that entails systematic,
long-term physical and emotional abuse.42
Children in forced labour and domestic
service are among the most invisible
An estimated 8.4 million children work
under horrific circumstances: They are
T H E S TAT E O F T H E W O R L D ’ S C H I L D R E N 2 0 0 6
forced into debt bondage or other forms of
slavery, into prostitution and pornography
or into participation in armed conflict or
other illicit activities.43
Figure 3.7: Children in unconditional worst forms*
of child labour and exploitation
(thousands; 2000)
According to the ILO, “forced labour is
present in all regions and kinds of economy…. The offence of exacting forced labour
is very rarely punished…. For the most part,
there is neither official data on the incidence
of forced labour, nor a widespread awareness among society at large that forced
labour is a problem. It remains, with very
few exceptions, one of the most hidden
problems of our times.”44
Debt bondage, whatever the origin of the
debt, leaves children under the complete
control of a landowner, entrepreneur or
moneylender in a state little distinguishable
from slavery. They may be making gravel in
Latin America or bricks in South Asia, or
quarrying stone in sub-Saharan Africa.45
The work is often hazardous and much too
heavy to be appropriate for children; the
conditions of service betray every aspect and
principle of human rights, let alone any
conception of childhood.
Children in domestic service are also
among the most invisible child labourers.
Their work is performed within individual
homes, removed from public scrutiny, and
their conditions of life and labour are
entirely dependent on the whims of their
employer. The number of children involved
in domestic service around the world is
unquantifiable because of the hidden nature
of the work, but it certainly runs into the
millions. Many of these children are girls,
and in many countries domestic service is
seen as the only avenue of employment for
a young girl, though in some places, such
as Nepal and South Africa, boys are more
likely to be domestic workers than girls.46
Children exploited in domestic service are
generally paid little or nothing over and
above food and lodging. Many are banned
altogether from attending classes or have
such restrictions placed on their school
attendance that it becomes impossible.
All too often domestic service becomes a
24-hour job, with the child perpetually on
call and subject to the whims of all family
members.47
Trafficking
1,200
Illicit activities
600
Prostitution and
pornography
1,800
Forced and
bonded labour
5,700
Armed conflict
300
* Unconditional worst forms of child labour: These forms of labour correspond to those
outlined in Article 3 of the International Labour Organization Convention No. 182.
Source: International Labour Organization, Every Child Counts: New global estimates on
child labour, ILO, International Programme on the Elimination of Child Labour, Statistical
Informational and Monitoring Programme on Child Labour, April 2002.
In addition, children in domestic service are
especially susceptible to physical and psychological harm. Many are forced to undertake
tasks that are completely inappropriate for
their age and physical strength. The food
they are given is often nutritionally inadequate, vastly inferior to the meals eaten by
the employing family. In Haiti, for example,
15-year-old domestic workers were found to
be on average four centimetres shorter and
40 pounds lighter than 15-year-olds not in
domestic service in the same area.48 Children
frequently suffer physical abuse as punishment for a task performed at a lower standard than demanded or simply as a routine
means of ensuring their submission. They are
also at extreme risk of sexual abuse. Rapid
assessment research in El Salvador found
that 66 per cent of girls in domestic service
reported having been physically or psychologically abused, many of them sexually, and
that the threat of sexual advances from
employers was ever present.49
Making children visible by creating
a protective environment
All children have the right to grow up in
a protective environment in which all elements work, individually and collectively,
to secure them from violence, abuse and
INVISIBLE CHILDREN
51
The protective environment
The protective environment is made
up of interconnected elements that
individually and collectively work to
protect children from exploitation, violence and abuse. While much of the
responsibility for the creation of a protective environment lies with the government, other members of society
also have duties. The key elements of
the protective environment include:
• Capacity of families and communities: All those who interact with
children – parents, teachers and
religious leaders alike – should
observe protective child-rearing
practices and have the knowledge,
skills, motivation and support to
recognize and respond to exploitation and abuse.
• Government commitment and
capacity: Governments should provide budgetary support for child
protection, adopt appropriate social
welfare policies to protect children’s rights and ratify with few or
no reservations international conventions concerning children’s
rights and protection. Ratification
of the two Optional Protocols to the
Convention on the Rights of the
Child would be an important
demonstration of the commitment
to protect children from armed conflict and exploitation.
• Legislation and enforcement:
Governments should implement
laws to protect children from
abuse, exploitation and violence,
vigorously and consistently prosecute perpetrators of crimes against
children and avoid criminalizing
child victims.
• Attitudes and customs:
Governments should challenge
attitudes, prejudices and beliefs
that facilitate or lead to abuses.
They should commit to preserving
the dignity of children and engage
the public to accept its responsibility to protect them.
• Open discussion by civil society
and the media: Societies should
openly confront exploitation,
abuse and violence through the
media and civil society groups.
neglect, as well as from exploitation and
discrimination. Without this, children are at
risk of being excluded and becoming invisible. Furthermore, the persistence of child
protection abuses threatens to jeopardize
every one of the MDGs (see Panel: The
links between child protection and the
Millennium Development Goals, page 53).
There are numerous obstacles to ensuring
that children’s right to protection is not violated. Traditional practices, lack of national
capacity to administer programmes for even
those children who are readily reachable
and the absence of rule of law are just three
examples of impediments to protecting children. Broad and systemic protection strategies are required to both prevent abuses and
address the failures that occur.
52
• Children’s life skills, knowledge
and participation: Societies should
ensure that children know their
rights – and are encouraged and
empowered to express them – as
well as give them the vital information and skills they need to
protect themselves from abuse
and exploitation.
• Essential services: Services for victims of abuse should be available
to meet their needs in confidence
and with dignity, and basic social
services should be available to all
children without discrimination.
• Monitoring, reporting and oversight: There should be monitoring,
transparent reporting and oversight of abuses and exploitation.
Key to building the protective
environment is responsibility: All
members of society can contribute
to protecting children from violence, abuse and exploitation.
See References, page 92.
In an ideal society, children are manifestly
protected because all forms of violence,
abuse and exploitation against them are
considered socially unacceptable and because
customs and traditions respect the rights
of women and children. However, in the
majority of countries and societies, this ideal
is not yet fully in place. Article 5 of the
Convention on the Elimination of All Forms
of Discrimination against Women calls on all
States parties to adopt measures that will
help modify the social and cultural patterns
of men and women, with the aim of eliminating prejudices and customary practices
based on gender inequality and stereotypes.
The recommendations of the Convention on
the Rights of the Child also underline the
importance of modifying social practices and
patterns to safeguard children’s rights.50
T H E S TAT E O F T H E W O R L D ’ S C H I L D R E N 2 0 0 6
The links between child protection and the
Millennium Development Goals
Child Protection Consideration
Millennium Development Goal
MDG 1: Eradicate extreme poverty
and hunger
• Child labour squanders a nation’s human capital.
• Armed conflict depletes a nation’s physical, economic and human
resources and leads to the displacement of populations.
• Accurate and complete birth registration information is a prerequisite for
all economic planning to address poverty and hunger issues.
• Poverty and exclusion contribute to child abandonment and to the
overuse of formal and informal fostering arrangements or institutional
care, leading to poor child development.
• Legal systems that do not take into account the child’s age and fail to
promote reintegration into the community of children in conflict with the
law increase the likelihood of their poverty and marginalization.
MDG 2: Achieve universal primary
education
•
•
•
•
•
MDG 3: Promote gender equality
and empower women
• Girls are disproportionately engaged in domestic work, which
compromises their school participation.
• Child marriage leads to the removal of girls from school and may limit
their opportunities to participate in the public life of their communities.
• Violence and harassment in schools are obstacles to gender equality in
education. Sexual violence, exploitation and abuse undermine efforts to
empower women and girls.
MDG 4: Reduce child mortality
• Violence against children can lead to child mortality.
• Child marriage and early childbearing lead to higher risks of maternal
mortality and morbidity.
• Children separated from their mothers at an early age, especially those
who remain in institutional settings for long periods of time, are at
greater risk of early death.
MDG 5: Improve maternal health
• Child marriage jeopardizes both maternal and infant health.
• Sexual violence can lead to unwanted pregnancies and puts women at
risk of HIV/AIDS infection.
• Female Genital Mutilation/Cutting increases the chance of maternal
mortality during delivery and complications thereafter.
MDG 6: Combat HIV/AIDS,
malaria and other diseases
• Many of the worst forms of child labour are a cause and consequence of
the HIV/AIDS pandemic.
• Sexual exploitation, abuse and violence can lead to the infection of girls
and boys.
• Children in HIV/AIDS-affected families are particularly at risk of losing the
care and protection of their families.
• Children in detention are vulnerable to HIV infection, given the high rates
of transmission in prisons.
MDG 7: Ensure environmental
sustainability
• Armed conflict leads to population displacement and potential overuse of
environmental resources.
• Environmental disasters increase household vulnerability and increase
the potential for child labour, as well as for sexual exploitation and child
marriage.
MDG 8: Develop a global partnership
for development
• Child protection requires inter-sectoral cooperation at the national and
international level to create a protective environment for children.
Armed conflict disrupts education.
Child labour prevents children from attending school.
Violence is an obstruction to a safe and protective learning environment.
Child marriage leads to the removal of girls from school.
Children without parental care must be placed in an appropriate family
environment to increase the likelihood they will receive an education.
See References, page 92.
INVISIBLE CHILDREN
53
© UNICEF/HQ04-0697/Giacomo Pirozzi
In countries where these discriminating patterns have been challenged, the results have
been significant. In Somalia, for example,
following a study on sensitive child protection issues in which more than 10,000
children and adults participated, child protection coordination networks have been
established in Bari, Nugal, Benadir, Lower
Shabelle and Hiran regions, with similar initiatives now under way in other regions,
including Somaliland. The networks have
agreed on priority areas of focus for their
work, such as improving the situation of
street children, increased efforts to eradicate
female genital mutilation and the protection
of internally displaced children.51
Children may be able to reduce their own
risk of exploitation when they know that
they have rights and about the options they
have to protect themselves against violations. Health workers, teachers, police
54
officers, social workers and others who
work with children should be equipped with
the motivation, skills and authority to
identify and respond to child protection
abuses. Parents and communities need to be
provided with the tools and capacity to
protect their children.
Monitoring systems that record the
incidence and nature of child protection
abuses and allow for informed and strategic
interventions are also required. Such systems
tend to be most effective when they are
participatory and locally based. One such
example is provided by Benin, where village
committees have been set up to combat
child trafficking. The first such committees
were set up in 1999 in the area in the south
most affected by trafficking, and there are
now more than 170.52 Among their activities are raising awareness about child protection issues among parents, children and
T H E S TAT E O F T H E W O R L D ’ S C H I L D R E N 2 0 0 6
the general population, reporting cases of
abuse or disappearance and monitoring the
reintegration of trafficked children when
they return to the village. The committees
provide an effective early warning system
that genuinely strengthens children’s protection by investigating when a child leaves the
village and alerting the Juvenile Protection
Squad, thwarting the transportation of many
children to neighbouring countries.53
Another example of where evidence-based
risk factors can be used to guide programming is seen in Moldova, where UNICEF
has been supporting a life-skills education
project for children growing up in residential care institutions. Research indicates that
children in these institutions were several
times more vulnerable to trafficking than the
rest of the child population. The project uses
participatory methods and a life-skills-based
approach to raise children’s awareness of the
dangers of trafficking and build their capacity to understand and exercise their rights.54
Creating an environment that protects children requires ongoing and sustained efforts
by individuals and organizations at all levels
of the international community, from the
family to the largest multinational corporation operating in the globalized economy.
While families and governments bear the
primary responsibility for ensuring that children are included in essential services and
protected from harm, they require the support of others – civil society, donors, international agencies, the media and the private
sector – to confront and stamp out abuses,
challenge attitudes and prejudices and monitor and evaluate exploitation. The roles that
these actors play, as discussed in Chapter 4,
will be critical to ensuring that all children
become visible, not only in official statistics,
budgets, programmes and legislation, but
also in their societies and communities.
Signing human rights treaties and passing
progressive legislation by governments is critical but must be seen as only the beginning:
To truly protect all children against violence,
exploitation and abuse, behaviour and attitudes that devalue some children must be
changed. A partnership across levels of society must be forged to ensure that each child’s
right to a protective environment is fulfilled,
that impunity for abuses against children is
challenged, and that each child has the
opportunity to reach his or her full potential.
INVISIBLE CHILDREN
55
Making Every Child Count
The ability to prove age and nationality is
key to guaranteeing a child’s rights. Article 7
of the Convention on the Rights of the Child
establishes the right of every child to a
name and nationality, stipulating that boys
and girls should be registered immediately
after birth. Yet in many countries, birth registration is neither accessible nor affordable
to large portions of the population.
A formal record of age may help to protect
a child’s right to a childhood. Children
forced into the labour market, who serve as
combatants or who enter into marriage take
on adult roles. Unable to prove their age,
unregistered children and those seeking to
assist them often find it difficult to claim
their rights as children or prove that these
rights have been violated.
Birth registration guarantees the right to
be counted in official statistics and
acknowledged as a member of society. It
also increases the chances that children
from poor and marginalized families will be
included in national-level planning and
decisions. An accurate count of the number
of children in a given community, village or
region provides a basis on which to demand
that resources be distributed to fulfill the
rights of children and that proportionate
basic services are available. Because those
excluded from birth registration tend to be
those who are excluded from other essential
services, universal birth registration should
be seen as the first step towards including
all children.
56
T H E S TAT E O F T H E W O R L D ’ S C H I L D R E N 2 0 0 6
Protecting Childhood
INVISIBLE CHILDREN
57
T H E S TAT E O F T H E W O R L D ’ S C H I L D R E N 2 0 0 6
Including Children
The principles of universality and
non-discrimination must govern our
interventions for children
© UNICEF/HQ05-0726/ Christine Nesbitt
A human rights-based approach to development demands that every effort be made to
reach all children without exception. The
principle of universality, the foundation of
all human rights treaties, and the related
principle of non-discrimination (on the basis
of race, colour, gender, language, opinion,
origin, disability, birth or any other characteristic) as expressed in Article 2 of the
Convention on the Rights of the Child, must
apply to all actions to support, protect and
care for children.
4
SUMMARY
ISSUE: Our commitments to children demand that every effort be
made to reach them. But how can we reach those children living in the
shadows? How can we ensure their inclusion in essential services and
their visibility by protecting them from harm, abuse and violence and
encouraging their participation in society? Three conclusions emerge:
• Understanding the plight of excluded and invisible children and the
factors behind their marginalization, and then focusing initiatives
on these children, must form an integral part of national strategies
on child rights and development.
• The root causes of exclusion and the factors making children invisible must be directly addressed. Even well funded, well targeted
initiatives for disadvantaged families and children risk failure if the
overall conditions that foster poverty, armed conflict, weak governance, the uncontained spread of HIV/AIDS, inequalities and
discrimination are not addressed.
How can we reach the children who are the
most vulnerable to ensure their inclusion in
essential services and protect them from
harm, exploitation, abuse and neglect? How
can we ensure that we will know enough
about them to guarantee their rights?
• All elements of society must recommit to their responsibilities to
children, including the creation of a strong protective environment.
A ‘business as usual’ approach will never
reach excluded and invisible children
• Legislation: National legislation must match international commitments to children. Legislation that entrenches discrimination must
be amended or abolished.
The first answer is that they will never be
reached through a ‘business as usual’
approach. Routine development initiatives
pitched at the general population, aiming to
include as many children as possible, risk
failing to reach excluded and invisible children. Understanding their plight and the
factors behind their marginalization, and
then targeting initiatives towards these children, must therefore form an integral part
of national strategies on child rights, development and well-being, as well as those on
reaching the goals of the Millennium agenda. The disaggregation of indicators – by
age, sex, household income, geographic area
and other factors – permits the assessment
of discrimination and inequality and is
therefore essential for formulating policies
and programmes that can reach the most
disadvantaged children.
• Financing and capacity-building: Legislation and research on
excluded and invisible children must be complemented by childfocused budgets and institution-building.
ACTION: Governments bear the primary responsibility for reaching
out to excluded and invisible children and need to step up their efforts
in four key areas:
• Research: Strong research is essential to effective programming,
but reliable data on these children is currently in short supply.
• Programmes: Service reform to remove entry barriers to essential
services for excluded children is urgently required in many countries and communities. Packaging services can increase access, as
can the use of satellite and mobile services for children in remote or
deprived locations.
Other actors also have a role to play. Donors and international organizations must create an enabling environment through bold and well
conceived policies on aid, trade and debt relief. Civil society must
acknowledge its responsibilities to children and be part of the solution. The private sector must adopt ethical corporate practices that
ensure that children are never exploited. The media can become a
vehicle for empowerment by providing people with accurate information and by challenging attitudes, prejudices and practices that harm
children. Finally, children themselves can play an active part in their
own protection and that of their peers.
59
© UNICEF/HQ04-0485/Louise Gubb
60
Second, the root causes of exclusion and the
main factors that contribute to making children invisible must be tackled. Eradicating
extreme poverty, combating HIV/AIDS, promoting conflict resolution, providing special
assistance to and protection for children
caught up in conflict, maintaining assistance
to children in fragile States, and addressing
discrimination on the basis of ethnicity, gender or disability would go a long way
towards eliminating the background conditions that foster exclusion and invisibility.
become a partner for human development by
adopting responsible corporate practices and
by ensuring that its actions do not harm or
exploit children. The media must aid in
empowering people by providing accurate
information on the exclusion and invisibility
experienced by children, and by scrutinizing
and challenging behaviours and attitudes,
prejudices and practices that harm them.
Finally, children themselves should be able to
play an active part in their own protection
and empowerment – and that of their peers.
The final requirement is that all duty bearers
recommit to ensuring that no child is excluded and that all children are protected and
made visible. The primary duty will
inevitably fall upon national governments,
since they bear the statutory responsibility
for providing for and protecting their citizens. But all sectors of global society and
national constituencies also have a part to
play. Donors and international organizations
must create an enabling environment
through equitable policies on aid, development, debt relief and trade aimed at including the most impoverished and excluded
countries, communities and groups. Civil
society, in all its diversity, must acknowledge its responsibilities to children and be
part of the solution. The private sector must
Research
Strong research is essential to effective
programming
An assessment of capacities, vulnerabilities
and needs is the first step in formulating
appropriate responses targeted at reaching
excluded and invisible children. However, reliable data on excluded and invisible children
are usually in short supply, often because of
significant practical difficulties for data collection. This inevitably complicates the development of evidence-based interventions.
Detailed situation analyses of the plight of
these children, and its root and proximate
causes, are vital complements to statistical
T H E S TAT E O F T H E W O R L D ’ S C H I L D R E N 2 0 0 6
Statistical tools for monitoring the Millennium agenda for children
Measuring impact and progress is
crucial to ensure that programmes
and policies lead to the desired
effects on the ground. By supplementing official national data,
household surveys provide nationally representative information on the
status of individual women and children, allowing for monitoring across
a range of social stratifiers. As a
result, international organizations,
researchers and national governments often use household surveys
such as the Demographic and Health
Surveys – which gather information
through questionnaires that can take
from half an hour to an hour to
administer. One household survey
tool, the Multiple Indicator Cluster
Surveys (MICS), was originally
developed to measure progress
towards the goals that emerged
from the 1990 World Summit for
Children. The first round of MICS
was conducted around 1995 in more
than 60 countries, with a second
round of surveys five years later.
A third round of MICS was conducted in more than 50 countries during
the year 2005. MICS-3 has collected
information on some 20 of the 48
MDG indicators, offering the largest
single source of data for MDG monitoring. In addition, the current round
of MICS is also providing a monitoring tool for ‘A World Fit for Children’
compact, as well as for other major
international commitments such as
the United Nations General
Assembly Special Session on
HIV/AIDS and the Abuja targets
for malaria.
Questionnaires
Household surveys are based on
questionnaires that can be easily
customized to the needs of a country. For example, the MICS consists
of a household questionnaire, a
questionnaire for women aged 1549, and a questionnaire for children
under the age of five (to be completed by the mother or other caregivers). The surveys contain many
questions and indicators directly
related to the causes and implications of a child being excluded or
invisible, including birth registration,
orphaned and vulnerable children,
child disability, age of marriage and
questions related to health, education, shelter, water and sanitation,
HIV/AIDS and early child development. Each survey takes around an
hour to complete, depending on
whether optional modules are
included, and the responses from
each household provide crucial
information for planners, programmers and policy makers.
Survey results
Results from the surveys, including
national reports, standard sets of
tabulations and micro level data
sets, will all be made widely available after completion and collation.
Survey results for most countries are
expected to be completed by early
information. Studies that are based on the
direct experiences of individuals are particularly valuable. Lessons learned – often from
the experiences of other countries and
regions – can be integrated with accurate
local knowledge, including the root causes
of exclusion and of protection violations
that make children less visible, to produce
the most effective response. Monitoring and
2006 and will be made available
through DevInfo, a statistical
database designed to monitor
progress towards the Millennium
Development Goals. DevInfo facilitates the presentation of data in
tables, charts and maps to illuminate
where disparities exist, making visible the factors of exclusion and the
existence of those who might otherwise go unseen. Data can be
accessed at the local level to
improve the capacities of local
authorities and civil society organizations to assess the situation of children, or databases can be compiled
regionally or globally to allow for
cross-country comparisons.
Mapping data trends geographically
is an immensely useful tool for
visualizing disparities across geographical regions. For example, a
map can demonstrate the differences between the number of children registered in the capital city
compared to the province in which it
sits, or the number of girls in school
across several provinces, indicating
clearly where further efforts are
required. Combining data collection,
analysis and mapping technology
allows researchers to create an evidence base for programmers to use
in implementing the most efficient
and effective programmes and
ensuring that those most in need
are identified.
See References, page 93.
evaluation is also required to ensure that
those most in need are being reached and to
make adjustments over time as their situation changes.
Collecting accurate data and compiling
qualitative studies on excluded and invisible
children is clearly fundamental to the assessment process. Agreeing on definitions is
INCLUDING CHILDREN
61
often the first step towards gathering comparable data and information in areas where
systematic research is in early stages. For
example, the consensus around the Palermo
Protocol definition of trafficking in 2000
provides a consistent basis for researchers,
policymakers, legislators and programme
developers across different contexts.1
Census and household surveys can be
immensely useful in identifying factors
that increase the risk of exclusion
The results of censuses or nationally representative household surveys such as the
Demographic and Health Surveys (DHS) and
Multiple Indicator Cluster Surveys (MICS)
are being employed by governments and
international agencies to construct a clearer
picture of how disparities within countries
affect children’s quality of life. Statistical
tools, such as multivariate analysis, can help
uncover significant contributing elements to a
particular material deprivation or protection
violation such as non-registration at birth.
They are increasingly used to identify factors
that make some children vulnerable to exclusion and invisibility, and to pinpoint where
interventions might be most effective. These
analyses have shown, for example, that lack
of education, particularly at the secondary
level, plays a significant role in whether a girl
will be married before 18, and whether, as a
mother, her own children will attend school.2
While household surveys are immensely useful tools, they are limited in that some of
the most excluded and invisible children and
families will be left out – for example,
nomadic tribes that have no formal abode,
children living outside a household and
internally displaced people. Despite these
limitations, surveys can illuminate key risk
factors that make a child particularly prone
to exclusion from essential services. Survey
designs should be continually strengthened
to ensure that their coverage is as broad and
inclusive as possible.
Using household survey data in tandem with
qualitative information on the state and
condition of children’s lives will provide a
more complete picture of exclusion in particular. Quantitative analyses often point to
issues or geographical areas where more
62
detailed and qualitative investigation is
required. In this regard, pilot studies with
small groups of excluded or invisible
children and community-led surveys and
consultations can make a valuable contribution to understanding the plight of the
children hardest to reach.
Many gaps in data gathering and qualitative
analysis remain that must be urgently
addressed. Key examples include child trafficking, child labour and children caught
up in conflict.
• Child trafficking: In the field of child
trafficking, there is no single research
methodology that is universally applicable
and reliable, although the action against
trafficking formulated by the Economic
Community of West African States
(ECOWAS) specifically includes expanded
efforts to collect and share data.3
• Child labour: The International
Programme on the Elimination of Child
Labour (IPEC) of the International Labour
Organization has successfully used rapid
assessments to gain local snapshots, but
these are not easily comparable across
locations. In practice, information is
gathered from multiple sources, and
programmes tend to be quite small.4
• Children caught up in conflict: There has
been a high pitch of international concern
about child soldiers and other children
caught up in conflict since the landmark
UN report on the subject by Graça Machel
in 1996.5 But firm estimates on the number of child soldiers have been difficult
to obtain. The latest approximations,
announced in a statement from the then
UN’s Special Representative on Children
in Armed Conflict, Olara Otunnu, to the
UN Security Council Meeting on Children
and Armed Conflict held in February
2005, suggest that over 250,000 children
are currently serving as child soldiers.6
Lack of firm quantitative data is not an
excuse for inaction by policymakers
While data collection and analysis are certainly important, it is also imperative to
T H E S TAT E O F T H E W O R L D ’ S C H I L D R E N 2 0 0 6
Figure 4.1: Status of ratification of major international treaties*
200
2
1
Numbers of countries
150
100
46
41
192
101
101
Convention on
the Rights of the
Child, 1989
Optional Protocol
to the Convention on
the Rights of the Child
on sale of children,
child prostitution and
child pornography, 2000
180
156
Convention on the
Elimination of All
Forms of
Discrimination
against Women,
1979
ILO Convention 182
on the Worst Forms
of Child Labour,
1999**
50
0
Ratification
Optional Protocol
to the Convention
on the Rights of the
Child on involvement
of children in armed
conflict, 2000
Signatories (not yet ratified)
* As of September 2005
** The International Labour Organization (ILO) database includes lists of conventions ratified, non-ratified and denounced.
Sources: United Nations Treaty Collections Databases and ILOLEX of International Labour Standards.
take judicious action based on human rights
principles in areas where quantitative data is
still lacking. The absence of an updated estimate of the number of children involved in
armed conflict, for example, is not a reason
to delay programme development and
expansion of capacity to address the known
needs of those children, or for governments
not to sign and ratify the Optional Protocol
to the Convention on the Rights of the
Child on the involvement of children in
armed conflict. Efforts must proceed on
simultaneous tracks, both to learn more
about children who are excluded or less
visible through quantitative research and
through further and more detailed qualitative assessments of their situation and
circumstances.
Enforcement, monitoring, evaluation and
follow-up are also vital to ensure that legislative, programmatic and budgetary efforts
effectively reach those they seek to benefit.
Given the current dearth of knowledge on
how to provide access to quality essential
services for the most excluded and invisible
children and their families, it is important
that any lessons learned from experience be
scrupulously evaluated and documented.
And because most strategies to reach such
groups require special efforts over and
above the norm, they require rigorous monitoring to ensure that the target group is
being reached.
Legislation
National laws must match international
commitments for children
The Convention on the Rights of the Child
commits governments to guaranteeing the
rights of all children. Ratification of this
international convention, its Optional
Protocols and other international legislation
that protect the rights of children and women
means little, however, unless their principles
are enshrined in national law. This process of
reforming national legislation to meet the
standards established by the Convention on
the Rights of the Child has been important
in making more children visible.
INCLUDING CHILDREN
63
In Latin America, for example, ratification
of the Convention on the Rights of the
Child has involved changing the prevailing
legal doctrine of ‘irregular situation’, which
was codified in legislation enacted across
the continent in the 1920s and 1930s.
Under this system, children could be
accused of ‘antisocial behaviour’ or criminalized simply for having no material
resources, and then be deprived of their liberty by a judge ‘for their own protection’.
The doctrine was clearly incompatible
with the principles of universality and
non-discrimination that undergird the
Convention on the Rights of the Child.
Legislative reform was initiated to eliminate
this legal approach towards children. These
changes are still in progress and have potentially profound implications for juvenile justice and social protection, and for keeping
children visible.
In 2003, the Philippines adopted an act
against trafficking in persons that incorporates into domestic law the Protocol to
Prevent, Suppress and Punish Trafficking in
Persons, Especially Women and Children,
supplementing the United Nations
Convention against Transnational
Organized Crime. The law imposes higher
sanctions for trafficking in children and
includes provisions related to the rights of
victims of trafficking by requiring the
Government to make available appropriate
social services for their recovery, rehabilitation and reintegration.
Legislation that entrenches or fosters
discrimination must be altered or
abolished
Many national laws exist that entrench and
encourage exclusion. Among these are laws
determining the legal age of marriage. In
keeping with the spirit of the Convention on
the Rights of the Child, an increasing number of national laws fix the minimum age
for marriage at 18 – a threshold also suggested by both the Committee on the
Elimination of Discrimination against
Women and the UN Special Rapporteur on
Violence against Women.7 Yet the majority
of nation states – including many industrialized countries – allow marriage at younger
ages. Particularly discriminatory are nation64
al laws that enshrine a younger marriageable age for girls than for boys.
In other cases, new legislation is required to
ensure that the rights of boys and girls are
fulfilled. For example, at the end of 2004,
Bangladesh passed the Births and Deaths
Registration Act, marking the first time the
country had recognized birth certificates as
legal proof of age. As only 7 per cent of
children in Bangladesh are registered at
birth,8 the change in law must be accompanied by capacity building, social mobilization and budgetary allocation to finance the
registration of children if the law is to have
the intended effect. The benefits of the legislation will facilitate the implementation of
other laws requiring proof of age, such as
issuance of passports, registration of marriage and the preparation of voters’ lists. In
addition, to ensure that the new legislation
has positive outcomes for children, there is
also the need to review other legislation –
such as on education, marriage and labour
laws – to guarantee compatibility.
Changing legislation is vital if entrenched
prejudices are to be challenged
Positive examples from around the world
show how legislation can improve the position of disadvantaged children and adults.
Legislation on the rights of physically disabled people in industrialized countries, for
example, has in recent years transformed
their access to many public buildings and
resulted in a more inclusive approach by
schools. Antidiscrimination legislation
enhances the rights of women and children.
But enacting a law against discrimination –
whatever the basis – is only a beginning, a
necessary prerequisite that requires consolidation through rigorous monitoring,
enforcement and active campaigning on
behalf of the communities suffering the
discrimination.
Traditional practices, although not entrenched
in law, can also harm children and need to be
addressed at the national level through
legislation. Female genital mutilation/cutting
(FGM/C) is one such practice. In countries
where FGM/C persists, where governments
have taken a strong lead, running public education campaigns and pointing out the
T H E S TAT E O F T H E W O R L D ’ S C H I L D R E N 2 0 0 6
Domestic law reform, though necessary,
needs to be supported by social policies,
institutional changes and budget allocation
to be truly effective in reaching excluded and
invisible children. Changing legislation does
not conclude the legal reform process, and
attention must be paid to ensure that the
institutions and capacity for implementation
are established. Duty bearers must be made
aware of the law, people should know their
rights, and the mechanisms to implement
and enforce them need to be established.
Financing
Legislation and research must be
supported by budgetary allocations,
institution building and reform
Stronger legislation and better and more
extensive research on excluded and invisible
children will mean little if the financial
resources to implement and enforce new
laws and policies are not forthcoming or
inadequate to fulfil commitments to these
children. Few countries currently incorporate a children’s rights perspective into their
budgetary processes – and few donors
demand it when working with countries on
Allocation of child affairs and welfare
as a % of the national budget
The very strong lead taken by the
Government of Burkina Faso over a 13-year
period, for example, seems now to be making
a difference. Burkina Faso started major public education campaigning against the practice in the mid-1990s and then formally
outlawed FGM/C in 1996. Before the practice was outlawed, around two thirds of girls
were being mutilated. The law stipulates that
anyone performing FGM/C risks a prison
term of up to three years, which can rise to
10 years if the victim dies of the procedure. A
national telephone hotline that people can
phone anonymously to report violations or
when a girl is threatened with being cut was
established. Strong advocacy and a clear legislative lead has succeeded in reducing the
incidence of cutting of girls to 32 per cent,
according to the latest UNICEF estimates.9
Figure 4.2: Budgeting for a child’s right to protection
and development* in Zambia, 1991-2001
1.0
100
0.8
80
0.6
60
0.4
40
0.2
20
0.0
1991 1992 1993 1994 1995 1996 1997 1998 1999 2000 2001
0
Percentage of authorized child affairs
and welfare budgets actually spent
appalling health risks involved, the incidence
has been reduced – though, again, legislative
direction from the top must be supported by
active promotion by civil society and echoed
by grassroots support.
Allocations to child affairs and welfare as a share of the
national budget, 1991-2001
Percentage of authorized child affairs and welfare budgets
actually spent, 1991-2001
* This is a composite spending area made up of budget programmes relating to children
in institutional homes; children living or working on the streets; child sports and recreational activities; child labour interventions; and poverty reduction programmes aimed at
guardians or parents of children.
Source: Institute for Democracy in South Africa and Save the Children Sweden, Children
and the budget in Zambia, 2004.
poverty-reduction strategies or similar policy frameworks. Financing deficiencies may
be the result of constraints on the overall
resources available, lack of information and
knowledge about demands for financial
resources, practical obstacles in the budget
process or lack of political will. In Zambia,
for example, although the share of the
national budget apportioned to children
increased steadily in the decade preceding
2001, the percentage of these funds that
was actually spent declined (see Figure 4.2)
– suggesting a lack of capacity to implement
programmes for children. Children, who
lack a political voice, have limited ability
to bring pressures to bear on national
budgetary processes.
Child-focused budgets draw growing
interest across the world
On a more optimistic note, there is growing
worldwide interest in child-focused budgets.
In most cases, this does not imply a children’s budget separate from the main financial programme outlined by a government.
Instead, it entails detailed and expert analysis of mainstream budget measures in order
INCLUDING CHILDREN
65
Monitoring the effectiveness of budgets in meeting children’s
rights in South Africa
While monitoring government
budgets is a relatively new area,
experience is already showing how
such analysis can uncover whether
sufficient resources are being dedicated to realize children’s rights and
if they are being used effectively.
One example is in South Africa,
where the Children’s Budget Unit of
the Institute of Democracy in South
Africa (IDASA) – an independent
public interest organization committed to promoting sustainable democracy – focuses on conducting
research of the government’s budget
and disseminating its findings.
In the initial phase of South African
democracy, the Children’s Budget
Unit (CBU) tracked the government’s
ratification of the Convention on the
Rights of the Child and the African
Charter on the Rights of the Child.
Since then the focus has shifted to
how well the government is realizing
these rights. In the first 10 years of
democracy in the country, the CBU
identified significant progress in
South Africa in funding programmes
to provide services to vulnerable
children, including a child support
grant for children up to 14 years old
who pass an income-means test; primary school feeding plans to promote child nutrition; a programme to
provide free basic health care for
young children and pregnant mothers; a means-tested health-care
provision for all children; and a
programme that identifies and
assists children made vulnerable by
HIV/AIDS.
The CBU also identified key areas
where considerable work was needed, such as the underfunding of nongovernmental organizations that
deliver critical services to vulnerable
children; the extension of the child
support grant to cover children aged
15-18; the need to make clear the
government’s obligation in funding
100 per cent of statutory services;
and the development of norms and
standards for early childhood
development.
The CBU has also assessed the 2005
budget, indicating the areas where it
considers progress has been made
and those where challenges remain.
One positive focus of the budget
was that it aims to strengthen economic growth, which the CBU indicates will help children by increasing
the incomes of vulnerable families.
It also allows for more direct investments in social infrastructure, social
services and grants to address
poverty and vulnerability at the
household level, and additional
investments in child-specific social
services and grants. Despite these
improvements, significant gaps
remain. It was far from clear that
additional funds allocated in the
to understand their specific impact on children and suggest methods for targeting the
budget more accurately and effectively.10
Child-focused, targeted budgets inevitably
depend upon gathering and processing accurate information. This was one of the main
conclusions drawn by an in-depth study of
social public expenditure targeted to children
66
budget for extending delivery of
welfare services are sufficient for
addressing the service needs of
excluded children and their families.
In particular, there was no new funding for non-governmental organizations, which puts increasing
pressure on provincial budgets to
make up shortfalls, and no mention
of extending the child support
grant to cover children 14-18 or
clarification on the Government of
South Africa’s obligation to pay
100 per cent of statutory services
for children.
Such analysis is extremely effective
in outlining to governments and
advocates for children’s rights where
further action and financial
resources are urgently required. But
effective budget analysis requires
specialized skills and knowledge.
Along with undertaking research on
government budgets, the CBU also
builds capacity in budget analysis. In
partnership with four South African
youth organizations, the unit is
teaching and assisting young people
from all walks of life to build their
capacity to monitor local- and
provincial-level budgets, empowering South African children to
improve their own lives, both now
and in the future.
See References, page 93.
in Peru between 1990 and 2003. The study
found that children were essentially invisible
as part of the budget process. The result was
that no more than 25 per cent of the public
budget was targeted to children rather than
the 45 per cent that would have been appropriate given their presence in the population.
In addition, the funds allocated did not reach
the extreme poor, nor the most socially and
T H E S TAT E O F T H E W O R L D ’ S C H I L D R E N 2 0 0 6
geographically excluded, such as the children
of the rural Sierra and the jungle. Children
living in high-risk situations, on the streets or
working in hazardous conditions were also,
in effect, invisible to policymakers. The
research team therefore designed a methodology for ‘visualizing children’, the starting
point of which was not only gathering data
effectively but also then processing the indicators. The methodology involved upgrading
the use of information technology and training staff in the relevant institutions.11
to meet the particular needs of these children. But the higher unit cost for extending
a service to these children is justified on the
grounds that they have benefited less than
other children from past public expenditures
on essential services. This is acknowledged
by the Government of Namibia, which concluded that: “Marginalized children are entitled to their share of the educational budget.
As they have been denied their educational
rights earlier, the additional costs of including them must be accepted.”13
There is also increasing interest in budget
processes that involve children’s participation.
One of the best examples of this is the children’s budget in the Brazilian city of Barra
Mansa. The city has a children’s participatory
budget council of 18 boys and 18 girls who
have the task of ensuring that the municipal
council addresses children’s needs and priorities. These representatives had previously been
elected by their peers in their neighbourhood
and district assemblies. This council determines how a proportion of the municipal
budget – equivalent to around US$125,000 a
year – is spent on addressing children’s priorities, and its child councillors also participate
in other aspects of government. The elected
children learn how to represent their peers
within democratic structures, to prioritize
actions based on available resources, and then
to develop projects within the complex and
often slow political and bureaucratic process
of city governance. Other cities in Latin
America are being inspired to follow Barra
Mansa’s example as its success becomes better
known. Among the other cities around the
world that are experimenting with participatory budgeting for children are Córdoba in
Spain, Essen in Germany and Tuguegarao
City in the Philippines.12
The resources required to reach excluded
children may also result from better targeting of public funds towards the priority
needs and rights of children, harnessing the
same amounts of money but directing them
in a more cost-effective way. In South
Africa, for example, a costing exercise of the
Child Justice Bill projected its impact on
various government departments, illustrating how savings generated by implementation of the bill, through reduced costs of
legal representation due to decreased numbers of children going to trial, could be reallocated to ensure respect for the rights of
children in conflict with the law. The bill
expanded the legal mechanisms to avoid
detention before trial by redirecting children
to programmes that contained an element of
restorative justice and increased the range of
sentencing options, including alternatives to
imprisonment.14
Reaching excluded and invisible children
will require greater and more targeted
financing for services to support them
Including excluded and invisible children is
likely to cost more money per child, largely
because of the obstacles these children face.
Programmes that are more narrowly and
specifically targeted, through careful
research and project design, are inevitably
likely to cost more than general initiatives.
It is also costly to expand existing initiatives
Budget initiatives can also serve to raise
public awareness of discrimination.
Developing Initiatives for Social and Human
Action (DISHA), an Indian organization of
tribal and forest workers in Gujarat, studies
the codification of sectors, programmes and
schemes in the state-level budget and
analyses the levels of social expenditures in
the poorest areas relative to other areas. The
analysis demonstrated that these areas were
being neglected, and the findings were
disseminated in the local language and
distributed to members of the legislature,
the press, opposition parties and publiccause advocates. The government was
encouraged to address the analysis of
socio-economic conditions and expenditures
in the tribal areas. The analysis led to
increased allocations and expenditures in
subsequent budgets.15
INCLUDING CHILDREN
67
© UNICEF/HQ00-0595/ Jose Hernandez-Claire
Capacity building
Capacity building empowers marginalized
children, families and communities
Marginalized groups are often excluded
from power within the political system.
Removing the obstacles and strengthening
their capacity for political participation is,
therefore, a requirement for their inclusion.
In Latin America, indigenous peoples are
becoming increasingly involved in representing their own interests and defending their
rights on the national political stage.
Indigenous children and young people are
playing an important role in countries like
Venezuela, where the Fourth National
Meeting of Native American Youth took
place in the province of Amazonas in
August 2003. The Encuentro involved 62
young people from 17 different indigenous
groups who focused on cultural identity,
identifying the key aspects of life for each
indigenous group, and electing a new board
of directors for the National Network of
Native American Youth.
68
Building capacity at the local level is essential to the success of initiatives to further the
rights of children. Communities play a significant role in identifying their most vulnerable children – and, where possible, in
distributing the goods and services to them.
In societies with strong traditional systems
of mutual support, as in much of Eastern
and Southern Africa, villagers may be able
to reach out to orphans and other vulnerable children with relatively little help from
outside. In Swaziland, for example, a system
of volunteers provides protection, and emotional and material support. They intervene
in cases of child exploitation and sexual
abuse, provide comfort to victims, consult
with relatives and sometimes talk to the
abusers or inform the police.16
Programmes
Programmatic interventions are no substitute for addressing the root causes of marginalization and discrimination, or for
creating a strong protective environment.
T H E S TAT E O F T H E W O R L D ’ S C H I L D R E N 2 0 0 6
Nevertheless, there are many strategies that
facilitate reaching children who are at risk
of being excluded or suffering protection
violations that must be enacted as interim
solutions. These will respond to their immediate needs as well as pave the way for
future action to reduce their exclusion in
many dimensions.
One of these strategies is providing exemptions and subsidies for marginalized communities and families, including the
adjustment of service standards in line with
their particular situation. Direct subsidies or
stipends to individual children and families
have been offered to encourage children to
attend school rather than be sent to work.
In Brazil, for instance, families are paid a
monthly stipend of about US$8 for each
child who attends school under the National
Programme for the Eradication of Child
Labour.17 School feeding programmes
are another method often used to bring
hard-to-reach children into the education
system.
Removing entry barriers to essential
services will encourage usage
Reform is often required to remove entry
barriers to essential services. These barriers
can include the failure to provide services in
the local language, prejudice among staff, or
the requirements to produce identity cards
or proof of address in order to access services. For example, more than 85 per cent of
Bolivians living in rural indigenous communities lack the official documentation that
would allow them to inherit land, register
their children in school or vote.18 In countries with historical or current repression by
the state, marginalized peoples might be
reluctant to come into contact with government-related bodies. Lack of knowledge or
trust and cultural distance may also prevent
people from knowing that a service exists,
what its benefits might be, or that it is free
or affordable. Removing these barriers can
be an effective strategy to reach and include
marginalized children and families, as illustrated by the decision of the Government of
the Dominican Republic in 2001 to eliminate the requirement for children to produce
birth certificates in order to enter school.19
Social mobilization campaigns to publicize
services and their benefits can spread accurate information about the available
options.
Packaging services together increases
access
Another way to make services more userfriendly is to package them, creating a single
location where multiple services can be
accessed. In southern Sudan, for example,
child immunization programmes have been
combined with campaigns to vaccinate cattle against rinderpest. This combination was
particularly successful as young children
typically lived in the cattle camps and the
logistics of keeping the two different vaccines cold were similar.20 In like manner,
efforts to make schools the centre of communities by locating water points at schools
both decrease the additional distance that
girls must travel to get water and can help
bring those girls to school.
Satellite and mobile services provide
services to children in remote or deprived
geographic locations
In some places, satellite services may be
required as a stopgap measure until comprehensive services can be provided. In
Sarawak, Malaysia, remote from the mainland, it is currently too expensive to maintain permanent health clinics. Health care
on the island is provided through a combination of outreach and community-based
services. Since the road network is poor,
mobile health teams usually travel along the
rivers or by air in a ‘flying doctor’ service
that is complemented by village health assistants who are trained in first aid, health
promotion, disease prevention, curative care
and community development, with a particular focus on infant and child health. The
Government provides incentives in the form
of recognition certificates, logistical support
and further training opportunities.21
Satellite and mobile facilities are often very
important in reaching poor families or those
living in remote areas, many of whom are
currently excluded from essential services.
The distance to services is often cited as the
reason women give birth at home and children are not registered, taken to the doctor
INCLUDING CHILDREN
69
The Child Rights Index: Assessing the rights of children in
Ecuador and Mexico
In Ecuador and Mexico, national
observatories focused on children and
adolescents are working to ensure
that the rights of children are met in
practice. In both countries, the participation of different sectors of civil society has been an essential element in
promoting a national consensus
aimed at the universal fulfillment of
child rights.
In 2001, Ecuador’s Observatorio
por los Derechos de la Niñez y
Adolesencia (Observatory for the
Rights of Children and Adolescents)
took the first successful steps towards
the establishment of the Child Rights
Index, which measures the degree of
fulfillment of rights to survival, health,
adequate nutrition and an education
during every phase in the lives of children and adolescents. The Observatorio
recently led an effort to commit local
elected authorities to implement actions
that would raise the Child Rights Index
in their communities.
In Mexico, the Consejo Consultivo de
UNICEF Mexico (Advisory Board),
composed of prominent citizens from
various walks of life including the
business community, academia, politics, media and entertainment, has
been a key actor in sensitizing public
opinion and mobilizing society
around the issue of child rights,
specifically through the construction
and publication of the Child Rights
Index. The Advisory Board, in partnership with UNICEF Mexico and the
Observatorio Ciudadano de Políticas
de Niñez, Adolescencia y Familias
(Citizens’ Observatory of Policies on
Children, Adolescents and Families),
an NGO, set up the index in 2004.
Since the challenges children face in
their physical, emotional and intel-
70
Child Rights Indices in Ecuador and Mexico: Parameters
employed to assess survival, health and education in early
childhood
Rights
Indicators
Policy priorities
Early childhood (0-5 years)
The right to survival. Under-five mortality rate.
Mortality rate of women
from causes related to
pregnancy and childbirth.
The right to a
healthy and safe
development.
Guarantee universal
access to maternal and
child health care, including
prenatal care and care
during childbirth.
Low weight for age.
Guarantee healthy residential environments,
including decent housing,
safe water and
sanitation.
Mortality due to
malnutrition.
Guarantee universal
access to good nutrition,
including nutrition
education for children
and their families, as
well as supplementary
feeding programmes.
The right to intellec- Preschool non-attendance.
tual and emotional
Mother’s education.
development and the
Illiteracy rate in women
right to education.
over age 15.
Guarantee universal
access to early education
and stimulation, including
information services and
support for parents.
Note: The table is a compilation of indicators from the Mexican Child Rights Indicator and
the Ecuador Rights of Children Indices related to the early childhood period of the life cycle.
Source: Child Rights Indices for Ecuador and Mexico.
lectual development vary with their
age, the Mexican and Ecuadorian
indices are sensitive to children’s
developmental stages. To account
for the changing priorities in the fulfillment of children’s rights, the
indices are calculated for three
developmental stages – early childhood (0-5), school-aged children (612) and adolescents (13-18).
T H E S TAT E O F T H E W O R L D ’ S C H I L D R E N 2 0 0 6
The indices measure the extent to
which the country is fulfilling the
rights of children and adolescents in
survival, health and education, and
help reveal where social, economic or
cultural barriers prevent the exercise
of children’s rights. They measure
aspects of the welfare of children that
are sensitive to changes in social
spending and interventions, and sum-
marize large amounts of information into one
single measure to provide a comprehensive
view of the situation. After compiling data
from various sources, the indices convert all
indicators to a scale of 0-10, with 0 representing the worst values of the indices for each
indicator and 10 indicating that the right is
being fully exercised by all children. A simple
average is calculated for each right considered, and the final result is the average of the
resulting figures.
The indices in Ecuador and Mexico provide a
tool for society to measure and track progress
over time. They also serve to identify disparities in children’s well-being within the respective countries. According to the Mexican Child
Rights Index, in aggregate terms there has
been gradual improvement in the fulfillment of
the rights of the country’s children. The index
stood at 4.68 in 1998, 5.25 in 2000 and 5.71 in
2003, with the majority of the states also
showing improvement. But the index also
illustrates wide disparities between states and
points out that those with the lowest levels of
fulfillment of rights also have the highest percentage of indigenous populations. Similarly
low scores for provinces with the largest
indigenous populations were observed in
Ecuador, where the probability of children’s
rights remaining unmet, as measured by the
index, was nine times higher in the impoverished provinces of Cotopaxi and Chimborazo
than in Galápagos, the province with the highest score. Significant gaps were also observed
between urban and rural areas. Overall, the
index for early childhood showed improvement in Ecuador, increasing from 3.4 to 3.6
between 2002 and 2003.
To improve the index rating, governments
must take swift and decisive action in
partnership with families and communities,
civil-society organizations, the media and the
private sector. The union of their efforts is
essential for ensuring the sustained application of public policies for reducing the number
of preventable children’s deaths, decreasing
malnutrition and guaranteeing access to preschool education for children. There are
already a number of encouraging signs that
such partnerships are forming. In the states of
Michoacán and Zacatecas in Mexico, for example, the government has taken the initiative to
launch a ‘social dialogue for children’, aimed
at building broad-based consensus on goals
for fulfilling child rights (including improvement of the index), and promoting the support
of all sectors of society for concrete actions to
achieve these goals.
In the province of Carchi in Ecuador, the index
rose from 2.8 to 3.9 after actions were taken
by a local assistance programme. The underfive mortality rate fell, and school enrolment in
the first grade of basic education increased.
The local programme was scheduled to be discontinued but, thanks to the positive impact it
had on the situation of children and the timely intervention of the Observatorio, the government decided to give this type of initiative
a permanent budget.
See References, page 93.
By gathering official data and analysing and disseminating this information, the indices provide
families and communities with an assessment
of how well their children’s rights are being fulfilled. The aim is that the public will be able to
monitor the index’s progress and advocate for
public policies oriented towards universal guarantee of these rights.
INCLUDING CHILDREN
71
© UNICEF/HQ04-0095/ Christine Nesbitt
or immunized. Outreach efforts and doorto-door campaigns are effective strategies
used for immunization that might be
expanded to other areas. For example,
UNICEF has worked with the Serbian
Health Ministry and the Public Health
Institute to send mobile teams to different
parts of the country to identify and register
unregistered children, and then to immunize
them against major killer diseases, including
tuberculosis, diphtheria, tetanus, pertussis
(whooping cough), measles and polio.22
Civil society
The involvement of civil society will help
to broaden the scope of interventions
‘Civil society organizations’ refers to a
broad group of institutions and actors
including, but not limited to, communitybased organizations, non-governmental
organizations, think tanks, social movements, religious organizations, women’s
rights movements, grassroots and indigenous people’s movements, and voluntary
organizations.23 The United Nations has
recognized the importance of engaging civil
society in governance and development and
has made it part of its reform process. The
Secretary-General highlighted this impor72
tance in his report to the General Assembly
in 2002, and the subsequent year he created
a panel of experts to produce a set of
practical recommendations on how the UN’s
relationship with civil society, as well as
with the private sector and parliaments,
could be improved. Since then, the engagement of civil society has been prominent
on the UN agenda.
International non-governmental organizations (NGOs) play a vital role by bringing
issues to the attention of governments and
the global community and by providing
large-scale programmes and projects. For
example, Plan International has been
responsible for a global campaign calling on
governments to ensure all children are registered at birth. They have been working with
local partners in more than 40 countries
worldwide to boost the rates of child registration, with some major successes. In
Cambodia, for example, Plan International’s
Mobile Registration Project, in partnership
with the government and UN volunteers,
has recently registered 1.5 million people in
two months. It aims to register the whole
population of some 13 million people in the
coming year. In India, Plan International has
successfully registered 3.2 million children
in the state of Orissa alone.
T H E S TAT E O F T H E W O R L D ’ S C H I L D R E N 2 0 0 6
Local civil society organizations can
perform many tasks to assist excluded
and invisible children
Civil society organizations composed of
members of the local community are often
in the best position within their communities to create development strategies that are
tailor-made for the children who are hardest
to reach. They can contribute to the inclusion of these children in a variety of ways,
including situation analyses and public
advocacy, policy design and scaling up service delivery, monitoring and evaluation, and
fund-raising. In addition to these activities,
civil society organizations play a key role in
raising awareness in communities, challenging social taboos, promoting open discussion on important issues and ultimately
changing public behaviour.
Professional associations are one area in
which civil society organizations have been
actively promoting children’s rights issues.
The Mutawinat Benevolent Company, an
NGO of women lawyers in Khartoum, has
for years offered free legal services to
women and children, most of them internally displaced people living in extreme poverty. It has helped focus attention on the
plight of women in prison – often with their
children alongside them – and has worked
to educate judges and police on the implications of the Convention on the Rights of the
Child.24 In a similar initiative in rural
Nepal, community paralegal committees,
made up primarily of women, monitor violence against women and children by facilitating the reporting of any incidents.25
for children’s rights, such as the right to an
education for all children.26
They do this through speaking out about
these sometimes sensitive or taboo issues in
their communities. Inter-religious councils in
different regions provide a forum for discussion and creation of frameworks of action.
Where religious leaders have acted to fight
the spread of HIV/AIDS, particularly in
partnership with national governments and
NGOs, there have been significant successes
in preventing HIV and alleviating the suffering from AIDS.27
For the past 21 years, the Pastoral da
Criança (Children’s Pastoral) project has
been working to reduce child deaths and
hunger in the poorest communities of Brazil
and 14 other Latin American and African
countries, relying on a huge network of
some 240,000 volunteers. Supported by the
Catholic Church, UNICEF and other organizations, the initiative received the King of
Spain’s first Human Rights Award in
January 2005 in recognition of its innovative
Figure 4.3: Main activities of faith-based organizations
for orphans and vulnerable children in
southern and eastern African countries*
Promotion of fostering
Community school
27
41
Religious education
Day care
54
Income generation
95
Medical care
The participation of religious leaders and
organizations is vital to addressing
sensitive issues related to children
Religion plays a central role in social and
cultural life in most developing countries,
and religious leaders and faith-based organizations are greatly respected and listened to.
They are in a very strong position to raise
awareness and influence behaviour. All over
the world, religious leaders and organizations are working to combat the spread of
HIV/AIDS, fight poverty and end harmful
traditional practices such as female genital
mutilation and cutting. They also advocate
13
150
Counselling
162
195
Home visiting
HIV prevention
257
School assistance
315
Material support
371
Street shelter
19
Orphanage
76
0
*
100
200
300
400
Kenya, Malawi, Mozambique, Namibia, Swaziland and Uganda.
Source: World Conference of Religions for Peace and United Nations Children’s Fund,
Study of the response by faith-based organizations to orphans and vulnerable children,
January 2004.
INCLUDING CHILDREN
73
efforts on behalf of children’s rights.28
Similar projects operate in other parts of the
world. In Thailand, for instance, the Sangha
Metta project has trained more than 3,000
Buddhist monks, nuns and novices to work
with their communities in preventing HIV
infection, providing support for families and
prevent prejudice and discrimination. These
efforts have had a marked impact on challenging stigmatization associated with
HIV/AIDS, resulting in the integration of
HIV-positive women and children into
groups and schools from which they were
previously excluded, and the return of children to the care of mothers living with
HIV/AIDS.29
Civil society organizations can contribute to
identifying and targeting priority areas and
communities, designing effective implementation strategies, setting national and local
budget priorities, and involving women and
children in the design and implementation
of these strategies. Because they have
first-hand information on the needs and
constraints at the local level, they make an
invaluable contribution to the policy debate.
Excluded children and their families often
depend on grassroots organizations to make
their concerns known in policy circles. A
model of civil society engagement in policy
design is offered by the Global Fund to
Fight AIDS, Tuberculosis and Malaria. The
fund calls for country-level partnerships
including civil society organizations to submit grant proposals based on priority needs.
Once grants are approved, these partnerships oversee programme implementation.30
Encouraging children to participate will
also help to empower them
Children are not passive recipients of our
charity or protection, but active citizens with
rights who should be able to participate in
their communities and societies. But, lacking
a political voice or representation, children
are easily left out of discussions on public
policies. Policymakers should ensure that the
views of all children, and those of excluded
and invisible children in particular, are heard
and taken into account. The fullest measure
of our success in including marginalized
children will be their participation, their new
visibility. Participation of children should be
74
developed and supported in line with the
evolving capacities of the children concerned.
The Global Movement for Children exists
both to advance children’s rights and to foster their participation, seeing the two as
inseparable. Launched in the run-up to the
UN General Assembly Special Session on
Children in 2002, its participants ranged
from international organizations to local
children’s groups. In 2005, representatives
of the Global Movement published a report
just before the G-8 summit to remind the
leaders of the world’s most powerful nations
of their commitment to end child poverty.
They stressed that this is a practical, achievable objective, an economic essential and a
moral imperative.
In addition, under the Global Movement
umbrella, thousands of children from 13
African countries – working in jobs ranging
from domestic labour to shoeshining – published in 2005 the first results of a global survey by children of the world’s progress in
pursuing child rights. The report states that
while there has been some progress in some
areas on education and child participation,
poverty is still endemic. It also recommends
that children around the world work together
to ensure that governments are held accountable for the promises they have made.31
Youth civil society organizations increasingly contribute to the policy debate through
youth forums and parliaments. The
Ethiopian Youth Forum, for example, has
held seven sessions on a variety of issues,
including street children, poverty reduction
and youth, HIV/AIDS and, most recently,
girls’ education. In 2004, the Forum was
involved in a child-to-child survey that
mapped children out of school and
advocated for getting them into school.
Child-to-child surveys in several countries
have shown that children can be effective
actors in the development process at the
local level – and specifically in seeking out
excluded or invisible children. In India, for
example, the project asked children to draw
a map of their village or neighbourhood,
marking the houses containing children who
do not go to school and including the numbers of girls and boys.32 The map provided
T H E S TAT E O F T H E W O R L D ’ S C H I L D R E N 2 0 0 6
© UNICEF/HQ04-1027/ Giacomo Pirozzi
vital information for local planners and promoted community awareness of both local
disadvantage and the importance of education. Children were placed right at the centre of the process, enhancing their sense of
empowerment as well as their education.
mitments to children. Through their work,
media professionals can shape public opinion and influence behaviour. They can
encourage governments, civil society organizations and individuals to effect change that
will improve the quality of people’s lives.
The media
Reporting on children’s issues must be
undertaken with sensitivity and
understanding
The media has a unique and vital role in
raising awareness and monitoring
progress on commitments to children
Media professionals – journalists, writers,
broadcasters and programme developers –
are the eyes, ears and voices of society and
have great influence on how children are
visualized and portrayed. They can also help
by putting children’s rights squarely on the
news and media agenda and drawing the
attention of the general public and opinion
makers to the violations of those rights,
using their work to hold governments
accountable. As the watchdogs of the
public, the media has a unique role to play
in ensuring that the rights of children are
respected and that violators are brought to
justice. Media scrutiny can provide public
and independent monitoring of a government’s progress towards keeping their com-
Excluded and invisible children can often
make compelling news stories – from street
children to child soldiers – and there is
enormous potential for the media to create a
social climate that demands their inclusion.
But not all media professionals take care to
portray such children with the respect and
understanding that is their due. The media
can sometimes contribute to the exploitation
of children – for example, by stereotyping
them as powerless victims of abuse, conflict,
crime and poverty, as perpetrators of crimes
or as charming innocents. Combined with
sensationalism, these limited representations
can lead to exploitation of children who are
experiencing rights violations – for example,
by providing identifying details or failing to
explore the child’s capacities and strengths.
Guiding principles such as those underINCLUDING CHILDREN
75
UNICEF principles and guidelines for ethical reporting on children
Reporting on children and young people has its special challenges. In some
instances the act of reporting on children places them or other children at
risk of retribution or stigmatization.
UNICEF has developed principles to
assist journalists as they report on
issues affecting children. They are
offered as guidelines that UNICEF
believes will help media to cover children in an age-appropriate and sensitive manner, while respecting their
rights under the Convention on the
Rights of the Child. The guidelines are
meant to support the best intentions
of ethical reporters: serving the public
interest without compromising the
rights of children.
be consulted about the political,
social and cultural ramifications of
any reporting.
6. Do not publish a story or an image
that might put the child, siblings or
peers at risk even when identities
are changed, obscured or not used.
Guidelines for interviewing
children
1. Do no harm to any child; avoid
questions, attitudes or comments
that are judgemental, that are
insensitive to cultural values, that
place a child in danger or expose a
child to humiliation, or that reactivate a child’s pain and grief from
traumatic events.
sion is obtained in the child’s
language and if the decision is
made in consultation with an adult
the child trusts.
6. Pay attention to where and how the
child is interviewed. Limit the number of interviewers and photographers. Try to make certain that
children are comfortable and able
to tell their story without outside
pressure, including from the interviewer. In film, video and radio
interviews, consider what the
choice of visual or audio background might imply about the child
and her or his life and story. Ensure
that the child would not be endangered or adversely affected by
showing his or her home, community or general whereabouts.
Principles
1. The dignity and rights of every
child are to be respected in every
circumstance.
2. Do not discriminate in choosing
children to interview because of sex,
race, age, religion, status, educational background or physical abilities.
2. In interviewing and reporting on
children, special attention is to be
paid to each child’s right to privacy
and confidentiality, to have their
opinions heard, to participate in
decisions affecting them and to be
protected from the actuality or possibility of harm and retribution.
3. No staging – do not ask children to
tell a story or take an action that is
not part of their own history.
3. The best interests of each child are
to be protected over any other consideration, including over advocacy
for children’s issues and the promotion of child rights.
5. Obtain permission from the child
and his or her guardian for all
interviews, videotaping and, when
possible, for documentary photographs. When possible and
appropriate, this permission should
be in writing. Permission must be
obtained in circumstances that
ensure the child and guardian are
not coerced in any way and that
they understand that they are part
of a story that might be disseminated locally and globally. This is
usually only ensured if the permis-
4. When trying to determine the best
interests of a child, the child’s right to
have their views taken into account
are to be given due weight in accordance with their age and maturity.
5. Those closest to the child’s situation and best able to assess it must
76
4. Ensure that the child or guardian
knows they are talking with a
reporter. Explain the purpose of the
interview and its intended use.
T H E S TAT E O F T H E W O R L D ’ S C H I L D R E N 2 0 0 6
Guidelines for reporting
on children
1. Do not further stigmatize any
child; avoid categorizations or
descriptions that expose a child to
negative reprisals – including additional physical or psychological
harm – or to lifelong abuse, discrimination or rejection by their local
communities.
2. Always provide an accurate context
for the child’s story or image.
3. Always change the name and
obscure the visual identity of any
child who is identified as:
• A victim of sexual abuse or
exploitation.
• A perpetrator of physical or
sexual abuse.
• HIV-positive, or living with AIDS,
unless the child, a parent or a
guardian gives fully informed
consent.
• Charged or convicted of a crime.
4. In certain circumstances of risk or potential risk of harm or retribution, change the
name and obscure the visual identity of
any child who is identified as:
• A current or former child combatant.
• An asylum seeker, a refugee or an
internally displaced person.
5. In certain cases, using a child’s identity –
their name and/or recognizable image – is
in the child’s best interests. However,
when the child’s identity is used, they
must be protected against harm and
supported through any stigmatization
or reprisals.
Some examples of these special cases occur
when children:
• Initiate contact with the reporter,
wanting to exercise their right to
freedom of expression and their right to
have their opinion heard.
• Participate in a sustained programme of
activism or social mobilization and want
to be so identified.
• Engage in a psychosocial programme
and claim their name and identity as
part of their healthy development.
6. Confirm the accuracy of what the child
has to say, either with other children or an
adult, preferably with both.
7. When in doubt about whether a child is at
risk, report on the general situation for
children rather than on an individual child,
no matter how newsworthy the story.
See References, page 93.
pinning the Convention on the Rights of the
Child, and frameworks such as UNICEF’s
Principles for Ethical Reporting on
Children33 should be used to ensure that the
rights of children are both promoted and
respected. In all cases, the best interests of
the child should be of primary concern.
A good example of a holistic approach to
improving the quality of reporting on children and youth is the Brazilian News
Agency for Children’s Rights (ANDI).34
ANDI journalists monitor the media and
publish league tables to show which publishers portray children in the most negative
light. These tables have contributed to a
gradual change in the tone of coverage, with
publishers striving to occupy a better position in the league. In addition to monitoring, ANDI offers news guidelines and
training for journalists and increases the
visibility of social projects aimed at children. Journalist Friends of Children are
given awards that have created incentives
for sensitive coverage by improving the
access that award winners have to children.
The model is now being replicated in eight
other Latin American countries.35
One way to improve the media presentation
of children and to empower children in
telling their own stories is to encourage their
direct participation as programme developers and presenters. In Albania, reports by
teenagers on the conditions in an orphanage
led to changes in its administration.36 This
illustrates how the media itself, employed
judiciously, can be a powerful tool towards
helping children to protect themselves.
A constructive and supportive debate is
needed on the issue of media images of
children. Media organizations should consider appointing children’s correspondents
with responsibility for covering all aspects
of children’s lives. Media professionals and
organizations need to educate themselves on
methods of responsible reporting on
children and their rights.
Partnerships with the media can enhance
the effectiveness of campaigns
The media can also be used as a vehicle to
educate the public on specific issues by
INCLUDING CHILDREN
77
Child labour and corporate social responsibility: The UNICEF-IKEA project
to combat child labour
An estimated 14 per cent of children
aged 5-14 in India are engaged in
child labour activities, including the
production of goods, often inexpensive, for direct export by large multinational companies. Most of these
children work in the informal economic sector, largely beyond the
reach of institutional oversight and
often in private homes doing
subcontracted work.
What are the implications for
corporations and their indirectly
employed child labourers? Since the
early 1990s, multinationals have
begun to include anti-child-labour
policies in their corporate codes of
conduct. IKEA Group, the multinational that designs, manufactures and
sells home furnishings, provides an
example of how the private sector
can do business in developing countries in a socially responsible manner
by using the Convention on the
Rights of the Child as a framework.
To ensure that no children are
employed at any level of the supply
chain, IKEA has specifically designed
the ‘IKEA Way on Preventing Child
Labour’, a code of conduct that
applies to all its suppliers. The code
requires that all contractors recognize
the Convention on the Rights of the
Child. In addition, to ensure compliance, IKEA employees make regular
on-site visits to check that there are no
children working on the premises, and
unannounced inspections are made at
least once a year by independent auditors. As a result, local suppliers who
want to attract business have to comply with the corporate codes that are
based on existing local and domestic
laws concerning children and minimum employment age.
UNICEF and IKEA joined forces to
implement this code of conduct in the
state of Uttar Pradesh in India. In
2000, UNICEF developed Phase 1 of
the Bal Adhikar-IKEA initiative, cover-
bringing information directly to individuals.
Television and radio are used in most societies to disseminate information and educate
audiences. Media partnerships for education
increase the effectiveness of these initiatives.
The Global Media AIDS Initiative, an initiative of the UN, UNAIDS and the Kaiser
Family Foundation, seeks to engage media
companies to combat HIV/AIDS by incorporating messages on the pandemic into shortand long-form broadcasts.37 More than 20
leading media executives from around the
world have joined the initiative and have
committed their companies to expanding
public knowledge and understanding about
HIV/AIDS.
ing 200 villages where IKEA currently
sources carpets. Uttar Pradesh
accounts for an estimated 15 per cent
of the country’s working children.
These children are largely employed
in the informal sector, working within
families or households. The carpet
industry of Uttar Pradesh contributes
approximately 85 per cent of India’s
carpet exports and is highly
decentralized, with marginalized rural
households constituting much of the
weaving labour force.
The project has been expanded to
500 villages and is founded on the
belief that child labour cannot be
eliminated by simply removing a
child from work, or terminating a
multinational supplier’s contract, as
the child would simply move on to a
different employer. The problem is
tackled instead by addressing child
labour’s root causes, such as
indebtedness in marginalized
communities, adult unemployment,
ships and action to fulfil their rights. Among
these is the AIDS Media Center, a Web-based
resource centre for media professionals that
includes embargoed materials, contact information, background documents and multimedia materials to facilitate a dialogue
between professionals. The Best Practice
Media Resource Centre and Database now
being established by the British Broadcasting
Corporation (BBC) World Service Trust
provides HIV/AIDS media materials and
training. The BBC is also one of the few
international broadcasters with a dedicated
and regularly updated section on children’s
rights and issues on its website.
The private sector
The resources of the Internet are being
used by national and international agencies,
NGOs and other organizations to highlight
the situation of excluded and invisible
groups of children and to promote partner78
Private-sector organizations, including trade
organizations, chambers of commerce and
other members of the business community,
also have important roles to play in includ-
T H E S TAT E O F T H E W O R L D ’ S C H I L D R E N 2 0 0 6
poverty and children’s right to quality
primary education.
To that end, IKEA and UNICEF use a
two-pronged strategy that simultaneously reaches child labourers and
their families. Women within the community, mothers in particular, are
tasked with the creation of women’s
self-help groups. In the Phase 1 villages, 430 such groups, comprising
5,600 women, save about US$3,700
per month. This enables women to
escape the exploitative interest rates
of local moneylenders. Having their
own funds, families are no longer
forced to seek help from unscrupulous
lenders when they need money to pay
for medicines, their children’s education, a wedding, or want to start their
own businesses. When families are
freed from indebtedness, they are less
likely to send their children to work.
Children’s educational needs are also
addressed by both school enrolment
campaigns and alternative learning
centres. About 75,000 out-of-school
children between 6 and 12 years old
were identified through a house-tohouse survey and brought into the
formal school system thanks to these
annual campaigns.
Alternative learning centres are a specific, time-bound strategy to reach
excluded children, concentrating on
8- to 13-year-olds. With the objective
of eventually integrating these children into the formal educational system, 103 alternative learning centres
were opened in the Phase 1 villages.
Since their inception, about 6,300 children have benefited from them, 4,980
of whom had graduated to the formal
education system by June 2005.
Efforts are under way to establish
alternative learning centres in another
300 villages.
In mid-2002, IKEA, which was already
supporting the Bal Adhikar-IKEA Child
ing children. They serve as partners in building a protective environment for children
and by ensuring that their actions never
cause children harm or allow them to be
exploited. One of the most effective ways
that private-sector organizations can do this
is through corporate social responsibility,
by establishing and abiding by codes of
conduct, as well as creating awareness
and training staff.
Corporations must ensure that their
activities never contribute to excluding
children or making them invisible
Recently, many companies have come to
accept some form of corporate social
responsibility: that they are accountable to
all of their stakeholders in all their operations and activities, with the aim of achieving sustainable development not only in the
economic dimension but also in the social
Labour Initiative in two blocks of the
Jaunpur district of eastern Uttar
Pradesh, took up the challenge to
reach and protect every infant and
pregnant woman in all 21 blocks of
the Jaunpur district. Its goal was to
achieve at least 80 per cent immunization coverage in the district by
2007 and to make it sustainable once
external assistance is withdrawn.
IKEA’s Add-on Routine Immunization
Initiative has achieved immunization
coverage of a total eligible population
of 52,558 infants and 56,407 pregnant
women living in seven blocks, comprising 1,126 villages, in Jaunpur
district. With the state government
supporting the Routine Immunization
Initiative, it is expected that the
remaining 14 blocks will be covered
in phases over the four-year
project cycle.
See References, pages 93-94.
and environmental dimensions. The publication of corporate social responsibility
reports has brought the use of child labour
to light and mobilized consumers to demand
an end to rights violations. Pressure must
continue to be exerted to ensure that hazardous child labour is eliminated, that fair
work practices are implemented, and that
corporations do not use outsourcing as a
means to evade their responsibility to those
who produce their profits.
A notable step in the protection of children
all over the world was achieved in April
2004 with the launch of the Code of
Conduct for the Protection of Children
from Sexual Exploitation in Travel and
Tourism. The Code of Conduct emerged as
a result of collaboration between End Child
Prostitution, Child Pornography and
Trafficking of Children for Sexual Purposes
(ECPAT) and private-sector groups in the
INCLUDING CHILDREN
79
Film-makers shine light on the lives of excluded and invisible children
Film-makers are in a unique position
to draw public attention to the plight
of excluded and invisible children,
and the need to speak for those children who do not have a voice was
recently recognized by some of the
world’s most prominent directors.
They collaborated with UNICEF, the
World Food Programme and the
Italian Government to produce seven
short films presented as All the
Invisible Children during the 62nd
Venice Biennale Film Festival. The
project aims to raise awareness of
the need for a global commitment to
help protect the rights of all children
everywhere.
The eight directors involved with All
the Invisible Children portray the
lives of children from different
regions of the world. Mehdi Charef
depicts conditions in Burkina Faso;
Emir Kusturica, Serbia and
Montenegro; Spike Lee, USA; Katia
Lund, Brazil; Jordan Scott and Ridley
Scott, UK; Stefano Veneruso, Italy;
and John Woo, China. Each episode
focuses on children made invisible
by poverty, violence, armed conflict,
marginalization or HIV/AIDS.
The world of street children is the
setting for three of the films. In
Lund’s short, two siblings scrape
together a living by collecting cardboard and scrap metal in the streets
of São Paolo, while Veneruso and
Kusturica’s films show children desperately stealing to get by in Naples
and the Serbian countryside, respectively. Lee portrays the tragic story
of an HIV-positive Brooklyn teenager
facing torment and stigmatization
from her peers. In Jordan and Ridley
Scott’s contribution, a war photographer retreats into reminiscences of
his childhood to escape terrifying
adult memories. Charef’s episode
80
introduces us to the lives of child
soldiers, who manipulate machine
guns with practised ease, but who
are starved of love and education.
The collection ends with Woo’s
short, which examines the contrasting lives of a rich girl and a poor girl
growing up in China.
The characters in All the Invisible
Children represent millions of their
silent off-screen peers: the tens of
millions of street children, the
hundreds of thousands of children
caught up in conflict, the more than
2 million children under 15 living
with HIV/AIDS, the many millions
who are excluded and made invisible by these and other factors.
“Children are being abused and
forgotten all around the world, and
I hope the film brings recognition
to their plight,” says Spike Lee.
Director Hanna Polak shares Lee’s
hope of raising awareness of forgotten children. Her Oscar-nominated
documentary, The Children of
Leningradsky, explores the world of
homeless children in Moscow, where
an estimated 25,000 to 30,000 children live on the streets. These
children are vulnerable to alcohol
and drug addiction, physical and
sexual abuse, HIV infection, violence
and exploitation. Polak believes that
portraying their stories is one effective way of helping them.
“As an individual, I can do only so
much for these children,” she says.
“By giving exposure to their problems through film and having them
tell their stories, I hope to influence
others to help as well. In fact, making a film with this subject matter is
a very practical way to help….
Sometimes people ask me how I can
film the harshest aspects of these
T H E S TAT E O F T H E W O R L D ’ S C H I L D R E N 2 0 0 6
children’s lives. The fact of the matter is that these aspects are very
much a part of their realities.
Without knowing this reality, how
can someone become truly aware of
their ongoing tragedy and be moved
to help them?”
Despite the challenges in reaching
the homeless children in Moscow,
making the film was very rewarding
for Polak and resulted in long-lasting
friendships. Her investment is long
term; she has established a foundation, Active Child Aid, which uses
funds raised by the documentary
and other means to help hundreds
of children living in the streets.
For Polak, the biggest reward has
been showing the children in her
film that a different life is possible:
“It is wonderful to see the children
realize that they have alternatives,
that they are not doomed to a life
spent on the streets.”
tourism industry.38 ECPAT is an alliance of
organizations working to eliminate the commercial sexual exploitation of children, with
Special Consultative Status with the United
Nations Economic and Social Council. The
Code commits the hotel and travel industry
to establishing ethical corporate policies
against the commercial sexual exploitation
of children, training personnel in countries
where children are sexually exploited and
providing information on the sexual
exploitation of children to travellers.39
In the Philippines, the non-governmental
organization Coalition Against Trafficking
in Women Asia Pacific uses various
educational tools to change the sexual
attitudes and practices of boys and men that
result in the sexual exploitation of women
and children in communities known for
prostitution.
The way forward
Bringing invisible children out of the shadows and creating inclusive societies requires
that all members of the global community –
in all their myriad roles – work to ensure
that no child is forgotten. International
agencies, donors, governments, civil society,
the media and the private sector must all
take responsibility for the inclusion and protection of children. The principles of the
Convention and recommendations of the
Committee on the Rights of the Child must
be more consistently integrated into development strategies.
Governments must make sure that their laws
promote the rights of children and that they
are allocating sufficient resources towards
ensuring the quality of life of the next generation of citizens, particularly those who
have been excluded from receiving social
benefits and services. Civil society organizations can provide a forum for the voices of
directly affected peoples to be heard. The
private sector has made some important
strides towards greater corporate social
responsibility with regards to children,
although continued work and vigilance is
required. The media plays a significant role
in bringing excluded and invisible children
into the light, challenging all to act. Respect
for the views of children must be promoted
within the family, schools and institutions.
INCLUDING CHILDREN
81
Demographic Challenges
Thirty-eight per cent of the world’s
population is under the age of 18. In the
50 least developed countries, children
account for half of the population. In 91
countries, the proportion of inhabitants
under the age of 18 will increase between
now and 2015 – the deadline for achieving
many of the Millennium Development Goals.
Changes in demographic composition
present policy challenges. It is imperative
that resources are made available to meet
the needs of growing numbers of children
in many locations. Individuals’ needs vary
during their life cycle, and early investment
in the next generation is essential for any
poverty-reduction strategy to succeed.
Urbanization poses additional challenges
as more children are concentrated in large
cities throughout the developing world.
While population rates are declining, the
increased size of urban populations will
require significant attention to ensure that
children of the urban poor do not miss out
on essential services and protection.
Simultaneously, attention must be paid to
confronting and reversing the inequities
faced by rural children.
Strategies being implemented towards
achieving the MDGs, as well as forwardlooking initiatives that aim to improve
the adult lives of the present generation
of children, will need to take these
demographic trends into account.
Children comprise a large, disenfranchised
population with limited voice in government
decision making. Therefore, it is imperative
to ensure that their needs are prioritized
in legislation, policies, programmes and,
most importantly, resource allocation.
82
T H E S TAT E O F T H E W O R L D ’ S C H I L D R E N 2 0 0 6
Our Common Future
INCLUDING CHILDREN
83
T H E S TAT E O F T H E W O R L D ’ S C H I L D R E N 2 0 0 6
Working Together
An unprecedented opportunity
© UNICEF/HQ00-0779/ Donna Decesare
Let us consider a scenario – one in which the
world has gone that extra mile to ensure that
children, regardless of the country in which
they live, their household income, gender,
ethnicity or location, have access to essential
services and are protected. Countries have
made the efforts to reach the last 5 or 10 per
cent of children who had been excluded or
invisible and are, in many cases, the hardest
to reach. Every single child is in school, with
all the empowerment and protection against
abuse that this implies. Every child is immunized against the main killer diseases, benefiting from the new vaccines currently
considered too expensive to be offered to
all.1 No infant loses their life for want of a
few simple, inexpensive doses of oral rehydration salts. No child is locked away from
the world in a workshop, labouring in conditions approaching slavery.
The benefits of such a world accrue not
only to the children but to the whole of
humanity. Premature death or debilitating
diseases become altogether less of a drag
upon the momentum of development. The
despair of extreme poverty and the disruption and destruction wreaked by conflict are
markedly reduced. Economies benefit as
workforces become healthier and more
skilled, more adaptable to the challenges of
technology and modernity. Democratic systems become more vibrant and sustained as
more literate, informed voters demand to
have an active voice in the decision-making
processes in their countries and keep corruption and authoritarianism in check.
Above all, the energy and creativity of children and young people can be channelled
into their own development and into their
full, active participation in society instead of
dissipated in a desperate struggle to survive.
This would indeed be a world fit for children. It may seem impossibly far away, but
5
SUMMARY
ISSUE: Creating a world fit for children may seem impossibly far
away, but achieving it is as simple as this: We must do everything in
our power to keep our commitments to children. These commitments
are clear and unambiguous. What is now required is the understanding that a commitment is a pledge with both moral and practical obligations. In a moral sense, a commitment signifies a relationship of
duty. In practical terms, a commitment binds those making it to a
course of action. This was implicitly recognized at the Millennium
Summit in 2000, which translated fine words and noble aspirations
into time-bound development objectives in the Millennium
Declaration – against which the world’s leaders undertook
to be measured and held accountable.
ACTION: The Millennium agenda for children is eminently attainable.
What is needed now is firm and decisive action on three key fronts
over the next 10 years.
• Meet the Millennium Development Goals: At the September 2005
World Summit, world leaders reaffirmed their commitment to meet
the Millennium Development Goals by 2015. Achieving the MDGs
must be the first step towards providing universal access to essential services, protection and participation for children. Those countries falling behind on the goals must redouble their efforts, with
ample support from donors and international agencies, while those
currently on course must strive to go beyond the goals to meet the
challenge of eliminating disparities in children’s health, education
and development.
• Reach out to the excluded and the invisible: Our commitments to
children demand that we reach out to those most in need of care
and protection – the poorest and the most vulnerable, the exploited
and the abused. We must confront unpalatable truths about the
many disparities and abuses suffered by excluded and invisible children within our countries, societies and communities, and across
borders, and do our utmost to eliminate them.
• Work together: Making this possible will require more than political
will or well intentioned strategies. No government, agency or organization can meet any of the goals by itself; the Millennium agenda
will not be achieved without effective, creative and consistent partnerships. We must all not only acknowledge our responsibility to be
part of the solution, but also be ready and willing to work together
on behalf of children. We must be their partners – seeking to
empower them as well as to include and protect them, with the
knowledge that realizing the Millennium Declaration’s vision of a
world of peace, equity, tolerance, security, freedom, respect for the
environment and shared responsibility depends on ensuring that no
child is excluded or invisible. The children of the world, especially
those who so often miss out on the opportunities they need to grow
and thrive, are counting on us.
85
genome to comprehending the origins of the
universe – could it really be impossible during the next 10 years to banish child hunger
or to keep children from dying of something
as easily preventable as diarrhoea?
© UNICEF/HQ03-0374/ Ami Vitale
Reaching all children depends on creative
and effective partnerships
it is as simple as this: We must do everything in our power to keep our commitments to children. These commitments are
clear and unambiguous. What is required
now is the understanding that a commitment is a pledge with both moral and practical obligations. In a moral sense, a
commitment signifies a relationship of duty.
In practical terms, a commitment binds
those making it to a course of action. This
was implicitly recognized at the Millennium
Summit in 2000, which translated fine
words and noble aspirations into timebound development objectives in the
Millennium Declaration – against which
the world’s leaders undertook to be measured and held accountable.
Politics has been described as the art of the
possible. The wonder of the Millennium
agenda is that politicians and international
organizations have embraced the pledge to
make it possible – by 2015 – for every child
in the world to complete primary schooling,
to cut child mortality rates by two thirds and
maternal mortality rates by three quarters,
and to not only halt, but send into retreat
HIV/AIDS, malaria and other major diseases. In a world with a global economy
worth US$60 trillion2 and rising, all these
goals and the other aims of the Millennium
agenda are eminently attainable. As humanity continues to push through the frontiers of
knowledge, and science advances further
every day – from mapping the human
86
Making this possible will require more than
political will or well-intentioned strategies.
No government, agency or organization can
achieve these goals by itself; the Millennium
agenda will not be realized without effective, creative and consistent partnerships.
Partnering means working in solidarity, not
just theoretically but practically. And it
requires, as the United Nations SecretaryGeneral’s report on enhancing cooperation
between the UN and all relevant partners
outlines, “voluntary and collaborative relationships in which all parties agree to work
together to achieve a common purpose or
undertake a specific task and to share risks,
responsibilities, resources, competencies
and benefits.”3
There are thousands of people and organizations working on behalf of children
around the world, each with its own focus,
strength and orientation. But a growing
global constituency is uniting around the
Convention on the Rights of the Child, the
Millennium Declaration, the Millennium
Development Goals and ‘A World Fit for
Children’. Only by pooling strengths can we
create a movement with a global voice and
political weight that reflects the depth and
breadth of these commitments. The children
of the world, especially those who so often
miss out on the opportunities they need to
grow and thrive, the excluded and the
invisible, are counting on us.
The concept of partnership is fundamental
to UNICEF, whose history provides a
powerful illustration of how people and
organizations working together, sharing
resources and building on one another’s
ideas can create synergies that produce
larger – and more effective – results than
might otherwise be imagined. In its founding resolution from the General Assembly,4
UNICEF was charged to work with relief
and child welfare organizations, relation-
T H E S TAT E O F T H E W O R L D ’ S C H I L D R E N 2 0 0 6
UNGEI: Making the goal of gender equality in education a reality
The majority of the 115 million
children out of school are girls.
Sustainable development and the
eradication of poverty will only be
achieved with quality education for
all girls and boys alike. A ‘business
as usual’ approach is not an option if
universal primary education and
gender equality in education are to
be achieved by 2015. Since girls face
much greater obstacles, additional
efforts are needed to get them in
school and ensure that they
complete their education. One such
effort is the United Nations Girls’
Education Initiative (UNGEI).
education interventions. UNGEI advocates at global, regional and country
levels to influence decision-making
and investments that ensure gender
equity and equality in national education policies, plans and programmes.
The partnership mobilizes resources
for projects and country programmes
as well as large-scale initiatives targeted at the education system. Its
efforts complement and are integrated into existing development structures such as poverty-reduction
strategies, sector-wide approaches
and United Nations development
assistance frameworks.
Launched at the World Forum on
Education for All in Dakar, Senegal, in
April 2000, this global movement for
girls’ education is an unprecedented
partnership that embraces stakeholders and actors at all levels. The
movement is being convened by
UNICEF and encompasses a broad
spectrum of partners who share the
same commitment, including governments, UN agencies, donors, development agencies, NGOs, civil-society
organizations, the private sector, religious groups, parents, teachers, communities and student organizations.
Making UNGEI work at the
country level
Rather than creating separate mechanisms and programmes, UNGEI’s
working principles are based on coordination, pooled resources and strategic alliances that create the synergy
needed for maximum impact of girls’
Strong partnerships and effective participation in sector-wide processes are
required to bolster girls’ education at
the national level. This process begins
with the creation of an UNGEI task
force within a country to articulate the
importance and effectiveness of its
projects and programmes in achieving gender parity in education.
UNGEI’s plan of action for girls’ education includes multiple interventions
and initiatives to engage the government and local partners in planning,
implementing, monitoring and evaluating programmes and projects.
National strategies to narrow the
gender gap in education and to
ensure all children obtain their right
to quality basic education fall into
ships that have been instrumental in sharing
information, raising funds and contributing
to policy decisions to benefit the world’s
children. National Committees for UNICEF
were established to partner with civil society. In the 1960s, NGOs influenced UNICEF
policy decisions related to maternal and
child health, education and nutrition. And
in the 1970s, it was UNICEF’s civil-society
two major categories: targeted and
systematic interventions.
• Targeted interventions are usually
small scale and focus on particular
population groups, geographic
regions or specific areas of the education system. They often are piloted by civil-society organizations
with stand-alone or coordinated
funding mechanisms. Targeted
interventions may also be largescale projects that are conducted
nationally or across multiple sites
within the country.
• Systematic interventions are usually
larger in scale and are designed to
influence the education system and
to serve most population groups.
They are frequently joint projects
between donor agencies and governments and are usually implemented countrywide or regionally.
Engaging partners is essential to
achieving gender equality in education. UNGEI partners work together
on targeted and systematic interventions with the goal of building national capacity rather than creating
parallel structures. Partner agencies
strive to be transparent and realistic
about their comparative advantages.
Each partner aims to be clear on what
it has to offer the initiative, based on
its strengths and resources.
See References, page 94.
partners who pushed for an International
Year of the Child (IYC) – an idea that
eventually resulted in the proposal for the
Convention on the Rights of the Child.
With the firm establishment of children’s
rights, UNICEF took on the challenge of
moving beyond charity-based partnerships –
seeking out children and their families as
partners and rights-holders to be empowered
WORKING TOGETHER
87
© UNICEF/HQ05-0317/Josh Estey
and enabled in making their capacities and
vulnerabilities known and acted upon.5
As part of the United Nations, UNICEF is
engaged in the reform process that is redefining the ways UN agencies will work together
at all levels to improve the effectiveness and
efficiency of the organization. This reflects a
new and growing recognition throughout the
world that development must involve all
actors to be truly effective and sustainable.
Boldness and speed are required to strengthen existing partnerships, build new ones and
create new mechanisms of accountability.
Time is of the essence, not only because the
deadline for the Millennium Development
Goals is only a decade away, but because
millions of children today will miss out on
a childhood if we do not act now.
The lives of excluded and invisible children
will depend on the actions we take now
Effective partnerships will provide the foundation for achieving the Millennium agenda,
which will bring a marked improvement to
the lives of millions of children and is a step
towards our ultimate aim: creating a world
in which every child enjoys a childhood –
protected, cared for and loved by their
parents, families and communities. This is
88
possible, but only with the support of
national and global partners working
together to ensure that children’s needs are
met and their rights protected under all
circumstances. Links between partners will
be strengthened as each actor responds to
the challenge – from government leaders
establishing budgets to voluntary agencies
working in slums, from the media as they
influence social priorities to communities
caring for their children, and from entrepreneurs showing social responsibility to the
children themselves, whose talents and
energies are just waiting to be released.
It is a bitter irony that the children most at
risk of being bypassed by the global march
against poverty and disease, illiteracy and
exploitation are those whose rights are most
abused and undervalued. It is time to reach
out to them – not just to those already
living on the margins but also to future
generations. We must be their partners –
not only seeking to include and protect
them but also to empower them – with the
knowledge that realizing the Millennium
Declaration’s vision of a world of peace,
equity, tolerance, security, freedom, respect
for the environment and shared responsibility depends on ensuring that no child is
excluded or invisible.
T H E S TAT E O F T H E W O R L D ’ S C H I L D R E N 2 0 0 6
REFERENCES
CHAPTER 1
1
The term ‘childhood’ refers to the state
and condition of a child’s life. The ideal
childhood is one where a child’s rights
under the Convention on the Rights of the
Child are fully respected and fulfilled. For a
fuller discussion on childhood, see United
Nations Children’s Fund, The State of the
World’s Children 2005, New York, 2004,
Chapter 1.
CHAPTER 1 FIGURES
Technical note: The implications for children
of meeting the Millennium Development
Goals
Figures 1.1 - 1.3 assess progress towards the
Millennium Development Goals for five key
indicators related to children’s well-being and
attempt to quantify the potential benefits for
children of achieving the MDGs by 2015. The
tables explore:
2
United Nations, Millennium Declaration,
New York, 2000, Articles 2, 6.
• How many children would benefit between
now and 2015 if the MDGs are met (Fig. 1.1.)
3
Derived from Statistical Tables 1, 6,
pp. 98-101, 118-121.
4
United Nations General Assembly,
‘A World Fit for Children’, New York,
October 2002, p. 2.
• The number of years it will take to meet
MDG 4, which aims to reduce under-five
mortality by two thirds of its level in 1990, if
current trends continue (Fig. 1.2.)
5
Ibid., pp. 15-17.
6
UNICEF projections based on data in
Statistical Tables 1-10, pp. 95-137. Notes
on the methodology employed can be
found in the technical note on this page.
7
United Nations Millennium Project,
Investing in Development: A practical plan
to achieve the Millennium Development
Goals, Earthscan, London/Sterling, VA,
2005, pp. 66-67; United Nations, In Larger
Freedom: Towards development, security,
and human rights for all, Annex, ‘For
Decisions by Heads of States and
Government’, New York, 2005; and United
Nations, ‘2005 World Summit Outcome’,
A/60/L.1*, New York, 20 September 2005,
pp. 9-10.
CHAPTER 1 PANELS
Defining exclusion and invisibility
of children
a
b
Saunders, Peter, ‘Can Social Exclusion
Provide a New Framework for Measuring
Poverty?’, SPRC Discussion Paper No. 127,
Social Policy Research Centre, University
of New South Wales, Sydney, October
2003, p. 6.
Atkinson, Tony, ‘Social Exclusion, Poverty
and Unemployment’ in Exclusion,
Employment and Opportunity, edited by A.
B. Atkinson and John Hills, Centre for
Analysis of Social Exclusion, London
School of Economics, CASE Paper 4,
London, January 1998, pp. 13-14.
• How many children will miss out if the
MDGs are not achieved and current trends
continue (Fig. 1.3)
The methodology for projecting progress
begins by calculating the current rates of
progress towards the goals based on baseline
country estimates for 1990 and 2004, or the
years closest to these for which data is available, assuming linear progress between the
two points.
The current trends scenario is calculated by
extrapolating these trends to 2015, and then
applying population projections relevant to each
MDG indicator – e.g., projected birth rates
(MDG 4) – to calculate the number of children
reached in each category.
The MDG scenario for 2015 is calculated by
projecting the rate of progress required to
meet the MDG target – e.g., a reduction in
under-five mortality by two thirds from the
1990 rate by 2015 – and interpolating between
2004 and 2015. The number of children
reached by meeting the goal is calculated by
applying this trajectory to the relevant population indicator.
Calculating the benefits to children of
achieving the MDGs and the costs to
children of not achieving the Goals
Figure 1.1. The benefits to children of meeting
each of the five MDG indicators assessed are
calculated by subtracting the estimated number
of under-five deaths, children under five who
are moderately or severely underweight, children out of primary school, and children without access to improved water and sanitation in
2004 from the respective estimates under the
MDG scenario for 2015.
Figure 1.2. The year in which MDG 4 will be
achieved on current trends is calculated by
extrapolating the current trends scenario until
the global under-five mortality rate for developing countries is reduced to two thirds of its
1990 level.
Figure 1.3. The costs of continuing on current
trends, thereby failing to achieve the MDGs by
2015, are calculated by subtracting the number
of children reached under the MDG scenario for
each indicator from its corresponding value
under the current trends scenario.
Indicator specific notes
Under-five mortality: Current trends in the
global under-five mortality rate (per 1,000 live
births) for 1990 and 2004 are calculated from
population-weighted national rates and then
extrapolated to 2015. Linear interpolation
between 2004 and 2015 is used to derive the
rate of reduction required to reduce the rate of
under-five mortality by two thirds from its 1990
level by 2015. Both of these estimates are
then multiplied by projected birth rates from
the United Nations Population Division to calculate the number of under-five lives lost based
on the current trends scenario and those lives
of under-fives lost under the MDG scenario.
Underweight: Current trends are calculated
from population-weighted national rates of
under-five malnutrition for 1990 and 2004, or
the closest years to these, which are extrapolated to 2015. Linear interpolation between
2004 and 2015 is used to derive the rate of
reduction required to halve the global rate of
under–five malnutrition from its 1990 level by
2015. The number of children reached under
each scenario is calculated by applying these
trajectories to the estimated under-five population in 1990, 2004 and 2015.
Primary school attendance: Current trends
are derived by applying the estimated rate of
progress for 1980-2001 to the net attendance
ratio for 2004 and extrapolating to 2015. The
MDG scenario is calculated as the rate of
increase required from 2004 to reach 100
per cent attendance by 2015. The number of
children reached under each scenario is calculated by applying these trajectories to the estimated number of primary school-age children
in 2004 and 2015.
Access to improved water and sanitation:
Current trends calculated from baseline
estimates for 1990 and 2002 are interpolated
to 2004 and subsequently extrapolated to
2015. Linear interpolation between 2004 and
2015 is used to derive the rate of reduction
required to halve the number of under-18s
without access to improved water sources or
sanitation from 1990 levels by 2015. The number of children reached under each scenario is
calculated by applying these trajectories to the
estimated under-18 population in 1990, 2004
and 2015. Calculations assumed that the proportion of children under 18 with access to
improved water source or sanitation is the
same as the general population (analysis of a
number of data sets showed that the difference is very small).
REFERENCES
89
CHAPTER 2
1
2
3
4
15
For a fuller discussion on the threats posed
to childhood by poverty, conflict and
HIV/AIDS, see United Nations Children’s
Fund, The State of the World’s Children
2005, UNICEF, New York, 2004, p.10.
International Labour Organization,
International Programme on the Elimination
of Child Labour, ‘Combating Child Labour
Through Education’, ILO/IPEC, Geneva,
April 2004, p. 5.
United Nations, Department of Public
Information, ‘The Millennium Development
Goals Report 2005’, UN, New York, May
2005, p. 6.
17
United Nations Children’s Fund, The State
of the World’s Children 2005, op. cit., pp.
20-22.
5
Derived from Statistical Table 1, p. 98-101.
6
Derived from Statistical Tables 1, 5, 6, pp.
98-101, 114-117, 118-121.
7
United Nations Children’s Fund, The State
of the World’s Children 2005, op. cit., pp.
45-46.
8
Derived from Statistical Table 5, pp. 114-117.
9
‘Fragile’ States are defined in this report as
states whose governments are unable or
unwilling to deliver core functions to the
majority of its people, including the poor.
(Department for International Development,
DFID, 2005). Generally, one common way
to estimate the level of fragility is derived
from the World Bank’s 2004 Country Policy
and Institutional Assessment (CPIA),
Overall Rating, Fourth and Fifth Quintiles.
10
16
United Nations Millennium Project,
Investing in Development: A practical plan
to achieve the Millennium Development
Goals, Earthscan, London/Sterling, VA,
2005, p. 113.
11
Derived from Statistical Table 5, pp. 114-117.
12
Joint United Nations Programme on
HIV/AIDS, United Nations Children’s
Fund and the United States Agency for
International Development, Children
on the Brink 2004: A joint report
of new orphan estimates and a framework
for action, Population, Health and Nutrition
Information Project for USAID,
Washington, D.C., July 2004, p. 7.
13
Derived from Statistical Table 4, pp. 110-113.
14
Joint United Nations Programme on
HIV/AIDS, United Nations Children’s
Fund and the United States Agency for
International Development, Children
on the Brink 2004, op. cit., p. 14.
90
18
19
Derived from the Joint United Nations
Programme on HIV/AIDS and World Health
Organization, AIDS Epidemic Update,
UNAIDS/WHO, Geneva, December 2004,
p. 1.
Huang, Rui., Lilyan E. Fulginiti and E.
Wesley F. Peterson, ‘Investing in Hope:
AIDS, life expectancy, and human capital
accumulation’, Paper prepared for presentation at the Meetings of the International
Association of Agricultural Economists,
Durban, South Africa, August 2003,
Abstract, p.1.
Derived from the Joint United Nations
Programme on HIV/AIDS, 2004 Report on
the Global AIDS Epidemic, Geneva, June
2004, p. 93, and the Joint United Nations
Programme on HIV/AIDS and World Health
Organization, AIDS Epidemic Update, op.
cit., p. 1.
UNICEF calculations based on data from the
Demographic and Health Survey (DHS) and
Multiple Indicator Cluster Surveys (MICS).
United Nations Children’s Fund, Progress
for Children: A report card on gender parity
and primary education, Number 2, UNICEF,
New York, April 2005, p. 6.
Innocenti Digest No. 11, UNICEF, Innocenti
Research Centre, Florence, 2004, p. 7.
30
Ibid., p. 7.
31
Ibid., pp. 7-10.
32
Ibid., Box 9, p. 9.
33
Ibid., pp. 9-10.
34
Ibid., p.10.
35
Ibid., p. 9.
36
Ibid., p. 9.
37
Ibid., p. 11.
38
United Nations Education, Scientific and
Cultural Organization, EFA Flagship
Initiatives, UNESCO, Paris, 2004, p. 19.
39
NGO/UNICEF Regional Network for
Children, ‘Leave No Child Out Campaign’,
op. cit., pp. 18-19.
40
United Nations Children’s Fund, Progress
for Children: A Report card on immunization, Number 3, UNICEF, New York,
September 2005, p. 7.
41
World Health Organization, Nutrition for
Health and Development. A global agenda
for combating malnutrition, Progress
Report, WHO, France, 2000, pp. 14-15.
20
Ibid., p. 7.
21
United Nations Millennium Project, A
Home in the City: Task force report on
improving the lives of slum dwellers,
Executive Summary, Earthscan, London/
Sterling, VA, 2005, p. 10.
42
International Campaign to Ban Landmines,
Landmine Monitor Report 2003: Toward a
mine-free world, Executive Summary,
Human Rights Watch, New York, August
2003, p. 53.
22
Ibid., pp. 16-17.
43
23
United Nations Children’s Fund, Progress
for Children, op. cit., p. 4.
24
Ibid., p. 8.
25
United Nations Population Fund, State of
the World Population Report 2004. The
Cairo Consensus at Ten: Population, reproductive health and the global effort to end
poverty, UNFPA, New York, 2004, pp. 34-35.
United Nations General Assembly
and Economic and Social Council,
‘Implementation of the Programme
of Action for the Least Developed
Countries for the Decade 2001-2010’,
Report of the Secretary-General, May
2005, A/60/81-E/2005/68.
44
United Nations Development Programme,
Human Development Report 2004: Cultural
liberty in today’s diverse world, Oxford
University Press for UNDP, New York,
2004, p. 27.
Otunnu, Olara A., ‘Special Comment’
on Children and Security, Disarmament
Forum, No. 3, United Nations Institute
for Disarmament Research, Geneva,
2002, p. 2.
45
United Nations Children’s Fund, The State
of the World’s Children 2005, op. cit., pp.
56-57.
26
27
NGO/UNICEF Regional Network for
Children, Central and Eastern Europe,
the Commonwealth of Independent
States, The Baltics, ‘Leave No Child Out
Campaign, Fact Sheets’, RNC, 2003, p. 7.
28
United Nations Development Programme,
Human Development Report 2004, op. cit.,
pp. 32-33.
29
United Nations Children’s Fund, ‘Ensuring
the Rights of Indigenous Children’,
T H E S TAT E O F T H E W O R L D ’ S C H I L D R E N 2 0 0 6
CHAPTER 2 PANELS
Income disparities and child survival
a
Derived from Statistical Table 1, pp. 98-101.
b
UNICEF calculations based on data from
the Demographic and Health Survey (DHS)
and Multiple Indicator Cluster Surveys
(MICS).
c
d
United Nations Millennium Project, Task
Force on Hunger 2005, Halving Hunger: It
can be done, Earthscan, London/Sterling,
VA, 2005, p. 18.
United Nations Children’s Fund and World
Health Organization, Immunization
Summary 2005: A statistical reference,
UNICEF/WHO, New York, February 2005,
p. vii.
The marginalization of Roma communities
and their children
a
Ringold, Dena, Mitchell A. Orenstein and
Erika Wilkens, Roma in an Expanding
Europe: Breaking the cycle of poverty,
The International Bank for Reconstruction
and Development/The World Bank,
Washington, D.C., 2003, p. 12.
b
Ibid., pp. 19-20.
c
United Nations Development Programme,
The Roma in Central and Eastern Europe:
Avoiding the dependency trap. A Regional
Human Development Report, UNDP, New
York, 2002, Table 8, p. 47.
d
Ringold, et al., op. cit., Box 1, p. 9.
e
United Nations Development Programme,
Roma in Central and Eastern Europe, op.
cit., pp. 53-62.
f
International Step by Step Association,
Open Society Institute, School Success for
Roma Children, Step by Step Special
Schools Initiative, Interim Report, Open
Society Institute, New York, 2001, p. 4.
g
Ibid., p. 4.
h
Ibid., pp. 15-16.
i
Proactive Information Services, ‘Transition
of Students: Roma Special Schools
Initiative - Year 4, Final Evaluation Report’,
prepared for the Open Society Institute,
New York, February 2004.
Issues in Developing Countries, Brief 3,
International Food Policy Research
Institute, Washington D.C., February 2001.
d
b
Osteogenesis Imperfecta Federation
Europe, Factsheet, http://www.oife.org.
Russell, Marta, Beyond Ramps: Disability
at the end of the social contract, Common
Courage Press, Monroe, ME, 1998.
Joint United Nations Programme on HIV/
AIDS, AIDS Epidemic Update, op. cit., p. 1.
b
Derived from the Joint United Nations
Programme on HIV/AIDS, 2004 Report on
the Global AIDS Epidemic, UNAIDS, New
York, June 2004, p. 15.
c
Barnett, Tony and Gabriel Rugalema,
‘HIV/AIDS’ in 2020 Focus 5, Health and
Nutrition: Emerging and Reemerging
Norwegian Refugee Council, Internal
Displacement: Global Overview of Trends
and Developments in 2004, Global IDP
Project, Geneva, 2004, p. 9.
11
United Nations Children’s Fund, ‘UNICEF
and Displacement: A guidance note’,
UNICEF, Department of Emergency
Operations, New York, 2005, p. 2.
12
Norwegian Refugee Council, Internal
Displacement, op. cit., p. 23.
13
United Nations Children’s Fund, ‘UNICEF
and Displacement’, op. cit., p. 2.
14
Executive Committee of the High
Commissioner’s Programme, ‘Agenda for
Protection’, UNHCR, June 2002,
EC/52/SC/CRP.9/Rev.1.
15
The formal definition of an orphan used
here is a child under 18 who has lost at
least one parent. A single orphan is a child
who has lost one parent, while a double
orphan has lost both parents. Joint United
Nations Programme on HIV/AIDS, Children
on the Brink 2004, op. cit., p. 7.
16
Ibid., p. 7.
17
Ibid., p. 7.
18
Kifle, Abiy, ‘Ethiopia, Child Domestic
Workers in Addis Ababa: A rapid assessment’, International Programme on the
Elimination of Child Labour, International
Labour Office, International Labour
Organization, Geneva, July 2002, p. 19.
19
Musingeh, A.C.S., et al., ‘HIV/AIDS and
Child Labour in Zambia: A rapid assessment’, Paper no. 5, International
Programme on the Elimination of Child
Labour, International Labour Office,
International Labour Organization,
Geneva/Lusaka, 2003, pp. vii-viii.
20
Consortium for Street Children, ‘Street
Children FAQs’,http://www.streetchildren.org.uk/street_children.
21
United Nations Children’s Fund, The State
of the World’s Children 2003, UNICEF,
New York, 2002, p. 37.
22
Casa Allianza, ‘Exploitation of Children – A
Worldwide Outrage’, Casa Allianza,
Worldwide Statistics, September 2000, p. 1.
23
Consortium for Street Children, ‘Street
Children FAQs’, op. cit.
24
United Nations Children’s Fund, ‘Factsheet:
Child Protection’, UNICEF, New York, 2004.
25
Committee on the Rights of the Child,
[Report of] 37th Session, 13 September to
1 October 2004, Geneva, 2004, p. 8.
Figure 2.4 ‘Fragile’ states are among the
poorest
‘Fragile’ States are defined in this report as
States whose governments are unable or
unwilling to deliver core functions to the
majority of their people, including the poor.
(Department for International Development,
DFID, 2005). The list of countries with weak
policy/institutional frameworks is derived
from the World Bank 2004 Country Policy
and Institutional Assessment (CPIA), Overall
Rating, Fourth and Fifth Quintiles. It includes
Angola, Burundi, Cambodia, Central African
Republic, Chad, Comoros, Congo,
Democratic Republic of the Congo, Côte
d’ Ivoire, Djibouti, Eritrea, Gambia, Guinea,
Guinea-Bissau, Haiti, Kiribati, Lao People’s
Democratic Republic, Mauritania, Nigeria,
Papua New Guinea, Sao Tome and Principe,
Sierra Leone, Solomon Islands, Sudan,
Tajikistan, Togo, Tonga, Uzbekistan, Vanuatu,
Zimbabwe.
CHAPTER 3
1
United Nations Children’s Fund, The
‘Rights’ Start to Life: A statistical analysis
of birth registration, UNICEF, New York,
2005, p. 3.
2
Ibid., p.1.
3
United Nations Children’s Fund,
‘Birth Registration: Right from the
Start’, Innocenti Digest No. 9, UNICEF
Innocenti Research Centre, Florence,
March 2002, p. 1.
4
United Nations Children’s Fund, The
‘Rights’ Start to Life, op. cit., p. 1.
5
Derived from Statistical Table 9, pp. 130-131.
6
Ibid., pp. 130-131.
7
United Nations Children’s Fund, The
‘Rights’ Start to Life: A statistical analysis
of birth registration, op. cit., Table 2, p. 29.
8
Derived from Statistical Table 9, pp. 130-131;
and United Nation’s Childrens Fund, ‘Birth
registration: Right from the start’, op. cit.,
p. 10-12.
Global Campaign on Children and AIDS
a
10
Joint United Nations Programme on
HIV/AIDS, Children on the Brink 2004, op.
cit., p. 8.
CHAPTER 2 FIGURES
Living with disability
a
other persons of concern to UNHCR,
UNHCR, Geneva, June 2005, p. 2.
9
Office of the United Nations High
Commissioner for Human Rights, 2004
Global Refugee Trends: Overview of
refugee populations, new arrivals, durable
solutions, asylum-seekers, stateless and
REFERENCES
91
26
27
United Nations, ‘Violence Against Children
in Conflict with the Law: A thematic consultation for the United Nations SecretaryGeneral’s Study on Violence Against
Children’, UN, Geneva, 4-5 April 2005, p. 4.
United Nations General Assembly,
‘Convention on the Rights of the Child’,
New York, 1989, Preamble.
International Labour Organization,
International Programme on the Elimination
of Child Labour, ‘Nepal, Trafficking in Girls
with Special Reference to Prostitution: A
rapid assessment’, Executive Summary,
ILO/IPEC, Geneva, 2001, pp. 24, 42.
from the UNFPA website.
43
International Labour Organization, Every
Child Counts, op. cit., pp. 8, 12.
The links between child protection and
the Millennium Development Goals
42
The protective environment
Information supplied by Child Protection
Section, Programme Division, UNICEF, New
York, 2005.
28
United Nations Children’s Fund, The State
of the World’s Children 2005, op. cit.,
pp. 41, 44.
44
International Labour Organization, A
Global Alliance against Forced Labour,
op. cit., p. 17.
Information supplied by Child Protection
Section, Programme Division, UNICEF, New
York, 2005.
29
Ibid., p. 44.
45
Save the Children, ‘Forgotten Casualties of
War: Girls in armed conflict’, Executive
Summary, London, April 2005, p.1.
International Labour Organization, A Future
Without Child Labour, op. cit., p. 31.
CHAPTER 4
30
46
International Labour Organization,
International Programme on the Elimination
of Child Labour, Helping Hands or Shackled
Lives? Understanding Child Domestic
Labour and Responses to It, ILO/IPEC,
Geneva, June 2004, p. 20, footnote 25.
31
United Nations Children’s Fund, Early
Marriage: A harmful traditional practice,
UNICEF, New York, 2005, p. 4.
32
Ibid., Table 2, p. 32.
33
Assani, Aliou, ‘Etudes sur les mariages précoces et les grossesses précoces au
Burkina Faso, Cameroun, Gambie, Liberia,
Niger et Tchad’, UNICEF Abidjan, 2000.
Cited in United Nations Children’s Fund,
Early Marriage: Child spouses, Innocenti
Digest No. 7, UNICEF, Innocenti Research
Centre, Florence, 2001, p. 2.
34
United Nations Children’s Fund, Early
Marriage: Child spouses, op. cit., p. 2.
35
United Nations General Assembly,
‘Convention on the Elimination of All Forms
of Discrimination against Women’, New
York, 1979, Article 16.
36
United Nations Children’s Fund, Early
Marriage: Child spouses, op. cit., p. 11.
37
Ibid., p. 11.
38
International Labour Organization,
International Programme on the Elimination
of Child Labour, Statistical Information and
Monitoring Programme on Child Labour,
Every Child Counts: New global estimates
on child labour, Summary of Highlights,
ILO/IPEC/SIMPOC, Geneva, 2002, pp. 8,
12.
39
Ashagrie, Kebebew, ‘Statistics on Working
Children and Hazardous Child Labour in
Brief’, International Labour Organization,
Geneva, April 1998, pp. 8-12.
40
International Labour Organization, A Future
Without Child Labour, ILO, Geneva, 2002,
p. 32.
41
International Labour Organization,
Unbearable to the Human Heart: Child trafficking and action to eliminate it, ILO,
Geneva, 2002, pp. 14-15.
92
47
Ibid., pp. 12, 51.
48
Ibid., p. 51.
49
Organización Internacional del Trabajo,
Programa Internacional para la Erradicación
del Trabajo Infantil, El Salvador, Trabajo
infantil doméstico: una evaluación rápida,
ILO/IPEC, Geneva, February 2002, p. xi.
50
Landgren, Karin, ‘The Protective
Environment: Development support for
child protection’, Human Rights Quarterly,
Vol. 27, No. 1, Johns Hopkins University
Press, Baltimore, 2005, p. 220.
51
Submission from UNICEF Somalia, April
2005.
52
United Nations Children’s Fund, ‘Child
Trafficking in West Africa: Policy responses’, UNICEF, Innocenti Insight, Florence,
April 2002, p. 14.
53
Ibid., p. 14.
54
Submission from UNICEF Moldova, April
2005.
1
Inter-Parliamentary Union and United
Nations Children’s Fund, Combating Child
Trafficking, Handbook for Parliamentarians
No. 9, IPU and UNICEF, France, March
2005, p. 11.
2
United Nations Children’s Fund, Early
Marriage: A harmful traditional practice,
op. cit., p. 25; and United Nation’s Children’s
Fund, Progress for Children, op. cit., p. 7.
3
Economic Community of West African
States, ‘ECOWAS Initial Plan of Action
against Trafficking in Persons (2002-2003)’,
ECOWAS, Executive Secretariat, Dakar,
December 2001, p. 7.
4
International Labour Organization
Unbearable to the Human Heart,
op. cit., p.67.
5
Machel, Graça, The Impact of Armed
Conflict on Children, United Nations, United
Nations Children’s Fund, New York, 1996.
6
Otunnu, Olara A., ‘Era of Application:
Instituting a compliance and enforcement
regime for CAAC’, Statement before the
Security Council, New York, 23 February
2005, p. 3.
7
United Nations Children’s Fund, ‘Early
Marriage: Child spouses’, op. cit., p. 8.
8
Derived from Statistical Table 9, p. 130.
9
UNICEF provides two indicators for female
genital mutilation/cutting: (A) Women: the
percentage of women aged 15-49 who
have been mutilated/cut; (B) Daughters:
the percentage of women aged 15-49 with
at least one mutilated/cut daughter.
Indicator A is indicative of the extent of
FGM/C among the female population as a
whole, whereas Indicator B is indicative of
the extent of new incidence of FGM/C.
The figure cited in the text refers to
Indicator B and was derived from Statistical
Table 9, p. 130.
10
Institute for Democracy in South Africa and
Save the Children Sweden, Report of the
Global Seminar on Monitoring Government
Budgets to Advance Child Rights and Child
CHAPTER 3 PANELS
Children and young people in detention in
Nigeria
Information derived from The Federal
Government of Nigeria and United Nations
Children’s Fund, ‘Juvenile Justice in Nigeria’,
Fact Sheet, UNICEF Abuja, 2003; Submission
from UNICEF Abuja, 2005, and group discussions with children held in Enugu, Nigeria, on
14 May 2005.
Early marriage and fistula
Information derived from the United Nations
Population Fund, The Campaign to End
Fistula, 2004 Annual Report, UNFPA, New
York, 2005, p. 1, and other material derived
T H E S TAT E O F T H E W O R L D ’ S C H I L D R E N 2 0 0 6
Poverty Alleviation: How far have we
come?’, Cape Town, 10-14 May 2004, p. 1.
11
12
13
14
15
16
17
18
19
Vásquez, Enrique, and Enrique Mendizabal,
‘How to Make Children Come First: The
process of visualizing children in Peru’,
paper presented at the International
Conference ‘Promoting Human Rights and
Social Policies for Children and Women:
Monitoring and Achieving the Millennium
Development Goals’, co-sponsored by the
United Nations Children’s Fund and the
Graduate School of International Affairs
of The New School, 28-30 April 2004,
New York.
As cited in United Nations Children’s Fund,
‘A Children’s Budget: Ensuring adequate
resource commitment and budget analysis
for children’, Child-Friendly Cities Secretariat,
http://www.childfriendlycities.org.
Ministry of Basic Education and Culture,
Namibia, ‘National Policy Options for
Educationally Marginalized Children’, 2000,
cited in United Nations Children’s Fund,
‘Guidance Note: Reaching Marginalized
Children and Families’, UNICEF
Organizational Plan 2006-2009, New York,
p. 3.
Barberton, Conrad, and John Stuart, ReCosting the Child Justice Bill: Updating the
original costing taking into consideration
changes made to the bill, Applied Fiscal
Research Centre, Executive Summary,
(Afrec Pty Ltd), South Africa, May 2001, pp.
11-IV.
Social Development Notes,
Environmentally and Socially Sustainable
Development Network, ‘Case Study 3 Gujarat, India: Participatory Approaches in
Budgeting and Public Expenditure
Management’, prepared by Wagle,
Swarning and Parmesh Shah of the
Participation and Civic Engagement Group
in The World Bank, Note No. 72, March
2003.
20
United Nations Children’s Fund, ‘Guidance
Note: Reaching Marginalized Children and
Families’, op. cit., p. 17.
21
Submission from UNICEF Malaysia, May
2005.
22
Cvekic, Ljiljana, ‘Serbia and Montenegro:
Immunization to reach the unreached’,
UNICEF Serbia and Montenegro, January
2004.
23
United Nations Millennium Project,
Investing in Development, op. cit., p. 306.
24
Women’s Commission for Refugee
Women and Children, ‘Only Through
Peace: Hope for breaking the cycle of
famine and war in Sudan’, New York,
September 1999, p.10.
Department for International Development,
Departmental Report 2005, DFID, UK,
2005, p. 128.
Submission from UNICEF Dominican
Republic, April 2005.
Jempson, Mark, ‘Children and Media – A
Global Concern’, prepared as a contribution
to ‘Child Rights and the Media: Asia
Regional Workshop’, Bangkok, 24-25 June
2003, p. 5.
35
Gigli, Susan and InterMedia Survey
Institute for UNICEF, ‘Children, Youth and
Media Around the World: An overview of
trends & issues’, 4th World Summit on
Media for Children and Adolescents, Rio de
Janeiro, Brazil, April 2004, p. 11.
36
Jempson, Mark, ‘Children and the Media’,
MAGIC briefing, UNICEF,
http://www.unicef.org/magic/briefing/childmedia.html.
37
United Nations, Joint United Nations
Programme on HIV/AIDS, Kaiser Family
Foundation, ‘The Global Media AIDS
Initiative’, http://www.kff.org/hivaids/
gmai.cfm.
25
United Nations Children’s Fund,
Humanitarian Action Report 2005, UNICEF,
New York, 2005, p. 153.
26
United Nations Children’s Fund, World
Conference of Religions for Peace and
United States Agency for International
Development, What Religious Leaders Can
Do about HIV/AIDS: Action for children and
young people, UNICEF, WCRP and USAID,
New York, November 2003, pp. 8, 17, 21.
38
ECPAT, United Nations Children’s Fund and
World Tourism Organization, ‘Code of
Conduct for the Protection of Children from
Sexual Exploitation in Travel and Tourism’,
http://www.thecode.org.
39
Ibid.
27
Ibid., p. 8.
CHAPTER 4 PANELS
28
Submission from UNICEF, Regional Office
for Latin America and the Caribbean,
October 2005.
Statistical tools for monitoring the
Millennium agenda for children
29
Joint United Nations Programme on
HIV/AIDS, HIV-Related Stigma,
Discrimination and Human Rights
Violations: Case studies of successful
programmes, UNAIDS best practice collection, UNAIDS, Geneva, April 2005, pp. 2425.
30
31
United Nations Children’s Fund, UNICEF
Efforts to Address the Needs of Children
Orphaned and Made Vulnerable by
HIV/AIDS: Rwanda, Swaziland, and
Tanzania’, draft 3, UNICEF, May 2004, New
York, p. 8.
United Nations Children’s Fund, Report on
the Situation of Children and Adolescents
in Brazil, UNICEF, Brasilia, 2003, pp. 125126.
34
32
33
United Nations Millennium Project,
Investing in Development, op. cit., p. 128.
Global Movement for Children and
Mouvement Africain des Enfants et Jeunes
Travailleurs, ‘A World Fit for Us… Children:
African children organisations’ report of
accountability on the promises governments have made to them’, Executive
Summary and p. 5, GMC/MAEJT, Dakar,
Senegal, 2005.
Caillods, Françoise and Candy Lugaz,
United Nations Educational, Scientific and
Cultural Organization and International
Institute of Educational Planning, ‘How to
do the ‘Missing Out’ map’, UNESCO/IIEP,
New York, April, 2004, p. 7.
Information supplied by Media Section,
Department of Communication, UNICEF,
New York, 2005.
Information derived from Demographic and
Health Surveys; United Nations Children’s
Fund, Strategic Information Section.
Monitoring the effectiveness of budgets in
meeting children’s rights in South Africa
Information derived from the Institute for
Democracy in South Africa (IDASA) website
and UNICEF South Africa.
The Child Rights Index: Assessing the
rights of children in Ecuador and Mexico
Information supplied by UNICEF Mexico and
UNICEF Ecuador, July 2005.
UNICEF Principles and Guidelines for
Ethical reporting on Children
Information supplied by Media Section,
Division of Communication, UNICEF, New
York, 2005.
Child labour and corporate social responsibility: The UNICEF-IKEA project to combat child labour
Information derived from Statistical Table 9,
p. 130; International Labour Organization,
A future without Child Labour, ILO, Geneva,
2002, pp. XI, 28; Submission from UNICEF
India, July 2005; United Nations Children’s
Fund, Child Labour Resource Guide, ‘Appendix
6 – Developing child labour policies: Examples
from four major businesses’, UNICEF, New
REFERENCES
93
York, 2005, pp. 112-115; IKEA Services AB,
‘The IKEA Way on Preventing Child Labour’,
IKEA, Sweden, 2002, p. 2; IKEA Services AB,
‘Social and Environmental Responsibility’,
IKEA, Sweden, 2004, pp. 20, 22.
3
CHAPTER 5
1
These include vaccines against
haemophilus influenzae type B, hepatitis B,
streptococcus pneumoniae and rotavirus.
2
Real global gross domestic product (GDP)
measured in US dollars at purchasingpower-parity values. Derived from the
International Monetary Fund, World
Economic Outlook, Statistical Appendix,
IMF, Washington D.C., September 2005, p.
205.
94
United Nations, ‘Enhanced cooperation
between the United Nations and all relevant partners, in particular the private sector’, Report of the Secretary-General,
A/58/227, United Nations, New York, 18
August 2003, p. 4.
4
United Nations General Assembly, resolution 57 (I), Establishment of an International
Children’s Emergency Fund, United
Nations, New York, December 1946.
5
United Nations Children’s Fund, The State
of the World’s Children 1996, UNICEF, New
York, 1995, Chapter 2, pp. 43-46.
T H E S TAT E O F T H E W O R L D ’ S C H I L D R E N 2 0 0 6
CHAPTER 5 PANEL
UNGEI: Making the goal of gender
equality in education a reality
Information derived from United Nations
Children’s Fund, Progress for Children: A
report card on gender parity and primary education, Number 2, UNICEF, New York, April
2005, p. 3; United Nations Girls’ Education
Initiative, UNGEI Info Sheet; and United
Nations Girls’ Education Initiative,
‘Framework for Action at Country, Regional
and Global Levels’, Operation Guidelines
Paper, UNGEI, July 2005.
STATISTICAL TABLES
Economic and social statistics on the countries and territories of the world, with
particular reference to children’s well-being.
General note on the data........................................................................................page 96
Explanation of symbols..........................................................................................page 96
Under-five mortality rankings................................................................................page 97
Summary indicators ..............................................................................................page 132
Measuring human development:
An introduction to table 10 ................................................................................page 133
TABLES
1
2
3
4
5
Basic indicators..............................................................................page 98
Nutrition ......................................................................................page 102
Health ..........................................................................................page 106
HIV/AIDS ......................................................................................page 110
Education ....................................................................................page 114
6 Demographic indicators ............................................................page 118
7 Economic indicators ..................................................................page 122
8 Women ........................................................................................page 126
9 Child protection ..........................................................................page 130
10 The rate of progress ..................................................................page 134
STATISTICAL TABLES
Economic and social statistics on the countries and territories of the world,
with particular reference to children’s well-being.
General note on the data
The data presented in the following statistical tables are
accompanied by definitions, sources and explanations of
symbols. Data from the responsible United Nations organizations have been used whenever possible. Where such internationally standardized estimates do not exist, the tables
draw on other sources, particularly data received from the
appropriate UNICEF field office. Where possible, only comprehensive or representative national data have been used.
Data quality is likely to be adversely affected for countries
that have recently suffered from man-made or natural
disasters. This is particularly so where basic country
infrastructure has been fragmented or major population
movements have occurred.
Several of the indicators, such as the data for life
expectancy, total fertility rates and crude birth and
death rates, are part of the regular work on estimates and
projections undertaken by the United Nations Population
Division. These and other internationally produced
estimates are revised periodically, which explains why
some of the data will differ from those found in earlier
UNICEF publications.
Several statistical tables have been revised this year. In the
basic indicators table (table 1), the under-five and infant
mortality rates are presented for 1990 and 2004, replacing
the 1960 estimate with the 1990 estimate to better reflect
the focus on monitoring progress related to the Millennium
Development Goals and its baseline year of 1990. The
health table (table 3) has seen the addition of data for a
new immunization antigen, Haemophilus influenzae type b
(Hib), as well as the addition of estimates for the first dose
of the diphtheria, pertussis and tetanus (DPT) vaccine,
which in conjunction with the DPT3 estimate permits
comparison of the drop-out rate in immunizations.
Substantial changes have been made to the education
data in tables 1 and 5. In table 1, the net primary school
enrolment/attendance indicator has been computed based
on attendance data from household surveys dated from
2000 to 2004, where available, and otherwise from administrative enrolment data reported by UNESCO/UIS (UNESCO
Institute for Statistics). The net primary school attendance
ratio (NAR) is an improved indicator including not only children attending primary school but also those attending secondary education. The NAR is defined as the percentage of
children in the age group that officially corresponds to primary schooling who attend primary or secondary school.
In addition, the adult literacy rate is now presented only for
the year 2000 since comparison with previous values from
1990 is not recommended due to differences in definition
and data collection. Also, secondary school participation is
expanded in two new ways, first to include net ratios for
enrolment and second to include secondary net attendance
ratios obtained from household surveys.
The demographic indicators (table 6) have also seen
some additions. These are the inclusion of estimates
for the crude birth rate, the crude death rate and the life
expectancy for 1990 in addition to the estimates for 1970
and the current estimate. These additions have again
been made to provide data consistent with the baseline
year for the MDGs.
The women’s indicators (table 8) have also seen the
inclusion of two new indicators – the ratio of females as
a percentage of males for the net primary enrolment ratio
and the net secondary enrolment ratios. These have been
added to complement the ratios of gross primary enrolment and gross secondary enrolment that have been
published in the past.
Finally, the rate of progress indicators (table 10) have been
revised to provide data comparing change between 1970
and 1990 and 1990 and 2004. Previously this table used
estimates for 1960 as the earliest point. This has been
changed to 1970 to provide a more recent and more
comparable time frame over which to compare change
in key indicators.
Explanation of symbols
Since the aim of this statistics chapter is to provide a broad
picture of the situation of children and women worldwide,
detailed data qualifications and footnotes are seen as
more appropriate for inclusion elsewhere. The following
symbols are common across all tables; symbols specific
to a particular table are included in the table’s footnotes:
96
T H E S TAT E O F T H E W O R L D ’ S C H I L D R E N 2 0 0 6
-
Indicates data are not available.
x
Indicates data that refer to years or periods other than
those specified in the column heading, differ from the
standard definition, or refer to only part of a country.
Such data are not included in the regional averages or
totals.
*
Data refer to the most recent year available during the
period specified in the column heading.
Under-five mortality rankings
The following list ranks countries and territories in descending order of their estimated 2004 under-five mortality
rate (U5MR), a critical indicator of the well-being of children. Countries and territories are listed alphabetically
in the tables that follow.
Under-5
mortality
rate (2004)
Value Rank
Under-5
mortality
rate (2004)
Value Rank
Sierra Leone
Angola
Niger
Afghanistan
Liberia
Somalia
Mali
Congo, Democratic Republic of the
Equatorial Guinea
Guinea-Bissau
Rwanda
Chad
Nigeria
Côte d’Ivoire
Central African Republic
Burkina Faso
Burundi
Zambia
Malawi
Ethiopia
Swaziland
Guinea
Benin
Mozambique
Cameroon
Cambodia
Togo
Uganda
Senegal
Zimbabwe
Djibouti
Tanzania, United Republic of
Iraq
Mauritania
Madagascar
Gambia
Kenya
Sao Tome and Principe
Tajikistan
Haiti
Botswana
Ghana
Yemen
Congo
Myanmar
Turkmenistan
Pakistan
Papua New Guinea
Gabon
Sudan
Azerbaijan
India
Lao People’s Democratic Republic
Eritrea
Lesotho
Bhutan
Timor-Leste
Bangladesh
Nepal
Kazakhstan
Comoros
Bolivia
Uzbekistan
Kyrgyzstan
South Africa
283
260
259
257
235
225
219
205
204
203
203
200
197
194
193
192
190
182
175
166
156
155
152
152
149
141
140
138
137
129
126
126
125
125
123
122
120
118
118
117
116
112
111
108
106
103
101
93
91
91
90
85
83
82
82
80
80
77
76
73
70
69
69
68
67
1
2
3
4
5
6
7
8
9
10
10
12
13
14
15
16
17
18
19
20
21
22
23
23
25
26
27
28
29
30
31
31
33
33
35
36
37
38
38
40
41
42
43
44
45
46
47
48
49
49
51
52
53
54
54
56
56
58
59
60
61
62
62
64
65
Kiribati
Guyana
Namibia
Marshall Islands
Solomon Islands
Korea, Democratic People’s Republic of
Mongolia
Tuvalu
Maldives
Georgia
Guatemala
Morocco
Honduras
Algeria
Vanuatu
Belize
Suriname
Indonesia
Iran (Islamic Republic of)
Nicaragua
Cape Verde
Egypt
Brazil
Philippines
Armenia
Dominican Republic
Turkey
China
Lebanon
Nauru
Samoa
Peru
El Salvador
Mexico
Moldova, Republic of
Jordan
Palau
Saudi Arabia
Ecuador
Tonga
Tunisia
Occupied Palestinian Territory
Panama
Paraguay
Micronesia (Federated States of)
Viet Nam
Saint Vincent and the Grenadines
Colombia
Cook Islands
Grenada
Qatar
Russian Federation
Saint Kitts and Nevis
Thailand
Fiji
Jamaica
Libyan Arab Jamahiriya
Romania
Trinidad and Tobago
Albania
Venezuela
Argentina
Ukraine
Uruguay
Syrian Arab Republic
65
64
63
59
56
55
52
51
46
45
45
43
41
40
40
39
39
38
38
38
36
36
34
34
32
32
32
31
31
30
30
29
28
28
28
27
27
27
26
25
25
24
24
24
23
23
22
21
21
21
21
21
21
21
20
20
20
20
20
19
19
18
18
17
16
66
67
68
69
70
71
72
73
74
75
75
77
78
79
79
81
81
83
83
83
86
86
88
88
90
90
90
93
93
95
95
97
98
98
98
101
101
101
104
105
105
107
107
107
110
110
112
113
113
113
113
113
113
113
120
120
120
120
120
125
125
127
127
129
130
Under-5
mortality
rate (2004)
Value Rank
Bosnia and Herzegovina
15
Bulgaria
15
Mauritius
15
Serbia and Montenegro
15
Dominica
14
Saint Lucia
14
Seychelles
14
Sri Lanka
14
The former Yugoslav Republic of Macedonia 14
Bahamas
13
Costa Rica
13
Oman
13
Antigua and Barbuda
12
Barbados
12
Kuwait
12
Latvia
12
Malaysia
12
Bahrain
11
Belarus
11
Brunei Darussalam
9
Slovakia
9
Chile
8
Estonia
8
Hungary
8
Lithuania
8
Poland
8
United Arab Emirates
8
United States
8
Andorra
7
Croatia
7
Cuba
7
Australia
6
Canada
6
Ireland
6
Israel
6
Korea, Republic of
6
Luxembourg
6
Malta
6
Netherlands
6
New Zealand
6
United Kingdom
6
Austria
5
Belgium
5
Cyprus
5
Denmark
5
France
5
Germany
5
Greece
5
Italy
5
Liechtenstein
5
Monaco
5
Portugal
5
Spain
5
Switzerland
5
Czech Republic
4
Finland
4
Japan
4
Norway
4
San Marino
4
Slovenia
4
Sweden
4
Iceland
3
Singapore
3
Holy See
No Data
Niue
No Data
S TAT I S T I C A L TA B L E S
131
131
131
131
135
135
135
135
135
140
140
140
143
143
143
143
143
148
148
150
150
152
152
152
152
152
152
152
159
159
159
162
162
162
162
162
162
162
162
162
162
172
172
172
172
172
172
172
172
172
172
172
172
172
185
185
185
185
185
185
185
192
192
-
97
TABLE 1. BASIC INDICATORS
Countries and
territories
Afghanistan
Albania
Algeria
Andorra
Angola
Antigua and Barbuda
Argentina
Armenia
Australia
Austria
Azerbaijan
Bahamas
Bahrain
Bangladesh
Barbados
Belarus
Belgium
Belize
Benin
Bhutan
Bolivia
Bosnia and Herzegovina
Botswana
Brazil
Brunei Darussalam
Bulgaria
Burkina Faso
Burundi
Cambodia
Cameroon
Canada
Cape Verde
Central African Republic
Chad
Chile
China
Colombia
Comoros
Congo
Congo, Democratic
Republic of the
Cook Islands
Costa Rica
Côte d’Ivoire
Croatia
Cuba
Cyprus
Czech Republic
Denmark
Djibouti
Dominica
Dominican Republic
Ecuador
Egypt
El Salvador
Equatorial Guinea
Eritrea
Estonia
Ethiopia
Fiji
98
Under-5
mortality
rate
Net primary
school
Total
enrolment/
adult
attendance
literacy
(%)
rate
2000-2004* 1996-2004*
% share
of household
income
1993-2003*
2004
Total
population
(thousands)
2004
Annual
no. of
births
(thousands)
2004
Annual
no. of
under-5
deaths
(thousands)
2004
168
37
54
154
26
52
8
8
84
24
15
100
14
13
8
39
111
107
89
18
45
50
10
15
113
114
80
85
7
45
102
117
17
38
30
88
83
165
17
35
6
154
11
16
29
5
5
75
10
9
56
10
9
4
32
90
67
54
13
84
32
8
12
97
114
97
87
5
27
115
117
8
26
18
52
81
28574
3112
32358
67
15490
81
38372
3026
19942
8171
8355
319
716
139215
269
9811
10400
264
8177
2116
9009
3909
1769
183913
366
7780
12822
7282
13798
16038
31958
495
3986
9448
16124
1307989
44915
777
3883
1395
53
671
1
749
2
685
34
249
75
132
6
13
3738
3
91
111
7
341
64
265
37
46
3728
8
67
601
330
422
562
328
15
149
456
249
17372
970
28
172
359
1
27
0
195
0
12
1
1
0
12
0
0
288
0
1
1
0
52
5
18
1
5
127
0
1
115
63
60
84
2
1
29
91
2
539
20
2
19
250x
2080
2280
d
1030
10000
3720
1120
26900
32300
950
14920x
10840x
440
9270x
2120
31030
3940
530
760
960
2040
4340
3090
24100x
2740
360
90
320
800
28390
1770
310
260
4910
1290
2000
530
770
46
74
71
41
75
72
81
79
67
70
75
63
75
68
79
72
54
63
64
74
35
71
77
72
48
44
57
46
80
71
39
44
78
72
73
64
52
99
70
67
97
99
99
88
41
100
100
77
34
87
95
79
88
93
98
13
59
74
68
76
49
26
96
91
94
56
83
53s
95
94s
89
58s
97s
97
90
91s
86
86s
79s
100
94
100
99
54s
78s
86s
84s
95s
90
32s
47s
65s
75s
100
99
43s
39s
85
99
93s
31s
54
23
19
10
18
18
21
19
22
21
22
13
24
7
8
20
12
15
18
15
20
7
10
14
9
-
37
43
56
45
41
39
45
41
39
37
49
36
70
63
39
61
48
48
51
40
65
62
50
62
-
129
26
16
103
11
11
10
11
8
122
15
50
43
76
47
103
88
12
131
25
129
18
11
117
6
6
5
4
4
101
13
27
23
26
24
122
52
6
110
16
55853
18
4253
17872
4540
11245
826
10229
5414
779
79
8768
13040
72642
6762
492
4232
1335
75600
841
2788
0
79
661
41
136
10
91
63
27
2
211
296
1890
166
21
166
13
3064
19
572
0
1
128
0
1
0
0
0
3
0
7
8
68
5
4
14
0
509
0
120
4670
770
6590
1170x
17580
9150
40650
1030
3650
2080
2180
1310
2350
c
180
7010
110
2690
44
78
46
75
78
79
76
77
53
68
75
70
71
43
54
72
48
68
65
96
48
98
100
97
88
91
56
80
84
100
42
93
52s
90
58s
89
93
96
87
100
36
81
92s
100
83s
90
62s
63s
95
31s
100
13
14
21
25
23
14
11
21
10
18
22
-
52
51
40
36
36
53
58
44
57
44
39
-
Infant
mortality
rate
(under 1)
Under-5
mortality
rank
1990
2004
1990
4
125
79
159
2
143
127
90
162
172
51
140
148
58
143
148
172
81
23
56
62
131
41
88
150
131
16
17
26
25
162
86
15
12
152
93
113
61
44
260
45
69
260
29
60
10
10
105
29
19
149
16
17
10
49
185
166
125
22
58
60
11
18
210
190
115
139
8
60
168
203
21
49
36
120
110
257
19
40
7
260
12
18
32
6
5
90
13
11
77
12
11
5
39
152
80
69
15
116
34
9
15
192
190
141
149
6
36
193
200
8
31
21
70
108
8
113
140
14
159
159
172
185
172
31
135
90
104
86
98
9
54
152
20
120
205
32
18
157
12
13
12
13
9
163
17
65
57
104
60
170
147
16
204
31
205
21
13
194
7
7
5
4
5
126
14
32
26
36
28
204
82
8
166
20
T H E S TAT E O F T H E W O R L D ’ S C H I L D R E N 2 0 0 6
GNI
per capita
(US$)
2004
Life
expectancy
at birth
(years)
2004
lowest highest
40%
20%
…TABLE 1
Finland
France
Gabon
Gambia
Georgia
Germany
Ghana
Greece
Grenada
Guatemala
Guinea
Guinea-Bissau
Guyana
Haiti
Holy See
Honduras
Hungary
Iceland
India
Indonesia
Iran (Islamic Republic of)
Iraq
Ireland
Israel
Italy
Jamaica
Japan
Jordan
Kazakhstan
Kenya
Kiribati
Korea, Democratic
People’s Republic of
Korea, Republic of
Kuwait
Kyrgyzstan
Lao People’s
Democratic Republic
Latvia
Lebanon
Lesotho
Liberia
Libyan Arab Jamahiriya
Liechtenstein
Lithuania
Luxembourg
Madagascar
Malawi
Malaysia
Maldives
Mali
Malta
Marshall Islands
Mauritania
Mauritius
Mexico
Micronesia
(Federated States of)
Moldova, Republic of
Monaco
Net primary
school
Total
enrolment/
adult
attendance
literacy
(%)
rate
2000-2004* 1996-2004*
% share
of household
income
1993-2003*
2004
Total
population
(thousands)
2004
Annual
no. of
births
(thousands)
2004
Annual
no. of
under-5
deaths
(thousands)
2004
6
7
60
103
43
7
75
10
30
60
145
153
64
102
44
15
6
84
60
54
40
8
10
9
17
5
33
53
64
65
3
4
60
89
41
4
68
4
18
33
101
126
48
74
1
31
7
2
62
30
32
102
5
5
4
17
3
23
63
79
49
5235
60257
1362
1478
4518
82645
21664
11098
102
12295
9202
1540
750
8407
7048
10124
292
1087124
220077
68803
28057
4080
6601
58033
2639
127923
5561
14839
33467
97
55
744
42
52
50
687
679
102
2
433
383
77
16
253
206
95
4
26000
4513
1308
972
63
134
531
52
1169
150
237
1322
2
0
4
4
6
2
3
76
1
0
19
59
16
1
30
8
1
0
2210
171
50
122
0
1
3
1
5
4
17
159
0
32790
30090
3940
290
1040
30120
380
16610
3760
2130
460
160
990
390
1030
8270
38620
620
1140
2300
2170x
34280
17380
26120
2900
37180
2140
2260
460
970
79
80
54
56
71
79
57
78
68
54
45
64
52
68
73
81
64
67
71
59
78
80
80
71
82
72
63
48
-
54
91
69
52
80
99
61
88
77
97
88
90
100
74
-
100
99
94s
53s
89
83
61s
99
84
78s
57s
41s
97s
54s
87
91
100
77s
94s
86
78s
96
99
99
95
100
99s
91s
78s
-
24
20
14
18
22
16
19
9
17
14
9
23
21
20
15
19
18
19
17
25
19
20
16
-
37
40
53
44
37
47
44
64
47
53
59
37
43
43
50
43
44
42
46
36
44
40
49
-
55
6
12
68
42
8
14
68
42
5
10
58
22384
47645
2606
5204
349
467
50
116
19
3
1
8
a
13980
16340x
400
63
77
77
67
83
99
100
83
89s
22
20
38
43
163
18
37
120
235
41
10
13
10
168
241
22
111
250
11
92
133
23
46
83
12
31
82
235
20
5
8
6
123
175
12
46
219
6
59
125
15
28
120
14
32
84
157
35
9
10
7
103
146
16
79
140
9
63
85
21
37
65
10
27
61
157
18
4
8
5
76
110
10
35
121
5
52
78
14
23
5792
2318
3540
1798
3241
5740
34
3443
459
18113
12608
24894
321
13124
400
60
2980
1233
105699
204
21
66
50
164
133
0
31
6
704
550
549
10
647
4
0
123
20
2201
17
0
2
4
39
3
0
0
0
87
96
7
0
142
0
0
15
0
62
390
5460
4980
740
110
4450
d
5740
56230
300
170
4650
2510
360
12250
2370
420
4640
6770
55
72
72
35
42
74
73
79
56
40
73
67
48
79
53
72
75
69
100
81
56
82
100
71
64
89
96
19
88
51
84
90
62s
86
97s
65s
70
91
90
76s
76s
93
92
39s
96
84
44s
97
99
19
20
6
21
13
13
13
13
17
10
45
41
67
40
54
56
54
56
46
59
31
40
9
23
28
5
26
30
7
19
23
4
110
4218
35
3
43
0
0
1
0
1990
710
d
68
68
-
96
-
98s
-
18
-
44
-
Infant
mortality
rate
(under 1)
Under-5
mortality
rate
Under-5
mortality
rank
1990
2004
1990
185
172
49
36
75
172
42
172
113
75
22
10
67
40
78
152
192
52
83
83
33
162
162
172
120
185
101
60
37
66
7
9
92
154
47
9
122
11
37
82
240
253
88
150
59
17
7
123
91
72
50
10
12
9
20
6
40
63
97
88
4
5
91
122
45
5
112
5
21
45
155
203
64
117
41
8
3
85
38
38
125
6
6
5
20
4
27
73
120
65
71
162
143
64
55
9
16
80
53
143
93
54
5
120
172
152
162
35
19
143
74
7
162
69
33
131
98
110
98
172
GNI
per capita
(US$)
2004
Life
expectancy
at birth
(years)
2004
lowest highest
40%
20%
S TAT I S T I C A L TA B L E S
99
TABLE 1. BASIC INDICATORS
Mongolia
Morocco
Mozambique
Myanmar
Namibia
Nauru
Nepal
Netherlands
New Zealand
Nicaragua
Niger
Nigeria
Niue
Norway
Occupied
Palestinian Territory
Oman
Pakistan
Palau
Panama
Papua New Guinea
Paraguay
Peru
Philippines
Poland
Portugal
Qatar
Romania
Russian Federation
Rwanda
Saint Kitts and Nevis
Saint Lucia
Saint Vincent and
the Grenadines
Samoa
San Marino
Sao Tome and Principe
Saudi Arabia
Senegal
Serbia and Montenegro
Seychelles
Sierra Leone
Singapore
Slovakia
Slovenia
Solomon Islands
Somalia
South Africa
Spain
Sri Lanka
Sudan
Suriname
Swaziland
Sweden
Switzerland
Syrian Arab Republic
Tajikistan
Tanzania, United Republic of
Thailand
100
Net primary
school
Total
enrolment/
adult
attendance
literacy
(%)
rate
2000-2004* 1996-2004*
% share
of household
income
1993-2003*
2004
Total
population
(thousands)
2004
Annual
no. of
births
(thousands)
2004
Annual
no. of
under-5
deaths
(thousands)
2004
78
69
158
91
60
100
7
8
52
191
120
7
41
38
104
76
47
25
59
5
5
31
152
101
4
2614
31020
19424
50004
2009
13
26591
16226
3989
5376
13499
128709
1
4598
58
713
769
992
56
0
786
190
55
153
734
5323
0
55
3
31
117
105
4
0
60
1
0
6
190
1049
0
590
1520
250
220x
2370
260
31700
20310
790
230
390
52030
65
70
42
61
47
62
79
79
70
45
43
80
98
51
46
90
85
49
77
14
67
-
79s
89s
60s
80s
78s
81
74s
99
100
80s
30s
62s
99
100
16
17
17
4
19
21
18
15
10
13
24
51
47
47
79
45
39
44
49
53
56
37
24
13
101
27
24
93
24
29
34
8
5
21
20
21
203
21
14
34
25
100
28
27
74
33
60
41
19
11
21
27
23
103
30
20
22
10
80
22
19
68
21
24
26
7
4
18
17
17
118
18
13
3587
2534
154794
20
3175
5772
6017
27562
81617
38559
10441
777
21790
143899
8882
42
159
136
64
4729
0
70
176
175
627
2026
365
112
14
213
1511
365
1
3
3
1
478
0
2
16
4
18
69
3
1
0
4
32
74
0
0
1110x
7830x
600
6870
4450
580
1170
2360
1170
6090
14350
12000x
2920
3410
220
7600
4310
73
74
63
75
56
71
70
71
75
78
73
72
65
44
73
92
74
49
92
57
92
88
93
89
97
99
64
90
91
72
56s
96
100
74
89
96s
88s
98
100
94
89
90
75s
95
99
21
9
12
9
11
14
20
17
20
21
23x
-
42
60
57
61
53
52
42
46
41
39
39x
-
22
30
4
118
27
137
15
14
283
3
9
4
56
225
67
5
14
91
39
156
4
5
16
118
126
21
22
40
13
75
35
90
24
17
175
7
12
8
38
133
45
8
26
74
35
78
6
7
35
99
102
31
18
25
3
75
21
78
13
12
165
3
6
4
34
133
54
3
12
63
30
108
3
5
15
91
78
18
118
184
28
153
23950
11386
10510
80
5336
4273
5401
1967
466
7964
47208
42646
20570
35523
446
1034
9008
7240
18582
6430
37627
63694
2
5
0
5
665
419
122
3
245
40
51
17
15
359
1093
447
330
1163
9
30
95
68
526
186
1403
1015
0
0
0
1
18
57
2
0
69
0
0
0
1
81
73
2
5
106
0
5
0
0
8
22
177
21
3650
1860
d
370
10430
670
2620
8090
200
24220
6480
14810
550
130x
3630
21210
1010
530
2250
1660
35770
48230
1190
280
330
2540
71
71
63
72
56
74
41
79
74
77
63
47
47
80
74
57
69
31
80
81
74
64
46
70
99
79
39
96
92
30
93
100
100
82
90
59
88
79
83
99
69
93
90
98
78s
54
48s
96
100
41s
86
93
11s
89s
100
53s
90s
72s
100
99
98
81s
82s
85
17
3x
14
24
23
10
20x
21
9
23
20x
20
18
16
48
63x
49
35
36
62
40x
42
64
37
40x
41
46
50
Under-5
mortality
rate
Infant
mortality
rate
(under 1)
Under-5
mortality
rank
1990
2004
1990
72
77
23
45
68
95
59
162
162
83
3
13
185
108
89
235
130
86
145
9
11
68
320
230
9
52
43
152
106
63
30
76
6
6
38
259
197
4
107
140
47
101
107
48
107
97
88
152
172
113
120
113
10
113
135
40
32
130
34
34
101
41
80
62
18
14
26
31
29
173
36
21
112
95
185
38
101
29
131
135
1
192
150
185
70
6
65
172
135
49
81
21
185
172
130
38
31
113
25
50
14
118
44
148
28
19
302
9
14
10
63
225
60
9
32
120
48
110
7
9
44
128
161
37
T H E S TAT E O F T H E W O R L D ’ S C H I L D R E N 2 0 0 6
GNI
per capita
(US$)
2004
Life
expectancy
at birth
(years)
2004
lowest highest
40%
20%
…TABLE 1
Under-5
mortality
rate
2004
Total
population
(thousands)
2004
Annual
no. of
births
(thousands)
2004
Annual
no. of
under-5
deaths
(thousands)
2004
33
130
88
26
28
41
67
80
40
93
19
12
8
9
20
65
48
24
38
98
101
53
13
64
78
20
18
21
28
80
36
80
14
7
5
7
15
57
32
16
17
82
102
79
2030
887
5988
102
1301
9995
72220
4766
10
27821
46989
4284
59479
295410
3439
26209
207
26282
83123
20329
11479
12936
23
45
233
2
19
166
1505
107
0
1412
391
67
663
4134
57
611
6
590
1644
826
468
384
0
4
33
0
0
4
48
11
0
195
7
1
4
33
1
42
0
11
38
92
85
50
112
105
119
59
89
43
43
44
9
72
115
65
102
95
109
44
67
29
26
32
5
59
98
54
697561
348833
348728
371384
1459305
1937058
548273
404154
956315
5166574
741597
6374050
28263
13371
14892
9620
37052
29932
11674
5570
10839
119663
27823
132950
4833
1992
2844
539
3409
1078
362
212
65
10411
4313
10503
Infant
mortality
rate
(under 1)
Under-5
mortality
rank
1990
2004
1990
135
56
27
105
120
105
90
46
73
28
127
152
162
152
129
62
79
125
110
43
18
30
38
172
152
32
33
52
82
97
56
160
26
14
10
12
25
79
62
27
53
142
180
80
14
80
140
25
20
25
32
103
51
138
18
8
6
8
17
69
40
19
23
111
182
129
Sub-Saharan Africa
188
171
Eastern and Southern Africa
167
149
Western and Central Africa
209
191
Middle East and North Africa
81
56
South Asia
129
92
East Asia and Pacific
58
36
Latin America and Caribbean
54
31
CEE/CIS
54
38
Industrialized countries
10
6
Developing countries
105
87
Least developed countries
182
155
World
95
79
Countries in each category are listed on page 132.
The former Yugoslav
Republic of Macedonia
Timor-Leste
Togo
Tonga
Trinidad and Tobago
Tunisia
Turkey
Turkmenistan
Tuvalu
Uganda
Ukraine
United Arab Emirates
United Kingdom
United States
Uruguay
Uzbekistan
Vanuatu
Venezuela
Viet Nam
Yemen
Zambia
Zimbabwe
Net primary
school
Total
enrolment/
adult
attendance
literacy
(%)
rate
2000-2004* 1996-2004*
% share
of household
income
1993-2003*
GNI
per capita
(US$)
2004
Life
expectancy
at birth
(years)
2004
2350
550
380
1830
8580
2630
3750
1340
270
1260
18060x
33940
41400
3950
460
1340
4020
550
570
450
480x
74
56
55
72
70
74
69
63
48
66
78
79
78
76
67
69
73
71
61
38
37
96
53
99
98
74
88
99
69
99
77
98
99
74
93
90
49
68
90
91
64s
100
96s
97
88s
85s
79s
84
83
100
92
90
80s
94
94s
96s
72s
68s
79s
22
16x
16
17
16
16
22
18
16
14
23
11
19
20
11
13
37
46x
47
47
48
50
38
44
46
50
36
53
45
41
57
56
611
836
399
2308
600
1686
3649
2667
32232
1524
345
6298
46
46
46
68
63
71
72
67
79
65
52
67
60
63
58
67
58
90
90
97
77
54
78
60
65
55
79
74
96
93
88
95
80
60
82
12
11
13
17
21
16
10
20
19
15
18
18
57
59
53
46
43
47
59
41
42
50
46
43
lowest highest
40%
20%
SUMMARY INDICATORS
DEFINITIONS OF THE INDICATORS
MAIN DATA SOURCES
Under-five mortality rate – Probability of dying between birth and exactly five years of age
expressed per 1,000 live births.
Infant mortality rate – Probability of dying between birth and exactly one year of age expressed
per 1,000 live births.
GNI per capita – Gross national income (GNI) is the sum of value added by all resident producers
plus any product taxes (less subsidies) not included in the valuation of output plus net receipts of
primary income (compensation of employees and property income) from abroad. GNI per capita is
gross national income divided by mid-year population. GNI per capita in US dollars is converted
using the World Bank Atlas method.
Life expectancy at birth – The number of years newborn children would live if subject to the
mortality risks prevailing for the cross-section of population at the time of their birth.
Adult literacy rate – Percentage of persons aged 15 and over who can read and write.
Net primary school enrolment/attendance – Derived from net primary school enrolment rates
as reported by UNESCO/UIS (UNESCO Institute of Statistics) and from national household survey
reports of attendance at primary school or higher. The net primary school attendance ratio is
defined as the percentage of children in the age group that officially corresponds to primary
schooling who attend primary school or higher.
Income share – Percentage of income received by the 20 per cent of households with the highest
income and by the 40 per cent of households with the lowest income.
NOTES
a: Range $825 or less.
b: Range $826 to $3255.
c: Range $3256 to $10065.
d: Range $10066 or more.
Under-five and infant mortality rates – UNICEF, World Health Organization, United Nations
Population Division and United Nations Statistics Division.
Total population – United Nations Population Division.
Births – United Nations Population Division.
Under-five deaths – UNICEF.
GNI per capita – World Bank.
Life expectancy – United Nations Population Division.
Adult literacy – United Nations Educational, Scientific and Cultural Organization (UNESCO) and
UNESCO Institute of Statistics (UIS).
School enrolment/attendance – UIS, Multiple Indicator Cluster Surveys (MICS) and Demographic
and Health Surveys (DHS).
Household income – World Bank.
- Data not available.
s National household survey.
x Indicates data that refer to years or periods other than those specified in the column heading, differ from the
standard definition, or refer to only part of a country.
* Data refer to the most recent year available during the period specified in the column heading.
S TAT I S T I C A L TA B L E S
101
TABLE 2. NUTRITION
% of children (1996-2004*) who are:
Countries and territories
Afghanistan
Albania
Algeria
Andorra
Angola
Antigua and Barbuda
Argentina
Armenia
Australia
Austria
Azerbaijan
Bahamas
Bahrain
Bangladesh
Barbados
Belarus
Belgium
Belize
Benin
Bhutan
Bolivia
Bosnia and Herzegovina
Botswana
Brazil
Brunei Darussalam
Bulgaria
Burkina Faso
Burundi
Cambodia
Cameroon
Canada
Cape Verde
Central African Republic
Chad
Chile
China
Colombia
Comoros
Congo
Congo, Democratic Republic of the
Cook Islands
Costa Rica
Côte d’Ivoire
Croatia
Cuba
Cyprus
Czech Republic
Denmark
Djibouti
Dominica
Dominican Republic
Ecuador
Egypt
El Salvador
Equatorial Guinea
Eritrea
Estonia
Ethiopia
Fiji
102
% of infants
with low
birthweight
1998-2004*
3
7
12
8
8
7
7
7
11
7
8
36
10x
5
8x
6
16
15
7
4
10
10x
10
10
19
16
11
11
6
13
14
10
5
4
9
25
12
3
7
17
6
6
7
5
10
11
16
12
7
13
21x
4
15
10
exclusively
breastfed
(< 6 months)
6
13
11
30
7
34x,k
36
24k
38
54
6
34
19
62
12
21
57k
17
2
63
51
26
21
4k
24
19k
35x,k
5
23
41
10
35
30
24
24
52
55
47x,k
% of under-fives (1996-2004*) suffering from:
breastfed with
complementary
food
(6-9 months)
still
breastfeeding
(20-23 months)
moderate
& severe
severe
29
24
38
77
51
39
65x
69
54
66
74
57
30
38
46
72
80
64
77
77
47
32
58
34
94
79
47x
73
42
41
70
72
76
43
43
-
54
6
22
37
13
16
41x
94
23
62
46
11
17
81
85
59
29
13
53
66
15
25
45
13
52
12x
38
9
16
25
31
43
62
77
-
39
14
10
31
10x
5
3
7
9x
48
6x
6x
23
19
8
4
13
6
38
45
45
18
14x
24
28
1
8
7
25
14
31
5
17
1
4
1x
18
5x
5
12
9
10
19
40
47
8x
12
1
3
8
4x
1
0
1
2x
13
1x
1x
5
3
1
1
2
1
14
13
13
4
2x
6
9
1
9
3
9
0
5
0
0x
6
0x
1
1
1
4
12
16
1x
underweight
T H E S TAT E O F T H E W O R L D ’ S C H I L D R E N 2 0 0 6
wasting
stunting
moderate
& severe
moderate
& severe
7
11
8
6
10x
3
2
2
5x
13
5x
8
3
1
6
5
2
19
8
15
5
6x
9
11
0
1
12
4
13
2
7
1
2
2x
13
2x
2
4
1
7
13
11
8x
54
34
19
45
7x
12
13
13
10x
43
7x
31
40
27
10
23
11
39
57
45
32
16x
39
29
2
14
14
42
19
38
6
21
1
5
2x
26
6x
9
26
16
19
39
38
52
3x
Vitamin A
supplementation
coverage rate
(6-59 months)
2003
86t
68
87t
98t
38
95t
95
47
86
84
89
80t
75
40
52
65
-
% of
households
consuming
iodized salt
1998-2004*
28
62
69
35
90x
84
26
70
55
90x
72
95
90
77
66
88
98
45
96
14
61
0x
86
58
100
93
92x
82
72
97x
31
90
88
18
99
56
91x
20x
68
28
31x
…TABLE 2
% of children (1996-2004*) who are:
% of infants
with low
birthweight
1998-2004*
Finland
France
Gabon
Gambia
Georgia
Germany
Ghana
Greece
Grenada
Guatemala
Guinea
Guinea-Bissau
Guyana
Haiti
Holy See
Honduras
Hungary
Iceland
India
Indonesia
Iran (Islamic Republic of)
Iraq
Ireland
Israel
Italy
Jamaica
Japan
Jordan
Kazakhstan
Kenya
Kiribati
Korea, Democratic People’s Republic of
Korea, Republic of
Kuwait
Kyrgyzstan
Lao People’s Democratic Republic
Latvia
Lebanon
Lesotho
Liberia
Libyan Arab Jamahiriya
Liechtenstein
Lithuania
Luxembourg
Madagascar
Malawi
Malaysia
Maldives
Mali
Malta
Marshall Islands
Mauritania
Mauritius
Mexico
Micronesia (Federated States of)
Moldova, Republic of
Monaco
Mongolia
Morocco
4
7
14
17
7
7
16
8
9
12
16
22
12
21
14
9
4
30
9
7x
15
6
8
6
10
8
10x
8
10
5
7
4
7
7x
14
5
6
14
7x
4
8
17
16
9
22
23
6
12
14
8
18
5
7
11x
exclusively
breastfed
(< 6 months)
6
26
18k
53
39k
51
23
37
11
24
35
37k
40
44
12
27
36
13
80x,k
65
12k
24
23
27k
15
35
67
44
29k
10
25
63x,k
20
21k
38x,k
60k
51
31
% of under-fives (1996-2004*) suffering from:
breastfed with
complementary
food
(6-9 months)
still
breastfeeding
(20-23 months)
moderate
& severe
severe
62
37
12
62
67
43
36
42
73
61
44
75
51
70
73
84
31
26
77
10
35
51
70
78
93
85
32
78
36x
55
66
9
54
12
67
47
73
67
31
30
34
66
59
0
27
12
17
57
37
9
21
47
11
58
45
23x
64
77
12
69
57
21x
57
15
12
17
3
22
23
21
25
14
17
17
2x
47
28
11
16
4
4
4
20
13x
23
10
11
40
3
18
26
5x
42
22
11
30
33
32
15x
8
3
13
9
2
4
0
5
4
7
3
4
0x
18
9
2
2
1
0
4
8
3
2
13
0
4
8
1x
11
1
7
11
10
2x
1
3
2
underweight
wasting
stunting
moderate
& severe
moderate
& severe
3
9
2
7
2
11
10
11
5
1
2x
16
5
6
2
2
2
6
11x
7
11
3
15
3
5
6
3x
13
5
13
11
13
14x
2
3
6
4
21
19
12
30
49
33
30
11
23
29
3x
46
15
22
5
9
10
30
28x
37
24
25
42
12
46
39
15x
48
45
25
38
35
10x
18
10
25
24
Vitamin A
supplementation
coverage rate
(6-59 months)
2003
30
91
78t
98t
25
35
45w
62
33
45
95t
64
75t
91t
92
61
23
95t
87t
-
S TAT I S T I C A L TA B L E S
% of
households
consuming
iodized salt
1998-2004*
36
8
68
28
67
68
2
11
80
50
73
94
40
100
88
83
91
40
42
75
87
69
90x
75
49
44
74
2
0x
91
33
75
41
103
TABLE 2. NUTRITION
% of children (1996-2004*) who are:
% of infants
with low
birthweight
1998-2004*
Mozambique
Myanmar
Namibia
Nauru
Nepal
Netherlands
New Zealand
Nicaragua
Niger
Nigeria
Niue
Norway
Occupied Palestinian Territory
Oman
Pakistan
Palau
Panama
Papua New Guinea
Paraguay
Peru
Philippines
Poland
Portugal
Qatar
Romania
Russian Federation
Rwanda
Saint Kitts and Nevis
Saint Lucia
Saint Vincent and the Grenadines
Samoa
San Marino
Sao Tome and Principe
Saudi Arabia
Senegal
Serbia and Montenegro
Seychelles
Sierra Leone
Singapore
Slovakia
Slovenia
Solomon Islands
Somalia
South Africa
Spain
Sri Lanka
Sudan
Suriname
Swaziland
Sweden
Switzerland
Syrian Arab Republic
Tajikistan
Tanzania, United Republic of
Thailand
The former Yugoslav Republic of Macedonia
Timor-Leste
Togo
Tonga
104
15
15
14
21
6
12
13
14
0
5
9
8
19x
9
10
11x
9x
11x
20
6
8
10
9
6
9
9
8
10
4x
20
11x
18
4
23
8
7
6
13x
15
6x
22
31
13
9
4
6
6
15
13
9
6
12
18
0
exclusively
breastfed
(< 6 months)
30
15k
19
68
31
1
17
29k
16x,k
59x,k
25x
59
22
67
34
12k
84
56k
56
31k
24k
11k
4
65k
9
7
84
16
9
24
81k
50
41
4x,k
37
31
18
62k
% of under-fives (1996-2004*) suffering from:
breastfed with
complementary
food
(6-9 months)
still
breastfeeding
(20-23 months)
moderate
& severe
severe
80
66
57
66
68
56
64
78
92
31x
38x
74
60
76
58
48
79
53
60
64
33
51
13
67
47
25
60
50
91
71x
8
82
65
-
65
67
37
92
39
61
34
11
73
56x
21x
66
49
32
21
71
42
30
49
11
53
8
30
73
40
11
25
6
55
27x
10
35
65
-
24
32
24
48
10
40
29
4
24x
38
7
35x
5
7
28
6x
6x
3x
27
14x
13
14
23
2
6x
27
14x
21x
26
12
29
17x
13
10
7
22
19x
6
46
25
-
6
7
5
13
2
14
9
1
4x
12
1
1x
1x
7
2
3
6
0
0x
9
4x
7
2
7x
2
2
1
4
1
15
7
-
underweight
T H E S TAT E O F T H E W O R L D ’ S C H I L D R E N 2 0 0 6
wasting
stunting
moderate
& severe
moderate
& severe
4
9
9
10
2
14
9
3
13x
13
1
1
1
6
2x
3x
4x
6
6x
4
11
8
4
2x
10
4x
7x
17
3
14
7
1
4
5
3
6x
4
12
12
-
41
32
24
51
20
40
38
9
23x
37
14
14
25
30
8x
8x
13x
41
11x
29
20
25
5
5x
34
11x
27x
23
25
14
10
30
18
36
38
16x
7
49
22
-
Vitamin A
supplementation
coverage rate
(6-59 months)
2003
50
87t
93
96t
91
95
27
95t
1
76t
86
84t
34
80
91t
95
84t
-
% of
households
consuming
iodized salt
1998-2004*
54
60
63
63
83
97
15
97
65
61
17
95
88
93x
56
53
35
90
100
74
16
73
23
62
88
1
59
79
28
43
63
80
72
67
-
…TABLE 2
% of children (1996-2004*) who are:
% of infants
with low
birthweight
1998-2004*
Trinidad and Tobago
Tunisia
Turkey
Turkmenistan
Tuvalu
Uganda
Ukraine
United Arab Emirates
United Kingdom
United States
Uruguay
Uzbekistan
Vanuatu
Venezuela
Viet Nam
Yemen
Zambia
Zimbabwe
exclusively
breastfed
(< 6 months)
% of under-fives (1996-2004*) suffering from:
breastfed with
complementary
food
(6-9 months)
still
breastfeeding
(20-23 months)
moderate
& severe
severe
underweight
wasting
stunting
moderate
& severe
moderate
& severe
Vitamin A
supplementation
coverage rate
(6-59 months)
2003
23
7
16
6
5
12
5
15x
8
8
8
7
6
9
9
32x
12
11
2
47
21
13
63
22
34x,k
19
50k
7k
15
12
40
33
19
38
71
75
52x
49
50
76
87
90
10
22
24
27
50
29x
45
31
26
58
35
7x
4
4
12
23
1
14x
1x
5x
8
20x
4
28
46
23
13
0x
1
1
2
5
0
3x
0x
1x
2
1
4
15
2
4x
2
1
6
4
0
15x
1x
1x
7
3
7
12
5
6
5x
12
12
22
39
3
17x
2x
8x
21
19x
13
32
53
49
27
93t
99t, w
36
73t
46
14
14
15
15
31
7
9
9
7
17
19
16
30
41
20
29
38
43
22
36
34
36
67
69
65
60
45
44
45
45
51
63
51
53
58
48
23
69
27
26
26
46
65
46
28
29
28
14
46
15
7
5
27
36
26
8
8
9
3
16
1
1
10
11
10
9
7
10
6
14
2
3
10
10
10
38
41
35
21
44
19
16
14
31
42
31
64
68
60
58
73e
61e
76
61e
% of
households
consuming
iodized salt
1998-2004*
1
97
64
100
95
32
19
90
83
30
77
93
SUMMARY INDICATORS
Sub-Saharan Africa
Eastern and Southern Africa
Western and Central Africa
Middle East and North Africa
South Asia
East Asia and Pacific
Latin America and Caribbean
CEE/CIS
Industrialized countries
Developing countries
Least developed countries
World
64
60
68
58
49
85
86
47
69
53
68
Countries in each category are listed on page 132.
DEFINITIONS OF THE INDICATORS
Low birthweight – Infants who weigh less than 2,500 grams.
Underweight – Moderate and severe – below minus two standard deviations from median weight
for age of reference population; severe – below minus three standard deviations from median
weight for age of reference population.
Wasting – Moderate and severe – below minus two standard deviations from median weight for
height of reference population.
Stunting – Moderate and severe – below minus two standard deviations from median height for
age of reference population.
MAIN DATA SOURCES
Low birthweight – Demographic and Health Surveys (DHS), Multiple Indicator Cluster Surveys
(MICS), other national household surveys and data from routine reporting systems.
Breastfeeding – DHS, MICS and UNICEF.
Underweight, wasting and stunting – DHS, MICS, UNICEF and World Health Organization (WHO).
Vitamin A – UNICEF and WHO.
Salt iodization – MICS, DHS and UNICEF.
Vitamin A – Percentage of children aged 6-59 months who have received at least one high dose
of vitamin A capsules in 2003.
NOTES
x
k
*
t
e
w
Data not available.
Indicates data that refer to years or periods other than those specified in the column heading, differ from the standard definition, or refer to only part of a country.
Refers to exclusive breastfeeding for less than four months.
Data refer to the most recent year available during the period specified in the column heading.
Identifies countries that have achieved a second round of vitamin A coverage greater than or equal to 70 per cent.
This regional figure for East Asia and Pacific does not include China.
Identifies countries with vitamin A supplementation programmes that do not target children all the way up to 59 months of age.
S TAT I S T I C A L TA B L E S
105
TABLE 3. HEALTH
Immunization 2004
% of population
using adequate
sanitation facilities
2002
% of routine
EPI
vaccines
financed by
government
2004
Countries and territories
total urban rural
total urban rural
total
%
newTB
DPT
Polio Measles HepB Hib
borns
protected
corresponding vaccines:
against
BCG DPT1† DPT3† polio3 measles hepB3 Hib3 tetanus
Afghanistan
Albania
Algeria
Andorra
Angola
Antigua and Barbuda
Argentina
Armenia
Australia
Austria
Azerbaijan
Bahamas
Bahrain
Bangladesh
Barbados
Belarus
Belgium
Belize
Benin
Bhutan
Bolivia
Bosnia and Herzegovina
Botswana
Brazil
Brunei Darussalam
Bulgaria
Burkina Faso
Burundi
Cambodia
Cameroon
Canada
Cape Verde
Central African Republic
Chad
Chile
China
Colombia
Comoros
Congo
Congo, Democratic
Republic of the
Cook Islands
Costa Rica
Côte d’Ivoire
Croatia
Cuba
Cyprus
Czech Republic
Denmark
Djibouti
Dominica
Dominican Republic
Ecuador
Egypt
El Salvador
Equatorial Guinea
Eritrea
Estonia
Ethiopia
Fiji
13
97
87
100
50
91
92
100
100
77
97
75
100
100
91
68
62
85
98
95
89
100
51
79
34
63
100
80
75
34
95
77
92
94
46
19
99
92
100
70
95
97
99
100
100
95
98
100
82
100
100
100
100
79
86
95
100
100
96
100
82
90
58
84
100
86
93
40
100
92
99
90
72
8
89
92
100
30
95
84
100
100
55
100
48
99
47
32
70
45
93
41
75
100
12
36
16
48
100
42
27
8
92
44
86
23
9
5
81
82
100
16
94
61
100
100
36
100
39
100
25
12
70
23
88
25
35
100
5
35
8
33
99
19
12
0
64
29
54
15
2
0
60
100
43
100
100
6
100
100
100
100
100
94
100
100
73
0
34
70
100
100
100
100
100
6
12
65
80
0
42
100
100
100
0
73
78
97
98
72
99
96
99
70
95
99
99
99
92
93
95
99
99
99
98
99
84
95
83
79
70
38
96
94
92
79
85
80
98
93
99
75
91
95
97
97
97
98
99
97
95
97
99
97
99
99
93
94
93
98
96
99
95
99
86
92
80
97
78
65
68
94
97
95
85
67
66
97
86
99
59
97
90
91
92
83
96
93
98
85
93
99
95
95
83
89
81
84
97
96
92
95
88
74
85
73
91
75
40
50
94
91
89
76
67
66
98
86
99
57
97
95
93
92
83
97
92
98
85
93
99
96
95
89
90
79
87
97
98
92
94
83
69
86
72
88
76
40
47
94
92
89
73
67
61
96
81
98
64
97
95
92
93
74
98
89
99
77
98
99
82
95
85
87
64
88
90
99
99
95
78
75
80
64
95
69
35
56
95
84
92
73
65
99
81
54
97
88
91
95
83
97
93
98
93
99
65
96
89
89
84
81
79
90
99
94
83
68
72
89
77
-
95
97
90
95
83
93
98
93
95
96
81
79
96
92
83
83
94
89
-
35
75
45
69
65
45
51
60
42
40
46
65
19
1
9
8
11
3
21
12
22
2
40
24x
9
13
20
11
10
12
13
10
-
46
95
97
84
91
100
100
80
97
93
86
98
82
44
57
22
-
83 29
98 88
100 92
98 74
95 78
100 100
100 100
82 67
100 90
98 85
92 77
100 97
91 68
45 42
72 54
81 11
-
29 43 23
100 100 100
92 89 97
40 61 23
98 99 95
100 100 100
50 55 27
83 86 75
57 67 43
72 80 59
68 84 56
63 78 40
53 60 46
9 34
3
- 93
6 19
4
98 99 98
17
11
100
58
100
99
25
85
70
60
100
100
100
100
0
18
100
78
99
90
51
98
99
99
78
99
97
99
98
94
73
91
99
82
93
76
99
89
63
96
89
99
98
95
81
99
88
99
98
90
65
91
98
93
75
64
99
90
50
96
88
98
98
95
64
99
71
90
97
90
33
83
94
80
71
63
99
90
50
98
98
98
96
95
64
99
57
93
97
90
39
83
95
80
76
64
99
88
49
96
99
86
97
96
60
99
79
99
97
93
51
84
96
71
62
99
89
50
99
88
98
71
90
97
83
83
90
73
90
93
99
58
98
95
71
90
83
27
71
58
75
71
40
62
45
-
11
4
20
10
42
19
24
-
106
11
95
80
100
40
89
80
100
100
59
86
72
100
100
82
60
60
68
96
90
58
100
44
78
29
41
99
73
61
32
59
68
71
96
17
16
99
99
100
56
98
96
100
100
73
100
100
75
99
71
58
65
58
99
57
83
100
45
47
53
63
100
61
47
30
96
69
96
38
14
1-year-old children immunized against:
T H E S TAT E O F T H E W O R L D ’ S C H I L D R E N 2 0 0 6
% underfives with
diarrhoea
receiving
oral rehydration and
continued
feeding
1996-2004*
%
underfives
sleeping
under a
mosquito net
28
83
52
58
26
36
20
66
35
52
80
14
46x
36
40
37
40
32
22
51
49
-
48
51
32
48
40
35
42
54
23
7
28
16
59
33
47
50
44
31
-
10
12
32
20
3
31
27
24
36
-
2
1
7
2
1
2
1
1
9
-
63
1
60
50
31
69
32
63
-
36
38
63
70
62
44
16
-
17
34
53
29
36
54
38
-
12
14
15
12
-
1
4
1
4
-
45
49
4
3
-
%
underfives
%
with ARI
under- taken to
fives
health
with ARI provider
% of population
using improved
drinking water
sources
2002
1998-2004*
Malaria: 1999-2004
% under- % underfives fives with
sleeping
fever
under a receiving
treated
antimosmalarial
quito net
drugs
…TABLE 3
% of population
using improved
drinking water
sources
2002
Finland
France
Gabon
Gambia
Georgia
Germany
Ghana
Greece
Grenada
Guatemala
Guinea
Guinea-Bissau
Guyana
Haiti
Holy See
Honduras
Hungary
Iceland
India
Indonesia
Iran (Islamic Republic of)
Iraq
Ireland
Israel
Italy
Jamaica
Japan
Jordan
Kazakhstan
Kenya
Kiribati
Korea, Democratic
People’s Republic of
Korea, Republic of
Kuwait
Kyrgyzstan
Lao People’s Democratic Republic
Latvia
Lebanon
Lesotho
Liberia
Libyan Arab Jamahiriya
Liechtenstein
Lithuania
Luxembourg
Madagascar
Malawi
Malaysia
Maldives
Mali
Malta
Marshall Islands
Mauritania
Mauritius
Mexico
Micronesia (Federated States of)
Moldova, Republic of
Monaco
Mongolia
Morocco
% of population
using adequate
sanitation facilities
2002
% of routine
EPI
vaccines
financed by
government
2004
Immunization 2004
1-year-old children immunized against:
%
underfives
%
with ARI
under- taken to
fives
health
with ARI provider
% underfives with
diarrhoea
receiving
oral rehydration and
continued
feeding
1996-2004*
%
underfives
sleeping
under a
mosquito net
Malaria: 1999-2004
% under- % underfives fives with
sleeping
fever
under a receiving
treated
antimosmalarial
quito net
drugs
total urban rural
total urban rural
total
%
newTB
DPT
Polio Measles HepB Hib
borns
protected
corresponding vaccines:
against
BCG DPT1† DPT3† polio3 measles hepB3 Hib3 tetanus
100
87
82
76
100
79
95
95
51
59
83
71
90
99
100
86
78
93
81
100
93
100
91
86
62
64
100
100
95
95
90
100
93
97
99
78
79
83
91
99
100
100
96
89
98
97
100
100
100
98
100
91
96
89
77
100
47
77
61
100
68
93
92
38
49
83
59
82
98
100
82
69
83
50
100
87
100
91
72
46
53
100
36
53
83
58
97
61
13
34
70
34
68
95
30
52
84
80
80
100
93
72
48
39
100 100
37 30
72 46
96 69
74 46
96 97
72 52
25
6
57 23
86 60
52 23
89 52
100 85
58 18
71 38
86 78
95 48
100
90 68
100 100
94 85
87 52
56 43
59 22
100
45
20
62
100
100
8
0
60
30
100
100
80
100
100
100
100
100
100
100
5
100
98
85
89
95
91
92
88
98
71
80
94
71
93
99
73
82
99
93
90
85
58
65
87
94
98
98
69
95
88
98
88
96
87
94
75
86
90
76
96
99
99
71
88
99
93
96
98
98
86
99
96
85
72
75
98
97
38
92
78
97
80
88
83
84
69
80
91
43
89
99
99
64
70
99
81
89
96
96
77
99
95
82
73
62
96
97
31
90
66
94
81
87
84
84
68
80
91
43
90
99
99
70
70
98
87
89
92
97
71
97
95
99
73
61
97
86
55
90
86
92
83
88
74
75
73
80
88
54
92
99
93
56
72
96
90
81
96
84
80
99
99
99
73
56
28
90
64
81
80
88
83
91
89
75
95
70
98
95
77
95
99
73
67
96
86
90
90
80
88
83
91
89
99
99
89
96
90
77
95
73
-
45
70
77
56
52
80
54
70
70
-
13
8
4
10
18
15
10
5
39
19
8
24
7
3
6
3
18
-
48
75
99
44
64
33
64
78
26
67
61
93
76
39
78
48
49
-
44
38
40
22
44
23
40
41
22
61
21
44
22
33
-
42
15
6
25
67
67
15
-
15
4
1
4
7
6
5
-
55
63
56
58
3
12
1
27
-
100
92
76
43
100
76
62
72
100
45
67
95
84
48
100
85
56
100
91
94
92
62
80
100
97
98
66
100
88
72
72
100
75
96
96
99
76
100
80
63
100
97
95
97
100
87
99
100
71
66
38
100
74
52
68
100
34
62
94
78
35
100
95
45
100
72
94
88
30
56
59
60
24
98
37
26
97
33
46
58
45
82
42
99
77
28
68
59
61
58
75
61
100
61
49
97
49
66
100
59
100
93
64
100
90
61
86
100
75
83
80
100
100
22
0
100
100
10
0
100
100
0
0
100
100
100
100
100
95
0
86
33
100
95
93
98
60
99
83
60
99
99
72
97
99
98
75
91
86
99
99
62
96
90
95
95
75
95
99
99
66
99
98
83
48
99
94
98
71
99
99
98
99
76
71
83
98
99
83
99
99
99
99
72
88
98
99
45
98
92
78
31
97
94
98
61
89
99
96
76
55
64
70
98
98
78
98
99
99
97
99
90
98
98
46
97
92
78
33
97
90
98
63
94
95
96
72
55
68
68
98
98
82
98
99
95
97
95
99
97
99
36
99
96
70
42
99
98
91
59
80
95
97
75
87
70
64
98
96
85
96
99
96
95
98
92
94
99
45
99
88
67
99
94
49
61
89
95
97
73
8
72
98
98
80
99
99
95
95
98
95
92
35
86
89
99
55
46
98
65
99
10
30
35
55
70
50
33
-
12
4x
1
4
7
39
9
27
22
10
10
1
2
12
93
48x
36
74
49
70
48
27
22
36
41
78
78
38
16
37
29
47
51
45
28
52
66
50
82
8
72
-
18
3
8
-
9
34
27
38
-
60
51
14
87
32
7
96
27
42
98
42
38
59
9
99
39
14
52
37
31
1998-2004*
S TAT I S T I C A L TA B L E S
107
TABLE 3. HEALTH
Mozambique
Myanmar
Namibia
Nauru
Nepal
Netherlands
New Zealand
Nicaragua
Niger
Nigeria
Niue
Norway
Occupied Palestinian Territory
Oman
Pakistan
Palau
Panama
Papua New Guinea
Paraguay
Peru
Philippines
Poland
Portugal
Qatar
Romania
Russian Federation
Rwanda
Saint Kitts and Nevis
Saint Lucia
Saint Vincent and the Grenadines
Samoa
San Marino
Sao Tome and Principe
Saudi Arabia
Senegal
Serbia and Montenegro
Seychelles
Sierra Leone
Singapore
Slovakia
Slovenia
Solomon Islands
Somalia
South Africa
Spain
Sri Lanka
Sudan
Suriname
Swaziland
Sweden
Switzerland
Syrian Arab Republic
Tajikistan
Tanzania, United Republic of
Thailand
The former Yugoslav
Republic of Macedonia
Timor-Leste
Togo
Tonga
108
Immunization 2004
% of population
using adequate
sanitation facilities
2002
% of routine
EPI
vaccines
financed by
government
2004
total urban rural
total urban rural
total
%
newTB
DPT
Polio Measles HepB Hib
borns
protected
corresponding vaccines:
against
BCG DPT1† DPT3† polio3 measles hepB3 Hib3 tetanus
42
80
80
84
100
81
46
60
100
100
94
79
90
84
91
39
83
81
85
100
57
96
73
99
98
88
79
72
93
87
57
100
70
29
87
78
69
92
52
100
100
79
58
73
85
24
74
72
82
99
65
36
49
100
100
86
72
87
94
79
32
62
66
77
100
16
88
69
99
98
93
88
73
54
86
75
46
100
65
27
73
72
64
73
42
100
100
64
47
62
80
27
73
30
27
100
66
12
38
100
76
89
54
83
72
45
78
62
73
100
51
87
41
96
89
100
24
52
87
39
100
31
25
67
91
34
93
52
100
100
77
53
46
99
51
96
66
68
100
78
43
48
100
78
97
92
96
89
67
94
72
81
100
86
93
56
96
89
100
32
100
70
97
53
100
100
98
47
86
98
50
99
78
100
100
97
71
54
97
14
63
14
20
100
51
4
30
100
70
61
35
52
51
41
58
33
61
100
10
70
38
96
89
96
100
20
34
77
100
30
100
18
14
44
89
24
76
44
100
100
56
47
41
100
47
0
100
100
65
100
40
100
100
100
100
61
100
100
100
98
100
100
100
100
100
50
97
100
100
100
100
70
25
100
0
100
80
100
0
0
100
69
0
100
100
100
2
23
100
87
85
71
95
85
88
72
48
96
98
99
80
99
54
82
91
91
94
83
99
99
96
86
89
99
99
93
99
95
95
97
99
83
99
98
98
84
50
97
99
51
84
16
99
97
91
99
88
86
88
93
88
98
96
92
75
43
99
91
97
99
75
99
99
60
91
95
90
99
98
99
98
98
94
87
99
99
90
95
99
96
95
96
99
77
95
99
97
82
50
99
98
98
79
92
94
99
98
99
87
99
99
72
82
81
80
80
98
90
79
62
25
99
91
96
99
65
98
99
46
76
87
79
99
95
96
97
97
89
96
91
99
68
98
99
96
87
97
99
61
94
99
92
80
30
93
96
97
55
85
83
99
95
99
82
95
98
70
82
81
59
80
98
82
80
62
39
99
91
96
99
65
98
99
36
75
87
80
98
95
95
97
98
89
96
91
99
41
98
99
96
87
96
99
61
94
99
93
75
30
94
97
97
55
84
82
99
95
99
84
95
98
77
78
70
40
73
96
85
84
74
35
99
88
96
98
67
99
99
44
89
89
80
97
95
99
97
98
84
98
95
99
25
98
91
97
57
96
99
64
94
98
94
72
40
81
97
96
59
86
70
94
82
98
89
94
96
72
54
75
87
90
79
99
96
99
65
98
99
45
76
87
40
98
94
97
99
96
89
96
91
99
70
97
99
96
54
89
99
93
99
72
92
97
85
78
1
99
81
95
96
97
90
79
99
93
99
98
99
76
91
95
96
89
95
91
99
98
96
99
93
92
96
98
91
99
-
60
85
67
42
43
51
45
10
70
76
85
76
60
61
37
90
-
10
2
18
23
31
12
10
17
16x
13x
17x
20
10
12
5
7
3
9
19
5
4
10
18
1
14
-
52 73 51
51 80 36
100 100 100
33
34
97
65
71
98
30
15
96
99
0
40
100
94
72
91
99
96
65
83
99
94
57
71
99
95
57
71
99
96
55
70
99
99
-
61
-
14
9
-
76
95
98
93
100
100
93
80
72
100
100
97
81
95
79
99
88
100
87
90
100
100
91
99
92
99
98
91
89
97
90
99
100
75
100
100
94
32
98
99
78
98
87
100
100
94
93
92
95
1-year-old children immunized against:
T H E S TAT E O F T H E W O R L D ’ S C H I L D R E N 2 0 0 6
% underfives with
diarrhoea
receiving
oral rehydration and
continued
feeding
1996-2004*
%
underfives
sleeping
under a
mosquito net
55
66
53
26
57
27
33
65
66x
75x
51x
58
55
20
47
27
97
50
75
57
58
60
66
51
68
-
33
48
39
43
49
43
28
33x
-x
46
76
16
44
33
39
37
38
43
24
29
38
-
10
7
17
6
6
52
15
15
1
23
77
0
6
36
-
3
6
1
5
2
2
0
0
3
0
2
10
-
15
14
2
48
34
13
36
61
19
50
26
69
58
-
24
30
-
25
-
48
15
-
8
2
-
47
60
-
%
underfives
%
with ARI
under- taken to
fives
health
with ARI provider
% of population
using improved
drinking water
sources
2002
1998-2004*
Malaria: 1999-2004
% under- % underfives fives with
sleeping
fever
under a receiving
treated
antimosmalarial
quito net
drugs
…TABLE 3
% of population
using improved
drinking water
sources
2002
Trinidad and Tobago
Tunisia
Turkey
Turkmenistan
Tuvalu
Uganda
Ukraine
United Arab Emirates
United Kingdom
United States
Uruguay
Uzbekistan
Vanuatu
Venezuela
Viet Nam
Yemen
Zambia
Zimbabwe
% of routine
EPI
vaccines
financed by
government
2004
Immunization 2004
1-year-old children immunized against:
%
underfives
%
with ARI
under- taken to
fives
health
with ARI provider
% underfives with
diarrhoea
receiving
oral rehydration and
continued
feeding
1996-2004*
%
underfives
sleeping
under a
mosquito net
Malaria: 1999-2004
% under- % underfives fives with
sleeping
fever
under a receiving
treated
antimosmalarial
quito net
drugs
total urban rural
total urban rural
total
%
newTB
DPT
Polio Measles HepB Hib
borns
protected
corresponding vaccines:
against
BCG DPT1† DPT3† polio3 measles hepB3 Hib3 tetanus
91
82
93
71
93
56
98
100
98
89
60
83
73
69
55
83
100
80
83
62
88
41
99
100
100
94
57
50
68
41
30
45
57
100 100
90 62
94 62
77 50
92 83
53 39
100 97
100 100
100 100
95 85
73 48
78 42
71 48
84 26
76 14
68 32
69 51
100
100
100
67
100
7
100
100
56
100
80
100
100
70
100
10
0
97
88
99
99
99
98
98
99
99
63
97
96
63
94
95
91
97
86
98
99
99
96
96
96
99
98
99
73
99
92
92
94
90
94
97
85
97
98
87
99
94
90
96
95
99
49
86
96
78
80
85
94
97
85
98
98
86
99
94
91
92
95
99
53
83
96
78
80
85
95
95
81
97
98
91
99
94
81
93
95
98
48
80
97
76
84
80
94
96
77
96
98
87
98
92
92
94
99
56
82
94
49
85
94
97
87
94
91
94
94
61
80
-
41
53
85
21
83
70
3
9
29
1
22
0
9
20
24
15
16
74
43
41
51
67
57
72
71
47
69
50
31
19
29
33
51
39
23x
48
80
7
96
16
3
0
16
7
-
7
52
-
36 55 26
37 60 27
35 52 24
72 88 52
35 64 23
50 72 35
75 84 44
81 92 62
100 100 100
49 73 31
35 58 27
58 81 37
47
24
68
88
90
90
95
89
69
80
38
80
76
87
67
88
77
92
96
93
84
82
84
77
89
67
94
75
94
96
94
98
84
87
86
65
80
52
88
67
86
91
93
96
76
75
78
68
79
57
89
71
87
92
94
94
79
74
80
66
77
55
89
61
83
92
93
92
74
72
76
33
54
13
77
11
71
83 91
90
63 92
46
28
49
-
59
62
57
70
64
54
64
14
18
10
13
19
10**
15
16**
16
16**
41
47
35
66
59
62**
50
54**
38
54**
34
37
30
26
59**
36
25
33**
36
33**
15
14
15
20
-
3
4
2
3
-
35
26
43
36
-
92 88
94 60
96 87
93 54
94 92
87 52
100 94
100
100 100
98 93
97 84
85 52
85 70
93 67
74 68
90 36
100 74
% of population
using adequate
sanitation facilities
2002
1998-2004*
SUMMARY INDICATORS
Sub-Saharan Africa
57 82 44
Eastern and Southern Africa
56 87 43
Western and Central Africa
58 78 45
Middle East and North Africa
87 95 77
South Asia
84 94 80
East Asia and Pacific
78 92 68
Latin America and Caribbean
89 95 69
CEE/CIS
91 98 79
Industrialized countries
100 100 100
Developing countries
79 92 70
Least developed countries
58 80 50
World
83 95 72
Countries in each category are listed on page 132.
DEFINITIONS OF THE INDICATORS
Government funding of vaccines – Percentage of vaccines routinely administered in a country to protect children
that are financed by the national government (including loans).
EPI – Expanded Programme on Immunization: The immunizations in this programme include those against tuberculosis
(TB), diphtheria, pertussis (whooping cough) and tetanus (DPT), polio and measles, as well as protecting babies
against neonatal tetanus by vaccination of pregnant women. Other vaccines (e.g. against hepatitis B (HepB),
haemophilus influenzae type B (Hib), or yellow fever) may be included in the programme in some countries.
BCG – Percentage of infants that receive Bacile Calmette-Guérin (vaccine against tuberculosis).
DPT1 – Percentage of infants that received their first dose of diphtheria, pertussis (whooping cough) vaccine and
tetanus vaccine.
DPT 3 – Percentage of infants that received three doses of diphtheria, pertussis (whooping cough) and tetanus
vaccine.
HepB3 – Percentage of infants that received three doses of hepatitis B vaccine.
Hib3 – Percentage of infants that received three doses of Haemophilus influenzae type b vaccine.
% under-fives with ARI – Percentage of children (0-4 years) with an acute respiratory infection (ARI) in the last two weeks.
% under-fives with ARI taken to health provider – Percentage of children (0-4 years) with ARI in the last two
weeks taken to an appropriate health provider.
% under-fives with diarrhea receiving oral rehydration and continued feeding – Percentage of children
(0-4 years) with diarrhoea (in the two weeks preceding the survey) who received either oral rehydration Therapy
(Oral Rehydration Solutions or Recommended Homemade Fluids) or increased Fluids and continued feeding.
Malaria
% under-fives sleeping under a mosquito net – Percentage of children (0-4 years) who slept under a mosquito net.
MAIN DATA SOURCES
Use of improved drinking water sources and adequate sanitation facilities – UNICEF, World Health
Organization (WHO), Multiple Indicator Cluster Surveys (MICS) and Demographic and Health Surveys (DHS).
Government funding of vaccines – UNICEF and WHO.
Immunization – UNICEF and WHO.
Acute respiratory infection – DHS, MICS, and other national household surveys.
Oral rehydration – DHS, MICS.
Malaria – MICS and DHS.
% under-fives sleeping under a treated mosquito net – Percentage of children (0-4 years) who slept under an
insecticide-impregnated mosquito net.
% under-fives with fever receiving anti-malarial drugs – Percentage of children (0-4 years) who were ill with
fever in the last two weeks and received any appropriate (locally defined) antimalarial drugs.
NOTES
x
*
**
†
Data not available.
Indicates data that refer to years or periods other than those specified in the column heading, differ from the standard definition or refer to only part of a country.
Data refer to the most recent year available during the period specified in the column heading.
Excludes China.
This was the first year that DPT1 coverage was estimated. Coverage for DPT1 should be at least as high as DPT3. Discrepancies where DPT1 coverage is less than DPT3 reflect
deficiencies in the data collection and reporting process. UNICEF and WHO are working with national and territorial systems to eliminate these discrepancies.
S TAT I S T I C A L TA B L E S
109
TABLE 4. HIV/AIDS
HIV Prevalence
Adult
prevalence
rate
(15-49
years),
end-2003
Countries and
territories
Afghanistan
Albania
Algeria
Andorra
Angola
Antigua and Barbuda
Argentina
Armenia
Australia
Austria
Azerbaijan
Bahamas
Bahrain
Bangladesh
Barbados
Belarus
Belgium
Belize
Benin
Bhutan
Bolivia
Bosnia and Herzegovina
Botswana
Brazil
Brunei Darussalam
Bulgaria
Burkina Faso
Burundi
Cambodia
Cameroon
Canada
Cape Verde
Central African Republic
Chad
Chile
China
Colombia
Comoros
Congo
Congo, Democratic
Republic of the
Cook Islands
Costa Rica
Côte d’Ivoire
Croatia
Cuba
Cyprus
Czech Republic
Denmark
Djibouti
Dominica
Dominican Republic
Ecuador
Egypt
El Salvador
Equatorial Guinea
Eritrea
Estonia
Ethiopia
Fiji
110
estimate
Knowledge and behaviour (1998-2004)* (15-24 years)
Estimated number of people living with HIV,
2003 (in thousands)
adults
and
children
children
(0-49
low
high
(0-14
years) estimate - estimate years)
0.1
3.9
0.7
0.1
0.1
0.3
<0.1
3.0
0.2
1.5
0.2
2.4
1.9
0.1
<0.1
37.3
0.7
<0.1
<0.1
4.2
6.0
2.6
6.9
0.3
13.5
4.8
0.3
0.1
0.7
4.9
9.1
240
130
2.6
14
10
1.4
5.6
<0.6
2.5
10
3.6
68
4.9
0.9
350
660
<0.2
<0.5
300
250
170
560
56
260
200
26
840
190
90
4.2
0.6
7.0
<0.1
0.1
0.1
0.2
2.9
1.7
0.3
<0.1
0.7
2.7
1.1
4.4
0.1
1100
12
570
<0.2
3.3
2.5
5.0
9.1
88
21
12
29
60
7.8
1500
0.6
3.0
97
61
1.2
6.8
5.0
0.5
3.2
0.2
2.5
0.7
12
5.3
1.2
38
1.6
0.3
330
320
190
170
100
390
26
160
130
13
430
90
39
<
<
-
450 6.0 390 <
1.1 0.8 2.5 2.3 48 10 5.0 14 21 2.6 950 0.2 -
18
600
210
4.3
22
16
2.8
8.7
1.1
15
9.2
42
17
10
120
11
1.8
380
1100
0.4
1.0
470
370
290
810
86
410
300
44
1500
310
200
2600
21
820
0.4
6.6
4.9
8.2
24
160
38
31
50
170
15
2300
1.3
women
(15-49
years)
HIV prevalence
rate in young
(15-24 years)
pregnant women
in capital city
year
median
% who
know
condom
can prevent
HIV
% who
% who
know
have
healthycomprelooking
hensive
person can knowledge
have HIV
of HIV
male female male female male female male female
23
<0.2
<0.2
<0.2
5.7
25
31
27
7.3
43
21
18
10
1.4
130
24
0.9
1.0
2.2
2.5
<0.5
0.8
3.5
1.3
35
1.3
190
240
<0.2
150
130
51
290
13
130
100
8.7
190
62
45
2002
2003
2002
2002
2002
2002
2003
-
2.3
32.9
2.3
13.6
7.0
14.0
4.8
-
56
53
74
90
61
-
42
41
11
45
58
53
93
48
47
64
46
20
21
41
-
48
69
67
79
61
63
60
-
40
53
35
56
59
74
81
56
66
62
57
53
46
28
82
55
-
8
14
33
23
-
110
40
0.7
2.2
5.6
120
-
570
4.0
300
1.1
0.8
0.9
4.7
23
6.8
1.6
9.6
31
2.6
770
<0.2
2002
2003
-
5.2
11.7
-
88
-
46
53
89
84
26
62
-
67
89
54
-
64
91
92
58
68
46
79
39
-
-
T H E S TAT E O F T H E W O R L D ’ S C H I L D R E N 2 0 0 6
% who
used
condom
at last
high-risk
sex
0
7
2
8
40
15
24
37
16m
5
5
10
-
Orphans
Children (0-17 years)
orphaned Orphan
orphaned due to all
school
by AIDS, causes, attendance
2003
2003
ratio
estimate (in estimate (in
thousands) thousands)
(1998-2004*)
44
34
37
88
67
31
-
0
19
21
75
54
16
30
-
110
34
120
260
200
240
110
96
97
1600
1000
750
7.6
5300
3.7
5.6
340
90
340
160
4300
4.2
830
660
670
930
290
500
230
20600
910
260
90
82
99
109
70
71
94p
91
96
59
-
16m 56
52
52
4
37
30
-
25
29
17
-
770
310
5
39
720
-
4200
50
940
130
33
260
290
180
24
230
4000
25
72
83
96
95
83
60
-
…TABLE 4
HIV Prevalence
Adult
prevalence
rate
(15-49
years),
end-2003
estimate
Finland
France
Gabon
Gambia
Georgia
Germany
Ghana
Greece
Grenada
Guatemala
Guinea
Guinea-Bissau
Guyana
Haiti
Holy See
Honduras
Hungary
Iceland
India
Indonesia
Iran (Islamic Republic of)
Iraq
Ireland
Israel
Italy
Jamaica
Japan
Jordan
Kazakhstan
Kenya
Kiribati
Korea, Democratic
People’s Republic of
Korea, Republic of
Kuwait
Kyrgyzstan
Lao People’s
Democratic Republic
Latvia
Lebanon
Lesotho
Liberia
Libyan Arab Jamahiriya
Liechtenstein
Lithuania
Luxembourg
Madagascar
Malawi
Malaysia
Maldives
Mali
Malta
Marshall Islands
Mauritania
Mauritius
Mexico
Micronesia
(Federated States of)
Moldova, Republic of
Monaco
Knowledge and behaviour (1998-2004)* (15-24 years)
Estimated number of people living with HIV,
2003 (in thousands)
adults
and
children
children
(0-49
low
high
(0-14
years) estimate - estimate years)
0.1
0.4
8.1
1.2
0.1
0.1
3.1
0.2
1.1
3.2
2.5
5.6
1.8
0.1
0.2
0.1
0.1
<0.1
0.1
0.1
0.5
1.2
<0.1
<0.1
0.2
6.7
-
1.5
120
48
6.8
3.0
43
350
9.1
78
140
11
280
63
2.8
<0.5
110
31
<0.5
2.8
3.0
140
22
12
0.6
17
1200
-
<0.1
0.1
8.3
3.9
0.1
0.6
0.1
28.9
5.9
0.3
0.1
0.2
1.7
14.2
0.4
1.9
0.2
0.6
0.3
1.7
7.6
2.8
320
100
10
1.3
<0.5
140
900
52
140
<0.5
9.5
160
0.2
-
5.5
-
0.5
60
24
1.8
2.0
21
210
4.5
median
male female male female male female male female
Orphans
Children (0-17 years)
orphaned Orphan
orphaned due to all
school
by AIDS, causes, attendance
2003
2003
ratio
estimate (in estimate (in
thousands) thousands)
(1998-2004*)
<0.5
32
26
3.6
1.0
10
180
1.8
31
72
6.1
150
33
<0.2
15
3.8
0.8
45
10
2.9
5.5
720
-
2003
-
3.9
-
71
81
72
68
-
64
51
56
77
32
69
46
23
59
-
81
83
75
56
78
90
73
86
-
72
53
51
78
69
60
31
84
68
81
32
63
83
-
22
44
28
17
47
-
24
15
38
8
36
15
21
7
34
-
48
52
32
30
59
65
47
-
33
33
17
19
51
32
25
-
14
2
170
35
650
-
57
45
1000
510
420
81
33
610
180
35000
6100
2100
45
1700
-
-
0.9
<0.8
-
-
-
-
-
-
-
-
-
-
-
710
630
-
-
260
22
8.0
8.6
83
13
-
<0.5
2.5
<0.5
170
54
<0.5
76
460
8.5
71
5.1
53
2003
2003
2003
-
27.8
18.0
2.2
-
56
76
56
-
58
49
66
42
-
43
89
59
39
-
46
46
84
46
30
-
16
41
15
-
18
19
34
9
-
12
38
30
-
5
32
14
-
100
36
30
500
75
2
-
290
180
230
1000
1000
480
730
140
1900
87
76
93
72
-
2.7 - 9.0
-
-
-
-
-
-
56
-
-
79
-
-
19
-
-
-
-
-
-
3.5
120
35
0.9
2200
53
10
1.1
1.5
67
11
5.7
0.0
5.8
820
3.0
200
91
24
12
71
560
15
year
% who
know
condom
can prevent
HIV
% who
used
condom
at last
high-risk
sex
2.5
0.5
24
9.2
0.6
19
3.9
<0.5
100
-
38
51
<
<
<
-
women
(15-49
years)
HIV prevalence
rate in young
(15-24 years)
pregnant women
in capital city
% who
% who
know
have
healthycomprelooking
hensive
person can knowledge
have HIV
of HIV
130
360
35
600
110
5.5
1.0
7600
180
61
1.0
5.3
4.9
220
41
19
1.0
35
1700
2.7 - 16
1.5 - 8.0
0.6
3.7
0.7
290
47
3.3
0.4
68
700
25
44
4.5
78
<
<
-
3.6
12
4.1
360
220
20
2.6
1.0
250
1100
86
420
1.0
17
S TAT I S T I C A L TA B L E S
98
85
79p
98
113
103
87
82
95
-
111
TABLE 4. HIV/AIDS
HIV Prevalence
Adult
prevalence
rate
(15-49
years),
end-2003
estimate
Mongolia
<0.1
Morocco
0.1
Mozambique
12.2
Myanmar
1.2
Namibia
21.3
Nauru
Nepal
0.5
Netherlands
0.2
New Zealand
0.1
Nicaragua
0.2
Niger
1.2
Nigeria
5.4
Niue
Norway
0.1
Occupied Palestinian Territory
Oman
0.1
Pakistan
0.1
Palau
Panama
0.9
Papua New Guinea
0.6
Paraguay
0.5
Peru
0.5
Philippines
<0.1
Poland
0.1
Portugal
0.4
Qatar
Romania
<0.1
Russian Federation
1.1
Rwanda
5.1
Saint Kitts and Nevis
Saint Lucia
Saint Vincent and the Grenadines Samoa
San Marino
Sao Tome and Principe
Saudi Arabia
Senegal
0.8
Serbia and Montenegro
0.2
Seychelles
Sierra Leone
Singapore
0.2
Slovakia
<0.1
Slovenia
<0.1
Solomon Islands
Somalia
South Africa
21.5
Spain
0.7
Sri Lanka
<0.1
Sudan
2.3
Suriname
1.7
Swaziland
38.8
Sweden
0.1
Switzerland
0.4
Syrian Arab Republic
<0.1
Tajikistan
<0.1
Tanzania, United Republic of 8.8
The former Yugoslav
Republic of Macedonia <0.1
Thailand
1.5
Timor-Leste
-
112
Knowledge and behaviour (1998-2004)* (15-24 years)
Estimated number of people living with HIV,
2003 (in thousands)
adults
and
children
children
(0-49
low
high
(0-14
years) estimate - estimate years)
<0.5
15
1300
330
210
61
19
1.4
6.4
70
3600
2.1
1.3
74
16
16
15
82
9.0
14
22
6.5
860
250
44
10
4.1
<0.2
<0.5
5300
140
3.5
400
5.2
220
3.6
13
<0.5
<0.2
1600
<0.2
570
-
median
6200
220
6.9
1300
18
230
6.9
21
2.1
0.4
2300
2002
2003
2002
2002
2002
2002
2002
14.7
4.2
11.6
1.1
24.0
39.0
7.0
74
86
63
59
59
76
72
77
56
73
30
43
44
44
63
32
49
30
2
83
58
63
5
66
82
87
41
65
77
69
78
57
65
82
73
37
52
49
72
67
70
64
65
46
35
13
54
70
81
8
74
33
41
21
20
49
< 0.4
310 - 1000
-
12
-
200
-
-
-
-
6
-
8
-
0.7
0.5
24
7.7
7.8
7.3
40
3.0
6.9
11
4.8
420
170
22
3.4
1.3
4500
67
1.2
120
1.4
210
1.2
6.5
0.3
1200
110
31
2.8
12
130
5400
4.0
3.0
150
26
28
25
140
18
23
36
8.9
1400
380
89
20
8.0
0.4
1.0
T H E S TAT E O F T H E W O R L D ’ S C H I L D R E N 2 0 0 6
% who
used
condom
at last
high-risk
sex
male female male female male female male female
<0.2
670
97
110
16
3.8
<0.2
2.1
36
1900
<0.5
<0.5
8.9
6.2
4.8
3.9
27
2.0
4.3
290
130
23
2.0
1.0
2900
27
0.6
220
1.7
110
0.9
3.9
<0.2
840
29
9.5
0.5
3.1
36
2400
1.0
30
1700
620
250
year
% who
know
condom
can prevent
HIV
99
7.6
15
5.9
290
22
3.1
230
21
<0.2
16
140
5.0
980
170
180
<
<
<
<
-
women
(15-49
years)
HIV prevalence
rate in young
(15-24 years)
pregnant women
in capital city
% who
% who
know
have
healthycomprelooking
hensive
person can knowledge
have HIV
of HIV
32
20
31
5m
18
23
11
13
16
0
20
27
27
44
-
Orphans
Children (0-17 years)
orphaned Orphan
orphaned due to all
school
by AIDS, causes, attendance
2003
2003
ratio
estimate (in estimate (in
thousands) thousands)
(1998-2004*)
33
69
30
46
55
47
29
48
17
7
24
19
23
20
42
470
57
24
1800
160
17
1100
65
980
78
1500
1900
120
1000
150
680
7000
4800
48
220
150
720
2100
810
460
350
770
2200
340
1300
13
100
2500
80
92
64p
85p
80
74p
71
65
95
96
89
91
82
-
-
-
1400
-
-
…TABLE 4
HIV Prevalence
Adult
prevalence
rate
(15-49
years),
end-2003
estimate
Togo
Tonga
Trinidad and Tobago
Tunisia
Turkey
Turkmenistan
Tuvalu
Uganda
Ukraine
United Arab Emirates
United Kingdom
United States
Uruguay
Uzbekistan
Vanuatu
Venezuela
Viet Nam
Yemen
Zambia
Zimbabwe
4.1
3.2
<0.1
<0.1
4.1
1.4
0.1
0.6
0.3
0.1
0.7
0.4
0.1
16.5
24.6
Knowledge and behaviour (1998-2004)* (15-24 years)
Estimated number of people living with HIV,
2003 (in thousands)
adults
and
children
children
(0-49
low
high
(0-14
years) estimate - estimate years)
110
29
1.0
<0.2
530
360
32
950
6.0
11
110
220
12
920
1800
67 11 0.4 <
350 180 16 470 2.8 4.9 47 110 4.0 730 1500 -
170
women
(15-49
years)
170
360
24
1100
2000
9.3
0.7
84
85
120
54
14
<0.5
270
120
7.0
240
1.9
3.7
32
65
470
930
27900
18800
10300
1400
7700
3200
2600
1900
2300
39600
14300
42300
1900
1200
650
22
130
39
48
8.1
17
2100
1000
2100
13100
9100
4100
230
1500
640
760
440
410
16300
6100
17000
74
2.4
0.4
880
590
52
1600
9.7
30
HIV prevalence
rate in young
(15-24 years)
pregnant women
in capital city
% who
know
condom
can prevent
HIV
% who
% who
know
have
healthycomprelooking
hensive
person can knowledge
have HIV
of HIV
% who
used
condom
at last
high-risk
sex
Orphans
Children (0-17 years)
orphaned Orphan
orphaned due to all
school
by AIDS, causes, attendance
2003
2003
ratio
estimate (in estimate (in
thousands) thousands)
(1998-2004*)
year
median
2003
2001
2002
-
9.1
10.0
22.1
-
81
50
68
81
63
54
19
68
57
28
28
60
67
73
73
83
58
73
83
66
95
42
76
78
55
78
61
74
74
40
7
33
-
20m
33
3
28
8
25
31
-
41
62
50
42
69
22
44
33
42
54
940
630
980
240
28
2000
62
460
2100
1100
1300
96
95
92
98
-
68
73
64
-
54
64
46
-
68
71
65
-
58
61
53
-
31
39
23
17
-
23
28
18
21
-
43
42
45
59
-
27
27
26
51
-
12100
7900
4200
-
42000
22200
19800
48100
37400
12400
143400
83
82
-
male female male female male female male female
SUMMARY INDICATORS
Sub-Saharan Africa
7.5
25000
23000
Eastern and Southern Africa 10.2
17100
15900
Western and Central Africa 4.8
7800
6400
Middle East and North Africa 0.3
510
230
South Asia
0.7
5000
2400
East Asia and Pacific
0.2
2400
1800
Latin America and Caribbean 0.7
2000
1600
CEE/CIS
0.6
1300
840
Industrialized countries
0.4
1600
1100
Developing countries
1.2
34900
31600
Least developed countries
3.2
12000
10800
World
1.1
37800
34600
Countries in each category are listed on page 132.
-
DEFINITIONS OF THE INDICATORS
Adult prevalence rate – Percentage of adults (15-49 years) living with HIV/AIDS as of end-2003.
Estimated number of people living with HIV/AIDS – Estimated number of adults and children
living with HIV/AIDS as of end-2003.
HIV prevalence among pregnant women – Percentage of blood samples taken from pregnant
women (15-24 years) that test positive for HIV during ‘unlinked anonymous’ sentinel surveillance
at selected antenatal clinics.
Know condom can prevent HIV – Percentage of young men and women (15-24 years) who report
through prompted questions that condom use can prevent HIV transmission.
Know healthy-looking person can have HIV – Percentage of young men and women (15-24
years) who know that a healthy-looking person can have the AIDS virus.
Comprehensive knowledge of HIV – Percentage of young men and women (15-24 years) who
correctly identify the two major ways of preventing the sexual transmission of HIV (using condoms and
limiting sex to one faithful, uninfected partner), who reject the two most common local misconceptions
about HIV transmission, and who know that a healthy-looking person can have the AIDS virus.
Condom use at last high-risk sex – Percentage of young men and women (15-24 years) who say
they used a condom the last time they had sex with a non-marital, non-cohabiting partner, of
those who have had sex with such a partner in the last 12 months.
Children orphaned by AIDS – Estimated number of children (0-17 years) as of end-2003, who
have lost one or both parents to AIDS.
Orphan school attendance ratio – Percentage of children (10-14 years) who lost both biological
parents and who are currently attending school as a percentage of non-orphaned children of the
same age who live with at least one parent and who are attending school.
NOTES
m
p
*
MAIN DATA SOURCES
Adult prevalence rate – Joint United Nations Programme on HIV/AIDS (UNAIDS), Report on the
Global HIV/AIDS Epidemic, 2004.
Estimated number of people living with HIV/AIDS – UNAIDS, Report on the Global HIV/AIDS
Epidemic, 2004.
HIV prevalence among pregnant women – UNAIDS, Report on the Global HIV/AIDS Epidemic, 2004.
Know condom can prevent HIV – Demographic and Health Surveys (DHS), Multiple Indicator
Cluster Surveys (MICS), behavioural surveillance surveys (BSS) and Reproductive Health Surveys
(RHS) (1998-2003) and www.measuredhs.com/hivdata.
Know healthy-looking person can have HIV – DHS, BSS, RHS and MICS (1998-2003) and
www.measuredhs.com/hivdata.
Comprehensive knowledge of HIV – DHS, BSS, RHS and MICS (1998-2003) and
www.measuredhs.com/hivdata.
Condom use at last high-risk sex – DHS, MICS, BSS and RHS (1998-2003) and
www.measuredhs.com/hivdata.
Children orphaned by AIDS – UNAIDS, UNICEF and USAID, Children on the Brink 2004.
Orphan school attendance ratio – MICS and DHS (1998-2003) and
www.measuredhs.com/hivdata.
Data not available.
Data for the three knowledge indicators come from different sources.
Proportion of orphans (10-14 years) attending school is based on 25-49 cases.
Data refer to the most recent year available during the period specified in the column heading.
S TAT I S T I C A L TA B L E S
113
TABLE 5. EDUCATION
Adult literacy rate
Countries and territories
Afghanistan
Albania
Algeria
Andorra
Angola
Antigua and Barbuda
Argentina
Armenia
Australia
Austria
Azerbaijan
Bahamas
Bahrain
Bangladesh
Barbados
Belarus
Belgium
Belize
Benin
Bhutan
Bolivia
Bosnia and Herzegovina
Botswana
Brazil
Brunei Darussalam
Bulgaria
Burkina Faso
Burundi
Cambodia
Cameroon
Canada
Cape Verde
Central African Republic
Chad
Chile
China
Colombia
Comoros
Congo
Congo, Democratic
Republic of the
Cook Islands
Costa Rica
Côte d’Ivoire
Croatia
Cuba
Cyprus
Czech Republic
Denmark
Djibouti
Dominica
Dominican Republic
Ecuador
Egypt
El Salvador
Equatorial Guinea
Eritrea
Estonia
Ethiopia
Fiji
114
Number per 100
population
2002-2003*
Primary school enrolment ratio
(2000-2004*)
gross
net
Primary school
attendance
ratio
(1996-2004*)
net
2000-2004*
phones Internet
male
female
users
male
female
male
female
male
99
79
82
97
100
99
92
50
100
100
77
46
93
98
76
88
95
99
19
67
85
77
85
65
41
96
95
94
63
89
98
60
54
97
99
98
83
31
100
99
77
23
80
91
82
89
90
98
8
52
64
60
68
33
13
96
87
95
49
77
1
44
11
115
2
98
40
18
126
136
24
78
91
2
102
42
128
32
4
5
22
52
37
49
66x
85
2
1
4
5
107
27
1
1
73
42
32
2
10
0
1
2
12
0
13
11
4
57
46
4
26
22
0
37
14
39
11
1
2
3
3
3
8
10x
21
0
0
0
0
48
4
0
0
27
6
5
1
0
120
105
113
101
80
120
100
104
103
94
92
97
94
109
103
106
123
127
116
103
151
106
101
53
86
130
116
101
124
78
95
99
115
111
98
83
63
102
104
101
69
119
97
104
103
91
93
97
98
108
101
105
121
92
115
103
143
106
99
39
69
117
99
102
118
53
61
97
115
110
81
77
96
96
88
66x
95
96
89
81
85
89
82
100
95
100
98
69
95
79
98
91
42
62
96
100
100
75
85
99
88
59
55
94
94
90
57x
93
97
91
79
88
91
86
100
94
100
100
47
95
83
91
90
31
52
91
100
98
51
84
99
87
50
53
66
94
57
97
91
86
78
61
78
87
83
96
35
50
66
76
47
46
92
31
-
80
96
60
99
100
99
88
92
67
82
92
100
49
94
52
96
38
97
100
95
87
90
44
77
76
100
34
91
1
43
46
9
95
7
132
132
155
5
42
39
31
21
29
9
1
112
1
26
0
20
29
1
23
1
34
31
54
1
16
10
5
4
8
0
1
44
0
7
52x
108
86
97
100
97
103
104
47
91
123
117
100
116
132
70
103
79
109
47x
107
69
96
96
98
101
104
37
85
125
117
95
109
120
57
99
61
109
90
67
90
94
96
87
100
40
83
99
99
93
90
91
49
95
55
100
91
54
89
93
96
87
100
32
79
94
100
90
90
78
42
94
47
100
55
62
92
84
61
65
33
-
T H E S TAT E O F T H E W O R L D ’ S C H I L D R E N 2 0 0 6
% of primary school
entrants reaching
grade 5
Secondary school enrolment ratio
(2000-2004*)
gross
net
Secondary school
attendance
ratio
(1996-2004*)
net
Admin. data
Survey data
female
2000-2004*
1997-2004*
male
female
male
female
male
female
40
93
59
97
91
87
80
47
77
85
86
96
29
44
65
73
39
33
93
31
-
90y
97
92
96
97y
73y
99
54
99
99y
81
68
91
84
88
80y
93
94y
78
68
61
64
88
44
99
99
69
66
92
95
76
78
100
99
99
86
92
50
99
96
84x
93
80
93
93
70
96
86
24
-
24
81
77
80
21
97
86
156
102
84
90
93
45
105
90
153
76
38
88
70
105
87
100
14
13
31
34
106
67
22
91
71
67
34
37
81
83
84
17
103
88
152
97
81
93
99
50
107
92
169
80
17
85
75
115
92
97
9
9
20
28
105
73
7
92
69
74
28
27
76
65
69
79
82
87
89
77
74
84
42
90
83
97
67
27
72
50
72
88
11
10
30
97
55
12
80
53
-
78
69
74
84
85
89
89
75
77
90
47
90
86
98
71
13
71
57
78
86
7
8
19
98
61
4
81
58
-
18
39
22
66
76
35
19
57
79
42
12
6
21
24
10
9
61
10
-
6
39
20
71
75
36
12
56
79
50
10
6
13
22
7
5
66
11
-
49
53
93
82
62
62
28
-
51x
92
88
100y
98
99
98
100
88
84
65
74
98
69
33
86
98
62
88
54
94
99
93
99
75
82
65
-
24
64
33
89
94
98
96
126
29
108
53
59
88
59
38
34
95
28
78
13
69
18
91
92
99
98
132
20
120
65
60
82
59
22
22
98
16
83
50
27
86
86
91
89
94
25
86
30
50
83
48
33
25
87
23
73
55
15
87
86
94
92
98
17
98
41
51
79
49
19
18
90
13
79
18
15
19
73
19
38
-
15
11
26
68
18
35
-
…TABLE 5
Adult literacy rate
Finland
France
Gabon
Gambia
Georgia
Germany
Ghana
Greece
Grenada
Guatemala
Guinea
Guinea-Bissau
Guyana
Haiti
Holy See
Honduras
Hungary
Iceland
India
Indonesia
Iran (Islamic Republic of)
Iraq
Ireland
Israel
Italy
Jamaica
Japan
Jordan
Kazakhstan
Kenya
Kiribati
Korea, Democratic
People’s Republic of
Korea, Republic of
Kuwait
Kyrgyzstan
Lao People’s
Democratic Republic
Latvia
Lebanon
Lesotho
Liberia
Libyan Arab Jamahiriya
Liechtenstein
Lithuania
Luxembourg
Madagascar
Malawi
Malaysia
Maldives
Mali
Malta
Marshall Islands
Mauritania
Mauritius
Mexico
Micronesia
(Federated States of)
Moldova, Republic of
Monaco
Number per 100
population
2002-2003*
Primary school enrolment ratio
(2000-2004*)
gross
net
Primary school
attendance
ratio
(1996-2004*)
net
Secondary school enrolment ratio
(2000-2004*)
% of primary school
entrants reaching
grade 5
gross
net
Secondary school
attendance
ratio
(1996-2004*)
net
Admin. data
Survey data
female
2000-2004*
1997-2004*
male
female
male
female
male
female
94
50
100y
60
76
54
38
97
57
73
95
91y
72
99
99
78
-
100
98x
69
98y
99y
63
79
65
77
98y
100
61
89
94
66x
99
85
96
90
97
98y
59
-
91
98
98
72
94
85
97
88
95
97
88
92
99
99
98
-
122
108
49
41
80
101
47
98
152
44
33
23
93
106
110
58
61
80
50
102
94
100
83
102
85
92
34
98
135
109
42
28
80
99
38
97
146
41
15
13
97
106
119
47
60
75
35
112
92
99
85
102
87
92
32
111
94
93
39
62
88
39
85
95
30
28
11
75
94
84
54
40
80
89
91
74
99
79
87
25
-
95
95
27
61
88
33
87
97
29
13
6
81
94
88
54
26
87
89
92
77
100
81
87
24
-
34
23
34
23
17
10
70
14
45
54
32
73
10
-
36
20
35
23
8
7
75
18
36
56
22
76
11
-
95
95
100
97y
93y
100
90
87
91
91
92
92
88
75
-
88
79
-
58
60
65
97
62
59x,y
74
74
45
46
-
60
97
69
53x,y
77
77
34
42
-
64
98y
92
73
98y
99
53
44
87
99y
75
99
61
99
93
93
95
89
51
80
93
83
-
50
95
76
30
40
102
103
93
15x
37
67
62
25
95
75
25
81
76
37
95
83
39
28
108
102
99
14x
29
74
71
14
95
76
20
81
83
38
88
18
23
94
77
11x
32
66
48
86
64
18
74
61
32
88
27
13
94
83
12x
26
74
55
88
66
14
74
64
27
12
17
7
15
14
-
21
17
21
9
11
9
-
98
-
99
-
91y
-
99
-
72
-
75
-
68
-
70
-
75
-
80
-
2000-2004*
phones Internet
male
female
users
male
female
male
female
male
63
94
75
54
80
99
73
92
84
98
84
95
100
78
-
46
88
63
50
80
99
48
83
70
96
91
85
99
70
-
140
126
25
10
28
144
5
136
67
20
2
1
19
6
10
112
163
7
13
27
3
137
142
150
70
115
36
19
6
6
53
37
3
2
2
47
1
15
17
3
1
1
14
2
4
23
67
2
4
7
0
32
30
34
23
48
8
2
1
2
102
105
133
86
91
100
87
101
121
110
92
84
126
105
101
100
111
113
93
120
106
112
102
100
100
99
102
95
103
102
104
132
84
90
99
79
101
119
102
71
56
123
107
100
99
104
111
90
100
106
112
101
99
100
99
101
90
120
100
99
79
79
89
82
65
99
89
89
73
53
100
87
91
100
90
93
88
98
95
99
100
94
100
91
92
66
-
100
99
78
78
88
84
53
99
80
86
58
37
98
88
90
99
85
92
85
83
97
99
99
95
100
93
91
66
-
94
55
99y
62
80
59
44
96
52
80
94
94y
84
99
98
77
-
85
99
81
98
4
124
77
10
0x
61
23
4
106
93
102
105
94
100
100
82
91
100
84
88
77
100
74
72
92
100
76
75
92
96
27
86
60
88
92
61
100
90
39
71
100
65
54
85
96
12
89
43
81
89
3
81
43
6
0x
16
93
87
199
2
2
62
25
1
125
9
14
55
45
0
40
14
1
0x
3
59
20
38
0
0
34
5
0
30
3
0
12
12
124
95
105
125
122
114
99
99
122
143
93
119
66
105
110
89
103
111
108
93
102
127
89
114
98
99
117
137
93
117
50
104
103
87
104
110
88
86
91
83
79
91
90
78
93
92
50
96
85
68
96
99
82
85
90
89
61
91
91
79
93
93
39
96
84
67
98
100
97
-
95
-
16
35
149
9
8
49
86
-
86
-
79
-
79
-
S TAT I S T I C A L TA B L E S
115
TABLE 5. EDUCATION
Adult literacy rate
Mongolia
Morocco
Mozambique
Myanmar
Namibia
Nauru
Nepal
Netherlands
New Zealand
Nicaragua
Niger
Nigeria
Niue
Norway
Occupied Palestinian Territory
Oman
Pakistan
Palau
Panama
Papua New Guinea
Paraguay
Peru
Philippines
Poland
Portugal
Qatar
Romania
Russian Federation
Rwanda
Saint Kitts and Nevis
Saint Lucia
Saint Vincent and
the Grenadines
Samoa
San Marino
Sao Tome and Principe
Saudi Arabia
Senegal
Serbia and Montenegro
Seychelles
Sierra Leone
Singapore
Slovakia
Slovenia
Solomon Islands
Somalia
South Africa
Spain
Sri Lanka
Sudan
Suriname
Swaziland
Sweden
Switzerland
Syrian Arab Republic
Tajikistan
Tanzania, United Republic of
Thailand
The former Yugoslav
Republic of Macedonia
Timor-Leste
116
Number per 100
population
2002-2003*
Primary school enrolment ratio
(2000-2004*)
gross
net
2000-2004*
phones Internet
male
female
users
male
female
male
female
98
63
62
94
87
63
77
20
74
96
82
62
93
63
93
93
93
98
100
70
90
98
38
31
86
83
35
77
9
59
87
65
35
91
51
90
82
93
96
99
59
91
19
28
2
1
18
29x
2
138
110
12
0
3
84
162
22
32
4
39
1
34
17
31
77
131
79
52
50
2
61
41
6
3
0
0
3
3x
0
52
53
2
0
1
48
35
4
7
1
6
1
2
10
4
23
19
20
18
4
0
21
8x
100
115
114
91
105
80x
126
109
102
109
51
132
121
101
99
81
80
115
114
79
112
119
113
100
118
107
100
118
122
109
112
102
104
93
92
106
82x
112
107
101
108
36
107
114
101
99
80
57
111
110
70
108
118
112
99
112
104
98
118
122
115
111
78
92
58
84
76
80
75
100
100
86
45
74
99
100
91
72
68
98
100
79
89
100
93
98
100
95
89
89
85
90
99
80
87
53
85
81
82x
66
99
99
85
31
60
98
100
91
72
50
94
99
69
89
100
95
98
99
94
88
90
88
100
100
99
87
51
99
91
40
97
100
100
84
92
69
92
80
91
100
78
95
98
69
29
94
92
21
89
100
100
81
89
50
84
78
74
99
62
91
80
13
139
8
48
8
58
85
2
130
92
128
2
5
41
135
12
5
47
13
162
157
15
4
3
50
6
2
54
10
7
2
8
14
0
51
26
40
1
1
7
24
1
1
4
3
57
40
1
0
1
11
109
107
130
68
83
98
115
93
101
108
108
109
111
64
127
102
109
108
118
113
98
99
106
104
122
65
77
98
114
65
100
107
104
107
110
56
125
94
112
107
112
108
95
95
90
99
100
55
61
96
100
85
94
89
100
50
96
75
100
99
100
97
83
87
98
-
94
-
45
-
5
-
96
-
97
-
91
-
Primary school
attendance
ratio
(1996-2004*)
net
male
female
Admin. data
Survey data
2000-2004*
1997-2004*
Secondary school enrolment ratio
(2000-2004*)
gross
net
Secondary school
attendance
ratio
(1996-2004*)
net
male
female
male
female
male
female
92y
81
49
65
92
65
100
65
69
76x
98y
98
84x
90
69
70
84
76
99
95y
99y
47
88y
84x
95
86
55
78
95
92
63
89
97
99
90
90x
97
93
78
-
78
49
19
40
59
52x
50
123
109
56
8
40
95
113
85
82
26
89
68
28
64
93
80
107
108
92
84
18
92
77
90
41
13
38
66
56x
39
121
116
66
6
32
93
116
90
79
19
89
73
22
66
86
88
102
118
96
85
15
121
96
72
38
14
36
39
88
91
36
7
32
95
96
82
69
60
27
50
70
54
90
81
80
79
94
68
83
33
10
34
50
89
93
42
5
26
93
97
86
70
66
21
53
68
65
93
89
85
82
100
85
58
39
6
36
29
35
35
8
38
80
48
55
5
-
69
36
4
38
40
27
47
5
33
83
48
70
5
-
78
45
96y
39
10
94
52
91
71
82
51
-
82
94
61
91
80
96y
99
98y
99y
65
98
84
73
91
99y
88
-
71
93
94
94
79
99
71
84
94
94
97
-
66
73
42
70
23
88
111
31
91
110
84
114
84
38
63
45
127
101
50
94
6
77
73
79
36
63
16
89
111
22
92
109
91
121
89
32
85
46
151
95
46
78
5
77
56
59
32
54
100
88
93
63
94
54
29
99
89
44
90
5x
-
61
65
26
52
100
88
94
68
98
74
36
100
84
41
76
4x
-
39
16
14
41
11
40
24
80
2
-
39
10
12
48
12
47
32
73
3
-
74y
96y
-
-
86
-
84
-
82
-
80
-
-
-
79
91
63
79
78
80
77
36
66
91y
62
87x,y
96
88
75
-
80
87
57
80
78
67
84
25
58
92y
51
87x,y
95
89
75
-
90
96
94
54
54
96
99
86
93
89
99
42
98
75
99
99
96
91x
81
84
77
52
98y
43
12
93
54
88
72
80
47
-
91
-
76y
T H E S TAT E O F T H E W O R L D ’ S C H I L D R E N 2 0 0 6
% of primary school
entrants reaching
grade 5
…TABLE 5
Adult literacy rate
Number per 100
population
2002-2003*
2000-2004*
phones Internet
male
female
users
Togo
Tonga
Trinidad and Tobago
Tunisia
Turkey
Turkmenistan
Tuvalu
Uganda
Ukraine
United Arab Emirates
United Kingdom
United States
Uruguay
Uzbekistan
Vanuatu
Venezuela
Viet Nam
Yemen
Zambia
Zimbabwe
68
99
99
83
96
99
79
100
76
97
100
93
94
69
76
94
38
99
98
65
81
98
59
99
81
98
99
93
87
29
60
86
6
15
53
31
66
8
7
3
37
102
143
117
47
8
7
38
9
5
3
6
Primary school enrolment ratio
(2000-2004*)
gross
net
male
female
male
female
4
3
11
6
8
0x
19
0
2
27
42
56
12x
2
4
6
4
1
1
4
132
114
101
113
95
96
142
93
98
100
98
110
103
113
105
105
98
85
94
110
111
99
109
88
109
139
93
95
100
98
108
102
113
103
97
68
79
92
99
100
91
97
89
84
84
100
92
90
93
90
98
84
69
79
83
100
90
97
84
84
82
100
93
91
95
91
92
59
68
80
1
2
1
4
1
8
9
6
45
5
0
11
104
101
105
98
106
112
121
101
101
108
97
108
90
92
85
89
97
111
118
98
101
101
85
101
70
71
68
84
86
96
95
89
95
88
71
88
62
68
55
78
80
96
94
87
96
83
65
85
Primary school
attendance
ratio
(1996-2004*)
net
Secondary school enrolment ratio
(2000-2004*)
% of primary school
entrants reaching
grade 5
gross
net
Secondary school
attendance
ratio
(1996-2004*)
net
Admin. data
Survey data
1997-2004*
male
female
male
female
88
100
92
97
100
89
89
96
96
88
88
94
51
96
79
75
90
87
22
97
77
159
94
99
97
27
65
75
65
30
38
22
111
86
81
67
81
18
96
80
199
94
112
94
29
75
70
29
25
35
36
67
69
61
17
84
70
94
88
70
27
55
47
25
35
17
77
75
68
16
85
72
97
89
77
28
64
21
21
33
21
69
49
50
14
70
8
59
35
21
44
11
75
36
61
15
73
10
57
13
23
42
84
81
87
90
93
96
90
80
90
33
32
39
70
52
69
85
91
106
61
32
66
26
28
29
63
44
68
91
83
109
57
26
63
29
29
35
60
54**
64
91
50**
30
60**
24
25
28
55
55**
68
92
49**
26
60**
22
17
25
46
43
52**
40
40**
21
40**
20
19
21
39
35
55**
46
37**
19
37**
male
female
2000-2004*
68
95
95y
89
86
78
81
93
97
68
68
85
59
96
93y
88
84
79
80
95
96
41
68
86
69
84x,y
71
96
64
99y
93
93
96y
72
84
87
76
77
70
60
62
59
82
77
91
89
76
60
76
57
62
51
77
70
91
88
72
55
72
66
65
91
61
93
83
98
78
65
79
male
female
SUMMARY INDICATORS
Sub-Saharan Africa
68
52
6
Eastern and Southern Africa 70
56
8
Western and Central Africa 69
48
4
Middle East and North Africa 77
57
22
South Asia
70
45
6
East Asia and Pacific
94
86
38
Latin America and Caribbean 91
89
40
CEE/CIS
99
96
46
Industrialized countries
125
Developing countries
83
70
24
Least developed countries
63
45
2
World
84
72
40
Countries in each category are listed on page 132.
DEFINITIONS OF THE INDICATORS
MAIN DATA SOURCES
Adult literacy rate – Percentage of persons aged 15 and over who can read and write.
Adult literacy – UNESCO Institute for Statistics.
Gross primary school enrolment ratio – The number of children enrolled in a primary level, regardless
of age, divided by the population of the age group that officially corresponds to the same level.
Phone and Internet use – International Telecommunications Union (Geneva).
Gross secondary school enrolment ratio – The number of children enrolled in a secondary level,
regardless of age, divided by the population of the age group that officially corresponds to the same
level.
Net primary school enrolment ratio – The number of children enrolled in primary school who belong
to the age group that officially corresponds to primary schooling, divided by the total population of the
same age group.
Primary and secondary school enrolment – UNESCO Institute for Statistics.
Primary and secondary school attendance – Demographic and Health Surveys (DHS) and
Multiple Indicator Cluster Surveys (MICS).
Reaching grade five – Administrative data: UNESCO Institute for Statistics. Survey data: DHS and
MICS.
Net secondary school enrolment ratio – The number of children enrolled in secondary school who
belong to the age group that officially corresponds to secondary schooling, divided by the total
population of the same age group.
Net primary school attendance – Percentage of children in the age group that officially corresponds to
primary schooling who attend primary school or higher. These data come from national household surveys.
Net secondary school attendance – Percentage of children in the age group that officially
corresponds to secondary schooling who attend secondary school or higher. These data come from
national household surveys.
Primary school entrants reaching grade five – Percentage of children entering the first grade of
primary school who eventually reach grade five.
NOTES
x
y
*
**
Data not available.
Indicates data that refer to years or periods other than those specified in the column heading, differ from the standard definition or refer to only part of a country.
Indicates data that differ from the standard definition or refer to only part of a country, but are included in the calculation of regional and global averages.
Data refer to the most recent year available during the period specified in the column heading.
Excludes China.
S TAT I S T I C A L TA B L E S
117
TABLE 6. DEMOGRAPHIC INDICATORS
Population
(thousands)
2004
Countries and territories
Afghanistan
Albania
Algeria
Andorra
Angola
Antigua and Barbuda
Argentina
Armenia
Australia
Austria
Azerbaijan
Bahamas
Bahrain
Bangladesh
Barbados
Belarus
Belgium
Belize
Benin
Bhutan
Bolivia
Bosnia and Herzegovina
Botswana
Brazil
Brunei Darussalam
Bulgaria
Burkina Faso
Burundi
Cambodia
Cameroon
Canada
Cape Verde
Central African Republic
Chad
Chile
China
Colombia
Comoros
Congo
Congo, Democratic Republic of the
Cook Islands
Costa Rica
Côte d’Ivoire
Croatia
Cuba
Cyprus
Czech Republic
Denmark
Djibouti
Dominica
Dominican Republic
Ecuador
Egypt
El Salvador
Equatorial Guinea
Eritrea
Estonia
Ethiopia
Fiji
118
under
18
under
5
15183
1048
12103
12
8277
27
12277
852
4816
1571
2802
108
231
58970
64
2048
2131
116
4192
973
4043
827
806
62194
128
1406
6982
3875
6250
7801
7007
236
1997
5087
4989
358887
16685
380
2085
30127
7
1500
8829
886
2706
207
1917
1203
378
27
3476
5090
29491
2727
250
2183
273
39005
318
5329
256
3099
3
2887
8
3350
164
1257
387
607
30
65
17284
16
444
565
34
1406
289
1231
194
221
17946
40
332
2393
1270
1801
2434
1705
70
636
1804
1246
86055
4734
125
727
10829
2
393
2751
210
689
49
449
329
120
7
997
1449
8795
804
86
733
63
12861
93
Population
annual
growth rate
(%)
Crude
death rate
1970-1990 1990-2004
1970 1990 2004
0.7
2.2
3.0
3.8
2.7
-0.2
1.5
1.7
1.4
0.2
1.7
2.0
4.0
2.4
0.4
0.6
0.2
2.1
3.0
2.2
2.3
0.9
3.2
2.2
3.4
0.1
2.4
2.4
1.7
2.8
1.2
1.4
2.4
2.4
1.6
1.6
2.2
3.3
3.2
3.0
-0.8
2.6
4.3
0.4
1.1
0.5
0.2
0.2
6.2
0.1
2.4
2.7
2.3
1.8
0.9
2.5
0.7
2.7
1.6
4.8
-0.4
1.8
1.8
2.8
1.7
1.2
-1.1
1.2
0.4
1.1
1.6
2.7
2.1
0.3
-0.3
0.3
2.5
3.3
1.8
2.1
-0.7
1.5
1.5
2.5
-0.8
2.9
1.8
2.5
2.3
1.0
2.4
2.0
3.2
1.4
0.9
1.8
2.8
3.2
2.8
-0.1
2.3
2.5
0.0
0.5
1.4
-0.1
0.4
2.4
0.6
1.5
1.7
1.9
2.0
2.4
2.4
-1.2
2.8
1.1
26
8
16
28
9
5
9
13
7
7
9
21
9
7
12
8
22
23
20
7
13
11
7
9
23
20
20
21
7
12
22
25
10
8
9
18
14
20
7
18
10
7
10
13
10
21
11
12
17
12
25
21
11
21
8
21
6
7
25
8
8
7
11
7
7
4
12
9
11
11
5
15
14
11
7
6
7
3
12
18
20
13
14
7
8
17
19
6
7
7
11
12
19
4
14
11
7
8
12
12
15
7
6
9
7
20
16
13
18
6
Life
expectancy
Crude
birth rate
19
7
5
22
8
9
7
10
7
7
3
8
9
15
10
5
13
8
8
9
27
7
3
14
17
19
11
17
7
5
22
20
5
7
5
7
13
20
4
17
12
7
7
11
11
13
7
5
6
6
20
11
14
16
6
T H E S TAT E O F T H E W O R L D ’ S C H I L D R E N 2 0 0 6
1970 1990 2004
51
33
49
52
23
23
20
15
29
31
40
45
22
16
14
40
47
43
46
23
48
35
36
16
50
44
42
45
17
40
43
48
29
33
38
50
44
48
33
51
15
30
19
16
16
49
42
42
40
44
42
47
15
49
34
51
24
32
53
22
21
15
12
27
24
29
35
15
14
12
35
47
39
36
15
34
24
28
12
50
47
44
42
14
39
42
48
23
21
27
41
44
49
27
45
12
17
19
12
12
43
30
29
32
30
44
42
14
47
29
49
17
21
48
18
11
13
9
16
19
18
27
12
9
11
27
42
30
29
9
26
20
23
9
47
45
31
35
10
30
37
48
15
13
22
36
44
50
19
37
9
12
12
9
12
35
24
23
26
25
43
39
10
41
23
1970 1990 2004
39
67
53
37
66
70
71
70
65
66
62
44
69
71
71
66
46
41
46
66
55
59
67
71
43
44
44
44
73
57
42
40
62
62
61
48
54
45
67
49
69
70
71
70
73
43
58
58
51
57
40
43
71
43
60
45
72
67
40
71
68
77
76
66
68
71
55
75
71
76
72
53
54
59
72
66
66
74
71
48
45
55
53
78
65
49
46
73
68
68
56
55
46
75
52
72
74
77
72
75
51
65
68
63
65
46
48
70
47
67
46
74
71
41
75
72
81
79
67
70
75
63
75
68
79
72
54
63
64
74
35
71
77
72
48
44
57
46
80
71
39
44
78
72
73
64
52
44
78
46
75
78
79
76
77
53
68
75
70
71
43
54
72
48
68
Total
fertility
rate
2004
% of
population
urbanized
2004
7.4
2.2
2.5
6.7
2.3
1.3
1.7
1.4
1.8
2.3
2.4
3.2
1.5
1.2
1.7
3.1
5.7
4.2
3.8
1.3
3.1
2.3
2.4
1.2
6.6
6.8
4.0
4.5
1.5
3.6
4.9
6.7
2.0
1.7
2.6
4.7
6.3
6.7
2.2
4.9
1.3
1.6
1.6
1.2
1.8
4.9
2.7
2.7
3.2
2.8
5.9
5.4
1.4
5.7
2.9
24
44
59
91
36
38
90
64
92
66
50
90
90
25
52
71
97
48
45
9
64
45
52
84
77
70
18
10
19
52
81
57
43
25
87
40
77
36
54
32
72
61
45
59
76
69
74
85
84
72
60
62
42
60
49
20
70
16
52
Average
annual
growth rate
of urban
population (%)
1970-1990 1990-2004
3.3
2.8
4.4
3.8
5.5
0.0
2.0
2.3
1.4
0.2
2.0
2.8
4.2
7.1
0.8
2.7
0.3
1.8
6.7
5.1
4.0
2.8
11.5
3.7
3.7
1.4
6.6
7.2
2.1
6.2
1.3
5.5
3.4
5.3
2.1
3.9
3.2
5.1
5.1
2.6
-0.4
4.2
6.2
1.9
2.1
2.8
2.1
0.5
7.6
1.9
3.9
4.4
2.4
2.9
2.2
4.0
1.2
4.6
2.5
6.7
1.1
2.8
1.5
5.1
2.2
1.4
-1.4
1.8
0.4
0.5
2.1
2.8
3.6
1.4
0.2
0.4
2.6
5.2
5.2
3.1
0.3
3.0
2.3
3.6
-0.4
5.0
5.3
5.5
4.1
1.4
4.2
3.0
4.5
1.8
3.5
2.6
4.5
4.0
3.8
1.4
3.3
3.4
0.7
0.7
1.8
-0.1
0.4
3.2
1.1
2.1
2.6
1.7
3.4
4.9
4.2
-1.4
4.4
2.7
…TABLE 6
Population
(thousands)
2004
under
18
under
5
Finland
1108
281
France
13290
3722
Gabon
646
193
Gambia
689
228
Georgia
1115
245
Germany
14933
3615
Ghana
10057
3069
Greece
1968
517
Grenada
35
10
Guatemala
6175
1988
Guinea
4625
1562
Guinea-Bissau
828
300
Guyana
264
76
Haiti
3842
1137
Holy See
Honduras
3284
975
Hungary
1993
481
Iceland
78
21
India
419442 120155
Indonesia
75682 21477
Iran (Islamic Republic of)
25915
5890
Iraq
13499
4274
Ireland
1004
296
Israel
2169
660
Italy
9861
2661
Jamaica
998
262
Japan
21949
5912
Jordan
2442
734
Kazakhstan
4515
1079
Kenya
16898
5557
Kiribati
38
12
Korea, Democratic People’s Republic of 6810
1763
Korea, Republic of
11031
2521
Kuwait
748
235
Kyrgyzstan
2027
539
Lao People’s Democratic Republic
2788
884
Latvia
465
99
Lebanon
1230
327
Lesotho
848
232
Liberia
1744
621
Libyan Arab Jamahiriya
2119
623
Liechtenstein
7
2
Lithuania
769
154
Luxembourg
103
29
Madagascar
9193
3064
Malawi
6775
2319
Malaysia
9529
2738
Maldives
156
46
Mali
7231
2540
Malta
89
20
Marshall Islands
24
7
Mauritania
1471
513
Mauritius
364
98
Mexico
39787 10962
Micronesia (Federated States of)
51
16
Moldova, Republic of
1052
211
Monaco
7
2
Mongolia
1009
268
Morocco
11734
3343
Population
annual
growth rate
(%)
Crude
death rate
1970-1990 1990-2004
1970 1990 2004
0.4
0.6
3.0
3.5
0.7
0.1
2.7
0.7
0.1
2.5
2.2
2.8
0.1
2.1
3.2
0.0
1.1
2.1
2.1
3.4
3.0
0.9
2.2
0.3
1.2
0.8
3.5
1.1
3.7
2.5
1.6
1.5
5.3
2.0
2.1
0.7
0.7
2.2
2.2
3.9
1.5
0.8
0.5
2.8
3.7
2.5
2.9
2.5
0.9
4.2
2.4
1.2
2.6
2.2
1.0
1.2
2.8
2.4
0.3
0.4
2.5
3.3
-1.4
0.3
2.4
0.6
0.4
2.3
2.8
3.0
0.2
1.4
2.6
-0.2
1.0
1.8
1.4
1.4
3.0
1.1
2.7
0.2
0.8
0.2
3.8
-0.8
2.5
2.2
0.9
0.8
1.4
1.2
2.4
-1.1
1.8
0.9
3.0
2.0
1.2
-0.5
1.4
2.9
2.1
2.4
2.8
2.8
0.7
1.7
2.7
1.1
1.6
0.9
-0.2
1.0
1.2
1.6
10
11
21
28
9
12
17
8
15
27
29
11
19
15
11
7
17
17
14
12
11
7
10
8
7
16
9
15
9
9
6
11
23
11
8
17
22
16
9
12
21
24
10
17
28
9
21
7
10
9
10
14
17
10
9
11
16
9
11
12
9
9
18
23
10
16
7
14
7
11
9
7
8
9
6
10
7
7
6
8
10
8
6
2
8
17
14
8
11
21
5
11
10
15
19
5
10
20
8
17
6
5
7
10
9
8
Life
expectancy
Crude
birth rate
10
9
13
12
11
10
11
10
7
14
20
9
13
6
13
6
9
7
5
10
8
6
10
8
8
4
11
15
11
6
2
7
12
13
7
25
21
4
12
8
12
21
5
6
17
8
14
7
4
6
11
7
6
1970 1990 2004
14
17
35
50
19
14
46
17
44
50
49
38
39
48
15
21
40
41
43
46
22
27
17
35
19
52
26
51
33
31
48
31
44
14
33
42
50
49
17
13
47
56
37
40
55
17
46
28
45
41
18
42
47
13
13
39
43
16
11
40
10
39
45
50
25
38
38
12
18
31
26
35
39
15
22
10
25
10
37
22
42
21
16
24
31
43
14
26
36
50
28
15
13
44
51
31
41
50
15
43
20
29
34
19
32
29
11
12
31
35
11
8
31
9
35
42
50
21
30
29
9
14
24
21
19
35
16
20
9
20
9
27
16
39
16
10
19
22
35
9
19
28
50
23
9
13
39
44
22
31
49
10
41
16
21
31
10
22
23
1970 1990 2004
70
72
47
36
68
71
49
72
52
38
36
60
47
52
69
74
49
48
54
56
71
71
72
68
72
54
62
52
61
60
66
60
40
70
65
49
42
51
71
70
44
41
61
50
37
70
42
62
61
62
65
53
52
75
77
60
50
71
76
56
77
61
47
42
60
49
65
69
78
58
62
65
63
75
76
77
72
79
67
67
59
65
71
75
66
50
69
69
58
43
68
71
75
51
46
70
60
46
76
49
69
71
66
68
61
64
79
80
54
56
71
79
57
78
68
54
45
64
52
68
73
81
64
67
71
59
78
80
80
71
82
72
63
48
63
77
77
67
55
72
72
35
42
74
73
79
56
40
73
67
48
79
53
72
75
68
68
65
70
Total
fertility
rate
2004
% of
population
urbanized
2004
1.7
1.9
3.9
4.6
1.4
1.3
4.2
1.2
4.5
5.8
7.1
2.2
3.9
3.6
1.3
2.0
3.0
2.3
2.1
4.7
1.9
2.8
1.3
2.4
1.3
3.4
1.9
5.0
2.0
1.2
2.3
2.6
4.7
1.3
2.3
3.5
6.8
2.9
1.3
1.7
5.3
6.0
2.8
4.1
6.8
1.5
5.7
2.0
2.3
4.3
1.2
2.4
2.7
61
76
85
26
52
88
46
61
41
47
36
35
38
38
100
46
66
93
28
47
67
67
60
92
67
52
66
79
56
41
49
61
81
96
34
21
66
88
18
47
87
22
67
92
27
17
64
29
33
92
67
63
44
76
30
46
100
57
58
Average
annual
growth rate
of urban
population (%)
1970-1990 1990-2004
1.4
0.8
6.9
6.0
1.5
0.4
3.9
1.3
0.1
3.2
5.2
5.0
0.7
4.1
4.8
1.2
1.4
3.4
5.0
4.9
4.1
1.3
2.6
0.4
2.3
1.7
4.7
1.8
8.0
4.0
1.9
4.5
6.3
2.0
4.5
1.3
2.4
5.6
4.6
6.7
1.6
2.4
1.7
5.3
7.0
4.5
6.1
5.0
1.5
4.3
8.2
1.0
3.6
2.7
2.9
1.2
4.0
4.1
S TAT I S T I C A L TA B L E S
0.3
0.7
4.1
3.6
-1.8
0.5
4.0
0.9
2.2
3.2
5.2
5.7
1.2
3.3
3.6
0.2
1.2
2.5
4.4
2.7
2.7
1.5
2.8
0.2
0.9
0.5
4.5
-0.9
6.1
4.6
1.3
1.4
1.5
0.4
4.7
-1.6
2.2
1.2
3.8
2.6
1.5
-0.6
1.9
3.8
4.6
4.2
3.7
5.1
1.1
1.9
5.3
1.6
1.9
1.8
-0.4
1.0
1.2
2.9
119
TABLE 6. DEMOGRAPHIC INDICATORS
Population
(thousands)
2004
under
18
under
5
Mozambique
9869
Myanmar
18111
Namibia
990
Nauru
5
Nepal
12260
Netherlands
3556
New Zealand
1050
Nicaragua
2512
Niger
7511
Nigeria
66211
Niue
1
Norway
1082
Occupied Palestinian Territory
1885
Oman
1050
Pakistan
71297
Palau
8
Panama
1153
Papua New Guinea
2717
Paraguay
2688
Peru
10701
Philippines
34448
Poland
8243
Portugal
2010
Qatar
199
Romania
4490
Russian Federation
29809
Rwanda
4640
Saint Kitts and Nevis
14
Saint Lucia
57
Saint Vincent and the Grenadines
43
Samoa
87
San Marino
5
Sao Tome and Principe
72
Saudi Arabia
10517
Senegal
5718
Serbia and Montenegro
2416
Seychelles
41
Sierra Leone
2627
Singapore
1033
Slovakia
1174
Slovenia
352
Solomon Islands
223
Somalia
4016
South Africa
18417
Spain
7407
Sri Lanka
6108
Sudan
16328
Suriname
163
Swaziland
519
Sweden
1949
Switzerland
1473
Syrian Arab Republic
8309
Tajikistan
3062
Tanzania, United Republic of
18833
Thailand
18617
The former Yugoslav Republic of Macedonia 504
Timor-Leste
442
Togo
3030
Tonga
44
3254
4716
273
2
3638
979
276
730
2775
21943
0
286
637
302
20922
2
341
820
814
3007
9873
1830
562
65
1063
7052
1477
4
14
12
26
1
23
3178
1820
611
14
925
226
259
87
71
1446
5248
2160
1631
5180
46
138
479
361
2488
839
5998
5020
119
160
996
12
120
Population
annual
growth rate
(%)
Crude
death rate
1970-1990 1990-2004
1970 1990 2004
1.8
2.1
3.0
1.9
2.3
0.7
1.0
2.9
3.1
2.8
0.4
3.4
4.5
3.1
1.5
2.4
2.4
2.9
2.5
2.6
0.8
0.7
7.2
0.7
0.6
3.2
-0.5
1.4
0.9
0.6
1.2
2.3
5.2
2.8
0.8
1.4
2.1
1.9
0.7
0.7
3.4
3.1
2.4
0.8
1.7
2.9
0.4
3.2
0.3
0.5
3.5
2.9
3.3
2.1
1.0
1.0
3.1
-0.2
2.6
1.5
2.6
2.5
2.4
0.6
1.1
2.2
3.3
2.5
0.6
3.6
2.3
2.3
1.9
2.0
2.4
2.5
1.7
2.1
0.1
0.3
3.6
-0.4
-0.2
1.6
0.3
1.0
0.6
0.9
1.0
1.9
2.7
2.5
0.2
0.7
1.9
2.5
0.2
0.1
2.8
1.3
1.8
0.6
1.0
2.2
0.8
1.3
0.4
0.4
2.6
1.4
2.6
1.1
0.4
1.3
3.0
0.6
24
18
15
21
8
9
14
28
22
10
19
17
16
8
19
9
14
11
8
11
13
9
9
21
8
11
10
13
18
25
9
29
5
10
10
10
25
14
9
9
21
8
18
10
9
13
10
17
9
8
22
18
6
21
12
9
13
9
8
7
26
18
11
7
4
11
5
13
6
7
7
10
10
3
11
12
33
7
7
7
10
5
14
10
26
5
10
10
9
22
8
9
6
14
7
10
11
9
5
8
13
6
8
18
12
6
Life
expectancy
Crude
birth rate
20
10
15
8
9
7
5
21
19
10
4
3
8
5
10
5
6
5
10
11
3
12
16
18
7
7
6
9
4
11
11
23
5
10
10
7
18
18
9
6
11
7
29
10
9
4
8
17
7
9
12
12
6
T H E S TAT E O F T H E W O R L D ’ S C H I L D R E N 2 0 0 6
1970 1990 2004
48
41
43
42
17
22
48
58
47
17
50
50
43
38
42
37
42
40
17
21
34
21
15
53
41
40
39
47
48
49
19
48
23
19
17
46
51
38
20
31
47
37
50
14
16
47
40
48
37
24
46
48
37
44
31
42
39
13
17
38
57
47
14
46
38
41
26
38
35
30
33
15
12
23
14
13
48
26
25
34
37
36
44
15
48
18
15
11
38
46
29
10
21
39
24
41
14
12
36
39
44
21
17
40
44
30
40
20
28
30
12
14
28
54
41
12
38
25
31
22
30
29
23
25
10
11
19
10
11
41
19
20
28
34
28
37
12
47
9
9
9
33
45
23
11
16
33
21
29
11
9
28
29
37
16
12
50
39
24
1970 1990 2004
40
48
53
43
74
71
54
38
42
74
54
50
51
65
44
65
53
57
70
67
61
68
70
44
64
61
55
56
52
39
68
35
69
70
69
54
40
53
72
62
44
63
48
74
73
55
60
48
60
66
40
48
65
43
56
62
54
77
75
64
40
47
77
69
70
60
72
52
68
65
65
71
74
69
69
69
32
71
69
65
62
68
53
72
39
75
72
73
61
42
62
77
71
53
68
58
78
78
68
63
54
68
71
45
58
70
42
61
47
62
79
79
70
45
43
80
73
74
63
75
56
71
70
71
75
78
73
72
65
44
73
71
71
63
72
56
74
41
79
74
77
63
47
47
80
74
57
69
31
80
81
74
64
46
70
74
56
55
72
Total
fertility
rate
2004
% of
population
urbanized
2004
5.4
2.3
3.8
3.6
1.7
2.0
3.2
7.8
5.7
1.8
5.4
3.6
4.1
2.7
3.9
3.8
2.8
3.1
1.2
1.5
2.9
1.3
1.3
5.6
2.2
2.2
4.3
3.9
3.9
4.9
1.6
6.5
1.3
1.2
1.2
4.2
6.3
2.8
1.3
1.9
4.3
2.6
3.8
1.7
1.4
3.3
3.7
4.9
1.9
1.5
7.8
5.2
3.4
37
30
33
100
15
66
86
58
23
48
36
80
72
78
34
68
57
13
58
74
62
62
55
92
55
73
20
32
31
59
22
89
38
88
50
52
50
40
100
58
51
17
35
57
77
21
40
77
24
83
68
50
24
36
32
60
8
36
34
Average
annual
growth rate
of urban
population (%)
1970-1990 1990-2004
8.3
2.5
4.8
1.9
6.4
1.0
1.2
3.5
6.3
5.5
0.9
4.4
13.0
4.2
2.4
3.0
3.9
4.3
3.4
4.5
1.5
3.6
7.5
2.1
1.5
5.7
-0.4
2.2
3.0
0.9
3.1
4.4
7.6
3.7
2.1
4.6
4.8
1.9
2.3
2.3
5.5
4.4
2.5
1.4
1.5
5.3
2.1
7.5
0.4
1.6
4.1
2.2
9.2
3.8
2.0
0.1
7.0
1.6
6.6
2.8
4.1
2.5
6.3
1.3
1.2
2.8
5.8
4.7
1.3
4.2
3.9
3.2
1.8
2.4
2.4
3.8
2.2
3.8
0.2
1.5
3.9
-0.3
-0.2
11.0
-0.3
2.1
3.3
1.2
0.9
2.2
3.6
4.2
0.4
0.8
3.9
2.5
0.3
0.2
4.2
2.6
2.9
0.7
0.9
5.1
1.9
1.5
0.4
0.3
2.8
-0.5
6.3
1.7
0.7
1.2
4.6
1.1
…TABLE 6
Population
annual
growth rate
(%)
Crude
death rate
1970-1990 1990-2004
1970 1990 2004
Population
(thousands)
2004
Trinidad and Tobago
Tunisia
Turkey
Turkmenistan
Tuvalu
Uganda
Ukraine
United Arab Emirates
United Kingdom
United States
Uruguay
Uzbekistan
Vanuatu
Venezuela
Viet Nam
Yemen
Zambia
Zimbabwe
Life
expectancy
Crude
birth rate
Total
fertility
rate
2004
% of
population
urbanized
2004
Average
annual
growth rate
of urban
population (%)
under
18
under
5
365
3312
25283
1896
4
15964
9467
1150
13208
74694
997
10797
98
9947
30741
10986
6127
6289
89
806
7236
484
1
5744
1930
325
3398
20243
283
2815
30
2842
7900
3581
1987
1756
1.1
2.4
2.3
2.6
1.3
3.2
0.5
10.6
0.2
1.0
0.5
2.7
2.8
3.1
2.2
3.2
3.3
3.5
0.5
1.4
1.7
1.9
0.7
3.2
-0.7
5.9
0.3
1.0
0.7
1.7
2.3
2.0
1.6
3.7
2.3
1.4
7
14
12
11
16
9
11
12
9
10
10
14
7
18
26
17
13
7
6
8
8
18
13
3
11
9
10
7
7
5
8
13
17
9
8
5
7
8
15
17
1
10
8
9
7
6
5
6
8
23
23
27
39
39
37
50
15
36
16
17
21
37
43
37
41
54
51
49
20
27
25
35
50
13
27
14
16
18
35
37
29
31
51
46
38
14
17
21
22
51
8
16
11
14
17
23
31
22
20
40
41
30
66
54
56
58
50
71
61
72
71
69
63
53
65
49
38
49
55
72
69
65
63
46
69
73
76
75
72
67
64
71
65
54
47
60
70
74
69
63
48
66
78
79
78
76
67
69
73
71
61
38
37
1.6
1.9
2.4
2.7
7.1
1.1
2.5
1.7
2.0
2.3
2.7
4.0
2.7
2.3
6.0
5.5
3.4
76
64
67
46
56
12
67
85
89
80
93
36
23
88
26
26
36
35
1.6
3.7
4.5
2.3
4.6
4.9
1.5
10.7
0.9
1.1
0.9
3.1
4.5
3.9
2.7
5.6
4.7
6.1
1.2
2.1
2.5
1.9
3.0
3.9
-0.7
6.1
0.4
1.5
1.0
1.1
4.0
2.4
3.5
5.1
1.6
2.9
117346
56702
60644
44067
169294
146536
56526
26430
54200
548486
117229
614399
2.9
2.9
2.8
3.0
2.2
1.8
2.2
1.0
0.7
2.1
2.5
1.8
2.5
2.4
2.6
2.1
1.9
1.1
1.6
0.2
0.6
1.6
2.5
1.4
20
19
22
16
17
10
11
9
10
13
21
12
16
15
18
8
11
7
7
11
9
9
16
10
18
17
18
6
9
7
6
12
9
9
14
9
48
47
48
45
40
35
37
21
17
38
47
32
45
43
47
35
33
22
27
18
13
29
43
26
40
38
43
26
25
15
21
14
11
23
37
21
45
47
43
52
49
59
60
67
71
55
44
59
50
51
48
63
58
66
68
68
76
62
50
65
46
46
46
68
63
71
72
67
79
65
52
67
5.4
5.1
5.8
3.2
3.2
1.9
2.5
1.7
1.6
2.9
4.9
2.6
36
31
41
58
28
42
77
63
77
43
27
49
4.8
4.7
4.9
4.4
3.7
3.9
3.3
2.0
1.1
3.8
4.9
2.7
4.3
4.3
4.4
2.9
2.8
3.4
2.2
0.2
0.9
3.0
4.4
2.2
1970 1990 2004
1970 1990 2004
1970-1990 1990-2004
SUMMARY INDICATORS
Sub-Saharan Africa
Eastern and Southern Africa
Western and Central Africa
Middle East and North Africa
South Asia
East Asia and Pacific
Latin America and Caribbean
CEE/CIS
Industrialized countries
Developing countries
Least developed countries
World
354355
174309
180046
153626
584389
579131
199054
106302
205133
1925281
361520
2181991
Countries in each category are listed on page 132.
DEFINITIONS OF THE INDICATORS
Life expectancy at birth – The number of years newborn children would live if subject to the
mortality risks prevailing for the cross-section of population at the time of their birth.
Crude death rate – Annual number of deaths per 1,000 population.
Crude birth rate – Annual number of births per 1,000 population.
Total fertility rate – Number of children that would be born per woman if she were to live to
the end of her childbearing years and bear children at each age in accordance with prevailing
age-specific fertility rates.
MAIN DATA SOURCES
Child population – United Nations Population Division.
Crude death and birth rates – United Nations Population Division.
Life expectancy – United Nations Population Division.
Fertility – United Nations Population Division.
Urban population – United Nations Population Division.
Urban population – Percentage of population living in urban areas as defined according to the
national definition used in the most recent population census.
NOTES
-
Data not available.
S TAT I S T I C A L TA B L E S
121
TABLE 7. ECONOMIC INDICATORS
Countries and territories
1970-1990
Afghanistan
Albania
Algeria
Andorra
Angola
Antigua and Barbuda
Argentina
Armenia
Australia
Austria
Azerbaijan
Bahamas
Bahrain
Bangladesh
Barbados
Belarus
Belgium
Belize
Benin
Bhutan
Bolivia
Bosnia and Herzegovina
Botswana
Brazil
Brunei Darussalam
Bulgaria
Burkina Faso
Burundi
Cambodia
Cameroon
Canada
Cape Verde
Central African Republic
Chad
Chile
China
Colombia
Comoros
Congo
Congo, Democratic Republic of the
Cook Islands
Costa Rica
Côte d’Ivoire
Croatia
Cuba
Cyprus
Czech Republic
Denmark
Djibouti
Dominica
Dominican Republic
Ecuador
Egypt
El Salvador
Equatorial Guinea
Eritrea
Estonia
Ethiopia
Fiji
250x
2080
2280
d
1030
10000
3720
1120
26900
32300
950
14920x
10840x
440
9270x
2120
31030
3940
530
760
960
2040
4340
3090
24100x
2740
360
90
320
800
28390
1770
310
260
4910
1290
2000
530
770
120
4670
770
6590
1170x
17580
9150
40650
1030
3650
2080
2180
1310
2350
c
180
7010
110
2690
0.7x
-0.6x
1.7
0.4x
6.3x
-0.7
1.5
2.5
1.9
-1.9x
0.5
1.8
2.2
2.9
0.3
5.4x
-1.1
8.1
2.3
3.4x
1.3
1.4
3.4
2.0
-1.2
-0.9
1.5
6.6
2.0
0.2x
3.0
-2.3
0.5
-1.3
6.2x
1.5
4.7x
2.0
1.3
4.2
-1.8
1.5x
0.6
122
1990-2004
Average
annual
rate of
inflation
(%)
1990-2004
% of
population
below $1
a day
1993-2003*
health
education
defence
ODA inflow
in millions
US$
2003
5.2
0.8
0.7
1.6
1.0
3.6
2.5
1.8
-1.3
0.3x
1.9x
3.1
1.4x
1.6
1.8
2.2
2.1
3.6
1.3
11.7x
2.9
1.2
1.0
1.8
-3.1
4.1x
0.4
2.3
3.3
-0.5
0.9
3.9
8.4
0.4
-0.9
-1.2
-5.8
2.6
-0.6
2.3
3.5x
3.1
1.7
1.9
-3.0
1.1
4.0
0.3
2.4
1.9
16.3
0.8x
3.7
2.0
1.7
24
14
460
2
5
103
2
2
101
3x
1x
4
3x
225
2
1
7
8
7
3x
8
103
68
5
12
3x
4
2
4
4
7
7
5
17
4
7
523
14
7
46
4
9
2
3
2
10
4
7
6
17
11x
32
5
3
<2
<2
3
13
4
36
<2
14
31
8
5
45
55
34
17
67
<2
17
8
2
11
<2
<2
<2
18
3
31
<2
23
-
4
4
6x
5
14
13
1
16
7
7
4
15
8
6x
11
10
5
6
12
7x
2
3
3
8x
14
0
9
0
21
4x
16
23x
6
17
1
13
11x
3
13
16
6
9
2
24
15x
4
9
10
3
20
13
18
4
3
20
31x
17
23
26
6
5
17x
15
12
2
8x
18
2
20
0
22
21x
8
10x
12
9
13
17
18x
15
15
7
16
18
4
17
34x
3
7
2
11
3
14
10
5
3
5
17x
0
6
8
3
7
14x
23
10
6
6
12
13
18
0
4x
5
4
5
5
6
13x
9
3
5
9
6
1533
342
232
499
5
109
247
297
38
1393
20
12
294
77
930
539
30
296
451
224
508
884
144
50
247
76
1325
802
24
70
5381
6
28
252
121
70
78
11
69
176
894
192
21
307
1504
51
GDP per capita
average annual
growth rate (%)
GNI per
capita
(US$)
2004
T H E S TAT E O F T H E W O R L D ’ S C H I L D R E N 2 0 0 6
% of central government
expenditure allocated to:
(1993-2004*)
ODA inflow
as a % of
recipient
GNI
2003
6
0
5
1
0
8
4
3
1
10
13
12
8
1
0
13
32
12
9
21
5
12
0
0
1
9
3
100
0
2
1
12
5
0
1
1
1
36
24
3
Debt service
as a % of
exports of
goods and services
1990
2003
4x
62
7
30
17
14
6
7
5
31
4
19
5x
6
41
18
5
8
2
20
10
39
2
32
5x
21
26
4
7
27
18
14
3
33
12
2
19
15
20
6
5
5
5
1
24
6
5
20
4
1
48
9
10
63
0
11
5
12
7
31
7
43
3x
3
0
9
7
20
9
4
13
7
25
11
8
0
13
16
6
6
…TABLE 7
Finland
France
Gabon
Gambia
Georgia
Germany
Ghana
Greece
Grenada
Guatemala
Guinea
Guinea-Bissau
Guyana
Haiti
Holy See
Honduras
Hungary
Iceland
India
Indonesia
Iran (Islamic Republic of)
Iraq
Ireland
Israel
Italy
Jamaica
Japan
Jordan
Kazakhstan
Kenya
Kiribati
Korea, Democratic People’s Republic of
Korea, Republic of
Kuwait
Kyrgyzstan
Lao People’s Democratic Republic
Latvia
Lebanon
Lesotho
Liberia
Libyan Arab Jamahiriya
Liechtenstein
Lithuania
Luxembourg
Madagascar
Malawi
Malaysia
Maldives
Mali
Malta
Marshall Islands
Mauritania
Mauritius
Mexico
Micronesia (Federated States of)
Moldova, Republic of
Monaco
Mongolia
Morocco
1990-2004
Average
annual
rate of
inflation
(%)
1990-2004
% of
population
below $1
a day
1993-2003*
health
education
2.5
1.6
-0.4
0.2
-0.7
1.2
1.9
2.2
2.3
1.0
1.6
-2.5
3.3
-2.8
0.3
2.7
2.2
4.1
2.1
2.3
6.5
1.5
1.4
0.0
1.0
1.1
1.3
-0.6
2.5
4.5
-2.3x
-1.7
3.7
2.9
2.9
2.3
3.7
1.2
3.5
-0.8
0.9
3.3
4.6x
2.5
3.0
1.7
3.9
1.4
-1.4
-4.6
-1.8
1.1
2
1
5
7
156
2
26
7
2
9
6
20
9
19
15
16
4
7
16
24
4
8
3
17
-1
2
104
12
2
5
3x
64
28
28
11
9
50
40
3
15
30
3
1x
6
3
4
6
6
16
2
70
40
2
54x
3
45
16
<2
21
<2
35
8
<2
<2
<2
<2
23
<2
<2
26
<2
36
36
<2
61
42
<2
72
26
10
22
27
<2
3
16x
7x
5
19
7
7
10
11
3x
1x
10x
6
26
2
1
7
16
13
11x
7
2
10
3
7
0
7
11
11
2
9
5x
12
13
8
7x
6
11
2x
11
4x
8
5
6
6
3
10
7x
12x
5
0
22
11
17
17
11x
3x
19x
5
10
2
4
7
14
15
8x
15
6
16
3
26
18
15
20
7
7
27
11x
7
10
21
12x
23
18
9x
12
23x
16
25
9
9
18
GDP per capita
average annual
growth rate (%)
GNI per
capita
(US$)
2004
1970-1990
32790
30090
3940
290
1040
30120
380
16610
3760
2130
460
160
990
390
1030
8270
38620
620
1140
2300
2170x
34280
17380
26120
2900
37180
2140
2260
460
970
a
13980
16340x
400
390
5460
4980
740
110
4450
d
5740
56230
300
170
4650
2510
360
12250
2370
420
4640
6770
1990
710
d
590
1520
2.9
2.1
-0.1
0.9
3.2
2.2x
-2.2
1.3
4.9x
0.2
-0.2
-1.5
0.0
0.6
2.9
3.2
2.2
4.7
-3.5x
-4.3
2.8
1.9
2.6
-1.3
3.0
2.5x
1.3
-5.3
6.2
-6.8x
3.3
4.2
-4.6
-4.8x
2.7
-2.2
0.3
4.0
-0.3
6.5
-0.6
5.1x
1.7
1.9x
2.1
defence
ODA inflow
in millions
US$
2003
ODA inflow
as a % of
recipient
GNI
2003
4
6x
4x
5
4
5
8
0
11
29x
4x
7x
3
0
14
3
10
3
20
4x
2
4
19
6
6
13
17
10
4
11
7
9x
5
1
0
5x
11
9
8x
2
1
3
2
9
13
-11
60
220
907
12
247
238
145
87
200
389
942
1743
133
2265
3
1234
268
483
18
167
-55x
198
299
228
79
107
7x
539
498
109
18
528
-9
56
243
-15
103
115
117
247
523
0
14
6
14
3
1
7
72
13
6
6
0
1
0
0
13
1
4
21
0x
12
16
1
8
24
11
27
0
3
15
39
21
0
0
44
5
21
1
% of central government
expenditure allocated to:
(1993-2004*)
Debt service
as a % of
exports of
goods and services
1990
2003
4
18
21
2
11
18
21
4
30
30
25
31
1
20
18
26
10x
8
1
4
32
23
12
4
8
0x
24
6
16
18
11
3
9
14
18
7
13
11
6
3
10
29
18
23
4
16
15
34
15
22
10
12
8
17
63
8
0
66
6
6
8
3
5
3
20
5
21
8
31
23
S TAT I S T I C A L TA B L E S
123
TABLE 7. ECONOMIC INDICATORS
Mozambique
Myanmar
Namibia
Nauru
Nepal
Netherlands
New Zealand
Nicaragua
Niger
Nigeria
Niue
Norway
Occupied Palestinian Territory
Oman
Pakistan
Palau
Panama
Papua New Guinea
Paraguay
Peru
Philippines
Poland
Portugal
Qatar
Romania
Russian Federation
Rwanda
Saint Kitts and Nevis
Saint Lucia
Saint Vincent and the Grenadines
Samoa
San Marino
Sao Tome and Principe
Saudi Arabia
Senegal
Serbia and Montenegro
Seychelles
Sierra Leone
Singapore
Slovakia
Slovenia
Solomon Islands
Somalia
South Africa
Spain
Sri Lanka
Sudan
Suriname
Swaziland
Sweden
Switzerland
Syrian Arab Republic
Tajikistan
Tanzania, United Republic of
Thailand
The former Yugoslav Republic of Macedonia
Timor-Leste
Togo
Tonga
124
1990-2004
Average
annual
rate of
inflation
(%)
1990-2004
% of
population
below $1
a day
1993-2003*
health
education
4.8
5.7x
0.9
2.0
2.0
2.1
0.9
-0.6
0.2
2.8
-6.0x
0.9
1.1
0.0x
2.5
0.0
-0.7
2.1
1.3
4.2
2.1
1.0
-0.7
0.9
2.9
0.3
1.9
2.2
0.0
-0.5
1.4
4.1x
1.7
-2.5
3.5
2.6
3.1
-2.6
0.4
2.4
3.3
3.3
0.9
0.2
2.1
0.6
1.3
-5.1
1.3
2.9
-0.5
0.3
2.0
23
25x
10
7
2
2
26
5
23
3
9x
2x
10
2x
3
8
11
16
8
17
5
72
95
10
3
2
3
4
37
2
4
51x
2
22
1
9
19
8
9
4
9
44
64
12
2
1
6
136
16
3
43
5
4
38
35
39
45
61
70
13
7
16
18
16
<2
<2
<2
<2
52
22
57x
<2
<2
11
8
8
7
49x
<2
<2
-
5x
3
10x
5
10
17
13
1x
16
7
1
18
7
7
13
2
2
9x
15
1
5x
12
6x
3
6
10x
6
20
15
1x
15
6
1
8
3
0
2
2
6x
11
5x
7x
10x
8
22x
18
11
21
15
3x
6
15
2
16
22
22
7
19
5
11x
6
3
26x
16
14x
14
10
13x
23
3
14
2x
2
10
8
20
6
3
9
4
8x
23
20x
13x
GDP per capita
average annual
growth rate (%)
GNI per
capita
(US$)
2004
1970-1990
250
220x
2370
260
31700
20310
790
230
390
52030
1110x
7830x
600
6870
4450
580
1170
2360
1170
6090
14350
12000x
2920
3410
220
7600
4310
3650
1860
d
370
10430
670
2620
8090
200
24220
6480
14810
550
130x
3630
21210
1010
530
2250
1660
35770
48230
1190
280
330
2540
2350
550
380
1830
-1.6x
1.6
-2.0x
1.3
1.5
0.8
-3.9
-2.2
-1.6
3.4
3.6
3.0
0.3
-0.8
2.9
-0.6
0.8
2.6
0.9x
1.4
6.3x
5.3x
3.2
0.0x
-1.2
-0.4
2.9
-0.4
5.7
3.4
-1.0
0.1
1.9
3.2
0.3
-2.2x
2.1
1.8
1.1
2.2
4.7
-0.2
-
T H E S TAT E O F T H E W O R L D ’ S C H I L D R E N 2 0 0 6
defence
ODA inflow
in millions
US$
2003
ODA inflow
as a % of
recipient
GNI
2003
35x
29
7x
10
4
3
6
3x
5
33
18
0
4
11
5
4
6x
5
11
0
36x
7
4
10x
29
5
3
38x
4
18
28
8
6
6
24
9
16x
7
11x
-
1033
126
146
16
467
833
453
318
9
972
45
1068
26
30
221
51
500
737
332
29x
34x
5x
33
38
22
450
1317
9
297
-10
60
175
625
672
621
11
27
160
144
1669
-966
234
151
45
27
27
4
8
21
19
1
26
2
17
0
8
1
1
1
18
10x
5x
1x
12
76
8
8
1
37
0
22
0
4
4
2
1
12
16
-1
6
43
3
18
% of central government
expenditure allocated to:
(1993-2004*)
Debt service
as a % of
exports of
goods and services
1990
2003
21
17
12
2
12
22
12
16
3
37
12
6
23
4
0
10
3
2
3
5
28
14
8
8
10
10x
25x
10
4
6
20
25
14
8
2
6
4
6
11
6
8
10
12
11
12
10
20
20
25
17
10
13
34
7
7
5
31
9
13
14
11
13
16
7
9
7
0
2
3
7
4
15
12
0
2
…TABLE 7
Trinidad and Tobago
Tunisia
Turkey
Turkmenistan
Tuvalu
Uganda
Ukraine
United Arab Emirates
United Kingdom
United States
Uruguay
Uzbekistan
Vanuatu
Venezuela
Viet Nam
Yemen
Zambia
Zimbabwe
1990-2004
Average
annual
rate of
inflation
(%)
1990-2004
% of
population
below $1
a day
1993-2003*
health
education
3.5
3.2
1.4
0.2
3.8
-3.5
-2.1x
2.5
2.1
0.8
-0.1
-0.8
-1.3
5.8
2.1
-0.6
-0.8x
5
4
65
191
8
134
3x
3
2
22
144
3
38
11
18
39
32x
4x
<2
<2
12
85
3
<2
17
14
<2
16
64
56
9
6
3
2x
3
8
15
23
7
6
4
4
13
8
15
20
10
15x
7
18
4
3
8
20
14
22
14
24
0.6
0.7
0.2
1.2
3.7
6.2
1.3
0.1
1.9
3.5
1.8
2.1
36
35
38
10
7
6
40
90
2
20
59
7
45
38
55
3
33
14
10
4
22
41
21
5
2
1
7
4
16
4
6
13
14
4
9
16
5
4
11
16
5
GDP per capita
average annual
growth rate (%)
GNI per
capita
(US$)
2004
1970-1990
8580
2630
3750
1340
270
1260
18060x
33940
41400
3950
460
1340
4020
550
570
450
480x
0.5
2.5
1.9
-4.8x
2.0
2.2
0.9
-0.6x
-1.6
-2.2
-0.3
611
836
399
2308
600
1686
3649
2667
32232
1524
345
6298
0.0
-0.5
0.4
2.1
5.6
1.4
2.3
2.6
-0.1
2.4
Debt service
as a % of
exports of
goods and services
defence
ODA inflow
in millions
US$
2003
ODA inflow
as a % of
recipient
GNI
2003
1990
2003
2
5
8
26x
5
31
7
19
4
7
19
4
7
-2
306
166
27
6
959
17
194
32
82
1769
243
560
186
0
1
0
0
16
0
2
13
0
5
2
14
-
18
22
27
47
31
2
22
7x
4
13
20
4
13
34
30
5
12
21
21
1
30
3
3
22
6
13
14
12
4
9
11
10
13
11
21505
9893
11612
7994
6170
6891
5359
49680
23457
52331
7
5
10
2
1
0
0
1
13
0
17
14
19
20
21
16
20
19
12
18
9
9
11
16
10
26
17
16
7
16
% of central government
expenditure allocated to:
(1993-2004*)
SUMMARY INDICATORS
Sub-Saharan Africa
Eastern and Southern Africa
Western and Central Africa
Middle East and North Africa
South Asia
East Asia and Pacific
Latin America and Caribbean
CEE/CIS
Industrialized countries
Developing countries
Least developed countries
World
Countries in each category are listed on page 132.
DEFINITIONS OF THE INDICATORS
MAIN DATA SOURCES
GNI per capita – Gross national income (GNI) is the sum of value added by all resident producers
plus any product taxes (less subsidies) not included in the valuation of output plus net receipts of
primary income (compensation of employees and property income) from abroad. GNI per capita is
gross national income divided by mid-year population. GNI per capita in US dollars is converted
using the World Bank Atlas method.
GDP per capita – Gross domestic product (GDP) is the sum of value added by all resident producers
plus any product taxes (less subsidies) not included in the valuation of output. GDP per capita is
gross domestic product divided by mid-year population. Growth is calculated from constant price
GDP data in local currency.
% of population below $1 a day – Percentage of population living on less than $1.08 a day at
1993 international prices (equivalent to $1 a day in 1985 prices, adjusted for purchasing power
parity). As a result of revisions in purchasing power parity exchange rates, poverty rates for
individual countries cannot be compared with poverty rates reported in previous editions.
GNI per capita – World Bank.
GDP per capita – World Bank.
Rate of inflation – World Bank.
% of population below $1 a day – World Bank.
Expenditure on health, education and defence – International Monetary Fund (IMF).
ODA – Organisation for Economic Co-operation and Development (OECD).
Debt service – World Bank.
ODA – Net official development assistance.
Debt service – The sum of interest payments and repayments of principal on external public
and publicly guaranteed long-term debts.
NOTES
a: Range $825 or less.
b: Range $826 to $3255.
c: Range $3256 to $10065.
d: Range $10066 or more.
- Data not available.
x Indicates data that refer to years or periods other than those specified in the column heading, differ from the
standard definition or refer to only part of a country.
* Data refer to the most recent year available during the period specified in the column heading.
S TAT I S T I C A L TA B L E S
125
TABLE 8. WOMEN
Maternal mortality ratio†
Gross enrolment ratios:
females as a % of males
Countries and territories
Afghanistan
Albania
Algeria
Andorra
Angola
Antigua and Barbuda
Argentina
Armenia
Australia
Austria
Azerbaijan
Bahamas
Bahrain
Bangladesh
Barbados
Belarus
Belgium
Belize
Benin
Bhutan
Bolivia
Bosnia and Herzegovina
Botswana
Brazil
Brunei Darussalam
Bulgaria
Burkina Faso
Burundi
Cambodia
Cameroon
Canada
Cape Verde
Central African Republic
Chad
Chile
China
Colombia
Comoros
Congo
Congo, Democratic Republic of the
Cook Islands
Costa Rica
Côte d’Ivoire
Croatia
Cuba
Cyprus
Czech Republic
Denmark
Djibouti
Dominica
Dominican Republic
Ecuador
Egypt
El Salvador
Equatorial Guinea
Eritrea
Estonia
Ethiopia
Fiji
126
Life expectancy:
females as a
% of males
2004
Adult literacy rate:
females as a
% of males
2000-2004*
101
108
104
107
111
110
107
108
112
109
104
103
110
119
108
107
103
104
107
108
100
112
106
110
103
104
114
102
106
109
104
105
108
105
109
107
105
105
106
103
110
105
107
109
106
104
111
108
106
109
102
107
117
104
107
99
76
66
100
99
99
90
62
100
99
100
50
86
93
108
101
95
99
42
78
75
78
80
51
32
100
92
101
78
87
65
100
63
98
100
96
99
98
66
94
83
100
69
97
primary school
2000-2004*
gross
net
53
97
92
100
86
99
97
100
100
97
101
100
104
99
98
99
98
72
99
100
95
100
98
74
80
90
85
101
95
68
64
98
100
99
83
93
90x
99
80
99
96
101
98
100
79
93
102
100
95
94
91
81
96
77
100
98
98
102
86x
98
101
102
98
104
102
105
100
99
100
102
68
100
105
93
99
74
84
95
100
98
68
99
100
99
85
96
101
81
99
99
100
100
100
80
95
95
101
97
100
86
86
99
85
100
secondary school
2000-2004*
gross
net
100
108
105
81
106
102
97
95
96
103
106
111
102
102
110
105
45
97
107
110
106
97
64
69
65
82
99
109
32
101
97
110
82
73
54
108
55
102
98
101
102
105
69
111
123
102
93
100
58
65
103
57
106
T H E S TAT E O F T H E W O R L D ’ S C H I L D R E N 2 0 0 6
103
106
107
106
104
102
100
97
104
107
112
100
104
101
106
48
99
114
108
98
64
80
63
101
111
33
101
109
110
56
101
100
103
103
104
68
114
137
102
95
102
58
72
103
57
108
Contraceptive
prevalence
(%)
1996-2004*
10
75
57
6
53
74x
61
76x
51
55
62x
62x
59
55
50x
78x
56
19
31
58
48
48
77
42
14
16
24
26
75x
53
28
8
56x
87
77
26
31
44
80
15
73
72
78x
50
70
66
60
67
8
70x
8
44
Antenatal
care
coverage
(%)
1996-2004*
16
91
81
66
100
98
92
100x
100x
66
97x
49
89
100
96
81
79
99
97
86
100x
73
78
38
83
99
62
42
95x
89
91
74
68
70
88
100
99x
67
100
99
69
69
86
86
70
27
-
Skilled
attendant
at delivery
(%)
1996-2004*
14
98
96
45
100
99
97
100
100x
84
99
98x
13
98
100
100x
83
66
37
67
100
94
96
99
99
38
25
32
62
98
89
44
16
100
96
86
62
61
98
98
68
100
100
100x
100
100x
61
100
99
69
69
92
65
28
100
6
99
2000
1990-2004*
reported
adjusted
Lifetime
risk of
maternal
death. 1 in:
1600
23
120
65
44
9
25
46
380
0
18
140
500
260
230
10
330
64
0
15
480
440
430
76
1100
830
17
51
78
520x
1300
6
33
600
2
34
0
3
10
74
67
180
80
84
170
1000
46
870
38
1900
55
140
1700
82
55
8
4
94
60
28
380
95
35
10
140
850
420
420
31
100
260
37
32
1000
1000
450
730
6
150
1100
1100
31
56
130
480
510
990
43
690
8
33
47
9
5
730
150
130
84
150
880
630
63
850
75
6
610
190
7
410
1200
5800
16000
520
580
1200
59
590
1800
5600
190
17
37
47
1900
200
140
830
2400
12
12
36
23
8700
160
15
11
1100
830
240
33
26
13
690
25
6100
1600
890
7700
9800
19
200
210
310
180
16
24
1100
14
360
…TABLE 8
Maternal mortality ratio†
Gross enrolment ratios:
females as a % of males
Life expectancy:
females as a
% of males
2004
Finland
France
Gabon
Gambia
Georgia
Germany
Ghana
Greece
Grenada
Guatemala
Guinea
Guinea-Bissau
Guyana
Haiti
Holy See
Honduras
Hungary
Iceland
India
Indonesia
Iran (Islamic Republic of)
Iraq
Ireland
Israel
Italy
Jamaica
Japan
Jordan
Kazakhstan
Kenya
Kiribati
Korea, Democratic People’s Republic of
Korea, Republic of
Kuwait
Kyrgyzstan
Lao People’s Democratic Republic
Latvia
Lebanon
Lesotho
Liberia
Libyan Arab Jamahiriya
Liechtenstein
Lithuania
Luxembourg
Madagascar
Malawi
Malaysia
Maldives
Mali
Malta
Marshall Islands
Mauritania
Mauritius
Mexico
Micronesia (Federated States of)
Moldova, Republic of
Monaco
Mongolia
Morocco
109
109
102
105
112
108
102
107
112
101
106
110
103
106
112
105
105
106
104
105
107
105
108
105
109
104
119
96
110
110
106
113
105
117
106
106
105
106
117
108
105
99
107
99
103
106
106
110
107
102
111
106
106
Adult literacy rate:
females as a
% of males
2000-2004*
73
94
84
93
100
100
66
90
83
98
108
89
99
90
95
99
79
100
122
54
77
100
86
72
92
100
44
103
72
92
97
98
100
60
primary school
2000-2004*
gross
net
100
99
99
98
99
99
91
100
98
93
77
67
98
102
99
99
94
98
97
83
100
100
99
99
100
100
99
95
117
99
101
98
87
98
97
102
73
100
99
100
96
96
100
98
76
99
94
98
101
99
100
102
90
100
100
99
99
99
102
82
100
90
97
79
70
98
101
99
99
94
99
97
85
102
100
99
101
100
102
99
100
100
102
97
93
99
99
107
77
100
101
101
100
101
78
100
99
99
102
101
100
103
95
secondary school
2000-2004*
gross
net
111
101
86
68
100
98
81
99
96
93
45
57
104
100
108
81
98
94
70
110
98
99
102
100
102
100
94
113
101
106
101
74
100
109
130
70
106
99
106
93x
78
110
115
56
100
101
80
100
109
104
115
84
101
102
69
98
100
85
102
102
97
46
55
108
100
105
100
65
109
100
101
104
101
103
100
96
100
105
84
100
150
57
100
108
109x
81
112
115
102
103
78
100
105
103
115
87
Contraceptive
prevalence
(%)
1996-2004*
77x
75x
33
18
41
75x
25
54
43
7
8
37
27
62
77x
47
57
74
44
68x
60
66
59x
56
66
39
21
62x
81
50
60
32
48x
63
30
10
45x
47x
27
31
55x
39
8
34
8
76
73
45
62
69
63
Antenatal
care
coverage
(%)
1996-2004*
100x
99x
94
91
95
92
98
84
84
62
81
79
83
60
92
77
77
99
99
91
88
88x
95
97
27
87x
85
85
81x
80
94
74
81
57
64
86x
99
94
68
Skilled
attendant
at delivery
(%)
1996-2004*
100
99x
86
55
96
100x
47
100
41
56
35
86
24
56
100
43
72
90
72
100
99x
97
100
100
99
42
85
97
100
98
98
19
100
89
60
51
94x
100
100
51
61
97
70
41
98x
95
57
98
95
88
99
97
63
2000
1990-2004*
reported
adjusted
Lifetime
risk of
maternal
death. 1 in:
6
10
520
730
52
8
210x
1
1
150
530
910
190
520
110
5
540
310
37
290
6
5
7
110
8
41
50
410
56
110
20
5
44
530
25
100x
580x
77
13
0
470
1100
30
140
580
750
22
65
120
44
99
230
6
17
420
540
32
8
540
9
240
740
1100
170
680
110
16
0
540
230
76
250
5
17
5
87
10
41
210
1000
67
20
5
110
650
42
150
550
760
97
13
28
550
1800
41
110
1200
0
1000
24
83
36
110
220
8200
2700
37
31
1700
8000
35
7100
74
18
13
200
29
190
4000
0
48
150
370
65
8300
1800
13900
380
6000
450
190
19
590
2800
6000
290
25
1800
240
32
16
240
4900
1700
26
7
660
140
10
0
14
1700
370
1500
300
120
S TAT I S T I C A L TA B L E S
127
TABLE 8. WOMEN
Maternal mortality ratio†
Gross enrolment ratios:
females as a % of males
Mozambique
Myanmar
Namibia
Nauru
Nepal
Netherlands
New Zealand
Nicaragua
Niger
Nigeria
Niue
Norway
Occupied Palestinian Territory
Oman
Pakistan
Palau
Panama
Papua New Guinea
Paraguay
Peru
Philippines
Poland
Portugal
Qatar
Romania
Russian Federation
Rwanda
Saint Kitts and Nevis
Saint Lucia
Saint Vincent and the Grenadines
Samoa
San Marino
Sao Tome and Principe
Saudi Arabia
Senegal
Serbia and Montenegro
Seychelles
Sierra Leone
Singapore
Slovakia
Slovenia
Solomon Islands
Somalia
South Africa
Spain
Sri Lanka
Sudan
Suriname
Swaziland
Sweden
Switzerland
Syrian Arab Republic
Tajikistan
Tanzania, United Republic of
Thailand
The former Yugoslav Republic
of Macedonia
Timor-Leste
128
Contraceptive
prevalence
(%)
1996-2004*
Antenatal
care
coverage
(%)
1996-2004*
Skilled
attendant
at delivery
(%)
1996-2004*
Life expectancy:
females as a
% of males
2004
Adult literacy rate:
females as a
% of males
2000-2004*
103
110
101
101
107
106
107
100
101
106
104
104
101
107
102
107
108
106
111
109
107
111
122
108
104
108
109
103
106
104
107
107
105
111
110
102
105
105
110
107
105
110
100
106
107
105
108
101
111
50
91
95
56
100
45
80
91
79
56
98
81
97
88
100
98
99
84
101
99
79
57
95
101
53
92
100
100
96
97
72
91
98
81
99
79
96
82
101
101
103x
89
98
99
99
71
81
94
100
100
99
71
97
96
89
96
99
99
99
95
97
98
100
100
106
99
97
97
94
96
93
100
99
70
99
99
96
98
99
88
98
92
103
99
95
96
97
96
91
101
107
103x
88
99
99
99
69
81
99
100
100
100
74
96
99
87
100
100
102
100
99
99
99
101
104
111
101
100
97
94
98
89
100
99
101
99
100
99
84
102
100
99
100
96
94x
98
97
68
95
112
108x
78
98
106
118
75
80
98
103
106
96
73
100
107
79
103
92
110
95
109
104
101
83
132
125
111
108
86
90
70
101
100
71
101
99
108
106
106
84
135
102
119
94
92
83
83
100
71
94
128
101
102
117
71
81
98
101
105
101
110
78
106
97
120
103
110
106
104
106
125
109
110
81
96
100
100
101
108
104
137
124
101
94
93
84
80x
-
17
34
44
38
79x
75x
69
14
13
74x
51
32
28
17
58x
26
57
69
49
49x
66x
43
64
13
41
47
58
30x
29
32
11
58
4
74x
74x
74x
11
1x
56
81x
70
7
42
48
78x
82x
48
34
26
79
85
76
91
28
95x
86
41
58
96
100
43
72
78
94
84
88
94x
92
100x
100x
99
91
90
79
68
98x
32
94
95
60
91
90
71
71
94
92
48
57
76
15
100
100x
67
16
35
100
100x
97
95
23
100
93
41
77
59
60
100
100
99
99
99
31
99
100
100
100
76
91
58
93
42
100
99
100
85
25
84
96
87
85
74
100x
77x
71
46
99
107
104
96
-
101
-
100
-
98
-
98
-
10
81
61
99
18
primary school
2000-2004*
gross
net
secondary school
2000-2004*
gross
net
T H E S TAT E O F T H E W O R L D ’ S C H I L D R E N 2 0 0 6
2000
1990-2004*
reported
adjusted
Lifetime
risk of
maternal
death. 1 in:
410
230
270
540
7
15
83
590
6
23
530
0x
70
370x
180
190
170
4
8
10
31
32
1100
250
35
93
100
560
7
57
1800
6
16
17
550x
150
6
92
550
150
230
5
5
65
45
580
24
1000
360
300
740
16
7
230
1600
800
16
100
87
500
160
300
170
410
200
13
5
140
49
67
1400
130
23
690
11
2000
30
3
17
130
1100
230
4
92
590
110
370
2
7
160
100
1500
44
14
75
54
24
3500
6000
88
7
18
2900
140
170
31
210
62
120
73
120
4600
11100
170
1300
1000
10
150
610
22
4500
6
1700
19800
4100
120
10
120
17400
430
30
340
49
29800
7900
130
250
10
900
23
660
2100
30
7
-
…TABLE 8
Maternal mortality ratio†
Gross enrolment ratios:
females as a % of males
Contraceptive
prevalence
(%)
1996-2004*
Antenatal
care
coverage
(%)
1996-2004*
Skilled
attendant
at delivery
(%)
1996-2004*
Life expectancy:
females as a
% of males
2004
Adult literacy rate:
females as a
% of males
2000-2004*
107
104
109
106
107
115
102
120
106
106
107
110
110
106
108
106
105
97
97
56
100
99
78
84
99
75
99
107
101
99
100
93
42
79
91
83
97
98
96
93
114
98
100
97
100
100
98
99
100
98
92
69
93
98
84
100
99
100
94
100
98
100
101
101
102
101
94
70
99
101
43
116
109
108
74
93
82
99
104
125
100
113
97
107
115
93
45
83
92
47
115
109
111
94
101
103
103
101
110
104
116
45
84
94
26
33
38
66
71
62
32
23
89
28x
82x
76x
84
68
28
77
79
23
34
54
85
92
92
81
98
92
97x
99x
94
97
94
86
41
93
93
61
95
96
90
83
97
100
39
100
99x
99
99
100
96
88
94
85
27
43
73
76
80
70
74
64
91
98
97
84
71
86
87
91
81
91
92
99
98
97
100
94
88
94
90
96
83
93
93
100
99
98
101
94
92
97
79
88
74
90
85
99
107
91
103
93
81
95
83
86
80
92
102**
106
101
98**
87
100**
23
28
17
52
46
79
72
69
60
28
60
69
72
66
71
54
87
87
86
71
59
71
42
39
45
76
36
86
87
93
99
59
35
63
Togo
Tonga
Trinidad and Tobago
Tunisia
Turkey
Turkmenistan
Tuvalu
Uganda
Ukraine
United Arab Emirates
United Kingdom
United States
Uruguay
Uzbekistan
Vanuatu
Venezuela
Viet Nam
Yemen
Zambia
Zimbabwe
primary school
2000-2004*
gross
net
secondary school
2000-2004*
gross
net
2000
1990-2004*
reported
adjusted
Lifetime
risk of
maternal
death. 1 in:
480
45
69
130x
14
510
13
3
7
8
26
34
68
68
170
370
730
700
570
160
120
70
31
880
35
54
13
17
27
24
130
96
130
570
750
1100
26
330
320
480
790
13
2000
500
3800
2500
1300
1300
140
300
270
19
19
16
940
980
900
220
560
110
190
64
13
440
890
400
16
15
16
100
43
360
160
770
4000
61
17
74
SUMMARY INDICATORS
Sub-Saharan Africa
103
Eastern and Southern Africa
103
Western and Central Africa
103
Middle East and North Africa
105
South Asia
104
East Asia and Pacific
106
Latin America and Caribbean
109
CEE/CIS
115
Industrialized countries
108
Developing countries
106
Least developed countries
104
World
106
Countries in each category are listed on page 132.
DEFINITIONS OF THE INDICATORS
Life expectancy at birth – The number of years newborn children would live if subject to
the mortality risks prevailing for the cross-section of population at the time of their birth.
Adult literacy rate – Percentage of persons aged 15 and over who can read and write.
-
MAIN DATA SOURCES
Life expectancy – United Nations Population Division.
Adult literacy – United Nations Educational, Scientific and Cultural Organization (UNESCO).
School enrolment – UIS (UNESCO Institute of Statistics) and UNESCO.
Net enrolment ratios: females as a % of males – Girls’ net enrolment ratio divided by that of
boys, as a percentage. The net enrolment ratio is the number of children enrolled in a primary or
secondary school that belong to the age group that officially corresponds to primary or secondary
schooling, divided by the total population of the same age group.
Contraceptive prevalence – Demographic and Health Surveys (DHS), Multiple Indicator Cluster
Surveys (MICS), United Nations Population Division and UNICEF.
Contraceptive prevalence – Percentage of women in union aged 15-49 years currently using
contraception.
Skilled attendant at delivery – DHS, MICS, WHO and UNICEF.
Antenatal care – Percentage of women aged 15-49 years attended at least once during pregnancy
by skilled health personnel (doctors, nurses or midwives).
Antenatal care – DHS, MICS, World Health Organization (WHO) and UNICEF.
Maternal mortality – WHO and UNICEF.
Lifetime risk – WHO and UNICEF.
Skilled attendant at delivery – Percentage of births attended by skilled health personnel (doctors,
nurses or midwives).
Maternal mortality ratio – Annual number of deaths of women from pregnancy-related causes per
100,000 live births. This ‘reported’ column shows country reported figures that are not adjusted
for underreporting and misclassification.
Lifetime risk of maternal death – The lifetime risk of maternal death takes into account both the
probability of becoming pregnant and the probability of dying as a result of that pregnancy
accumulated across a woman’s reproductive years.
NOTES
x
*
**
† The maternal mortality data in the column headed ‘reported’ are those reported by national
authorities. Periodically, UNICEF, WHO and UNFPA evaluate these data and make adjustments
to account for the well-documented problems of underreporting and misclassification of
maternal deaths and to develop estimates for countries with no data. The column with
‘adjusted’ estimates for the year 2000 reflects the most recent of these reviews.
Data not available.
Indicates data that refer to years or periods other than those specified in the column heading, differ from the standard definition or refer to only part of a country.
Data refer to the most recent year available during the period specified in the column heading.
Excludes China.
S TAT I S T I C A L TA B L E S
129
TABLE 9. CHILD PROTECTION
Female genital mutilation/cutting 1998-2004*
Child labour (5-14 years) 1999-2004*
Countries and territories
Afghanistan
Albania
Angola
Armenia
Azerbaijan
Bahrain
Bangladesh
Benin
Bolivia
Bosnia and Herzegovina
Botswana
Brazil
Burkina Faso
Burundi
Cambodia
Cameroon
Central African Republic
Chad
Colombia
Comoros
Congo, Democratic Republic of the
Costa Rica
Côte d’Ivoire
Cuba
Dominican Republic
Ecuador
Egypt
El Salvador
Equatorial Guinea
Eritrea
Ethiopia
Gabon
Gambia
Georgia
Ghana
Guatemala
Guinea
Guinea-Bissau
Guyana
Haiti
India
Indonesia
Iraq
Jamaica
Jordan
Kazakhstan
Kenya
Korea, Democratic People’s Republic of
Kyrgyzstan
Lao People’s Democratic Republic
Lebanon
Lesotho
Liberia
Madagascar
Malawi
Maldives
Mali
Mauritania
Mexico
Moldova, Republic of
Mongolia
Morocco
Mozambique
Myanmar
Namibia
Nepal
Nicaragua
Niger
Nigeria
Occupied Palestinian Territory
Pakistan
130
Child marriage 1986-2004*
Birth registration 1999-2004*
total
male
female
total
urban
rural
total
urban
rural
34y
23
22
8
5
7
26y
21
11
7y
57y
24
51
56
57
5
28
28y
50y
35
9
6y
6
27
43y
22
57y
24y
54
19
14
4y
8
2
26
24
6
17
30
17
30
10y
16y
28
30
11y
31
10y
66
39y
-
31y
26
21
9
6
10
23y
22
12
9y
26
52
54
60
7
27
26y
71y
34
11
9y
6
27
47y
23
57y
54
21
14
5y
11
3
27
23
8
19
35
18
33
15y
29
30
30
69
-
38y
19
23
7
3
4
29y
20
10
4y
23
50
57
55
4
29
29y
29y
36
6
4y
5
27
37y
22
58y
54
17
15
4y
5
1
25
25
4
14
26
16
28
16y
28
30
33
64
-
43
19
65
37
26
10
24
52
17y
25
43
57
71
21
30
33
41
26y
19
27
47
49
34
28
34
65
24
46
24
11
14
25
21
11
48y
39
47
65
37
28y
16
56
10
56
43
77
43
32
12
44
25
22
13
22
22
36y
19
30
54
65
18
23
24
37
21y
11
31
32
30
18
25
46
18
26
15
11
12
19
19
38y
29
32
46
32
31y
12
41
9
34
36
46
27
21
31
72
45
37
9
30
62
17y
26
51
59
74
34
33
43
51
34y
24
60
53
49
39
44
75
31
55
33
12
17
27
22
58y
42
50
74
42
21y
21
66
10
60
55
86
52
37
6
99
29
97
97
7
70
82
98
58
76
75
22
79
73
25
91
83
34
72
100
75
32
89
32
95
21
67
42
97
70
35
55
98
96
48y
99
59
51
75
73
48
55
98
98
85
65y
71
34
81
46
30
98
-
12
99
34
100
98
9
78
83
98
66
71
30
94
88
53
95
87
30
88
100
82
43
90
37
97
88
32
99
78
54
69
99
95
64y
99
71
41
87
71
72
98
98
92
66y
82
37
90
85
53
98
-
4
99
19
94
96
7
66
79
99
52
75
21
73
63
18
84
83
36
60
100
66
24
87
29
92
56
47
96
66
29
43
97
96
44y
99
56
53
72
41
42
98
97
80
64y
64
34
73
40
20
97
-
T H E S TAT E O F T H E W O R L D ’ S C H I L D R E N 2 0 0 6
womena (15-49 years)
total
17
77
1.4
36
45
45
97
89
80
5
99
32
92
71
5
19
-
daughtersb
urban
rural
total
13
75
1
29
43
39
95
86
80
4
98
21
90
65
2
28
-
20
77
2
41
46
48
99
91
80
7
99
36
93
77
5
14
-
6
32
24
47
63
48
54
21
73
66
4
10
-
…TABLE 9
Female genital mutilation/cutting 1998-2004*
Child labour (5-14 years) 1999-2004*
Paraguay
Peru
Philippines
Romania
Rwanda
Sao Tome and Principe
Senegal
Sierra Leone
Somalia
South Africa
Sri Lanka
Sudan
Suriname
Swaziland
Syrian Arab Republic
Tajikistan
Tanzania, United Republic of
Thailand
Timor-Leste
Togo
Trinidad and Tobago
Tunisia
Turkey
Turkmenistan
Uganda
Uzbekistan
Venezuela
Viet Nam
Yemen
Zambia
Zimbabwe
Child marriage 1986-2004*
Birth registration 1999-2004*
womena (15-49 years)
daughtersb
total
male
female
total
urban
rural
total
urban
rural
total
urban
rural
total
8y
11
1y
31
14
33
57
32
13
8
8y
18
32
4y
60
2
34
15
7
23
11
26y
10y
12
31
15
36
57
29
14
8
10y
19
34
4y
62
3
34
18
9
23
10
-
6y
10
30
13
30
57
36
12
8
6y
17
30
4y
59
2
33
12
5
22
11
-
24
19
14
20
36
8
14y
27y
39
21y
31
34y
10y
23
9
54
13
11
48
42
29
18
12
10
21
15
5
10y
19y
23
13y
17
37y
7y
19
12
34
16
5
39
32
21
32
35
22
19
53
12
15y
34y
48
23y
41
32y
14y
30
7
59
11
13
53
49
36
93
83
65
70
62
46
64
95
53
75
6
22
82
95
4
100
92
72
10
42
93
87
61
73
82
66
82
94
72
77
22
32
93
11
100
92
16
56
92
78
66
67
51
40
46
94
50
74
3
20
78
3
100
68
6
35
90
18
23
-
92
10
26
-
88
20
22
-
58
7
20
-
37
34
41
9
14
11**
11
18**
29
18**
34
29
41
7
15
10**
8
17**
26
17**
40
36
45
46
20**
25
36**
50
36**
25
21
28
27
12**
24
22**
33
22**
48
43
56
54
25**
31
45**
57
45**
38
29
-
31
29
-
42
29
-
24
19
-
SUMMARY INDICATORS
Sub-Saharan Africa
36
Eastern and Southern Africa
32
Western and Central Africa
41
Middle East and North Africa
9
South Asia
14
East Asia and Pacific
10**
Latin America and Caribbean
11
CEE/CIS
Industrialized countries
Developing countries
18**
Least developed countries
28
World
18**
Countries in each category are listed on page 132.
38
32
41
30
65**
82
45**
32
45**
55
44
59
47
77**
92
62**
44
62**
33
28
35
25
56**
80
35**
28
35**
DEFINITIONS OF THE INDICATORS
MAIN DATA SOURCES
Child labour – Percentage of children aged 5 to 14 years of age involved in child labour activities at the moment of the survey. A child is considered to be involved
in child labour activities under the following classification: (a) children 5 to 11 years of age that during the week preceding the survey did at least one hour of
economic activity or at least 28 hours of domestic work, and (b) children 12 to 14 years of age that during the week preceding the survey did at least 14 hours of
economic activity or at least 42 hours of economic activity and domestic work combined.
Child labour – Multiple Indicator
Cluster Survey (MICS) and
Demographic and Health Surveys
(DHS).
Child labour background variables – Sex of the child; urban or rural place of residence; poorest 20% or richest 20% of the population constructed from
household assets (a more detailed description of the household wealth estimation procedure can be found at www.childinfo.org); mother’s education, reflecting
mothers with and without some level of education.
Child marriage – MICS, DHS and other
national surveys.
Birth registration – Percentage of children less than five years of age that were registered at the moment of the survey. The numerator of this indicator includes
children whose birth certificate was seen by the interviewer or whose mother or caretaker says the birth has been registered. MICS data refer to children alive at
the time of the survey.
Child marriage – Percentage of women 20-24 years of age that were married or in union before they were 18 years old.
Female genital mutilation/cutting – (a) Women – the percentage of women aged 15 to 49 years of age who have been mutilated/cut. (b) Daughters – the percentage
of women aged 15 to 49 with at least one mutilated/cut daughter. Female genital mutilation/cutting (FGM/C) involves the cutting or alteration of the female genitalia
for social reasons. Generally, there are three recognized types of FGM/C: clitoridectomy, excision and infibulation. Clitoridectomy is the removal of the prepuce with or
without excision of all or part of the clitoris. Excision is the removal of the prepuce and clitoris along with all or part of the labia minora. Infibulation is the most severe
form and consists of removal of all or part of the external genitalia, followed by joining together of the two sides of the labia minora using threads, thorns or other
materials to narrow the vaginal opening. A more detailed analysis of this data can be found at www.measuredhs.com and www.prb.org.
NOTES
y
*
**
Birth registration – MICS, DHS and
other national surveys.
Female genital mutilation/cutting –
DHS conducted during the period
1998-2004 and MICS conducted during
the period 1999-2001.
Data not available.
Indicates data that differ from the standard definition or refer to only part of a country but are included in the calculation of regional and global averages.
Data refer to the most recent year available during the period specified in the column heading.
Excludes China.
S TAT I S T I C A L TA B L E S
131
Summary indicators
Averages given at the end of each table are
calculated using data from the countries and
territories as grouped below.
Sub-Saharan Africa
Angola; Benin; Botswana; Burkina Faso;
Burundi; Cameroon; Cape Verde; Central
African Republic; Chad; Comoros; Congo;
Congo, Democratic Republic of the; Côte
d’Ivoire; Equatorial Guinea; Eritrea; Ethiopia;
Gabon; Gambia; Ghana; Guinea; GuineaBissau; Kenya; Lesotho; Liberia; Madagascar;
Malawi; Mali; Mauritania; Mauritius;
Mozambique; Namibia; Niger; Nigeria;
Rwanda; Sao Tome and Principe; Senegal;
Seychelles; Sierra Leone; Somalia; South
Africa; Swaziland; Tanzania, United Republic
of; Togo; Uganda; Zambia; Zimbabwe
Middle East and North Africa
Algeria; Bahrain; Djibouti; Egypt; Iran (Islamic
Republic of); Iraq; Jordan; Kuwait; Lebanon;
Libyan Arab Jamahiriya; Morocco; Occupied
Palestinian Territory; Oman; Qatar; Saudi
Arabia; Sudan; Syrian Arab Republic; Tunisia;
United Arab Emirates; Yemen
South Asia
Afghanistan; Bangladesh; Bhutan; India;
Maldives; Nepal; Pakistan; Sri Lanka
East Asia and Pacific
Brunei Darussalam; Cambodia; China; Cook
Islands; Fiji; Indonesia; Kiribati; Korea,
Democratic People’s Republic of; Korea,
Republic of; Lao People’s Democratic Republic;
Malaysia; Marshall Islands; Micronesia
(Federated States of); Mongolia; Myanmar;
Nauru; Niue; Palau; Papua New Guinea;
Philippines; Samoa; Singapore; Solomon
Islands; Thailand; Timor-Leste; Tonga; Tuvalu;
Vanuatu; Viet Nam
Latin America and Caribbean
Antigua and Barbuda; Argentina; Bahamas;
Barbados; Belize; Bolivia; Brazil; Chile;
132
Colombia; Costa Rica; Cuba; Dominica;
Dominican Republic; Ecuador; El Salvador;
Grenada; Guatemala; Guyana; Haiti; Honduras;
Jamaica; Mexico; Nicaragua; Panama;
Paraguay; Peru; Saint Kitts and Nevis; Saint
Lucia; Saint Vincent and the Grenadines;
Suriname; Trinidad and Tobago; Uruguay;
Venezuela
CEE/CIS
Albania; Armenia; Azerbaijan; Belarus;
Bosnia and Herzegovina; Bulgaria; Croatia;
Georgia; Kazakhstan; Kyrgyzstan; Moldova,
Republic of; Romania; Russian Federation;
Serbia and Montenegro; Tajikistan; the former
Yugoslav Republic of Macedonia; Turkey;
Turkmenistan; Ukraine; Uzbekistan
Industrialized countries
Andorra; Australia; Austria; Belgium; Canada;
Cyprus; Czech Republic; Denmark; Estonia;
Finland; France; Germany; Greece; Holy See;
Hungary; Iceland; Ireland; Israel; Italy; Japan;
Latvia; Liechtenstein; Lithuania; Luxembourg;
Malta; Monaco; Netherlands; New Zealand;
Norway; Poland; Portugal; San Marino; Slovakia;
Slovenia; Spain; Sweden; Switzerland; United
Kingdom; United States
Developing countries
Afghanistan; Algeria; Angola; Antigua and
Barbuda; Argentina; Armenia; Azerbaijan;
Bahamas; Bahrain; Bangladesh; Barbados;
Belize; Benin; Bhutan; Bolivia; Botswana;
Brazil; Brunei Darussalam; Burkina Faso;
Burundi; Cambodia; Cameroon; Cape Verde;
Central African Republic; Chad; Chile; China;
Colombia; Comoros; Congo; Congo, Democratic
Republic of the; Cook Islands; Costa Rica;
Côte d’Ivoire; Cuba; Cyprus; Djibouti; Dominica;
Dominican Republic; Ecuador; Egypt; El
Salvador; Equatorial Guinea; Eritrea; Ethiopia;
Fiji; Gabon; Gambia; Georgia; Ghana; Grenada;
Guatemala; Guinea; Guinea-Bissau; Guyana;
Haiti; Honduras; India; Indonesia; Iran (Islamic
Republic of); Iraq; Israel; Jamaica; Jordan;
Kazakhstan; Kenya; Kiribati; Korea, Democratic
T H E S TAT E O F T H E W O R L D ’ S C H I L D R E N 2 0 0 6
People’s Republic of; Korea, Republic of;
Kuwait; Kyrgyzstan; Lao People’s Democratic
Republic; Lebanon; Lesotho; Liberia; Libyan
Arab Jamahiriya; Madagascar; Malawi;
Malaysia; Maldives; Mali; Marshall Islands;
Mauritania; Mauritius; Mexico; Micronesia
(Federated States of); Mongolia; Morocco;
Mozambique; Myanmar; Namibia; Nauru; Nepal;
Nicaragua; Niger; Nigeria; Niue; Occupied
Palestinian Territory; Oman; Pakistan; Palau;
Panama; Papua New Guinea; Paraguay; Peru;
Philippines; Qatar; Rwanda; Saint Kitts and
Nevis; Saint Lucia; Saint Vincent/Grenadines;
Samoa; Sao Tome and Principe; Saudi Arabia;
Senegal; Seychelles; Sierra Leone; Singapore;
Solomon Islands; Somalia; South Africa; Sri
Lanka; Sudan; Suriname; Swaziland; Syrian
Arab Republic; Tajikistan; Tanzania, United
Republic of; Thailand; Timor-Leste; Togo;
Tonga; Trinidad and Tobago; Tunisia; Turkey;
Turkmenistan; Tuvalu; Uganda; United Arab
Emirates; Uruguay; Uzbekistan; Vanuatu;
Venezuela; Viet Nam; Yemen; Zambia;
Zimbabwe
Least developed countries
Afghanistan; Angola; Bangladesh; Benin;
Bhutan; Burkina Faso; Burundi; Cambodia;
Cape Verde; Central African Republic; Chad;
Comoros; Congo, Democratic Republic of the;
Djibouti; Equatorial Guinea; Eritrea; Ethiopia;
Gambia; Guinea; Guinea-Bissau; Haiti;
Kiribati; Lao People’s Democratic Republic;
Lesotho; Liberia; Madagascar; Malawi;
Maldives; Mali; Mauritania; Mozambique;
Myanmar; Nepal; Niger; Rwanda; Samoa;
Sao Tome and Principe; Senegal; Sierra
Leone; Solomon Islands; Somalia; Sudan;
Tanzania, United Republic of; Timor-Leste;
Togo; Tuvalu; Uganda; Vanuatu; Yemen;
Zambia
Measuring human development
An introduction to table 10
If development is to assume a more human
face, then there arises a corresponding need
for a means of measuring human as well as
economic progress. From UNICEF’s point of
view, in particular, there is a need for an
agreed method of measuring the level of
child well-being and its rate of change.
The under-five mortality rate (U5MR) is
used in table 10 (next page) as the principal
indicator of such progress.
The U5MR has several advantages. First,
it measures an end result of the development
process rather than an ‘input’ such as school
enrolment level, per capita calorie availability, or the number of doctors per thousand
population – all of which are means to an
end.
Second, the U5MR is known to be the result of a wide variety of inputs: the nutritional
health and the health knowledge of mothers;
the level of immunization and ORT use; the
availability of maternal and child health services (including prenatal care); income and
food availability in the family; the availability
of clean water and safe sanitation; and the
overall safety of the child’s environment.
Third, the U5MR is less susceptible than,
say, per capita GNI to the fallacy of the average. This is because the natural scale does
not allow the children of the rich to be one
thousand times as likely to survive, even if
the man-made scale does permit them to
have one thousand times as much income. In
other words, it is much more difficult for a
wealthy minority to affect a nation’s U5MR,
and it therefore presents a more accurate, if
far from perfect, picture of the health status
of the majority of children (and of society as a
whole).
For these reasons, the U5MR is chosen by
UNICEF as its single most important indicator
of the state of a nation’s children.
The speed of progress in reducing the
U5MR can be measured by calculating its
average annual reduction rate (AARR). Unlike
the comparison of absolute changes, the
AARR reflects the fact that the lower limits to
U5MR are approached only with increasing
difficulty. As lower levels of under-five
mortality are reached, for example, the same
absolute reduction obviously represents a
greater percentage of reduction. The AARR
therefore shows a higher rate of progress for,
say, a 10-point reduction if that reduction
happens at a lower level of under-five mortality. (A fall in U5MR of 10 points from 100 to 90
represents a reduction of 10 per cent, whereas
the same 10-point fall from 20 to 10 represents a reduction of 50 per cent).
When used in conjunction with GDP
growth rates, the U5MR and its reduction
rate can therefore give a picture of the
progress being made by any country or
region, and over any period of time, towards
the satisfaction of some of the most essential
of human needs.
As table 10 shows, there is no fixed relationship between the annual reduction rate
of the U5MR and the annual rate of growth in
per capita GDP. Such comparisons help to
throw the emphasis on the policies, priorities,
and other factors which determine the ratio
between economic and social progress.
Finally, the table gives the total fertility
rate for each country and territory and the
average annual rate of reduction. It will be
seen that many of the nations that have
achieved significant reductions in their
U5MR have also achieved significant reductions in fertility.
S TAT I S T I C A L TA B L E S
133
TABLE 10. THE RATE OF PROGRESS
Countries and
territories
Afghanistan
Albania
Algeria
Andorra
Angola
Antigua and Barbuda
Argentina
Armenia
Australia
Austria
Azerbaijan
Bahamas
Bahrain
Bangladesh
Barbados
Belarus
Belgium
Belize
Benin
Bhutan
Bolivia
Bosnia and Herzegovina
Botswana
Brazil
Brunei Darussalam
Bulgaria
Burkina Faso
Burundi
Cambodia
Cameroon
Canada
Cape Verde
Central African Republic
Chad
Chile
China
Colombia
Comoros
Congo
Congo, Democratic
Republic of the
Cook Islands
Costa Rica
Côte d’Ivoire
Croatia
Cuba
Cyprus
Czech Republic
Denmark
Djibouti
Dominica
Dominican Republic
Ecuador
Egypt
El Salvador
Equatorial Guinea
Eritrea
Estonia
Ethiopia
Fiji
134
Under-5
mortality
rate
Average annual
rate of
reduction (%)
Under-5
mortality
rank
1970
1990
2004
1970-90
4
125
79
159
2
143
127
90
162
172
51
140
148
58
143
148
172
81
23
56
62
131
41
88
150
131
16
17
26
25
162
86
15
12
152
93
113
61
44
320
109
220
300
71
20
33
49
82
239
54
27
29
252
267
243
82
142
135
78
32
295
233
215
23
238
98
120
108
215
160
260
45
69
260
29
60
10
10
105
29
19
149
16
17
10
49
185
166
125
22
58
60
11
18
210
190
115
139
8
60
168
203
21
49
36
120
110
257
19
40
7
260
12
18
32
6
5
90
13
11
77
12
11
5
39
152
80
69
15
116
34
9
15
192
190
141
149
6
36
193
200
8
31
21
70
108
1.0
4.4
5.8
0.7
4.5
3.5
6.0
2.6
7.3
2.4
6.1
2.3
5.3
1.5
2.4
3.3
6.6
4.5
4.1
9.8
2.9
1.7
1.0
2.2
5.3
1.7
7.7
4.5
5.5
2.9
1.9
8
113
140
14
159
159
172
185
172
31
135
90
104
86
98
9
54
152
20
120
245
83
239
42
43
33
24
19
127
140
235
162
237
26
239
61
205
32
18
157
12
13
12
13
9
163
17
65
57
104
60
170
147
16
204
31
205
21
13
194
7
7
5
4
5
126
14
32
26
36
28
204
82
8
166
20
0.9
7.6
2.1
6.3
6.0
5.1
3.1
3.7
3.3
4.5
4.1
5.0
2.4
2.4
0.8
3.4
GDP per capita
average annual
growth rate (%)
Total
fertility rate
Average annual
rate of reduction (%)
1990-2004
Reduction
since 1990
(%)
1970-90
1990-2004
1970
1990
2004
1970-90
1990-2004
0.1
6.2
3.9
0.0
3.4
4.5
3.6
5.0
1.1
5.7
3.9
4.7
2.1
3.1
5.0
1.6
1.4
5.2
4.2
2.7
-5.0
4.1
1.4
1.3
0.6
0.0
-1.5
-0.5
2.1
3.6
-1.0
0.1
6.9
3.3
3.8
3.8
0.1
1
58
42
0
38
47
40
50
14
55
42
48
25
35
50
20
18
52
45
32
-100
43
18
17
9
0
-23
-7
25
40
-15
1
62
37
42
42
2
0.7,x
-0.6,x
1.7
0.4,x
6.3,x
-0.7
1.5
2.5
1.9
-1.9,x
0.5
1.8
2.2
2.9
0.3
5.4,x
-1.1
8.1
2.3
3.4,x
1.3
1.4
3.4
2.0
-1.2
-0.9
1.5
6.6
2.0
0.2,x
3.0
5.2
0.8
0.7
1.6
1.0
3.6
2.5
1.8
-1.3
0.3,x
1.9,x
3.1
1.4,x
1.6
1.8
2.2
2.1
3.6
1.3
11.7,x
2.9
1.2
1.0
1.8
-3.1
4.1,x
0.4
2.3
3.3
-0.5
0.9
3.9
8.4
0.4
-0.9
-1.2
7.7
4.9
7.4
7.3
3.1
3.2
2.7
2.3
4.6
3.6
6.5
6.4
3.1
2.3
2.1
6.3
7.0
5.9
6.6
2.9
6.9
5.0
5.7
2.2
7.6
6.8
5.9
6.2
2.2
7.0
5.7
6.6
4.0
5.6
5.6
7.1
6.3
8.0
2.9
4.7
7.2
3.0
2.5
1.9
1.5
3.0
2.6
3.7
4.4
1.7
1.9
1.6
4.5
6.8
5.7
4.9
1.7
4.5
2.8
3.2
1.7
7.3
6.8
5.6
5.9
1.7
5.5
5.7
6.7
2.6
2.2
3.1
6.1
6.3
7.4
2.2
2.5
6.7
2.3
1.3
1.7
1.4
1.8
2.3
2.4
3.2
1.5
1.2
1.7
3.1
5.7
4.2
3.8
1.3
3.1
2.3
2.4
1.2
6.6
6.8
4.0
4.5
1.5
3.6
4.9
6.7
2.0
1.7
2.6
4.7
6.3
-0.2
2.6
2.3
0.1
0.2
1.2
1.8
2.1
2.1
1.6
2.8
1.9
3.0
1.0
1.4
1.7
0.1
0.2
1.5
2.7
2.1
2.9
2.9
1.3
0.2
0.0
0.3
0.2
1.3
1.2
0.0
-0.1
2.2
4.7
3.0
0.8
0.0
0.6
2.0
4.5
0.5
1.9
4.7
0.8
0.5
3.6
0.9
3.1
2.3
0.9
3.3
-0.4
2.7
1.3
2.2
1.8
1.9
2.7
1.4
2.1
2.5
0.7
0.0
2.4
1.9
0.9
3.0
1.1
0.0
1.9
1.8
1.3
1.9
0.0
0.0
3.0
2.3
-1.5
3.8
4.4
6.3
8.4
4.2
1.8
1.4
5.1
5.6
7.6
5.4
-1.3
4.2
5.0
1.5
3.1
0
34
28
-24
42
46
58
69
44
23
18
51
54
65
53
-20
44
50
19
35
-2.3
0.5
-1.3
6.2,x
1.5
4.7,x
2.0
1.3
4.2
-1.8
1.5,x
0.6
-5.8
2.6
-0.6
2.3
3.5,x
3.1
1.7
1.9
-3.0
1.1
4.0
0.3
2.4
1.9
16.3
0.8,x
3.7
2.0
1.7
6.4
5.0
7.4
2.0
4.0
2.6
2.0
2.1
7.4
6.2
6.3
6.1
6.4
5.7
6.6
2.1
6.8
4.5
6.7
3.2
6.6
1.7
1.7
2.4
1.8
1.7
6.3
3.4
3.7
4.3
3.7
5.9
6.2
1.9
6.8
3.4
6.7
2.2
4.9
1.3
1.6
1.6
1.2
1.8
4.9
2.7
2.7
3.2
2.8
5.9
5.4
1.4
5.7
2.9
-0.2
2.2
0.6
0.8
4.3
0.4
0.5
1.1
0.8
3.0
2.7
1.7
2.7
-0.2
0.3
0.5
0.0
1.4
0.0
2.7
2.1
1.9
0.4
2.9
2.9
-0.4
1.8
1.6
2.3
2.1
2.0
0.0
1.0
2.2
1.3
1.1
T H E S TAT E O F T H E W O R L D ’ S C H I L D R E N 2 0 0 6
…TABLE 10
Finland
France
Gabon
Gambia
Georgia
Germany
Ghana
Greece
Grenada
Guatemala
Guinea
Guinea-Bissau
Guyana
Haiti
Holy See
Honduras
Hungary
Iceland
India
Indonesia
Iran (Islamic Republic of)
Iraq
Ireland
Israel
Italy
Jamaica
Japan
Jordan
Kazakhstan
Kenya
Kiribati
Korea, Democratic
People’s Republic of
Korea, Republic of
Kuwait
Kyrgyzstan
Lao People’s
Democratic Republic
Latvia
Lebanon
Lesotho
Liberia
Libyan Arab Jamahiriya
Liechtenstein
Lithuania
Luxembourg
Madagascar
Malawi
Malaysia
Maldives
Mali
Malta
Marshall Islands
Mauritania
Mauritius
Mexico
Micronesia
(Federated States of)
Moldova, Republic of
Monaco
Under-5
mortality
rate
Average annual
rate of
reduction (%)
Under-5
mortality
rank
1970
1990
2004
1970-90
185
172
49
36
75
172
42
172
113
75
22
10
67
40
78
152
192
52
83
83
33
162
162
172
120
185
101
60
37
66
16
24
319
26
186
54
168
345
221
170
39
14
202
172
191
127
27
27
33
64
21
107
156
-
7
9
92
154
47
9
122
11
37
82
240
253
88
150
59
17
7
123
91
72
50
10
12
9
20
6
40
63
97
88
4
5
91
122
45
5
112
5
21
45
155
203
64
117
41
8
3
85
38
38
125
6
6
5
20
4
27
73
120
65
4.1
4.9
3.6
5.3
2.1
8.0
3.6
1.8
1.9
5.3
4.2
3.5
2.5
3.2
4.9
4.7
5.0
4.1
6.5
5.8
6.3
4.9
2.4
-
71
162
143
64
70
54
59
130
55
9
16
80
55
6
12
68
53
143
93
54
5
120
172
152
162
35
19
143
74
7
162
69
33
131
98
218
26
54
190
263
160
28
26
180
330
70
255
400
32
250
86
110
163
18
37
120
235
41
10
13
10
168
241
22
111
250
11
92
133
23
46
110
98
172
61
-
31
40
9
GDP per capita
average annual
growth rate (%)
Total
fertility rate
Average annual
rate of reduction (%)
1990-2004
Reduction
since 1990
(%)
1970-90
1990-2004
1970
1990
2004
1970-90
1990-2004
4.0
4.2
0.1
1.7
0.3
4.2
0.6
5.6
4.0
4.3
3.1
1.6
2.3
1.8
2.6
5.4
6.1
2.6
6.2
4.6
-6.5
3.6
5.0
4.2
0.0
2.9
2.8
-1.1
-1.5
2.2
43
44
1
21
4
44
8
55
43
45
35
20
27
22
31
53
57
31
58
47
-150
40
50
44
0
33
33
-16
-24
26
2.9
2.1
-0.1
0.9
3.2
2.2,x
-2.2
1.3
4.9,x
0.2
-0.2
-1.5
0.0
0.6
2.9
3.2
2.2
4.7
-3.5,x
-4.3
2.8
1.9
2.6
-1.3
3.0
2.5,x
1.3
-5.3
2.5
1.6
-0.4
0.2
-0.7
1.2
1.9
2.2
2.3
1.0
1.6
-2.5
3.3
-2.8
0.3
2.7
2.2
4.1
2.1
2.3
6.5
1.5
1.4
0.0
1.0
1.1
1.3
-0.6
2.5
1.9
2.5
4.9
6.5
2.6
2.0
6.7
2.4
6.2
6.8
6.8
5.6
5.8
7.3
2.0
3.0
5.6
5.4
6.6
7.2
3.9
3.8
2.4
5.5
2.1
7.9
3.5
8.1
-
1.7
1.8
5.4
5.9
2.1
1.4
5.8
1.4
5.6
6.5
7.1
2.6
5.4
5.1
1.8
2.2
4.0
3.1
5.0
5.9
2.1
3.0
1.3
2.9
1.6
5.5
2.8
5.9
-
1.7
1.9
3.9
4.6
1.4
1.3
4.2
1.2
4.5
5.8
7.1
2.2
3.9
3.6
1.3
2.0
3.0
2.3
2.1
4.7
1.9
2.8
1.3
2.4
1.3
3.4
1.9
5.0
-
0.6
1.6
-0.5
0.5
1.1
1.8
0.7
2.7
0.5
0.2
-0.2
3.8
0.4
1.8
0.5
1.6
1.7
2.8
1.4
1.0
3.1
1.2
3.1
3.2
1.4
1.8
1.1
1.6
-
0.0
-0.4
2.3
1.8
2.9
0.5
2.3
1.1
1.6
0.8
0.0
1.2
2.3
2.5
2.3
0.7
2.1
2.1
6.2
1.6
0.7
0.5
0.0
1.4
1.5
3.4
2.8
1.2
-
1.2
9.0
6.5
2.4
0.0
2.9
2.1
1.2
0
33
25
15
6.2
-6.8,x
-
4.5
-2.3,x
-1.7
4.3
4.5
7.2
4.9
2.4
1.6
3.5
3.9
2.0
1.2
2.3
2.6
2.9
5.2
3.6
1.1
1.3
2.1
3.0
2.9
83
12
31
82
235
20
5
8
6
123
175
12
46
219
6
59
125
15
28
1.5
1.8
1.9
2.3
0.6
6.8
3.8
4.8
0.3
1.6
5.8
4.2
2.4
5.3
3.2
6.6
4.4
4.8
2.9
1.3
2.7
0.0
5.1
5.0
3.5
3.6
2.2
2.3
4.3
6.3
0.9
4.3
3.2
0.4
3.1
3.5
49
33
16
32
0
51
50
38
40
27
27
45
59
12
45
36
6
35
39
3.3
4.2
-4.6
-4.8,x
2.7
-2.2
0.3
4.0
-0.3
6.5
-0.6
5.1,x
1.7
3.7
2.9
2.9
2.3
3.7
1.2
3.5
-0.8
0.9
3.3
4.6,x
2.5
3.0
1.7
3.9
1.4
6.1
1.9
5.1
5.7
6.9
7.6
2.3
2.1
6.8
7.3
5.6
7.0
7.5
2.1
6.5
3.7
6.8
6.1
1.9
3.1
4.9
6.9
4.8
2.0
1.6
6.2
7.0
3.8
6.4
7.4
2.0
6.2
2.2
3.4
4.7
1.3
2.3
3.5
6.8
2.9
1.3
1.7
5.3
6.0
2.8
4.1
6.8
1.5
5.7
2.0
2.3
0.0
0.0
2.5
0.8
0.0
2.3
0.7
1.4
0.5
0.2
1.9
0.4
0.1
0.2
0.2
2.6
3.5
1.9
2.7
2.1
2.4
0.1
3.6
3.1
-0.4
1.1
1.1
2.2
3.2
0.6
2.1
0.6
0.7
2.8
23
28
5
2.1
-
2.1
2.5
4.2
26
30
44
1.9,x
-
-1.4
-4.6
-
6.9
2.6
-
5.0
2.4
-
4.3
1.2
-
1.6
0.4
-
1.1
5.0
-
S TAT I S T I C A L TA B L E S
135
TABLE 10. THE RATE OF PROGRESS
Mongolia
Morocco
Mozambique
Myanmar
Namibia
Nauru
Nepal
Netherlands
New Zealand
Nicaragua
Niger
Nigeria
Niue
Norway
Occupied Palestinian Territory
Oman
Pakistan
Palau
Panama
Papua New Guinea
Paraguay
Peru
Philippines
Poland
Portugal
Qatar
Romania
Russian Federation
Rwanda
Saint Kitts and Nevis
Saint Lucia
Saint Vincent
and the Grenadines
Samoa
San Marino
Sao Tome and Principe
Saudi Arabia
Senegal
Serbia and Montenegro
Seychelles
Sierra Leone
Singapore
Slovakia
Slovenia
Solomon Islands
Somalia
South Africa
Spain
Sri Lanka
Sudan
Suriname
Swaziland
Sweden
Switzerland
Syrian Arab Republic
Tajikistan
Tanzania, United Republic of
Thailand
136
Under-5
mortality
rate
Average annual
rate of
reduction (%)
Under-5
mortality
rank
1970
1990
2004
1970-90
72
77
23
45
68
95
59
162
162
83
3
13
185
107
140
47
101
107
48
107
97
88
152
172
113
120
113
10
113
135
184
278
179
135
250
15
20
165
330
265
15
200
181
68
147
78
178
90
36
62
65
57
36
209
-
108
89
235
130
86
145
9
11
68
320
230
9
40
32
130
34
34
101
41
80
62
18
14
26
31
29
173
36
21
52
43
152
106
63
30
76
6
6
38
259
197
4
24
13
101
27
24
93
24
29
34
8
5
21
20
21
203
21
14
3.6
0.8
1.6
2.3
2.7
2.6
3.0
4.4
0.2
0.7
2.6
9.2
1.7
3.5
1.9
3.2
4.0
1.9
3.5
7.4
4.6
3.0
1.1
0.9
-
112
95
185
38
101
29
131
135
1
192
150
185
70
6
65
172
135
49
81
21
185
172
130
38
31
113
101
185
279
71
59
363
27
29
29
99
34
100
172
196
15
18
128
218
102
25
50
14
118
44
148
28
19
302
9
14
10
63
225
60
9
32
120
48
110
7
9
44
128
161
37
22
30
4
118
27
137
15
14
283
3
9
4
56
225
67
5
14
91
39
156
4
5
16
118
126
21
3.5
7.2
3.2
4.7
5.7
0.9
5.5
3.6
5.3
2.3
6.6
5.7
1.8
2.9
3.8
3.5
5.3
1.5
5.1
GDP per capita
average annual
growth rate (%)
Total
fertility rate
Average annual
rate of reduction (%)
1990-2004
Reduction
since 1990
(%)
1970-90
1990-2004
1970
1990
2004
1970-90
1990-2004
5.2
5.2
3.1
1.5
2.2
4.6
2.9
4.3
4.2
1.5
1.1
5.8
3.6
6.4
1.8
1.6
2.5
0.6
3.8
7.2
4.3
5.8
7.4
1.5
3.1
2.3
-1.1
3.8
2.9
52
52
35
18
27
48
33
45
44
19
14
56
40
59
22
21
29
8
41
64
45
56
64
19
35
28
-17
42
33
2.1
-1.6,x
1.6
-2.0,x
1.3
1.5
0.8
-3.9
-2.2
-1.6
3.4
3.6
3.0
0.3
-0.8
2.9
-0.6
0.8
2.6
0.9,x
1.4
6.3,x
5.3,x
-1.8
1.1
4.8
5.7,x
0.9
2.0
2.0
2.1
0.9
-0.6
0.2
2.8
-6.0,x
0.9
1.1
0.0,x
2.5
0.0
-0.7
2.1
1.3
4.2
2.1
1.0
-0.7
0.9
2.9
0.3
7.5
7.1
6.6
5.9
6.5
5.9
2.4
3.1
7.0
8.1
6.9
2.5
7.9
7.2
6.6
5.3
6.2
6.0
6.3
6.3
2.2
2.8
6.9
2.9
2.0
8.2
6.1
4.1
4.0
6.3
4.0
6.0
5.2
1.6
2.1
4.9
8.2
6.8
1.9
6.4
6.6
6.1
3.0
5.1
4.7
3.9
4.4
2.0
1.5
4.4
1.9
1.9
7.6
3.5
2.4
2.7
5.4
2.3
3.8
3.6
1.7
2.0
3.2
7.8
5.7
1.8
5.4
3.6
4.1
2.7
3.9
3.8
2.8
3.1
1.2
1.5
2.9
1.3
1.3
5.6
2.2
3.0
2.9
0.2
1.9
0.4
0.6
2.0
1.9
1.8
-0.1
0.1
1.4
1.1
0.4
0.4
2.8
1.0
1.2
2.4
1.8
0.5
3.1
2.2
2.1
0.3
0.4
2.8
3.8
2.8
1.1
4.0
3.3
2.6
-0.4
0.3
3.0
0.4
1.3
0.4
1.2
4.3
2.8
0.8
1.9
1.5
2.4
2.5
3.6
0.0
3.0
2.7
2.7
2.2
3.3
0.9
3.6
8.9
0.0
3.5
0.6
4.5
2.2
0.5
7.8
3.2
6.5
0.8
0.0
-0.8
4.2
5.9
2.0
1.5
-2.5
4.0
4.2
7.2
0.6
1.8
4.0
12
40
71
0
39
7
46
26
6
67
36
60
11
0
-12
44
56
24
19
-42
43
44
64
8
22
43
3.2
0.0,x
-1.2
-0.4
2.9
-0.4
5.7
3.4
-1.0
0.1
1.9
3.2
0.3
-2.2,x
2.1
1.8
1.1
2.2
4.7
1.9
2.2
0.0
-0.5
1.4
4.1,x
1.7
-2.5
3.5
2.6
3.1
-2.6
0.4
2.4
3.3
3.3
0.9
0.2
2.1
0.6
1.3
-5.1
1.3
2.9
6.0
6.1
6.5
7.3
7.0
2.4
6.5
3.0
2.5
2.3
6.9
7.3
5.6
2.9
4.4
6.7
5.7
6.9
2.0
2.0
7.6
6.9
6.8
5.5
3.0
4.8
5.3
6.0
6.5
2.1
6.5
1.8
2.0
1.5
5.5
6.8
3.6
1.3
2.5
5.6
2.7
5.7
2.0
1.5
5.3
5.2
6.1
2.2
2.2
4.3
3.9
3.9
4.9
1.6
6.5
1.3
1.2
1.2
4.2
6.3
2.8
1.3
1.9
4.3
2.6
3.8
1.7
1.4
3.3
3.7
4.9
1.9
3.5
1.2
1.0
1.0
0.4
0.7
0.0
2.6
1.1
2.1
1.1
0.4
2.2
4.0
2.8
0.9
3.7
1.0
0.0
1.4
1.8
1.4
0.5
4.6
2.2
0.8
2.2
3.1
2.0
1.9
0.0
2.3
3.6
1.6
1.9
0.5
1.8
0.0
2.0
1.9
0.3
2.9
1.2
0.5
3.4
2.4
1.6
1.0
T H E S TAT E O F T H E W O R L D ’ S C H I L D R E N 2 0 0 6
…TABLE 10
The former Yugoslav
Republic of Macedonia
Timor-Leste
Togo
Tonga
Trinidad and Tobago
Tunisia
Turkey
Turkmenistan
Tuvalu
Uganda
Ukraine
United Arab Emirates
United Kingdom
United States
Uruguay
Uzbekistan
Vanuatu
Venezuela
Viet Nam
Yemen
Zambia
Zimbabwe
Under-5
mortality
rate
Average annual
rate of
reduction (%)
Under-5
mortality
rank
1970
1990
2004
1970-90
135
56
27
105
120
105
90
46
73
28
127
152
162
152
129
62
79
125
110
43
18
30
119
216
50
57
201
201
170
27
83
23
26
57
101
155
61
87
303
181
138
38
172
152
32
33
52
82
97
56
160
26
14
10
12
25
79
62
27
53
142
180
80
14
80
140
25
20
25
32
103
51
138
18
8
6
8
17
69
40
19
23
111
182
129
244
219
266
195
206
122
123
86
27
167
244
147
188
167
209
81
129
58
54
54
10
105
182
95
171
149
191
56
92
36
31
38
6
87
155
79
GDP per capita
average annual
growth rate (%)
Total
fertility rate
Average annual
rate of reduction (%)
1990-2004
Reduction
since 1990
(%)
1970-90
1990-2004
1970
1990
2004
1970-90
1990-2004
5.7
1.8
2.2
2.7
6.8
4.5
0.3
0.2
8.9
4.2
3.9
4.1
1.2
4.6
4.1
2.5
3.8
0.0
2.7
7.1
5.5
0.6
1.8
3.6
5.2
6.7
-0.4
0.7
1.1
2.6
4.0
3.6
2.9
2.8
1.0
3.1
2.5
6.0
1.8
-0.1
-3.4
63
53
8
22
39
52
61
-6
9
14
31
43
40
33
32
13
35
30
57
22
-1
-61
-0.2
0.5
2.5
1.9
-4.8,x
2.0
2.2
0.9
-0.6,x
-1.6
-2.2
-0.3
-0.5
0.3
2.0
3.5
3.2
1.4
0.2
3.8
-3.5
-2.1,x
2.5
2.1
0.8
-0.1
-0.8
-1.3
5.8
2.1
-0.6
-0.8,x
3.2
6.3
7.0
5.9
3.5
6.6
5.5
6.3
7.1
2.1
6.6
2.3
2.2
2.9
6.5
6.3
5.4
7.0
8.5
7.7
7.7
1.9
4.9
6.4
4.6
2.5
3.6
3.0
4.3
7.1
1.8
4.4
1.8
2.0
2.5
4.2
4.9
3.4
3.7
8.0
6.5
5.2
1.5
7.8
5.2
3.4
1.6
1.9
2.4
2.7
7.1
1.1
2.5
1.7
2.0
2.3
2.7
4.0
2.7
2.3
6.0
5.5
3.4
2.6
1.3
0.4
1.2
1.7
3.0
3.0
1.9
0.0
0.8
2.0
1.2
0.5
0.7
2.2
1.3
2.3
3.2
0.3
0.8
2.0
1.7
-3.3
1.5
2.2
3.2
4.6
1.6
3.3
0.0
3.5
4.0
0.4
0.0
0.6
3.2
1.4
1.6
3.4
2.1
1.2
3.0
1.3
1.4
1.2
4.4
2.3
3.7
4.1
2.3
5.0
2.3
1.5
2.2
0.7
0.8
0.6
2.6
2.4
3.4
4.0
2.5
3.6
1.3
1.1
1.3
9
11
9
31
29
38
43
30
40
17
15
17
0.0
-0.5
0.4
2.1
5.6
1.4
2.3
2.6
-0.1
2.4
0.6
0.7
0.2
1.2
3.7
6.2
1.3
0.1
1.9
3.5
1.8
2.1
6.8
6.8
6.8
6.8
5.8
5.6
5.3
2.8
2.3
5.8
6.7
4.7
6.3
6.0
6.7
5.0
4.3
2.5
3.2
2.3
1.7
3.6
5.9
3.2
5.4
5.1
5.8
3.2
3.2
1.9
2.5
1.7
1.6
2.9
4.9
2.6
0.4
0.6
0.1
1.5
1.5
4.0
2.5
1.0
1.5
2.4
0.6
1.9
1.1
1.2
1.0
3.2
2.1
2.0
1.8
2.2
0.4
1.5
1.3
1.5
SUMMARY INDICATORS
Sub-Saharan Africa
Eastern and Southern Africa
Western and Central Africa
Middle East and North Africa
South Asia
East Asia and Pacific
Latin America and Caribbean
CEE/CIS
Industrialized countries
Developing countries
Least developed countries
World
Countries in each category are listed on page 132.
DEFINITIONS OF THE INDICATORS
MAIN DATA SOURCES
Under-five mortality rate – Probability of dying between birth and exactly five years of age
expressed per 1,000 live births.
Under-five mortality – UNICEF, United Nations Population Division and United Nations Statistics
Division.
Reduction since 1990 (%) – Percentage reduction in the under-five mortality rate (U5MR) from
1990 to 2004. The United Nations Millennium Declaration in 2000 established a goal of a twothirds (67%) reduction in U5MR from 1990 to 2015. Hence this indicator provides a current
assessment of progress towards this goal.
GDP per capita – World Bank.
Fertility – United Nations Population Division.
GDP per capita – Gross domestic product (GDP) is the sum of value added by all resident producers
plus any product taxes (less subsidies) not included in the valuation of output. GDP per capita is
gross domestic product divided by mid-year population. Growth is calculated from constant price
GDP data in local currency.
Total fertility rate – The number of children that would be born per woman if she were to live to
the end of her child-bearing years and bear children at each age in accordance with prevailing
age-specific fertility rates.
NOTES
x
Data not available.
Indicates data that refer to years or periods other than those specified in the column heading, differ from the standard definition or refer to only part of a country.
S TAT I S T I C A L TA B L E S
137
INDEX
adolescents, prevention of HIV/AIDS among, 30
Brazil
child protection (table), 130–133
adult roles, premature entry into, 43–48
ANDI, Agency for Children’s Rights in, 77
‘A World Fit for Children’ and, 4
Addis Ababa, child domestic workers in, 40
budgeting for marginalized children in, 67
abuses of, 1, 35–57
Afghanistan
children in detention in, 41
links between Millennium Development
Goals and, 53
birth registration in, 37
polio in, 28
AIDS (see HIV/AIDS)
National Programme for the Eradication of
Child Labour in, 69
Pastoral da Criança project in, 73
children
commitments to, 1–7
British Broadcasting Corporation (BBC) World
Service Trust, 78
conflict resolution and prevention in
safeguarding, 29
All the Invisible Children, 80
Brussels Declaration and Programme of Action
for the Least Developed Countries, 28
defining exclusion and invisibility of, 7
Annan, Kofi A., vi
budgets, child-focused, 59, 65–67
armed conflict
Bulgaria, Roma in, 24
displaced (see displaced children)
excluded (see excluded children)
education and, 14–15
Burkina Faso, public education campaign
against FGM/C, 65
emergency responses for, 11
Burundi, indigenous children in, 23
exploitation of, 49–51
Cambodia
invisible (see invisible children)
AIDS Media Center, 78
Albania, media presentation of children in, 77
as threat to childhood, 12, 31
excluded children in, 11, 14–15, 35
Optional Protocol to the Convention on the
Rights of the Children on the involvement
of children in, 63
research on children in, 62
infant mortality rates in indigenous children
in, 24
media and, 75, 77
Plan International’s Mobile Registration
Project in, 73
street (see street children)
capacity building, 59, 68
Australia
census surveys, 62
indigenous children in, 23–24
Central and Eastern Europe, Roma in, 24, 25
Charef, Mehdi, 80
Chad
Bangladesh
birth registration in, 37, 64
indigenous children in, 23
basic indicators (table), 98–101
experience of poverty, 32–33
indigenous (see indigenous children)
Asia, 12, 40 (also see East Asia and Pacific;
South Asia)
Azerbaijan, lack of vaccines in, 20
with disabilities (see disabilities, children
with)
fistula prevention in, 47
lack of vaccines in, 20
Millennium agenda and, 3–4
UNICEF guidelines on interviewing and
reporting on, 76-77
The Children of Leningradsky, 80
Child Rights Index, 70–71
child soldiers, 14, 28, 43–44, 62
child survival, 3
income inequalities and, 20–21
child-focused budgets (see budgets)
child-to-child surveys, effectiveness of, in local
development process, 74–75
child labour, 12
child trafficking, 49–50
Benin, efforts to combat child trafficking in, 55
child trafficking into, 50
Best Practice Media Resource Centre and
Database, 78
into child labour, 50
in developing countries, 50, 56–57
debt bondage and, 50, 51
birth certificates, 36
economic costs and benefits of eliminating,
48
legislation against, 64
birth registration
ILO Convention against, 63
in Bangladesh, 37, 64
injuries in hazardous, 28, 46–47
in the developing world, 37, 56–57
invisibility of children in forced, 50–51
displacement and, 38
lack of education and, 47–48
factors influencing levels of, 37
programme for eradication of, 69
of indigenous children, 24–25
poverty and, 12
invisibility of children without, 36–38
research on, 62
legislation and, 64
UNICEF-IKEA project on combating, 78
mechanisms for, 36
worst forms of, 48
protection and, 53
child prostitution
in rural areas, 38
trafficking into, 50, 51
variance in actual numbers, 36–37
Optional Protocol to the Convention on the
Rights of the Child on the sale of children,
child prostitution and child pornography
and, 63
blindness, vitamin A deficiency
as cause of, 28
Bolivia, 21, 23, 69
138
T H E S TAT E O F T H E W O R L D ’ S C H I L D R E N 2 0 0 6
Palermo Protocol definition of, 62
into pornography, 51
into prostitution, 50, 51
research on, 62
Chile, indigenous children in, 23
civil society organizations
acknowledgement of responsibilities to
children, 59, 60
involvement of, in broadening the scope of
interventions, 72–75
push for International Year of the Child, 87
Coalition Against Trafficking in Women Asia
Pacific in the Philippines, 81
Code of Conduct for the Protection of Children
from Sexual Exploitation in Travel and
Tourism, 79
commitments to children, 1–7, 85–88
Committee on the Elimination of Discrimination
against Women, 64
displaced children, 36, 38–39
birth registration and, 38
lack of visibility for, 38
lives of, 11
reaching out to, 59, 85, 88
exclusion
Committee on the Rights of the Child, 1, 23, 35,
41
documentation, loss or lack of formal, 36–39
for children with disabilities, 25–28
Congo, Democratic Republic of the,
disarmament, demobilization and
reintegration initiatives in, 43
domestic law reform, need for, 65
defining, 7, 11
domestic service, invisibility of children in, 50–51
harms of, 11–12, 32–33
Dominican Republic, school entrance
requirements in, 69
macro-level causes of, 12, 14–17
donors, creation of enabling environment, 29,
55, 59, 60
root causes of, 28–31, 35, 59, 60
lack of vaccines in, 20
Convention on the Elimination of All Forms of
Discrimination against Women
Article 5 of, 52
Article 16 of, 46
ratification of, 63
early marriage, 44-46
in developing countries, 46
Convention on the Rights of the Child, 1, 7, 11, 23,
36, 39, 43–44, 54, 56–57, 59, 63–64, 86
fistula and, 47
cultural barriers, 11, 19, 70
physical implications of, for young girls, 46
Czech Republic, Roma in, 24
impact on childhood, 44–46
East Asia and the Pacific, child trafficking in, 50
economic growth, raising incomes through, 12
data trends, geographical mapping of, 61
economic indicators (table), 122–125
death penalty, application to juvenile offenders,
41–42
Ecuador
debt bondage, child trafficking and, 50, 51
Demographic and Health Surveys (DHS), 17, 61,
62
demographic indicators (table), 118–121, 82–83
Denmark (Greenland), indigenous children in, 23
deprivation, 12, 14, 25, 32–33
detention
children in, 41
data on numbers of, 41
in Nigeria, 44–45
violent abuse of, 41
community-based alternatives to, 42
developing countries
birth registration in, 37
child labour in, 50
children in, 12
disabilities in, 25
early marriage in, 46
disabilities, children with, 25–26
lack of vaccines for, 25, 28
need for special attention, 28
education (table), 114–117 (also see primary
school enrolment; secondary education)
achieving universal primary, 2
financing, need for changes in, and inclusion, 59,
65–67
Fourth National Meeting of Native American
Youth (2003), 68
‘fragile States’, 11
characteristics of, 15
child labour and lack of, 47–48
lack of education in, 15–16
exclusion of children from, 32–33, 12, 13
maintaining assistance to children in, 60
gender equality in, 22, 87
need for attention to children living in, 29
income inequality and, 18
need for strengthening of governance in, 16
lack of, for orphans, 39
lack of access to, 15–16, 23
G-8 summit, 29, 74
Millennium Development Goals and, 2, 8–9
gender
opportunities provided by, 19, 22
discrimination in education, 19, 22
in Somalia, 15–16
equality, 3–4
Egypt, polio in, 28
education and, 22, 87
El Salvador
promoting, 2
United Nations Girls’ Education Initiative
in, 87
children in domestic service in, 51
empowerment
role of children in own, 60
of women, 2, 3, 19, 53
Ethiopian Youth Forum, 74
on the basis of ethnicity, gender, or disability,
19, 22–23, 60
ethnic violence, 23
budget initiatives in raising public awareness
of, 67
defined, 22
as root cause of exclusion, 35
film making, on lives of excluded and invisible
children, 80
armed conflict and, 14–15
discrimination, 11
of Roma, 22
female genital mutilation/cutting (FGM/C), need
for legislation on, 64–65
forced labour, invisibility of children in, 50–51
ethical reporting, UNICEF principles and
guidelines on, for children, 75–77
need for openly addressing, 29, 31
family protection, lack of, 35, 39
fistula, early marriage and, 47
disarmament, demobilization and reintegration
(DDR) programmes, 43–44
language as basis for, 23
women’s disempowerment and, 22
exploitation of children, 49–51
indigenous children in, 23, 25
disability activism, 26–27
HIV/AIDS and, 16
subnational factors resulting in, 11, 17–19
assessing the rights of children in, 70–71
End Child Prostitution, Child Pornography and
Trafficking of Children for Sexual Purposes
(ECPAT), 79, 81
neglect and stigmatization of, 25–28
at national level, 11
ethnicity
discrimination on the basis of, 22–23
excluded children
gap, narrowing of, in education, 87
inequality in education, 22
parity, excluded children and, 8–9, 13
Geneva Declaration of the Rights of the Child,
League of Nations adoption of, 1
geography, income inequality and, 19
girls
disarmament, demobilization and
reintegration (DDR) programs for, 43
discrimination against, 19, 22
Global Campaign on Children and HIV/AIDS, 11,
30
Global Fund to Fight AIDS, Tuberculosis and
Malaria, 74
defining, 7
Global Media AIDS Initiative, 78
films on lives of, 80
Global Movement for Children, 74
in least developed countries, 12–14
Global Polio Eradication Initiative, 28
INDEX
139
governance
excluded children and breakdown in, 14–16
as root cause of exclusion, 35
Guatemala, indigenous children in, 23
Haiti
child exclusion in, 15
children in domestic service in, 51
health (table), 106–109
health care
cultural barriers in receiving, 19
denial of, to children, 23
exclusion of children from, 12, 13
programmes in, 6, 7, 36, 54–55, 59, 68–72
need for protective environment for, 51–52,
54–55
research on, 59, 60–63, 66
orphaned children as, 39–40
private sector in, 59, 60, 78–79, 81
income inequalities, 32–33
premature entry into adult roles and, 43–48
child survival and, 18, 20–21
reaching out to, 59, 85, 88
geography and, 19
refugee and displaced children as, 38–39
primary school participation and, 18
street children as, 40–41, 42
incomes, raising, through economic growth, 12
India
child-to-child survey, 74–75
child labour and corporate social
responsibility, the UNICEF-IKEA project in,
78–79
Japan, indigenous children in, 23
juvenile justice systems
lack of appropriate, 41–42, 45–46
lack of training and sensitization in, 43
juvenile offenders, application of death penalty
to, 41–42
improving maternal, 2, 4, 53
Developing Initiatives for Social and Human
Action (DISHA) in, 67
inequalities in child, 19
indigenous children in, 23
lack of, for indigenous children, 24
Plan International in, 72
Kaiser Family Foundation, 78
polio in, 28
trafficking to, 50
Korea, Democratic People’s Republic of, birth
registration in, 37
vaccination in , 21
Kusturica, Emir, 80
HIV/AIDS, 1, 6, 110–113 (table)
antiretroviral treatments for, 17
challenging stigmatization associated with, 74
as a threat to childhood, 12
Juvenile Protection Squad, 55
indigenous children
combatting, 2, 4, 16–17, 60
barriers to full participation in society, 23–25
landmines, 14, 28
death from AIDS-related illness, 30
birth registration and, 24–25, 29, 69
early marriage for orphans of, 45–46
capacity building, 68
language, discrimination related to, 11, 19, 23,
25, 69
excluded children and, 11, 13, 16–17
Child Rights Index, 71
Latin America
Global campaign on Children and, 30
lack of health care services for, 24
income inequalities in, 18
impact of, 16–17
school enrollment rates for, 25
ratification of the Convention on the Rights
of the Child in, 64
orphans and, 16, 30, 39
industrialized countries
protecting children affected by, 30
children in, 12
League of Nations, adoption of Geneva
Declaration of the Rights of the Child, 1
providing paediatric treatment for, 30
children in school in, 14, 19
least developed countries
as root cause of exclusion, 35
gross national income per capita in, 15
children in, 4, 12
spread of, 16–17
prevalence of HIV/AIDS in, 16
exclusion of children in, 12–14
household surveys, 11, 17, 21, 38, 61, 62
human development, 3
lack of progress on, in Somalia, 15
human genome mapping, 86
human rights-based approach to development,
1, 6, 59
human rights treaties, 59
signing, 55
Hungary, Roma in, 24
hunger, 3, 20, 86
eradication of extreme, 2, 5, 53
inequalities (also see income inequalities)
as root cause of exclusion, 35
IKEA, 78-79
ILO Convention 182 on the Worst Forms of Child
Labour, ratification of, 63
Leave No Child Out campaign, 25
institutions, 38, 41–43
Lee, Spike, 80
International Committee of the Red Cross (ICRC),
38–39
legislation
International Federation of Women Lawyers, 44
International Labour Organization (ILO)
child labour and, 46–47
Convention No. 182, 48, 63
Internet, highlighting the situation of excluded
and invisible children, 78
invisible children, viii, 6–7, 35–55, 85
children in detention as, 41–43
immunization (see vaccines)
defining, 7
including children, 59–81
education needs of, 39
capacity building and, 59, 68
exploitation of, 49–52
civil society and, 59, 60, 72–75, 81
film making on lives of, 80
financing of, 59, 65–67
inadequate state protection for, 39–43
legislation on, 11, 24, 29, 35, 37, 52, 55, 59,
63–65
lack of formal identity or documentation for,
36–39
media and, 52, 55, 75, 77–78, 80–81
need for birth registration, 36–38
140
reducing poverty in, 29
Institute of Democracy in South Africa (IDASA),
Children's Budget Unit of, 66
International Year of the Child (IYC), 87
identity, loss or lack of formal, 1, 36–39, 69
need for special attention for children in,
28–29
T H E S TAT E O F T H E W O R L D ’ S C H I L D R E N 2 0 0 6
antidiscrimination, 11, 29, 64
on female genital mutilation/cutting, 64–65
to include children, 59, 63–65
on the rights of the physically disabled, 64
life-skills-based approach, 55
longer-term initiatives for meeting the
Millennium Development Goals, 6
Lund, Katia, 80
Machel, Graça, 62
macro-level causes of exclusion, 11–17
malaria, combatting, 2
Malaysia, health care provisions in, 69
malnutrition, 12 (also see nutrition)
impacts of, 6
HIV and, 30
weakened immune system and, 20, 25
marginalization, understanding factors behind,
59
marriage (see early marriage)
impact of early, on childhood, 44–46
laws fixing minimum age for, 64
maternal health, improving, 2, 4, 53
media, 81
polio in, 28
non-discrimination, principle of, 7, 59, 64
non-governmental organizations (NGOs), role of,
42, 45, 66
influence on UNICEF policy decisions, 87
role of, in bringing issues to forefront, 72–73,
78
nutrition (table), 102–105 (also see malnutrition)
role
in addressing discrimination, 29, 31, 35
excluded children and, 13
in empowering people, 59, 60
disability and, 25
partnerships with, in enhancing
campaign effectiveness, 77–78
Nwokocha, Uche, 44
in raising awareness, 75, 77–78, 80–81
Occupied Palestinian Territory, birth registration
in, 37
Mexico
assessing the rights of children in, 70–71
lack of health care for indigenous people in,
24
Office of the United Nations High Commissioner
for Refugees (UNHCR), 38–39
Open Society Institute, 24, 25
ordnance, unexploded, 14
Millennium agenda for children, 1–7, 8–9
orphans
Millennium Declaration, 1–4, 7, 85–86
vision of, 5, 86, 88
vulnerability of, 39–40
osteogenesis imperfecta, 26–27
Otunnu, Olara, 62
mobile services, provision of, for remote or
deprived locations, 69, 72
packaging services in increasing access, 69
paediatric treatment, providing, for HIV/AIDS, 30
Pakistan, polio in, 28
parents, loss of, 39–40
partnerships, 71, 85–88
in combating HIV/AIDS, 30
with the media, 77–78
Peru
under-five mortality in, 18
social expenditure in, 66
Philippines
Namibia, budgeting for marginalized children in,
67
National Network of Native American Youth, 68
National Programme for the Eradication of Child
Labour, 69
Nepal
children in domestic service in, 51
child trafficking in, 50, 51
Niger
child marriage in, 45
fistula prevention in, 47
lack of vaccines in, 20
polio in, 28
Nigeria
children and young people in detention in,
44–45
fistula prevention in, 47
armed conflict and, 15
excluded children and, 14
gender discrimination and, 19
private sector, role of, 59, 60, 78–79, 81
programmes
need for strong research in developing
effective, 59, 60–63
role of, in inclusion, 59, 68–69, 72
protective environment
mines, child trafficking into, 50
Mutawinat Benevolent Company,
accomplishment of, in Khartoum, 73
primary school enrolment, 8–9, 12, 86 (also see
education)
protection rights, violations of, 11–12
Millennium Summit (September 2000), 2, 86
multivariate analysis, 62
prevention of mother-to-child transmission, 30
as invisible children, 39–40
supporting of, 68, 73
Multiple Indicator Cluster Surveys (MICS), 17,
61, 62
premature entry into adult roles, 43–48
HIV/AIDS in creating, 16, 30, 39
Millennium Project, 6
Moscow, filming world of homeless children in,
80
vaccinations and, 20, 21
pregnancy, 47
protecting childhood, 82–83
lack of education for, 39
Montenegro, Roma people in, 24
underweight and, 20, 29
early marriage and, 45–46
Millennium Development Goals (MDGs), 1–7,
8–9 16, 30, 32–33, 53, 86, 82–83, 88
Moldova, life-skills education project for
children, 55
trafficking and, 50
barriers to, 19
Mexico City, street children in, 42
statistical tools for monitoring, 61
as root cause of exclusion, 7, 8–9, 11, 12, 28,
30, 35
adoption of act against trafficking, 64
budgeting for children, 67
Coalition Against Trafficking in Women Asia
Pacific in, 81
Plan International, role of, in birth registration,
72
plantations, child trafficking into, 50
Polak, Hanna, 80
polio, 28, 72
politics, 86
creation of, in making children visible, 51–52
key elements of, 35, 52
Protocol to Prevent, Suppress and Punish
Trafficking in Persons, Especially Women and
Children, 64
qualitative studies, compiling on excluded and
invisible children, 61–63
quantitative data
analysis of, 62
lack of, as no excuse for inaction, 62–63
‘quick impact initiatives’, 1, 6
refugee children
lack of visibility for, 38
primary responsibility for, 38–39
religious leaders/organizations, participation by,
as vital, 72–73, 81
remote locations, provision of satellite services
for, 69, 72
research, 59, 60–63
Roma
discrimination against, 22
marginalization of, 24–25
poverty among, 24
Roma Education Initiative (REI), 25
Romania, Roma people in, 24, 25
pornography, 51
Romanian Federation of NGOs Active in Child
Protection Issues, 25
poverty, 3
root causes of exclusion, 11–31, 35, 59, 60
early marriage and, 45, 47
rural areas
eradication of extreme, 2, 3, 11, 12, 60
early marriage in, 46
need for action in combatting, 6, 11
children out of school, 19
reducing, 12, 29, 60, 65, 66, 73, 74
child mortality in, 19
INDEX
141
risk of exclusion in, 15, 18–19, 67, 69, 71,
82–83
trafficking and, 49–50
crisis in Darfur, 23
Swaziland, identifying marginalized children in,
68
unregistered births in, 37–38
Venezuela
indigenous children in, 23
net primary school attendance in, 18
violence, 41–43
safe water, 4
Tanzania, United Republic of, birth registration
in, 37, 38
visibility, creation of protective environment
and, 51–52, 54–55
satellite services, 59, 69
targeted interventions, 29, 35, 87
vitamin A deficiency, as cause of blindness, 28
schools (see primary school enrolment;
secondary education)
Thailand, Sangha Metta project in, 74
vulnerability
feeding programmes at, 69
Scott, Jordan, 80
‘3 by 5’ Initiative, 30
of orphans, 39–40
’Three Ones’ principles, 30
of poor children, 12
trafficking (see child trafficking)
Scott, Ridley, 80
secondary education (also see education)
excluded children and, 8–9, 14
gender gaps in, 22
water
Uganda, birth registration in, 37
under-five mortality, 12, 98–101 (table), 134–137
(table)
Serbia, Roma people in, 24
armed conflict and, 15
sexual exploitation, 30, 38, 44, 49, 53, 79, 81
children in the least developed countries
and, 13–14, 18
sexual violence, 14, 35, 38, 41, 53
Sierra Leone, DDR initiatives in, 43–44
Slovakia, Roma in, 24
social exclusion, 7
social mobilization campaigns, 64, 69, 77
Society for the Welfare of Women Prisoners in
Enugu, 44
efforts to reverse, 17
income poverty levels and, 21
underweight and, 13, 20
UNICEF
concept of partnership as fundamental to,
86–87
access to improved source of, 4–5
Millennium Development Goal on, 3
West Africa
child trafficking in, 50
early marriage in, 45
women (table), 126–129
conflict resolution and prevention in
safeguarding, 29
disempowerment of, 22
empowerment of, 2, 53
excluded children and, 13
Woo, John, 80
Somalia, 15–16, 54
Global Campaign on HIV/AIDS and children
and, 29
South Africa
engagement of, in UN reform, 88
work-related illnesses, child labour and, 46–47
Principles for Ethical Reporting on Children,
75–77
‘A World Fit for Children,’ 2, 4, 7, 86
Child Justice Bill in, 67
monitoring of child’s rights budgets in, 66
South Asia
birth registration in, 37
child survival in, 18
child trafficking in, 50, 51
education in, 22
child labour in, 57
stigmatization, 43
street children, 40–41
United Nations Convention against
Transnational Organized Crime, 64
adoption of Convention on the Rights of the
Child, 1
Special Session on HIV/AIDS, 30, 61
United Nations Girls' Education Initiative
(UNGEI), 87
United Nations Millennium Project, 6, 28
United Nations Population Fund (UNFPA),
Global Campaign to End Fistula, 47
United Nations Secretary-General’s Study on
Violence Against Children, 42
birth registration in, 37
Universal Declaration of Human Rights, 46
child labour in, 50–51
universality, principle of, 59
child survival in, 20–21
universal primary education, 8–9
education in, 22
urban poor, risk of exclusion for, 18–19, 82–83
ethnic groups in, 23
urbanization, 82–83
HIV/AIDS in, 16, 30
orphans in, 40
vaccines, 85
early marriage in, 45,
excluded children and, 13
fistula in, 47
lack of, 25, 28
levels of disparity in, 20
poverty level and, 20–21
programmes providing, 69
Sudan
child immunization programmes in, 69
Veneman, Ann M., vii
child survival in, 20
Veneruso, Stefano, 80
142
World Summit for Children, 4, 6, 29, 30, 61, 85
young people, prevention of HIV/AIDS among,
30
Special Session on Children, 2
in Mexico City, 42
sub-Saharan Africa
World Forum on Education for All, 87
United Nations General Assembly
film making on, 80
subnational factors resulting in exclusion, 11,
17–18
working together, benefits of, 85–88
T H E S TAT E O F T H E W O R L D ’ S C H I L D R E N 2 0 0 6
Zambia, 65
GLOSSARY
AIDS acquired immune deficiency syndrome
HIV human immunodeficiency virus
CEE/CIS Central and Eastern Europe/
Commonwealth of Independent States
ILO International Labour Organization
CPIA Country Policy and Institutional
Assessment
IPEC International Programme on the Elimination
of Child Labour
MDGs Millennium Development Goals
CRC Convention on the Rights of the Child
MICS Multiple Indicator Cluster Surveys
CSO civil society organization
NGO non-governmental organization
DDR disarmament, demobilization and reintegration
DHS Demographic and Health Surveys
OHCHR Office of the United Nations High
Commissioner for Human Rights
DISHA Developing Initiatives for Social and
Human Action
PMTCT prevention of mother-to-child transmission
(of HIV)
DPT3 three doses of combined
diphtheria/pertussis/tetanus vaccine
U5MR under-five mortality rate
ECOWAS Economic Community of West
African States
UNAIDS Joint United Nations Programme
on HIV/AIDS
UNFPA United Nations Population Fund
ECPAT End Child Prostitution, Child Pornography
and Trafficking of Children for Sexual Purposes
EU European Union
UNGEI United Nations Girls’ Education Initiative
UNHCR United Nations High Commissioner
for Refugees
FGM/C female genital mutilation/cutting
UNICEF United Nations Children’s Fund
G-8 Group of Eight (Canada, France, Germany,
Italy, Japan, Russia, UK and US)
USAID United States Agency for
International Development
HepB3 three doses of hepatitis B vaccine
WHO World Health Organization
GLOSSARY
143
UNICEF Offices
UNICEF The Americas and Caribbean
Regional Office
UNICEF Headquarters
Apartado 3667
Balboa Ancón
Panama City, Panama
UNICEF House
3 United Nations Plaza
New York, NY 10017, USA
UNICEF Regional Office for Europe
UNICEF East Asia and the Pacific
Regional Office
Palais des Nations
CH-1211 Geneva 10, Switzerland
P.O. Box 2-154
Bangkok 10200, Thailand
UNICEF Central and Eastern Europe,
Commonwealth of Independent States
and Baltic States Regional Office
UNICEF Middle East and North Africa
Regional Office
Palais des Nations
CH-1211 Geneva 10, Switzerland
P.O. Box 1551
Amman 11821, Jordan
UNICEF South Asia Regional Office
UNICEF Eastern and Southern Africa
Regional Office
P.O. Box 44145
Nairobi, Kenya
UNICEF West and Central Africa
Regional Office
P.O. Box 29720 Yoff
Dakar, Senegal
P.O. Box 5815
Lekhnath Marg
Kathmandu, Nepal
Further information is available at
our website <www.unicef.org>
As the world presses
ahead with the
strategies, initiatives
and financing needed to
realize the vision of the
Millennium Declaration,
it must not allow the
children most in need
of care and protection
– the excluded and the
invisible – to be forgotten.
United Nations Children’s Fund
3 United Nations Plaza
New York, NY 10017, USA
[email protected]
www.unicef.org
US $12.95 UK £7.95
ISBN-13: 978-92-806-3916-2
ISBN-10: 92-806-3916-1
Sales no.: E.06.XX.1
© The United Nations Children’s Fund
(UNICEF), New York
December 2005
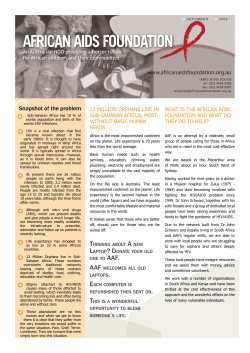


© Copyright 2026