
Child Weight July 2012 NOO data factsheet Key points
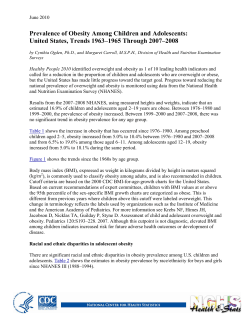
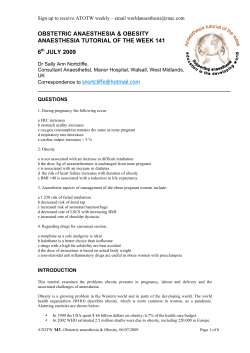
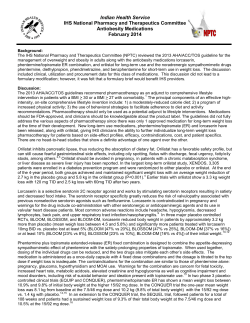
NOO data factsheet Child Weight www.noo.org.uk July 2012 Key points Obesity among 2–10 year olds rose from 10.1% in 1995 to 14.6% in 2010 according to Health Survey for England (HSE) figures. There are growing indications that the previous upwards trend in child obesity may now be flattening out. However it is still too early to be certain that this represents a long-term change in the trend, particularly for older boys. Future HSE data will confirm whether this is a persistent pattern, or just a short-term change in a long-term upwards trend (Table 1, Figure 1). According to the HSE, in 2010, obesity prevalence among 11–15 year olds was 18.3% (Table 2). The 2010/11 National Child Measurement Programme (NCMP) showed that obesity prevalence among 4–5 year olds (Reception) was 9.4% and among 10–11 year olds (Year 6) was 19.0% (Table 3). NCMP data show a trend of increasing obesity prevalence among both boys and girls in Year 6 between 2007/08 and 2010/11 (Figure 2). The pattern of changes in body mass index (BMI) is different in different age groups. Compared to the British 1990 baseline, Reception year children have slightly higher BMIs and the shape of the distribution has remained the same. However in Year 6 the pattern is skewed, with many more children at the right hand side of the chart, with higher BMIs, in 2010/11 compared to the 1990 baseline (Figures 3 & 4). Obesity prevalence shows strong links with deprivation. Figure 5 shows very clearly that as deprivation rises so does the prevalence of obesity, for both Reception and Year 6 children. There is variation in obesity prevalence by ethnic group for both Reception and Year 6 children. Boys in Year 6 from all minority groups are more likely to be obese than White British boys. For girls in Year 6, obesity prevalence is especially high for those from Black African and Black Other ethnic groups. Some of these differences may be due to the influence of factors such as deprivation and, possibly, physical differences such as height (Figures 6 & 7). NOO | Child weight factsheet 2 Current figures HSE figures show that the prevalence of obesity in children aged 2–10 years is around 14% and the prevalence of overweight including obesity is around 28%. There was not much change in obesity prevalence between 2008 and 2010. Table 1: Prevalence of overweight and obesity among children aged 210 years All children Overweight Obese Overweight including obese Boys Overweight Obese Overweight including obese Girls Overweight Obese Overweight including obese 2008 (%) 2009 (%) 2010 (%) 13.4 13.9 27.3 13.9 14.4 28.3 13.6 14.6 28.2 13.8 14.4 28.3 16.2 13.7 29.9 14.3 15.3 29.6 13.0 13.3 26.3 11.5 15.2 26.7 13.0 13.9 26.8 Source: Health Survey for England Table 2 shows that the prevalence of obesity in 11–15 year olds from HSE data is around 18% and the prevalence of overweight and obesity is around 34%. Table 2: Prevalence of overweight and obesity among children aged 1115 years All children Overweight Obese Overweight including obese Boys Overweight Obese Overweight including obese Girls Overweight Obese Overweight including obese Source: Health Survey for England www.noo.org.uk 2008 (%) 2009 (%) 2010 (%) 15.7 19.5 35.2 14.6 17.7 32.3 15.5 18.3 33.8 15.7 20.6 36.3 14.0 19.7 33.7 14.3 19.9 34.3 15.6 18.3 33.9 15.3 15.4 30.7 16.8 16.6 33.4 NOO | Child weight factsheet 3 Table 3 shows that prevalence of child obesity and overweight from the NCMP have remained stable between 2008/09 and 2010/11 for children in Reception, whereas the prevalence for children in Year 6 appears to be increasing. Around 9% of children in Reception are classified as obese, compared to around 19% of children in Year 6. Table 3: Prevalence of overweight and obesity by school year 2008/09 (%) 2009/10 (%) 2010/11 (%) 13.2 9.6 22.8 13.3 9.8 23.1 13.2 9.4 22.6 14.3 18.3 32.6 14.6 18.7 33.4 14.4 19.0 33.4 Reception (aged 4-5 years) Overweight Obese Overweight including obese Year 6 (aged 10-11 years) Overweight Obese Overweight including obese Source: National Child Measurement Programme Trends The HSE provides data going back over a number of years demonstrating trends in child weight status. Figure 1 shows the prevalence of obesity from 1995 to 2010. Since 1995 there has been an increase in the prevalence of obesity among boys aged 2–15 from 11% to 17%, while for girls the increase has been from 12% to 15%. As shown in Figure 1 there has not been a consistent trend over that time, with a steady increase in prevalence up to 2004, and an apparent decline since then. Although the indications are that there has been a levelling off in prevalence of child obesity in recent years, it is still too early to be certain that this represents a long-term change in the trend, particularly for older boys and younger girls. The proportion of 11–15 year old boys recorded as obese in 2010 was 20% (among the highest levels recorded) and there has been no significant change in prevalence in this age group over the last six years. The proportion of 2–10 year old girls recorded as obese in 2010 was 14%. This figure has remained similar over the last five years. It is important to exercise caution in interpreting these findings until subsequent data give a more statistically robust indication of any changes. www.noo.org.uk NOO | Child weight factsheet 4 Figure 1: Overweight and obesity prevalence among children aged 215 years, by sex (three year moving averages), 1995 to 2010 35% 30% Prevalence 25% 20% 15% 10% Boys obese Boys overweight including obese Girls obese Girls overweight including obese 5% 0% Source: Health Survey for England Between 2009/10 and 2010/11 obesity prevalence as measured by the NCMP decreased for both boys and girls in Reception. Analysis of all years of NCMP measurements suggests that the decrease among boys in Reception may represent part of a longer term trend. However, there is less evidence to suggest that the obesity prevalence among girls of this age is undergoing a sustained decrease. Obesity prevalence among children in Year 6 rose between 2009/10 and 2010/11, and this also appears to be part of a longer term trend. The addition of a further year of good quality NCMP data into trend analysis seems to confirm that obesity prevalence is indeed rising for this age group. Figure 2: Prevalence of obesity 2006/07 to 2010/11 by school year and sex Year of measurement 20.0% 20.0% 20.4% 20.6% 19.0% 16.6% 16.5% 17.0% 15.8% 10.7% 10.4% 10.3% 10.5% 10.1% 9.1% 8.8% 8.9% 9.2% 8.8% Reception boys Reception girls Source: National Child Measurement Programme www.noo.org.uk Year 6 boys Year 6 girls 17.4% NOO | Child weight factsheet 5 BMI distribution Using data from the NCMP, Figure 3 compares children in Reception in 2010/11 with children from the British 1990 growth reference, the baseline population used to classify children’s BMI. For both boys and girls, the whole curve has shifted slightly to the right but the shape of the distribution is very similar. This shows that the rise in BMI since 1990 is spread across the whole population: that is, on average all children are slightly heavier. Figure 4 shows a different pattern for children in Year 6. Here the shape of the distribution has changed quite considerably since the 1990 baseline. The curve is now more skewed, with many more children at the right hand side of the chart, with higher BMIs, above the 85th centile. These findings suggest that while obesity prevalence has increased in both Reception and Year 6 since the 1990 baseline, the pattern of change across the whole population differs. In the older age group, there are not only more overweight and obese children, but these children are now likely to be heavier than was the case in 1990. Figure 3: Distribution of BMI for Reception children (aged 45 years) 2010/11, compared to the 1990 baseline population Boys Girls 1990 baseline 85th centile 91st centile 95th centile 98th centile 2nd centile 10 12 14 16 18 20 22 24 26 28 30 32 34 36 38 40 42 44 46 48 50 52 54 56 58 60 62 64 66 68 70 72 74 76 78 80 82 84 86 88 90 92 94 96 98 100102104106108110112114116118120122124126128130 BMI z score Source: National Child Measurement Programme BMI z score is a measure of BMI adjusted for age www.noo.org.uk NOO | Child weight factsheet 6 Figure 4: Distribution of BMI for Year 6 children (aged 1011 years) 2010/11, compared to the 1990 baseline population Boys Girls 1990 baseline 85th centile 91st centile 95th centile 98th centile 2nd centile 10 13 16 19 22 25 28 31 34 37 40 43 46 49 52 55 58 61 64 67 70 73 76 79 82 85 88 91 94 97 100 103 106 109 112 115 118 121 124 127 130 Source: National Child Measurement Programme BMI z score BMI z score is a measure of BMI adjusted for age Obesity and deprivation Obesity prevalence is strongly correlated with deprivation and is highest in the most deprived areas. Figure 5 shows a steady rise in obesity prevalence, with increasing deprivation, for both Reception and Year 6 children. Figure 5: Prevalence of obesity by deprivation decile in Reception (aged 45 years) and Year 6 (aged 1011 years) children, 2010/11 Year 6 Reception 23.6% 23.8% 22.1% 20.6% 19.6% 18.0% 16.0% 16.6% 14.8% 12.7% 6.3% Least deprived 11.7% 7.0% 7.6% 8.1% 8.4% 9.4% 10.3% Index of Multiple Deprivation 2010 decile 12.2% 10.7% Most deprived Source: National Child Measurement Programme For this chart, the children measured in each school year have been divided into ten groups (deciles) according to the 2010 Index of Multiple Deprivation (IMD) score of where they live. Obesity prevalence figures have then been calculated for each group. www.noo.org.uk NOO | Child weight factsheet 7 Obesity and ethnicity Figures 6 and 7 present obesity data by ethnic group, school year, and sex. They show significant differences in obesity between different ethnic groups and between sexes and school years. Reception children from Indian and Mixed ethnic groups have similar prevalence of obesity to White ethnic groups. Obesity prevalence among boys in Reception is highest in the Black African, Black Other, and Bangladeshi groups. For girls in Reception obesity prevalence is highest among those from Black African, and Black Other ethnic groups. Boys in Year 6 from all minority ethnic groups are more likely to be obese than White British boys, with boys of Bangladeshi, Asian Other, and Pakistani ethnicities having the highest prevalence. For girls in Year 6, obesity prevalence is especially high for those from Black African and Black Other ethnic groups. The prevalence of obesity in boys in Year 6 from some Asian groups, particularly those of Bangladeshi, Asian Other and Pakistani ethnicity, is as high or higher, than that for the Black African and Black Other ethnic groups despite a general perception that the latter groups have the highest obesity prevalence. Some of these differences may be due to the influence of factors such as deprivation, and possibly, in part to physical differences such as height. Figure 6: Prevalence of obesity by ethnic group among children in Reception (aged 45 years), 2010/11 16.9% 16.0% 14.6% 14.5% 13.8% 13.1% 12.0% 11.5% 10.5% 10.7% 9.3% 10.8% 9.8% 9.2% 10.3% 9.4% 9.3% 8.1% 8.6% BOYS Source: National Child Measurement Programme www.noo.org.uk GIRLS Any other ethnic group Black Other Black African Asian Other Bangladeshi Pakistani Indian Mixed White Other White British Any other ethnic group Black Other Black African Asian Other Bangladeshi Pakistani Indian Mixed White Other White British 7.5% NOO | Child weight factsheet 8 Figure 7: Prevalence of obesity by ethnic group among children in Year 6 (aged 1011 years), 2010/11 29.4% 28.1% 27.3% 26.8% 25.4% 27.0% 27.6% 26.6% 24.2% 23.5% 22.4% Source: National Child Measurement Programme www.noo.org.uk GIRLS Any other ethnic group Black Other Black African Asian Other Bangladeshi Indian 15.6% Mixed White Other White British Any other ethnic group Black Other Black African Asian Other Bangladeshi Pakistani Indian Mixed White Other BOYS 17.4% 17.6% 16.4% 16.3% White British 21.1% 21.1% 19.5% Pakistani 19.2% NOO | Child weight factsheet Data sources Health Survey for England The HSE is a cross-sectional survey which samples a representative proportion of the population. Timing of data collection: The survey is conducted annually. Data for some of the time series are available from 1993 onwards. Certain years include ‘boost samples’ which focus on specific population groups: e.g. 2004 included a boost of individuals from minority ethnic groups. Date of next release: The report on the HSE 2011 should be published online in December 2012. The data should be available from the UK Data Archive in the spring following publication of the report. National Child Measurement Programme The NCMP is an annual programme that measures the height and weight of children in Reception (aged 4–5 years) and Year 6 (aged 10–11 years) in England. Although the NCMP only covers certain age groups, it includes the majority of children in those year groups. The participation rate in 2010/11 was 93%. The NCMP dataset is compliant with the Code of Practice for Official Statistics and has therefore been accredited with “National Statistic” status. Timing of data collection: The NCMP was established in 2006. Data are collected annually during the school year. Date of next release: The Health and Social Care Information Centre will report NCMP data for the 2011/12 school year in December 2012. Definitions Body mass index classification in children BMI is a measure of weight status that adjusts for height. BMI is a person’s weight in kilograms divided by the square of their height in metres. In this briefing the British 1990 growth reference (UK90) is used to determine weight status according to a child’s age and sex. Children whose BMI is between the 85th and less than the 95th centile are classified as overweight and those at or above the 95th centile are classified as obese. This definition is commonly used in the UK for population monitoring rather than clinical purposes. For clinical assessment, children whose BMI is between the 91st and less than the 98th centile are classified as overweight and those at or above the 98th centile are classified as obese. Confidence intervals on the charts Error bars (I) on the charts are 95% confidence intervals. These indicate the level of uncertainty about each value on the chart. Wider intervals mean more uncertainty. www.noo.org.uk 9 NOO | Child weight factsheet 10 Useful resources Health Survey for England http://www.ic.nhs.uk/statistics-and-data-collections/health-and-lifestyles-related-surveys/healthsurvey-for-england http://www.dh.gov.uk/en/Publicationsandstatistics/PublishedSurvey/HealthSurveyForEngland/Hea lthsurveyresults/index.htm National Child Measurement Programme http://www.noo.org.uk/data_sources/child/national_child_measurement_programme http://www.ic.nhs.uk/ncmp Statistics on Obesity, Physical activity and Diet: England, February 2012 http://www.ic.nhs.uk/statistics-and-data-collections/health-and-lifestyles/obesity/statistics-onobesity-physical-activity-and-diet-england-2012 Index of Multiple Deprivation 2010 http://www.communities.gov.uk/communities/research/indicesdeprivation/deprivation10/ Changes summary March 2010: Original report. June 2011: Updated to include 2009/10 NCMP data and 2009 Health Survey for England data where available. July 2012: Updated to include 2010/11 NCMP data and 2010 Health Survey for England data where available. Contact Email: [email protected] Web: www.noo.org.uk Telephone: 01865 334900 www.noo.org.uk Delivered by NOO on behalf of the Public Health Observatories in England


© Copyright 2026