
Franklin County’s Children
Franklin County’s Children a look at their lives in and out of the classroom February, 2012 Dear Friends, This report does not belong neatly tucked away on your bookshelf. It demands to be read, studied, and discussed. It takes a detailed view of the lives of central Ohio children and examines many factors that affect their success in and out of school. It gathers facts that paint a comprehensive picture and provide us with a baseline for measuring our children’s success. Consider it a call to action. Every one of the numbers on these pages, every statistic and every fact represent our children. Make no mistake, these are our children because their success, or lack of it, will have repercussions for all of central Ohio. If we want to live in a safe and vibrant community that is fully prepared to compete in the 21st century, we must ensure that our children receive the high quality education they need to grow, succeed, and become lifelong learners. This report tells us we have arrived at the threshold of a new era. If we do not come together and marshal all of our efforts to create significant change, the current generation of students will be the first in American history to see their standard of living decline compared to their parents. We can’t let that happen. Together, we have to create new, positive partnerships and collaborations that propel our students and our community in the right direction. The good news is there are many innovative efforts going on in our local community that provide a strong foundation for future success. We can build on that by ensuring that effective approaches are shared across child serving systems and by committing to a process of continuous improvement where we are steadfast in our pursuit of a high quality education. Central Ohio is building the will to create fundamental change—to collaborate and make a collective impact that will far surpass what any individual group or organization is capable of achieving. There has been significant movement already. Many visionary community leaders have come together to create Learn4Life—a birth-to-career, community-wide support system focused on providing every child with the opportunity to succeed. United Way of Central Ohio has expanded our work in education, organized it under Champion of Children, and placed community engagement at the forefront of our education efforts. This report represents the first venture of a continuing collaboration between the two organizations and our many partners. But let’s be candid—the issues that face us are complex and have deep roots. They developed over many years, and it will take many years to address them effectively. Our community needs to dedicate itself to creating lasting systemic change. We will not see dramatic improvements in one or two years, but if we are relentless in our pursuit of excellence we can make a difference. This report is a starting point for that change. The children it represents need champions. They need a community of motivated, engaged people who understand the obstacles they face and are willing to work together to improve their lives and our collective future. They need you. This is not just a report; it is a call to action. Please join us. Sincerely, Janet E. Jackson President and CEO United Way of Central Ohio Steve Votaw Executive Director Learn4Life Table of Contents Executive Summary . . . . . . . . . . . . . . . . . . . . ... i Learn4Life Columbus .................. 18 Franklin County Youth . . . . . . . . . . . . . . . . . ....1 References ............................. 27 Franklin County School Districts . . . . . . . .. 5 Acknowledgements .................... 29 Obstacles to Academic Success . . . . . . ... 10 Change the Odds ...................... 32 Champion of Children . . . . . . . . . . . . . . . . . . .. 14 Executive Summary Central Ohio is known as a great place to raise a family. Like many communities, we endeavor to support and advance the quality of life for all residents, including our children. One of the most important indicators of the well-being of children is their educational success. However, there is a growing recognition that academic achievement depends upon both strong schools and individual, family, peer, and community factors beyond the school walls. In order to design strategies that support the success of children, it is important to understand the characteristics of our children and schools, as well as the challenges they face. This new report brings that information together in one place, including data and research on Franklin County youth, Franklin County school districts, and obstacles to academic success prepared by Community Research Partners. In addition, it describes the roles of Champion of Children and Learn4Life Columbus in helping children and youth succeed. The report also represents the beginning of what will be a continuing collaboration between Champion of Children and Learn4Life Columbus—a collaboration that will include the many partners throughout Franklin County working on behalf of child wellbeing and academic success. It reinforces that we all have a stake in making sure that today’s children grow up equipped with the skills to succeed in school and life. Profile of Franklin County Youth Characteristics The youth population of Franklin County—more than 278,000 persons under age 18 in 2010—experienced the following important trends from 2000 to 2010: •Increase in population size, despite a statewide decrease •Increase in diversity, through both a loss in white population and growth in other racial/ethnic groups •Increase in percentage of children in households headed by single parents •Increase in percentage of school age children (ages 5-17) with all parents in the labor force •Increase in poverty rate among school age children If a single classroom of 30 students reflected the composition of all Franklin County youth in 2010: •13 students would be non-white and 2 would be Hispanic or Latino •3 students would be foreign born and 6 would have a foreign-born parent •4 students would speak a language other than English at home •11 students would be in a family with no spouse present, 9 with single mothers, 2 with single fathers •2 students would live with a grandparent •8 students would be in a household with income below the Federal Poverty Level i | Franklin County’s Children: a look at their lives in and out of the classroom Obstacles to success Factors related to an individual child, and his or her family, peers, school, or neighborhood or broader community can present risks that play a part in the likelihood the child will succeed in school. A selection of risk factors faced by Franklin County children includes the following: •Income-related factors such as poverty (one in five school age children live in poverty); food insecurity (31% of children are in households that receive food stamp assistance) and housing instability (annually, about 1,600 children are in families seeking emergency shelter). •Low birth weight. Franklin County children are more likely to be born at a low birth weight (12.1%) than are babies in Ohio (10.2%) or the United States (8.9%). •Abuse and neglect. Franklin County has about 2,500 substantiated cases of child abuse or neglect each year. •Early education. The majority of 3- and 4-year-old children (59%) are not enrolled in preschool. •Drug and tobacco use. Among teenage survey respondents, 14% reported using alcohol each month and 7% reported smoking cigarettes each week. •School safety. Among teenage survey respondents, 38% reported experiencing bullying or intimidation at school. •Delinquency. Franklin County youth detention centers have about 2,800 admissions each year. Profile of Franklin County School Districts Characteristics Sixteen public school districts are fully or primarily located within Franklin County, and five of them are among the 12 largest in the state. As of school year 2011, the average daily enrollment of the combined 16 districts is approximately 161,500 students, with 49,600 (31%) in the Columbus City Schools district. The 16-district combined enrollment is 43% minority, as compared to 26% statewide. Table i. Enrollment by Franklin County school district Bexley Canal Winchester Columbus Dublin Gahanna-Jefferson Grandview Heights Groveport Madison Hamilton Local Hilliard New Albany-Plain Reynoldsburg South-Western Upper Arlington Westerville Whitehall Worthington 16 districts total Ohio public schools School Year (SY) 2011 2,130 3,446 49,616 13,614 7,028 1,092 5,746 3,005 14,945 4,191 5,811 19,336 5,542 14,105 2,818 9,098 161,523 1,749,248 Change SY 2001—SY 2011 -116 +1,368 -14,014 +2,514 +679 -140 -16 +366 +2,604 +2,253 +163 +327 +143 +1,111 -13 -879 -3,650 -309 -5.2% +65.8% -22.0% +22.6% +10.7% -11.4% -0.3% +13.9% +21.1% +116.3% +2.9% +1.7% +2.6% +8.6% -0.5% -8.8% -2.2% <0.1% Source: Ohio Department of Education ii Executive Summary Continued Franklin County has mixed academic achievement results compared to statewide averages. Relative to all Ohio public schools, the combined 16 districts have: • A lower percentage of children scoring in the top two bands of the Kindergarten Readiness Assessment for Literacy (KRA-L) and achieving proficiency on the Ohio Achievement Assessments (OAA) 5th Grade Science. • A similar percentage of students achieving proficiency on the OAA 3rd Grade Reading or the 8th Grade Math. • A higher rate of proficiency on the 10th Grade Social Studies and a higher rate of high school students graduating on time. Table ii. Report card rating and enrollment by Franklin County school building, SY 2011 Schools School with rating available Academic Emergency Academic Watch Continuous Improvement Effective Excellent Excellent with Distinction 292 18 33 48 46 104 43 Enrollment 100.0% 6.2% 11.3% 16.4% 15.8% 35.6% 14.7% 159,493 4,870 13,941 25,430 24,281 70,308 20,663 100.0% 3.1% 8.7% 15.9% 15.2% 44.1% 13.0% Source: Ohio Department of Education Obstacles to success If a single classroom of 30 students reflected the composition of students across the 16 public school districts: •14 students would be economically disadvantaged, up from 11 in school year 2007 •2 students would have Limited English Proficiency •4 students would have one or more disabilities •4 students would be in the same school building for less than a full academic year •7 or 8 students would not be proficient on achievement tests of reading and mathematics •3 students would not graduate on time Community responses to obstacles to success Champion of Children In 2010, Champion of Children joined forces with United Way of Central Ohio (UWCO) to meet the educational needs of children and young people, with the two central goals that children will enter kindergarten ready to succeed and that youth will graduate from high school well prepared for college and career. Champion of Children, long a respected resource in our community, now encompasses all of UWCO’s work in the area of education. Under the Champion of Children banner, UWCO: • Funds effective programs that make real differences in the care and education of children and young people • Engages with partners across the county to increase awareness and commitment to advancing our children’s education • Educates the community through the dissemination of relevant research and information • Advocates for those who are too young to speak for themselves but are the future of our community • Connects willing volunteers with ways to serve children and youth • Celebrates outstanding work and collaboration in the field of education in central Ohio iii | Franklin County’s Children: a look at their lives in and out of the classroom Learn4Life Columbus Learn4Life Columbus, launched in 2011, is a community-wide collaborative of educators, business leaders, colleges and universities, child and family service agencies, faith-based organizations, civic leaders, charitable foundations, and public officials. This diverse group has come together to create a new cradle-to-career educational support framework designed to provide central Ohio’s children and students with a pathway to personal and professional success. It is the aspiration of Learn4Life to create a culture of community ownership for education and to inspire students to pursue a post-secondary degree or certificate. The organization will focus on academic and non-academic barriers to learning that can affect educational experiences. Learn4Life will promote the use of effective practices, reliable data, a continuous improvement process, and increase the number of students achieving academic success. Key goals and community indicators The Learn4Life Governing Board has selected key goals and community indicators on which to focus. Learn4Life and its partners want to see all children enter school ready to learn, succeed academically, graduate, and enter post-secondary coursework ready to earn a certificate or degree. In its first year, Learn4Life will dedicate its time and resources to three initial community indicators, each corresponding with one of the organization’s overall goals. Through community-wide efforts and collaborations, Learn4Life and its partners will: • Increase the percentage of children entering kindergarten scoring in the highest band of the readiness assessment. • Increase the percentage of students who are proficient in mathematics in eighth grade. • Reduce the percentage of students needing remediation in post-secondary programs. These goals are ambitious but not impossible because of the tremendous support Learn4Life has already received from the community. In order to see progress within each indicator and provide children and students with the best education possible, community-wide support and action is essential in this effort. iv Franklin County Youth In this section, we provide a general profile of youth characteristics in Franklin County using the most recent data from the U.S. Census Bureau. Topics include age groups, race and ethnicity, birthplace, language, housing type, family type, and poverty, as well as changes over the decade in these facets of the youth population. Data on youth living in the Columbus City Schools (CCS) District and Ohio overall are included for comparison. In one classroom… If a single classroom of 30 students reflected the composition of the Franklin County youth population: • 13 would be non-white and 2 would be Hispanic or Latino • 3 would be foreign born and 6 would have a foreign born parent • 4 would speak a language other than English at home • 11 would be in a family with no spouse present, 9 with single mothers and 2 with single fathers • 2 would live with a grandparent • 8 would be in a household with income below the Federal Poverty Level Total population: Franklin County youth population grows in contrast to statewide decrease. Franklin County, Ohio is a county of more than 278,000 youth, with approximately 195,000 in the primary and secondary school age range of 5 to 17. The CCS District includes nearly 69,000 school age children in its boundaries. Similar to the statewide proportion, youth represent approximately one-quarter of the total population in Franklin County. Franklin County’s population under age 18 grew by 3.8%, adding more than 10,000 youth since 2000, whereas Ohio’s overall youth population decreased by 5.5%. Table 1. Population by age Total population Under age 18 Under age 5 Ages 5 to 17 2010 Change 2000—2010 Franklin County Franklin County 1,163,414 278,542 83,117 195,425 +94,436 +10,221 +5,754 +4,467 Sources: Decennial Census 2000 and 2010 1 | Franklin County’s Children: a look at their lives in and out of the classroom Percent of total population 2010 Franklin County 1,163,414 23.9% 7.1% 16.8% CCS District Ohio 500,906 20.7% 7.0% 13.8% 11,536,504 23.7% 6.2% 17.4% Race and ethnicity: Franklin County youth population has become more diverse. The Franklin County youth population is 44.6% minority race or ethnicity, meaning non-white or of Hispanic origin. More than one in four youth in Franklin County (27.6%) are black or African American, 3.6% are Asian, 3.8% are some other race alone, and 6.6% are multiracial. The representation of these racial groups is higher in Franklin County than in Ohio overall. In the CCS District, half of all youth (49.7%) are black or African American. Over the decade, the white youth population of Franklin County decreased by 20,500 people, or 11%. However, the county’s total youth population grew as a result of increases in nearly every racial category. Franklin County outpaced the state in rate of growth in youth who are black (+22.5% compared to -2.5%) and youth who are Hispanic (+173.5% compared to +69.0%). The county’s percentage growth in Asian youth (+37.5%) and multiracial youth (+65.7%) were similar to statewide increases. Table 2. Children by race and ethnicity Total population under age 18 One race White Black or African American American Indian and Alaska Native Asian Native Hawaiian, other Pacific Islander Some other race Two or more races Hispanic or Latino, any race 2010 Franklin County 278,542 260,130 162,200 76,800 663 10,102 296 10,069 18,412 20,639 Change 2000—2010 Franklin County +10,221 +2,924 -20,499 +14,122 -106 +2,755 +184 +6,468 +7,297 +13,092 Percent of population under age 18 in 2010 Franklin County 278,542 93.4% 58.2% 27.6% 0.2% 3.6% 0.1% 3.6% 6.6% 7.4% CCS District Ohio 103,906 92.4% 36.0% 49.7% 0.3% 2.0% 0.2% 4.2% 7.6% 8.4% 2,730,751 95.2% 76.7% 14.8% 0.2% 1.7% 0.0% 1.7% 4.8% 5.0% Source: Decennial Census 2000 and 2010 Birthplace: Franklin County has nearly three times the state rate of foreign born youth. The nearly 22,500 foreign born children in Franklin County represent 8.5% of all children. More than 49,000 Franklin County youth, or nearly one in five children, have a foreign born parent. Table 3. Children who are foreign born or have foreign born parent Children under age 18 (living with own parent) Foreign born At least one parent who is foreign born 2010 Percent of children under age 18 in 2010 Franklin County 265,960 22,498 49,110 Franklin County 265,960 8.5% 18.5% CCS District Ohio 102,452 10.2% 19.2% 2,591,203 3.0% 7.2% Sources: American Community Survey 2010 2 Language spoken: Nearly 25,000 school age children speak a language other than English at home. Table 4. Language spoken at home by school age children Children ages 5 to 17 English only Spanish Other Indo-European languages Asian and Pacific Island languages Other languages 2010 Change 2000—2010 Franklin County 195,584 170,781 9,454 3,784 4,488 7,077 Franklin County +4,644 -4,774 +3,978 +53 +1,062 +4,325 Percent of school age children 2010 Franklin County 195,584 87.3% 4.8% 1.9% 2.3% 3.6% CCS District Ohio 73,028 87.3% 5.4% 1.7% 1.6% 4.1% 2,004,794 93.0% 2.8% 2.5% 0.9% 0.8% Sources: Decennial Census 2000, American Community Survey 2010 Home ownership: Four in 10 county householders with children, and 6 in 10 living in the CCS District, are renters. Table 5. Households with children by ownership status of householder 2010 Franklin County 147,653 63,396 84,257 Households with children under age 18 Renter householder Owner householder Percent of population under age 18 in 2010 Franklin County 147,653 42.9% 57.1% CCS District Ohio 53,635 60.6% 39.4% 1,437,882 33.7% 66.3% Source: Decennial Census 2010 Family type: Single parent families are becoming more common for Franklin County children. Although being a part of a married couple family is still the norm for Franklin County children, more than 94,000 (37.8%) live with a “single” parent, i.e., no spouse present, regardless of marital status. The CCS District has nearly the same percentage of children living with a single mother (45.6%) as with a married couple (44.7%). Over the decade, the number of Franklin County children living with a single mother increased by nearly 11,600, or 18.4%, whereas children living with a single father increased by about 4,500, or 30.1%. The number of children living with married parents fell by more than 10,800, or 6.5%. In Franklin County in 2010, nearly one in five single parent families has an unmarried partner present, and more than 2,000 children live with a same-sex couple. Table 6. Children by family type Children under age 18(living with own parent) In married couple family With mother, no spouse present With father, no spouse present 2010 Franklin County 249,068 154,952 74,711 19,405 Sources: Decennial Census 2000 and 2010 3 | Franklin County’s Children: a look at their lives in and out of the classroom Change 2000—2010 Franklin County +5,235 -10,856 +11,598 +4,493 Percent of children under age 18 in 2010 Franklin County 249,068 62.2% 30.0% 7.8% CCS District Ohio 88,049 44.7% 45.6% 9.7% 2,436,267 67.3% 25.3% 7.4% Grandparents as parents: In 9,000 households, a grandparent is legally responsible for his or her grandchild. Nine out of 10 Franklin County children in households (89.6%) are the own child of the householder (including biological, step-, or adopted children). More than 17,800 children, or 6.4%, are living in a grandparent’s house, whereas 6,100 live with another relative, and 4,700 live with a nonrelative. The number of children living with a grandparent or another relative increased by 5,200, or 27.7%, over the decade. Parents in work force: More school age children have all parents in the labor force. From 2000 to 2010, the percentage of married couple households with both parents in the labor force increased from 69% to 73%, and the percentage of single parents in the labor force went from 80% to 84%. Table 7. School age children by parent labor force participation Change 2000-2010 2010 Children ages 6 to 17, living with married parents Both parents in labor force One parent in labor force Neither parent in labor force Children ages 6 to 17, living with one parent Parent in labor force Parent not in labor force Franklin County 104,789 76,603 27,260 926 66,246 55,809 10,437 Franklin County +2,534 -3,935 -1,832 +9,819 -1,307 Percent of school age children 2010 Franklin County 104,789 73.1% 26.0% 0.9% 66,246 84.2% 15.8% CCS District Ohio 27,211 70.3% 28.2% 1.5% 36,229 78.3% 21.7% 1,154,181 68.9% 29.5% 1.6% 605,319 82.3% 17.7% Sources: Decennial Census 2000, American Community Survey 2010 Poverty: 15,900 more school age children are living in poverty today than 10 years ago. Poverty is a state of economic deprivation in which a person or family lacks income needed to achieve a minimally adequate standard of living. The Federal Poverty Level (FPL) indicates the threshold income for poverty status. Franklin County has more than 39,600 school age children living in poverty, accounting for 22.2% of all children ages 6 to 17 for whom poverty is calculated. In 2000, the county poverty rate among school age children was 13.7%. Poverty is even worse for school age children living within the CCS District, where 40.5% are in poverty and nearly one in four (24.2%) are in extreme poverty below 50% FPL. Table 8. School age children by household income as percentage of Federal Poverty Level Income threshold for family of 3 in 2010 Children ages 6 to 17 Under 50% FPL (extreme poverty) 50–99% FPL (poverty) 100–199% FPL (low-income) 200% FPL or above (self-sufficiency) $8,776 $17,552 $35,104 - 2010 Franklin County 178,290 22,188 17,475 35,698 102,929 Change 2000—2010 Franklin County +4,616 +10,917 +4,985 +5,223 -16,509 Percent of school age children 2010 Franklin County 178,290 12.4% 9.8% 20.0% 57.7% CCS District Ohio 67,015 24.2% 16.3% 21.9% 37.5% 1,823,704 10.0% 11.1% 21.0% 58.0% Sources: Decennial Census 2000, American Community Survey 2010 Note: Here, reference incomes refer to weighted averages for a family of three. Exact thresholds depend on household size and number of children. 4 Franklin County School Districts In this section, we provide a description of public school districts in Franklin County using the most recent data from the Ohio Department of Education and other sources. Topics include enrollment, race and ethnicity, school rating, test achievement, and graduation, as well as selected measures of change in the enrolled population. Data for all 16 Franklin County school districts, as well as Ohio overall, are provided in this section. The school districts Sixteen public school districts are fully or primarily located within Franklin County. Five Franklin County school districts are among the 12 largest in enrollment in the state. Their rank among the more than 600 Ohio districts: Columbus (#1), South-Western (#6), Hilliard (#9), Westerville (#11), and Dublin (#12). As of school year 2010–2011 (SY 2011), the 16 districts have a combined 182 elementary schools, 73 middle schools, and 50 high schools. In addition to the 16 districts, there are 73 charter school options, ranging from small local charter schools to statewide digital learning programs. Figure 1. School districts in Franklin County (Columbus City Schools represented in orange) 5 | Franklin County’s Children: a look at their lives in and out of the classroom Average daily enrollment For school year 2011, the average daily enrollment of the combined 16 districts in Franklin County is approximately 161,500 students. The Columbus City Schools (CCS) District has approximately 49,600 students, compared to 111,900 collectively in the other 15 districts. The CCS District is about 2.5 times larger than South-Western City Schools, the next highest enrollment district in the county. The CCS District has approximately 31 students to each student in Bexley City Schools or Grandview Heights City Schools. The 2010 American Community Survey indicates that 11-12% of all students enrolled at the elementary, middle, and high school levels living in Franklin County attend a private school, for a total of approximately 20,600 students across grades 1 to 12. Table 9. Enrollment by Franklin County school district SY 2011 Bexley Canal Winchester Columbus Dublin Gahanna-Jefferson Grandview Heights Groveport Madison Hamilton Local Hilliard New Albany-Plain Reynoldsburg South-Western Upper Arlington Westerville Whitehall Worthington 16 districts total Ohio public schools 2,130 3,446 49,616 13,614 7,028 1,092 5,746 3,005 14,945 4,191 5,811 19,336 5,542 14,105 2,818 9,098 161,523 1,749,248 Change SY 2001—SY 2011 -116 +1,368 -14,014 +2,514 +679 -140 -16 +366 +2,604 +2,253 +163 +327 +143 +1,111 -13 -879 -3,650 -309 -5.2% +65.8% -22.0% +22.6% +10.7% -11.4% -0.3% +13.9% +21.1% +116.3% +2.9% +1.7% +2.6% +8.6% -0.5% -8.8% -2.2% <0.1% Percent of students across 16 districts SY 2011 1.3% 2.1% 30.7% 8.4% 4.4% 0.7% 3.6% 1.9% 9.3% 2.6% 3.6% 12.0% 3.4% 8.7% 1.7% 5.6% 100% - Source: Ohio Department of Education Ten of the 16 districts increased in enrollment size since school year 2001, and two others remained essentially the same. New Albany-Plain Local Schools and Canal Winchester Local Schools experienced exceptional growth over the decade, increasing enrollment by 116% and 66%, respectively. The CCS District had the largest decrease, with 14,000 fewer students, or a 22% loss; and Worthington City Schools decreased enrollment by nearly 900. 6 Enrollment by grade level For the combined 16 districts in school year 2011, the average enrollment for a grade level is 12,533 students (excluding kindergarten). The grade level with the largest enrollment is 9th grade with 13,850 students. A pivotal year for enrollment, the 9th grade level has 14% more students than both 8th grade (12,137) and 10th grade (11,911). This suggests many students enter, or reenter, a public school district upon reaching high school and also that the transition to 10th grade entails student losses because of dropout or pursuit of alternative learning options. In the CCS District, the 9th grade class of 4,400 students is more than 1,000 persons larger than either the 8th grade (3,370) or 10th grade (3,148) classes. Race and ethnicity of enrollment The distribution of race for Franklin County youth is reflected in the enrollments of the public school districts. The percentages of minority enrollment—students who are non-white or of Hispanic origin—are highest in Columbus (73.0%), Whitehall (55.0%), and Reynoldsburg (49.1%). The combined 16 districts are 42.8% minority, as compared to 26.0% statewide. In addition to CCS District, Groveport Madison Local Schools and Reynoldsburg City Schools each have more than one in three students who are black. Enrollment of Asian students is higher than 10% in Dublin City Schools and New Albany-Plain Local Schools, and Hispanic enrollment is higher than 10% in Whitehall City Schools and South-Western City Schools. Table 10. Race and ethnicity distribution by school district, school year 2011 All minority Bexley Canal Winchester Columbus Dublin Gahanna-Jefferson Grandview Heights Groveport Madison Hamilton Local Hilliard New Albany-Plain Reynoldsburg South-Western Upper Arlington Westerville Whitehall Worthington 16 districts total Ohio public schools 17.5% 27.8% 73.0% 29.3% 30.9% 8.6% 46.7% 20.5% 21.3% 23.3% 49.1% 29.0% 10.4% 35.1% 55.1% 26.0% 42.8% 26.0% Black, non-Hispanic 8.3% 16.9% 58.9% 3.9% 17.7% 0.9% 34.4% 10.8% 5.7% 6.1% 34.5% 12.1% 0.8% 21.2% 31.0% 8.5% 27.4% 16.5% Source: Ohio Department of Education 7 | Franklin County’s Children: a look at their lives in and out of the classroom Asian 1.7% 1.7% 2.1% 16.1% 3.3% 1.1% 2.2% 1.7% 6.0% 10.2% 1.6% 1.9% 6.1% 2.5% 1.3% 6.4% 4.2% 1.7% Multiracial 5.6% 7.4% 5.1% 5.2% 6.7% 4.7% 5.7% 5.5% 4.7% 4.0% 9.1% 4.4% 2.5% 6.3% 7.7% 6.3% 5.4% 4.2% Hispanic, any race 1.6% 1.7% 6.8% 3.9% 3.0% 1.8% 4.2% 2.4% 4.8% 2.9% 3.8% 10.3% 0.9% 4.8% 15.0% 4.7% 5.7% 3.5% Since school year 2001, the combined 16 districts have an enrollment loss of more than 16,900 non-Hispanic white students (-15.5%) and more than 2,100 non-Hispanic black students (-4.6%). On a percentage basis, Franklin County’s decreases in these two student groups are larger than losses seen statewide. In fact, public schools in Ohio collectively increased enrollment of black students by 1.8% during the same period. However, the growth in enrollment for Asian, multiracial, and Hispanic students that occurred in Franklin County’s combined 16 districts totaled a gain of more than 26,800 students and represented greater percentage growth than statewide for each group. Table 11. Enrollment by race and ethnicity across 16 school districts in Franklin County Enrollment SY 2011 Race/ethnicity Total White, non-Hispanic All minority Black, non-Hispanic Asian Multiracial Hispanic Change SY 2001—SY 2011 Percent change SY 2001—SY 2011 16 districts 16 districts 16 districts CCS District Ohio 161,523 92,331 69,192 44,204 6,824 8,668 9,166 -3,650 -16,930 13,280 -2,112 1,758 7,259 6,367 -2.2% -15.5% +23.8% -4.6% +34.7% +515.2% +227.5% -22.0% -41.6% -11.0% -22.9% -31.0% +181.2% <0.1% -7.1% +27.8% +1.8% +47.6% +244.6% +107.0% Source: Ohio Department of Education School performance ratings The distribution of enrollment by school rating differs considerably by level of school and district. Although approximately 28% of all students in the 16 districts attend schools with a rating below Effective, the same is true of 73% of elementary school students in the CCS District. Table 12. Schools and enrollment by school building rating across 16 districts of Franklin County, school year 2011 School with rating available Academic Emergency Academic Watch Continuous Improvement Effective Excellent Excellent with Distinction Schools 292 18 33 48 46 104 43 Enrollment 100.0% 6.2% 11.3% 16.4% 15.8% 35.6% 14.7% 159,493 4,870 13,941 25,430 24,281 70,308 20,663 100.0% 3.1% 8.7% 15.9% 15.2% 44.1% 13.0% Source: Ohio Department of Education 8 Academic achievement and high school graduation Based on four indicators of academic achievement in Table 13, the 16 districts of Franklin County have mixed results in comparison to statewide averages. Relative to all Ohio public schools, the combined 16 districts have: • A lower percentage of children scoring in the top two bands of the Kindergarten Readiness Assessment for Literacy (KRA-L) and achieving proficiency on the Ohio Achievement Assessments (OAA) 5th Grade Science. • A similar percentage of students achieving proficiency on the OAA 3rd Grade Reading or the 8th Grade Math. • A higher rate of proficiency on the 10th Grade Social Studies and a higher rate of high school students graduating on time. In one classroom… If a single classroom of 30 students reflected the composition of students across the 16 public school districts: • 7 or 8 would not be proficient on achievement tests of Reading and Mathematics • 3 would not graduate on time Table 13. Selected indicators of academic achievement by district, school year 2011 Bexley Canal Winchester Columbus Dublin Gahanna-Jefferson Grandview Heights Groveport Madison Hamilton Local Hilliard New Albany-Plain Reynoldsburg South-Western Upper Arlington Westerville Whitehall Worthington 16 districts total Ohio public schools Kindergarteners scoring in KRA-L Bands 2 or 3 96.5% 85.4% 65.8% 86.8% 90.1% 92.1% 59.6% 81.1% 85.8% 96.5% 76.8% 64.6% 95.6% 85.6% 55.2% 92.8% 75.8% 80.6% Proficient on OAA 3rd Grade Reading Proficient on OAA 5th Grade Science Proficient on OAA 8th Grade Math 91.3% 84.0% 60.7% 91.4% 89.3% 93.3% 77.7% 79.5% 87.9% 94.4% 83.8% 75.2% 92.7% 89.7% 65.2% 90.8% 78.3% 79.9% 89.4% 81.9% 44.2% 87.5% 81.1% 83.5% 62.5% 81.4% 82.7% 86.1% 87.7% 65.5% 86.7% 82.0% 47.0% 80.9% 68.6% 71.1% 92.7% 83.3% 47.6% 91.5% 78.8% 98.9% 73.3% 74.5% 88.9% 89.4% 78.3% 73.8% 93.8% 82.2% 73.2% 84.8% 74.0% 74.3% Source: Ohio Department of Education 9 | Franklin County’s Children: a look at their lives in and out of the classroom Proficient on 10th Grade Social Studies 97.2% 91.3% 68.9% 94.5% 92.3% 94.9% 72.5% 85.0% 93.3% 96.8% 87.5% 76.3% 96.7% 91.0% 82.9% 91.8% 84.0% 80.1% On-time graduation rate (SY 2010) 98.2% 97.4% 77.6% 98.2% 94.9% 98.0% 87.8% 92.5% 94.9% 98.5% 97.0% 88.5% 97.2% 93.3% 90.4% 95.0% 89.1% 84.3% Obstacles to Academic Success Educators know that what happens outside of the walls of a school building have a great impact on children’s academic success and achievements later in life. The personal issues, family situations, and neighborhood environments of children can either provide support or be an obstacle to student achievement. Researchers refer to these as child “risk factors” and “protective factors.” This section provides an overview of this research and a profile of obstacles to academic success among the student population of Franklin County school districts. Child risks and assets Social scientists categorize child risk and protective factors into five categories or “domains:” (1) Individual (such as temperament and intelligence); (2) Family (such as parents’ educational attainment); (3) Peers (such as the actions and values of friends); (4) Schools (such as attachment felt toward teachers and administrators); and (5) Community (such as the levels of crime in the neighborhood). Table 14 summarizes these factors.1,2,3,4,5 Table 14. Common child risks and assets identified in research literature Domain Risks Assets/Protective Factors Individual Language and cultural barriers Physical disability Emotional disturbance Depression Acting out Dependence Hyperactivity/ADHD Low IQ Unhealthy dietary behaviors Low birth weight Obesity Positive self-image Follows rules/self-disciplined Autonomy Emotional stability Being female Perceived sanctions for transgressions Involvement in productive leisure activities Family Domestic violence/abuse Low socioeconomic status/poverty Inconsistent discipline Parent(s) with low levels of education Antisocial parents Poor parent-child relations High mobility High quality parenting skills Parent(s) with higher levels of education Parent(s) employed in a management/professional position Stable housing Parental monitoring Strong parent-child bonds Peer Peer rejection Inappropriate peer models Friends who engage in problem behavior Gang affiliation Friends who engage in pro-social behavior Peer acceptance School Poor quality school Negative encounters with teachers Low GPA/test scores Low commitment to school Disruptive classroom behaviors Lack of participation in extracurricular activities Positive attitude about school Participation in one or more extracurricular activities Teacher encouragement Community Community disorganization Extreme economic deprivation High levels of crime, violence, drugs, etc. Housing in poor physical condition Limited community resources Immigrant status Unemployment Social cohesion Neighborhood pride Sources 6, 7, 8, 9, 10, 11, 12, 13, 14 10 Before a child even enrolls in school, his or her family and living situation—such as parents’ education, family income, housing, and unemployment—may contribute potential obstacles that can impede a child’s academic success later in life. However, one particular circumstance does not always cause a child to struggle, and risk factors in one or more areas may work together in complicated ways. For instance, if a family’s income is low, chances are greater that the family lives in a neighborhood with higher rates of crime, so which factor has the greater impact on success is difficult to measure with certainty. Risk factors faced by Franklin County children and youth The data describing the Franklin County youth population in the previous section of this report include demographic indicators of individual, family, and community conditions that may pose obstacles to student success. The following are additional indicators of risk for Franklin County children: • Poverty. In Franklin County, one in five school age children (22.2%) live in poverty in 2010 (American Community Survey, ACS). About 31% of children in Franklin County receive food stamp assistance (Franklin County Department of Job and Family Services), compared to 26% statewide, and 39% of the nearly 790,000 requests at Franklin County food pantries in 2010 were for children (Mid-Ohio Foodbank). • Housing instability. Frequent moves and housing instability may negatively impact school attendance and achievement as students adjust to a new living situation and school. In 2010, 20.3% of school age children living within the CCS District boundaries had lived in a different house one year ago (ACS). Of these movers, 85% moved within Franklin County. Housing instability can lead to homelessness. More than 1,700 children were in families seeking emergency shelter in Franklin County in 2010 (Community Shelter Board). In school year 2011, CCS identified 2,063 homeless students, 4.2% of average total enrollment (Ohio Department of Education, ODE). Among all Franklin County districts, Groveport Madison Local Schools had the highest percentage of homeless students (7.9%). • Low birth weight. Franklin County children are more likely to be born at a low birth weight than are babies in Ohio or the United States —12.1%, 10.2%, and 8.9%, respectively (2010 Pediatric Nutrition Surveillance, Ohio Department of Health). Having a low birth weight places children at greater risk of having learning difficulties, scoring significantly lower on reading and mathematics tests, and dropping out of high school.15 • Abuse and neglect. From 2005 to 2009, an average of about 2,500 cases of child abuse or neglect were substantiated each year in Franklin County (Franklin County Department of Childrens Services). During this period, the number of cases of neglect decreased almost one-half and sexual abuse cases decreased by more than 30%. However, cases of physical abuse almost doubled from 575 to 1,080 substantiated cases during the same time period.16 Abuse and neglect put children at risk of impaired brain development, attention-deficit/hyperactivity, depression, posttraumatic stress disorder, and cognitive and social difficulties.17 • Educational attainment of parents. In 2010, 10.5% of Franklin County adults age 25 years and over did not have a high school diploma or equivalent and nearly one in four (37.4%) had no post-secondary education (ACS). A recent long-term study demonstrated that parents’ education level affected their children’s educational and occupational success even decades later: children with more highly educated parents attained more education by age 19 than did children with less educated parents. In fact, parents’ education levels predict with great accuracy their children’s educational and occupational achievement as adults.18 • Access to early care and education. In Franklin County, most 3- and 4-year-old children (58.5%) were not enrolled in preschool in 2010 (ACS). Those children who are enrolled in preschool may not have access to quality care. In 2011, there were six children ages 0-6 years potentially in need of care for each of the 10,946 accredited or quality rated slots for children under age six in Franklin County (Action for Children and Census 2010). In addition to developing cognitive skills necessary for kindergarten, attending a preschool program at earlier ages cultivates a child’s emotional and social skills. Some research suggests that the benefits of a robust preschool can endure for the next few decades of one’s life. The benefits include a greater likelihood of high school graduation and less chance of being involved in the criminal justice system or using illegal drugs.19 • Youth risk behaviors. Older youth may engage in risk behaviors as a result of the influence of their peer group. Criminal behavior, substance abuse, and teen pregnancy can be factors in school success and completion. Franklin County youth between the ages of 14 and 17 have a greater chance of entering the court system for a felony crime than do other students in Ohio (14.0% versus 12.8%). Franklin County youth detention centers have about 2,800 admissions each year (Franklin 11 | Franklin County’s Children: a look at their lives in and out of the classroom County Court of Common Pleas). Among Franklin County 8th, 10th, and 12th graders taking the 2009 Primary Prevention, Awareness, Attitude and Use Survey (PPAAUS), about 14% of reported using alcohol once or twice a month, about 7% smoked cigarettes one or more a week, and slightly fewer smoked marijuana each week. About 1 in 10 teenagers (11.7%) reported having ever used prescription drugs or over-the-counter medications to get high. In Ohio, only one in three sexually active teenagers (31.8%) reported using birth control (Youth Risk Behavior Survey). • School safety and bullying. While at school, peers influence each other’s behavior and affect the classroom climate. Among Franklin County 8th, 10th, and 12th graders taking the PPAAUS, 38% of students reported experiencing bullying at school. Although one-third (33.7%) of students reported that respect between students is strong at their schools, 15.7% reported feeling afraid for their physical safety at school, and 12% experienced physical bullying. Risk characteristics of the student population The characteristics of the student populations in Franklin County school districts provide another perspective on obstacles to education success. School district data from ODE include the following risk indicators: (1) economically disadvantaged (eligible for free or reduced price lunch program), (2) in the same school less than a full academic year, (3) Limited English Proficiency, (4) school discipline occurrences, and (5) disabilities. In one classroom… If a single classroom of 30 students reflected the composition of the students across all 16 districts in school year 2011: • 14 would be economically disadvantaged, up from 11 in school year 2007 • 2 would have Limited English Proficiency • 4 would have one or more disabilities • 4 would be in the same school for less than a full academic year • More economically disadvantaged students in all districts. In school year 2011, nearly half the students in Franklin County school districts (46.9%) were identified as economically disadvantaged, an increase from 37.9% just four years earlier. Economic disadvantage rates increased by more than 50% in 9 of the 16 districts. • High student mobility rates in many districts. In six districts—CCS, Groveport Madison Local Schools, Whitehall City Schools, Hamilton Local Schools, Reynoldsburg City Schools, and South-Western City Schools—more than one in seven students were not in the same school for a full academic year. Many of these moves involve students moving from one district to another or between a district and a charter school. Analysis of data on Franklin County students by CRP identified 20,745 unique students, based on their state student ID, who attended CCS and at least one other district or charter building within Franklin County at some point from October 1, 2008, through the end of the school year 2011 (Community Research Partners, 2011). • Nearly 90 different languages spoken by CCS students. In the CCS District boundaries, one in ten students were (9.7%) identified as having Limited English Proficiency (LEP) in school year 2011. As many as 89 different languages are spoken by CCS students. The South-Western and Whitehall districts each had more than 10% of their respective enrollments as LEP students, and there were more than 11,800 LEP students across the 16 districts. • In nearly all districts, at least one in nine students has a disability. Among the students in all Franklin County school districts, 13.9%, or over 22,400 students, have one or more disabilities, which could include learning disabilities, speech and language impairments, cognitive disabilities, emotional disturbances, or autism. In the CCS District, about 5 of 30 students (17.2%) receive special education services, and a comparable number (17.7%) have been identified as gifted and talented. • Rate of disciplinary occurrences varies widely across districts. In Columbus City Schools in school year 2011, disciplinary occurrences included more than: 20,100 instances of disobedient/disruptive behavior; 10,800 instances related to harassment, fighting, or serious bodily injury; and 700 acts of unwelcome sexual conduct. The highest rates of disciplinary action were in Columbus City Schools, Canal Winchester, Whitehall, and Reynoldsburg. 12 Table 15. Selected indicators of risk by district Economically disadvantaged students Bexley Canal Winchester Columbus Dublin Gahanna-Jefferson Grandview Heights Groveport Madison Hamilton Local Hilliard New Albany-Plain Local Reynoldsburg South-Western Upper Arlington Westerville Whitehall Worthington 16 districts total Ohio public schools SY 2011 Rate SY 2011 Rate SY 2007 1,935 2,507 9,000 11,702 5,230 895 2,415 1,155 11,592 3,900 3,396 8,784 5,464 10,112 685 6,968 85,740 960,257 9.2% 27.2% 81.9% 14.0% 25.6% 18.0% 58.0% 61.6% 22.4% 7.0% 41.5% 54.6% 1.4% 28.3% 75.7% 23.4% 46.9% 45.1% 7.5% 15.0% 73.3% 10.2% 15.4% 9.6% 37.0% 40.3% 15.0% 3.9% 26.4% 31.0% 1.1% 22.2% 63.0% 14.1% 37.9% 35.3% Source: Ohio Department of Education Note: Disciplinary occurrences include multiple instances for a single child. 13 | Franklin County’s Children: a look at their lives in and out of the classroom In same school less than full academic year 3.0% 8.4% 19.8% 6.4% 8.4% 3.1% 21.3% 17.3% 6.2% 4.9% 14.5% 14.5% 11.9% 8.4% 18.5% 6.9% 13.1% - Other factors, school year 2011 Disciplinary Limited English occurrences per Proficiency 100 students 1.0% 2.2 2.5% 39.1 9.7% 72.0 8.0% 4.9 2.4% 17.6 1.6 3.1% 27.9 1.1% 17.8 7.3% 11.7 1.9% 5.0 4.9% 28.6 10.9% 16.0 1.1% 2.0 7.3% 21.3 13.1% 36.5 4.8% 8.0 7.3% 2.0% 23.1 With one or more disabilities 10.8% 12.4% 17.1% 8.7% 15.3% 11.5% 17.3% 10.6% 11.4% 11.3% 14.0% 14.5% 8.8% 12.8% 14.3% 11.8% 13.9% - Champion of Children Champion of Children Means Education at United Way of Central Ohio We all have a stake in making sure that today’s children grow up equipped with the skills to succeed in school and life. For this to happen, it is critical that our community is committed to children’s education. For nearly two decades, Champion of Children has been a respected resource in our community. In 2010, Champion of Children joined forces with United Way of Central Ohio to combine the efforts of devoted volunteers, experts, investors, staff, and community members in meeting our community’s education needs. We believe that anyone who assists in any way in the advancement of educational goals for youth is a champion of children. Our work starts early to prepare children for school and provides ongoing resources that encourage our youth to reach their academic and career potential. We are committed to helping children and youth succeed. Under the expanded Champion of Children banner, United Way of Central Ohio continues to: • Fund effective programs that make real differences in the care and education of children and young people; • Engage with a variety of community partners to increase awareness and commitment to advancing our children’s education; • Educate the community through the dissemination of relevant research and information; • Support parents and caregivers with training and tools to promote learning; • Advocate for those who are too young to speak for themselves but are the future of our community; • Connect willing volunteers with ways to serve children and youth; • Celebrate and share outstanding work and collaboration in the field of education in central Ohio. 14 Bold Goals for Education in Central Ohio In 2009, United Way of Central Ohio made an unprecedented ten-year commitment to the Columbus community at-large to achieve 9 Bold Goals in the areas of Education, Income, Health and Home. The ambitious but attainable Bold Goals build on previous work, setting clear targets for broad-based community change. They also allow us to track and demonstrate our progress along the way. Champion of Children efforts focus on two goals: Community Result 10- Year Bold Goal Children enter kindergarten ready to succeed; Increase the percentage of young children entering kindergarten in Franklin County public school districts who score in the top two screening categories of the Kindergarten Readiness Assessment – Literacy (KRA-L) from 75.8% to 85%. Youth graduate from high school well prepared for college and career. Increase the percentage of students who graduate from high school in Franklin County public school districts from 87% to 95%. These bold goals will not be achieved easily. But these goals can be achieved—with committed champions for change who realize that the best way to leap forward is to rally together around common objectives and educate our community on what can be accomplished when we have a shared purpose. Achieving the Bold Goals for Education Through Champion of Children, there are opportunities for everyone to get involved, to Give, Advocate or Volunteer in one or more ways to advance educational efforts in central Ohio. Figure 2. Champion of Children: Helping our Children and Youth Succeed Birth Kindergarten Kindergarten Readiness Program/Initiative Investments Graduation High School Graduation Program/Initiative Investments Advocacy/Public Policy Volunteer Engagement Community Partnerships Community Awareness/Engagement Impact Investments In 2011, United Way of Central Ohio invested nearly $10 million in efforts to help children and youth succeed. More than 95,000 children and young people are touched by United Way-funded programs and initiatives related to Education each year. Columbus Kids: Ready Set Learn, a groundbreaking community collaborative program managed by United Way, focuses on reaching every 2.5 - 4 year old child in the Columbus City Schools District to make sure they are ready for kindergarten. With the help of 106 partners, Columbus Kids has already completed assessments of more than 3,000 children in central Columbus, Weinland Park, and South Linden. It has recently expanded into the south side. Following the assessments, parents are given materials to help them address any identified needs. For more serious issues, Columbus Kids connects families with services to help their child. 15 | Franklin County’s Children: a look at their lives in and out of the classroom To date, the assessments have found that 55% of the children were on target in school readiness skills, 28.5% needed intervention, and 16% needed monitoring. Social and emotional development was the primary reason children needed more assessment. Lack of fine motor skills, like properly using crayons and pencils, was the number one reason children needed monitoring. Research shows that Columbus Kids is working. Results from a sample of 59 children showed that 30% of the children improved in the developmental areas assessed by the screening tool. Start Smart is a public-private partnership designed to increase children’s readiness for kindergarten and success in school. Begun in July, 2000 with more than 50 funding, planning and implementing partners, Start Smart works to improve the availability and quality of early learning centers in Franklin County. Start Smart efforts are based on brain research showing that the quality of early interactions increases children’s capacity to learn. In 2011, there were 100 Start Smart centers, 50 of which were accredited by the National Association for the Education of Young Children or Ohio’s Step Up To Quality, and 13 of which received quality awards. Start Smart provided just over 100 subsidized infant/toddler child care slots, as well as professional development opportunities to 145 early educators. Born Learning is Start Smart’s parent education and awareness component. Born Learning provides parents with easy-touse materials, helping turn everyday occurrences into teachable moments—approximately 6,400 Born Learning packets were distributed last year. Born Learning volunteers also conducted 127 workshops in 2011 alone, reaching the families of nearly 1,800 children. Advocacy / Public Policy Starting behind and unable to catch up without significant interventions and support in place, too many young people drop out before graduation, or graduate unprepared to succeed in higher education or the workplace. These are not just individual and family challenges. They are challenges to the systems in which we live—the school systems, and the social, economic, and political systems of the community. Therefore, United Way of Central Ohio engages in advocacy because it strengthens our organizational capacity for affecting community change and impact. UWCO’s Public Policy Agenda is developed with our volunteer committees and targets specific issues, policies, and services that promote strong communities. Early care and education is one of United Way of Central Ohio’s two highest priority issues. Specifically, United Way of Central Ohio supports public policies that increase opportunities for Ohio’s children to receive high quality early care and education from birth to age six, with an emphasis on: • Maintaining state investments in programs that increase quality of care, such as TEACH and Step Up To Quality. • Promoting services for expectant parents, newborns, infants and toddlers and their families. • Maintaining early care and education services for employed individuals earning low wages. Volunteer Engagement Champions of Children who wish to volunteer will find no shortage of opportunities, from hands-on tasks to committee work. Champions may choose to serve directly in United-Way funded programs or with United Way affinity groups such as GenNext, PRIDE Gives and the Women’s Leadership Council. Volunteers drive United Way decisions by participating on committees such as the Education Impact Council, the Kindergarten Readiness Results committee, the High School Graduation Results Committee, and more. Early in 2012, United Way of Central Ohio will launch a new web-based program that allows individuals to connect directly with volunteer opportunities in the areas of Education, Income, Health and Home. (liveunitedcentralohio.org/volunteer) In addition, each Wednesday, United Way’s web site and social media posts highlight a specific, current volunteer need in the community with our Volunteer Wednesday spotlight. 16 Of course, many companies and individuals choose to take part in Community Care Day, the largest single-day volunteering effort in central Ohio. Over the past 20 years, Community Care Day has mobilized more than 75,000 volunteers and provided an estimated half million dollars in equivalent labor costs to United Way member agencies, other nonprofit organizations, neighborhood groups and local schools in need of help. Community Partnerships Partnerships with residents, schools, funders, agencies, government organizations and businesses are pivotal to our work. We know that we must have a shared vision of how we want to move the needle on education, and we must work together to make it happen. Through active participation in community partnerships, including Learn4Life, Partners Achieving Community Transformation (PACT), and the Weinland Park Collaborative, United Way works to address non-academic barriers that stand in the way of school success by aligning and integrating efforts, leveraging resources, capitalizing on strengths, and identifying and addressing barriers and gaps. Community Awareness/Engagement Involving the whole community in our work takes two-way conversations, and Champion of Children is using a variety of methods to create ongoing dialogue about Education across our community. In 2011, we launched the Champion of Children Education Journal, an interactive electronic publication that discusses important developments, highlights the work of people and organizations in our community, and explores ideas that can help all our students succeed. It includes interviews with area thought leaders, research briefs, profiles of volunteers who are changing young lives, and opportunities to get involved. The Education Journal is free and arrives in your inbox ten times a year. Subscribe at liveunitedcentralohio.org/join-our-champion-of-children-mailing-list. Community Conversations let us tap into the thoughts and dreams of area residents and workers. More than 450 people have participated in more than 50 conversations across the county, sharing a wealth of personal insights and ideas for change. United Way uses the knowledge to help guide our core work and strategies as well as to build stronger outreach and advocacy efforts. The hundreds of people who have taken part in Community Conversations care deeply about the state of our community, our schools, and our young people. Not surprisingly, they see education as a significant community issue, with both problems and solutions arising from within the community. Community Conversation participants say we need to: • strengthen teaching and teachers • involve and engage parents • connect the schools and the community • look at the whole child and each child’s individual needs • help students see a positive future and build their aspirations Champion of Children 2012 Broadcast and Event. For the 19th year, Champion of Children has invited business and community leaders, educators, parents and caregivers to come together for dialogue on critical issues affecting children and education in central Ohio. With the generous support of corporate, media and individual sponsors, we are able to broadcast the event to all who care deeply about our future, and to provide a community-wide call to action. It will take our entire community united together to accomplish the Bold Goals for Education and create lasting change in central Ohio. 17 | Franklin County’s Children: a look at their lives in and out of the classroom LEARN4LIFE Columbus is one of the best places in the country to raise a family.20 A growing city and economy with top-rated attractions—such as the Columbus Zoo and Aquarium,21 the Center of Science & Industry,22 the Columbus Metropolitan Library,23 Huntington Park,24 and world class medical (The Ohio State University) and research institutions (Battelle Memorial Institute)—are a few reasons why residents are proud to call this city home. Columbus, like many urban communities, endeavors to be a city that supports, nurtures, and advances the quality of life for its citizens. One major quality indicator of a thriving community is the educational attainment and achievement of its students. Schools (preschool through post-secondary) that have high standards, rigorous curriculum, and top-notch teachers who help children and students reach their potential is critical to the enduring success of every community. However, there is a growing recognition that… • Students’ academic success and achievement depends upon factors beyond school walls. • Schools and families are not the sole source of educational support for children and youth. • Improving the performance of students and schools requires a well-planned, broad-based, community-wide commitment. This is the rationale driving Learn4Life, a community-wide collaborative of educators, business leaders, colleges and universities, child and family service agencies, faith-based organizations, civic leaders, charitable foundations and public officials. This diverse group has come together to create a new cradle-to-career educational support framework designed to provide central Ohio’s children and students with a pathway to personal and professional success. Learn4Life is part of a national network addressing academic and non-academic barriers to educational success. With initial investments from the Nationwide Insurance Foundation, American Electric Power, the JPMorgan Chase Foundation, and the Columbus City Schools Education Foundation, the organization began operations in July 2011. 18 Moving Toward Systemic Community Solutions There are a number of factors that impact student achievement, such as community, family and neighborhood environments, material and health resources, and personal motivation. Each year, thousands of students are considered at risk academically due to chronic absenteeism, disciplinary issues, and/or below grade level proficiency in mathematics and reading, as indicated by Columbus City Schools data.25 Research indicates that… • Chronic absenteeism is associated with lower academic performance starting as early as first grade; by sixth grade, chronic absence is a “clear predictor of students dropping out of school.26 • Discipline sanctions that result in out of school time are linked to academic underperformance, less investment in school rules and course work, less “bonding” to school, and potential increase of risk of antisocial behavior.27 • One in six students who are reading below grade level in the third grade does not graduate from high school on time, a rate four times greater than that for proficient readers.28 • According to a review of the research, students who have persistent difficulty with math in elementary school were “13 percentage points less likely to graduate from high school and 29 percentage points less likely to attend college.”29 Learn4Life acknowledges the complex conditions surrounding student achievement. However, there is evidence to suggest that through collaboration, we can help students overcome obstacles and identify a path to achieve success. Did you know? • 34% of children entering kindergarten in Columbus City Schools require reading intervention30 • 52% of Columbus eighth-graders are not proficient in math31 • 59% of Columbus City Schools graduates who enroll in a two or four year degree program will need math remediation32 Learn4Life Cradle-to-Career Framework It is the aspiration of Learn4Life to create a culture of community ownership for education and to inspire students. The organization will focus on academic and non-academic barriers to learning that can affect educational experiences. Learn4Life will promote the use of effective practices, reliable data, and a continuous improvement process to increase the number of students achieving academic success. Cradle to Career Framework* Figure 3. Cradle-to-Career community infrastructure33 Shared Community Vision Evidence-‐ Based Decision Collaborative Action Engaged Leadership Community Level Outcomes Networks formed around Priorities Partnership Accountability Structure Priority Strategies Identified Continuous Improvement Action Plans Partnership Sustainability Plan Communication & Community Involvement Scan of Existing Community Resources Comprehensive Data Mgmt. System Sustained Community Engagement Investment & Sustainability Innovation & Impact Fund | *This F19 ramework is based on the STRIVE ainfrastructure and in was created o act as a guide for communities looking to improve student outcomes by leveraging the unique Franklin County’s Children: look at their lives and out of tthe classroom strengths and addressing the complex challenges in the community. The Cradle to Career Civic Infrastructure is the organizational system that is formed within a community to use existing resources to target the needs of every individual child so they have the support they need to succeed along their learning journey. Learn4Life has been influenced by similar organizations in Canton and Dayton, and its framework is based on the work of Strive Together of Cincinnati. This framework consists of four pillars considered critical for building a ccommunity infrastructure: shared community vision, evidenced-based decision-making, collaborative action, and investment and sustainability. Learn4Life will utilize data to make decisions and measure its collective progress on indicators in an objective manner. Learn4Life will serve as a partner and mechanism that will bring together experienced leadership to explore how central Ohio can better address academic and non-academic barriers to success. The organization will work with action teams that will review the data and research related to their assigned goals and indicators, identify potential strategies, and develop a continuous improvement plan that will be integral to addressing needs, problems and opportunities. Figure 4. Learn4Life goals and indicators The Learn4Life Governing Board has selected the following key goals and indicators. The indicators (1a, 2a, and 3a above) will constitute Learn4Life’s initial focus in 2012. Additional key indicators will be targeted in future years. The following is an overview of the data and research that supports the selection of Learn4Life’s goals and indicators. Goal: Be prepared for school The foundation for reading success is built well before kindergarten, beginning in infancy and developing throughout the preschool years. Children who enter kindergarten with essential foundational skills for reading are ready to take advantage of reading instruction. However, children who enter kindergarten without these skills start behind and without early intervention, they may stay behind. Indicator 1a: Increase the percentage of children entering kindergarten scoring in the highest band of the readiness assessment Ohio’s Kindergarten Readiness Assessment-Literacy (KRA-L) is an evaluation of children’s early reading skills prior to kindergarten. Scores are divided into three bands used to guide educators’ decisions regarding further assessment and instruction. Band 1, the lowest-scoring band, indicates a need for assessing the student for “specialized” instruction. Band 2 indicates a need for assessing for “targeted skill” instruction, and Band 3 indicates the child is ready for “enriched” instruction. Each band suggests the appropriate level of instruction. As shown in the following graph, Columbus City Schools has a higher percentage of students scoring in Band 1 of the KRA-L, the lowest band, compared to the state average. More than 34% of students in Columbus City Schools scored in Band 1 and are already at-risk academically and in need of specialized instruction. 20 Figure 5. Kindergarten Readiness | Percentage of students scoring in band 1 of the KRA-L34 Source: Ohio Department of Education Indicator 1b: Increase the percentage of students who are proficient in reading in third grade “Reading proficiently by the end of the third grade can be a make-or-break benchmark in a child’s educational development,” according to a special report by the Annie E. Casey Foundation.35 Reading proficiently by the end of third grade matters because from that point forward, students are reading to learn subject content in all other academic areas. As the following graph illustrates, 60.8% of Columbus City Schools students scored proficient or above in third grade reading, according to Ohio Achievement Assessment (OAA) scores, as compared to the statewide average of 79.9%.36 Figure 6. Third Grade Reading | Ohio Achievement Assessment scores (at or above the proficient level) Source: Ohio Department of Education 21 | Franklin County’s Children: a look at their lives in and out of the classroom Goal: Succeed academically, graduate, and be prepared for post-secondary education Most students who drop out do so during their high school years but these high-risk students can often be identified much earlier by their attendance record and academic performance. Districts with higher poverty levels often face unique challenges in helping their students succeed. These students need academic, emotional, and social support from families and communities—support that families and communities may not be equipped to provide—to overcome non-academic barriers such as mental health issues, truancy, and teen pregnancy. Indicator 2a: Increase the percentage of students who are proficient in mathematics in eighth grade One initial focus of Learn4Life is to increase the number of students proficient in eighth grade mathematics. Science, technology, engineering and math (STEM) are at the forefront of skills necessary to be successful in the workforce. According to the National Governors Association, “over the past 10 years, STEM jobs grew three times faster than non-STEM jobs.”37 Students who fall behind in math find it difficult to reach grade level proficiency. Falling behind will not only keep students from getting a diploma, but also a job. As the following graph shows, in 2010-2011, 47.6% of eighth grade students in Columbus City Schools were considered proficient in mathematics, compared to 74.2% statewide.38 Figure 7. Eighth grade mathematics | Ohio Achievement Assessment Scores, at or above proficient level Source: Ohio Department of Education Indicator 2b: Increase the percentage of students who graduate from high school Students without a high school diploma are severely limited when it comes to career opportunities, and those who fail to complete high school tend to have higher rates of unemployment and incarceration.39 Academic disengagement is often gradual, so it is possible to identify at-risk students early and develop appropriate interventions. In 2009-2010, 77.6% of high school students graduated on-time40 from Columbus City Schools, as compared to the statewide average of 84.3%. There were 2,798 graduates and 809 non-graduates.41 22 Figure 8. High School graduation rates Source: Ohio Department of Education Goal: Earn a post-secondary degree or certificate Increasingly, post-secondary certificates and/or degrees are essential for creating a foundation for a meaningful career. According to the Alliance for Excellent Education, “in today’s complex global economy, post-secondary education is increasingly necessary for the success of individual citizens and the nation as a whole.”42 In 2009, individuals with less than a high school diploma were reportedly earning an average of $454 per week. That amount increased to $626 with a diploma, $699 with some post-secondary coursework, and $761 with an associate’s degree. It also was reported that an individual with a bachelor’s degree earned an average of $1,025 per week.43 Indicator 3a: Reduce the percentage of students needing remediation in post-secondary programs The United States loses more than $5.6 billion per year due to remedial education costs. This figure includes $3.6 billion to provide remedial education to students who have recently completed high school and an additional $2 billion in lost wages over a lifetime for students who drop out of college and therefore reduce their earning potential.44 Nationally, approximately one-third of all college freshmen enroll in at least one remedial course.45 In Columbus City Schools, 33% of students enrolling in post-secondary coursework require English remediation and 59% require mathematics remediation.46 23 | Franklin County’s Children: a look at their lives in and out of the classroom Figure 9. Students requiring post-secondary remediation in English Source: Ohio Board of Regents Figure 10. Students requiring post-secondary remediation in mathematics Source: Ohio Board of Regents Indicator 3b: Increase the number of students enrolling in a post-secondary degree or certificate program The 21st century global economy demands education beyond high school, whether it is a high-skill certificate or a two- or fouryear degree. Students, families and teachers must have access to college and career information. Lack of support and financial barriers must be addressed. In 2008, 31% of Columbus City Schools graduates entered either a two-year or four-year Ohio public institution, compared to the state average of 39%.47 24 Figure 11. Post-secondary education enrollment Source: Ohio Board of Regents Indicator 3c: Increase the number of students graduating with a post-secondary degree or certificate Individuals with higher levels of education tend to have higher incomes, better employment benefits, and better overall health than individuals with lower levels of education. This leads to substantial variation in the magnitude of health disparities across educational groups over time. However, increases in educational attainment also suggest the possibility of using education as a means to improve overall quality of life.48 The following table shows that 39.1% of Columbus City Schools students who enrolled in a two-or-four year certificate or degree program at an Ohio public institution in 2004 graduated by 2010. According to the Report on the Condition of Higher Education in Ohio, six year graduation/retention rates for Ohio’s public four-year institutions are 73% overall.49 Table 16. High School Graduates, public college entrance data | Columbus City School District graduate Six-Year Graduation Rates Ohio Public Colleges Community Colleges University Regional Campuses University Main Campuses Status Enrolled Full-Time Part-Time Full-Time Part-Time Full-Time Part-Time Total Source: Ohio Board of Regents 25 | Franklin County’s Children: a look at their lives in and out of the classroom 107 27 41 3 454 5 637 % Earning a Certificate or Associates Degree % Earning a Bachelor’s Degree or Higher 14.0% 11.1% 0.0% 33.3% 1.3% 0.0% 3.9% 7.5% 3.7% 43.9% 33.3% 42.7% 40.0% 35.2% Future Direction Placing the full responsibility of school achievement and the healthy development of children and students on families and schools will not change the odds and outcomes. Changing the trajectory from risk and failure to academic success requires a new way of doing business—one based on the evidence of what works and our collective community partnerships and actions.50 Tackling academic and non-academic barriers students face requires that we operate as a united front, working side-by-side with community leaders, stakeholders and families. Through a common vision, sustained focus, and a commitment to continuous improvement strategies, Learn4Life will work to ensure that every child has the opportunity to succeed. The Learn4Life Board identified three critical targets for one urban school district on which to focus in its first year. Learn4Life has been given the charge to meet with stakeholders, learn from other states and communities and review the research to understand what works and what actions and priorities will make a difference for our children. In the near future, Learn4Life plans to reach out to other area school districts to seek their interest and support in this effort. The Board and staff of Learn4Life look forward to working with you to help create a thriving, more prosperous Columbus. It will take everyone’s commitment to this mission if we are going to make this city the best place to live, work, and most importantly, raise a family. 26 references 1. Adelman, H.S., & Taylor, L. (2008). Rebuilding for learning: Addressing barriers to learning and teaching, and re-engaging students. New York, NY: Scholastic. 2. Arthur, M.W., Hawkins, J. D., Pollard, J. A., Catalano, R. F., & Baglioni, A. J., Jr. (2002). Measuring risk and protective factors for substance use, delinquency, and other adolescent problem behaviors: The Communities That Care Youth Survey. Evaluation Review, 26, 575-601. Retrieved from http://www.pridesurveys.com/supportfiles/CTC_ reliability.pdf 3. National Institute on Drug Abuse. (2003). Preventing drug use among children and adolescents. Retrieved from http://www.nida.nih.gov/pdf/prevention/RedBook.pdf 4. Schinke, S., Brounstein, P., & Gardner, S. (2002). Science based prevention programs and principles (DHHS Pub. No. SMA 03-3764). Rockville, MD: Center for Substance Abuse Prevention, Substance Abuse and Mental Health Services Administration. Retrieved from http://www.preventionidaho.net/Documents/csapscience.pdf 5. Wasserman, G., Keenan, K., Tremblay, R. E., Coie, J. D., Herrenkohl, Loeber, R., Petechuk, D. (2003). Risk and protective factors of child delinquency. Washington, DC: Child Delinquency Bulletin Series, OJJDP. Retrieved from http://www.ncjrs.gov/pdffiles1/ojjdp/193409.pdf 6. Foti, K., & Eaton, D. (2010). Associations of selected health risk behaviors with self-rated health status among U.S. high school students. Public Health Reports, 125, 771–781. 7. Gavazzi, S. M. (2010). An evaluation of the need to assess student reports of non-academic barriers and advantages: Using risks and assets to predict academic performance and behavioral incident consequences in school. Report for the Columbus City School District. Columbus, OH: Author. (Available upon request.) 8. Ward, P., Lundberg, N., Ellis, G., & Berrett, K. (2010). Adolescent peer followership: A self-determination theory perspective. Journal of Park and Recreation Administration, 28(2), 20–35. 9. Deater-Dechard, K., Mullineaux, P. Y., Beckman, C., Petrill, S. A., Schatschneider, C., & Thompson, L. A. (2009). Conduct problems, IQ, and household chaos: A longitudinal multi-informant study. The Journal of Child Psychology and Psychiatry, 50(10), 1301–1308. 10. Walls, T. A., & Little, T. D. (2005). Relations among personal agency, motivation, and school adjustment in early adolescence. Journal of Educational Psychology, 97(1), 23–31. 11. Attar, B. K., Guerra, N. G., & Tolan, P. H. (1994). Neighborhood disadvantage, stressful life events, and adjustment in urban elementary-school children. Journal of Clinical Child Psychology, 23, 391–400. 12. DuBois, D. L., Eitel, S. K., & Felner, R. D. (1994). Effects of family environment and parent-child relationships on school adjustment during the transition to early adolescence. Journal of Marriage and the Family, 56, 405–414. 13. Reynolds, A. J. (1992). Grade retention and school adjustment: An explanatory analysis. Educational Evaluation and Policy Analysis, 14(2), 101–121. 14. Sterling, S., Cowen, E. L., Weissberg, R. P., Lotyczewski, B. S., & Boike, M. (1985). Recent stressful life events and young children’s school adjustment. American Journal of Community Psychology, 13(1), 87–98. 15. Johnson, R. C., & Schoeni, R. F. (2007, February). The Influence of Early‐Life Events on Human Capital, Health Status, and Labor Market Outcomes Over the Life Course. National Poverty Center Working Paper Series A#07-05. Ann Arbor, MI. Retrieved from http://npc.umich.edu/publications/u/working_paper05-07.pdf 16. Annie E. Casey Foundation. (2009). Kids Count Data Center. Franklin County, Ohio, profile. Baltimore, MD. Retrieved from http://datacenter.kidscount.org/data/bystate/ stateprofile.aspx?state=OH&loc=5202 17. Administration for Children and Families. (2008). Long-term consequences of abuse and neglect. Child Welfare Information Gateway. Washington, DC. Retrieved from http:// www.childwelfare.gov/pubs/factsheets/long_term_consequences.cfm 18. Dubow, E.F., Boxer, P., & Huesmann, L.R. (2009). Long-term effects of parents’ educational and occupational success: Mediation by family interactions, child aggression, and teenage aspirations. Merrill-Palmer Quarterly, 55(3), 224-249. [PMC2853053] 19. Reynolds, A. J., Temple, J. A., Ou, S. R., Arteaga, I. A., & White, B. A. (2011, July 15). School-Based Early Childhood Education and Age-28 Well-Being: Effects by Timing, Dosage, and Subgroups. Science, 333, pp. 360-364. doi:10.1126/science.1203618 20. The Best Places to Raise Your Kids 2009: Ohio (2009). BusinessWeek Slide Shows and Multimedia. Retrieved January 9, 2012, from http://images.businessweek.com/ ss/08/11/1110_best_places_for_kids/36.htm 21. The Top 10 Zoos in America | USA Travel Guide. (n.d.). Retrieved January 9, 2012, from http://www.wrsol.com/usatravelguide/2009/02/top10zoosinamerica/ 22. Cicero, K. (n.d.). The 10 Best Science Centers in the Country. Parents. Retrieved January 9, 2012, from http://www.parents.com/fun/vacation/us-destinations/best-sciencecenters/ 23. III, J. B. (2010, May 26). 2010 Library of the Year: Columbus Metropolitan Library. Library Journal Library News, Reviews, and Views. Retrieved January 18, 2012, from http:// www.libraryjournal.com/lj/home/883793-264/2010_library_of_the_year.html.csp 24. Huntington Park named Ballpark of the Year. (n.d.). Baseball Parks. Retrieved January 9, 2012, from http://www.baseballparks.com/ColumbusPrsRel4.asp 25. 2010-2011 School Year Report Card. (n.d.). reportcard.ohio.gov. Retrieved January 9, 2012, from http://www.ode.state.oh.us/reportcardfiles/2010-2011/DIST/043802.pdf 26. Why it Matters: Attendance Works. (n.d.). Attendance Works. Retrieved January 11, 2012, from http://www.attendanceworks.org/about/why-it-matters/ 27. The Achievement Gap and the Discipline Gap: Two Sides of the Same Coin? (2010, January) Educational Researcher. Retrieved January 11, 2012, from http://edr.sagepub.com/ content/39/1/59.full.pdf+html 28. Hernandez, D. J. (n.d.). The Achievement Gap and the Discipline Gap: Two Sides of the Same Coin?. Educational Researcher. Retrieved January 11, 2012, from http://edr. sagepub.com/content/39/1/59.full.pdf+html 29. Christensen, N. (n.d.). Early math skills predict later academic success. UC Irvine Feature: Teach your kids early math skills for later success. Retrieved January 11, 2012, from http://uci.edu/features/2011/04/feature_duncan_110427.html 30. iLRC Power User Reports. (n.d.). Ohio Department of Education Interactive Local Report Card. Retrieved January 9, 2012, from http://ilrc.ode.state.oh.us/PublicDW/asp/Main. aspx?rn=/20120109233946714&n=/KRAL _Percent _By_Band_(District).pdf 31. 2010-2011 School Year Report Card. (n.d.). Ohio Department of Education. Retrieved January 11, 2012, from http://www.ode.state.oh.us/reportcardfiles/2010-2011/ DIST/043802.pdf 32. First Annual Report on The Condition of Higher Education in Ohio: Meeting the State’s Future Needs. (n.d.). Ohio Board of Regents. Retrieved January 9, 2012, from http:// regents.ohio.gov/board_meetings/report/DraftConditionReport.pdf 33. Strive Approach: Every Child Cradle to Career. (n.d.). Strive Network. Retrieved January 10, 2012, from http://strivenetwork.org/strive-approach 27 | Franklin County’s Children: a look at their lives in and out of the classroom 34. iLRC Power User Reports . (n.d.). Ohio Department of Education Interactive Local Report Card. Retrieved January 9, 2012, from http://ilrc.ode.state.oh.us/PublicDW/asp/Main. aspx?rn=/20120109233946714&n=/KRAL_Percent_By_Band_(District).pdf 35. Fiester, L. (n.d.). Early Warning: Why Reading by the end of Third Grade Matters. Annie E. Casey Foundation. Retrieved January 10, 2012, from http://www.aecf.org/~/media/ Pubs/Initiatives/KIDS%20COUNT/123/2010KCSpecReport/AEC_report_color_highres.pdf 36. 2010-2011 School Year Report Card. (n.d.). reportcard.ohio.gov. Retrieved January 9, 2012, from http://www.ode.state.oh.us/reportcardfiles/2010-2011/DIST/043802.pdf 37. Thomasian, J. (2011, December 1). Building a Science, Technology, Engineering, and Math Education Agenda. National Governors Association. Retrieved January 11, 2012, from www.nga.org/files/live/sites/NGA/files/pdf/1112STEMGUIDE.PDF 38. 2010-2011 School Year Report Card. (n.d.). reportcard.ohio.gov. Retrieved January 9, 2012, from http://www.ode.state.oh.us/reportcardfiles/2010-2011/DIST/043802.pdf 39. The problem: Our high school students face significant challenges. (n.d.). Association for Supervision and Curriculum Development. Retrieved January 10, 2012, from http:// www.ascd.org/ASCD/pdf/newsandissues/High%20School%20Reform%20One%20Page%20Summary.pdf 40. “In 2008, the U.S. Department of Education issued new regulations to require Ohio and all other states to transition to a new graduation rate formula that will provide more consistency in reporting and will allow for comparisons across states. The new formula, referred to as a “four-year, adjusted cohort graduation rate,” includes only graduates who earn either a regular or honors diploma anytime within four years of when they first enter the 9th grade, which includes the summer immediately following their fourth year of high school:” 2010-2011 School Year Report Card. (n.d.). reportcard.ohio.gov. Retrieved January 9, 2012, from http://www.ode.state.oh.us/reportcardfiles/2010-2011/ DIST/043802.pdf 41.S. Tankovich, Columbus City Schools, personal communication, January 11, 2012. 42. Saving Now and Saving Later: How High School Reform Can Reduce the Nation’s Wasted Remediation Dollars. (n.d.). Alliance for Excellent Education. Retrieved January 9, 2012, from http://www.all4ed.org/files/SavingNowSavingLaterRemediation.pdf 43. Ibid. 44. Saving Now and Saving Later: How High School Reform Can Reduce the Nation’s Wasted Remediation Dollars. (n.d.). Alliance for Excellent Education. Retrieved January 9, 2012, from http://www.all4ed.org/files/SavingNowSavingLaterRemediation.pdf 45. Ibid. 46. First Annual Report on The Condition of Higher Education in Ohio: Meeting the State’s Future Needs. (n.d.). Ohio Board of Regents. Retrieved January 9, 2012, from http:// regents.ohio.gov/board_meetings/report/DraftConditionReport.pdf 47.Ibid. 48. Central Indiana’s P-20 Talent Alliance. (n.d.). Early Childhood to College & Career: Community Baseline Report 2010. Retrieved January 10, 2012, from http://www. talentalliance.iupui.edu/Resources/2010communitybaselinereport.pdf 49. First Annual Report on The Condition of Higher Education in Ohio: Meeting the State’s Future Needs. (n.d.). Ohio Board of Regents. Retrieved January 9, 2012, from http:// regents.ohio.gov/board_meetings/report/DraftConditionReport.pdf 50. Neuman, S. B. (2009). Changing the odds for children at risk: seven essential principles of educational programs that break the cycle of poverty. Westport, Conn.: Praeger. 28 Acknowledgements Champion of Children and Learn4Life thank the many volunteers who guide our work. Learn4Life Governing Board Cheryl Achterberg, Ph.D., The Ohio State University Steve Allen, M.D., Nationwide Children’s Hospital Bo Chilton, Impact Community Action Erika Clark Jones, Columbus Mayor’s Office Lisa Courtice, Ph.D., The Columbus Foundation Tanny Crane, Crane Group The Honorable Eric D. Fingerhut, Battelle Andrew Ginther, Columbus City Council Gene T. Harris, Ph.D., Columbus City Schools David Harrison, Ph.D., Columbus State Community College Dale Heydlauff, American Electric Power Janet E. Jackson, United Way of Central Ohio Chad Jester, Nationwide Insurance Foundation Pat Losinski, Columbus Metropolitan Library Steve Lyons, The Columbus Partnership Jeff Lyttle, JP Morgan Chase Foundation Anthony Trotman, Franklin County Department of Job and Family Services Steve Votaw, Executive Director Champion of Children Advisory Committee Linda Kass (Chair), Community Volunteer Barbara Boyd, Nationwide Lisa Courtice, Ph.D., The Columbus Foundation Sandy Erb, Voices for Ohio’s Children Chad Jester, Nationwide Insurance Foundation Sharron Kornegay, Abbott Labs Teresa McWain, AEP Susan Moran, PNC Nancy Nestor-Baker, Ph.D., OSU/United Way of Central Ohio Roberta Terapak, Community Volunteer Todd Tuney, City Year Columbus Shaun Yoder, Ohio Business Alliance for Higher Education 29 | Franklin County’s Children: a look at their lives in and out of the classroom United Way of Central Ohio Board of Trustees Michael Gonsiorowski (Chair), PNC Bank Ann Pizzuti (Past Chair), Community Volunteer Joseph A. Alutto, Ph.D., The Ohio State University Christie Angel, City of Columbus Keith Bell, Columbus City Schools Brandon Dupler, Dupler Office William G. Ebbing, The New Albany Company Darrell Gammell, Plumbers and Pipefitters, Local 189 Thomas Griesdorn, WBNS TV & Ohio News Network Tom Grote, ButylFuel LLC Joseph Hamrock, AEP Ohio Michelle Heritage, Community Shelter Board Marcus Hitt, OSU, Fisher College of Business Kelvin Jones,The State of Ohio Environmental Protection Agency Linda Kass, Community Volunteer Mike Lex, Nationwide Craig Marshall, Ernst & Young Jordan A. Miller, Jr., Fifth Third Bank Timothy Miller, Crane Group Kathleen Murphy, MurphyEpson Gregory Overmyer, Overmyer Associates C. David Paragas, Barnes & Thornburg, LLP Ken Peters, Mettler-Toledo Martyn R. Redgrave, Limited Brands Robert P. Restrepo, Jr., The State Auto Insurance Group Jon Ricker, DSW Inc. Denise M. Robinson, Alvis House Mark Thompson, Huntington Bancshares Audrey G. Tuckerman, Merrill Lynch Claus P. von Zychlin, Mt. Carmel Health Systems Anthony White, Thompson Hine, LLP Janet E. Jackson, President and CEO United Way of Central Ohio Education Impact Council Keith M. Bell (Chair) Linda Day Mackessy (Vice Chair) Michael Asher Lourdes Barroso de Padilla Celeste F. Bland Jessie Cannon Duane Casares, Ph.D. Debbie Charna Tom Daugherty Elizabeth MorraLee Keller Lisa Lambert Ezetta Murray Nancy Nestor-Baker, Ph.D. Joyce Ray Marcie Rehmar Tina Rutherford Hope M. Sharett The Honorable Douglas Shoemaker Todd Tuney Steve Votaw Jane Whyde William Wise, Ph.D. Shaun Yoder Columbus Kids: Ready, Set, Learn! Advisory Committee William Ebbing (Chair) Diane Bennett Joy Chivers Lisa Courtice, Ph.D Mattie James Patrick Losinski Rebecca Love Carolyn Slack Bernice Smith, Ph.D. Dennis Sykes, Ph.D. Olivia Thomas, M.D. Anthony Trotman Jane Whyde United Way of Central Ohio Kindergarten Readiness Results Committee Shaun Yoder (Chair) Barbara Acton Diane Bennett Peggy Calestro Jessie Cannon Debbie Charna Linda Day Mackessy Shelby Dowdy Peggy Fein Joseph V. Gioffre Doreen Luke Eleanor Palmer Kathy Shahbodaghi Bernice Smith, Ph.D. Christie Stover Jane Whyde United Way of Central Ohio High School Graduation Results Committee Nancy Nestor-Baker, Ph.D. (Chair) Michael Asher Lourdes Barroso de Padilla Barbara Boyd Shaunessy Everett Elizabeth MorraLee Keller Michelle Mills Sherry Minton Darren L. Nealy Marcie Rehmar Hope M. Sharett Terree Stevenson UWCO Member Agencies: 2012 Education Program Funding Action For Children Amethyst Asian American Community Services Big Brothers Big Sisters of Central Ohio Boy Scouts, Simon Kenton Council Boys & Girls Clubs of Columbus Buckeye Ranch Central Community House Children’s Hunger Alliance City Year Columbus Clintonville-Beechwold Community Resources Center Columbus Early Learning Centers Columbus Speech & Hearing Center Columbus Urban League Communities in Schools Community Development for All People Directions For Youth & Families Drug-Free Action Alliance Educational Council EnterpriseWorks Girl Scouts of Ohio’s Heartland Council Gladden Community House Godman Guild Association Huckleberry House J. Ashburn Jr. Youth Center Kaleidoscope Youth Center Maryhaven Neighborhood House Rosemont Center Salvation Army South Side Learning & Development Centers St. Stephen’s Community House St. Vincent Family Centers Strategies Against Violence Everywhere (SAVE) US Together YMCA YWCA 30 Acknowledgements Continued Champion of Children Partners Special Thanks to: Champion Partners: Community Research Partners Roberta Garber Eben Dowell Yvonne Olivares Erin Michel Photography Thank you to these organizations for providing the photographs used in this report. Supporting Partners: The Columbus Foundation Huntington Bank Limited Brands Foundation Media Partners: Big Red Rooster Business First Mills James Productions WOSU Public Media 31 | Franklin County’s Children: a look at their lives in and out of the classroom Amethyst Big Brothers Big Sisters of Central Ohio Boys & Girls Clubs of Columbus Central Community House City Year Columbus Communities in Schools Columbus Directions for Youth & Families Godman Guild Association Huckleberry House J. Ashburn Jr. Youth Center South Side Learning & Development Center United Way of Central Ohio Change the Odds: For our Children, For our Future Get involved in issues, strategies and programs www.liveunitedcentralohio.org/champion-of-children Get behind community partnerships www.learn4lifecolumbus.org Stay informed about conditions and needs in our community www.researchpartners.org Download and share this report www.liveunitedcentralohio.org/champion-of-children 32 This report was prepared in partnership with Community Research Partners.


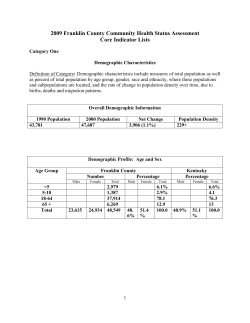
© Copyright 2026