
Adoption and Foster Care by Gay and Lesbian Gary J. Gates
Adoption and Foster Care by Gay and Lesbian
Parents in the United States
Number of adopted children
Gary J. Gates
M.V. Lee Badgett
Jennifer Ehrle Macomber
Kate Chambers
The Williams Institute
UCLA School of Law
The Urban Institute
Washington, DC
Urban Institute
March 2007
Executive Summary
Discussion and debate about adoption and foster care by gay, lesbian, and bisexual (GLB) parents occurs
frequently among child welfare policymakers, social service agencies, and social workers. They all need
better information about GLB adoptive and foster parents and their children as they make individual and
policy-level decisions about placement of children with GLB parents. This report provides new
information on GLB adoption and foster care from the U.S. Census 2000, the National Survey of Family
Growth (2002), and the Adoption and Foster Care Analysis and Reporting System (2004).
Currently half a million children live in foster care in the United States and more than 100,000 foster
children await adoption. States must recruit parents who are interested and able to foster and adopt
children. Three states currently restrict GLB individuals or couples from adopting. Several states have or
are considering policies that would restrict GLB people from fostering.
Recent government surveys demonstrate that many lesbians and gay men are already raising children,
and many more GLB people would like to have children at some point. We estimate that two million GLB
people have considered adoption. Since prior research shows that less than one-fifth of adoption
agencies attempt to recruit adoptive parents from the GLB community, our findings suggest that GLB
people are an underutilized pool of potential adoptive parents.
The report provides estimates of the number of adopted and fostered children of lesbians and gay men
and describes the demographic characteristics of parents and children. We compare gay and lesbian
parents and their adopted and fostered children to parents and children in other family arrangements,
including married and unmarried different-sex couples and single parents (who might be heterosexual or
GLB). While GLB parents are similar in many ways to other kinds of parents, we identify several
differences in the key findings below.
The report concludes with an assessment of how proposed bans on allowing GLB individuals and couples
to foster might affect foster care systems and fostered children. We estimate the possible financial cost to
states if they were to limit or deny GLB people the ability to foster, which could displace 9,000 to 14,000
children if pursued nationally. And while we cannot measure costs to children directly, we explore prior
research suggesting that displacing children from their current foster homes may have harmful effects on
the children’s development and well-being. The report closes with implications of this research for
policymakers.
Key Findings
•
More than one in three lesbians have
given birth and one in six gay men have
fathered or adopted a child.
•
More than half of gay men and 41
percent of lesbians want to have a child.
•
An estimated two million GLB people are
interested in adopting.
•
An estimated 65,500 adopted children
are living with a lesbian or gay parent.
•
More than 16,000 adopted children are
living with lesbian and gay parents in
California, the highest number among
the states.
•
Gay and lesbian parents are raising four
percent of all adopted children in the
United States.
•
Same-sex couples raising adopted
children are older, more educated, and
have more economic resources than
other adoptive parents.
•
Adopted children with same-sex parents
are younger and more likely to be
foreign born.
•
An estimated 14,100 foster children are
living with lesbian or gay parents.
•
Gay and lesbian parents are raising
three percent of foster children in the
United States.
•
A national ban on GLB foster care could
cost from $87 to $130 million.
•
Costs to individual states could range
from $100,000 to $27 million.
Table of Contents
Foster Care and Adoption in the United States.................................................................................... 1
Foster Care.................................................................................................................................. 1
Adoption ..................................................................................................................................... 1
State Policies and Gay, Lesbian, and Bisexual Adoption and Fostering................................................... 3
Variation in state policies .............................................................................................................. 3
GLB parenting research ................................................................................................................ 3
Parenting and Adoption among Gay Men, Lesbians, and Bisexuals........................................................ 5
GLB parenting.............................................................................................................................. 5
GLB desire to parent .................................................................................................................... 5
GLB interest in adopting ............................................................................................................... 6
Adoption by Gay Men and Lesbians ................................................................................................... 7
National adoption estimates .......................................................................................................... 7
State and regional estimates ......................................................................................................... 7
Adopted children by family type .................................................................................................. 11
Adoptive parent demographics .................................................................................................... 11
Adopted children demographics................................................................................................... 12
Foster Parenting by Gay Men and Lesbians....................................................................................... 15
National and regional foster care estimates .................................................................................. 15
Foster parent demographics........................................................................................................ 15
Foster children demographics...................................................................................................... 16
Impacts of Policies Prohibiting Gay Men and Lesbians from Adopting or Fostering Children................... 17
Displacement of children............................................................................................................. 17
Research on the well-being of children in foster care..................................................................... 17
Financial Impact of Excluding Gay Men, Lesbians, and Bisexuals from Fostering Children ..................... 19
National cost estimates............................................................................................................... 19
State cost estimates ................................................................................................................... 19
Cost estimate methodology......................................................................................................... 19
Conclusions and Policy Implications ................................................................................................. 23
Implications for the foster care system ........................................................................................ 23
Implications for children ............................................................................................................. 23
Implications for GLB people ........................................................................................................ 23
Appendix: Data and Methodology .................................................................................................... 25
United States Decennial Census, 2000 ......................................................................................... 25
National Survey of Family Growth 2002........................................................................................ 27
Adoption and Foster Care Analysis and Reporting System (AFCARS) 2004 ....................................... 28
References .................................................................................................................................... 33
Acknowledgements ........................................................................................................................ 37
About the Authors.......................................................................................................................... 37
About the Institutes ....................................................................................................................... 37
Foster Care and Adoption in the United States
Foster Care
On any given day in the United States, about a half
million children are living in foster care (U.S. DHHS,
2007). In 2004, approximately three million children
were investigated by child welfare agencies in the
United States for possible child abuse and neglect
(U.S. DHHS, 2006a). About 872,000 of these children
were confirmed as victims of child abuse and the
agency sought to put in place the appropriate services
to support the child and family (U.S. DHHS, 2006a).
For 268,000 of these children, or about a fifth, their
cases rose to a level of seriousness that the agencies
determined it was in the children’s best interests to
be removed from their homes and placed in foster
care (U.S. DHHS, 2006a). While a very small portion
of children may be in the custody of child welfare
agencies because their parents voluntarily relinquish
rights to their care, most families become involved
with child welfare as a result of some type of abuse
or neglect.
In finding foster care placements for
children, agencies seek the least
restrictive and most family-like setting
that will best meet the child’s
particular needs. For many children,
family settings are found.
On
September 30, 2005, 236,775 foster
children (46 percent) lived in family
foster homes with non-relative caregivers and
124,153 (24 percent) lived in family foster homes
with relatives providing for their care (U.S. DHHS,
2006b). However, either because a family home was
not available or because the child’s needs are best
met in a congregate care setting, 94,650 children (18
percent) in foster care were cared for in institutions or
group homes (U.S. DHHS, 2006b). An additional
eight percent of foster children participated in trial
home visits or lived in pre-adoptive placements in
preparation for adoption (U.S. DHHS, 2006b). A
small portion of foster children (one percent) resided
in independent living settings as they prepared to
“age-out” of the foster care system, and two percent
of foster children had run away (U.S. DHHS, 2006b).
Half a million
children live in
foster care in
the United
States.
Adoption
Many adoptions take place outside the child welfare
system, such as private domestic or international
adoptions.
Other adoptions occur when a child
welfare agency determines that a child is unlikely to
return home to his or her parent(s). In that case, the
agency considers other permanency options for that
child. Typically this involves looking for an adoptive
family to provide a permanent home. In 2005, there
were 114,000 children waiting to be adopted,
meaning they had a goal of adoption and/or their
parental rights had been terminated (U.S. DHHS,
2006b). This figure represents a substantial decline
from 2000 when 131,000 children waited for adoptive
families (U.S. DHHS, 2007). This decline is likely
attributable to the Adoption and Safe Families Act
(ASFA) of 1997, which put pressure on states to find
permanent homes for children in a timely manner and
placed stricter timelines on agencies to terminate
parental rights.
Right after ASFA, there was a
significant increase in adoptions and since 2000 the
number of adoptions out of foster care has remained
steady at around 50,000 per year (U.S. DHHS, 2007).
States seeking adoptive homes for children in foster
care report that one of the biggest obstacles is finding
interested and able families to adopt (Macomber,
Scarcella, Zielewski, and Geen, 2004). To address
this problem, in recent years state and federal
governments
have
made
significant efforts to recruit
114,000 children
adoptive families. During the late
in the foster care
1990s, many states initiated
system await
statewide campaigns to recruit
adoption.
adoptive families (Macomber,
Zielewski, Chambers, and Geen,
2005).
At the federal level, in 2002, the U.S.
Department of Health and Human Services’ Children’s
Bureau developed a national adoptive parent
recruitment and retention campaign, AdoptUSKids.
This national effort involved a series of television
advertisements and a national online photolisting of
children (Macomber, Zielewski, Chambers, and Geen,
2005). In tandem with these efforts to find adoptive
parents, states also seek foster parents, who are
typically in short supply relative to the number of
children needing foster care. Foster parents also
constitute an important source of adoptive parents.
Roughly 60 percent of all adoptions of children in
foster care in 2005 were by their foster parents (U.S.
DHHS, 2006b).
The costs of recruitment efforts to find these adoptive
and foster parents are difficult to estimate. States
typically pay for these expenses through Title IV-E of
the Social Security Act. This funding stream provides
federal payments to states for foster care and
adoption assistance. There are many categories of
spending under Title IV-E. The costs of recruitment
efforts generally fall under the IV-E categories of
administration and training costs, yet these categories
also include other child welfare expenditures, making
it difficult to distinguish recruitment costs. California,
one state for which itemized costs on recruitment are
available, reported spending over $25 million for
foster parent recruitment, training, and retention from
July1, 2001 to June 30, 2002. In 2002, Michigan paid
a standard rate of $4160 to contracted adoption
recruitment agencies per child adopted.
1
2
State Policies and Gay, Lesbian, and Bisexual
Adoption and Fostering
Variation in state policies
State law influences whether or not gay, lesbian, or
bisexual (GLB) people can be involved as adoptive or
foster parents through the state’s child welfare
system. Some states have passed laws or have
regulations that explicitly relate to whether GLB
people or same-sex couples can adopt. A few states
have laws that block GLB people from adopting; in
other cases the law makes it clear that GLB people
are eligible to adopt or foster. Other states have
policies specifically related to GLB people becoming
foster parents.
State GLB Adoption Policies
• Only Florida forbids “homosexuals” from
adopting (Florida Statutes § 63.042(3)), and
bisexuals are also apparently disqualified.
• Mississippi explicitly bans “same-gender”
couples from adopting (MISS CODE ANN § 9317-3-(5)), as does Utah through a ban on
adoption by all unmarried couples (UTAH CODE
ANN § 78-30-1(3)(b)). However, single GLB
people in Mississippi and Utah might be able to
adopt.
• In contrast, some states have policies that
either explicitly or implicitly state that sexual
orientation cannot be a basis to prevent gay
and lesbian people from adopting, including
California, Maryland, Massachusetts, Nevada,
New Jersey, New York, Connecticut, Illinois,
Indiana, Pennsylvania, Vermont, and the District
of Columbia (Cooper and Cates, 2006, p. 6).
The absence of an explicit policy does not mean that
parents’ sexual orientation is not considered in
adoption and foster care decisions. Although states
might not have formal policies forbidding adoption or
foster care by GLB parents, some adoption agencies
or social workers might discriminate against GLB
applicants.
The Evan B. Donaldson Institute studied the policies
and practices of 307 adoption agencies during 1999
and 2000. 1 That study found that 60 percent of
agencies responding to the survey accepted adoption
applications from lesbians and gay men, whether
single or in couples (p. 21). Among public agencies
responding, 90 percent accepted gay applicants (p.
22). Almost 40 percent of all agencies and 83 percent
of public agencies reported making at least one
adoption placement with a lesbian or gay man (pp.
24-25). Overall, 1.3 percent of reported adoptions by
these agencies were to self-identified lesbian or gay
parents (p. 24).
1
State GLB Fostering Policies
• Nebraska has a policy prohibiting gay people
from fostering, but the current enforcement of
that policy is unclear (Cooper and Cates, 2006).
• As with adoption, Utah forbids fostering by
unmarried couples (UTAH CODE ANN § 62A4A-602).
• A policy banning gay foster parents was
recently removed by the Department of Social
Services in Missouri and overturned by the state
Supreme Court in Arkansas (Cooper and Cates,
2006, p. 11).
However, one third of agencies would reject a gay or
lesbian applicant, either because of the religious
beliefs guiding the agency, a state law prohibiting
placement with GLB parents, or a policy of placing
children only with married couples (p. 21).
Furthermore, the discretionary power of social
workers in many agencies probably results in some
finding that individual GLB parents are unsuitable
because of their sexual orientation, even in the
absence of a public prohibition (Wald, 2006, p. 415416; Ryan, Pearlmutter, and Groza, 2004). The Evan
B. Donaldson Institute survey of adoption agencies
asked directors about their own personal attitudes
and beliefs about lesbian and gay parents. They
found that negative attitudes about lesbian and gay
adoption were correlated with the belief that gay
applicants required more evaluation and support (p.
29). Notably, public agency directors were the most
supportive of adoption by lesbian and gay parents (p.
32). Other studies have also found evidence of
negative social worker attitudes toward adoption by
lesbian and gay parents (Ryan, 2000; Kenyon et al.,
2003). Finally, GLB prospective foster parents report
agency discrimination as a major barrier to becoming
a foster parent (Downs and James, 2006).
GLB parenting research
Allowing GLB parents to adopt or foster has been the
subject of controversy. In the last few years several
states have considered bans on adoption or fostering
by GLB people (Cooper and Cates, 2006, p. 6 and p.
11). The debates associated with these bans often
consider the fitness of gay men, lesbians, and
bisexuals to parent and the concern that children
raised in their homes would be adversely affected.
Gay parenting is an area that has received increasing
research attention. Studies of child-rearing by GLB
people have necessarily focused on relatively small
samples and share some other possible limitations
that are common to studies in those fields (Stacey
and
Biblarz,
2001;
American
Psychological
The response rate for the survey was 41%.
3
Association, 2005; Rauch and Meezan, 2005). For
instance, most of the available research has focused
on parents who are predominantly lesbian, white, and
of relatively high economic status. However, findings
across these studies are remarkably consistent in
showing no negative consequences for children of
GLB parents with regard to standard child well-being
measures.
A wide variety of professional organizations have
official positions recognizing the scientific research on
GLB parents and stating that sexual orientation
should not be a determinative factor in assessing the
ability of individuals to raise children through
adoption, foster care, or second parent adoptions.
These positions typically address some combination of
adoption, foster care, second-parent adoption, and
co-parenting by GLB people. 2
Organizations with such statements include:
•
•
•
•
•
•
•
•
•
•
American Academy of Child and Adolescent
Psychiatry (1999)
American Academy of Pediatrics (2002)
American Bar Association (1999, 2003)
American Medical Association (2004)
American Psychoanalytic Association (2002)
American Psychological Association (2004)
Child Welfare League of America (2004)
National Adoption Center (1998)
National Association of Social Workers (2002)
North American Council on Adoptable Children
(1998)
In later sections, we consider the implication of
policies designed to limit adoption and fostering rights
for gay men, lesbians, and bisexuals.
2
One professional organization, the American College of
Pediatricians, has a policy statement that does not support
parenting by lesbian, gay, or bisexual parents.
4
Parenting and Adoption among Gay Men,
Lesbians, and Bisexuals
GLB parenting
Several recent datasets provide a new picture of GLB
parenting. They show that many lesbians and gay
men are already raising children and many more GLB
people would like to have children at some point.
They also demonstrate that as many as two million
GLB people have considered adopting children.
Two recent datasets show that many lesbians and
gay men are already parents. An estimated 27
percent of same-sex couples identified in Census
2000 have a child under 18 living in the home with
them (Gates and Ost, 2004). 3 Data from the National
Survey of Family Growth
(NSFG), conducted by the
More than one in
National Center for Health
three lesbians have
Statistics in 2002, show that
given birth and one in
over 35 percent of lesbians
six gay men have
aged 18-44 have given birth,
fathered or adopted a
compared with 65 percent of
child.
heterosexual and bisexual
women. Among gay men,
16 percent have had a biological or adopted child
compared to 48 percent of heterosexual and bisexual
men.
GLB people participate in childrearing in other ways,
as well. Interestingly, lesbian and bisexual women
are almost twice as likely as heterosexual women to
report that they have lived with a non-birth child who
was under their “care and responsibility”: 23 percent
of lesbian and bisexual women compared with 12
Table 1. Desire to have children by sexual
orientation and prior births.
Sexual Orientation
Women
Men
Heterosexual (all)
53.5%
66.6%
37.3%
43.6%
Among those who with children
Among those without children
Lesbian or gay (all)
Among those who with children
Among those without children
Bisexual (all)
Among those who with children
Among those without children
83.7%
87.4%
41.4%
51.8%
49.0%
24.6%
37.4%
57.0%
59.2%
65.6%
39.5%
55.4%
75.4%
70.4%
Source: National Survey of Family Growth
Bold figures are statistically significantly different at 10% level from heterosexual
men or women.
3
This figure is lower than official Census Bureau figures
reported in Simmons and O’Connell (2003). It represents an
adjusted estimate that accounts for measurement error due
to possible miscoding of different-sex married couples as
same-sex couples.
Figure 1. Gay men and lesbians having children.
Gay Men
Lesbians
41%
Want to have
children
Currently have
children
52%
35%
16%
Considered
adoption
46%
Source: National Survey of Family Growth
percent of heterosexual women reported living with
and caring for someone else’s birth child. This
difference probably reflects the fact that lesbians
partner with other women who have given birth in
prior relationships or in the context of that particular
lesbian relationship.
GLB desire to parent
In addition, many more lesbian, gay, and bisexual
people would like to be parents. The NSFG asked
men and women about their desire to have a child or,
if the individual has already had a child, another child
(see Table 1). More than half (52 percent) of gay
men say they would like a child, compared with twothirds of heterosexual and bisexual men who say they
would like a child. Among lesbians, 41 percent would
like to have a child, compared with a bit more than
half of heterosexual women and 59 percent of
bisexual women.
The desire to have children
More than half of gay
depends partly on whether
men and 41 percent
people already have children,
of lesbians want to
however, and those who do
not have children usually
have a child.
express
more
current
interest in having a child than people who are already
parents. Among men who have had a child, 25
percent of gay men, 44 percent of heterosexual men,
and 55 percent of bisexual men would like to have
another child. Among men who have not had a child,
57 percent of gay men, 87 percent of heterosexual
men, and 70 percent of bisexual men would like to
have a child. The pattern for most women is similar
5
to that of men, with heterosexual and bisexual
women who have not had children being more likely
to want a child than those with children.
Lesbians who have not had children are somewhat
less likely to say they want a child than lesbians who
have given birth, however.
GLB interest in adopting
The NSFG asks women in that survey about their
adoption considerations and actions. The answers to
those questions show that many lesbian and bisexual
women are potential adoptive parents. Almost half of
lesbian and bisexual women (46 percent) have
considered adoption at some point, compared with
only one third (32 percent) of heterosexual women
(see Table 2). This figure is strikingly similar to that
found in a Kaiser Family Foundation survey of GLB
people in 15 large metropolitan areas, which found
that almost half of GLB people without children would
like to adopt someday (Kaiser Family Foundation, p.
4).
Although many women have considered adoption,
few have actually taken concrete steps toward
adopting a child.
According to the NSFG,
lesbian/bisexual women are also more likely than
heterosexual women to have ever taken steps toward
adopting: 5.7 percent of lesbian/bisexual women
compared with 3.3 percent of heterosexual women.
Another way of looking at the interest in adoption is
that just over one million lesbian or bisexual women
aged 18-44 have considered adoption, and over
130,000 lesbian or bisexual women have take a step
toward adopting a child.
Unfortunately, the NSFG did not ask the same
questions about adoption of men. We do know that
gay and bisexual men are even
An estimated two
more likely than lesbian and
bisexual women to express an
million GLB people
interest in having children
are interested in
(even though fewer gay men
adopting.
than lesbians actually have
children already). We might
reasonably project that at least another million
gay/bisexual men are interested in adopting. Since
gay/bisexual men are likely to have partners who are
not capable of giving birth, it would not be
unreasonable to think that even more gay and
bisexual men might have an interest in adopting than
lesbian and bisexual women. Therefore, our estimate
of two million gay, lesbian, or bisexual people who
have ever considered adopting a child is likely to be a
conservative one.
6
Table 2: Adoption considerations for women by sexual
orientation.
Sexual Orientation
Ever considered adoption
Percent
Number (weighted)
Ever took a step toward adoption
Percent
Number (weighted)
N (unweighted)
Heterosexual
Lesbian/
bisexual
32.1%
16,798,000
46.2%
1,057,000
3.3%
1,751,000
5.7%
132,000
6529
314
Source: National Survey of Family Growth
Figures in bold are statistically significantly different from those for heterosexual
women.
A note about bisexuals
Our treatment of bisexual people in this report varies
according to the specific context. Existing and proposed laws
and policies related to the sexual orientation of adoptive or
foster parents are often unclear with respect to bisexuals.
We believe it is likely that restrictive policies will discourage
bisexual people as well as lesbians and gay men from
pursuing adoption and foster care, so in this discussion we
include bisexuals in our estimate of the pool of potential
adoptive parents. In describing current adoptive and foster
parents in later sections, however, we are limited by the
available data, as discussed below.
Adoption by Gay Men and Lesbians
National adoption estimates
We estimate that approximately 65,500 adopted
children are being raised by lesbian or gay parents,
accounting for more than four percent of all adopted
children in the United States (see Table 3). Of the
estimated 3.1 million lesbian and gay households in
the United States, 1.6
An estimated 65,500
percent
(nearly
52,000)
adopted children are
include an adopted child
living with a lesbian
under age 18 (see Table 3).
or gay parent.
Actual counts of the number
of adopted children living with gay and lesbian
parents, both single and coupled, do not exist. We
derive our estimate using characteristics of same-sex
couples identified in the Census and NSFG estimates
of the size of the lesbian and gay population in the
United States. It is important to remember that these
estimates include all adopted children, including those
adopted from both public and private adoption
agencies, as well as international adoptions and
possibly second parent adoptions of a partner’s child.
Unfortunately, we are unable to separate out these
different kinds of adoptions. Also, these figures do
not directly include bisexual adoptive or foster
parents. We only know the extent of parenting
among same-sex couples from the Census. To the
extent that bisexual people are in same-sex couples,
they will be represented in our estimates. Further
details about the specifics of the estimation procedure
are included in the Appendix.
In our analyses of the demographic characteristics of
families with adopted children (and later in the
analyses of those with foster children), we consider
characteristics across four family types: same-sex
couples, different-sex married couples, different-sex
unmarried couples, and families where the adoptive
parent does not report a partner or spouse in the
home.
These comparisons allow us to identify
differences and similarities of characteristics across
family types for parents and the adopted or fostered
children. It is important to note that Census data do
not allow us to separately identify single lesbians and
gay men and the children living with them, so single
gay and lesbian parents would be included among the
non-couple households. As noted earlier, we also
cannot identify whether these children were adopted
through private adoptions, from foster care, or from
other countries.
State and regional estimates
States with the largest number of adopted children
living with lesbian and gay parents (see Figure 2)
include California (16,458), New York (7,042),
Massachusetts
(5,828),
Texas
(3,588),
and
Washington (3,004). Estimated counts for all states
where data were available are shown in Table 5.
Figure 2. Estimated number of adopted children under age 18 living with lesbian or gay parents, by state.
7
Table 3. Estimates of the number of adopted children
under age 18 living in lesbian and gay
households, United States.
The geographic distribution of adopted children being
raised by lesbian and gay parents differs substantially
from that of children being raised in other family
types (see Tables 4 & 5). Gay and lesbian parents
with adopted children
are substantially more
More than 16,000 adopted
likely
than
other
children are living with
families to live in New
lesbian and gay parents in
England, Mid-Atlantic
California, the highest
and
West
coast
number
among the states.
states.
They are
generally less likely to
live in the Midwest and the South.
United States
Lesbian/gay households
3,134,218
Adopted children (under age 18)a
1,586,004
Lesbian and gay households
Adoption rateb
1.6%
c
Avg. # adopted children
1.3
Lesbian and gay households with an adopted child
Estimated # adopted children with lesbian/gay
parents
% Adopted children living in lesbian and gay
households
50,774
States where there are high proportions of adopted
children living with lesbian and gay parents are shown
in Figure 3. In general, the Northeast and the West
are the regions of the country where adopted children
are most likely to be living with lesbian and gay
parents. States with the highest percentages include
the Massachusetts (16.4 percent), California (9.8
percent), New Mexico (9 percent), and Alaska (8.6
percent). 4
65,499
4.1%
a
Census 2000, as reported in Kreider (2003) and Lugalia and Overturf (2004)
Author calculations based on same-sex unmarried partner households with an
adopted/foster children under age 18 living in the household, Census 2000 5%/1%
PUMS
c
Author calculations based on same-sex unmarried partner households with at least one
adopted/foster child under age 18, Census 2000 5%/1% PUMS
b
Table 4. Geographic distribution of families with adopted children under age 18, by family type.
All
Region
New England
Middle Atlantic
East North Central
West North Central
South Atlantic
East South Central
West South Central
Mountain
Pacific
Same-sex
5%
13%
17%
7%
17%
6%
11%
7%
16%
Differentsex Married
Different-sex
unmarried
5%
12%
17%
8%
17%
6%
11%
8%
15%
5%
10%
17%
6%
20%
6%
10%
10%
16%
11%
17%
8%
4%
12%
2%
8%
5%
33%
Single
4%
16%
17%
6%
18%
7%
10%
6%
16%
Same-sex
female
14%
18%
7%
5%
12%
1%
8%
4%
31%
Source: Census 2000
Bold figures are significantly different (p<0.05) from same-sex
Italicized figures are significantly different (p<0.05) from same-sex female
4
The District of Columbia actually has the highest proportion
at 28.6 percent.
8
Same-sex
male
0%
15%
12%
1%
15%
5%
8%
6%
39%
Figure 3. Estimated proportion of adopted children under age 18 who are living with lesbian or gay
parents, by state.
9
Table 5. Estimates of the number of adopted children under age 18 living in lesbian and gay households, by state.
Total adopted
children
Alabama
Alaska
Arizona
Arkansas
24,944
Adopted children living
with lesbian or gay
parents
301
Rank
Percent of adopted children
living with gay or lesbian
parents
Rank
32
1.2%
37
6,910
594
23
8.6%
5
28,966
543
24
1.9%
30
16
6.5%
9
15,973
1,040
California
167,190
16,458
1
9.8%
3
Colorado
29,438
616
22
2.1%
26
Connecticut
14
19,239
873
19
4.5%
Delaware
3,452
-
-
-
-
District of Columbia
2,649
758
20
28.6%
1
Florida
82,179
962
17
1.2%
39
Georgia
49,194
2,377
6
4.8%
13
Hawaii
6,941
95
42
1.4%
34
Idaho
9,562
-
-
0.0%
-
Illinois
73,638
1,887
10
2.6%
23
Indiana
37,004
725
21
2.0%
28
43
0.5%
43
Iowa
18,569
95
Kansas
19,733
462
27
2.3%
24
Kentucky
20,661
248
37
1.2%
38
Louisiana
22,827
469
26
2.1%
27
7,137
323
31
4.5%
15
32,269
2,142
8
6.6%
8
3
16.4%
2
Maine
Maryland
Massachusetts
35,647
5,828
Michigan
61,232
959
18
1.6%
32
Minnesota
31,378
1,328
12
4.2%
16
Mississippi
16,300
286
33
1.8%
31
Missouri
33,156
161
41
0.5%
44
Montana
6,803
95
44
1.4%
33
Nebraska
11,812
367
29
3.1%
20
34
2.6%
22
Nevada
10,588
279
6,864
-
-
-
-
New Jersey
42,614
2,344
7
5.5%
11
New Mexico
11,764
1,056
15
9.0%
4
100,736
7,042
2
7.0%
7
42,911
499
25
1.2%
40
New Hampshire
New York
North Carolina
North Dakota
3,647
-
-
-
-
Ohio
62,653
1,335
11
2.1%
25
Oklahoma
23,518
183
39
0.8%
42
Oregon
23,901
1,232
13
5.2%
12
Pennsylvania
62,328
1,950
9
3.1%
19
Rhode Island
5,496
176
40
3.2%
18
35
1.3%
35
South Carolina
22,027
279
South Dakota
5,691
-
-
-
-
30,980
384
28
1.2%
36
Texas
110,275
3,588
4
3.3%
17
Utah
19,430
367
30
1.9%
29
4,181
235
38
5.6%
10
14
3.0%
21
5
7.7%
6
Tennessee
Vermont
Virginia
38,289
1,143
Washington
38,879
3,004
West Virginia
9,849
-
-
-
-
Wisconsin
30,583
257
36
0.8%
41
Wyoming
3,997
-
-
-
-
10
Adopted children by family type
Gay and lesbian parents are raising four percent of all
adopted children in the United States (see Figure 4).
Nearly 80 percent of adopted children have differentsex married parents and three percent are being
raised by different-sex unmarried couples.
Single heterosexual parents
are raising 15 percent of
adopted children and an
additional three percent have
single gay or lesbian parents.
This implies that gay and
lesbian parents represent
nearly one in six single parents raising adopted
children. 5
Figure 4. Estimated distribution of adopted children
under age 18, by family type.
Heterosexual
Unmarried Couple
3%
Single
Heterosexual
15%
Gay and lesbian
parents are raising
four percent of all
adopted children in
the United States.
Same-sex couples are raising one percent of adopted
children. Roughly 80 percent of those children have
female parents.
Adoptive parent demographics
Same-sex couple adoptive parents, particularly female
parents, and adoptive parents without a partner are
older than their different-sex married and unmarried
couple counterparts, with an average age of 43 (see
Table 6).
Single
Lesbian/Gay
3%
Gay/Lesbian
Couple
1%
Heterosexual
Married Couple
78%
Individuals in same-sex couples raising adopted
children have the highest levels of education. More
than half of them have a college degree, compared to
a third of men and women in different-sex married
couples, a fifth of single parents, and only 7 percent
of those in different-sex unmarried couples.
Same-sex couples with adopted children also have the
highest average annual household income of any of
Table 6. Demographic characteristics of adoptive parents by living arrangement.
All
Age (mean)
Same-sex
Differentsex
Married
Differentsex
unmarried
Single
Same-sex
female
Same-sex
male
41.6
42.8
41.8
34.0
42.8
43.2
41.3
14%
24%
32%
18%
13%
13%
11%
22%
20%
34%
12%
23%
32%
19%
13%
28%
36%
29%
5%
2%
21%
25%
32%
12%
9%
10%
10%
20%
21%
38%
22%
$73,274
$102,474
$81,900
$43,746
$36,312
$102,508
$102,331
73%
12%
10%
3%
1%
2%
73%
10%
11%
2%
2%
2%
76%
9%
9%
3%
1%
2%
54%
20%
20%
2%
2%
1%
49%
33%
12%
2%
2%
2%
77%
8%
11%
1%
2%
2%
61%
15%
Education
<High School
High School Diploma
Some College
College Degree
Graduate Studies
Household Income (mean)
13%
30%
16%
19%
Race/Ethnicity
White
African/American
Hispanic/Latino(a)
Asian/Pac. Islander
Am. Indian/AK Native
Other
15%
4%
1%
4%
Source: Census 2000
Bold figures are significantly different (p<0.05) from same-sex
Italicized figures are significantly different (p<0.05) from same-sex female
5
The children who have single parents (both GLB and
heterosexual) in these findings might also have another
adoptive parent who lives in a different household. The
Census data do not allow us to identify those situations.
11
Adopted children demographics
the adoptive family types ($102,474). Different-sex
married couples compare at $81,900 followed by
different-sex unmarried couples at $43,746 and single
parents (including heterosexual, gay, lesbian, and
bisexual people) at $36,312 per year.
Adopted children of same-sex couples are the
youngest among the various family types (see Table
7). Nearly half (46 percent) are under age five
compared to a third of adopted children with
different-sex unmarried parents, a fifth of children
with different-sex married parents and 16 percent of
those with single parents. Unfortunately, we do not
know the age of the children at the time of their
adoption.
Adoptive parents in both
same-sex couples and
different-sex
married
couples are essentially
alike with regard to racial
and
ethnic
diversity.
Nearly three-quarters of
them are white. About one
in
ten
are
AfricanAmerican and another one
in ten are Latino(a). Adoptive parents who are single
or are in different-sex unmarried couples and single
adoptive parents differ from married and same-sex
couples, however. About half of single parents and
unmarried different-sex couples are white. One fifth
of men and women in different-sex unmarried couples
is African-American and a similar proportion is
Latino(a). Among single adoptive parents, a third are
African-American and 12 percent are Latino(a).
Same-sex couples
raising adopted
children are older, more
educated, and have
more economic
resources than other
adoptive parents.
Among same-sex couples, the adopted children of
male couples are older than those of their female
counterparts. More than one in five children of male
couples are aged 13 and older compared to only one
in ten among the children of female couples.
Among adopted children
of same-sex couples, 14
Adopted children with
percent
are
foreign
same-sex parents are
born, twice the rate
younger and more likely
among
children
of
to be foreign born.
different-sex
married
couples (seven percent)
and higher than that of children with single parents.
One in five adopted children being raised by a
different-sex unmarried couple is foreign born, a
higher proportion than among adopted children in any
other family type.
Almost one quarter of children
adopted by female same-sex couples are foreign
born.
Notably, these characteristics differ rather markedly
from comparisons between same-sex couples raising
children (all children, not just those who are adopted)
and their different-sex married counterparts.
In
general, same-sex couples raising children have lower
incomes and education levels than do married couples
raising children. They are also less likely to be white
(Sears and Gates, 2005).
Table 7. Demographic characteristics of adopted children by living arrangement.
All
Age (mean)
Age group
Under 5
5-12
13-17
9.4
Same-sex
Differentsex Married
Differentsex
unmarried
Single
Same-sex
female
Same-sex
male
6.2
9.4
7.5
9.9
5.7
7.7
20%
49%
32%
46%
42%
12%
20%
49%
31%
32%
46%
22%
16%
49%
34%
49%
42%
10%
34%
45%
21%
58%
16%
13%
8%
1%
4%
53%
14%
18%
11%
0%
4%
63%
11%
13%
8%
1%
5%
49%
19%
24%
2%
2%
4%
38%
36%
15%
5%
2%
4%
52%
14%
17%
13%
0%
4%
56%
14%
21%
5%
1%
3%
Sensory
Physical
Mental
13%
2%
2%
11%
14%
3%
2%
11%
11%
1%
1%
10%
12%
4%
3%
9%
14%
2%
2%
12%
5%
3%
8%
1%
16%
0%
21%
5%
Foreign born
13%
14%
7%
20%
10%
23%
9%
Race/Ethnicity
White
African/American
Hispanic/Latino(a)
Asian/Pac. Islander
Am. Indian/AK Native
Other
Disabled (age 5+)
Source: Census 2000
Bold figures are significantly different (p<0.05) from same-sex
Italicized figures are significantly different (p<0.05) from same-sex female
12
Adopted children of different-sex married couples are
more likely than children in other family types to be
white (63 percent). More than a third (36 percent)
of the adopted children of single parents are AfricanAmerican, the highest percentage among the various
family types. Different-sex unmarried couples have
the highest percentage of Latino(a) adopted children
(24 percent) and same-sex couples have the highest
percentage of children of Asian/Pacific Island descent
(11 percent).
The portion of children with disabilities (age five and
older) among adopted children does not vary much
by family type. Disability is defined as those reporting
either a mental, physical, or sensory disability.
Among all adopted children, 13 percent report some
disability. More than one in ten adopted children has
a mental disability while two percent have a sensory
disability and two percent have a physical disability.
Among same-sex couples, male couples are more
than three times more likely than female couples to
have a child with a disability.
13
14
Foster Parenting by Gay Men and Lesbians
National and regional foster care
estimates
We estimate that just over 14,100 children live with a
lesbian or gay foster parent. This suggests that
nearly three percent of the half million children in all
forms of family foster care (both kin and non-kin) in
the United States are living with lesbian or gay foster
parents (see Table 8). When only those foster
children placed with a non-relative are considered, six
percent of foster children are living with lesbian or
gay foster parents.
Because the sample sizes of
foster children in the Census
are very small in most states,
we do not present state-bystate numbers. However, it is
clear that the geographic
distribution of foster children
being raised by same-sex couples differs substantially
from that of children being raised in other family
types (see Table 9).
Like those with adopted
children, same-sex couples with foster children are
substantially more likely than other families to live in
west coast states and are less likely to live in the
South.
An estimated
14,100 foster
children are living
with lesbian or gay
parents.
In describing the characteristics of foster children and
their families derived from the Census, it is important
Table 8. Estimates of the number of fostered
children under age 18 living in lesbian and
gay households, United States.
United States
Lesbian/gay households
3,134,218
Foster children (under age 18) a
501,299
Family, non-kin care
232,301
Institutional
95,280
Other
173,718
Lesbian and gay households
Fostering rateb
0.33%
c
Avg. # foster children
Lesbian and gay households with a
foster child
Estimated # foster children with
lesbian/gay foster parents
% Foster children living in lesbian
and gay households
Among children in family, non-kin
care
Among all children in foster care
a
1.4
10,343
14,134
6.1%
2.8%
Adoption and Foster Care Reporting System (AFCARS), 2004
Author calculations based on same-sex unmarried partner households with an
adopted/foster children under age 18 living in the household, Census 2000
5%/1% PUMS
c
Author calculations based on same-sex unmarried partner households with at
least one adopted/foster child under age 18, Census 2000 5%/1% PUMS
b
Figure 5. Estimated distribution of foster children in
family, non-kin care, by family type.
Heterosexual
Unmarried Couple
8%
Single
Heterosexual
30%
Single
Lesbian/Gay
5%
Lesbian/Gay
Couple
1%
Heterosexual
Married Couple
56%
to remember that these data are primarily observing
foster children living in a non-kin family home, or
where foster parents do not include a relative. These
children represent 46 percent of the total children in
foster care. As noted earlier, nearly 20 percent of
children in foster care are in institutional settings, and
the remaining third of children in the foster care
system live with relatives or are in other special living
arrangements.
Six percent of foster
Gay and lesbian
children in non-kin care
parents are raising six
are being raised by lesbian
percent of foster
or gay foster parents (see
children in non-kin care
Figure 5).
They are
in the United States.
divided roughly five to one
between single and samesex coupled parents. Nearly three-quarters of these
children likely have female foster parents.
More than half (56 percent) of foster children are
living with different-sex married couples and eight
percent are being raised by different-sex unmarried
couples. Single heterosexual parents are raising
nearly a third (30 percent) of these children. These
estimates imply that among the third of foster parents
who are single, one in seven is a lesbian or gay
parent.
Foster parent demographics
Like their adoptive parent counterparts, same-sex
couple foster parents, whose average age is 48, are
older than foster parents from all of the other family
types (see Table 10).
Also similar to adoptive
parents, same-sex couples raising foster children
generally have the highest levels of education. One
quarter of them have a college degree, compared to
17 percent of different-sex married couples, 13
percent of single parents, and only 10 percent of
different -sex unmarried couples.
15
Table 9. Geographic distribution of foster families, by family type.
All
Region
New England
Middle Atlantic
East North Central
West North Central
South Atlantic
East South Central
West South Central
Mountain
Pacific
Same-sex
5%
15%
20%
7%
16%
5%
8%
6%
17%
3%
8%
15%
7%
11%
1%
7%
4%
44%
Differentsex Married
Different-sex
unmarried
6%
12%
20%
8%
15%
6%
9%
6%
18%
5%
11%
15%
12%
22%
5%
13%
7%
8%
Single
Same-sex
female
4%
21%
21%
5%
17%
4%
6%
5%
16%
4%
9%
20%
3%
4%
2%
8%
2%
49%
Same-sex
male
0%
5%
2%
18%
31%
0%
5%
10%
29%
Source: Census 2000
Bold figures are significantly different (p<0.05) from same-sex
Italicized figures are significantly different (p<0.05) from same-sex female
Different-sex married couples with foster children
have the highest average annual household income of
any of the family types ($63,698), though the
differences are not statistically significant. Same-sex
couples compare at $57,056, followed by differentsex unmarried couples at $46,314 and single parents
at $32,948 per year.
With regard to race and ethnicity, any observed
differences among same-sex couples and differentsex married and unmarried couples are not
statistically significant. Among those foster parents,
between 55 percent (same-sex couples) and 62
percent (different-sex married couples) are white.
Between 14 percent (different-sex unmarried) and 21
percent (different-sex married) are African-American,
and between 13 percent (different-sex married) and
23 percent (different-sex unmarried) are Latino(a).
Single foster parents are more likely than others to be
African-American (51 percent) and less likely to be
white (31 percent).
Foster children demographics
In general, few statistically significant differences
emerged between the characteristics of foster
children living with same-sex couples and those living
in other family settings (see Table 11). While not
statically significant, the portion of foster children
with a disability is highest among those in same-sex
couple households (32 percent). In particular, female
couples appear to be most likely to be fostering a
child with a disability. Among all families, roughly
half of foster children are between the ages of five
and twelve. A quarter of foster children are under
age five and another quarter is age 13 and older.
The race and ethnicity of foster children only differs
between those with single parents and those in other
family types. Foster children of single parents are
more likely to be African-American (52 percent) and
less likely to be white (26 percent) than children in
other family types. Among foster families headed by
couples, in contrast, approximately half of foster
children are white and about 20 percent are AfricanAmerican and an additional 20 percent are Latino(a).
Table 10. Demographic characteristics of foster parents, by living arrangement.
All
Age (mean)
Education
<High School
High School Diploma
Some College
College Degree
Graduate Studies
Household Income (mean)
Race/Ethnicity
White
African/American
Hispanic/Latino(a)
Asian/Pac. Islander
Am. Indian/AK Native
Other
Same-sex
44.3
47.8
Different-sex
Married
44.6
24%
28%
32%
11%
5%
$49,841
20%
17%
39%
17%
8%
$57,056
22%
27%
35%
12%
5%
$63,698
31%
35%
24%
8%
2%
$46,314
30%
29%
28%
8%
5%
$32,948
24%
25%
32%
12%
8%
$49,599
35%
21%
28%
7%
9%
$70,202
55%
26%
14%
1%
2%
2%
55%
18%
21%
1%
1%
4%
62%
21%
13%
1%
2%
2%
58%
14%
23%
2%
2%
1%
31%
51%
14%
1%
1%
3%
49%
16%
30%
1%
0%
4%
49%
28%
Source: Census 2000
Bold figures are significantly different (p<0.05) from same-sex
Italicized figures are significantly different (p<0.05) from same-sex female
16
Different-sex
unmarried
35.7
Single
38.9
Same-sex
female
39.3
Same-sex
male
42.2
12%
3%
8%
0%
Impacts of Policies Prohibiting Gay Men and Lesbians
from Adopting or Fostering Children
Displacement of children
As noted earlier, several states have recently
considered legislation that would prohibit lesbians and
gay men (and perhaps bisexuals) from adopting or
fostering children. Based on the data just presented
on the number and characteristics of adopted or
foster children with GLB parents, this section and the
next discuss the potential ramifications of such a
policy change.
If a state were to decide
to limit adoption and foster
care by gay parents, it is
likely
that
children
currently
placed
with
existing GLB foster parents
would be removed from those families. In the next
section, we estimate that 9,300 to 14,000 children
would be displaced. Some of those children would be
placed in other foster family settings, but others
would be placed in group or institutional care.
As many as 14,000
children could be
displaced from their
current foster homes.
Foster parents are an important source of adoptive
homes. Of children adopted from foster care in 2005,
60 percent were adopted by their foster parents (U.S.
DHHS, 2005b). Taking gay and lesbian parents out of
the pool of potential foster parents who might also
adopt may increase the time to adoption for the
children who would have been placed in those homes.
Some children might never be adopted and will “age
out” of the foster care system.
Taking GLB parents out
of the pool of foster
parents who might also
adopt may increase the
time to adoption for
some children.
In some circumstances, a
lesbian or gay foster
parent has a characteristic
that makes them best
suited to a particular child.
Removing children from
those homes deprives the
child of that placement. For instance, some children
might be placed with a stranger rather than a lesbian
or gay relative. Or a lesbian or gay foster parent who
is a medical professional might have skills that are
best suited to the medical needs of a child when
compared with other potential foster parents.
One recent study of Midwestern youth who are or
were in foster care found that almost seven percent
identified as homosexual or bisexual (Courtney, et al.,
p. 46). Challenges associated with being a GLB
youth, including stigma from family and peers,
contribute to GLB young people experiencing a variety
of difficulties in adolescence. These difficulties could
create challenges and conflict within biological
families and increase the likelihood that GLB youth
are placed in foster care settings (see Mallon, 1998).
If these youth are harder to place with non-GLB
foster parents, then GLB foster parents might
constitute an important pool of parents for these
children, in particular.
Prior research on children in foster care shows that all
of these policy impacts are likely to have harmful
effects on children.
Research on the well-being of children
in foster care
Studies show that the frequency of moves between
placements is associated with several harmful
outcomes for children. Most of these studies cannot
control for the possibility that causation runs in both
directions, e.g. that the child’s behavioral or other
problems caused the instability in placements.
However, researchers generally believe that children’s
problems are both a cause and a consequence of
instability (Harden, 2004). Such problems include:
•
A higher probability of
having at least one
Prior research on
severe academic skill
children in foster
delay (Zima, Bussing,
care suggests that
Freeman, Yang, Belin,
policy impacts are
and Forness, 2000).
likely to have
•
More
outpatient
harmful
effects on
mental health visits,
children.
particularly
for
children who also
reported some types of behavior problems
(James, Landsverk, Slymen, and Leslie,
2004).
•
Behavioral
disturbances
and
conduct
problems in school (girls) and difficulty in
forming relationships with their foster
families (boys) (Leathers, 2002).
•
Increased behavior problems, even when not
exhibited on entering the child welfare
system (Newton, Lintrownik, and Landsverk,
2000)
•
Lower probability of adoption (Smith, 2003).
Conversely, stability of placements is associated with
positive outcomes for children:
•
A review of studies conducted from 19601990 showed that having fewer placements
was
associated
with
better
school
achievement, less criminal activity, more
social support, increased life satisfaction,
greater housing stability, better self-support,
better caring for one’s own children
(McDonald, Allen, Westerfelt, Piliavin, 1993).
•
Stability of relationships is generally
important
for
children’s
development
(Harden, 2004).
Research also suggests that family environments are
usually best for children. Children who are placed in
congregate care settings are more likely to suffer the
ill effects of not having a family-like environment.
Studies show that such children experience negative
outcomes:
17
•
•
•
•
They had lower scores on social and
cognitive functioning and reported seeing
their biological family members far less often
than children in family-like foster care
settings (U.S. Dept. of Health and Human
Services, 2003).
They had a decreased probability of being
adopted (Freundlich, 2003).
They were more likely to demonstrate
behavioral problems and to repeat a grade
(Zima, et al., 2000).
Very young children had lower scores on
their motor and psychomotor development,
and in communication and socialization when
compared to matched children in family
foster care (Harden, 2002).
Finally, children who are not adopted and instead
“age out” of the foster care system face many health,
educational, and financial challenges:
•
The average income ($6,000) for aging-out
youth was below the federal poverty line
($7,890 for a single adult). Aging-out youth
also report high levels of unemployment.
(Goerge, Bilaver, Lee, Needell, Brookhart,
and Jackman, 2002).
•
Less adult guidance may account for some
of the reasons why foster care children who
have aged-out also go to college at
extremely low rates (Anderson, 2003).
•
In a survey of 141 young adults 18 months
after they had aged out of care, 32 percent
had received some type of public assistance,
37 percent had no high school diploma or
GED, 18 percent had been incarcerated, 51
percent had no health insurance, and only 9
percent were in college (Courtney, Piliavin,
Grogan-Kaylor, and Nesmith, 2000).
•
Even years later, foster care alumni show
high rates of mental health disorders, high
rates of homelessness and poverty, low rates
of education beyond high school, low
incomes, and low rates of health insurance
coverage (Pecora et al., 2005; see similar
findings for a different group of youth in
Courtney, et al., 2005).
Research suggests children who spend more time in
the foster care system have other harmful outcomes
(U.S. Dept. of Health and Human Services, 2007).
18
Financial Impact of Excluding Gay Men, Lesbians, and
Bisexuals from Fostering Children
National cost estimates
Our conservative policy models project that a national
ban on GLB foster care could add $87 to $130 million
to foster care system expenditures each year. States
that do not allow GLB people to be foster parents
could incur higher foster care system expenditures for
two reasons. First, some children who are removed
from non-kin care homes headed by GLB people will
be placed in group or
institutional care, which is
A national ban on GLB
more costly for states than
foster care could cost
family
foster
care.
from $87 to $130
Second, the state will incur
million.
the cost of recruiting and
training new foster parents. The state will want to
place some children removed from GLB homes in
other family care settings, but most states struggle to
recruit a sufficient number of foster parents.
We estimate the cost of banning foster care by GLB
parents in several steps described in detail in the
appendix. We assume that six percent of foster
children have GLB parents, the national average
presented earlier. That figure might overstate the
number of GLB parents in states that have or had
policies or practices that bar gay parents from foster
care. Therefore, we also calculate costs assuming that
four percent of foster children have GLB parents to
provide a range of estimates.
Using those
assumptions, we predict how many children will be
moved to other family foster care homes that will be
recruited or moved into group or institutional care
settings. Then we multiply the number going into
family foster care by the cost of recruiting a new
family to replace the GLB family.
To estimate family recruitment costs, we use
Michigan’s standard adoption recruitment rate of
$4160 per family recruited. While it is very difficult to
estimate these costs, this is the best available
estimate based on limited published information and
inquiries to states (see appendix for further
discussion). It should be assumed, however, that
family recruitment costs would vary by state. We also
estimate the additional cost of congregate care for
the children who cannot be placed with another
family but instead go into group or institutional
settings. Using data from the Adoption and Foster
Care Reporting System (AFCARS), we estimate the
difference in average monthly payments made to
providers for family foster care compared with
congregate care.
State cost estimates
Although these estimates based on available data
cannot be precise, this model provides a rough
estimate of the cost to states of a ban on gay foster
parents. Table 11 presents estimates for each state.
The second and third columns report the number of
children who are currently living with GLB parents
who would have to be relocated, making different
assumptions about how many children now have GLB
foster parents. Nationally, we estimate that between
9,300 and 14,000 children will be removed from their
foster homes. The fourth column shows the average
additional yearly cost per child who moves from a
family care setting to a group or institutional
placement (averaging that figure for children age 512 and age 13 and up). The last two columns
present our range of
Costs to individual states
estimates
for
the
could range from
additional
costs
for
$100,000 to $27 million.
states in recruitment
and the added cost of
group placements.
The wide range of the total effect on the state foster
care systems depends to some extent on the size of
the state. The potential costs to the states of
removing GLB parents from the foster care system
range from $100,000 in South Dakota to over $27
million in California.
Cost estimate methodology
These are several reasons to believe that these
represent conservative estimates of the financial
impact on states since there are a variety of costs
that cannot be estimated. First, banning GLB parents
from the foster care system takes out a large pool of
potential adoptive parents. As noted in an earlier
section, in 2005 114,000 children in the foster care
system were free for
adoption because the
Cost calculations are
child had a goal of
conservative and likely
adoption and/or the
underestimate the cost of a
child’s parental rights
ban on fostering and
had been terminated.
by GLB parents.
adoption
Also noted earlier was
that the majority of
adoptions from foster care are by foster parents.
States and the federal government subsidize
adoptions of some children out of foster care. In
some states, adoption subsidies are close to foster
care rates, but in other states adoption subsidies are
much lower than foster care payments. Therefore,
some states save money when children are placed in
permanent adoptive homes instead of remaining in
the foster care system.
19
Table 11. Cost of a ban on GLB fostering, by state.
State
Alabama
Total children displaced
4% GLB
6% GLB
foster rate
foster rate
107
161
Average additional cost for
congregate care per year
Total cost
(recruitment + congregate care differential)
(monthly avg. cost for children
age 5-12 and 13+)*12 mos.
$
-
Alaska
32
47
$
-
Arizona
120
180
$
26,084
4% GLB foster rate
$
336,960
$
6% GLB foster rate
$
507,520
112,320
$
162,240
$ 1,177,219
$
1,777,595
$
Arkansas
78
118
$
-
California
1370
2055
$
42,915
270,400
$
411,840
$18,028,645
$
27,039,386
Colorado
155
234
$
416
Connecticut
112
166
$
42,852
$
481,723
$
723,001
$ 1,936,430
$
2,857,633
Delaware
20
31
$
35,699
$
DC
40
61
$
8,922
$
269,141
$
396,810
225,362
$
Florida
462
694
$
11,126
342,384
$ 2,510,567
$
3,766,436
Georgia
359
537
$
-
Hawaii
64
95
$
-
$ 1,243,840
$
1,859,520
$
249,600
$
370,240
Idaho
38
58
$
24,916
$
283,563
$
429,505
Illinois
334
502
$
81,006
$ 4,950,441
$
7,514,942
Indiana
260
390
$
160
$
909,401
$
1,366,095
Iowa
116
174
$
12,750
$
734,758
$
1,090,702
Kansas
121
180
$
3,979
$
547,840
$
811,541
Kentucky
168
253
$
22,417
$ 1,445,986
$
2,183,191
Louisiana
104
157
$
29,373
$
951,538
$
1,444,555
56
85
$
667
$
207,687
$
315,690
Maryland
171
258
$
53,364
$ 2,787,690
$
4,215,373
Massachusetts
209
314
$
60,824
$ 3,852,264
$
5,743,373
Michigan
324
486
$
43,770
$ 3,791,966
$
5,685,557
Minnesota
134
200
$
34,764
$ 1,789,556
$
2,680,174
Mississippi
44
67
$
21,750
$
411,440
$
629,980
Missouri
124
184
$
18,797
$ 1,063,986
$
1,587,658
Montana
37
57
$
7,044
$
169,459
$
266,196
Nebraska
95
142
$
5,124
$
494,244
$
742,331
Nevada
77
114
$
33
$
266,702
$
400,020
New Hampshire
28
42
$
15,098
$
189,378
$
298,657
333
501
$
56,168
$ 4,404,556
$
6,588,897
$
Maine
New Jersey
New Mexico
46
68
$
-
New York
615
922
$
50,961
166,400
$
249,600
$ 8,958,810
$
13,384,060
North Carolina
166
249
$
North Dakota
24
35
$
2,337
$
600,106
$
901,473
35,215
$
264,742
$
424,008
Ohio
441
661
$
25,371
Oklahoma
172
258
$
209
$ 3,296,036
$
4,952,604
$
618,221
$
Oregon
209
313
$
588
$
925,251
784,669
$
1,174,923
Pennsylvania
409
615
$
Rhode Island
31
47
$
34,988
$ 4,857,021
$
7,306,667
58,334
$
696,113
$
South Carolina
118
178
1,124,634
$
9,254
$
711,911
$
South Dakota
29
1,072,026
41
$
2,491
$
107,285
$
Tennessee
153,867
198
297
$
30,954
$ 1,543,202
$
2,332,585
Texas
448
672
$
9,079
$ 2,409,105
$
3,610,907
Utah
54
80
$
9,781
$
339,535
$
489,741
Vermont
32
46
$
70,174
$
528,472
$
824,071
Virginia
166
250
$
1,897
$
559,040
$
840,457
Washington
195
293
$
58,038
$ 1,713,606
$
2,546,301
West Virginia
74
111
$
25,031
$
776,934
$
1,158,520
Wisconsin
161
242
$
49,685
$ 1,760,685
$
2,614,310
Wyoming
18
25
$
26,905
$
214,884
$
293,030
9298
13946
$87,001,436
$
130,588,073
TOTAL
20
States also save when children are adopted because
of the extra costs of foster care. Those extra costs
might include costs associated with periodic case
reviews by courts, administrative costs of case
management, independent living costs, and extra
health care costs. One recent study estimated that
North Carolina saved between $21,000 and $127,000
each time a foster child was adopted, depending on
the amount of time the child stayed in foster care
(Barth, Lee, Wildfire, and Guo, 2006). A more recent
study suggests that including the lifetime social
benefits of adoption to children boosts government
savings even more (Hansen, 2006). Because detailed
state-level estimates of the savings from adoption are
not available, we do not estimate these costs here,
although we note that it is likely they are
considerable.
Second, reductions in the future pool of potential
adoptive parents mean that states will need to
increase costly recruitment efforts to replace those
parents. Furthermore, states are likely to face rising
costs of recruiting additional parents as they reach
out beyond those potential parents who are most
interested and easiest to recruit.
Finally, this policy analysis exercise is based on data
regarding single gay and lesbian households and for
same-sex couple households. If bisexuals who are
not currently in same-sex relationships are also
restricted from adopting and fostering, the likely costs
to children and states will also be much higher than
our estimates. Findings from the NSFG (Mosher et
al., 2005) suggest that self-identified bisexuals
represent fully half of the GLB population. Our
estimates for the number of adopted and fostered
children being raised by GLB parents would be
significantly higher if we could include bisexual
parents in these estimates, as would our estimate of
the cost of excluding GLB parents.
Overall, then, our estimate of the costs to states are
likely to underestimate the cost of a ban on fostering
and adoption by GLB parents.
Third, as discussed in the previous section, the
children who must be moved out of a gay or lesbian
foster parent’s home might have added health care
and other expenses related to the trauma of the
move.
Children in foster care have already
experienced the trauma of a separation from their
biological parents.
Additional separations from
substitute caregivers to whom they have become
attached could have significant effects on their socioemotional development. Young children, in particular,
might not understand the nature of impersonal policy
changes and might instead perceive the move to be
related to some shortcoming on their part, increasing
the level of trauma experienced. Moves for older
children might be traumatic because they may be
separated from their friends, siblings, or their school.
Fourth, the federal government sets standards for
states to meet in placing of foster children who are
available for adoption in permanent homes (Adoption
and Safe Families Act (ASFA), P.L. 105 89 of 1997, as
explained by Wulczyn and Hislop (2002)). States
could receive $4,000 for each completed adoption
($6000 per adoption of a special needs child) that
exceeded a baseline set based on numbers of recent
adoptions. By turning away prospective adoptive
parents, states risk missing these goals and losing out
on an important source of funding (Doering and
Schuh, 2006).
Fifth, a ban on GLB foster parents would also ban
care by GLB relatives, which we cannot account for
here given the lack of Census data on kin care by GLB
people. Moreover, use of kin can vary from state to
state (Geen, 2003). If we could include these
providers, the number of children displaced and the
cost to the state would be higher, and states that rely
heavily on kin would be more affected.
21
22
Conclusions and Policy Implications
Implications for the foster care system
As the Census data and other recent federal data
show, many GLB people are adoptive or foster
parents. Many more have expressed interest in
adopting and constitute a large pool of potential
adoptive or foster parents. Given the constant need
for more adults to care for children who are in the
overburdened child welfare system, GLB people are
an important new source for child welfare officials to
tap. The fact that we already see so many GLB foster
parents also implies that changes in policy to ban GLB
people from fostering or adopting will have
repercussions for children and for state welfare
systems.
The conclusions and implications of this study might
be thought of in terms of implications for the states
and their child welfare agencies, for children, and for
GLB adults.
State child welfare agencies are already considerably
over-burdened and financially strained. Additional
costs to finding new
A ban on GLB fostering
foster
homes
for
might divert resources
children
displaced—as
from other child
much as $130 million
nationally—could divert
protection activities and
resources from other
create longer term stress
important
child
on parent recruitment
protection
activities.
efforts.
A segment of the foster care population to be
particularly concerned about in this debate is gay and
lesbian youth in foster care. More research is needed
to better understand the needs of this population, but
research shows that this population exists. They tend
to be older and research
shows
that
finding
GLB caregivers might
placements for older youth
be relatives or other
is particularly challenging
individuals who are
for states. GLB parents
best
equipped to foster
might be more likely to
these children.
accept a GLB foster youth.
Implications for
GLB people
While we did not directly assess the effects of a ban
on GLB people, laws or policies prohibiting wellqualified GLB potential parents from adopting or
fostering could exacerbate social stigma associated
with their sexual orientation by creating additional
legal barriers to parenting. They already face
documented hurdles in the foster care and adoptive
process because of their sexual orientation. Much
more research is needed to understand the practices
that affect this population's access to foster care and
adoption services.
Foster and adoptive parents are already a limited
resource for state child welfare agencies. In the short
term, restricting the pool of potential parents could
create financial and logistical challenges for states. In
the longer term, states would miss the opportunity to
expand pools of potential foster and adoptive parents
(Mallon, 2006), which might allow them to save
resources currently spent on recruiting and instead
use those resources for other important activities.
Implications for children
There are several reasons to be concerned about
children’s experiences and the potential trauma they
may incur should such bans be put in place. For one,
these children may have attached to their GLB
caregivers. They have already been separated from
their biological parents and many have likely
experienced several placements.
These GLB
caregivers might be relatives or other individuals who
are best equipped to foster these children. Disrupting
yet another attachment could be potentially very
detrimental to their well-being and ability to form
relationships later in life. Another reason for concern
is that children may be moved to institutional
settings, and prior research suggests these settings
are not as good for children’s development.
Moreover, moving children to more restrictive settings
would be counter to the federal and states goals of
finding the least-restrictive placement setting for a
child.
23
24
Appendix: Data and Methodology
United States Decennial Census, 2000
Estimates for the number of adopted and fostered children being raised in lesbian and gay household rely in large
part on ascertaining the characteristics of same-sex unmarried partner households, commonly understood as gay and
lesbian couples, in the United States 2000 Decennial Census. We use a combined 5 percent and 1 percent Public Use
Microdata Sample (PUMS) to determine the characteristics of same-sex unmarried partner households. The two
PUMS samples represent independent draws from the responses to the census long-form, which contains detailed
information about all members of the household, including if they are an adopted or foster child.
Identifying same-sex unmarried partners
The census household roster includes a number of relationship categories to define how individuals in a household
are related to the householder (the person filling out the form). These fall into two broad categories: related persons
(e.g., husband/wife, son/daughter, brother/sister), and unrelated persons (e.g., unmarried partner,
housemate/roommate, roomer/border, and other nonrelative). Since 1990, the Census Bureau has included an
“unmarried partner” category to describe an unrelated household member’s relationship to the householder. If the
householder designates another adult of the same sex as his or her “unmarried partner” or “husband/wife”, the
household counts as a same-sex unmarried partner household. These same-sex couples are commonly understood
to be primarily gay and lesbian couples (Black et al. 2000) even though the census does not ask any questions about
sexual orientation, sexual behavior, or sexual attraction—three common ways used to identify gay men and lesbians
in surveys.
Potential bias and measurement error
There are several selection bias and measurement error issues associated with the same-sex unmarried partner data
that could affect estimated rates of adoption and fostering. First, to the extent that the census sample can be used
to derive characteristics of gay and lesbian people, it is important to note that the sample is only a representation of
couples. Their characteristics, including the likelihood of either adopting or fostering children, may differ from those
of single gay men and lesbians. Carpenter (2005) finds that single lesbians and gay men in California were more
likely to have children (not specifically adopted or fostered children) than their coupled counterparts. In jurisdictions
that restrict adoption and fostering options for lesbians and gay men, it may be easier for single lesbians and gay
men to both adopt and/or foster.
Secondly, concerns about confidentiality may lead some same-sex couples to indicate a status that would not provide
evidence of the true nature of their relationship. Other couples may believe that “unmarried partner” or
“husband/wife” does not accurately describe their relationship. A study of undercount issues relating to same-sex
unmarried partners in Census 2000 indicates that these were the two most common reasons that gay and lesbian
couples chose not to designate themselves as unmarried partners (Badgett and Rogers 2003). It seems reasonable to
believe that the census tends to capture same-sex couples who are more willing to acknowledge their relationship
and are potentially more “out” about their sexual orientation. In areas which restrict adoption and fostering options
for lesbians and gay men, those who are more open about their relationships may actually be less likely to have
adopted or fostered children than those who keep their relationships more private.
These selection biases suggest that estimates of gay and lesbian adoption and fostering rates derived from the
census same-sex unmarried partner sample likely represent a lower bound.
Beyond the issue of selection bias, a measurement error issue specific to same-sex unmarried partners identified in
Census 2000 creates an additional potential bias. In the 1990 Census, a household record that includes a same-sex
“husband/wife” was edited such that, in most cases, the sex of the husband or wife was changed and the couple
became a different-sex married couple in publicly released data (Black et al., 2000). This decision is reasonable if
most of the same-sex husbands and wives were a result of the respondent checking the wrong sex for either him- or
herself or his or her spouse. In Census 2000, officials decided that some same-sex couples may consider themselves
married, regardless of legal recognition. As a result, these records were altered such that the same-sex
“husband/wife” was recoded as an “unmarried partner.”
This process inadvertently creates a measurement error issue. Some very small fraction of the different-sex couples
likely make an error when completing the census form and miscode the sex of one of the partners. Under Census
2000 editing procedures, all of these miscoded couples would be included in the counts of same-sex unmarried
partners. Because the ratio between different-sex married couples and same-sex couples is so large (roughly 90 to
1), even a small fraction of sex miscoding among different-sex married couples adds a sizable fraction of them to the
same-sex unmarried-partner population, possibly distorting some demographic characteristics.
25
Black et al. (2003) propose a method for at least identifying the direction of the bias when considering various
demographic characteristics of same-sex couples. Same-sex unmarried partner households where one member of
the couple was identified as “husband/wife” are the “at-risk” group for this form of measurement error. Census data
provide no simple way to identify this group, but one way to isolate same-sex “spouses” is to consider the marital
status variable allocation flag (a variable indicating that the original response had been changed). Census Bureau
officials confirm that their editing procedures altered the marital status of any unmarried partners who said they were
“currently married.” (Changes in marital status occurred after editing all of the same-sex “husbands” and “wives” into
the “unmarried partner” category.) A large portion of the same-sex unmarried partners who had their marital status
allocated likely originally responded that they were “currently married” given that one of the partners was a
“husband/wife.” Same-sex partners who have not had their marital status variable allocated are likely free of
significant measurement error. As such, the analyses use estimates of adoption and fostering rates as well as
demographic characteristics only among same-sex partners and their families where at least one of the partners did
not have his or her marital status allocated.
Identification of adopted and fostered children
The census household roster only identifies the relationship between household members and the householder.
Estimates of adopted and fostered children are therefore more technically estimates of households where the
householder is the adopted or foster parent of a child. This measurement method likely undercounts the total
number of adopted and fostered children since it probably misses households where the parent (or parents) of an
adopted or foster child is not the householder. Further, a child who is the “natural born” child of the householder
could technically be the adopted child of a spouse or partner. Census data provide no mechanism for distinguishing
these types of households.
Foster children identified in the Census are in most cases non-kin fostered children. The household roster includes a
variety of kinship relationship categories and it seems reasonable to assume that a householder would identify a
foster child as the appropriate kinship relationship even if the child is technically in the home as a foster child.
National estimates for the number of adopted and fostered children being raised by
lesbians and gay men
No available data sources provide a direct count or estimate of the number of adopted or fostered children living in
all gay or lesbian households, both singles and same-sex couples. Census 2000 estimates of adoption and fostering
rates within same-sex couple households provide a mechanism to make estimates among the entire lesbian and gay
population if one makes the following assumptions:
1. Rates of adoption and fostering do not vary between same-sex couples and single lesbian and gay
households
2. Census 2000 counted all gay and lesbian couples in the United States 6
The estimation process begins by estimating the total number of lesbian and gay households in the United States.
Using the National Survey of Family Growth (described in detail later), Mosher, et al. (2005) find that 2.3 percent of
men and 1.3 percent of women aged 18-44 identified themselves as gay or lesbian. If we apply these estimates to
the entire U.S. adult population (aged 18 and up), then there are an estimated 2,322,870 gay men and 1,405,738
lesbians in the United States. Census 2000 counted 301,026 same-sex male couples and 293,365 same-sex female
couples. Subtracting those figures from the estimates of the number of gay men and lesbians yields a total of
3,134,218 lesbian and gay households (2,021,844 male and 1,112,373 female).
We then derive estimates of the number of adopted or fostered children with gay or lesbian parents by multiplying
the total number of lesbian and gay households by the adoption/fostering rates among same-sex couples and the
average number of adopted and fostered children within same-sex couple households with adopted/fostered children.
State-level estimates for the number of adopted children being raised by lesbians
and gay men
We derive estimates of the number of adopted children being raised by lesbians and gay men within states by first
determining the geographic distribution across all states of the adopted children being raised by same-sex couples
from Census 2000. We then apply that distribution to the national estimate for the number of adopted children being
raised by lesbians and gay men. For example, approximately one-quarter (25 percent) of adopted children living
6
The measurement error discussed earlier would suggest that Census counts overstate the number of same-sex couples as some
portion are actually different-sex married couples. O’Connell and Gooding (2006) assessed this problem by attempting to match
names with recorded sex among both same-sex and different-sex couples. They found that sex miscodes among different-sex
couples (in other words, different-sex couples who are actually same-sex couples) were sufficient to offset the miscoded same-sex
couples. Further, undercount estimates made by Badgett and Rogers (2004) could also lead to the Census figures underestimating
the true count of same-sex couples.
26
with same-sex couples live in California. Our estimate for the number of adopted children living with a lesbian or gay
parent (both single and coupled) in California is derived by assuming that one quarter (25 percent) of the national
estimate of the number of adopted children being raised by lesbian or gay parents live in California. It should be
noted that we are unable to make estimates for the six states (Delaware, Idaho, New Hampshire, North Dakota,
South Dakota, West Virginia, and Wyoming) where there are no observations of adopted children living with a samesex couple.
In theory, a similar method could be applied to estimate the number of foster children being raised by lesbians and
gay men in states. Unfortunately, the sample sizes for foster children being raised by same-sex couples are
insufficient to make credible state-level estimates. The samples includes 106 observations of foster children being
raised by same-sex couples.
National Survey of Family Growth 2002
The 2002 National Survey of Family Growth (NSFG) provides data on fertility and the desire to adopt for people of
differing sexual orientations. The NSFG was conducted in 2002 and 2003 under the auspices of the National Center
for Health Statistics, which is part of the Centers for Disease Control and Prevention, U.S. Department of Health and
Human Services. Trained female interviewers conducted in-person interviews with 7,643 women and 4,928 men in
the United States who were age 15-44. These individuals sampled are representative of the U.S. population and
were chosen through multistage area probability sampling. We use sampling weights in all calculations presented in
this report.
The survey asked respondents about topics such as fertility, personal characteristics, and sexuality. Most questions
were asked face-to-face by the interviewer. However, a series of questions about sexuality, including sexual
orientation, were asked using an Audio Computer-Assisted Self-Interviewing (ACASI) technique. The respondent
used a computer to listen to or read the sensitive questions on sexuality and respond on the computer directly. The
additional privacy provided by this method is likely to produce better reporting of sexual identity than face-to-face
interviews.
On the ACASI questionnaire, people aged 18 and older were asked, “Do you think of yourself as heterosexual,
homosexual, bisexual, or something else?” Appendix Table A presents responses to this question by sex.
Respondents were also asked about same-sex attraction and sexual experiences, but we use the identity data for this
report because public policies related to adoption and sexual orientation most often appear to relate to self-reported
identity. Overall, 4.1 percent of both women and men reported either a homosexual or bisexual identity, although
more women reported being bisexual than did men. Because public policies do not always obviously distinguish
between homosexual (or gay or lesbian) identity and a bisexual identity, in this report we combine the homosexual
and bisexual respondents where necessary.
We draw on several other questions to provide information on the fertility experiences and adoption aspirations of
GLB respondents. Unless otherwise noted, all statistics come from the authors’ calculations on weighted data from
the Public Use sample supplemented with the ACASI datafile made available to us by the National Center for Health
Statistics.
Fertility
Women in the NSFG were asked how many live births they had (question BC-2). We calculate the proportion of
women who have given birth to a live baby. Men were asked if they had ever fathered or adopted a child.
Desire to have children
Both men (series HA) and women (series GA) were asked about their “feelings about having (a/another) child,
whether or not you are able to, or plan to have one.” We calculated the percentage answering yes or probably to
the following question: “(Looking to the future, do/If it were possible would) you, yourself, want to have (a/nother)
baby at some time (after this pregnancy is over/in the future)?” Phrases in parentheses were adapted to the
situations of each respondent.
Adoption consideration
Questions specifically related to adoption were asked only of women in the NSFG. One series of questions in the
NSFG (BK) probes for intentions and actual actions taken to adopt a child who has not already been adopted or
whose adoption is in the process. Question series BL asks respondents whether they “have ever considered adopting
(another) child.” That question was only asked of those not currently seeking to adopt. We combine people
answering affirmatively on either series to give a fuller picture of those who have considered adopting at some point
in their lives. Results are presented in Table 2 in the main text.
27
Appendix Table A: Self-reported sexual orientation by sex.
Sex
Women
Men
Heterosexual
90.3%
90.2%
Homosexual
1.3%
2.3%
Bisexual
2.8%
1.8%
Something Else
3.8%
3.9%
Did not
report
1.8%
1.8%
Source: William D. Mosher, Anjani Chandra, and Jo Jones, “Sexual Behavior and Selected Health Measures: Men and Women 15-44 Years of Age, United States,
2002,” Advance Data from Vital and Health Statistics, CDC, Number 362, Sept. 15, 2005.
Adoption and Foster Care Analysis and Reporting System (AFCARS) 2004
Children in foster care
The Adoption and Foster Care Analysis and Reporting System (AFCARS) is the federal repository for state
administrative data on children in foster care and those that have been adopted. While only developed in the late
1990s and still improving, this system is the preferred source for administrative data on children in the child welfare
system. For this report, AFCARS data from 2004 was used to provide the total numbers of children in foster care on
September 30, 2004 nationally and for each state. Estimates were also produced for the numbers of children in
foster care by age group and types of placement, specifically non-kin foster family homes and group home and
institutional care settings.
Payments made on behalf of foster children
AFCARS also provides information on payments made to caregivers and child-caring institutions on behalf of children
to provide for their care. Specifically, AFCARS asks states to provide the last full monthly payment made during the
reporting period:
"Enter the monthly foster care payment (regardless of sources) - Enter the monthly payment paid on behalf
of the child regardless of source (i.e., federal, state, county, municipality, tribal, and private payments). If
Title IV-E is paid on behalf of the child, the amount indicated should be the total computable amount. If the
payment made on behalf of the child is not the same each month, indicate the amount of the last full
monthly payment made during the reporting period. If no monthly payment has been made during the
period, enter all zeros. A blank in this field indicates that the State does not have the information for this
element.” (National Data Archive on Child Abuse and Neglect, 2002)
If the child is “IV-E eligible,” meaning the child resided in a family that met income eligibility requirements prior to
coming into care, a portion of this payment is reimbursable by the Federal government. Using AFCARS, estimates
were produced of the mean payments made for children of particular ages and in different types of placements. This
mean is intended to provide an approximation of state costs, on average, for providing care for foster children of
particular ages in different arrangements.
Quality checks and adjustments to the AFCARS data
Several adjustments and checks were done of the AFCARS data to ensure its accuracy. First, the mean was adjusted
to exclude erroneous payment amounts and adjust for outlying amounts. Cases where the payment was $0 or
$99,999 were removed. It is unlikely that no payment was made on behalf of the child, but instead that this data is
simply not available. It is also likely that values of $99,999 were default values in an administrative system. The
payment data was also adjusted for outlying values. Payments for children in care are substantially higher if a child
has significant special needs. To ensure these cases did not bias the mean, the mean is calculated based on the
middle 50 percent of the distribution.
Second, to get a sense of the validity of the AFCARS data, the adjusted means were compared to state payment data
collected by the Child Welfare League of America and stored in their National Data Analysis System (NDAS). The
NDAS compiles state reports of basic monthly foster care maintenance payments for children ages 2, 9, and 16.
NDAS also includes state reports of per diem payments for children in residential and group care settings.
Comparing foster care rates from NDAS 2002 and the adjusted means from AFCARS 2002 for non-kin foster care,
when both sources were available, rates were comparable within $200 for many states (72 percent of states for age
2, 58 percent for age 9, and 42 percent for age 16). For older youth, the payment amounts did diverge more
significantly. In all cases, the AFCARS adjusted mean was higher than NDAS. This likely reflects a reality in child
welfare that older children frequently have special needs and receive higher payments on average. Hence, AFCARS
data does appear to provide a reflection of the true cost to states in providing care for foster children in non-kin
foster care.
28
Data on institutional and group home care costs were more difficult to compare. NDAS rates were unavailable for
many states or were not available for either group home or institutional care. Generally, when rates were available,
NDAS and AFCARS estimates differed more substantially. This might be explained by the fact that group home and
institutional rates can vary widely between facilities in states, which could get obscured in the state averages
provided by NDAS. For the purposes of this study, AFCARS data, collected at the child level, provides the best
reflection of costs to states for serving children in group homes and institutional settings.
Third, AFCARS data were checked for small sample sizes. Table B identifies states for which sample sizes were under
50 children for particular ages and placement categories. Since very few children under four reside in congregate
care, for most states, these sample sizes were under 50. As congregate care is increasingly seen as a less preferable
placement for very young children, cost estimates for placement in congregate care for this age group are not
included in the analysis to assess costs to states of limiting gay and lesbian foster parenting. Costs of recruiting
additional foster parents to care for children potentially already living with a gay or lesbian foster parent(s) are
included for these children.
Appendix Table B: States with sample sizes of fewer than 50 children.
Foster Care
No states
Ages 0-4
Group Home /
Institutional
* Most states
have less than 50
children age 0-4
in these settings
Foster Care
No states
Ages 5-12
Group Home /
Institutional
Alaska
Delaware
Washington DC
Hawaii
Idaho
Vermont
Wyoming
Foster Care
No states
Ages 13+
Group Home /
Institutional
No States
Fourth, AFCARS data were also checked for extensive missing data. Table C lists states for which payment data was
missing for more than 20 percent of cases. States for which no data is available, and NDAS rates are used instead
(see below), are not included in this list.
Appendix Table C: States with missing payment data for more than 20 percent of children.
Foster Care
California
Delaware
Florida
Kansas
Maine
Nebraska
New York
Ohio
Virginia
Washington
West Virginia
Ages 0-4
Group Home /
Institutional
* Most states
report more than
20% missing
data as few very
young child
reside in these
settings
Ages 5-12
Group Home /
Institutional
Alabama
California
Arkansas
Delaware
California
Florida
Connecticut
Kansas
Florida
Nebraska
Hawaii
New York
Indiana
Ohio
Kansas
Virginia
Maryland
Washington
Missouri
West Virginia
Nebraska
New Jersey
New Mexico
New York
Ohio
Oregon
South Carolina
South Dakota
Vermont
Virginia
Washington
West Virginia
Wyoming
Foster Care
Ages 13+
Group Home /
Institutional
Alabama
Alabama
Arizona
Arizona
Arkansas
California
California
Delaware
Colorado
Florida
Delaware
Kansas
Florida
Nebraska
Hawaii
New York
Illinois
Ohio
Kansas
South Carolina
Louisiana
Vermont
Maryland
Virginia
Michigan
Washington
Missouri
Nebraska
New Jersey
New York
Ohio
Oregon
South Carolina
South Dakota
Vermont
Washington
West Virginia
Wisconsin
Wyoming
Foster Care
While this missing data is cause for some concern, it is difficult to determine how it might bias the payment
averages. Given that we use the mean of the middle two quartiles of the payment distribution, we are fairly
confident that even if bias was an issue, this adjustment would minimize it.
29
Fifth, adjusted means were checked for data that appeared potentially erroneous or were unavailable, and in a few
cases the NDAS rates were used instead. For foster care rates, AFCARS data were not available for Alaska and
Mississippi and NDAS rates were used instead. For Georgia, the AFCARS means appeared highly improbable, ranging
from over $12,000 to almost $15,000 per month depending on the age group, and NDAS rates were used instead.
For group home and institutional care, data was not available in AFCARS for some age groups in Delaware, Kansas,
Mississippi, Virginia, and West Virginia. For these states, NDAS rates for institutional and group home care were
used instead. For Alaska and Tennessee, AFCARS and NDAS data were not available for some age groups, and
payment estimates are not possible for these states. Again for Georgia, the adjusted average for institutional and
group home care seemed highly improbable, ranging from over $15,000 to nearly $27,000 per month depending on
the age group. NDAS data on institutional and group home care is not available for Georgia either, so payment
estimates are not available for Georgia. For some states, AFCARS institutional and group care rates appeared highly
improbable. For adjusted mean monthly payments under $200, we used NDAS data when available or did not report
data. This occurred in Nevada for 5-12 year olds (adjusted mean was $165) and the 13 and older age group
(adjusted mean was $86). NDAS data was not available for this state. Utah’s adjusted mean monthly payment for
the 13 and older age group was $42 and was replaced with the NDAS payment of $2129.
States also provide to the Federal government with their AFCARS submissions careful notation of any problems or
clarifications needed to understand particular data elements. Consulting this information, Florida, Iowa, and
Washington make notations about their 2004 payment information. Looking more closely at the rates for each of
these states, they appeared highly comparable to NDAS data when available and to other state estimates. It does
not appear that the notes reported affected the quality of the data substantially, and AFCARS estimates were used
for these states. However, as described above, both Florida and Washington have missing data for more than 20
percent of children in most age groups.
Estimating foster care recruitment costs
State data on the costs of foster care recruitment are not readily available, and as a result, costs are very difficult to
estimate. States pay for these costs through one funding stream, Title IV-E Foster Care Program Funds. This
funding stream provides financial reimbursement to states for the costs of foster care for eligible children. Funds for
foster parent recruitment and training, however, fall under two different IV-E categories, administration and training
costs. These categories of spending also include other expenditures. For example, Title IV-E administrative costs,
which include foster parent recruitment costs, also include spending for pre-placement services, placement services,
case management, eligibility determinations, and licensing.
To arrive at an estimate of recruiting costs, limited published information from states was assessed and additional
phone calls to a few other states were made. The best available data on costs of foster care recruitment comes from
published state analyses of spending in this area. Few states, however, have made this data available through public
reports. California and Michigan have published some information on spending from which insights into recruitment,
retention, and training costs can be gleaned. According to yearly reports provided by California, total spending on
foster parent recruitment, training, and retention has ranged from about $16 and $25 million per year (see Table D).
Looking at each of the years for which data is available, it is possible to estimate a range of per family costs.
Dividing total costs by number of licensed families gives an upper bound estimate of the costs of recruiting, training,
and licensing one family. However, these costs also include retention and training of foster parents who may have
been fostering for many years. If instead total costs are divided by all families served, a lower bound estimate can
be created. Looking at years for which these data are available, the range is wide. In the 2002-2003 year, costs per
family were likely somewhere in between $1100 and $15,500. In the 2002-2003 year, costs per family ranged
between $900 and $11,900. While these ranges are large, it can be assumed that the cost would not be exactly at
the lower or upper bound, so a conservative estimate would be slightly above the lower bound.
Appendix Table D: California costs of recruitment, training, and retention of foster parents.
Year
Total Spending
Number of Families
Sponsored Financially to
Attend Recruitment,
Training, and Retention
Events
Number of Families
Licensed
Cost Per Licensed
Family
Cost Per Family
Served through
Recruitment,
Training, and
Retention
2001-2002
$25,417,999
n/a
2673
$9,509.17
n/a
2002-2003
$18,982,629
16,270
1123
$16,903.50
$1,166.73
2003-2004
$16,106,276
18,109
1350
$11,930.57
$889.41
2004-2005
$15,967,610
12,441
n/a
n/a
$1,283.47
Source: Resource Family Recruitment, Training, and Retention Annual Reports, California Department of Social Services and Urban Institute calculations.
30
Published data on adoptive parent recruitment costs from Michigan also provide some context for thinking about
recruitment costs. The Michigan child welfare agency contracts with various public and private agencies for foster
care and adoption services. Table E indicates the reimbursement amounts paid to contracted agencies per adopted
child depending on the type of child for whom a family is recruited (i.e. it is more costly to recruit for a child in
institutional care). These payments range between $1,300 and $10,000. While the procedures for recruiting,
training, and licensing foster and adoptive parents are quite similar, it might be assumed that the process of
becoming and adoptive parent would be slightly more extensive and, therefore, more costly. Some of the additional
steps involved in this process include trial home visits, extensive data collection on parents’ backgrounds, and preadoptive services for the family to prepare for the adoption.
Hence for this analysis we use one of Michigan’s lower rates, the “standard rate” of $4,160 per adoptive family
recruited, to estimate potential costs of recruiting new foster families for displaced children living with gay and
lesbian foster parents. This estimate does fall within the California ranges and given the variability in the California
estimates, we believe the Michigan data provide the most feasible estimate of recruiting costs, given the limited data
available.
Appendix Table E: Data from adoption contract management, 2002.
$10,000
Residential Rate
$9,325
MARE Rate
$7,000
Intra-Agency
MARE Rate
$8,660
5 Month Premium
Rate
$6,520
Enhanced Rate
$4,160
Standard Rate
$2,600
$1,300
Enhanced PrePlacement Fee
Standard PrePlacement Fee
Paid to an agency that places a child for adoption directly from residential care.
Child must be placed within 120 days of leaving residential care.
Paid to a non-custodial agency that places a child registered on MARE (Michigan
Adoption Resource Exchange) with a recruited family (does not include foster or
relative family).
Paid to a non-custodial agency that places a child registered on MARE for six or
more months with a recruited family (does not include foster or relative family).
Documentation of recruitment efforts is required.
Paid to an agency that places a child in its care in adoption within 5 months of the
child’s permanent wardship.
Paid to an agency that places a child in its care in adoption within 7 months of the
child’s permanent wardship.
Paid to an agency that places a child in its care seven months after the date of
permanent wardship.
Paid to an agency when a child in its care is referred to another agency or DHS
local office within three months of the child's permanent wardship date.
Paid to an agency when a child in its care is placed by another agency or DHS
local office and the criteria for an enhanced pre-placement fee does not apply.
Researchers also called several states to supplement available published data on recruitment costs and found
reasonable support for an estimate of approximately $4,000. Many states could not provide exact recruitment cost
estimates as they either did not have the numbers at that level, were unwilling to share the information, or could not
compile the information easily and within the timeframe of the study. Yet, five states provided some information.
One state reported the average cost for the recruitment, training and licensure of a foster home to be approximately
$3,980. Three states reported costs for different stages of the recruitment process, that when considered together
also supported a $4,000 estimate. For example, the first stage of the process involves the actual recruitment
activities. Based on available figures from an adoption recruitment initiative in one state, researchers estimated
$1,715 per family, but this estimate did not include licensing and training for each family. Looking to the licensing
and training stage, another state reported that training and home study costs for foster parents appeared to be
around $1,000 per family. Another state estimated costs for a home study and training at $2,500 per family. So
combining recruitment activity costs with some of the licensing and training costs in the different states does suggest
a total recruitment cost estimate around $4,000 is probably reasonable. It is important to note, however, that
recruitment costs could be higher or lower in any state. For example, an adoption agency in one state did estimate a
total cost of approximately $1,100 for recruitment, training, and licensing of one family. In determining the most
precise estimate of the costs of a ban of GLB foster parents in a particular state, an actual estimate of recruiting
costs should be estimated for that particular state.
With a ban prohibiting gay men and lesbians from fostering, it is also possible that states might try to use the
resources they already have to find homes for displaced children, which would lower their recruitment costs. For
example, states might move more children into currently available foster homes. Given the current shortage of
foster parents, it is likely many foster parents are already caring for the maximum number of children for which they
are licensed. Hence, states may find it difficult to find enough new placements within the existing pool of foster
homes.
The study also assumes a cost of $4,160 per child. There may be some economies of scale if a family is recruited
and licensed and fosters more than one child, which would mean costs may be lower than estimated. At the same
time, it can also be assumed that the $4,160 estimate is somewhat conservative in that recruitment costs might be
much higher for older or special needs children who are more difficult to place. Using one recruitment cost estimate
31
for all children does not take into account the additional costs that states might incur in trying to find homes for
particular populations of children.
Estimating the cost to states of banning GLB foster care
We estimate the total cost of eliminating GLB parents using several assumptions and procedures:
1. If the foster children of GLB parents were removed pursuant to a new state law or policy, we assume that 6
percent of non-kin care placements of foster children have GLB parents, the national average presented earlier.
The sample sizes of foster parents in the census data were too small to create state-level estimates. While some
states have attempted to screen out GLB potential parents, it is possible that some GLB parents are still in the
system, either because they did not consider themselves GLB at the time they became foster parents or because
they did not reveal their status to the state child welfare system.
2. We assume those children go either to another family care setting or into group or institutional care in the same
proportions as all children are distributed into one of those two kinds of care. (The one exception to this
assumption is that we assume 100 percent of children aged 0-4 years stay in family care, since it is thought
particularly undesirable to place very young children in congregate care.)
3. We use assumptions in steps #1 and #2 above to calculate the number of children in non-kin placements
moving into family care or into group/institutional care based on the number of children reported by states in the
AFCARS data from 2004, the most recent year available.
4. We assume that the recruitment cost of a new family to replace the GLB family is $4160 based on the discussion
above. Recent studies in California and Michigan provide a range of estimates of recruiting costs. We use the
$4160 figure as a conservative estimate.
5. We calculate the difference in monthly payments per child to family caregivers compared with group/institutional
care for each state using the AFCARS data on those payments. Because the average time in foster is greater
than one year for children in all three age ranges that we used (0-4, 5-12, and 13 and up), we multiply the
monthly payment rate by twelve to get an annual payment differential.
6. We use the estimates described in steps #3, #4, and #5 above to calculate the added costs to states by
multiplying the number of children moving into a new family or into group/institutional care by the relevant cost
figure.
32
References
American Academy of Child and Adolescent Psychiatry. 1999. Gay, Lesbian and Bisexual Parents Policy Statement.
http://www.aacap.org/page.ww?section=Policy+Statements&name=Gay%2C+Lesbian+and+Bisexual+Parents+
Policy+Statement (accessed March 19, 2007).
American Academy of Pediatrics. 2002. Coparent or Second-Parent Adoption by Same-Sex Parents.
http://aappolicy.aappublications.org/cgi/content/full/pediatrics%3b109/2/339 (accessed March 19, 2007).
American Bar Association. 1999, 2003. Foster Care and Adoption. http://www.abanet.org/child/foster-adopt.shtml
(accessed March 19, 2007); See also American Bar Association. 1995. Child Custody and Support.
http://www.abanet.org/child/custody-support.shtml (accessed March 19, 2007).
American Medical Association. 2004. American Medical Association House of Delegates Resolution 204.
http://72.14.203.104/search?q=cache:LkziJ3A-HYMJ:www.amaassn.org/ama1/pub/upload/mm/15/res_hod204_a04.doc+%E2%80%9CWhereas,+Having+two+fully+sanctione
d+and+legally+defined+parents+promotes+a+safe+and+nurturing+environment+for+children,+including+psy
chological+and+legal+security%3B+and%22&hl=en&ct=clnk&cd=4&gl=us (accessed March 19, 2007).
American Psychoanalytic Association. 2002. American Psychoanalytic Association Position Statements.
http://www.apsa.org/AboutAPSAA/PositionStatements/tabid/191/Default.aspx (accessed March 19, 2007).
American Psychological Association. 2004. APA Policy Statement: Sexual Orientation, Parents and Children.
http://www.apa.org/pi/lgbc/policy/parents.html (accessed March 19, 2007).
Anderson, G. R. 2003. Aging Out of the Foster Care System: Challenges and Opportunities for the State of
Michigan. http://www.ippsr.msu.edu/AppliedResearch (accessed January 31, 2007).
Badgett, M.V. Lee, and Marc. A. Rogers. 2003. “Left Out of the Count: Missing Same-Sex Couples in Census 2000.”
Institute for Gay and Lesbian Strategic Studies.
Barth, Richard P., Chung Kwon Lee, Judith Wildfire, and Senyang Guo. 2006. “A Comparison of the Governmental
Costs of Long-Term Foster Care and Adoption.” Social Service Review 80 (1): 127-158.
Black, Dan, Gary Gates, Seth Sanders, and Lowell Taylor. 2000. “Demographics of the Gay and Lesbian Population
in the United States: Evidence from Available Systematic Data Sources.” Demography 37 (2): 139-154.
Black, Dan A., Hoda R. Makar, Seth G. Sanders, and Lowell J. Taylor. 2003. “The Earnings Effects of Sexual
Orientation. Industrial and Labor Relations Review 56 (3): 449-469.
California Department of Social Services. 2003. Foster and Adoptive Parent Recruitment, Training, and Retention
Annual Report: July 1, 2001 to June 30, 2002. Requested by Child and Youth Permanency Branch. Prepared by
Data Systems and Survey Design Bureau Research and Development Division.
http://www.childsworld.ca.gov/res/pdf/FAPRTRREPORT.PDF (accessed February 2007).
Carpenter, Christopher 2005. “Self-Reported Sexual Orientation and Earnings: Evidence from California,” Industrial
and Labor Relations Review, 58(2): 258-273.
Child Welfare League of America. 2004. Position Statement on Parenting of Children by Lesbian, Gay, and Bisexual
Adults. http://www.cwla.org/programs/culture/glbtqposition.htm (accessed March 19, 2007).
Cooper, Leslie and Paul Cates. 2006. Too High a Price: The Case Against Restricting Gay Parenting. New York, NY:
American Civil Liberties Foundation.
Courtney, M. E., I. Pilivian, A. Grogan-Kaylor, and A. Nesmith. 2001. “Foster youth transition to adulthood: A
longitudinal view of youth leaving care.” Child Welfare 80 (6): 658-717.
Courtney, M.E., A. Dworsky, G. Ruth, T. Keller, J. Havlicek, and N. Bost. 2005. “Midwest evaluation of the adult
functioning of former foster youth: Outcomes at age 19.” Chapin Hall Working Paper.
33
David M. Brodzinsky, Charlotte J. Patterson, and Mahnoush Vaziri. 2002. “Adoption Agency Perspectives on Lesbian
and Gay Prospective Parents: A National Study.” Adoption Quarterly 5 (3): 5-22.
DeSena, A. D., R.A. Murphy, H. Douglas-Palumberi, G. Blau, Blandina Kelly, S.M. Horwitz,and J. Kaufman. 2005.
“SAFE Homes: Is it worth the cost? An evaluation of a group home permanency planning program for children
who first enter out-of-home care.” Child Abuse and Neglect 29: 627-643.
Doering, Karen M. and Carl A. Schuh. 2006. “The High Cost of Denying Permanency: An Analysis of the Economic
Impact of Florida’s Adoption Ban.” National Center for Lesbian Rights.
Downs, A.C., and Steven E. James. 2006. “Gay, lesbian, and bisexual foster parents: Strengths and challenges for
the child welfare system.” Child Welfare March/April.
Evan B. Donaldson Adoption Institute. Adoption by Lesbians and Gays: A National Survey of Adoption Agency
Policies, Practices, and Attitudes.
http://www.adoptioninstitute.org/whowe/Lesbian%20and%20Gay%20Adoption%20Report_final.doc (accessed
February 16, 2007).
Freundlich, Madeline. 2003. Time Running Out: Teens in Foster Care. New York: Children’s Rights.
Gates, Gary and Jason Ost. 2004. The Gay and Lesbian Atlas. Washington D.C.: Urban Institute Press.
Geen, R. 2003. Kinship Care, Making the Most of a Valuable Resource. Washington, D.C.: The Urban Institute
Press.
Goerge, R., L. Bilaver, B. Lee, B. Needell, A. Brookhart, and W. Jackman. Chapin Hall Center for Children, University
of Chicago. 2002. Employment Outcomes for Youth Aging Out of Foster Care.
http://aspe.hhs.gov/hsp/fostercare-agingout02/ (accessed February 2007).
Hansen, M. E. 2006. The Value of Adoption. American University Department of Economics Working Paper Series,
No. 2006-15, http://academic2.american.edu/~mhansen/Working/2006-15.pdf (accessed March 16, 2007).
Harden, B. J. 2002. “Congregate care for infants and toddlers: Shedding new light on an old question.” Infant
Mental Health Journal 23 (5): 476-495.
Harden, B.J. 2004. “Safety and Stability for Foster Children: A Developmental Perspective.” The Future of Children.
14 (1): 31-47.
James, S., J. Landsverk, D.J. Slymen, and L.K. Leslie. 2004. “Predictors of outpatient mental health service use –
The role of foster care placement change.” Mental Health Services Research 6 (3): 127-141.
Judge, S. 2004. “The impact of early institutionalization on child and family outcomes.” Adoption Quarterly, 7 (3):
31-48.
Kenyon, G.L., K-A Chong, M Enkoff-Sage, C. Hill, C. Mays, and L. Rochelle. 2003. “Public adoption by gay and
lesbian parents in North Carolina: Policy and practice.” Families in Society, 571-575.
Krieder, Rose M. 2003. Adopted Children and Stepchildren: 2000. Census 2000 Special Reports. U.S. Department of
Commerce, Economics and Statistics Administration, U.S. Census Bureau.
http://www.census.gov/prod/2003pubs/censr-6.pdf (accessed March 20, 2007).
Leathers, S. J. 2002. “Foster children’s behavioral disturbance and detachment from caregivers and community
institutions.” Children and Youth Services Review 24 (4): 239-268.
Macomber, J.E., C. Scarcella, E. Zielewski, and R. Geen. 2004. Foster Care Adoption in the United States: A State
by State Analysis of Barriers & Promising Approaches. Produced for the National Adoption Day Coalition.
Washington, D.C.: Urban Institute.
Macomber, J.E., E.H. Zielewski, K. Chambers, and R. Geen. 2005. Foster Care Adoption in the United States: An
Analysis of Interest in Adoption and a Review of State Recruitment Strategies. Produced for the National
Adoption Day Coalition. Washington, D.C.: Urban Institute.
Mallon, G.P. 1998. We Don't Exactly Get the Welcome Wagon: The Experiences of Gay and Lesbian Adolescents in
Child Welfare Systems. New York: Columbia University Press.
34
Mallon, G.P. 2006. Lesbian and Gay Foster and Adoptive Parents. Washington, DC.: Child Welfare League of
America.
McDonald, T. P., R.I. Allen, A. Westerfelt, & Piliavin. 1993. “Accessing the long-term effects of foster care: A
research synthesis. Institute for Research on Poverty Special Report. No. 57-93.
Meezan, William, and Jonathan Rauch. 2005. “Gay Marriage, Same-Sex Parenting, and America's Children.” The
Future of Children 15 (2): 97-115.
Michigan Department of Human Services. 2002. Adoption Contract Management.
http://www.michigan.gov/dhs/0,1607,7-124-5452_7116-23480--,00.html (accessed February 2007).
Mosher, William D., Anjani Chandra, and Jo Jones, Division of Vital Statistics, CDC. 2005. “Sexual Behavior and
Selected Health Measures: Men and Women 15–44 Years of Age, United States, 2002.” Advance Data from Vital
and Health Statistics 362.
National Adoption Center. 1998. National Adoption Center Policy Statements: Adoptive Parent Assessment.
http://www.adopt.org/whoweare/policy.html#Adoptive%20Parent%20Assessment (accessed March 19, 2007)
National Association of Social Workers. 2003. “Social work speaks: National Association of Social Workers policy
statements, 2003-2006.” Washington D.C.: NASW Press.
National Data Archive on Child Abuse and Neglect. October 2002. Adoption and Foster Care Analysis and Reporting
System (AFCARS: User's Guide and Codebook for Fiscal Years 2000 to Present). Ithaca, New York.
http://www.ndacan.cornell.edu/NDACAN/Datasets/UserGuidePDFs/AFCARS_Guide_2000-Present.pdf (accessed
February 2007).
National Data Archive on Child Abuse and Neglect. 2004. Adoption and Foster Care Analysis and Reporting System.
Ithaca, New York.
http://www.ndacan.cornell.edu/NDACAN/Datasets/Abstracts/DatasetAbstract_AFCARS_General.html (accessed
March 2007).
National Gay and Lesbian Task Force. July 2006. Adoption Laws in the U.S.
http://www.thetaskforce.org/downloads/reports/issue_maps/adoption_laws_06.pdf (accessed February 13,
2007).
Newton, R. R., A.J. Litrownik, and J.A. Landsverk. 2000. “Children and youth in foster care: Disentangling the
relationship between problem behaviors and number of placements.” Child Abuse and Neglect 24 (10): 13631374.
North American Council on Adoptable Children. 1998. NACAC Position Statements: Gay and Lesbian Adoptions and
Foster Care. http://www.nacac.org/pub_statements.html#gay (accessed March 19, 2007).
O’Connell, Martin and Gretchen Gooding. 2006. “The Use of First Names to Evaluate Reports of Gender and Its
Effect on the Distribution of Married and Unmarried Couple Households.” Poster presented at the Annual
Meetings of the Population Association of America, Los Angeles, CA.
Pecora, Peter J., Ronald C. Kessler, Jason Williams, Kirk O’Brien, A. Chris Downs, Diana English, James White, Eva
Hiripi, Catherine Roller White, Tamera Wiggins, and Kate Holmes. 2005. Improving Family Foster Care:
Findings from the Northwest Foster Care Alumni Study. http://www.casey.org/NR/rdonlyres/4E1E7C77-76244260-A253-892C5A6CB9E1/923/CaseyAlumniStudyupdated082006.pdf (accessed March 16, 2007).
Resource Family Recruitment, Training and Retention Annual Report: July 1, 2002 to June 30, 2003. 2004.
Requested by Child and Youth Permanency Branch. Prepared By:Data Systems and Survey Design Bureau,
Administrative Division, California Department of Social Services. July 2004.
http://www.childsworld.ca.gov/res/PDF/RFRTRREPORT02-03.PDF. (accessed February 2007).
Resource Family Recruitment, Training and Retention Annual Report: July 1, 2003 to June 30, 2004. 2005.
Requested by Child and Youth Permanency Branch. Prepared By:Data Systems and Survey Design Bureau,
Administrative Division, California Department of Social Services. April 2005.
http://www.childsworld.ca.gov/res/PDF/RFSurvey(03-04)FinalReport.pdf (accessed February 2007).
Resource Family Recruitment, Training and Retention Annual Report: July 1, 2004 to June 30, 2005. 2006.
Requested by Child and Youth Permanency Branch. Prepared By:Data Systems and Survey Design Bureau,
35
Administrative Division, California Department of Social Services. June 2006.
http://www.childsworld.ca.gov/res/PDF/RFSurvey04-05FinalReport.pdf (accessed February 2007).
Ryan, Scott D. 2000. “Examining Social Workers’ Placement Recommendations of Children with Gay and Lesbian
Adoptive Parents.” Families in Society: The Journal of Contemporary Human Services 81 (5): 517-528.
Ryan, Scott D., Sue Pearlmutter and Victor Groza. 2004. “Coming Out of the Closet: Opening Agencies to Gay and
Lesbian Adoptive Parents.” Social Work 49 (1): 85-95.
Simmons, Tavia and Martin O’Connell. 2003. Married-Couple and Unmarried-Partner Households: 2000.
http://www.co.rockland.ny.us/C2000/documents/Married-Couple%20and%20UnmarriedPartner%20Households-%202000.pdf (accessed March 2007).
Smith, B. D. 2003. “After parental rights are terminated: Factors associated with exiting foster care.” Children and
Youth Services Review 25(12): 965-985.
Stacey, Judith and Timothy Biblarz. 2001. “(How) Does Sexual Orientation of Parents Matter?” American
Sociological Review 66: 159-183.
U.S. Department of Health and Human Services, Children’s Bureau, Administration for Children, Youth, and Families.
Trends in Foster Care and Adoption, FY2000-FY2005.
http://www.acf.hhs.gov/programs/cb/stats_research/afcars/trends.htm (accessed February 2007).
U.S. Department of Health and Human Services. 2006a. Administration on Children, Youth, and Families, Child
Maltreatment. Washington, DC: U.S. Government Printing Office.
U.S. Department of Health and Human Services. 2006b. Administration for Children and Families, Administration on
Children, Youth, and Families, Children’s Bureau. The AFCARS Report. Washington, D.C.
U.S. Department of Health and Human Services. Concept and History of Permanence in U.S. Child Welfare, Child
Welfare Information Gateway. http://www.childwelfare.gov/permanency/overview/history.cfm (accessed March
2007).
U.S. Dept. of Health and Human Services, Children’s Bureau, Administration for Children and Families. National
Survey of Child and Adolescent Well-being: One Year in Foster Care Wave 1 Data Analysis Report.
http://www.acf.hhs.gov/programs/opre/abuse_neglect/nscaw/reports/nscaw_oyfc/oyfc_report.pdf (accessed
March 16, 2007).
Wald, Michael. 2006. “Adults’ Sexual Orientation and State Determinations Regarding Placement of Children.”
Family Law Quarterly 40: 381-434.
Wulczyn, F. and K.B. Hislop. 2002. Growth in the Adoption Population. Chapin Hall Center for Children, University
of Chicago.
Zima, B. T., R. Bussing, S. Freeman, X. Yang, T.R. Belin, and S.R. Forness. 2000. “Behavior problems, academic skill
delays and school failure among school-aged children in foster care: Their relationship to placement
characteristics.” Journal of Child and Family Studies 9 (1): 87-103.
36
Acknowledgements
We thank Jason Ost, Rebecca Stotzer, Darcy Pottle, and Erica Zielewski for their help in preparing the report. Thanks
also to Leslie Cooper, Madelyn Freundlich, Rob Geen, Mary Hansen, Ellen Kahn, Jody Marksamer, Cathy Sakimura,
Brad Sears, Michael Wald, and Rob Woronoff for reviewing earlier drafts of the report. The Williams Institute thanks
the Gill Foundation and the Evelyn and Walter Haas, Jr. Fund for their general funding support.
About the Authors
M.V. Lee Badgett is the Research Director at The Williams Institute, UCLA School of Law, and an associate
professor of economics at the University of Massachusetts Amherst, where she is also on the faculty of the Center for
Public Policy and Administration. She studies family policy and employment discrimination related to sexual
orientation.
Kate Chambers is a Research Assistant with the Center on Labor, Human Services, and Population at the Urban
Institute. She has focused her research on social welfare and policy issues, including child welfare and family
homelessness.
Gary J. Gates is a Senior Research Fellow at The Williams Institute, UCLA School of Law. He studies the
demographic and economic characteristics of the lesbian and gay population.
Jennifer Ehrle Macomber is a Senior Research Associate with the Urban Institute's Center on Labor, Human
Services, and Population and Director of the Child Welfare Research Program. She studies policies and trends
concerning children in particularly vulnerable families—those facing such risks as domestic violence, child
maltreatment, substance abuse, depression, and childhood disabilities.
About the Institutes
The Urban Institute is a nonprofit, nonpartisan policy research and educational organization that examines the
social, economic, and governance challenges facing the nation. Views expressed in this report are those of the
authors and do not necessarily reflect the views of the Institute, its trustees, or its funders.
The Charles R. Williams Institute on Sexual Orientation Law and Public Policy is a research center at the
UCLA School of Law dedicated to the field of sexual orientation law and public policy. It advances law and public
policy through rigorous independent research and scholarship.
37

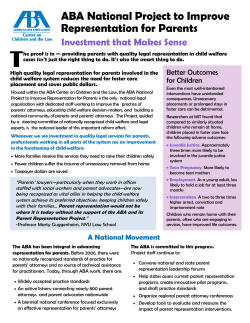
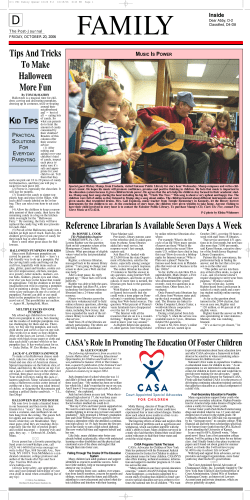


© Copyright 2024