
THE STATE OF AMERICA’S CHILDREN ®
THE STATE OF
AMERICA’S CHILDREN
®
CDF Mission Statement
The Children’s Defense Fund Leave No Child Behind® mission is to ensure every child a Healthy
Start, a Head Start, a Fair Start, a Safe Start and a Moral Start in life and successful passage to
adulthood with the help of caring families and communities.
CDF provides a strong, effective and independent voice for all the children of America who
cannot vote, lobby or speak for themselves. We pay particular attention to the needs of poor
and minority children and those with disabilities. CDF educates the nation about the needs
of children and encourages preventive investments before they get sick, drop out of school,
get into trouble or suffer family breakdown.
CDF began in 1973 and is a private, nonprofit organization supported by foundation and corporate
grants and individual donations.
© 2011 Children’s Defense Fund. All rights reserved.
Cover photo © Steve Nero
Inside photos © Dean Alexander, Steve Liss, T.C. Perkins, Jr., Alison Wright and Getty Images
Table of Contents
Foreword . . . . . . . . . . . . . . . . . . . . . . . . . . . . . . . . . . . . . . . . . . . . . . . . . . . . . . . . . . . . . . . . . . . . . . . . . . vii
Overview . . . . . . . . . . . . . . . . . . . . . . . . . . . . . . . . . . . . . . . . . . . . . . . . . . . . . . . . . . . . . . . . . . . . . . . . . . ix
Key Facts
Are Our Children Ready to Compete in the Global Arena? . . . . . . . . . . . . . . . . . . . . . . . . . . . . . . . . . . . . xiv
Moments in America for All Children . . . . . . . . . . . . . . . . . . . . . . . . . . . . . . . . . . . . . . . . . . . . . . . . . . . . . xv
How Are Children in America Faring, by Race/Ethnicity . . . . . . . . . . . . . . . . . . . . . . . . . . . . . . . . . . . . . . xvi
Each Day in America . . . . . . . . . . . . . . . . . . . . . . . . . . . . . . . . . . . . . . . . . . . . . . . . . . . . . . . . . . . . . . . . xxiii
Among White Children . . . . . . . . . . . . . . . . . . . . . . . . . . . . . . . . . . . . . . . . . . . . . . . . . . . . . . . . xxiii
Among Hispanic Children . . . . . . . . . . . . . . . . . . . . . . . . . . . . . . . . . . . . . . . . . . . . . . . . . . . . . . . xix
Among Black Children. . . . . . . . . . . . . . . . . . . . . . . . . . . . . . . . . . . . . . . . . . . . . . . . . . . . . . . . . . xix
Among Asian and Pacific Islander Children . . . . . . . . . . . . . . . . . . . . . . . . . . . . . . . . . . . . . . . . . . xx
Among American Indian and Alaska Native Children. . . . . . . . . . . . . . . . . . . . . . . . . . . . . . . . . . . xx
Child Population
Key Facts . . . . . . . . . . . . . . . . . . . . . . . . . . . . . . . . . . . . . . . . . . . . . . . . . . . . . . . . . . . . . . . . . . . . . . . . . . A-2
Trends in Child Population, by Race/Ethnicity, 1979-2009 (graph) . . . . . . . . . . . . . . . . . . . . . . . . . . . . . A-3
Trends in Child Population, by Race/Ethnicity, 1979-2009 . . . . . . . . . . . . . . . . . . . . . . . . . . . . . . . . . . . A-3
Where the Majority of Minority Children Live, 2009. . . . . . . . . . . . . . . . . . . . . . . . . . . . . . . . . . . . . . . . A-4
States Where a Majority of Children Are Racial or Ethnic Minorities, 2009 . . . . . . . . . . . . . . . . . . . . . . . A-5
States Where a Majority of Children Are Racial or Ethnic Minorities, 2009 (graph). . . . . . . . . . . . . . . . . A-5
Child Population, by Race and Hispanic Origin, 2009 . . . . . . . . . . . . . . . . . . . . . . . . . . . . . . . . . . . . . . . A-6
Percent of the Child Population, by Race and Hispanic Origin, 2009. . . . . . . . . . . . . . . . . . . . . . . . . . . . A-8
Child Population, by Age, 2009 . . . . . . . . . . . . . . . . . . . . . . . . . . . . . . . . . . . . . . . . . . . . . . . . . . . . . . . . A-9
Population of Children and Seniors, 1960-2050 . . . . . . . . . . . . . . . . . . . . . . . . . . . . . . . . . . . . . . . . . . . A-10
Population, 2009: Children and Seniors . . . . . . . . . . . . . . . . . . . . . . . . . . . . . . . . . . . . . . . . . . . . . . . . . A-11
Child Poverty
Key Facts . . . . . . . . . . . . . . . . . . . . . . . . . . . . . . . . . . . . . . . . . . . . . . . . . . . . . . . . . . . . . . . . . . . . . . . . . . B-2
Trends in Child Poverty Rates, 1959-2009 (graph) . . . . . . . . . . . . . . . . . . . . . . . . . . . . . . . . . . . . . . . . . . B-3
Trends in Child Poverty Rates, by Race/Ethnicity, 1959-2009 (graph) . . . . . . . . . . . . . . . . . . . . . . . . . . . B-3
Poverty Trends Among Children, 1959-2009 . . . . . . . . . . . . . . . . . . . . . . . . . . . . . . . . . . . . . . . . . . . . . . B-4
Poverty Trends Among Children, by Race/Ethnicity, 1959-2009. . . . . . . . . . . . . . . . . . . . . . . . . . . . . . . . B-5
Trends in Child Poverty Rate, by Age Group, 1969-2009 (graph). . . . . . . . . . . . . . . . . . . . . . . . . . . . . . . B-6
Trends in Poverty, by Age Groups 1969-2009 (graph). . . . . . . . . . . . . . . . . . . . . . . . . . . . . . . . . . . . . . . . B-6
Children Living in Poverty, by Age and Race, 2009 . . . . . . . . . . . . . . . . . . . . . . . . . . . . . . . . . . . . . . . . . B-7
Children Living in Extreme Poverty, by Age and Race, 2009 . . . . . . . . . . . . . . . . . . . . . . . . . . . . . . . . . . B-7
Poor Children in America: A Portrait . . . . . . . . . . . . . . . . . . . . . . . . . . . . . . . . . . . . . . . . . . . . . . . . . . . . B-8
State of America’s Children® 2011
i
States Where the Majority of Poor Children Live . . . . . . . . . . . . . . . . . . . . . . . . . . . . . . . . . . . . . . . . . . . B-9
States Where More than Half of All Poor Children Live . . . . . . . . . . . . . . . . . . . . . . . . . . . . . . . . . . . . . B-10
States With the Largest Percentage of Poor Children. . . . . . . . . . . . . . . . . . . . . . . . . . . . . . . . . . . . . . . . B-10
Poverty Guidelines, 2010. . . . . . . . . . . . . . . . . . . . . . . . . . . . . . . . . . . . . . . . . . . . . . . . . . . . . . . . . . . . . B-11
Child Poverty, by Age, 2009 . . . . . . . . . . . . . . . . . . . . . . . . . . . . . . . . . . . . . . . . . . . . . . . . . . . . . . . . . . B-12
Extreme Poverty Among Children, by Age, 2009 . . . . . . . . . . . . . . . . . . . . . . . . . . . . . . . . . . . . . . . . . . B-13
States Where More than Half of All Children in Extreme Poverty Live. . . . . . . . . . . . . . . . . . . . . . . . . . B-14
States With the Largest Percentages of Children Living in Extreme Poverty . . . . . . . . . . . . . . . . . . . . . . B-14
Child Poverty, by Residence, 2009 . . . . . . . . . . . . . . . . . . . . . . . . . . . . . . . . . . . . . . . . . . . . . . . . . . . . . B-15
Child Poverty, by Race/Ethnicity, 2009 . . . . . . . . . . . . . . . . . . . . . . . . . . . . . . . . . . . . . . . . . . . . . . . . . . B-16
Poverty Rate for Young Black Families (graph) . . . . . . . . . . . . . . . . . . . . . . . . . . . . . . . . . . . . . . . . . . . . B-18
Family Structure
Key Facts . . . . . . . . . . . . . . . . . . . . . . . . . . . . . . . . . . . . . . . . . . . . . . . . . . . . . . . . . . . . . . . . . . . . . . . . . . C-2
Living Arrangements of Children, 2010 . . . . . . . . . . . . . . . . . . . . . . . . . . . . . . . . . . . . . . . . . . . . . . . . . . C-3
Children Living with Neither Parent, 2010 (graph) . . . . . . . . . . . . . . . . . . . . . . . . . . . . . . . . . . . . . . . . . C-3
Trends in Teen Birth Rates, 1980-2008 (graph) . . . . . . . . . . . . . . . . . . . . . . . . . . . . . . . . . . . . . . . . . . . . C-4
Teen Birth Rates . . . . . . . . . . . . . . . . . . . . . . . . . . . . . . . . . . . . . . . . . . . . . . . . . . . . . . . . . . . . . . . . . . . . C-5
Kinship Care Families . . . . . . . . . . . . . . . . . . . . . . . . . . . . . . . . . . . . . . . . . . . . . . . . . . . . . . . . . . . . . . . . C-6
Children Living with Grandparents or Other Relatives, 2009. . . . . . . . . . . . . . . . . . . . . . . . . . . . . . . . . . C-7
Grandparents Raising Their Grandchildren, 2009, Selected Characteristics . . . . . . . . . . . . . . . . . . . . . . . C-8
Parents Who Are Incarcerated and Their Children . . . . . . . . . . . . . . . . . . . . . . . . . . . . . . . . . . . . . . . . . . C-9
Family Income
Key Facts . . . . . . . . . . . . . . . . . . . . . . . . . . . . . . . . . . . . . . . . . . . . . . . . . . . . . . . . . . . . . . . . . . . . . . . . . . D-2
Average Income Gains, Adjusted for Inflation, 2002-2008 . . . . . . . . . . . . . . . . . . . . . . . . . . . . . . . . . . . . D-3
Distribution of Income Gains, 2002-2008 (graph). . . . . . . . . . . . . . . . . . . . . . . . . . . . . . . . . . . . . . . . . . D-3
Average Income Between 1945 and 2008 (graph). . . . . . . . . . . . . . . . . . . . . . . . . . . . . . . . . . . . . . . . . . . D-4
The Income Share for the Richest 10 Percent of U.S. Households, 1917-2008 (graph) . . . . . . . . . . . . . . D-4
Median Income of Families with Children, 2009 (graph) . . . . . . . . . . . . . . . . . . . . . . . . . . . . . . . . . . . . . D-5
Median Income of Families with Children, by Family Type, 2009 (graph) . . . . . . . . . . . . . . . . . . . . . . . . D-6
Median Income of Families with Children, by Family Type, 2009 . . . . . . . . . . . . . . . . . . . . . . . . . . . . . . D-7
AFDC/TANF Benefits, July 1970 – July 2009 . . . . . . . . . . . . . . . . . . . . . . . . . . . . . . . . . . . . . . . . . . . . . D-8
TANF Recipients and Families, August 1996 and September 2010 . . . . . . . . . . . . . . . . . . . . . . . . . . . . . D-9
TANF Families, September 2010 . . . . . . . . . . . . . . . . . . . . . . . . . . . . . . . . . . . . . . . . . . . . . . . . . . . . . . D-10
Earned Income Tax Credit (EITC), 2008 Tax Year . . . . . . . . . . . . . . . . . . . . . . . . . . . . . . . . . . . . . . . . . D-11
Child Tax Credit, 2008. . . . . . . . . . . . . . . . . . . . . . . . . . . . . . . . . . . . . . . . . . . . . . . . . . . . . . . . . . . . . . D-12
Child Support Enforcement, 2008 . . . . . . . . . . . . . . . . . . . . . . . . . . . . . . . . . . . . . . . . . . . . . . . . . . . . . D-13
Children Receiving Supplemental Security Income (SSI), December 2009. . . . . . . . . . . . . . . . . . . . . . . D-14
Children Receiving Social Security Benefits, December 2009. . . . . . . . . . . . . . . . . . . . . . . . . . . . . . . . . D-15
Rental Housing Affordability: Fair Market Rent vs. Minimum Wage, 2011 . . . . . . . . . . . . . . . . . . . . . . D-16
Youth Employment and Unemployment, 2010: Teens Ages 16-19 (graph) . . . . . . . . . . . . . . . . . . . . . . D-17
Unemployment Rates, 2010 Annual Average . . . . . . . . . . . . . . . . . . . . . . . . . . . . . . . . . . . . . . . . . . . . . D-17
Employment and Unemployment Among Teens and Young Adults, 2008 and 2010 . . . . . . . . . . . . . . . D-18
ii
Children’s Defense Fund
Youth Unemployment and Joblessness, 1959-2010 . . . . . . . . . . . . . . . . . . . . . . . . . . . . . . . . . . . . . . . . D-19
Homeless Children and Youth Enrolled in Public Schools . . . . . . . . . . . . . . . . . . . . . . . . . . . . . . . . . . . D-20
Homeless Preschool Children, 2006-2009 (graph) . . . . . . . . . . . . . . . . . . . . . . . . . . . . . . . . . . . . . . . . . D-21
Subpopulation of Homeless Students . . . . . . . . . . . . . . . . . . . . . . . . . . . . . . . . . . . . . . . . . . . . . . . . . . . D-21
Primary Nighttime Residence for Homeless Children and Youth Enrolled in Public School . . . . . . . . . D-22
Child Health
Key Facts . . . . . . . . . . . . . . . . . . . . . . . . . . . . . . . . . . . . . . . . . . . . . . . . . . . . . . . . . . . . . . . . . . . . . . . . . . E-2
Uninsured Children, 2009. . . . . . . . . . . . . . . . . . . . . . . . . . . . . . . . . . . . . . . . . . . . . . . . . . . . . . . . . . . . . E-3
Odds of Being Uninsured: Children’s Coverage in 2009 . . . . . . . . . . . . . . . . . . . . . . . . . . . . . . . . . . . . . . E-4
Percentage of Children Who Are Uninsured, 2009 (graph) . . . . . . . . . . . . . . . . . . . . . . . . . . . . . . . . . . . . E-5
Ten States Where the Majority of Uninsured Children Live in . . . . . . . . . . . . . . . . . . . . . . . . . . . . . . . . . E-5
Ten States With the Largest Percentages of Uninsured Children . . . . . . . . . . . . . . . . . . . . . . . . . . . . . . . . E-5
Uninsured Children in the States, 2007-2009 . . . . . . . . . . . . . . . . . . . . . . . . . . . . . . . . . . . . . . . . . . . . . . E-6
Children’s Health Status, 2009 . . . . . . . . . . . . . . . . . . . . . . . . . . . . . . . . . . . . . . . . . . . . . . . . . . . . . . . . . E-7
Children’s Access to Health Care, 2009 . . . . . . . . . . . . . . . . . . . . . . . . . . . . . . . . . . . . . . . . . . . . . . . . . . . E-8
Children’s Dental Health and Access to Dental Care, 2009. . . . . . . . . . . . . . . . . . . . . . . . . . . . . . . . . . . . E-9
Overweight and Obesity Among Children and Teens, 2007-2008 . . . . . . . . . . . . . . . . . . . . . . . . . . . . . E-10
Immunization of Two-Year-Olds, by Race/Ethnicity and Poverty Status, 2009 . . . . . . . . . . . . . . . . . . . . E-11
Estimated Immunization Coverage in 2009 with Recommended Series Among Two-Year-Olds . . . . . . . E-12
International Rankings, Infant Mortality Rate. . . . . . . . . . . . . . . . . . . . . . . . . . . . . . . . . . . . . . . . . . . . . E-13
International Rankings, Low Birthweight . . . . . . . . . . . . . . . . . . . . . . . . . . . . . . . . . . . . . . . . . . . . . . . . E-14
Trend in Infant Mortality Rates, 1980-2007 (graph) . . . . . . . . . . . . . . . . . . . . . . . . . . . . . . . . . . . . . . . . E-15
Trend in Low Birthweight Rates, 1980-2008 (graph) . . . . . . . . . . . . . . . . . . . . . . . . . . . . . . . . . . . . . . . E-15
Trends in Infant Mortality and Low Birthweight. . . . . . . . . . . . . . . . . . . . . . . . . . . . . . . . . . . . . . . . . . . E-16
Mothers Giving Birth to Low Birthweight Babies, 2008 . . . . . . . . . . . . . . . . . . . . . . . . . . . . . . . . . . . . . E-17
Infant Deaths, Infant Mortality Rates, and Rankings, 2007 . . . . . . . . . . . . . . . . . . . . . . . . . . . . . . . . . . E-18
Selected Maternal and Infant Health Indicators, by Race and Hispanic Origin
of Mother, 2007 and 2008 . . . . . . . . . . . . . . . . . . . . . . . . . . . . . . . . . . . . . . . . . . . . . . . . . . . . . E-19
Prenatal Care, 2006 . . . . . . . . . . . . . . . . . . . . . . . . . . . . . . . . . . . . . . . . . . . . . . . . . . . . . . . . . . . . . . . . . E-20
Children Enrolled in Medicaid and CHIP . . . . . . . . . . . . . . . . . . . . . . . . . . . . . . . . . . . . . . . . . . . . . . . E-21
Simplified Enrollment and Renewal Processes in Place for Medicaid and CHIP, 2010 . . . . . . . . . . . . . . E-22
Children Living with Parents Who Have Substance Abuse or Dependence,
by Age Group (graph) . . . . . . . . . . . . . . . . . . . . . . . . . . . . . . . . . . . . . . . . . . . . . . . . . . . . . . . . . E-23
Children Living with Parents Who Have Substance Abuse or Dependence,
by Substance Abuse or Dependence (graph) . . . . . . . . . . . . . . . . . . . . . . . . . . . . . . . . . . . . . . . . E-23
Child Hunger and Nutrition
Key Facts . . . . . . . . . . . . . . . . . . . . . . . . . . . . . . . . . . . . . . . . . . . . . . . . . . . . . . . . . . . . . . . . . . . . . . . . . . F-2
Children Receiving Food Stamps/SNAP, 1989-2009 (graph). . . . . . . . . . . . . . . . . . . . . . . . . . . . . . . . . . . F-3
Food Stamp/SNAP Recipients, December 2007 – December 2010 (graph) . . . . . . . . . . . . . . . . . . . . . . . F-3
Average Number of Children Receiving Food Stamps Each Month, FYs 1989-2009. . . . . . . . . . . . . . . . . F-4
Prevalence of Household Level Food Insecurity, by State, 2007-2009 (Average) . . . . . . . . . . . . . . . . . . . . F-5
Number of Children by Food Security Status of Households and Selected Household
Characteristics, 2009. . . . . . . . . . . . . . . . . . . . . . . . . . . . . . . . . . . . . . . . . . . . . . . . . . . . . . . . . . . F-6
State of America’s Children® 2011
iii
National School Lunch Program . . . . . . . . . . . . . . . . . . . . . . . . . . . . . . . . . . . . . . . . . . . . . . . . . . . . . . . . F-6
Children in National School Lunch Program, FY 2010. . . . . . . . . . . . . . . . . . . . . . . . . . . . . . . . . . . . . . . F-7
Children in National School Breakfast Program, FY 2010. . . . . . . . . . . . . . . . . . . . . . . . . . . . . . . . . . . . . F-8
Children in Summer Food Service Program, FY 2010 . . . . . . . . . . . . . . . . . . . . . . . . . . . . . . . . . . . . . . . . F-9
Participants in the Child and Adult Care Food Program, FY 2010 . . . . . . . . . . . . . . . . . . . . . . . . . . . . . F-10
Participants in the Special Supplemental Nutrition Program for Women, Infants
and Children (WIC), FY 2008 . . . . . . . . . . . . . . . . . . . . . . . . . . . . . . . . . . . . . . . . . . . . . . . . . . F-11
Early Childhood
Key Facts . . . . . . . . . . . . . . . . . . . . . . . . . . . . . . . . . . . . . . . . . . . . . . . . . . . . . . . . . . . . . . . . . . . . . . . . . . G-2
Trends in Child Poverty Rate, 1969-2009 (graph) . . . . . . . . . . . . . . . . . . . . . . . . . . . . . . . . . . . . . . . . . . G-3
Children Living in Poverty, by Age and Race, 2009 (graph) . . . . . . . . . . . . . . . . . . . . . . . . . . . . . . . . . . . G-3
Labor Force Participation of Women with Children Under Age Six, Selected Years . . . . . . . . . . . . . . . . . G-4
Parental Labor Force Participation, 2009 . . . . . . . . . . . . . . . . . . . . . . . . . . . . . . . . . . . . . . . . . . . . . . . . . G-5
Child Care Assistance, 2010 . . . . . . . . . . . . . . . . . . . . . . . . . . . . . . . . . . . . . . . . . . . . . . . . . . . . . . . . . . . G-6
Child Care vs. College Costs, 2009 . . . . . . . . . . . . . . . . . . . . . . . . . . . . . . . . . . . . . . . . . . . . . . . . . . . . . G-7
Child and Dependent Care Tax Credit, 2008 . . . . . . . . . . . . . . . . . . . . . . . . . . . . . . . . . . . . . . . . . . . . . . G-8
Child Care and Development Fund, FY 2008 . . . . . . . . . . . . . . . . . . . . . . . . . . . . . . . . . . . . . . . . . . . . . G-9
Head Start Enrollment, 2009 . . . . . . . . . . . . . . . . . . . . . . . . . . . . . . . . . . . . . . . . . . . . . . . . . . . . . . . . . G-10
Head Start Enrollment, by Race and Hispanic Origin, 2009 . . . . . . . . . . . . . . . . . . . . . . . . . . . . . . . . . G-11
Infants and Toddlers Under Three Receiving Early Intervention Services Under the Individuals
with Disabilities Education Act (IDEA), Part C, by Age and State, 2008. . . . . . . . . . . . . . . . . . G-12
Prekindergarten Enrollment of 3- and 4-year-olds, 2008-2009. . . . . . . . . . . . . . . . . . . . . . . . . . . . . . . . G-13
States that Require Kindergarten and Have Adopted Common Core K-12 Standards, 2010 . . . . . . . . . G-14
Annual Salaries of Early Childhood Educators, 2009 . . . . . . . . . . . . . . . . . . . . . . . . . . . . . . . . . . . . . . . G-15
Number of Ongoing Training Hours Required for Child Center Staff Roles in 2008
(Reported in hours) . . . . . . . . . . . . . . . . . . . . . . . . . . . . . . . . . . . . . . . . . . . . . . . . . . . . . . . . . . G-16
Infant and Toddler Child-Staff Ratios and Group Sizes, 2008 . . . . . . . . . . . . . . . . . . . . . . . . . . . . . . . . G-17
Child-Staff Ratios in Licensed Centers . . . . . . . . . . . . . . . . . . . . . . . . . . . . . . . . . . . . . . . . . . . . . . . . . . G-18
Licensing of Small Family Child Care Homes, 2008 . . . . . . . . . . . . . . . . . . . . . . . . . . . . . . . . . . . . . . . G-19
Initial Training Requirements (Selected) for Small Family Child Care
Homes and Annual Training Requirements, 2008 . . . . . . . . . . . . . . . . . . . . . . . . . . . . . . . . . . . G-20
Education
Key Facts . . . . . . . . . . . . . . . . . . . . . . . . . . . . . . . . . . . . . . . . . . . . . . . . . . . . . . . . . . . . . . . . . . . . . . . . . . H-2
How America Ranks Among Industrialized Countries in Education . . . . . . . . . . . . . . . . . . . . . . . . . . . . H-3
Annual Expenditures Per Student, 2007 (graph). . . . . . . . . . . . . . . . . . . . . . . . . . . . . . . . . . . . . . . . . . . . H-3
The Four Americas . . . . . . . . . . . . . . . . . . . . . . . . . . . . . . . . . . . . . . . . . . . . . . . . . . . . . . . . . . . . . . . . . . H-4
Earnings by Educational Attainment, 2009 . . . . . . . . . . . . . . . . . . . . . . . . . . . . . . . . . . . . . . . . . . . . . . . H-5
Expected Lifetime Earnings by Education Level . . . . . . . . . . . . . . . . . . . . . . . . . . . . . . . . . . . . . . . . . . . . H-5
Racial Isolation of Black and Latino Students in the Public Schools, 1968-2006 . . . . . . . . . . . . . . . . . . . H-6
Change in Black Segregation in the South, 1954-2005 . . . . . . . . . . . . . . . . . . . . . . . . . . . . . . . . . . . . . . H-6
Reading and Math Performance of 4th, 8th and 12th Graders, by Race . . . . . . . . . . . . . . . . . . . . . . . . . H-7
Reading and Math Performance of 4th Graders, 2009 . . . . . . . . . . . . . . . . . . . . . . . . . . . . . . . . . . . . . . . H-8
iv
Children’s Defense Fund
Reading and Math Performance of 8th Graders, 2009 . . . . . . . . . . . . . . . . . . . . . . . . . . . . . . . . . . . . . . . H-9
Public School Education, Selected Indicators . . . . . . . . . . . . . . . . . . . . . . . . . . . . . . . . . . . . . . . . . . . . . H-10
Graduation Rates, by Race, 2007-2008 . . . . . . . . . . . . . . . . . . . . . . . . . . . . . . . . . . . . . . . . . . . . . . . . . H-11
Spending on Prisoners vs. Spending on Public School Students, 2007 . . . . . . . . . . . . . . . . . . . . . . . . . . H-12
School Discipline, 2006 . . . . . . . . . . . . . . . . . . . . . . . . . . . . . . . . . . . . . . . . . . . . . . . . . . . . . . . . . . . . . H-13
Violence and Risk Behaviors of High School Students, 2007 . . . . . . . . . . . . . . . . . . . . . . . . . . . . . . . . . H-14
A New Look at America’s “Dropout Factories” . . . . . . . . . . . . . . . . . . . . . . . . . . . . . . . . . . . . . . . . . . . . H-15
Dropouts, 2009 . . . . . . . . . . . . . . . . . . . . . . . . . . . . . . . . . . . . . . . . . . . . . . . . . . . . . . . . . . . . . . . . . . . H-16
Title I of the Elementary and Secondary Education Act . . . . . . . . . . . . . . . . . . . . . . . . . . . . . . . . . . . . . H-17
Children Receiving Services Under the Individuals with Disabilities Education Act (IDEA),
by Age, 2008 . . . . . . . . . . . . . . . . . . . . . . . . . . . . . . . . . . . . . . . . . . . . . . . . . . . . . . . . . . . . . . . H-18
Enrollment in Classes for Students with Mental Retardation, by Race, 2006 (graph). . . . . . . . . . . . . . . H-19
Enrollment in Classes for Students with Emotional Disturbances, by Race, 2006 (graph) . . . . . . . . . . . H-19
Enrollment in Classes for Students with Learning Disabilities, by Race, 2006 (graph) . . . . . . . . . . . . . . H-19
Enrollment in Classes for Students with Mental Retardation, 2006 . . . . . . . . . . . . . . . . . . . . . . . . . . . . H-20
Enrollment in Classes for Students with Emotional Disturbances, 2006 . . . . . . . . . . . . . . . . . . . . . . . . H-21
Enrollment in Classes for Students with Learning Disabilities, 2006 . . . . . . . . . . . . . . . . . . . . . . . . . . . H-22
Enrollment in Programs for the Gifted and Talented, 2006 . . . . . . . . . . . . . . . . . . . . . . . . . . . . . . . . . . H-23
High School Teachers with Undergraduate Major in Subject Matter Taught, 2007-2008. . . . . . . . . . . . H-24
Demographics of Public School Teachers Grade 9-12. . . . . . . . . . . . . . . . . . . . . . . . . . . . . . . . . . . . . . . H-24
College Graduation Rates Among Young Adults, 1957-2009 (graph). . . . . . . . . . . . . . . . . . . . . . . . . . . H-25
Percent of Young Adults Who Completed Four Years of College or More,
by Race/Ethnicity and Sex, 1957 to 2009 . . . . . . . . . . . . . . . . . . . . . . . . . . . . . . . . . . . . . . . . . H-26
Child Welfare
Key Facts . . . . . . . . . . . . . . . . . . . . . . . . . . . . . . . . . . . . . . . . . . . . . . . . . . . . . . . . . . . . . . . . . . . . . . . . . . . I-2
Who Are the Children Who Are Abused and Neglected? . . . . . . . . . . . . . . . . . . . . . . . . . . . . . . . . . . . . . . I-3
Child Maltreatment, 2009 . . . . . . . . . . . . . . . . . . . . . . . . . . . . . . . . . . . . . . . . . . . . . . . . . . . . . . . . . . . . . I-4
National Estimates of Children Served Following an Investigation of Child Abuse or Neglect. . . . . . . . . . I-5
Trends in Foster Care and Adoption, FYs 2002 – 2009 . . . . . . . . . . . . . . . . . . . . . . . . . . . . . . . . . . . . . . . I-5
Domestic Minor Sex Trafficking. . . . . . . . . . . . . . . . . . . . . . . . . . . . . . . . . . . . . . . . . . . . . . . . . . . . . . . . . I-6
Who’s in Foster Care . . . . . . . . . . . . . . . . . . . . . . . . . . . . . . . . . . . . . . . . . . . . . . . . . . . . . . . . . . . . . . . . . I-7
Children in Foster Care, FYs 2004-2009 . . . . . . . . . . . . . . . . . . . . . . . . . . . . . . . . . . . . . . . . . . . . . . . . . . I-8
Number of Children Entering, Exiting and In Foster Care, FY 2009 . . . . . . . . . . . . . . . . . . . . . . . . . . . . . I-9
Children in Foster Care, by Age, FY 2009 . . . . . . . . . . . . . . . . . . . . . . . . . . . . . . . . . . . . . . . . . . . . . . . . I-10
Children in Foster Care, by Race/Ethnicity, FY 2009. . . . . . . . . . . . . . . . . . . . . . . . . . . . . . . . . . . . . . . . I-11
Overrepresentation of Black Children in Foster Care, FY 2009. . . . . . . . . . . . . . . . . . . . . . . . . . . . . . . . .I-12
Placement Stability, 2009 . . . . . . . . . . . . . . . . . . . . . . . . . . . . . . . . . . . . . . . . . . . . . . . . . . . . . . . . . . . . . I-13
Exits of Children from Foster Care, 2009. . . . . . . . . . . . . . . . . . . . . . . . . . . . . . . . . . . . . . . . . . . . . . . . . I-14
Youth Who Exit Foster Care to Emancipation, 2009 . . . . . . . . . . . . . . . . . . . . . . . . . . . . . . . . . . . . . . . . I-15
Adoptions from Foster Care, Selected Years, FYs 1995 – 2009. . . . . . . . . . . . . . . . . . . . . . . . . . . . . . . . . I-16
Children in Public Foster Care Waiting to be Adopted, FYs 2004 – 2009 . . . . . . . . . . . . . . . . . . . . . . . . I-17
Children Living with Grandparents or Other Relatives, 2009 . . . . . . . . . . . . . . . . . . . . . . . . . . . . . . . . . I-18
State of America’s Children® 2011
v
Juvenile Justice
Key Facts . . . . . . . . . . . . . . . . . . . . . . . . . . . . . . . . . . . . . . . . . . . . . . . . . . . . . . . . . . . . . . . . . . . . . . . . . . . J-2
Youth at Risk . . . . . . . . . . . . . . . . . . . . . . . . . . . . . . . . . . . . . . . . . . . . . . . . . . . . . . . . . . . . . . . . . . . . . . . J-3
Juvenile Arrested Rates, by Race, 1980-2008 (graph) . . . . . . . . . . . . . . . . . . . . . . . . . . . . . . . . . . . . . . . . . J-4
Juvenile Arrested Rates, by Race, 1980-2008 . . . . . . . . . . . . . . . . . . . . . . . . . . . . . . . . . . . . . . . . . . . . . . . J-4
Juvenile Arrest Rates for Violent Offenses, by Race, 1980-2008 (graph) . . . . . . . . . . . . . . . . . . . . . . . . . . J-5
Juvenile Arrest Rates for Violent Offenses, by Race, 1980-2008. . . . . . . . . . . . . . . . . . . . . . . . . . . . . . . . . J-5
Juveniles in Residential Placement, by Race, 2006 . . . . . . . . . . . . . . . . . . . . . . . . . . . . . . . . . . . . . . . . . . . J-6
Offense Profile of Juveniles in Residential Placements, 2006 . . . . . . . . . . . . . . . . . . . . . . . . . . . . . . . . . . . J-8
Youth Under 18 in Adult Prisons, 2009 . . . . . . . . . . . . . . . . . . . . . . . . . . . . . . . . . . . . . . . . . . . . . . . . . . . J-9
Treating Children Like Adults in the Justice System. . . . . . . . . . . . . . . . . . . . . . . . . . . . . . . . . . . . . . . . . J-10
More Girls Enter the Juvenile Justice System Unnecessarily . . . . . . . . . . . . . . . . . . . . . . . . . . . . . . . . . . . J-11
Gun Violence
Key Facts . . . . . . . . . . . . . . . . . . . . . . . . . . . . . . . . . . . . . . . . . . . . . . . . . . . . . . . . . . . . . . . . . . . . . . . . . . K-2
Children and Teens Killed by Firearms: A Portrait . . . . . . . . . . . . . . . . . . . . . . . . . . . . . . . . . . . . . . . . . . K-3
Firearm Deaths of Children and Teens, by Manner, 1979-2007 . . . . . . . . . . . . . . . . . . . . . . . . . . . . . . . . K-4
Firearm Deaths of Children and Teens, by Age, Manner, and Race/Hispanic Origin, 2007 . . . . . . . . . . . K-5
Firearm Death Rates of Males Ages15-19, by Race and Hispanic Origin, 2007 (graph) . . . . . . . . . . . . . . K-6
Firearm Deaths of Children and Teens, by Race/Hispanic Origin, 1979-2007 . . . . . . . . . . . . . . . . . . . . . K-7
Firearm Deaths of Children and Teens, by Manner, 2005-2007 . . . . . . . . . . . . . . . . . . . . . . . . . . . . . . . . K-8
It’s Time to Stop the Deaths . . . . . . . . . . . . . . . . . . . . . . . . . . . . . . . . . . . . . . . . . . . . . . . . . . . . . . . . . . . K-9
vi
Children’s Defense Fund
Foreword
A
s we take stock of the current state of America’s children and the desperate need to change direction
for the future, some ancient wisdom can give us a blueprint for setting sail and getting our children
to safe harbor. Everything our nation and all of us need to know about life can be learned from
Noah’s Ark according to an anonymous writer.
Lesson One: Don’t miss the boat. The United States is going to miss the boat to lead and compete in
our globalizing world because we are not preparing the majority of our children for the future. The greatest
threat to America’s national security comes from no enemy without but from our failure to invest in and
educate all of our nation’s children. Every 11 seconds of the school day a child drops out. A majority of
children in all racial and income groups and almost 80 percent and more of Black and Hispanic children in
public schools cannot read or do math at grade level in fourth, eighth, or 12th grade—if they have not
already dropped out. Any nation that is failing to prepare all of its children for productive work and life
needs to correct course—now. And all of us—parents, educators, community, religious and political leaders—
need to be part of the solution and not part of the problem. God did not make two classes of children.
Every single child needs and deserves a quality education.
Lesson Two: We are all in the same boat. Many Americans may not like or think they have any self
interest in assuring a fair playing field for other people’s children—especially poor and minority children,
but Black, Hispanic and other children of color will constitute a majority in 2019. Isn’t it better to have
them supporting the Social Security and Medicare systems and making sure a productive workforce is in
place, rather than for us to be supporting them in costly ineffective prisons? Our states are spending three
times more on average per prisoner than per public school student. I can’t think of a dumber investment
policy. We need a paradigm change from punishment to prevention and early intervention.
Lesson Three: Plan ahead. It wasn’t raining when Noah built the Ark. Tomorrow is today and children
have only one childhood. They need to be healthy now. They need quality early childhood experiences now.
They need first-rate schools with first-rate teachers and stimulating high quality out of school time programs
now. And they need to know that there is a good-paying job after college in their future. We must resist our
quick fix, quarterly profit driven culture and invest in the future.
Lesson Four: Don’t listen to the critics and naysayers. Just get on with the job that needs to be done
to educate our children. If you don’t want to be criticized, don’t say anything, do anything, or be anything.
Stand up and fight for children, all of them.
State of America’s Children® 2011
vii
Lesson Five: For safety’s sake, travel in pairs. Better still, travel in groups able to make a ruckus loud
enough to be heard. We have got to stop those who are rhetorically hijacking Dr. King’s and America’s
dream but subverting his call to end the poverty, excessive militarism and excessive individualism that’s
killing the dreams and hopes of millions of children. How can we justify massive tax giveaways to the richest
two percent and continue tax loopholes for wealthy corporations at a time when 15.5 million children are
languishing in poverty?
Lesson Six: Remember that the Ark was built by amateurs; the Titanic by professionals. We
must all use our citizen power, and vote to wrest our ship of state from that small group of experts and
powerful corporate leaders who recklessly jeopardized all of our lives for personal gain. Use your own power
to make a difference.
Final Lesson: Build your future, build our children’s future and our nation’s future on high
ground. Let’s leave our nation and world better than we found it—more just, more hopeful, more
peaceful, more productive, and more unified. This may be the first time in our history when our children
and grandchildren will be worse off than their parents and grandparents. We must correct course with urgency
and do whatever is necessary to get them to safe harbor.
We have pushed so many of our children into the tumultuous sea of life in small and leaky boats without
survival gear and compass. I hope God will forgive us and help our children to forgive us. I hope we will
work together with urgency to build the transforming movement required to give all of our children the
anchors of faith and love, the rudder of hope, the sails of health and education, and the paddles of family
and community, to keep them safe and strong when life’s sea gets rough.
Marian Wright Edelman
viii
Children’s Defense Fund
An Overview of The State of America’s Children 2011
The Need for a Level Playing Field for All Children
CDF’s The State of America’s Children 2011 paints a devastating portrait of childhood across the country. With
unemployment, housing foreclosures and hunger still at historically high levels, children’s well-being is in great
jeopardy. Children today are our poorest age group. Child poverty increased by almost 10 percent between 2008
and 2009, which was the largest single year increase since data were first collected. As the country struggles to
climb out of the recession, our children are falling further behind.
Looking at data1 across children’s needs in child poverty, family structure, family income, child health, child
nutrition, early childhood development, education, child abuse and neglect, juvenile justice and gun violence
shows millions of children from birth through the teen years at risk of getting caught in the Cradle to Prison
Pipeline crisis at the intersection of race and poverty that threatens the futures of poor children of color across
our nation. Black children are facing one of the worst crisises since slavery, and in many areas, Hispanic and
American Indian children are not far behind.
Particularly striking is the fact that children of color in America who now constitute almost 45 percent of all
children will be the majority of children in 2019—just eight years from now. We will be counting on them as
the economic drivers of the future, who will be raising their own families, assisting their parents and investing in
the economy and in Social Security to keep us all thriving. Yet nearly 80 percent or more of Black and Hispanic
public school students cannot read or do math at grade level in fourth, eighth and 12th grades, sentencing them
to social and economic death in this globalizing competitive economy. We must level the playing field and invest
in education now so all children can achieve to ensure a solid economic future for all of us and for our nation.
Children of Color Desperately Need Help
The State of America’s Children 2011 tells us that children of color are behind on virtually every measure of child
well-being. They face multiple risks that put them in grave danger of entering the pipeline to prison rather than
the pipeline to college, productive employment and successful futures. Children of color are at increased risk of:
Being born at low birth weight and with late or no prenatal care
• Babies of Black mothers are almost twice as likely as babies of White mothers to be born at low
birthweight.
• Black babies are more than twice as likely to die before their first birthday as White babies.
• Black and Hispanic babies are more than twice as likely as White babies to be born to mothers who
received late or no prenatal care in almost half the states.
Living in poverty and extreme poverty
• More than one in three Black, one in three Hispanic and one in 10 White children live in poverty
($22,050 for a family of four).
• For children under age five, 41.9 percent of Black, 35 percent of Hispanic and almost 15 percent of
White children are poor.
• More than one in six Black and one in seven Hispanic children live in extreme poverty—at half the
poverty level or below. One in 20 White children lives in extreme poverty.
Lacking family stability
• Fewer than 40 percent of Black children live with two parents.
• Almost one in two Black children and more than one in four Hispanic children live with their mother
only, compared with fewer than one in five White children.
1 Generally the data presented are the latest available at this time from official government sources – most frequently 2009, sometimes 2010,
and some earlier.
State of America’s Children® 2011
ix
• Black children are more than twice as likely as White children and almost twice as likely as Hispanic
children to live with neither parent.
• Black children are more than seven times as likely and Hispanic children more than two and a half times
as likely as White children to have a parent in prison.
Greater health risks
• Black and American Indian babies are more than twice as likely to be born to teen mothers as
White babies.
• Black and Hispanic children are almost three times as likely to be in poor or only fair health as
White children and are more likely to have an unmet medical need due to cost than White children.
• More than one in three children in low-income families is overweight or obese. Black teens are 26 percent
and Hispanic teens 32 percent more likely than White teens to be overweight or obese.
Lacking a quality education
• Nearly 80 percent or more of Black and Hispanic public school students in the fourth, eighth and 12th
grades are unable to read or do math at grade level compared to 50 percent or more of White children.
• Black students are more than three times as likely as White or Asian/Pacific Islander students and more
than twice as likely as Hispanic students to be suspended from school.
• Thirty-five percent of Black and 29 percent of Hispanic high school students attend the more than
1,600 “dropout factories” across the country where 60 percent or fewer of the students in any given
ninth grade class will graduate in four years with a regular diploma.
• The averaged graduation rate for Black and Hispanic students is just over 60 percent, in contrast with
81 percent for White and 91 percent for Asian/Pacific Islander students. The 20-plus percentage
point spread in graduation rates between Black and White students exists in 13 states.
Being stuck in foster care, without permanent families
• Black children are overrepresented in foster care—they represent 30 percent of children in foster care,
double the percent of the child population who are Black.
• Black children stay in foster care longer than White children.
Ending up in the juvenile justice system
• Youth of color make up approximately two-thirds of youth in the juvenile justice system.
• Black youth are over three times more likely than all other groups to be arrested for a violent offense.
• The number of girls arrested has grown by 50 percent since 1980; American Indian girls are four times
and Black girls three times more likely to be incarcerated than White girls.
• Black youth make up 62 percent of those prosecuted in adult court, but only 17 percent of the overall
youth population.
Being caught in the college completion gap
• The Black-White gap in college completion persists and the Hispanic-White college completion gap is
even greater.
Being unemployed
• In 2010, four out of 10 Black and three out of 10 Hispanic teens ages 16 to 19 were unemployed.
• The youth jobless rate for teens 16 to 19 in July 2010 was higher than at any time in the past five
decades.
Killed by guns
• More Black than White children and teens were killed by firearms in 2007. Black children and teens
were more likely to be victims of homicide and White children and teens were more likely to be victims
of suicide.
x
Children’s Defense Fund
• Black males 15 to 19 are more than five times as likely as White males and more than twice as likely as
Hispanic and American Indian males to be killed by firearms.
• From 1979 to 2007, the annual number of firearm deaths of Black children and teens increased by
61 percent; the number for White children and teens decreased by 54 percent
The multiple risks facing children of color are cause for great concern by us all, especially considering our
responsibility as a nation to raise a next generation that can care not only for themselves and their own families
but also our seniors of tomorrow. While today there are almost twice as many children as seniors, by 2040 that
gap will close. There will be 94 million children and 81 million seniors. Our children’s success in education and
employment will be essential if we are to keep society functioning, businesses running, adults teaching and
health care professionals serving everyone’s needs. Today’s children will care for all of us tomorrow.
We must take extraordinary steps to address the crisis today—the worst since slavery—so we will have a generation
who can succeed in life and support our nation’s future. We do not have a moment to lose. Children have only
one childhood and that is today.
Children Need Help Now
We know that poverty impairs children’s emotional, intellectual and physical development and ends up costing
our nation billions of dollars in lost productivity and increased health care costs. We know how to end child
poverty and give each child a fair start. We know how to give children a healthy start and to keep them wellnourished. We know how to give children a head start to make them ready for school and help them flourish
when given a quality education. We know how to prevent child abuse and neglect, keep children safely out of
foster care, find permanent families for children in foster care and keep children out of the juvenile justice system.
To paraphrase what our mothers and grandmothers taught us, if you knew better, you should do better. Instead,
we have not invested as we should and urgently need to improve in each of the following areas. The State of
America’s Children 2011 reports:
Income Gaps
• Wide gaps in income persist. Since the late 1970’s the incomes of the bottom 90 percent has essentially
stagnated while the incomes of the top one percent have soared.
• In 2008, the income share for the richest 10 percent of U.S. households was 48.23 percent, just slightly
below its 2007 record high level of 49.74 percent. The average income for the bottom 90 percent of
households in 2008 was at its lowest level in more than a decade. The one year income drop for this
group in 2007-2008 was its largest since 1938.
• In 2009, the income of married-couple families with children was three times higher than that of female
householders for families of all races.
Lack of income supports
• Temporary Assistance for Needy Families (TANF) benefits in 2009 were less than half the 1970 real dollar
amount in nearly two thirds of the states.
• In 2008, 79 percent of child support cases had court orders, but collections were made in only 57 percent
of child support cases.
• Tens of millions of children, working families and individuals benefited from the Earned Income Tax Credit
and Child Tax Credit in the 2008 tax year, but many more could in the future if eligibility were expanded.
Lack of health coverage
• While Medicaid and the Children’s Health Insurance Program (CHIP) insure one in three children and
more than half of all low income children in America, one in eight Black children and one in six Hispanic
children are still uninsured. Two-thirds of the more than eight million uninsured children are eligible for
coverage in Medicaid or CHIP but are not enrolled largely due to state-imposed barriers that differ
across states.
State of America’s Children® 2011
xi
• While 34 states made improvements to children’s health coverage in 2010, only six states provided
for express lane eligibility for Medicaid and/or CHIP and one-third of the states still did not
provide 12-month continuous eligibility to help children enroll and stay enrolled in health coverage.
• Hispanic children are 76 percent more likely and Black children 50 percent more likely than
White children to have an unmet medical need due to cost.
Lack of nutritional supports
• While an average of 15.6 million children a month received Supplemental Nutrition Assistance Program
(SNAP) benefits in 2009, more than one in 10 households has limited access to food in the vast majority
of states.
• Only one in nine low income children who eats a free or reduced price school lunch during the school
year is reached by the Summer Food Service Program.
Lack of support for quality early childhood programs
• The annual cost of center-based child care for a four-year-old is more than the annual in-state tuition at a
public four-year college in 33 states and the District of Columbia.
• A family must have an income that is below 175 percent of the poverty level ($32,043 for a family of
four) to receive a public child care subsidy in 18 states and the District of Columbia.
• In more than one in three states, only 10 or fewer hours of training a year is required for child care center
directors and teachers.
• Most states exceed the recommended maximum child-staff ratios for pre-school aged children in licensed
centers. The infant-staff ratios in center-based care are 5:1 or higher in 15 states.
• In nearly half the states, small family child care homes are not required to be licensed until five or
more children are in the home, and in 35 states providers in licensed homes do not have to have a high
school diploma.
• Only 13.8 percent of three-year-olds and 38.9 percent of four-year-olds were in state funded prekindergarten programs, Head Start or early intervention/special education in 2008-2009.
Lack of access to quality education for every child
• Only 10 states require by statute that all school districts offer full-day kindergarten. Forty-four states and
the District of Columbia require half-day programs that leave children a half step behind as they enter
first grade.
• While the number of “dropout factories” and the proportion of students of color who attend them have
been reduced, there are still 1,634 dropout factories—at least one in every state. Seventy percent of them
are concentrated in just12 states.
• The United States spends almost two-and-a-half times as much per prisoner as per public school pupil.
Lack of supports for abused and neglected children
• Following a pattern of recent years, about 40 percent of children who were abused or neglected in 2009
received no services following the investigation of their maltreatment and many more received far fewer
services than they need.
• In the majority of states, at least one-third of the children in foster care between one and two years
experience three or more placements. The median length of stay in foster care for a child is over
12 months in 31 states.
• An estimated 114,000 children are in foster care waiting to be adopted.
• More than 29,000 youth aged out of foster care at 18 or older in 2009 without being returned home,
adopted or placed permanently with relatives. Researchers report these children are at increased risk of not
graduating from high school or enrolling in college and being unemployed, incarcerated or homeless.
In most states the majority of these children entered foster care when they were older than 12.
xii
Children’s Defense Fund
Lack of progress in reforming the juvenile justice system
• States are working to divert youth charged with status offenses, such as curfew violations, running away,
truancy offenses and incorrigibility, to community-based programs to prevent their entry into the juvenile
justice system—but progress in many states is slow.
• About two-thirds of youth in residential placement are there for status offenses, probation violations and
other technical violations, drug offenses, or property and public order offenses. Just over one-third are
there for offenses against persons.
• Approximately 250,000 children are prosecuted, sentenced or incarcerated as adults each year in the
United States. About 10,000 children are held in adult jails and prisons on any given night, two thirds of
them while they are awaiting trial, despite high risk for sexual abuse and other harms.
Lack of sufficient progress in ending gun violence
• Since 1979, gun violence has ended the lives of 110,645 children and teens in America.
• There are more than 280 million privately owned firearms in the U.S., which is the equivalent of nine
firearms for every 10 men, women and children in this country.
• In 2007 alone, 3,042 children and teens died from gunfire in the United States—eight every day—as a
result of homicide, suicide or accidental shooting. Almost six times as many teens suffered non-fatal gun
injuries, which have serious physical and emotional consequences that frequently go untreated.
Conclusion
The portrait of continuing and worsening racial and income inequality is clear as we look at the state of
America’s children today. Rather than moving forward, we are moving backwards. Programs and services that we
know can help children thrive—Medicaid and CHIP (the Children’s Health Insurance Program), the Maternal
and Child Health Block Grant, WIC (the Special Supplemental Nutrition Program for Women, Infants and
Children), SNAP (the Supplemental Nutrition Assistance Program), Early Head Start and Head Start, the
Child Care and Development Block Grant, the Title I Education Program for Disadvantaged Children, the
Individuals with Disabilities Education Act programs, Pell Grants, the Social Services Block Grant and others are
threatened with federal cuts or program changes that will unravel the safety net for poor and low income children.
These cuts will come on top of deep cuts in state funding for early childhood development, K-12 education and
higher education, mental health and other specialized treatment for children and parents, and services and staff
for children and youth in foster care and in the juvenile justice system. Families too have become more fragile as
jobs are lost, unemployment compensation has been reduced, public assistance and public health programs
restrict access, housing foreclosures continue and affordable housing becomes scarcer.
• We must invest in our children and their families. This means keeping key priorities for children
front and center:
• End child poverty;
• Ensure every child and pregnant woman access to affordable, comprehensive health and mental
health coverage and services;
• Provide high quality early childhood development programs for all;
• Ensure every child can read at grade level by the fourth grade and guarantee quality education through
high school graduation;
• Protect children from abuse and neglect and connect them to caring permanent families; and
• Stop the criminalization of children at increasingly younger ages, reduce the detention and incarceration
of children and invest in prevention and early intervention strategies.
We must reclaim our country, our core values and our spiritual foundation in order for our children to
thrive and protect our nation’s economic future.
State of America’s Children® 2011
xiii
Are Our Children Ready to Compete in the Global Arena?
How America Ranks Among Industrialized Countries in
Investing in and Protecting Children
1st in gross domestic product
1st in number of billionaires
1st in number of persons incarcerated
1st in health expenditures
1st in student expenditures
1st in military technology
1st in defense expenditures
1st in military weapons exports
17th in reading scores
22nd in low birthweight rates
23rd in science scores
30th in infant mortality rates
31st in math scores
31st in the gap between the rich and the poor
Last in relative child poverty
Last in adolescent birth rates (ages 15 to 19)
Last in protecting our children against gun violence
The United States and Somalia (which has no legally constituted government) are the only two
United Nations members that have failed to ratify the U.N. Convention on the Rights of the Child.
If we compare just Black child well-being in America to child well-being in other nations,
according to UNICEF:
• 70 nations have lower infant mortality rates including Thailand and Costa Rica.
• 144 nations have a lower incidence of low birthweight, including the Dominican
Republic, Nigeria and Kazakhstan.
• Black women in the United States are more likely to die due to pregnancy complications
than women in 54 other nations, including Iran and Albania.
xiv
Children’s Defense Fund
Moments in America for All Children
Every second a public school student is suspended.*
Every 8 seconds a high school student drops out.*
Every 18 seconds a baby is born to an unmarried mother.
Every 20 seconds a public school student is corporally punished.*
Every 21 seconds a child is arrested.
Every 34 seconds a child is born into poverty.
Every 42 seconds a baby is born without health insurance
Every 42 seconds a child is confirmed as abused or neglected.
Every minute a baby is born to a teen mother.
Every 2 minutes a child is born at low birthweight.
Every 4 minutes a child is arrested for a drug offense.
Every 8 minutes a child is arrested for a violent offense.
Every 18 minutes a baby dies before his or her first birthday.
Every 45 minutes a child or teen dies from an accident.
Every 3 hours a child or teen is killed by a firearm.
Every 5 hours a child or teen commits suicide.
Every 5 hours a child is killed by abuse or neglect.
Every 16 hours a mother dies from complications of childbirth or pregnancies.
* Based on calculations per school day (180 days of seven hours each)
State of America’s Children® 2011
xv
Although minority children are disproportionately affected by poverty, violence, homelessness and
other risks, more White children are victims of these risks than any other race.
How Children in America are Faring, by Race/Ethnicity
White, non-Hispanic
41,225,410
55.3% of child population
Hispanic
16,750,075
22.5%
every 3 and a half seconds
every 7 seconds
High school student drop out
every 20 seconds
every 27 seconds
Child is arrested
every 32 seconds
n/a
every 48 and a half seconds
every 58 sceonds
Born to an unmarried mother
every 38 seconds
n/a
Child confirmed abused or neglected
every 2 minutes
every 4 minutes
Baby born into poverty
every 2 minutes
every 2 minutes
Baby born without health insurance
every 2 minutes
every one and a half minutes
Baby born to teen mother
every 2 minutes
every 3 and a half minutes
Baby born at low birthweight
every 3 minutes
every 7 minutes
Child arrested for drug offense
every 5 minutes
n/a
every 16 and a half minutes
n/a
Baby dies before first birthday
every 28 minutes
n/a
Child or teen dies from an accident
every 58 minutes
every 5 hours
Child or teen killed by firearm
every 6 hours
every 14 hours
Child or teen commits suicide
every 8 hours
every one and a half days
Child killed by abuse or negelct
every 17 hours
every one and a half days
every one and a half days
every 4 days
Public school suspended
Public school student is corporally punished
Child arrested for violent offense
Woman dies of complications of childbirth
or pregnancy
* Based on 180 school days a year
xvi
Children’s Defense Fund
How Children in America are Faring, by Race/Ethnicity
Black
11,280,366
15.1%
Asian/Pacific Islander
3,480,257
4.7%
Ameican Indian/ Alaska Native
951,329
1.3%
every 4 seconds
every minute
every one and a half minutes
every 27 seconds
every 4 minutes
every 7 minutes
every minute
every 22 minutes
every 28 minutes
every 57 seconds
every 3 hours
every 14 and a half minutes
every minute
every 12 minutes
every 16 minutes
every 3 and a half minutes
every hour
every minute
every 2 minutes
every 25 minutes
every 49 minutes
every 4 minutes
n/a
n/a
every 4 and a half minutes
every hour
every 59 minutes
every 6 minutes
n/a
n/a
every 15 minutes
every 6 hours
every 7 hours
every 15 minutes
every 11 hours
every 16 and a half hours
every 59 minutes
n/a
n/a
every 4 and a half hours
every day
every one and a half days
every 6 hours
every 8 and a half days
every 9 days
every 2 days
every 6 and a half days
every 6 and a half days
every 22 and a half hours
n/a
n/a
every 2 days
n/a
n/a
State of America’s Children® 2011
xvii
Each day in America
2
5
5
8
32
80
186
368
949
1,204
1,240
2,058
2,163
2,573
3,312
4,133
4,717
18,493
mothers die in childbirth.
children are killed by abuse or neglect.
children or teens commit suicide.
children or teens are killed by firearms.
children or teens die from accidents.
babies die before their first birthdays.
children are arrested for violent offenses.
children are arrested for drug offenses.
babies are born at low birthweight.
babies are born to teen mothers.
public school students are corporally punished.*
children are confirmed as abused or neglected.
babies are born without health insurance.
babies are born into poverty.
high school students drop out.*
children are arrested.
babies are born to unmarried mothers.
public school students are suspended.
* Based on 180 school days a year
Each day in America for White children
1
1
3
4
25
52
86
266
447
663
735
811
823
846
1,270
1,776
2,722
7,236
mother dies in childbirth.
child is killed by abuse or neglect.
children or teens commit suicide.
children or teens are killed by firearms.
children or teens die from accidents.
babies die before their first birthdays.
children are arrested for violent offenses.
children are arrested for drug offenses.
babies are born at low birthweight.
public school students are corporally punished.*
babies are born without health insurance.
babies are born into poverty.
children are confirmed as abused or neglected.
babies are born to teen mothers.
high school students drop out.*
babies are born to unmarried mothers.
children are arrested.
public school students are suspended.*
* Based on 180 school days a year
xviii
Children’s Defense Fund
Each day in America for Hispanic children
2
5
103
198
387
402
944
945
955
1,495
3,726
children or teens are killed by firearms.
children or teens die from accidents.
public school students are corporally punished.*
babies are born at low birthweight.
children are confirmed as abused or neglected.
babies are born to teen mothers.
babies are born without health insurance.
high school students drop out.*
babies are born into poverty.
babies are born to unmarried mothers.
public school students are suspended.*
* Based on 180 school days a year
Each day in America for Black children
1
4
5
25
94
96
233
312
332
417
442
607
936
1,296
1,317
6,916
child is killed by abuse or neglect.
children or teens are killed by firearms.
children or teens die from accidents.
babies die before their first birthdays.
children are arrested for drug offenses.
children are arrested for violent offenses.
babies are born at low birthweight.
babies are born to teen mothers.
babies are born without health insurance.
children are confirmed as abused or neglected.
public school students are corporally punished.*
babies are born into poverty.
high school students drop out.*
children are arrested.
babies are born to unmarried mothers.
public school students are suspended.
* Based on 180 school days a year
State of America’s Children® 2011
xix
Each day in America for Asian
and Pacific Islander children
2
2
4
21
21
57
64
98
117
351
children are arrested for violent offenses.
public school students are corporally punished.*
children are arrested for drug offenses.
babies are born to teen mothers.
children are confirmed as abused or neglected.
babies are born into poverty.
children are arrested.
high school students drop out.*
babies are born to unmarried mothers.
public school students are suspended.
* Based on 180 school days a year
Each day in America for American Indian
and Alaska Native children
1
3
20
23
24
29
51
62
89
264
child is arrested for violent offenses.
children are arrested for drug offenses.
children are confirmed as abused or neglected.
babies are born into poverty.
babies are born to teen mothers.
public school students are corporally punished.*
children are arrested.
high school students drop out.*
babies are born to unmarried mothers.
public school students are suspended.
* Based on 180 school days a year
xx
Children’s Defense Fund
Child Population
C
hildren constitute almost one in four of the people living in the United States. More than 25 percent
of them are infants, toddlers or preschoolers. Almost 45 percent are children of color, and by 2019
the majority of children will be racial or ethnic minorities. There are almost twice as many children as
seniors, but by 2050 that gap will close: 23.1 percent of the population will be children and
20.2 percent will be seniors.
• Of the 74.5 million children in America: 41.2 million (55.3%) are White,
non-Hispanic; 16.8 million (22.5%) are Hispanic; 11.3 million (15.1%) are
Black; 3.5 million (4.7%) are Asian/Pacific Islander; and 951,000 (1.3%)
are American Indian/Alaska Native.
• The number of Hispanic children has increased every year since 1980, rising from
5.3 million in 1980 to 17 million in 2009, while the number of White children has
decreased every year since 1994. The number of Black children has remained steady
at around 10 to 11 million over the past two decades
• The majority of children in the District of Columbia and nine states – Hawaii,
New Mexico, California, Texas, Arizona, Nevada, Florida, Maryland and Georgia –
are racial or ethnic minorities.
• More than one in four children are under five and more than one in five are teenagers
ages 14-17.
• Vermont has the lowest proportion of children (20.3%); Utah has the highest (31.2%).
A-2
Children’s Defense Fund
Since 1979 the number of White children has decreased by 13 percent, while the number
of Hispanic children has increased by over 200 percent.
Trends in Child Population, by Race/Ethnicity, 1979-2009
50
White
Total number in millions
40
30
20
Hispanic*
Black
10
Asian
0
1979
1984
1989
Year
All Children
(in 1,000s)
White
(in 1,000s)
1979
1980
1981
1982
1983
1984
1985
1986
1987
1988
1989
1990
1991
1992
1993
1994
1995
1996
1997
1998
1999
2000
2001
2002
2003
2004
2005
2006
2007
2008
2009
63,375
62,914
62,449
62,345
62,334
62,447
62,876
62,948
63,294
63,747
64,144
65,049
65,918
68,440
69,292
70,020
70,566
70,650
71,069
71,338
71,685
71,741
72,021
72,696
72,999
73,241
73,285
73,727
73,996
74,068
74,579
46,967
46,578
45,950
45,531
44,830
44,886
44,752
44,664
44,461
44,438
44,492
44,797
45,236
45,590
46,096
46,668
45,689
45,605
45,491
45,355
44,272
44,244
44,095
43,614
43,150
42,978
42,523
42,212
41,979
41,309
40,917
1994
1999
Black
(in 1,000s)
9,307
9,368
9,374
9,400
9,417
9,480
9,545
9,629
9,730
9,865
10,012
10,162
10,350
10,956
11,127
11,211
11,369
11,338
11,367
11,317
11,488
11,480
11,556
11,275
11,367
11,244
11,136
11,315
11,302
11,172
11,282
2004
Asian
(in 1,000s)
n/a
n/a
n/a
n/a
n/a
n/a
n/a
n/a
1,937
1,970
1,983
2,126
2,056
2,218
2,061
1,739
2,900
2,924
3,096
3,137
3,212
3,294
3,215
2,683
2,759
2,854
2,871
2,956
2,980
3,052
3,311
2009
Hispanic*
(in 1,000s)
5,483
5,276
5,369
5,527
6,066
6,068
6,475
6,646
6,792
7,003
7,186
7,457
7,648
9,081
9,462
9,822
10,213
10,511
10,802
11,152
12,188
12,399
12,763
13,210
13,730
14,173
14,654
15,147
15,647
16,370
16,965
* Persons of Hispanic orgin can be of any race.
Source: U.S. Department of Commerce, Bureau of the Census, Current Population Survey, 2009 Annual Social and Economic
Supplements, Table 3. Poverty Status of People, by Age, Race, and Hispanic Origin: 1959 to 2009 Available at
http://www.census.gov/hhes/www/poverty/data/historical/people.html.
State of America’s Children® 2011
A-3
Where the Majority of Minority Children Live, 2009
The majority of Black children live in eight states
Number of Black children
in each state
New York
Florida
Texas
Georgia
California
Illinois
North Carolina
Maryland
Total number of Black children in these states
Total number of Black children in the United States
898,042
877,281
863,664
845,665
647,685
556,475
548,973
444,146
5,681,931
11,280,366
The majority of Hispanic children live in three states
Number of Hispanic children
in each state
California
Texas
Florida
Total number of Hispanic children in these states
Total number of Hispanic children in the United States
4,736,730
3,247,131
1,070,805
9,054,666
16,750,075
The majority of American Indian/Alaska Native children live in seven states
Number of American Indian/
Alaska Native children
in each state
California
Arizona
Oklahoma
New Mexico
Texas
Washington
Alaska
Total number of American Indian/Alaska Native children in these states
Total number of American Indian/Alaska Native children in U.S.
118,870
110,265
91,125
61,935
54,410
38,090
34,021
508,716
951,329
The majority of Asian/Pacific Islander children live in four states
Number of Asian/
Pacific Islander children
in each state
California
New York
Texas
New Jersey
Total number of Asian/Pacific Islander children in these states
Total number of Asian/Pacific Islander children in the U.S.
1,057,691
323,362
242,013
172,367
1,795,433
3,480,257
Source: U.S. Department of Commerce, Bureau of the Census, “Annual State Resident Population Estimates for 6 Race Groups
(5 Race Alone Groups and One Group with Two or more Race Groups) by Age, Sex, and Hispanic Origin: April 1, 2000 to July 1,
2009,” at <http://www.census.gov/popest/datasets.html>. Calculations by Children’s Defense Fund.
A-4
Children’s Defense Fund
The racial and ethnic makeup of the child population differs across states
where minority children make up the majority of the child population.
States Where a Majority of Children Are
Racial or Ethnic Minorities, 2009
Total
number of
children
Hawaii
District of Columbia
New Mexico
California
Texas
Arizona
Nevada
Florida
Maryland
Georgia
Minority children
Number
Percent of total
290,361
114,036
510,238
9,435,682
6,895,969
1,732,019
681,033
4,057,773
1,351,935
2,583,792
235,892
90,706
366,851
6,660,035
4,413,691
1,005,608
391,414
2,093,499
680,554
1,295,640
81.2%
79.5
71.9
70.6
64.0
58.1
57.5
51.6
50.3
50.1
White, non-Hispanic
Asian/Pacific Islander
Hispanic
American Indian/Alask Native
Two or more races
Black
100
60
40
20
ar
y
gi
a
M
Ge
or
la
nd
a
id
Fl
or
ev
ad
a
N
iz
on
a
Ar
s
Te
xa
ia
rn
Ca
lif
o
Di
Co stric
lu t o
m f
bi
a
N
ew
M
ex
ic
o
aw
ai
i
0
H
Percent
80
Source: U.S. Department of Commerce, Bureau of the Census, “Annual State Resident Population Estimates for 6 Race Groups
(5 Race Alone Groups and One Group with Two or more Race Groups) by Age, Sex, and Hispanic Origin: April 1, 2000 to July 1,
2009,” at <http://www.census.gov/popest/datasets.html>. Calculations by Children’s Defense Fund
State of America’s Children® 2011
A-5
Twenty states and the District of Columbia have a minority child population of 40 percent or more.
A majority of all minority children live in California, Texas, New York, Florida and Illinois.
Child Population, by Race and Hispanic Origin, 2009
White
Alabama
Alaska
Arizona
Arkansas
California
Colorado
Connecticut
Delaware
District of Columbia
Florida
Georgia
Hawaii
Idaho
Illinois
Indiana
Iowa
Kansas
Kentucky
Louisiana
Maine
Maryland
Massachusetts
Michigan
Minnesota
Mississippi
Missouri
Montana
Nebraska
Nevada
New Hampshire
New Jersey
New Mexico
New York
North Carolina
North Dakota
Ohio
Oklahoma
Oregon
Pennsylvania
Rhode Island
South Carolina
South Dakota
Tennessee
Texas
Utah
Vermont
Virginia
Washington
West Virginia
Wisconsin
Wyoming
United States
Black
One Race Only
American Indian/
Alaska Native
Asian/
Pacific Islander
743,933
113,522
1,417,786
533,912
7,186,489
1,057,381
640,945
140,953
32,399
2,921,938
1,580,862
73,551
384,282
2,387,454
1,336,015
643,170
598,030
874,599
647,841
251,518
782,615
1,160,358
1,790,452
1,036,460
407,922
1,152,184
184,603
391,842
528,927
266,740
1,462,469
400,361
3,037,550
1,579,219
121,780
2,171,421
660,757
749,758
2,210,248
188,004
680,162
158,936
1,116,422
5,567,405
786,444
118,460
1,259,179
1,240,076
354,680
1,094,555
118,272
342,322
9,985
96,390
137,298
647,685
66,997
103,817
51,501
74,129
877,281
845,665
13,724
7,615
556,475
181,052
31,058
54,418
98,717
425,858
6,650
444,146
138,706
401,986
89,815
333,446
203,097
3,449
28,475
63,692
7,161
345,066
21,657
898,042
548,973
2,871
405,986
90,643
25,589
397,320
20,111
352,136
4,153
309,559
863,664
16,904
2,233
414,029
78,341
19,283
117,931
3,265
5,510
34,021
110,265
7,855
118,870
18,149
4,188
928
441
26,291
11,065
2,256
8,360
12,618
5,224
5,035
8,588
2,911
7,804
2,238
5,584
5,471
16,175
23,759
4,974
8,075
21,972
8,066
12,519
1,029
8,390
61,935
28,052
32,693
13,805
7,666
91,125
17,140
9,157
2,436
5,623
27,906
5,905
54,410
14,277
457
7,196
38,090
844
18,936
5,045
13,403
10,620
48,239
10,427
1,057,691
38,037
34,208
6,960
3,467
110,514
79,834
115,424
5,821
139,586
25,448
14,567
17,759
13,008
17,694
3,944
72,111
83,834
66,969
66,476
7,404
26,123
2,163
9,840
40,407
7,341
172,367
9,274
323,362
55,206
1,498
49,252
16,304
37,898
85,476
8,064
16,947
2,344
24,708
242,013
24,008
2,075
97,838
116,461
2,829
41,598
1,416
56,344,841
11,280,366
951,329
3,480,257
* Persons of Hispanic origin can be of any race.
** Includes all children except White, non-Hispanic children.
Source: U.S. Department of Commerce, Bureau of the Census, “Annual State Resident Population Estimates for 6 Race Groups
(5 Race Alone Groups and One Group with Two or more Race Groups) by Age, Sex, and Hispanic Origin: April 1, 2000 to July 1, 2009,” at
<http://www.census.gov/popest/datasets.html>. Calculations by Children’s Defense Fund.
A-6
Children’s Defense Fund
Child Population, by Race and Hispanic Origin, 2009
Two or more
races
Hispanic*
White,
non-Hispanic
Minority**
23,696
15,398
59,339
20,476
424,947
47,199
24,827
6,651
3,600
121,749
66,366
85,406
13,112
81,244
41,626
19,325
26,156
25,088
24,189
6,826
47,479
44,633
74,310
44,287
13,996
41,859
7,641
13,418
35,488
6,800
57,556
17,011
137,077
61,876
4,017
80,016
60,020
42,426
72,931
8,210
25,864
6,277
36,658
168,477
27,191
3,050
68,940
96,624
8,813
37,230
4,027
64,429
16,884
754,363
70,989
4,736,730
366,807
144,500
25,003
13,960
1,070,805
324,493
43,508
68,682
705,192
137,909
55,999
104,019
45,929
50,029
6,657
141,459
194,727
156,510
94,442
27,028
79,096
11,494
63,824
263,782
13,357
442,088
282,203
960,678
296,159
5,660
123,160
120,670
172,970
241,633
45,268
81,034
10,340
107,483
3,247,131
141,968
2,805
197,128
276,821
7,724
118,032
16,514
686,160
101,659
726,411
469,489
2,775,647
722,595
517,308
119,154
23,330
1,964,274
1,288,152
54,469
321,846
1,725,779
1,210,504
592,652
503,900
834,795
605,720
245,790
671,381
1,008,858
1,653,490
959,815
384,539
1,082,699
175,365
335,145
289,619
255,194
1,088,513
143,387
2,289,156
1,311,809
117,280
2,069,513
559,073
593,483
2,019,005
150,003
612,761
151,378
1,026,363
2,482,278
656,034
115,986
1,088,469
1,003,810
347,750
989,835
103,785
442,704
81,887
1,005,608
240,479
6,660,035
505,168
290,677
87,839
90,706
2,093,499
1,295,640
235,892
97,344
1,451,598
378,861
120,503
201,051
179,528
517,666
25,386
680,554
424,144
696,402
300,982
383,203
348,639
44,463
116,496
391,414
33,877
957,335
366,851
2,134,927
966,158
26,691
644,828
359,776
279,328
756,127
76,822
467,971
48,238
466,889
4,413,691
212,790
10,289
758,713
565,782
38,699
320,415
28,240
2,491,422
16,750,075
41,225,410
33,322,805
Minority children
as a percent of
all children
39.2%
44.6
58.1
33.9
70.6
41.1
36.0
42.4
79.5
51.6
50.1
81.2
23.2
45.7
23.8
16.9
28.5
17.7
46.1
9.4
50.3
29.6
29.6
23.9
49.9
24.4
20.2
25.8
57.5
11.7
46.8
71.9
48.3
42.4
18.5
23.8
39.2
32.0
27.2
33.9
43.3
24.2
31.3
64.0
24.5
8.1
41.1
36.0
10.0
24.5
21.4
44.7
Alabama
Alaska
Arizona
Arkansas
California
Colorado
Connecticut
Delaware
District of Columbia
Florida
Georgia
Hawaii
Idaho
Illinois
Indiana
Iowa
Kansas
Kentucky
Louisiana
Maine
Maryland
Massachusetts
Michigan
Minnesota
Mississippi
Missouri
Montana
Nebraska
Nevada
New Hampshire
New Jersey
New Mexico
New York
North Carolina
North Dakota
Ohio
Oklahoma
Oregon
Pennsylvania
Rhode Island
South Carolina
South Dakota
Tennessee
Texas
Utah
Vermont
Virginia
Washington
West Virginia
Wisconsin
Wyoming
United States
State of America’s Children® 2011
A-7
The percentage of children by race varies greatly across states. The highest percentage of Black,
Hispanic, Asian/Pacific Islanders, American Indian/Alaska Native and White, non-Hispanic children
are in the District of Columbia, New Mexico, Hawaii, Alaska and Vermon respectively.
Percent of the Child Population, by Race and Hispanic Origin, 2009
Ranking of the Percentage of Children in Each Race/Ethnicity from Highest to Lowest
White,
non-Hispanic
Percent Rank
Alabama
60.8% 29
Alaska
55.4
36
Arizona
41.9
46
Arkansas
66.1
25
California
29.4
48
Colorado
58.9
31
Connecticut
64.0
27
Delaware
57.6
33
District of Columbia
20.5
50
Florida
48.4
44
Georgia
49.9
42
Hawaii
18.8
51
Idaho
76.8
10
Illinois
54.3
37
Indiana
76.2
11
Iowa
83.1
5
Kansas
71.5
20
Kentucky
82.3
6
Louisiana
53.9
38
Maine
90.6
2
Maryland
49.7
43
Massachusetts
70.4
21
Michigan
70.4
21
Minnesota
76.1
13
Mississippi
50.1
41
Missouri
75.6
15
Montana
79.8
8
Nebraska
74.2
18
Nevada
42.5
45
New Hampshire
88.3
4
New Jersey
53.2
39
New Mexico
28.1
49
New York
51.7
40
North Carolina
57.6
33
North Dakota
81.5
7
Ohio
76.2
11
Oklahoma
60.8
29
Oregon
68.0
24
Pennsylvania
72.8
19
Rhode Island
66.1
25
South Carolina
56.7
35
South Dakota
75.8
14
Tennessee
68.7
23
Texas
36.0
47
Utah
75.5
16
Vermont
91.9
1
Virginia
58.9
31
Washington
64.0
27
West Virginia
90.0
3
Wisconsin
75.5
16
Wyoming
78.6
9
United States
55.3
Black
Percent Rank
30.3%
7
5.4
36
5.6
34
19.3
14
6.9
32
5.5
35
12.8
21
24.9
8
65.0
1
21.6
11
32.7
5
4.7
39
1.8
49
17.5
15
11.4
23
4.4
40
7.7
30
9.7
25
37.9
3
2.5
44
32.9
4
9.7
25
17.1
16
7.1
31
43.4
2
14.2
20
1.6
50
6.3
33
9.4
27
2.5
43
16.9
17
4.2
41
20.3
13
24.1
9
2.0
47
15.0
18
9.9
24
2.9
42
14.3
19
8.9
29
32.6
6
2.1
46
20.7
12
12.5
22
1.9
48
1.8
49
22.4
10
5.0
37
5.0
37
9.0
28
2.5
44
15.1
American Indian
Alaska Native
Percent Rank
0.5%
33
18.5
1
6.4
7
1.1
21
1.3
19
1.5
16
0.5
33
0.4
36
0.4
36
0.6
29
0.4
36
0.8
23
2.0
10
0.4
36
0.3
47
0.7
26
1.2
20
0.3
47
0.7
26
0.8
23
0.4
36
0.4
36
0.7
26
1.9
12
0.6
29
0.6
29
10.0
4
1.8
13
1.8
13
0.4
36
0.4
36
12.1
3
0.6
29
1.4
17
9.6
6
0.3
47
9.9
5
2.0
10
0.3
47
1.1
21
0.5
33
14.0
2
0.4
36
0.8
23
1.6
15
0.4
36
0.4
36
2.4
9
0.2
17
1.4
8
3.8
51
1.3
Asian,
Pacific Islander
Percent Rank
1.2%
45
5.8
8
2.8
23
1.5
41
11.2
2
3.1
19
4.2
14
3.4
17
3.0
22
2.7
26
3.1
19
39.8
1
1.4
43
4.4
12
1.6
37
2.0
31
2.5
27
1.3
44
1.6
37
1.5
41
5.3
9
5.9
6
2.8
23
5.3
9
1.0
48
1.8
32
1.0
48
2.2
30
5.9
6
2.5
27
8.4
3
1.8
32
7.3
5
2.4
29
1.0
48
1.8
32
1.8
32
4.3
13
3.1
19
3.6
15
1.6
37
1.2
45
1.7
36
3.5
16
2.8
23
1.6
37
5.3
9
7.4
4
0.7
51
3.2
18
1.1
47
4.7
Hispanic*
Percent
Rank
5.7%
39
9.2
30
43.6
4
10.0
29
50.2
2
29.9
6
17.9
13
12.1
26
12.2
25
26.4
7
12.6
23
15.0
17
16.4
15
22.2
8
8.7
32
7.9
34
14.8
18
4.5
44
4.5
44
2.5
49
10.5
28
13.6
20
6.7
38
7.5
35
3.5
48
5.5
40
5.2
41
14.1
19
38.7
5
4.6
43
21.6
10
55.3
1
21.7
9
13.0
22
3.9
47
4.5
44
13.1
21
19.8
12
8.7
32
20.0
11
7.5
35
5.2
41
7.2
37
47.1
3
16.3
16
2.2
50
10.7
27
17.6
14
2.0
51
9.0
31
12.5
24
22.5
* Persons of Hispanic origin can be of any race.
Note: The state rankings on this page refer to the percentage of children by race and ethnicity in each state. States with the highest percentage are ranked
1st and states with the smallest percentage are ranked 51st.
Source: U.S. Department of Commerce, Bureau of the Census, “Estimates of the Resident Population by Selected Age Groups for the United States, States,
and Puerto Rico: July 1, 2009,” at http://www.census.gov/popest/states/asrh/SC-EST2009-01.html; and U.S. Department of Commerce, Bureau of the Census,
“Annual State Resident Population Estimates for 6 Race Groups (5 Race Alone Groups and One Group with Two or more Race Groups) by Age, Sex, and
Hispanic Origin: April 1, 2000 to July 1, 2009,” at <http://www.census.gov/popest/datasets.html>. Calculations by
Children’s Defense Fund.
A-8
Children’s Defense Fund
More than one in four of the nearly 75 million children in the U.S.
are infants, toddlers and preschoolers.
Child Population, by Age, 2009
Alabama
Alaska
Arizona
Arkansas
California
Colorado
Connecticut
Delaware
District of Columbia
Florida
Georgia
Hawaii
Idaho
Illinois
Indiana
Iowa
Kansas
Kentucky
Louisiana
Maine
Maryland
Massachusetts
Michigan
Minnesota
Mississippi
Missouri
Montana
Nebraska
Nevada
New Hampshire
New Jersey
New Mexico
New York
North Carolina
North Dakota
Ohio
Oklahoma
Oregon
Pennsylvania
Rhode Island
South Carolina
South Dakota
Tennessee
Texas
Utah
Vermont
Virginia
Washington
West Virginia
Wisconsin
Wyoming
United States
Total under
age 18
Under age 5
Ages 5–13
1,128,864
183,546
1,732,019
709,968
9,435,682
1,227,763
807,985
206,993
114,036
4,057,773
2,583,792
290,361
419,190
3,177,377
1,589,365
713,155
704,951
1,014,323
1,123,386
271,176
1,351,935
1,433,002
2,349,892
1,260,797
767,742
1,431,338
219,828
451,641
681,033
289,071
2,045,848
510,238
4,424,083
2,277,967
143,971
2,714,341
918,849
872,811
2,775,132
226,825
1,080,732
199,616
1,493,252
6,895,969
868,824
126,275
1,847,182
1,569,592
386,449
1,310,250
132,025
315,210
54,463
518,431
204,785
2,753,801
364,481
210,470
59,726
37,144
1,166,005
751,215
88,987
124,936
893,952
445,604
203,997
205,385
288,022
319,438
70,762
380,606
385,851
616,055
363,975
222,503
403,529
62,438
134,717
203,570
74,689
555,282
151,988
1,223,080
664,837
43,401
739,526
271,861
247,909
746,813
60,139
311,013
59,640
425,565
2,073,513
273,723
32,474
533,143
450,617
105,976
364,068
40,341
556,545
87,907
850,544
349,123
4,550,926
602,724
403,054
100,564
52,236
1,976,173
1,276,639
138,261
205,040
1,564,930
785,517
346,415
345,088
497,321
551,492
132,660
659,124
707,679
1,163,651
612,477
373,193
699,837
105,683
218,270
333,530
142,544
1,017,592
247,417
2,156,475
1,121,554
67,465
1,339,903
447,801
428,202
1,356,459
111,425
527,103
95,458
732,782
3,397,334
426,672
61,364
903,530
765,222
190,651
640,645
62,881
257,109
41,176
363,044
156,060
2,130,955
260,558
194,461
46,703
24,656
915,595
555,938
63,113
89,214
718,495
358,244
162,743
154,478
228,980
252,456
67,754
312,205
339,472
570,186
284,345
172,046
327,972
51,707
98,654
143,933
71,838
472,974
110,833
1,044,528
491,576
33,105
634,912
199,187
196,700
671,860
55,261
242,616
44,518
334,905
1,425,122
168,429
32,437
410,509
353,753
89,822
305,537
28,803
813,654
129,083
1,213,588
505,183
6,681,881
863,282
597,515
147,267
76,892
2,891,768
1,832,577
201,374
294,254
2,283,425
1,143,761
509,158
499,566
726,301
803,948
200,414
971,329
1,047,151
1,733,837
896,822
545,239
1,027,809
157,390
316,924
477,463
214,382
1,490,566
358,250
3,201,003
1,613,130
100,570
1,974,815
646,988
624,902
2,028,319
166,686
769,719
139,976
1,067,687
4,822,456
595,101
93,801
1,314,039
1,118,975
280,473
946,182
91,684
74,548,215
21,299,656
36,487,082
16,761,477
53,248,559
Ages 14–17
Ages 5–17
Source: U.S. Department of Commerce, Bureau of the Census, “Estimates of the Resident Population by Selected Age Groups for the United States, States,
and Puerto Rico: July 1, 2009,” at http://www.census.gov/popest/states/asrh/SC-EST2009-01.html. Calculations by Children’s Defense Fund.
State of America’s Children® 2011
A-9
By 2050 the number of children will increase by more than one-third and
the number of seniors will more than double.
Population of Children and Seniors, 1960–2050
Children
Seniors
Total,
all ages
(in 1,000s)
Number
(in 1,000s)
1960
180,676
64,561
35.7%
16,659
9.2%
1970
204,879
69,702
34.0
20,085
9.8
1980
227,738
63,683
28.0
25,713
11.3
1990
248,718
63,923
25.7
31,080
12.5
2000
281,422
72,294
25.7
34,992
12.4
2009
307,007
74,548
24.3
39,571
12.9
2020
341,387
81,685
23.9
54,804
16.1
2030
373,504
87,815
23.5
72,092
19.3
2040
405,655
93,986
23.2
81,238
20.0
2050
439,010
101,574
23.1
88,547
20.2
Percent
of population
Number
(in 1,000s)
Percent
of population
Actual population
Projected population
Source: U.S. Department of Commerce, Bureau of the Census, Statistical Abstract of the United States, various years, and “Projections of the
Population by Selected Age Groups for the United States: 2010 to 2050,” at http://www.census.gov/compendia/statab/2011/tables/11s0008.pdf
Calculations by Children's Defense Fund.
A-10
Children’s Defense Fund
In every state at least one in five residents is a child. In 11 states
there are at least twice as many children as seniors.
Population, 2009:
Children and Seniors
Children
Alabama
Alaska
Arizona
Arkansas
California
Colorado
Connecticut
Delaware
District of Columbia
Florida
Georgia
Hawaii
Idaho
Illinois
Indiana
Iowa
Kansas
Kentucky
Louisiana
Maine
Maryland
Massachusetts
Michigan
Minnesota
Mississippi
Missouri
Montana
Nebraska
Nevada
New Hampshire
New Jersey
New Mexico
New York
North Carolina
North Dakota
Ohio
Oklahoma
Oregon
Pennsylvania
Rhode Island
South Carolina
South Dakota
Tennessee
Texas
Utah
Vermont
Virginia
Washington
West Virginia
Wisconsin
Wyoming
United States
Total,
all ages
Number
4,708,708
698,473
6,595,778
2,889,450
36,961,664
5,024,748
3,518,288
885,122
599,657
18,537,969
9,829,211
1,295,178
1,545,801
12,910,409
6,423,113
3,007,856
2,818,747
4,314,113
4,492,076
1,318,301
5,699,478
6,593,587
9,969,727
5,266,214
2,951,996
5,987,580
974,989
1,796,619
2,643,085
1,324,575
8,707,739
2,009,671
19,541,453
9,380,884
646,844
11,542,645
3,687,050
3,825,657
12,604,767
1,053,209
4,561,242
812,383
6,296,254
24,782,302
2,784,572
621,760
7,882,590
6,664,195
1,819,777
5,654,774
544,270
1,128,864
183,546
1,732,019
709,968
9,435,682
1,227,763
807,985
206,993
114,036
4,057,773
2,583,792
290,361
419,190
3,177,377
1,589,365
713,155
704,951
1,014,323
1,123,386
271,176
1,351,935
1,433,002
2,349,892
1,260,797
767,742
1,431,338
219,828
451,641
681,033
289,071
2,045,848
510,238
4,424,083
2,277,967
143,971
2,714,341
918,849
872,811
2,775,132
226,825
1,080,732
199,616
1,493,252
6,895,969
868,824
126,275
1,847,182
1,569,592
386,449
1,310,250
132,025
307,006,550
74,548,215
Seniors
Percent
of population
24.0%
26.3
26.3
24.6
25.5
24.4
23.0
23.4
19.0
21.9
26.3
22.4
27.1
24.6
24.7
23.7
25.0
23.5
25.0
20.6
23.7
21.7
23.6
23.9
26.0
23.9
22.5
25.1
25.8
21.8
23.5
25.4
22.6
24.3
22.3
23.5
24.9
22.8
22.0
21.5
23.7
24.6
23.7
27.8
31.2
20.3
23.4
23.6
21.2
23.2
24.3
24.3
Number
651,049
52,849
866,734
413,681
4,148,055
533,580
488,055
126,693
70,184
3,195,841
1,014,814
188,180
187,418
1,594,473
828,591
444,294
367,546
570,336
554,296
205,617
694,796
894,514
1,339,772
671,055
376,913
822,425
141,903
240,630
306,843
179,247
1,173,024
261,342
2,619,755
1,192,025
94,870
1,605,316
495,962
516,862
1,946,266
150,596
623,223
117,732
840,953
2,539,215
251,159
89,911
960,090
806,202
287,557
761,279
66,867
39,570,590
Percent
of population
13.8%
7.6
13.1
14.3
11.2
10.6
13.9
14.3
11.7
17.2
10.3
14.5
12.1
12.4
12.9
14.8
13.0
13.2
12.3
15.6
12.2
13.6
13.4
12.7
12.8
13.7
14.6
13.4
11.6
13.5
13.5
13.0
13.4
12.7
14.7
13.9
13.5
13.5
15.4
14.3
13.7
14.5
13.4
10.2
9.0
14.5
12.2
12.1
15.8
13.5
12.3
12.9
Source: U.S. Department of Commerce, Bureau of the Census, Estimates of the Resident Population by Selected Age Groups for the United States,
States, and Puerto Rico: July 1, 2009 (SC-EST2009-01) at http://www.census.gov/popest/states/asrh/SC-EST2009-01.html.
Calculation by Children’s Defense Fund.
State of America’s Children® 2011
A-11
Child Poverty
M
illions of children and families fell into poverty in 2009 due to the economic downturn, jeopardizing the promise of a productive future for them and for our nation. Poverty impairs children’s
emotional, intellectual and physical development and ends up costing our nation tens of billions of dollars
a year in lost productivity and increased health care costs. Poverty is defined as an annual income below
$22,050 for a four-person family. The number of children in poverty increased 28 percent between
2000 and 2009 after dropping 27 percent between 1992 and 2000. Child poverty increased by almost
10 percent between 2008 and 2009, the largest single-year increase since 1960. Children of color
continue to suffer disproportionately from poverty. Black and Hispanic children are about three times
as likely to be poor as White non-Hispanic children.
• A total of 15.5 million children, or one in every five children in America, lived in poverty
in 2009, an increase of nearly four million children since 2000.
• Almost half—6.9 million—of all poor children lived in extreme poverty, defined as an
annual income of less than half of the poverty level ($11,025 for a family of four). Just over
one-third (2.4 million) of the children living in extreme poverty were under the age of five.
• There were more poor Hispanic children (5.6 million) than poor Black (4.0 million) or
poor White (4.9 million) children. Hispanic children experienced the largest single-year
increase in 2009.
• In 2009, more than one in three Black children and one in three Hispanic children, compared
to more than one in ten White non-Hispanic children, lived in poverty.
• Almost 60 percent of all children in poverty lived in single-parent families. However, marriedcouple families were not immune to the effects of the recession with 2.2 million marriedcouple families – nearly nine percent more than in 2008 – living in poverty in 2009.
• Two-thirds of poor children live in families in which at least one family member works.
• More than half of all poor children and half of the children living in extreme poverty live in
eight states (California, Texas, New York, Florida, Illinois, Ohio, Georgia, and Michigan).
• The number of homeless preschool-age children increased by 43 percent in the past two
school years. The number of homeless children and youth enrolled in public schools increased
41 percent between the 2006-2007 and the 2008-2009 school years.
B-2
Children’s Defense Fund
Child poverty was at its lowest level 40 years ago (14.0%). After dropping 27 percent between
1992 and 2000, the children poverty rate increased by 28 percent between 2000 and 2009.
Trends in Child Poverty Rate, 1959–2009
30
25
Percent poor
20.7%
20
15
14.0%
10
0
1959
1964
1969
1974
1979
1984
1989
1994
1999
2004
2009
Source: U.S. Department of Commerce, Bureau of the Census.
Black and Hispanic children have experienced significantly higher rates of poverty
since race data was first collected.
Trends in Child Poverty Rates, by Race/Ethnicity, 1959-2009
50
Black
40
35.7%
Percent poor
Hispanic*
33.1%
30
Asian
20.7%
20
All Races
14.0%
11.9%
10
0
White, non-Hispanic
1959
1964
1969
1974
1979
1984
1989
1994
1999
2004
2009
* Persons of Hispanic orgin can be of any race.
Source: U.S. Department of Commerce, Bureau of the Census, 2010 Current Population Survey, Annual Social and
Economic Supplements, Table 3, available at http://www.census.gov/hhes/www/poverty/data/historical/ people.html.
State of America’s Children® 2011
B-3
Since 2000 the number of poor children has increased by 3.9 million, reaching 15.5 million.
The number of children who fell into poverty between 2008 and 2009
was the largest single-year increase ever recorded.
Poverty Trends Among Children, 1959–2009
Year
Number of
children
under 18
who are poor
Child
poverty
rate
1959
1960
1961
1962
1963
1964
1965
1966
1967
1968
1969
1970
1971
1972
1973
1974
1975
1976
1977
1978
1979
1980
1981
1982
1983
1984
1985
1986
1987
1988
1989
1990
1991
1992
1993
1994
1995
1996
1997
1998
1999
2000
2001
2002
2003
2004
2005
2006
2007
2008
2009
17,552,000
17,634,000
16,909,000
16,963,000
16,005,000
16,051,000
14,676,000
12,389,000
11,656,000
10,954,000
9,691,000
10,440,000
10,551,000
10,284,000
9,642,000
10,156,000
11,104,000
10,273,000
10,288,000
9,931,000
10,377,000
11,543,000
12,505,000
13,647,000
13,911,000
13,420,000
13,010,000
12,876,000
12,843,000
12,455,000
12,590,000
13,431,000
14,341,000
15,294,000
15,727,000
15,289,000
14,665,000
14,463,000
14,113,000
13,467,000
12,280,000
11,587,000
11,733,000
12,133,000
12,866,000
13,041,000
12,896,000
12,827,000
13,324,000
14,068,000
15,451,000
27.3%
26.9
25.6
25.0
23.1
23.0
21.0
17.6
16.6
15.6
14.0
15.1
15.3
15.1
14.4
15.4
17.1
16.0
16.2
15.9
16.4
18.3
20.0
21.9
22.3
21.5
20.7
20.5
20.3
19.5
19.6
20.6
21.8
22.3
22.7
21.8
20.8
20.5
19.9
18.9
17.1
16.2
16.3
16.7
17.6
17.8
17.6
17.4
18.0
19.0
20.7
Number of
children *
under 6
who are poor
n/a
n/a
n/a
n/a
n/a
n/a
n/a
n/a
n/a
n/a
3,298,000
3,561,000
3,499,000
3,276,000
3,097,000
3,294,000
3,460,000
3,270,000
3,326,000
3,184,000
3,415,000
4,030,000
4,422,000
4,821,000
5,122,000
4,938,000
4,832,000
4,619,000
4,852,000
5,032,000
5,071,000
5,198,000
5,483,000
5,781,000
6,097,000
5,878,000
5,670,000
5,333,000
5,049,000
4,775,000
4,162,000
4,066,000
4,188,000
4,296,000
4,654,000
4,747,000
4,784,000
4,830,000
5,101,000
5,295,000
5,983,000
Poverty
rate for
children *
under 6
n/a
n/a
n/a
n/a
n/a
n/a
n/a
n/a
n/a
n/a
15.3%
16.6
16.9
16.1
15.7
16.9
18.2
17.7
18.1
17.2
17.8
20.5
22.0
23.3
24.6
23.4
22.6
21.6
22.4
22.6
22.5
23.0
24.0
25.0
25.6
24.5
23.7
22.7
21.6
20.6
18.4
17.8
18.2
18.5
19.8
20.0
20.0
20.0
20.8
21.3
23.8
* Related children in families
Source: U.S. Department of Commerce, Bureau of the Census, Income, Poverty and Health Insurance in the United States: 2009, Table 6.
B-4
Children’s Defense Fund
Minority children historically have been at greater risk of being poor. A Black child still has the greatest
chance of being poor, but in 2009 Hispanic children experienced the largest single-year increase in poverty.
Poverty Trends Among Children, by Race/Ethnicity, 1959–2009
Year
1959
1960
1961
1962
1963
1964
1965
1966
1967
1968
1969
1970
1971
1972
1973
1974
1975
1976
1977
1978
1979
1980
1981
1982
1983
1984
1985
1986
1987
1988
1989
1990
1991
1992
1993
1994
1995
1996
1997
1998
1999
2000
2001
2002
2003
2004
2005
2006
2007
2008
2009
All Children
Number
(in 1,000s) Percent
17,552
17,634
16,909
16,963
16,005
16,051
14,676
12,389
11,656
10,954
9,691
10,440
10,551
10,284
9,642
10,156
11,104
10,273
10,288
9,931
10,377
11,543
12,505
13,647
13,911
13,420
13,010
12,876
12,843
12,455
12,590
13,431
14,341
15,294
15,727
15,289
14,665
14,463
14,113
13,467
12,280
11,587
11,733
12,133
12,866
13,041
12,896
12,827
13,324
14,068
15,451
27.3%
26.9
25.6
25.0
23.1
23.0
21.0
17.6
16.6
15.6
14.0
15.1
15.3
15.1
14.4
15.4
17.1
16.0
16.2
15.9
16.4
18.3
20.0
21.9
22.3
21.5
20.7
20.5
20.3
19.5
19.6
20.6
21.8
22.3
22.7
21.8
20.8
20.5
19.9
18.9
17.1
16.2
16.3
16.7
17.6
17.8
17.6
17.4
18.0
19.0
20.7
White, non-Hispanic
Black
Number
Number
(in 1,000s) Percent (in 1,000s) Percent
n/a
n/a
n/a
n/a
n/a
n/a
n/a
n/a
n/a
n/a
n/a
n/a
n/a
n/a
n/a
4,820
5,342
4,799
4,714
4,506
4,730
5,510
5,946
6,566
6,649
6,156
5,745
5,789
5,230
4,888
5,110
5,532
5,918
6,017
6,255
5,823
5,115
5,072
5,204
4,822
4,155
4,018
4,194
4,090
4,233
4,519
4,254
4,208
4,255
4,364
4,850
n/a
n/a
n/a
n/a
n/a
n/a
n/a
n/a
n/a
n/a
n/a
n/a
n/a
n/a
n/a
9.5%
10.8
9.8
9.9
9.6
10.1
11.8
12.9
14.4
14.8
13.7
12.8
13.0
11.8
11.0
11.5
12.3
13.1
13.2
13.6
12.5
11.2
11.1
11.4
10.6
9.4
9.1
9.5
9.4
9.8
10.5
10.0
10.0
10.1
10.6
11.9
n/a
n/a
n/a
n/a
n/a
n/a
n/a
n/a
n/a
n/a
n/a
n/a
n/a
n/a
n/a
3,755
3,925
3,787
3,888
3,830
3,833
3,961
4,237
4,472
4,398
4,413
4,157
4,148
4,385
4,296
4,375
4,550
4,755
5,106
5,125
4,906
4,761
4,519
4,225
4,151
3,813
3,581
3,492
3,645
3,877
3,788
3,841
3,777
3,904
3,878
4,033
n/a
n/a
n/a
n/a
n/a
n/a
n/a
n/a
n/a
n/a
n/a
n/a
n/a
n/a
n/a
39.8%
41.7
40.6
41.8
41.5
41.2
42.3
45.2
47.6
46.7
46.6
43.6
43.1
45.1
43.5
43.7
44.8
45.9
46.6
46.1
43.8
41.9
39.9
37.2
36.7
33.2
31.2
30.2
32.3
34.1
33.7
34.5
33.4
34.5
34.7
35.7
Asian
Number
(in 1,000s) Percent
n/a
n/a
n/a
n/a
n/a
n/a
n/a
n/a
n/a
n/a
n/a
n/a
n/a
n/a
n/a
n/a
n/a
n/a
n/a
n/a
n/a
n/a
n/a
n/a
n/a
n/a
n/a
n/a
455
474
392
374
360
363
375
318
564
571
628
564
381
420
369
315
344
281
317
360
374
446
463
n/a
n/a
n/a
n/a
n/a
n/a
n/a
n/a
n/a
n/a
n/a
n/a
n/a
n/a
n/a
n/a
n/a
n/a
n/a
n/a
n/a
n/a
n/a
n/a
n/a
n/a
n/a
n/a
23.5%
24.1
19.8
17.6
17.5
16.4
18.2
18.3
19.5
19.5
20.3
18.0
11.9
12.7
11.5
11.7
12.5
9.9
11.1
12.2
12.5
14.6
14.0
Hispanic*
Number
(in 1,000s) Percent
n/a
n/a
n/a
n/a
n/a
n/a
n/a
n/a
n/a
n/a
n/a
n/a
n/a
n/a
n/a
n/a
n/a
1,443
1,422
1,384
1,535
1,749
1,925
2,181
2,312
2,376
2,606
2,507
2,670
2,631
2,603
2,865
3,094
3,637
3,873
4,075
4,080
4,237
3,972
3,837
3,693
3,522
3,570
3,782
4,077
4,098
4,143
4,072
4,482
5,010
5,610
n/a
n/a
n/a
n/a
n/a
n/a
n/a
n/a
n/a
n/a
n/a
n/a
n/a
n/a
n/a
n/a
n/a
30.2%
28.3
27.6
28.0
33.2
35.9
39.5
38.1
39.2
40.3
37.7
39.3
37.6
36.2
38.4
40.4
40.0
40.9
41.5
40.0
40.3
36.8
34.4
30.3
28.4
28.0
28.6
29.7
28.9
28.3
26.9
28.6
30.6
33.1
* Persons of Hispanic origin can be of any race.
Source: U.S. Department of Commerce, Bureau of the Census, Current Population Survey, 2009 Annual Social and Economic Supplements, Table 3. Poverty
Status of People, by Age, Race, and Hispanic Origin: 1959 to 2009. Available at http://www.census.gov/hhes/www/poverty/data/historical/people.html.
Note: Starting in 2002, the Census Bureau permitted persons to identify as more than one race, therefore membership in racial groups shown before 2002
may overlap and are not directly comparable to later data. The race data in this chart refers to children who are White alone (no other race) non Hispanic,
Black alone, and Asian alone.
State of America’s Children® 2011
B-5
Our youngest children are most at risk of being poor, at the same time that their brains
are rapidly developing and attention to their developmental needs is critical.
Trends in Child Poverty Rate, by Age Group, 1969–2009
30
25
23.8%
20.7%
Percent poor
20
Children under 6
Children under 18
15
10
0
1969
1973
1977
1981
1985
1989
1993
1997
2001
2005
2009
Source: U.S. Department of Commerce, Bureau of the Census. Table 6. People With Income Below Specified Ratios of Their Poverty Thresholds by
Selected Characterstics: 2009
Children are more likely to be poor than any other age group. Nearly four million more
Americans fell into poverty in 2009; nearly 1.5 million were children.
Trends in Poverty Rate, by Age Group, 1959–2009
35
30
Percent poor
65 years and older
25
Children under 18
20.7%
20
15
12.9%
18-64 years old
10
8.9%
0
1959
1964
1969
1974
1979
1984
1989
1994
1999
2004
Source: U.S. Department of Commerce, Bureau of the Census, 2010 Current Population Survey, Annual Social and Economic Supplements, Table
3, available at http://www.census.gov/hhes/www/poverty/data/historical/people.html.
B-6
Children’s Defense Fund
2009
In 2009 one in every five children – and one in four children under age five – lived in poverty.
Children of color suffer disproportionately from poverty. Similar trends in race and age
are found for children living in extreme poverty.
Children Living in Poverty, by Age and Race, 2009
50
Under 18
Under 5
41.9%
40
35.7%
35.0%
Percent in poverty
33.1%
30
24.5%
20.7%
20
14.7%
14.0% 14.3%
11.9%
10
0
All children
White, non-Hispanic
Black
Hispanic*
Asian
Children Living in Extreme Poverty, by Age and Race, 2009
25
21.6%
Percent in extreme poverty by race
Under 18
20
Under 5
17.9%
15.8%
15
14.1%
11.5%
10
9.3%
8.4%
6.9%
6.3%
5.0%
5
0
All children
White, non-Hispanic
Black
Hispanic*
Asian
* Persons of Hispanic origin can be of any race.
Source: U.S. Department of Commerce, Bureau of the Census, Current Population Survey, 2010 Annual Social and Economic Supplement.
State of America’s Children® 2011
B-7
The poorest children are preschool children of color living in female-headed
families. Two-thirds of children in poverty are living in working families.
Poor Children in America: A Portrait
Number of
Poor Children
(thousands)
2009
2009
1973
15,451
20.7
14.4
White1
Black1
Asian and Pacific Islander1
Hispanic (may be any race)2
Non-Hispanic White2
9,938
4,033
463
5,610
4,850
17.7
35.7
14.0
33.1
11.9
n/a
n/a
n/a
n/a
n/a
South
All other regions
6,276
9,176
22.4
19.7
19.7
11.6
Central city
Suburb
Rural (nonmetropolitan)
6,689
6,076
2,687
27.8
15.5
23.5
20.4
7.8
16.6
Children related to head of household
14,807
20.1
14.2
White1
Black1
Asian and Pacific Islander1
Hispanic (may be any race)2
Non-Hispanic White2
9,457
3,930
448
5,430
4,524
17.1
35.3
13.7
32.5
11.2
9.7
40.6
n/a
27.8
n/a
In female headed family
All other family types
7,962
6,845
44.3
12.3
52.1
7.6
10,213
4,376
8,001
2,951
15.0
8.0
13.8
7.4
n/a
n/a
8.7
4.1
5,983
8,791
23.8
18.2
15.7
13.6
24,684
3,433
12.9
8.9
8.3
16.3
All persons younger than 18
Any family member works
Full time year round
Head of family works
Full time year round
Under age 6
Ages 6-17
Comparison: Adults 18-64
Seniors 65+
Percent of Children
Who Are Poor
1 Starting with poverty data for 2002, the Census Bureau permits persons to choose more than one race; racial
groups shown here may overlap.
2
Persons of Hispanic origin may be of any race. White non-Hispanic means White alone (no other race) and not
of Hispanic origin.
n/a — Not available.
Note: Poverty estimates differ based on the source of the Census data. Census data on poverty is collected through
both the American Community Survey (ACS) and the Current Population Survey (CPS). The CPS provides the most
frequent national data on poverty and is therefore the official source of national poverty estimates. The ACS uses a
larger sample size and is therefore preferred for state-level poverty data.
Source: U.S. Department of Commerce, Bureau of the Census, Current Population Survey, 2010 Annual Social and
Economic Supplement and 1974 March Supplement. Calculations by Children’s Defense Fund.
B-8
Children’s Defense Fund
More than half of all poor children live in eight states and more than half of all poor Hispanic
children live in just three states. The majority of poor Black children are in nine states.
States Where the Majority of Poor Children Live
All
Poor Children
Arizona
White
Black
Hispanic
X
American Indian,
Alaskan Native
Asian, Pacific
Islander
Two or more
races
X
X
X
California
X
X
X
Florida
X
X
Georgia
X
Illinois
X
X
X
X
Michigan
X
X
X
X
X
X
X
New Mexico
New York
X
X
X
North Carolina
Ohio
X
X
X
X
X
X
X
X
X
X
Oklahoma
X
X
Pennsylvania
Texas
Louisiana
X
X
X
X
X
X
X
X
X
South Dakota
X
Montana
X
State of America’s Children® 2011
B-9
States Where More than Half of All Poor Children Live
California
Texas
New York
Florida
Illinois
Ohio
Georgia
Michigan
Number
poor
Percent
poor
1,846,741
1,661,402
868,354
851,803
591,398
584,310
568,324
519,828
19.9%
24.4
20.0
21.3
18.9
21.9
22.3
22.5
States With the Largest Percentages of Poor Children
Mississippi
District of Columbia
Arkansas
Kentucky
New Mexico
Alabama
Texas
South Carolina
Louisiana
Tennessee
West Virginia
Arizona
Michigan
North Carolina
Georgia
Oklahoma
Ohio
Montana
Florida
Missouri
B-10
Children’s Defense Fund
Percent
poor
Number
poor
31.0%
29.4
27.2
25.6
25.3
24.7
24.4
24.4
24.2
23.9
23.6
23.4
22.5
22.5
22.3
22.2
21.9
21.4
21.3
20.7
232,628
33,133
189,198
255,416
128,111
274,906
1,661,402
259,429
268,036
349,851
88,610
398,060
519,828
504,937
568,324
200,623
584,310
46,398
851,803
290,959
Poverty Guidelines, 2010
A family is poor if its income falls below the federal poverty guideline for its family size:
Size
of family
1
2
3
4
5
6
7
8
Poverty
level
$ 10,830
14,570
18,310
22,050
25,790
29,530
33,270
37,010
Extreme
poverty level
$ 5,415
7,285
9,155
11,025
12,895
14,765
16,635
18,505
The poverty guidelines are used to determine eligibility for public benefits. They are adjusted annually to
account for inflation. Except for Alaska and Hawaii, which have slightly higher levels, there are no adjustments
for differences in living costs from state to state. For families with more than eight persons, the federal government
adds $3,740 for each additional person.
Source: Federal Register, Vol. 75, No. 148 (August 3, 2010), pp. 45628-45629. Calculations by Children’s Defense Fund.
State of America’s Children® 2011
B-11
Every fifth child in America is poor. The lottery of geography results in a child in Mississippi
being almost three times as likely to be poor as a child in New Hampshire.
Child Poverty, by Age, 2009
Number Poor
Under age 18
Alabama
Alaska
Arizona
Arkansas
California
Colorado
Connecticut
Delaware
District of Columbia
Florida
Georgia
Hawaii
Idaho
Illinois
Indiana
Iowa
Kansas
Kentucky
Louisiana
Maine
Maryland
Massachusetts
Michigan
Minnesota
Mississippi
Missouri
Montana
Nebraska
Nevada
New Hampshire
New Jersey
New Mexico
New York
North Carolina
North Dakota
Ohio
Oklahoma
Oregon
Pennsylvania
Rhode Island
South Carolina
South Dakota
Tennessee
Texas
Utah
Vermont
Virginia
Washington
West Virginia
Wisconsin
Wyoming
United States
Under age 5
Percent Poor
Ages 5–17
Under age 18
Under age 5
Ages 5–17
274,906
23,119
398,060
189,198
1,846,741
210,498
96,893
33,508
33,133
851,803
568,324
39,241
75,008
591,398
311,031
109,423
121,395
255,416
268,036
45,190
154,049
185,613
519,828
173,980
232,628
290,959
46,398
66,349
117,809
30,602
272,697
128,111
868,354
504,937
18,148
584,310
200,623
164,326
466,638
37,731
259,429
35,497
349,851
1,661,402
105,000
16,495
253,068
250,830
88,610
214,404
15,965
90,142
8,472
136,053
62,146
595,252
77,214
31,182
11,460
9,530
283,827
191,861
12,132
26,224
183,707
108,652
40,388
44,708
87,157
90,471
14,089
54,527
57,737
162,640
55,865
73,090
99,845
16,292
23,783
40,846
9,895
87,558
41,871
269,364
171,676
7,142
195,089
64,643
53,461
149,110
9,784
90,494
12,701
122,165
569,607
34,884
5,949
81,809
79,809
28,329
69,793
5,563
184,764
14,647
262,007
127,052
1,251,489
133,284
65,711
22,048
23,603
567,976
376,463
27,109
48,784
407,691
202,379
69,035
76,687
168,259
177,565
31,101
99,522
127,876
357,188
118,115
159,538
191,114
30,106
42,566
76,963
20,707
185,139
86,240
598,990
333,261
11,006
389,221
135,980
110,865
317,528
27,947
168,935
22,796
227,686
1,091,795
70,116
10,546
171,259
171,021
60,281
144,611
10,402
24.7%
12.8
23.4
27.2
19.9
17.4
12.1
16.5
29.4
21.3
22.3
13.8
18.1
18.9
20.0
15.7
17.6
25.6
24.2
17.1
11.6
13.1
22.5
14.1
31.0
20.7
21.4
15.2
17.6
10.8
13.5
25.3
20.0
22.5
13.0
21.9
22.2
19.2
17.1
16.9
24.4
18.5
23.9
24.4
12.2
13.3
13.9
16.2
23.6
16.7
12.6
29.0%
15.8
26.7
31.2
22.0
21.5
15.0
19.7
25.5
24.8
26.2
13.9
21.4
20.8
24.9
20.6
22.3
30.6
28.8
20.4
14.5
15.2
26.9
15.7
33.9
25.0
27.0
18.2
20.4
13.5
16.0
28.3
22.5
26.7
17.0
26.8
24.4
22.2
20.4
16.5
29.6
21.9
29.4
28.0
13.0
19.1
15.9
18.1
27.1
19.6
14.3
23.0%
11.5
21.9
25.0
19.0
15.6
11.1
15.2
31.4
19.9
20.8
13.8
16.7
18.1
18.0
13.8
15.7
23.6
22.4
16.0
10.4
12.4
21.0
13.4
29.8
19.0
19.3
14.0
16.4
9.8
12.5
24.0
19.0
20.9
11.3
20.0
21.3
18.0
15.9
17.0
22.3
17.1
21.7
22.9
11.8
11.3
13.1
15.5
22.3
15.6
11.8
14,656,962
4,849,988
9,806,974
20.0
23.2
18.7
Note: Poverty estimates differ based on the source of the Census data. Census data on poverty is collected through both the American Community Survey
(ACS) and the Current Population Survey (CPS). The CPS provides the most frequent national data on poverty and is therefore the official source of national
poverty estimates. The ACS uses a larger sample size and is therefore preferred for state level poverty data.
Source: U.S. Department of Commerce, Bureau of the Census, 2009 American Community Survey, Table B17001. Calculations by Children’s Defense Fund.
B-12
Children’s Defense Fund
About two in five poor children live in extreme poverty—$11,025 a year for a family of four—
$919 a month, $230 a week and $32 a day for four people.
Extreme Poverty Among Children, by Age, 2009
Number in Extreme Poverty
Alabama
Alaska
Arizona
Arkansas
California
Colorado
Connecticut
Delaware
District of Columbia
Florida
Georgia
Hawaii
Idaho
Illinois
Indiana
Iowa
Kansas
Kentucky
Louisiana
Maine
Maryland
Massachusetts
Michigan
Minnesota
Mississippi
Missouri
Montana
Nebraska
Nevada
New Hampshire
New Jersey
New Mexico
New York
North Carolina
North Dakota
Ohio
Oklahoma
Oregon
Pennsylvania
Rhode Island
South Carolina
South Dakota
Tennessee
Texas
Utah
Vermont
Virginia
Washington
West Virginia
Wisconsin
Wyoming
United States
Under age 18
Under age 6
Ages 6–17
125,187
9,629
180,736
83,330
729,817
94,866
44,752
14,609
21,192
367,870
251,138
14,839
28,882
267,286
137,978
44,221
46,790
122,274
116,581
19,424
70,317
87,851
247,891
78,116
105,450
144,043
22,795
24,414
50,548
12,744
120,840
52,005
418,433
228,250
8,011
274,916
86,092
69,436
206,248
17,904
122,506
14,606
164,244
719,676
42,583
7,631
121,538
108,682
41,889
88,771
4,238
48,697
3,566
74,628
34,064
281,108
42,968
16,788
6,227
6,484
143,995
102,201
4,753
12,617
105,102
60,196
17,929
21,928
50,862
51,696
7,548
30,347
32,274
95,250
28,600
41,237
58,235
10,832
10,372
20,495
4,664
44,790
21,879
164,686
96,972
3,513
112,811
35,702
26,791
85,358
4,748
50,489
6,766
70,538
305,533
18,234
3,204
47,150
41,472
18,238
35,007
2,079
76,490
6,063
106,108
49,266
448,709
51,898
27,964
8,382
14,708
223,875
148,937
10,086
16,265
162,184
77,782
26,292
24,862
71,412
64,885
11,876
39,970
55,577
152,641
49,516
64,213
85,808
11,963
14,042
30,053
8,080
76,050
30,126
253,747
131,278
4,498
162,105
50,390
42,645
120,890
13,156
72,017
7,840
93,706
414,143
24,349
4,427
74,388
67,210
23,651
53,764
2,159
6,484,069
2,621,623
3,862,446
Percent in Extreme Poverty
Under age 18
11.2%
5.3
10.6
12.0
7.9
7.8
5.6
7.2
18.8
9.2
9.9
5.2
7.0
8.5
8.9
6.3
6.8
12.3
10.5
7.4
5.3
6.2
10.7
6.3
14.0
10.3
10.5
5.6
7.5
4.5
6.0
10.3
9.6
10.2
5.7
10.3
9.5
8.1
7.6
8.0
11.5
7.6
11.2
10.6
4.9
6.1
6.7
7.0
11.2
6.9
3.3
8.8
Under age 6
13.2%
5.7
12.3
14.3
8.8
10.0
6.8
9.0
15.5
10.7
11.7
4.7
8.6
10.1
11.6
7.7
9.3
15.1
13.6
9.1
6.8
7.0
13.1
6.8
16.2
12.3
15.1
6.6
8.7
5.4
6.8
12.5
11.5
12.7
7.1
13.0
11.4
9.4
9.8
6.8
13.9
10.1
14.2
12.6
5.7
8.7
7.6
7.9
14.5
8.2
4.4
10.6
Ages 6–17
10.3%
5.1
9.7
10.7
7.4
6.6
5.1
6.2
20.8
8.4
8.9
5.5
6.1
7.8
7.5
5.7
5.5
10.8
8.9
6.6
4.5
5.8
9.6
6.1
13.0
9.2
8.2
5.0
6.9
4.1
5.6
9.1
8.7
8.9
5.0
9.0
8.6
7.4
6.5
8.6
10.3
6.3
9.7
9.5
4.5
5.1
6.2
6.6
9.5
6.3
2.7
8.0
Source: U.S. Department of Commerce, Bureau of the Census, 2009 American Community Survey, Table B17024. Calculations by Children's Defense Fund.
State of America’s Children® 2011
B-13
States Where More than Half of All Children
in Extreme Poverty Live
California
Texas
New York
Florida
Ohio
Illinois
Georgia
Michigan
Number in
extreme poverty
Percent in
extreme poverty
729,817
719,676
418,433
367,870
274,916
267,286
251,138
247,891
7.9%
10.6
9.6
9.2
10.3
8.5
9.9
10.7
States With the Largest Percentages of Children
Living in Extreme Poverty
Percent in
extreme poverty
District of Columbia
Mississippi
Kentucky
Arkansas
South Carolina
Alabama
Tennessee
West Virginia
B-14
Children’s Defense Fund
18.8%
14.0
12.3
12.0
11.5
11.2
11.2
11.2
Number in
extreme poverty
21,192
105,450
122,274
83,330
122,506
125,187
164,244
41,889
More than one in four children living in urban areas and one in four children in rural areas are
poor, but there are almost as many poor children in the suburbs as in urban areas.
Child Poverty, by Residence, 2009
Metropolitan Areas
Principal City
(urban areas)
Number
Number
Child
of all
of poor poverty
children
children
rate
Alabama
Alaska
Arizona
Arkansas
California
Colorado
Connecticut
Delaware
District of Columbia
Florida
Georgia
Hawaii
Idaho
Illinois
Indiana
Iowa
Kansas
Kentucky
Louisiana
Maine
Maryland
Massachusetts
Michigan
Minnesota
Mississippi
Missouri
Montana
Nebraska
Nevada
New Hampshire
New Jersey
New Mexico
New York
North Carolina
North Dakota
Ohio
Oklahoma
Oregon
Pennsylvania
Rhode Island
South Carolina
South Dakota
Tennessee
Texas
Utah
Vermont
Virginia
Washington
West Virginia
Wisconsin
Wyoming
United States
303,501
92,376
82,619
9,580
840,531
229,512
207,796
60,170
4,341,501
949,785
452,372
107,337
224,329
47,821
23,469
7,200
112,536
33,133
1,031,144
259,456
408,907
131,033
62,253
7,262
116,941
24,925
1,057,475
287,233
481,426
146,888
199,650
45,615
224,632
52,901
229,054
57,239
317,484
88,059
40,000
10,618
225,218
52,644
324,778
78,321
651,214
241,775
287,554
66,898
88,340
28,945
294,886
85,405
49,114
12,145
169,778
32,771
288,754
57,040
43,352
8,780
219,942
61,062
173,400
41,443
2,151,977
609,367
705,736
162,321
40,740
5,741
639,445
243,435
253,683
68,225
277,862
55,502
588,334
202,596
74,228
14,935
166,054
48,144
54,248
9,740
506,422
163,759
3,198,381
928,558
3,198,382
32,922
No principal city
452,094
94,581
448,337
84,301
42,131
11,681
368,659
106,209
26,536
2,859
23,732,168 6,261,419
30.4%
11.6
27.3
29.0
21.9
23.7
21.3
30.7
29.4
25.2
32.0
11.7
21.3
27.2
30.5
22.8
23.6
25.0
27.7
26.5
23.4
24.1
37.1
23.3
32.8
29.0
24.7
19.3
19.8
20.3
27.8
23.9
28.3
23.0
14.1
38.1
26.9
20.0
34.4
20.1
29.0
18.0
32.3
29.0
21.3
20.9
18.8
27.7
28.8
10.8
26.4
Not Principal City
(suburban areas)
Number Number
Child
of all
of poor
poverty
children children
rate
498,537
85,142
17.1%
39,734
3,990
10.0
734,589
124,814
17.0
224641
48,620
21.6
4774959
862,841
18.1
607525
73,493
12.1
510240
42,689
8.4
140,466
19,405
13.8
No suburban areas
2,752,961
530,117
19.3
1,697,302
299,883
17.7
134,250
19,314
14.4
156,179
23,439
15.0
1,717,874
223,508
13.0
745,584
95,872
12.9
201,668
17,736
8.8
255,271
28,194
11.0
359,444
67,491
18.8
500,822
94,135
18.8
116,751
13,487
11.6
1,039,730
91,599
8.8
1,085,743
107,292
9.9
1,272,068
189,931
14.9
655,757
59,685
9.1
247,770
46,757
18.9
770,609
116,133
15.1
26,780
2,962
11.1
92,935
7,546
8.1
317,269
51,893
16.4
142,675
10,333
7.2
1,805,776
211,635
11.7
155,696
43,483
27.9
1,881,155
192,118
10.2
897,511
159,622
17.8
27,026
1,521
5.6
1,513,156
221,369
14.6
332,160
52,025
15.7
397,629
64,540
16.2
1,727,273
193,079
11.2
149,461
22,796
15.3
653,270
130,119
19.9
36,869
3,116
8.5
589,773
93,344
15.8
2,866,225
533,348
18.6
612,769
56,764
9.3
34,141
3,178
9.3
1,135,885
108,498
9.6
920,683
125,336
13.6
169,016
29,015
17.2
591,093
56,468
9.6
No suburban areas
38,329,271
5,661,376
14.8
Non-Metropolitan Areas
(rural areas)
Number
Number
Child
of all
of poor
poverty
children
children
rate
311,741
97,388
58,056
9,549
129,364
43,734
264,302
80,408
168,832
34,115
151,987
29,668
65,109
6,383
39,318
6,903
No rural areas
210,059
62,230
438,523 137,408
87,745
12,665
140,599
26,644
355,501
80,657
331,751
68,271
295,862
46,072
209,118
40,300
409,432 130,686
288,580
85,842
107,321
21,085
65,847
9,806
No rural areas
386,924
88,122
414,722 156,926
165,213
67,386
339,315
89,421
140,697
31,291
172,719
26,032
64,924
8,876
97,783
11,489
No rural areas
178,046
43,185
318,715
66,869
636,433 182,994
71,890
10,886
521,126 119,506
317,200
80,373
181,564
44,284
407,767
70,963
No rural areas
242,134
81,166
100,584
22,641
370,300
92,748
736,940 199,496
93,785
15,314
80,986
12,146
228,278
49,989
177,063
41,193
164,263
47,914
324,750
51,727
87,818
11,405
11,285,965 2,734,167
31.2%
16.4
33.8
30.4
20.2
19.5
9.8
17.6
29.6
31.3
14.4
19.0
22.7
20.6
15.6
19.3
31.9
29.7
19.6
14.9
22.8
37.8
40.8
26.4
22.2
15.1
13.7
11.7
24.3
21.0
28.8
15.1
22.9
25.3
24.4
17.4
33.5
22.5
25.0
27.1
16.3
15.0
21.9
23.3
29.2
15.9
13.0
24.2
Source: U.S. Department of Commerce, Bureau of the Census, 2009 American Community Survey, Table B17001. Calculations by Children’s Defense Fund.
State of America’s Children® 2011
B-15
More Hispanic children are poor than any other racial or ethnic minority. More than one-third
of Black and American Indian/Alaska Native children are poor.
Child Poverty, by Race/Ethnicity, 2009
White
Percent
Number
Alabama
Alaska
Arizona
Arkansas
California
Colorado
Connecticut
Delaware
District of Columbia
Florida
Georgia
Hawaii
Idaho
Illinois
Indiana
Iowa
Kansas
Kentucky
Louisiana
Maine
Maryland
Massachusetts
Michigan
Minnesota
Mississippi
Missouri
Montana
Nebraska
Nevada
New Hampshire
New Jersey
New Mexico
New York
North Carolina
North Dakota
Ohio
Oklahoma
Oregon
Pennsylvania
Rhode Island
South Carolina
South Dakota
Tennessee
Texas
Utah
Vermont
Virginia
Washington
West Virginia
Wisconsin
Wyoming
113,280
10,843
265,955
101,781
978,194
145,606
42,468
17,374
1,417
452,792
209,499
7,194
65,245
265,997
194,726
85,821
82,746
195,654
76,590
37,120
51,229
99,043
282,916
99,408
67,700
187,277
31,352
40,637
80,121
23,984
128,766
75,603
362,559
214,487
10,345
356,215
107,813
117,871
258,550
19,453
95,138
17,050
198,191
1,079,651
80,076
14,038
111,818
156,104
78,005
132,279
12,753
15.8%
10.0
21.3
20.3
18.2
15.3
7.3
13.1
4.8
16.4
14.6
11.9
17.7
12.9
15.4
14.0
14.7
23.1
12.2
15.4
7.1
9.2
16.4
9.9
17.2
16.9
17.5
11.2
16.5
9.3
9.7
22.2
13.6
15.0
8.8
16.8
17.6
17.4
12.3
11.8
14.6
11.4
18.4
22.4
10.8
12.2
9.5
13.8
22.5
12.5
11.5
United States
7,940,734
15.7
Black
Number
Percent
141,599
905
23,953
63,703
165,641
19,481
22,730
12,769
30,400
311,256
273,914
1,518
1,250
207,077
75,192
8,781
16,749
38,027
174,593
4,295
80,878
32,059
176,793
34,765
157,875
75,728
451
11,386
17,635
3,001
81,114
5,119
241,446
189,564
1,520
175,074
30,343
5,884
135,384
6,021
138,624
766
123,015
254,056
5,131
366
108,953
21,323
6,083
51,244
853
3,766,287
42.3%
10.9
30.5
49.0
29.4
36.0
25.5
26.1
42.8
38.0
33.1
20.8
28.8
40.1
45.3
41.1
40.4
44.1
42.2
54.1
19.4
28.2
46.7
46.6
48.3
40.4
58.8
48.4
30.5
51.1
26.1
39.7
30.9
36.6
68.2
46.8
40.4
30.6
37.4
33.0
41.4
25.4
42.4
31.9
32.6
21.4
27.7
33.8
46.4
47.6
53.3
36.3
One Race Only
American Indian,
Asian,
Alaska Native
Pacific Islander
Number
Percent
Number
Percent
2,486
6,446
43,128
1,081
22,098
2,121
589
365
—
4,991
1,169
—
1,633
1,440
245
1,848
2,276
1,757
2,826
968
—
464
5,754
7,117
1,274
502
10,620
2,082
2,591
—
1,500
19,695
5,142
9,868
5,029
1,388
17,539
4,115
615
—
782
15,416
—
9,875
3,515
315
1,520
7,955
—
5,796
485
239,582
45.7%
23.5
45.2
20.4
30.7
21.5
34.4
47.8
—
35.6
21.3
—
22.6
28.3
11.3
51.6
35.6
64.0
48.7
55.8
—
24.4
46.6
43.4
35.9
17.8
48.1
34.5
26.5
—
26.7
34.7
38.5
38.2
39.8
32.5
27.6
27.8
18.3
—
24.1
60.1
—
26.2
33.8
49.8
24.5
33.2
—
38.9
10.8
1,337
2,184
4,260
691
116,892
2,104
1,902
—
—
12,725
10,503
10,613
552
13,915
3,388
562
1,259
845
1,388
—
4,287
8,409
13,120
13,214
881
2,206
—
1,743
4,027
541
12,700
847
56,652
6,473
—
5,362
3,496
6,823
11,926
1,233
877
618
1,879
28,664
3,297
351
6,255
12,314
—
6,138
—
10.1%
29.1
10.6
8.5
11.9
6.6
6.2
—
—
12.3
14.2
11.1
13.6
10.5
15.0
5.4
8.6
7.3
7.8
—
6.7
11.4
20.6
22.0
22.7
10.1
—
19.5
10.4
7.4
7.7
10.9
18.7
13.3
—
12.1
24.4
19.5
15.3
15.6
6.5
25.1
8.8
12.4
15.3
20.4
7.1
12.7
—
16.5
—
35.1
402,217
12.6
* Persons of Hispanic origin can be of any race.
— Number of poor children in sample too small to calculate reliable counts or race.
Source: U.S. Department of Commerce, Bureau of the Census, 2009 American Community Survey, Table B17020, parts A through I.
Calculations by Children’s Defense Fund
B-16
Children’s Defense Fund
Child Poverty, by Race/Ethnicity, 2009
Other
Number
6,245
—
43,131
12,076
484,894
27,537
22,818
949
—
40,345
58,673
589
2,197
73,311
16,579
4,602
5,989
4,679
2,641
872
8,693
30,974
12,663
7,327
2,349
7,132
—
6,616
6,564
1,354
36,519
20,391
162,768
57,967
—
11,290
11,537
18,405
33,333
9,020
10,852
—
12,355
243,130
8,856
—
9,993
33,733
—
6,444
1,039
1,582,217
Percent
41.8%
—
29.6
45.7
29.7
34.0
39.4
20.1
—
28.6
49.1
17.8
22.0
25.0
37.5
27.1
30.4
36.8
21.7
75.2
15.3
42.4
33.2
28.0
34.2
31.7
—
33.8
17.0
35.0
26.4
32.7
38.6
47.6
—
39.9
33.7
35.5
43.1
40.4
48.8
—
43.9
36.4
25.1
—
19.1
36.3
—
32.3
37.6
32.8
Two or more
races
Number
Percent
9,959
2,549
17,633
9,767
79,022
13,649
6,386
1,723
—
29,694
14,440
19,025
4,104
29,658
20,901
7,809
12,376
14,454
9,851
1,685
8,519
14,664
28,582
12,149
2,549
18,114
2,909
3,885
6,871
1,698
12,098
6,456
39,787
26,361
1,070
34,981
29,895
11,228
26,253
1,783
12,706
1,262
14,190
46,026
4,125
1,327
14,529
19,401
4,188
12,503
794
725,925
Hispanic*
Number
Percent
36.1%
10.2
18.8
39.8
12.2
17.0
15.4
17.8
—
18.9
17.9
16.3
20.9
23.3
33.9
25.3
29.7
37.7
31.6
17.6
13.5
20.3
29.8
20.8
15.3
29.6
24.6
25.5
16.7
21.0
15.0
24.6
23.7
27.4
19.3
32.7
28.6
18.9
26.8
20.4
34.6
15.6
28.5
18.6
11.6
30.2
14.9
14.3
34.3
25.6
11.8
26,825
3,150
247,626
30,759
1,281,747
122,646
44,729
6,500
1,796
266,240
131,257
8,015
24,194
179,397
48,841
16,295
31,643
17,620
10,004
1,941
19,976
72,193
54,928
29,148
7,979
26,694
5,384
17,375
64,350
3,349
110,763
83,732
313,268
119,502
—
45,575
42,144
50,091
82,764
15,406
31,386
2,126
38,679
1,130,570
31,959
398
31,294
86,769
1,291
37,031
3,612
43.6%
20.8
33.3
43.2
27.5
34.0
31.4
26.8
13.0
25.3
42.0
18.9
35.3
25.8
36.7
31.6
31.6
38.7
20.7
32.8
14.6
37.6
36.1
32.4
34.4
34.4
55.8
29.0
24.8
26.9
25.4
30.1
33.0
42.3
—
37.7
35.3
29.5
35.2
35.2
40.8
29.0
37.3
35.2
22.9
12.9
16.5
32.0
16.5
32.5
23.8
20.4
5,061,196
30.8
Alabama
Alaska
Arizona
Arkansas
California
Colorado
Connecticut
Delaware
District of Columbia
Florida
Georgia
Hawaii
Idaho
Illinois
Indiana
Iowa
Kansas
Kentucky
Louisiana
Maine
Maryland
Massachusetts
Michigan
Minnesota
Mississippi
Missouri
Montana
Nebraska
Nevada
New Hampshire
New Jersey
New Mexico
New York
North Carolina
North Dakota
Ohio
Oklahoma
Oregon
Pennsylvania
Rhode Island
South Carolina
South Dakota
Tennessee
Texas
Utah
Vermont
Virginia
Washington
West Virginia
Wisconsin
Wyoming
United States
State of America’s Children® 2011
B-17
17
Poverty Rate for Young Black Families
The poverty rate for young Black families in 2009 with children in the home was 3.5 times as high as the poverty
rate for childless Black families.
While the overall family poverty rate for young Black families in 2009 was quite high (40%), the incidence of family
poverty varied quite considerably across different types of families. Among childless, married couples, with a family
householder that held a bachelor’s or higher degree, the poverty rate was only 3.5 percent (Chart 8). It rose to 9
percent if the family head only held a high school diploma and to 20 percent if the householder lacked a high
school diploma or a GED. Among married couple families with children present in the home and a family head
lacking a high school diploma, the poverty rate was close to 50 percent. Almost three of every four Black families
with a single mother who lacked a high school diploma or GED was poor in 2009.
Income of All Young Families and Young Black Families by Income Inadequacy Problem, 2009
Percent poor
All young families
Young Black families
With no children under 18
With one or more own children under 18
25.8%
40.4
12.6
45.2
Percent poor
or near poor
Percent
low-income
31.1%
49.5
17.6
55.0
48.0%
67.2
32.4
73.2
Percent of Young Black Families* Living in Poverty in 2009,
By Type of Family, Educational Attainment of Family Householder,
and Presence of Children in the Home
80
73.8%
No children
70
One or more children
58.6%
Percent
60
48.8%
50
40
30
19.8%
20
9.0%
10
3.5%
0
Married-couple,
bachelor’s degree
or higher
Married-couple,
high school
graduate
Married-couple,
no high school
diploma or GED
Married-couple,
no high school
diploma or GED
Single mother,
high school graduate
or GED
Single mother, no high
school graduate
or GED
*Head of household younger than 30
Source: Sum, A. et al., Deteriorating Employment Rates and Incomes Threaten the Futures of Young Workers and Young Families; Black
Young People and Young Families Fare the Worst, Center for Labor Market Studies, Northeastern University. December 2010.
B-18
Children’s Defense Fund
Family Structure
A
ll children deserve safe, permanent and loving families. Family structure and stability impact the
availability of resources—both emotional and financial—for children. Single parents often need
extra support and teen parents even more. The birth rate for Hispanic teens ages 15 – 19 is twice that
for White teens, but just above that for Black and American Indian teens. Often grandparents or other
relatives step in when parents cannot care for their children—parents may have died, be incarcerated or
struggling with substance abuse or other health challenges. Some children end up in foster care.
Movement from home to home and family to family can increase risks for the children as they seek
needed stability.
• About 70 percent of all children—but fewer than 40 percent of Black children—live
with two parents. Twenty-three percent of all children and 50 percent of Black children
live with their mother only.
• Black children are more than twice as likely as White children, almost twice as likely
as Hispanic children, and three-and-a-half times more likely than Asian/Pacific
Islander children to live with neither parent.
• Almost five percent of Black children live with grandparents; Black children are twice
as likely as all children to live with their grandparents only or other relatives.
• More than 940,000 grandchildren are being raised by grandparents with neither of
their parents present.
• Sixty-one percent of grandparents who report being responsible for their grandchildren
are in the labor force; 20 percent of grandparents raising grandchildren live in poverty.
• Black children are more than seven times as likely and Hispanic children are more
than two-and-a-half times as likely as White children to have a parent in prison.
C-2
Children’s Defense Fund
Almost 70 percent of all children live with two parents. About half of Black children and
one-fourth of Hispanic children live with their mother only.
Living Arrangements of Children, 2010
Total,
all races
White
Black
Asian
Hispanic
Living with two parents
69.4%
74.9%
39.2%
85.5%
67.0%
Living with mother only
23.1
18.3
49.7
10.1
26.3
Living with father only
3.4
3.5
3.6
2.2
2.7
Living with neither parent
4.1
3.4
7.5
2.1
4.0
Grandparents only
2.2
1.8
4.6
0.7
1.9
Other relatives only
0.9
0.6
1.8
0.7
1.1
Nonrelatives only
0.8
0.8
0.8
0.4
0.7
Other arrangement
0.2
0.2
0.2
0.3
0.2
Source: U.S. Department of Commerce, Bureau of the Census, March 2010 Current Population Survey, America’s Families and Living Arrangements:
2010, Table C9, Children by Presence and Type of Parents, Race, and Hispanic Origin: 2010, at http://www.census.gov/population/www/socdemo/hhfam/cps2010.html.
Black children are almost twice as likely as White or Hispanic children (and almost
three-and-a-half times as likely as Asian children) to live with neither parent.
Children Living with Neither Parent, 2010
8
7.5%
Percent
6
4.1%
4.0%
4
3.4%
2.1%
2
0
Total, All races
Black
Hispanic
White
Asian
Source: U.S. Department of Commerce, Bureau of the Census, March 2010 Current Population Survey, America’s
Families and Living Arrangements: 2010, Table C9, Children by Presence and Type of Parents, Race, and Hispanic
Origin: 2010, at http://www.census.gov/population/www/socdemo/hh-fam/cps2010.html.
State of America’s Children® 2011
C-3
The teen birth rate rose slightly in 2006 and 2007 for the first time in 15 years,
but then declined again in 2008.
Trends in Teen Birth Rates, 1980–2008
Births per 1,000 females ages 15–19
120
100
Black
Hispanic*
American Indian
77.5
80
63.4
60
58.4
All Races
41.5
40
37.8
Whtie
20
16.2
Asian
0
1980
1984
1989
1994
1999
2004
2008
American
Indian
Asian,
Pacific
Islander
Hispanic*
97.8
94.5
94.3
93.9
94.1
95.4
95.8
97.6
102.7
111.5
112.8
114.8
111.3
107.3
102.9
94.4
89.6
86.3
83.5
79.1
77.4
71.8
66.6
63.8
63.3
62.0
64.6
82.2
78.4
83.5
84.2
81.5
79.2
78.1
77.2
77.5
82.7
81.1
84.1
82.4
79.8
76.4
72.9
68.2
65.2
64.7
59.9
58.3
56.3
53.8
53.1
52.5
52.7
55.0
26.2
28.5
29.4
26.1
24.2
23.8
22.8
22.4
24.2
25.6
26.4
27.3
26.5
26.5
26.6
25.5
23.5
22.3
22.2
21.4
20.5
19.8
18.3
17.4
17.3
17.0
17.0
n/a
n/a
n/a
n/a
n/a
n/a
n/a
n/a
n/a
100.8
100.3
104.6
103.3
101.8
101.3
99.3
94.6
89.6
87.9
86.8
87.3
86.4
83.4
82.3
82.6
81.7
83.0
64.9
63.4
59.3
58.4
16.9
16.2
81.8
77.5
All
Races
White
Black
1980
1981
1982
1983
1984
1985
1986
1987
1988
1989
1990
1991
1992
1993
1994
1995
1996
1997
1998
1999
2000
2001
2002
2003
2004
2005
2006
53.0
52.2
52.4
51.4
50.6
51.0
50.2
50.6
53.0
57.3
59.9
61.8
60.3
59.0
58.2
56.0
53.5
51.3
50.3
48.8
47.7
45.3
43.0
41.6
41.1
40.5
41.9
45.4
44.9
45.0
43.9
42.9
43.3
42.3
42.5
44.4
47.9
50.8
52.6
51.4
50.6
50.5
49.5
47.5
45.5
44.9
44.0
43.2
41.2
39.4
38.3
37.7
37.0
38.2
2007
2008
2009
42.5
41.5
39.1**
38.8
37.8
*Persons of Hispanic origin can be of any race; Hispanic data prior to 1989 not available.
** Preliminary data. No preliminary race data available for teen birth rates in 2009.
Sources: U.S. Department of Health and Human Services, National Center for Health Statistics, National Vital Statistics Reports, Vol. 59, No. 1
(December, 2010), Births: Final Data for 2008, Table 4. Available at http://www.cdc.gov/nchs/data/nvsr/nvsr59/nvsr59_01.pdf.
C-4
Children’s Defense Fund
Teen birth rates declined in all states between 1995 and 2000 but were higher in 2008 than in
2000 in seven states. There are great disparities among the states in teen birth rates, with a high of
65.7 births per 1,000 teens in Mississippi to a low of 19.8 births per 1,000 teens in New Hampshire.
Teen Birth Rates1
1990
1995
2000
2005
2006
2007
2008
Alabama
Alaska
Arizona
Arkansas
California
Colorado
Connecticut
Delaware
District of Columbia
Florida
Georgia
Hawaii
Idaho
Illinois
Indiana
Iowa
Kansas
Kentucky
Louisiana
Maine
Maryland
Massachusetts
Michigan
Minnesota
Mississippi
Missouri
Montana
Nebraska
Nevada
New Hampshire
New Jersey
New Mexico
New York
North Carolina
North Dakota
Ohio
Oklahoma
Oregon
Pennsylvania
Rhode Island
South Carolina
South Dakota
Tennessee
Texas
Utah
Vermont
Virginia
Washington
West Virginia
Wisconsin
Wyoming
71.0
65.3
75.5
80.1
70.6
54.5
38.8
54.5
93.1
69.1
75.5
61.2
50.6
62.9
58.6
40.5
56.1
67.6
74.2
43.0
53.2
35.1
59.0
36.3
81.0
62.8
48.4
42.3
73.3
33.0
40.5
78.2
43.6
67.6
35.4
57.9
66.8
54.6
44.9
43.9
71.3
46.8
72.3
75.3
48.5
34.0
52.9
53.1
57.3
42.6
56.3
68.5
54.5
73.5
71.9
66.8
52.3
38.6
54.6
85.2
60.2
69.8
48.8
48.7
58.4
56.6
38.3
52.0
62.3
69.9
33.9
47.2
33.3
49.1
32.5
79.2
55.1
42.4
37.8
73.4
30.3
37.7
74.0
42.2
63.0
32.9
53.4
63.7
50.1
40.9
39.8
62.8
40.9
66.6
75.6
40.9
28.1
48.4
48.0
52.7
37.9
47.9
60.7
49.0
67.9
66.2
47.0
51.3
31.1
48.0
53.2
51.1
62.8
46.1
42.9
48.0
49.1
34.2
46.1
55.1
62.1
29.2
41.3
25.9
40.2
30.1
70.1
48.7
36.7
37.7
63.0
23.3
31.8
65.6
33.2
58.6
27.3
46.0
59.7
42.8
34.0
33.6
58.0
38.1
59.5
68.9
38.3
23.4
40.9
39.2
46.5
35.2
41.7
49.7
37.3
58.2
59.1
38.8
42.6
23.3
44.0
63.4
42.4
52.7
36.2
37.7
38.6
43.2
32.6
41.4
49.1
49.1
24.4
31.8
21.8
32.5
26.1
60.5
42.5
35.2
34.2
50.1
17.9
23.4
61.6
26.5
48.5
29.7
38.9
54.2
33.0
30.4
31.4
51.0
37.5
54.9
61.6
33.4
18.6
34.4
31.1
43.4
30.3
43.2
53.5
44.3
62.0
62.3
39.9
43.8
23.5
41.9
48.4
45.2
54.2
40.5
39.2
39.5
43.5
32.9
42.0
54.6
53.9
25.8
33.6
21.3
33.8
27.9
68.4
45.7
39.6
33.4
55.8
18.7
24.9
64.1
25.7
49.7
26.5
40.0
59.6
35.7
31.0
27.8
53.0
40.2
54.7
63.1
34.0
20.8
35.2
33.4
44.9
30.9
47.3
54.1
44.7
61.2
61.7
39.7
43.4
23.1
40.6
49.9
45.5
54.9
41.3
41.4
40.0
45.2
33.2
43.7
55.1
55.9
26.9
34.4
22.1
34.2
28.6
71.9
45.7
36.8
36.1
55.3
20.0
25.2
66.1
25.8
49.9
29.3
41.3
61.5
35.9
31.5
30.0
53.6
42.2
56.2
64.2
36.1
22.0
35.1
34.8
47.4
32.2
51.9
53.0
46.8
56.2
61.8
38.4
42.5
22.9
40.4
50.9
42.8
51.8
42.1
41.2
38.1
43.7
33.9
45.6
55.6
54.1
26.1
32.8
20.1
33.2
27.2
65.7
45.5
40.7
36.5
53.5
19.8
24.5
64.1
25.2
49.4
28.6
41.0
61.6
37.2
31.5
28.5
53.1
40.0
55.6
63.4
35.1
21.3
33.5
34.6
48.8
31.3
49.2
United States
59.9
56.0
47.7
40.5
41.9
42.5
41.5
1Number of births to teens ages 15-19 per 1,000 females ages 15-19.
Sources: U.S. Department of Health and Human Services, National Center for Health Statistics, National Vital Statistics Report, Vol. 52, No. 12 (August 4, 2003),
Revised Birth and Fertility Rates for the 1990s and New Rates for Hispanic Populations, 2000 and 2001: United States, Table 10; U.S. Department of Health
and Human Services, National Center for Health Statistics, National Vital Statistics Report, Vol. 56, No. 6 (December 5, 2007), Births: Final Data 2005, Table
11; U.S. Department of Health and Human Services, National Center for Health Statistics, National Vital Statistics Report, Vol. 57, No. 7 (Jaunaru 7, 2009),
Births: Final Data 2006, Table 11; and U.S. Department of Health and Human Services, National Center for Health Statistics, National Vital Statistics Reports,
Vol. 59, No. 1 (December, 2010), Births: Final Data for 2008, Table B.
State of America’s Children® 2011
C-5
Kinship Care Families
The terms “kinship care families” or “grandfamilies” are used to describe families where grandparents or
other relatives are raising their grandchildren or other related children when the children’s parents are
unable to do so. More than seven million children are living in multi-generational households headed by
grandparents and other relatives. Sometimes the child’s parent lives there too, but other times they do not.
Children may live with a relative because their parent needs additional support to help raise them or
because their parent is unable to care for them. Generally, the Children’s Defense Fund refers to children
being raised by relatives as those who are living with relatives who are responsible for them without their
parents present.
Children Living with Grandparents or Other Relatives
7,094,116 children live with a grandparent
or other relative who is the head of the
household.
5,345,635 of these are grandchildren who
live with a grandparent who is the head
of the household.
2,867,125 of these grandchildren live
with a grandparent who reports being
responsible for them.
943,356 grandchildren are being raised by
grandparents who are responsible for them
and the children’s parent is not present in
the home.
Grandparents Raising Grandchildren
6,687,495 grandparents are the heads
of households and live with their
grandchildren.
2,696,053 of these grandparents live with
their grandchildren and report being
responsible for them.
904,488 grandparents live with their
grandchildren and report being responsible
for them without that child’s parent being
present in the home.
Source: U.S. Department of Commerce, Bureau of the Census, 2009 American Community Survey, Tables B09006, B10002, B10050
and B10051. Calculations by Children’s Defense Fund.
C-6
Children’s Defense Fund
More than 2.8 million grandchildren live with grandparents who report they are responsible for them.
One-third of these children have no parent living with them.
Children Living with Grandparents or Other Relatives, 2009
Living in households headed by:
Grandparent
Alabama
Alaska
Arizona
Arkansas
California
Colorado
Connecticut
Delaware
District of Columbia
Florida
Georgia
Hawaii
Idaho
Illinois
Indiana
Iowa
Kansas
Kentucky
Louisiana
Maine
Maryland
Massachusetts
Michigan
Minnesota
Mississippi
Missouri
Montana
Nebraska
Nevada
New Hampshire
New Jersey
New Mexico
New York
North Carolina
North Dakota
Ohio
Oklahoma
Oregon
Pennsylvania
Rhode Island
South Carolina
South Dakota
Tennessee
Texas
Utah
Vermont
Virginia
Washington
West Virginia
Wisconsin
Wyoming
United States
Other Relative
Grandchildren living with grandparents
responsible for them:
No parent of grandchild present
Total
Number
Percent
110,977
12,532
144,835
58,192
735,450
61,202
48,152
14,852
13,397
315,514
213,418
40,584
18,862
213,258
105,558
26,755
31,443
88,582
121,196
11,521
106,405
73,562
134,355
42,631
105,511
92,581
13,540
19,563
50,791
13,669
114,430
51,013
304,458
155,146
5,309
158,704
67,976
49,809
172,803
13,236
96,450
12,506
138,120
610,289
46,812
4,365
119,711
82,908
38,366
57,033
7,303
26,954
3,482
50,610
11,772
367,117
26,556
11,862
4,487
6,169
97,802
73,132
11,314
6,117
74,899
21,877
7,098
11,160
19,953
29,973
3,143
34,245
22,430
35,082
14,487
22,131
24,177
3,678
4,932
21,094
2,603
42,586
11,144
106,983
48,977
1,117
40,364
16,136
14,646
41,379
4,799
25,705
3,710
32,339
194,691
16,885
1,138
39,017
28,925
6,741
19,260
1,603
71,625
6,925
77,722
39,302
313,542
33,170
23,508
9,075
5,802
171,592
130,841
10,509
11,156
113,181
66,730
14,120
18,083
63,493
75,238
5,572
51,916
30,637
68,951
21,194
69,008
50,460
8,829
11,119
28,337
6,247
50,741
29,365
140,185
99,144
3,048
90,061
43,479
27,189
85,003
4,835
56,740
8,207
80,695
356,410
18,381
1,928
62,220
43,781
23,603
29,199
5,027
26,980
2,241
22,396
15,335
75,160
13,047
8,444
2,469
1,691
58,614
48,057
2,788
3,652
33,817
21,124
4,650
7,081
28,348
29,128
2,564
15,109
8,630
20,963
6,623
22,358
19,245
4,195
4,531
7,135
1,909
16,147
9,593
39,526
40,564
1,030
33,999
17,062
8,319
32,900
1,554
22,721
2,818
29,230
103,547
4,489
1,115
21,890
16,690
9,916
9,563
2,399
37.7%
32.4
28.8
39.0
24.0
39.3
35.9
27.2
29.1
34.2
36.7
26.5
32.7
29.9
31.7
32.9
39.2
44.6
38.7
46.0
29.1
28.2
30.4
31.2
32.4
38.1
47.5
40.8
25.2
30.6
31.8
32.7
28.2
40.9
33.8
37.8
39.2
30.6
38.7
32.1
40.0
34.3
36.2
29.1
24.4
57.8
35.2
38.1
42.0
32.8
47.7
5,345,635
1,748,481
2,867,125
943,356
32.9
Source: U.S. Department of Commerce, Bureau of the Census, 2009 American Community Survey, Tables B09006 and B10002.
Calculations by Children’s Defense Fund.
State of America’s Children® 2011
C-7
Nearly 2.7 million grandparents report being responsible for their grandchildren;
36 percent have had this responsibility for five years or more.
Grandparents Raising Their Grandchildren, 2009
Selected Characteristics
Total number
who report being
responsible
Alabama
Alaska
Arizona
Arkansas
California
Colorado
Connecticut
Delaware
District of Columbia
Florida
Georgia
Hawaii
Idaho
Illinois
Indiana
Iowa
Kansas
Kentucky
Louisiana
Maine
Maryland
Massachusetts
Michigan
Minnesota
Mississippi
Missouri
Montana
Nebraska
Nevada
New Hampshire
New Jersey
New Mexico
New York
North Carolina
North Dakota
Ohio
Oklahoma
Oregon
Pennsylvania
Rhode Island
South Carolina
South Dakota
Tennessee
Texas
Utah
Vermont
Virginia
Washington
West Virginia
Wisconsin
Wyoming
United States
Grandparents raising
children without
parent present
Number
Percent
64,874
7,535
64,725
37,866
298,557
33,112
23,974
8,102
4,061
160,821
110,881
10,918
11,827
101,647
66,164
13,435
20,648
59,763
64,835
6,199
47,117
33,678
69,712
22,399
49,366
50,101
7,098
10,590
26,461
6,257
50,138
27,418
141,157
98,493
2,663
93,158
40,367
25,210
85,303
5,856
52,462
7,306
77,238
314,383
19,549
2,406
62,153
44,105
21,773
27,904
4,288
26,581
1,954
18,549
14,735
70,097
12,434
9,497
2,927
1,452
56,249
41,232
2,784
3,782
29,184
22,257
4,519
7,771
26,597
25,112
2,903
13,371
9,357
21,693
6,967
18,076
19,660
2,954
4,358
7,328
2,268
14,541
9,040
37,400
42,419
1,115
35,856
16,787
9,336
33,175
1,771
20,815
3,450
30,648
96,032
4,943
1,294
21,580
16,749
9,658
9,075
2,156
2,696,053
904,488
41.0%
25.9
28.7
38.9
23.5
37.6
39.6
36.1
35.8
35.0
37.2
25.5
32.0
28.7
33.6
33.6
37.6
44.5
38.7
46.8
28.4
27.8
31.1
31.1
36.6
39.2
41.6
41.2
27.7
36.2
29.0
33.0
26.5
43.1
41.9
38.5
41.6
37.0
38.9
30.2
39.7
47.2
39.7
30.5
25.3
53.8
34.7
38.0
44.4
32.5
50.3
33.5
Number in
labor force
Number
35,102
4,433
38,719
21,789
181,206
21,245
15,275
5,597
1,330
98,934
65,451
5,911
7,814
66,996
41,620
9,754
14,440
31,543
33,962
3,760
31,264
22,072
40,863
15,269
28,795
31,311
4,471
7,433
16,319
4,706
31,900
17,920
79,560
62,191
1,724
57,562
24,826
16,060
50,576
3,982
31,615
4,740
44,461
198,281
13,320
1,439
40,467
28,527
10,578
18,014
2,931
17,334
778
15,168
9,724
47,485
6,249
3,826
911
1,533
34,356
28,692
1,691
2,064
21,091
15,279
1,945
3,015
14,668
18,411
760
6,886
4,176
12,793
5,168
14,033
8,993
1,641
1,613
2,641
600
6,133
5,613
30,569
23,470
540
20,220
9,328
3,438
14,940
743
12,127
1,850
18,479
70,029
1,987
567
8,793
6,542
4,059
6,367
156
1,648,058
549,474
Poor
Percent
26.7%
10.3
23.4
25.7
15.9
18.9
16.0
11.2
37.7
21.4
25.9
15.5
17.5
20.7
23.1
14.5
14.6
24.5
28.4
12.3
14.6
12.4
18.4
23.1
28.4
17.9
23.1
15.2
10.0
9.6
12.2
20.5
21.7
23.8
20.3
21.7
23.1
13.6
17.5
12.7
23.1
25.3
23.9
22.3
10.2
23.6
14.1
14.8
18.6
22.8
3.6
40.6%
24.3
37.1
30.2
36.7
34.6
34.8
37.3
59.2
34.6
35.9
47.3
30.2
36.2
31.6
26.8
31.6
37.0
40.1
31.8
35.2
33.3
30.0
36.3
39.5
33.9
44.8
32.9
32.6
32.1
40.4
30.5
41.6
36.0
50.1
34.7
41.7
35.8
39.2
20.9
41.1
35.5
33.6
34.6
33.4
23.5
38.8
35.7
41.5
33.2
19.5
20.4
36.1
Source: U.S. Department of Commerce, Bureau of the Census, 2009 American Community Survey, Tables B10050 and B10051.
Calculations by Children’s Defense Fund.
C-8
Children’s Defense Fund
Percent
responsible
for five years
or more
More than 1.7 million children have a parent in prison.
About 45 percent of these children are Black.
Parents Who Are Incarcerated and Their Children
More than 800,000 parents of minor children are in prison. About eight percent are mothers.
Total,
all races
White, nonHispanic
Black, nonHispanic
Hispanic
Fathers
Mothers
744,200
65,600
223,700
31,700
319,400
18,300
160,100
11,100
Total
809,800
255,400
337,700
171,200
Black children are more than seven times as likely and Hispanic children are more than two and a half times
as likely as White children to have a parent in prison.
Number with a
parent in prison
White, non-Hispanic children
Black, non-Hispanic children
Hispanic children
Total, all children
484,100
767,400
362,800
1,706,600
Percent with a
parent in prison
0.9%
6.7
2.4
2.3
Source: U.S. Department of Justice, Bureau of Justice Statistics, Parents in Prison and Their Minor Children (August 2008), Table 2 and Appendix
Table 2. Calculations by Children's Defense Fund
State of America’s Children® 2011
C-9
Family Income
T
he gap between the rich and non-rich in our nation continues. Despite the recession and some
income loss in 2007-2008, the top one percent of households received 21 percent of total income
in 2008—among the highest percentages since the late 1920’s. The income share for the richest 10 percent
of households in 2008 was 48.2 percent. In 2008 the bottom 90 percent of households saw the largest
one-year drop in income since 1938 and had the lowest incomes they have seen in over a decade.
Virtually all the income gains for this group during the last five years were wiped out by the recession.
The median incomes of Black families with children were only 55 percent of those for White families
and several thousand dollars lower than for Hispanic families.
• The median income for female-headed households is less than a third of the median
income of married-couple families. More than one in five of all children, one in two
Black children and one in four Hispanic children live with their mother only.
• In 2010 the Temporary Assistance for Needy Families (TANF) Program benefited
3.4 million children, a 59 percent decrease from the number of children benefiting
from TANF in 1996.
• The Earned Income Tax Credit (EITC) lifts more children out of poverty than any
other single program. Working families and individuals with adjusted gross incomes
below $50,000 received $50.7 billion from EITC in the 2008 tax year. In addition,
the Child Tax Credit helped 25 million working families, many of them low-income,
recover more than $30 billion that year.
• Collections were made in 57 percent of the 15 million child support cases; 79 pecent
of child support cases in 2008 had court orders.
• More than three million children and 150,000 students ages 18-19 received Social
Security benefits from disabled, retired or deceased workers in 2009.
• The unemployment rate for teens 16-19 in 2010 (25.9%) was more than two-anda-half times the national unemployment rate for all ages; the average unemployment
rate for Black youth ages 16-19 that year was almost four-and-a-half times the national
unemployment rate for all ages.
D-2
Children’s Defense Fund
While the bottom 90 percent of households lost all income gains from 2002 to 2008,
the top 0.01 percent of households grew by nearly 70 percent in this time period.
Average Income Gains, Adjusted for Inflation, 2002–2008
Income loss during
first year of recession
2007–2008
Income gain
2002–2007
Bottom 90 percent
Top 1 percent
Top 0.01 percent
1,250
541,140
20,072,720
4%
62
123
-2,420
-279,200
-9,045,980
-7%
-20
-25
Change in
income gain
2002–2008
-1,170
261,930
11,026,750
-4%
30
68
Source: Center on Budget and Policy Priorities, “Tax Data Show Richest 1 Percent Took a Hit in 2008, But Income Remained Highly
Concentrated at the Top Recent Gains of Bottom 90 Percent Wiped Out” (October 21, 2010), Table 1. Based on Internal Revenuse Service
data analyzed by Thomas Piketty and Emmanuel Saez, Table A6, available at http://elsa.berkeley.edu/~saez/TabFig2008.xls.
The income loss during the first year of the recession more than wiped out the income gains
for the bottom 90 percent of households during the previous five years. The top one percent
also took a hit, but the drop for the bottom 90 percent was the largest
one-year drop for this group since 1938.
Distribution of Income Gains, 2002–2008
80
Bottom 90 percent
Percent change in income
61.8%
Top 1 percent
60
40
29.9%
20
3.9%
0
-40
-3.6%
-7.2%
-20
-19.7%
Income gain
2002–2007
Income loss during
first year of recession
2007–2008
Change in income gain
2002–2008
Source: Center on Budget and Policy Priorities, “Tax Data Show Richest 1 Percent Took a Hit in 2008, But Income Remained Highly
Concentrated at the Top Recent Gains of Bottom 90 Percent Wiped Out” (October 21, 2010), Figure 1. Based on Internal Revenuse Service
data analyzed by Thomas Piketty and Emmanuel Saez, Table A6, available at http://elsa.berkeley.edu/~saez/TabFig2008.xls.
State of America’s Children® 2011
D-3
Since the late 1970s the average income of the bottom 90 percent of households has essentially
stagnated while the average income for the top one percent has soared.
Average Income Between 1945 and 2008
As a percent of the 1979 level
350
300
Percent
250
$1,137,684
(260% of
the 1979 level)
200
Top 1 percent
150
Bottom 90 percent
100
$31,244
(97% of the 1979 level)
50
0
1945
1950
1955
1960
1965
1970
1975
1980
1985
1990
1995
2000
2008
Source: Center on Budget and Policy Priorities, “Tax Data Show Richest 1 Percent Took a Hit in 2008, But Income Remained Highly
Concentrated at the Top Recent Gains of Bottom 90 Percent Wiped Out” (October 21, 2010), Figure 3. Based on Internal Revenuse Service
data analyzed by Thomas Piketty and Emmanuel Saez, Table A6, available at http://elsa.berkeley.edu/~saez/TabFig2008.xls.
In 2008 the income share for the richest 10 percent of U.S. households was 48.23 percent,
just slightly below its 2007 record high level.
The Income Share for the Richest 10 Percent of U.S. Households,
1917–2008
48.23%
Share of total income going toTop 10%
50
45
40
35
30
25
0
1917 1922 1927 1932 1937 1942 1947 1952 1957 1962 1967 1972 1977 1982 1987 1992 1997 2002 2008
— Income is defined as market income including capital gains.
— In 2008, top 10 percent includes all families with annual income above $109,000.
Source: Thomas Piketty and Emmanuel Saez, “Income Inequality in the United States, 1913-1998,” Quarterly Journal of Economics,
Vol. 118, No. 1 (2003), data updated through 2008 at http://elsa.berkeley.edu/~saez/TabFig2008.xls.
D-4
Children’s Defense Fund
Black families with children have median incomes only 55 percent of those of White families.
The median income of Hispanic families is slightly higher than that of Black families.
Median Income of Families with Children, 2009
$90,000
$79,110
80,000
70,000
$61,775
60,000
$57,287
50,000
$37,027
40,000
$33,915
30,000
20,000
10,000
0
Total,
All Races
Asian
White
Hispanic*
Black
*Persons of Hispanic origin can be of any race.
Source: U.S. Department of Commerce, Bureau of the Census, FINC-03. Presence of Related Children Under 18 Years
Old-All Families by Total Money Income in 2009, Type of Family, Work Experience in 2009, Race and Hispanic Origin
of Reference Person, at http://www.census.gov/hhes/www/cpstables/032010/faminc/new03_000.htm.
State of America’s Children® 2011
D-5
Female householders have lower median incomes than any other family type.
The median income of Hispanic female householders and Hispanic married-couple
families are the lowest compared to other races.
Median Income of Families with Children, by Family Type, 2009
Median income of all families with children
$100,000
Median income of married-couple families
with children
Median income of female householders/
husband absent families with children
80,000
60,000
40,000
20,000
0
Total, All Races
Total, All Races
Asian
White
Hispanic*
Black
Asian
White
Hispanic*
All families
with children
Married-couple
families
with children
$ 57,287
79,110
61,775
37,027
33,915
$ 76,649
90,365
77,611
46,388
63,623
Black
Female householders/
husband absent families
with children
$ 25,172
40,409
26,500
22,033
22,158
*Persons of Hispanic origin can be of any race.
Source: U.S. Department of Commerce, Bureau of the Census, FINC-03. Presence of Related Children Under 18 Years Old-All
Families by Total Money Income in 2009, Type of Family, Work Experience in 2009, Race and Hispanic Origin of Reference Person,
at http://www.census.gov/hhes/www/cpstables/032010/faminc/new03_000.htm.
D-6
Children’s Defense Fund
The median income of female householders is less than a third of the median income
for married-couple familes and less than half of the median income for all families.
Median Income of Families with Children, by Family Type, 2009
All families
Alabama
Alaska
Arizona
Arkansas
California
Colorado
Connecticut
Delaware
District of Columbia
Florida
Georgia
Hawaii
Idaho
Illinois
Indiana
Iowa
Kansas
Kentucky
Louisiana
Maine
Maryland
Massachusetts
Michigan
Minnesota
Mississippi
Missouri
Montana
Nebraska
Nevada
New Hampshire
New Jersey
New Mexico
New York
North Carolina
North Dakota
Ohio
Oklahoma
Oregon
Pennsylvania
Rhode Island
South Carolina
South Dakota
Tennessee
Texas
Utah
Vermont
Virginia
Washington
West Virginia
Wisconsin
Wyoming
United States
Married-couples
Female householder,
no husband present
Male householder,
no wife present
$ 48,096
71,540
53,049
42,061
61,035
65,994
83,140
65,432
46,624
49,803
53,742
68,873
49,962
63,762
54,148
59,259
56,772
47,791
51,942
52,807
82,167
83,340
55,348
69,746
42,813
53,242
51,728
58,511
55,808
74,516
83,742
44,207
63,562
50,430
65,112
54,984
48,224
55,541
62,129
65,681
48,050
56,619
49,077
51,031
61,660
61,389
69,956
64,206
47,572
61,516
63,513
$ 68,752
86,695
69,164
60,167
79,044
83,486
106,536
89,443
121,179
67,936
74,302
84,162
60,989
82,684
71,768
75,311
73,094
67,211
76,575
70,041
106,732
105,499
74,730
85,422
63,971
72,588
67,511
72,663
70,639
90,990
106,732
63,016
88,480
70,933
76,887
74,873
64,820
71,636
80,979
90,970
69,741
70,176
67,500
69,419
69,357
76,484
90,403
81,830
60,948
78,353
74,870
$ 18,619
29,336
25,349
17,718
27,205
24,969
29,366
29,135
22,314
24,395
23,770
24,749
23,356
23,672
20,389
21,765
22,984
17,686
19,364
22,763
34,891
28,133
21,075
25,959
17,294
20,198
19,852
21,429
28,965
29,121
29,697
22,593
25,663
20,606
22,617
19,902
19,674
22,043
22,939
25,206
20,674
22,829
19,043
22,112
28,073
24,914
28,734
25,424
15,319
22,370
28,607
$ 34,418
39,673
36,902
28,452
37,742
40,610
49,629
41,001
34,203
31,505
35,821
43,290
33,685
36,550
29,455
33,697
35,271
28,511
36,224
30,117
42,873
41,323
31,251
36,623
27,550
32,237
25,584
32,251
37,847
41,682
41,688
32,499
37,434
27,791
38,621
31,645
31,834
31,246
34,709
39,422
29,747
30,627
28,351
33,569
40,547
38,593
41,431
37,503
30,596
35,353
44,861
58,314
77,474
23,313
34,676
Source: U.S. Department of Commerce, Bureau of the Census, 2009 American Community Survey, Tables B19125 and B19126.
State of America’s Children® 2011
D-7
In every state the 2009 TANF benefits were less than the 1970 real dollar amounts.
In 35 states these benefits were less than half the 1970 real dollar amount
AFDC/TANF Benefits, July 1970–July 2009
Maximum monthly benefits for a three-person family
July 1970
Actual
dollars
Alabama
Alaska
Arizona
Arkansas
California
Colorado
Connecticut
Delaware
District of Columbia
Florida
Georgia
Hawaii
Idaho
Illinois
Indiana
Iowa
Kansas
Kentucky
Louisiana
Maine
Maryland
Massachusetts
Michigan
Minnesota
Mississippi
Missouri
Montana
Nebraska
Nevada
New Hampshire
New Jersey
New Mexico
New York
North Carolina
North Dakota
Ohio
Oklahoma
Oregon
Pennsylvania
Rhode Island
South Carolina
South Dakota
Tennessee
Texas
Utah
Vermont
Virginia
Washington
West Virginia
Wisconsin
Wyoming
$ 65
328
138
89
186
193
283
160
195
114
107
226
211
232
120
201
222
147
88
135
162
268
219
256
56
104
202
171
121
262
302
149
279
145
213
161
152
184
265
229
85
264
112
148
175
267
225
258
114
184
213
Adjusted
for inflation
(July 2006)*
Actual
dollars
$ 359
1,812
762
492
1,027
1,066
1,563
884
1,077
630
591
1,248
1,165
1,281
663
1,110
1,226
812
486
746
895
1,480
1,210
1,414
309
574
1,116
944
668
1,447
1,668
823
1,541
801
1,176
889
840
1,016
1,464
1,265
469
1,458
619
817
967
1,475
1,243
1,425
630
1,016
1,176
$ 215
923
278
204
694**
462
560
338
428
303
280
636
309
432
288
426
429
262
240
485
574
618**
492
532
170
292
504
364
383
675
424
447
721
272
477
434
292
514
403
554
270
539
185
249
498
640
320
562
340
673
546
July 2009
Percent change
(compared to
As percent
inflation-adjusted
of 2009
amount)
poverty level
-40.1%
-49.0
-63.6
-58.5
-32.4
-56.7
-64.2
-61.8
-60.3
-51.9
-52.6
-49.0
-73.5
-66.3
-56.5
-61.6
-65.0
-67.7
-50.6
-35.0
-35.8
-58.2
-59.3
-62.4
-45.0
-49.2
-54.8
-61.5
-42.7
-53.4
-74.6
-45.7
-53.2
-66.0
-59.5
-51.2
-65.2
-49.4
-72.5
-56.2
-42.5
-63.0
-70.1
-69.5
-48.5
-56.6
-74.2
-60.6
-46.0
-33.8
-53.6
14.1%
48.4
18.2
13.4
45.5
30.3
36.7
22.2
28.1
19.9
18.4
36.2
20.3
28.3
18.9
27.9
28.1
17.2
15.7
31.8
37.6
40.5
32.2
34.9
11.1
19.1
33.0
23.9
25.1
44.2
27.8
29.3
47.3
17.8
31.3
28.4
19.1
33.7
26.4
36.3
17.7
35.3
12.1
16.3
32.6
41.9
21.0
36.8
22.3
44.1
35.8
*Adjusted by the Consumer Price Index for All Urban Consumers (CPI-U). The CPI-U for July 1970 was 39.0; for July 2009 it was 215.4
** Nonexempt maximum monthly benefit for a three-person family.
Sources: The Urban Insitute's Welfare Rules Database, available at http://anfdata.urban.org/wrd/WRDWelcome.cfm; U.S. Department of Labor, Bureau
of Labor Statistics, Consumer Price Index, at http://stats.bls.gov/cpi/. Calculations by Children’s Defense Fund.
D-8
Children’s Defense Fund
More than 3.4 million children receive Temporary Assistance for Needy Families (TANF)—a 58.8 percent
reduction since August 1996 (when major changes were made in the federal welfare program).
TANF Recipients and Families, August 1996 and September 2010
Child recipients,
August 1996
Percent Change
in child
recipients
Recipients, September 2010
Total
Adults
Children
Alabama
Alaska
Arizona
Arkansas
California
Colorado
Connecticut
Delaware
District of Columbia
Florida
Georgia
Hawaii
Idaho
Illinois
Indiana
Iowa
Kansas
Kentucky
Louisiana
Maine
Maryland
Massachusetts
Michigan
Minnesota
Mississippi
Missouri
Montana
Nebraska
Nevada
New Hampshire
New Jersey
New Mexico
New York
North Carolina
North Dakota
Ohio
Oklahoma
Oregon
Pennsylvania
Rhode Island
South Carolina
South Dakota
Tennessee
Texas
Utah
Vermont
Virginia
Washington
West Virginia
Wisconsin
Wyoming
56,687
9,489
42,443
19,359
1,457,333
30,028
33,531
15,841
19,450
106,342
37,345
29,456
2,772
69,483
88,722
55,451
40,352
63,232
24,590
39,876
60,905
97,967
175,511
53,960
25,149
94,771
9,344
21,644
27,530
13,407
82,462
55,841
387,206
45,655
4,975
242,698
21,213
83,535
130,523
15,382
46,042
6,907
161,806
119,261
16,434
7,560
84,173
172,578
23,945
58,960
644
14,789
2,956
11,949
5,568
332,204
7,768
9,981
5,964
5,678
21,273
3,597
9,654
212
9,650
23,208
17,873
13,156
13,744
3,795
13,967
16,956
32,545
49,405
13,403
6,789
30,024
2,774
4,780
7,256
3,893
24,712
16,036
106,377
7,247
1,213
68,236
4,082
26,876
33,805
4,802
11,729
1,074
44,920
17,544
4,611
2,336
24,657
53,873
6,774
13,875
109
41,898
6,533
30,494
13,791
1,125,129
22,260
23,550
9,877
13,772
85,069
33,748
19,802
2,560
59,833
65,514
37,578
27,196
49,488
20,795
25,909
43,949
65,422
126,106
40,557
18,360
64,747
6,570
16,864
20,274
9,514
57,750
39,805
280,829
38,408
3,762
174,462
17,131
56,659
96,718
10,580
34,313
5,833
116,886
101,717
11,823
5,224
59,516
118,705
17,171
45,085
535
76,403
22,913
115,924
40,752
1,779,004
66,101
106,457
16,002
48,332
377,821
237,656
44,316
15,240
448,589
101,191
57,154
45,309
119,202
156,267
34,058
134,880
145,800
338,976
115,404
92,546
157,149
19,349
27,460
25,407
15,104
188,641
64,559
748,895
184,274
8,962
379,941
68,688
53,810
361,012
38,024
85,685
11,767
177,401
460,781
26,415
15,227
108,231
174,142
58,067
107,380
8,249
-45.2
-71.5
-73.7
-66.2
-36.
-66.3
-77.9
-38.3
-71.5
-77.5
-85.8
-55.3
-83.2
-86.7
-35.3
-34.3
-40.0
-58.5
-86.7
-23.9
-67.4
-55.1
-62.8
-64.9
-80.2
-58.8
-66.0
-38.6
-20.2
-37.0
-69.4
-38.3
-62.5
-79.2
-58.0
-54.1
-75.1
5.3
-73.2
-72.2
-60.0
-50.4
-34.1
-77.9
-55.2
-65.7
-45.0
-31.8
-70.4
-58.0
-93.5
United States
4,589,770
1,169,699
3,420,071
8,310,917
-58.8
Source: U.S. Department of Health and Human Services, Administration for Children and Families, Office of Family Assistance, Caseload Data
1960–1999,at http://www.acf.hhs.gov/programs/ofa/data-reports/caseload/afdc/1996/1996.xls. Calculations by Children’s Defense Fund.
State of America’s Children® 2011
D-9
More than 1.9 million families receive Temporary Assistance for Needy Families (TANF).
More than 40 percent of these are families in which only children receive assistance,
most often children with disabilities or children being raised by relatives.
TANF Families,* September 2010
Total
Alabama
Alaska
Arizona
Arkansas
California
Colorado
Connecticut
Delaware
District of Columbia
Florida
Georgia
Hawaii
Idaho
Illinois
Indiana
Iowa
Kansas
Kentucky
Louisiana
Maine
Maryland
Massachusetts
Michigan
Minnesota
Mississippi
Missouri
Montana
Nebraska
Nevada
New Hampshire
New Jersey
New Mexico
New York
North Carolina
North Dakota
Ohio
Oklahoma
Oregon
Pennsylvania
Rhode Island
South Carolina
South Dakota
Tennessee
Texas
Utah
Vermont
Virginia
Washington
West Virginia
Wisconsin
Wyoming
United States
Two-parent
families
Families, September 2010
One-parent
families
Children-only
families
23,052
3,507
18,774
8,469
590,121
11,707
16,848
5,508
8,547
57,742
20,133
9,934
1,820
24,337
36,006
21,548
15,554
30,875
10,849
15,380
25,110
49,836
67,241
24,574
11,895
39,262
3,686
8,702
10,612
6,175
34,516
21,223
154,936
23,705
1,995
105,140
9,387
31,751
53,274
6,618
19,347
3,291
62,714
51,931
6,647
3,256
37,448
70,207
10,496
24,746
318
147
375
688
207
59,479
782
—
22
—
1,430
—
2,170
—
—
3,076
1,443
1,428
693
—
1,987
—
2,437
—
—
—
—
364
—
1,143
162
—
1,454
2,497
270
—
8,354
—
2,768
755
549
—
—
1,679
—
—
364
—
6,859
—
582
3
14,407
2,136
10,306
5,166
278,109
6,253
9,859
2,735
6,375
16,819
3,493
5,902
175
9,664
23,231
14,691
9,941
12,235
3,720
10,907
17,051
30,030
49,341
13,699
6,684
30,346
1,934
4,878
4,876
3,548
24,894
12,712
92,916
6,705
1,460
50,403
4,082
19,266
30,724
3,803
11,959
1,074
48,511
17,227
3,901
1,600
25,641
39,840
5,657
11,961
103
8,498
996
7,780
3,096
252,533
4,672
6,989
2,751
2,172
39,493
16,640
1,862
1,645
14,673
9,699
5,414
4,185
17,947
7,129
2,486
8,059
17,369
17,900
10,875
5,211
8,916
1,388
3,824
4,593
2,465
9,622
7,057
59,523
16,730
535
46,383
5,305
9,717
21,795
2,266
7,388
2,217
12,524
34,704
2,746
1,292
11,807
23,508
4,839
12,203
212
1,910,750
104,167
1,022,950
783,633
* Includes families receiving TANF and Separate State Programs (SSP), which offer cash benefits. In 2010, 19 states had SSPs in addition to TANF.
n/a – Data not available.
Source: U.S. Department of Health and Human Services, Administration for Children and Families, Office of Family Assistance, TANF Caseload Data 2010,
Combined TANF and SSP-MOE as of 1/03/2011, at http://www.acf.hhs.gov/programs/ofa/data-reports/caseload/caseload_current.htm#2010.
Calculations by Children’s Defense Fund.
D-10
Children’s Defense Fund
In 2008, 24.8 million working families and individuals received almost $50.7 billion from the
EITC and most of the funds went to low-wage workers with no or limited tax liability.
Earned Income Tax Credit (EITC), 2008 Tax Year
Federal EITC
Total claims
Number
of filers
Alabama
Alaska
Arizona
Arkansas
California
Colorado
Connecticut
Delaware
District of Columbia
Florida
Georgia
Hawaii
Idaho
Illinois
Indiana
Iowa
Kansas
Kentucky
Louisiana
Maine
Maryland
Massachusetts
Michigan
Minnesota
Mississippi
Missouri
Montana
Nebraska
Nevada
New Hampshire
New Jersey
New Mexico
New York
North Carolina
North Dakota
Ohio
Oklahoma
Oregon
Pennsylvania
Rhode Island
South Carolina
South Dakota
Tennessee
Texas
Utah
Vermont
Virginia
Washington
West Virginia
Wisconsin
Wyoming
United States
Amount
(in 1,000s)
State EITC
Refundable claims
Number
of filers
Amount
(in 1,000s)
524,097
38,488
487,002
301,909
2,730,012
308,255
190,504
66,152
50,144
1,852,940
1,022,957
97,062
120,054
954,070
504,631
194,022
195,577
386,058
516,934
94,901
375,444
353,061
758,244
308,262
398,579
489,968
78,427
122,890
196,012
70,926
535,511
210,347
1,622,113
864,536
40,669
896,168
329,642
258,435
856,884
75,871
477,905
60,067
626,531
2,417,062
164,055
42,141
552,941
399,088
152,595
347,667
33,807
$ 1,236,759
61,815
1,001,197
655,575
5,481,142
563,786
345,990
128,227
94,078
3,825,237
2,339,271
172,619
232,570
1,979,163
998,418
358,193
372,693
768,208
1,223,396
166,539
722,374
622,413
1,526,648
548,208
963,186
980,059
141,891
233,344
373,849
119,381
1,049,299
426,626
3,241,226
1,818,663
73,092
1,780,167
673,746
463,283
1,611,545
148,347
1,025,672
112,124
1,307,355
5,517,268
320,501
68,657
1,076,990
725,169
287,082
642,777
59,426
478,281
32,757
433,721
271,092
2,314,509
263,238
162,381
58,790
44,695
1,614,367
925,921
82,550
104,535
837,529
448,773
167,035
171,924
342,384
470,275
78,621
328,163
296,905
666,445
262,739
366,410
432,596
66,838
106,768
172,610
58,471
461,231
187,765
1,368,800
772,589
34,942
792,663
291,877
221,344
746,502
66,186
432,506
51,970
554,160
2,160,082
145,676
33,886
485,351
343,035
135,403
300,646
29,079
$ 1,109,510
54,836
892,496
589,003
4,594,443
491,031
302,506
116,002
84,253
3,268,128
2,067,796
153,488
203,171
1,711,288
896,144
318,183
335,383
681,820
1,099,191
140,608
627,105
540,287
1,325,337
477,715
875,405
877,043
123,711
208,219
333,770
101,239
898,900
385,088
2,683,133
1,627,257
65,201
1,586,156
598,101
404,503
1,434,105
129,137
928,997
100,685
1,146,184
4,781,310
283,680
57,060
956,223
638,035
260,495
569,437
52,907
24,751,617
50,665,244
21,677,016
44,185,705
Does state
have its
own EITC?
Is it
refundable?
Yes
Yes
No
Yes
Yes
Yes
Yes
Yes
Yes
Yes
Yes
Yes
Yes
Yes
Yes
Yes
Yes
Yes
Yes
No
Yes
Yes
Yes
Yes
Yes
Yes
Yes
Yes
Yes
Yes
Yes
Yes
Yes
Yes
Yes
Yes
Yes
Yes
Yes
Yes
Yes
Yes
Yes
Yes
No
Yes
Yes
Yes
Note: Total claims include refundable and non-refundable claims. If the EITC is greater than the total income tax due then the person receives the excess
amount, which is considered the “refundable” claim. When the amount of the EITC is less than the total income tax due then the claim is considered
“non-refundable” because the EITC only helped lower the total income tax.
Source: U.S. Department of the Treasury, Internal Revenue Service, Historical Table 2, SOI Bulletin, at http://www.irs.gov/taxstats/article/0,,id=171535,00.html;
and Center on Budget and Policy Priorities, Policy Basics: State Earned Income Tax Credits:
2008 Legislative Update. Calculations by Children's Defense Fund.
State of America’s Children® 2011
D-11
More than 25 million families received over $30 billion in child tax credits in 2008.
Child Tax Credit, 2008
Number
of filers
Alabama
Alaska
Arizona
Arkansas
California
Colorado
Connecticut
Delaware
District of Columbia
Florida
Georgia
Hawaii
Idaho
Illinois
Indiana
Iowa
Kansas
Kentucky
Louisiana
Maine
Maryland
Massachusetts
Michigan
Minnesota
Mississippi
Missouri
Montana
Nebraska
Nevada
New Hampshire
New Jersey
New Mexico
New York
North Carolina
North Dakota
Ohio
Oklahoma
Oregon
Pennsylvania
Rhode Island
South Carolina
South Dakota
Tennessee
Texas
Utah
Vermont
Virginia
Washington
West Virginia
Wisconsin
Wyoming
United States
Amount claimed
(in $1,000s)
401,018
72,164
533,926
234,056
2,988,934
418,696
275,003
75,550
32,388
1,350,099
809,298
110,405
134,731
1,068,928
574,151
262,245
255,171
349,600
391,503
99,737
468,777
476,173
770,895
447,269
260,697
485,573
73,262
161,486
250,323
109,612
691,702
172,002
1,348,991
788,267
54,419
968,276
311,689
281,884
989,560
81,051
387,001
68,084
513,549
2,238,641
271,497
48,359
644,522
559,830
135,107
486,508
51,048
$ 454,900
93,873
633,759
268,893
3,428,903
529,173
343,053
91,875
31,519
1,481,341
899,109
139,035
176,934
1,323,797
738,744
359,321
336,412
428,545
449,144
125,223
552,361
604,929
1,003,049
605,709
279,948
609,634
95,052
221,298
297,411
144,224
825,140
202,318
1,596,402
893,455
75,922
1,240,801
383,460
348,532
1,265,053
98,313
427,769
93,265
595,237
2,635,754
392,206
62,247
780,788
706,540
171,660
649,393
71,827
25,033,657
30,263,250
Source: U.S. Department of the Treasury, Internal Revenue Service, Historical Table 2, SOI Bulletin, at
http://www.irs.gov/taxstats/article/0,,id=171535,00.html. Calculations by Children’s Defense Fund.
D-12
Children’s Defense Fund
Seventy nine percent of child support cases in 2008 had court orders but
collections were made in only 57 percent
Child Support Enforcement, 2008
Caseload
Alabama
Alaska
Arizona
Arkansas
California
Colorado
Connecticut
Delaware
District of Columbia
Florida
Georgia
Hawaii
Idaho
Illinois
Indiana
Iowa
Kansas
Kentucky
Louisiana
Maine
Maryland
Massachusetts
Michigan
Minnesota
Mississippi
Missouri
Montana
Nebraska
Nevada
New Hampshire
New Jersey
New Mexico
New York
North Carolina
North Dakota
Ohio
Oklahoma
Oregon
Pennsylvania
Rhode Island
South Carolina
South Dakota
Tennessee
Texas
Utah
Vermont
Virginia
Washington
West Virginia
Wisconsin
Wyoming
United States
Cases
with
court order
225,438
44,554
212,623
121,761
1,628,936
140,356
194,222
67,869
63,203
792,233
398,965
94,002
120,621
505,630
349,497
189,205
126,968
325,478
281,492
68,015
255,866
269,665
934,493
247,950
320,397
356,970
38,403
105,269
116,607
35,547
347,646
67,105
892,672
421,217
41,104
978,416
186,918
226,648
481,677
56,843
226,380
44,184
420,617
1,099,311
75,295
22,021
344,126
346,225
117,615
355,294
34,885
186,563
41,538
162,755
102,136
1,305,281
122,810
139,286
45,767
34,633
584,953
333,079
59,586
96,494
390,705
251,856
162,556
100,294
272,514
217,081
60,268
205,015
208,153
755,004
209,097
177,438
301,996
32,006
86,292
79,661
30,086
293,598
38,106
731,922
342,387
32,172
739,995
132,269
165,501
428,334
35,436
139,903
31,452
272,641
917,867
66,707
19,279
293,474
311,422
101,047
296,205
29,294
15,418,434
12,173,914
Percent
with
court order
82.8%
93.2
76.5
83.9
80.1
87.5
71.7
67.4
54.8
73.8
83.5
63.4
80.0
77.3
72.1
85.9
79.0
83.7
77.1
88.6
80.1
77.2
80.8
84.3
55.4
84.6
83.3
82.0
68.3
84.6
84.5
56.8
82.0
81.3
78.3
75.6
70.8
73.0
88.9
62.3
61.8
71.2
64.8
83.5
88.6
87.5
85.3
89.9
85.9
83.4
84.0
79.0
Cases
with
collections
132,367
32,124
112,037
82,749
750,453
108,483
95,788
28,827
20,707
454,392
226,806
29,478
58,331
258,841
189,151
147,659
77,476
170,541
134,406
40,737
154,636
130,305
440,749
163,840
129,492
214,091
27,359
68,666
56,178
26,262
238,097
31,092
479,315
280,832
25,384
565,185
104,766
118,292
403,413
22,157
102,518
26,840
198,928
744,623
62,449
16,313
224,507
260,843
69,923
228,749
25,114
8,792,271
Percent
with
collections
58.7%
72.1
52.7
68.0
46.1
77.3
49.3
42.5
32.8
57.4
56.8
31.4
48.4
51.2
54.1
78.0
61.0
52.4
47.7
59.9
60.4
48.3
47.2
66.1
40.4
60.0
71.2
65.2
48.2
73.9
68.5
46.3
53.7
66.7
61.8
57.8
56.0
52.2
83.8
39.0
45.3
60.7
47.3
67.7
82.9
74.1
65.2
75.3
59.5
64.4
72.0
57.0
Source: U.S. Department of Health and Human Services, Administration for Children and Families, Office of Child Support Enforcement, FY 2008
Annual Report to Congress, Tables 49, 55 and 61, at http://www.acf.hhs.gov/programs/cse/pubs/2011/reports/fy2008_annual_report/#iii.
Calculations by Children’s Defense Fund.
State of America’s Children® 2011
D-13
The Supplemental Security Income Program helped more than one million
children with disabilities in December 2009.
Children Receiving Supplemental Security
Income (SSI), December 2009
Number
Alabama
Alaska
Arizona
Arkansas
California
Colorado
Connecticut
Delaware
District of Columbia
Florida
Georgia
Hawaii
Idaho
Illinois
Indiana
Iowa
Kansas
Kentucky
Louisiana
Maine
Maryland
Massachusetts
Michigan
Minnesota
Mississippi
Missouri
Montana
Nebraska
Nevada
New Hampshire
New Jersey
New Mexico
New York
North Carolina
North Dakota
Ohio
Oklahoma
Oregon
Pennsylvania
Rhode Island
South Carolina
South Dakota
Tennessee
Texas
Utah
Vermont
Virginia
Washington
West Virginia
Wisconsin
Wyoming
United States
Average
monthly payment
29,956
1,264
19,943
25,203
109,409
8,120
7,603
3,567
4,485
88,993
39,211
1,697
5,085
45,232
24,832
7,903
8,335
30,326
34,238
3,867
16,435
21,880
40,840
12,620
23,867
21,796
2,436
4,010
7,232
2,274
24,351
8,917
80,169
41,328
1,084
47,459
17,094
9,403
67,969
4,361
20,100
2,328
24,782
120,467
5,093
1,805
23,542
16,719
9,277
19,681
903
$ 589.71
531.68
591.14
592.56
654.35
561.06
579.60
571.68
587.65
581.83
581.79
562.18
566.41
595.41
586.74
565.97
567.17
595.74
595.65
563.85
571.36
621.74
598.00
569.87
592.11
588.39
580.55
560.42
579.16
552.58
585.71
591.21
612.24
572.20
535.62
596.32
582.84
578.42
585.02
626.80
576.03
553.59
583.24
579.83
543.64
623.58
569.44
579.83
586.24
583.71
559.79
1,199,491
581.21
Source: SSI Annual Statistical Report, 2009 (September 2010), Table 17, at
http://www.socialsecurity.gov/policy/docs/statcomps/ssi_asr/2009.
Calculations by Children’s Defense Fund.
D-14
Children’s Defense Fund
More than three million children of disabled, deceased or retired workers receive Social Security benefits.
Children Receiving Social Security Benefits, December 2009
Total
Alabama
Alaska
Arizona
Arkansas
California
Colorado
Connecticut
Delaware
District of Columbia
Florida
Georgia
Hawaii
Idaho
Illinois
Indiana
Iowa
Kansas
Kentucky
Louisiana
Maine
Maryland
Massachusetts
Michigan
Minnesota
Mississippi
Missouri
Montana
Nebraska
Nevada
New Hampshire
New Jersey
New Mexico
New York
North Carolina
North Dakota
Ohio
Oklahoma
Oregon
Pennsylvania
Rhode Island
South Carolina
South Dakota
Tennessee
Texas
Utah
Vermont
Virginia
Washington
West Virginia
Wisconsin
Wyoming
United States
Children under age 18
Children of:
Disabled
Deceased
workers
workers
Retired
workers
Total
Students ages 18–19
Children of:
Disabled Deceased
workers
workers
Retired
workers
77,430
7,258
60,006
48,427
275,723
36,439
30,437
9,566
4,883
183,603
103,662
11,398
15,583
114,205
71,071
25,476
27,071
65,773
64,448
17,384
49,499
64,846
115,523
40,497
52,691
72,059
9,877
15,153
22,895
15,598
75,891
23,891
183,958
105,221
5,008
110,923
45,718
30,953
133,367
10,982
58,273
6,956
82,233
239,687
23,178
6,985
75,463
52,042
28,614
51,415
4,875
43,522
2,425
28,125
28,500
120,910
15,976
15,553
4,912
1,618
84,479
48,045
4,444
8,018
54,176
37,026
12,922
13,489
40,634
31,768
11,736
20,456
41,024
62,716
22,074
28,072
38,651
4,356
7,678
9,795
10,389
37,430
10,851
104,024
55,773
2,351
56,254
22,413
14,421
74,397
6,836
30,011
3,100
42,832
112,016
9,666
4,323
38,965
25,819
17,693
28,530
1,955
28,024
3,740
25,966
16,646
117,281
16,878
11,686
3,929
2,669
76,191
46,183
4,599
6,203
48,286
29,013
10,697
11,545
21,516
28,027
4,559
24,356
19,134
42,700
15,732
20,343
28,539
4,441
6,381
10,249
4,348
30,175
10,875
59,056
41,372
2,294
46,166
19,714
12,636
49,002
3,282
23,464
3,331
33,289
106,268
11,497
1,984
30,028
20,787
9,085
19,275
2,519
5,884
1,093
5,915
3,281
37,532
3,585
3,198
725
596
22,933
9,434
2,355
1,362
11,743
5,032
1,857
2,037
3,623
4,653
1,089
4,687
4,688
10,107
2,691
4,276
4,869
1,080
1,094
2,851
861
8,286
2,165
20,878
8,076
363
8,503
3,591
3,896
9,968
864
4,798
525
6,112
21,403
2,015
678
6,470
5,436
1,836
3,610
401
4,366
331
2,756
2,364
9,012
1,875
1,073
526
170
9,793
6,052
177
696
6,178
5,041
1,417
1,357
3,073
3,261
754
1,476
2,746
5,570
2,353
3,140
4,522
563
766
844
677
3,322
1,016
6,216
5,342
315
7,066
2,811
1,548
7,102
330
3,366
468
4,335
11,494
807
297
3,639
2,836
1,468
2,821
238
1,977
81
961
1,159
2,857
648
397
214
43
3,319
2,234
53
264
2,254
2,143
572
539
1,595
1,253
418
385
1,362
2,297
969
1,353
1,978
204
281
274
354
1,221
358
2,571
2,272
119
2,816
1,085
527
3,019
155
1,427
163
1,799
4,112
247
137
1,443
1,065
751
1,213
77
1,947
188
1,407
958
4,489
989
525
259
103
4,925
3,094
76
347
3,060
2,399
689
658
1,230
1,667
255
885
1,048
2,605
1,096
1,495
2,093
283
398
445
268
1,627
530
2,682
2,515
157
3,415
1,447
769
3,256
122
1,585
259
2,118
5,950
444
107
1,739
1,350
568
1,278
129
442
62
388
247
1,666
238
151
53
24
1,549
724
48
85
864
499
156
160
248
341
81
206
336
668
288
292
451
76
87
125
55
474
128
963
555
39
835
279
252
827
53
354
46
418
1,432
116
53
457
421
149
330
32
3,064,114
1,553,149
1,225,960
285,005
149,766
59,015
71,928
18,823
Source: Social Security Administration, Annual Statistical Supplement to the Social Security Bulletin, 2010 (February 2011), Table 5.J10, at
http://www.ssa.gov/policy/docs/statcomps/supplement/. Calculations by Children’s Defense Fund.
State of America’s Children® 2011
D-15
In every state and the District of Columbia, the monthly Fair Market Rent for a two-bedroom apartment
is more than 40 percent of the state’s minimum wage. In 18 states and District of Columbia
the rent is far beyond affordability at more than half of the state minimum wage.
Rental Housing Affordability
Fair Market Rent vs. Minimum Wage, 2011
Monthly Fair Market
Rent (FMR)
two-bedroom apt.*
Alabama
Alaska
Arizona
Arkansas
California
Colorado
Connecticut
Delaware
District of Columbia
Florida
Georgia
Hawaii
Idaho
Illinois
Indiana
Iowa
Kansas
Kentucky
Louisiana
Maine
Maryland
Massachusetts
Michigan
Minnesota
Mississippi
Missouri
Montana
Nebraska
Nevada
New Hampshire
New Jersey
New Mexico
New York
North Carolina
North Dakota
Ohio
Oklahoma
Oregon
Pennsylvania
Rhode Island
South Carolina
South Dakota
Tennessee
Texas
Utah
Vermont
Virginia
Washington
West Virginia
Wisconsin
Wyoming
United States
$ 536
977
812
536
703
692
951
812
1,461
596
542
1,702
624
579
596
555
576
571
602
674
603
806
608
604
605
541
635
558
875
999
949
580
716
596
593
596
564
712
587
977
567
556
554
595
677
1,197
588
655
526
596
645
Minimum wage**
Hourly
Monthly
$ 7.25
7.75
7.35
6.25
8.00
7.36
8.25
7.25
8.25
7.25
5.15
7.25
7.25
8.25
7.25
7.25
7.25
7.25
7.25
7.50
7.25
8.00
7.40
7.25
7.25
7.25
7.35
7.25
7.55
7.25
7.25
7.50
7.25
7.25
7.25
7.40
7.25
8.50
7.25
7.40
7.25
7.25
7.25
7.25
7.25
8.15
7.25
8.67
7.25
7.25
5.15
$ 1,257
1,343
1,274
1,083
1,387
1,276
1,430
1,257
1,430
1,257
893
1,257
1,257
1,430
1,257
1,257
1,257
1,257
1,257
1,300
1,257
1,387
1,283
1,257
1,257
1,257
1,274
1,257
1,309
1,257
1,257
1,300
1,257
1,257
1,257
1,283
1,257
1,473
1,257
1,283
1,257
1,257
1,257
1,257
1,257
1,413
1,257
1,503
1,257
1,257
893
7.25
1,257
FMR as percent
of minimum
wage
42.7%
72.7
63.7
49.5
50.7
54.2
66.5
64.6
102.2
47.4
60.7
135.4
49.7
40.5
47.4
44.2
45.8
45.4
47.9
51.8
48.0
58.1
47.4
48.1
48.1
43.1
49.8
44.4
66.9
79.5
75.5
44.6
57.0
47.4
47.2
46.5
44.9
48.3
46.7
76.2
45.1
44.2
44.1
47.3
53.9
84.7
46.8
43.6
41.9
47.4
72.3
*Rent for a two-bedroom apartment in the lowest cost metropolitan area in the state.
**In all but 20 states and the District of Columbia, the state minimum wage is the same as the federal minimum wage.
Source: U.S. Department of Housing and Urban Development, Office of the Assistant Secretary for Policy Development and Research, Final FY 2011
Fair Market Rent Documentation System, at http://www.huduser.org/portal/datasets/fmr/fmrs/docsys.html&data=fmr11; and U.S. Department of Labor,
Employment Standards Administration, Age and Hour Division, “Minimum Wage Laws in the States – January 1, 2011,” at
http://www.dol.gov/whd/minwage/america.htm. Calculations by Children’s Defense Fund.
D-16
Children’s Defense Fund
In 2010, four out of 10 Black teens and three out of 10 Hispanic teens were unemployed.
Youth Employment and Unemployment, 2010
Teens Ages 16–19
All races
50
White
Hispanic*
40
43.0%
Black
37.7%
Asian
34.9%
32.2%
30.9%
29.0%
Percent
30
25.9%
25.5%
25.9%
24.8%
23.2%
22.0%
21.0%
20
16.6%
14.5%
10
0
In the labor force
(percent of population)
Unemployed
(percent of labor force)
Employed
(percent of population)
*Persons of Hispanic origin can be of any race.
Note: The labor force is the number of people who are either working (employed) or people who are jobless, looking for jobs
and available to work (unemployed). Persons, such as students, who are not employed and not looking for work are not in the
labor force.
Source: U.S. Department of Labor, Bureau of Labor Statistics, Household Data: Annual Averages,
at <http://stats.bls.gov/cps/home.htm>, Tables 3 and 4.
Unemployment Rates, 2010 Annual Averages
Total, all ages
Ages 16–19
Ages 20–24
Total
All races
White
Black
Asian
Hispanic
9.6%
8.7
16.0
7.5
12.5
25.9%
23.2
43.0
24.8
32.2
15.5
13.5
26.0
12.3
17.4
All races
White
Black
Asian
Hispanic
10.5
9.6
18.4
7.8
12.7
28.8
26.3
45.4
25.8
34.6
17.8
15.7
29.8
14.2
18.2
Females
All races
White
Black
Asian
Hispanic
8.6
7.7
13.8
7.1
12.3
22.8
20.0
40.5
23.7
29.1
13.0
11.0
22.6
10.2
16.2
Males
Source: U.S. Department of Labor, Bureau of Labor Statistics, Household Data: Annual Averages, at <http://stats.bls.gov/cps/home.htm>,
Tables 3 and 4.
State of America’s Children® 2011
D-17
One in four teens ages 16–19 were unemployed in 2010. The unemployment rate for
young adults ages 20–24 increased slightly to 15 percent in 2010.
Employment and Unemployment Among Teens and Young Adults, 2008 and 2010
Labor Force Participation Rate 1
Ages 16–19
Ages 20–24
2009
2010
2009
2010
Unemployment Rate 2
Ages 16–19
Ages 20–24
2009
2010
2009
2010
Alabama
Alaska
Arizona
Arkansas
California
Colorado
Connecticut
Delaware
District of Columbia
Florida
Georgia
Hawaii
Idaho
Illinois
Indiana
Iowa
Kansas
Kentucky
Louisiana
Maine
Maryland
Massachusetts
Michigan
Minnesota
Mississippi
Missouri
Montana
Nebraska
Nevada
New Hampshire
New Jersey
New Mexico
New York
North Carolina
North Dakota
Ohio
Oklahoma
Oregon
Pennsylvania
Rhode Island
South Carolina
South Dakota
Tennessee
Texas
Utah
Vermont
Virginia
Washington
West Virginia
Wisconsin
Wyoming
38.0%
42.8
33.0
36.7
31.1
43.5
40.6
39.0
25.8
33.0
30.1
34.1
43.9
37.1
33.0
58.1
50.0
42.5
32.9
51.5
38.3
38.3
40.4
53.6
26.8
50.2
42.2
55.2
36.0
46.0
29.7
31.7
29.7
36.0
51.5
47.6
38.8
41.2
44.4
47.8
34.0
55.3
36.0
35.6
50.7
45.9
35.9
43.0
33.9
54.5
52.7
31.4%
42.7
30.9
36.3
28.1
36.3
40.4
32.4
22.2
29.3
25.0
29.3
45.9
35.6
32.0
52.9
48.7
41.8
31.2
49.1
37.6
36.6
40.8
51.3
31.2
43.1
39.2
49.4
36.3
43.3
29.7
28.8
28.4
29.4
51.7
43.2
37.9
41.1
40.7
45.3
32.5
49.9
34.2
32.9
45.7
48.6
36.8
40.5
31.9
49.4
49.5
72.6%
75.2
73.5
80.1
70.1
77.9
74.9
74.7
70.7
72.7
66.2
70.7
80.3
71.5
72.6
82.7
80.7
76.9
69.2
76.6
72.2
73.0
73.5
81.5
65.9
75.8
75.6
81.7
76.7
74.4
72.7
65.5
67.4
74.5
82.5
77.3
74.8
76.5
74.3
76.9
73.6
75.0
70.7
69.3
77.4
79.7
77.8
76.7
72.0
82.1
81.1
70.2%
73.7
73.2
71.1
67.5
76.9
71.2
70.9
67.2
69.8
67.9
72.1
73.0
70.1
70.2
82.2
75.5
72.0
70.2
76.0
73.5
68.0
73.7
80.4
67.9
73.5
77.5
81.4
75.4
75.9
66.7
66.3
66.2
73.9
81.5
76.1
72.6
76.3
70.6
79.2
68.0
76.1
72.0
70.4
79.8
76.9
75.5
74.6
67.0
81.1
76.3
27.9%
14.7
31.1
29.6
32.8
24.7
18.8
25.0
49.1
24.0
29.0
23.2
20.2
25.8
21.3
16.4
18.8
24.0
19.6
25.7
22.5
16.2
26.5
21.1
30.3
23.0
18.7
9.9
31.5
18.5
21.6
20.0
26.7
25.7
12.3
21.5
18.9
31.2
20.6
30.8
30.3
10.0
28.5
20.8
16.3
15.8
22.9
30.5
22.8
18.7
16.8
30.9%
18.9
31.5
28.2
34.4
25.3
21.9
23.1
49.8
31.4
36.3
26.5
26.7
27.5
27.7
16.4
18.4
25.4
23.8
21.8
23.0
21.4
28.3
21.1
33.2
22.5
25.0
13.1
32.8
18.0
20.9
28.7
25.1
27.0
12.5
23.6
22.0
28.8
18.9
25.9
32.2
13.7
26.2
22.3
20.5
14.2
23.3
34.1
27.0
19.2
20.1
20.2%
11.2
15.6
10.2
16.9
11.0
13.3
12.3
16.9
16.1
16.6
12.3
18.3
16.3
19.9
10.7
10.4
17.7
15.5
15.0
12.4
13.5
16.7
12.6
15.2
16.0
11.9
7.7
15.6
9.4
12.7
11.8
14.8
18.3
6.5
16.0
9.1
16.8
12.1
15.2
16.9
9.3
18.7
12.0
13.3
12.2
10.2
13.7
14.7
12.7
10.8
20.9%
11.8
17.5
12.4
19.0
13.4
16.3
15.9
16.5
18.2
18.4
11.0
14.9
13.2
19.1
9.2
13.1
18.5
16.7
15.0
12.6
13.6
13.7
9.5
17.7
16.7
13.3
7.6
19.6
9.0
14.0
11.7
13.8
18.4
6.9
18.9
10.7
14.4
16.8
15.8
20.6
11.0
15.6
12.0
12.3
11.4
12.5
17.3
19.2
15.0
12.5
United States
37.5
34.9
72.9
71.4
24.3
25.9
14.7
15.5
1 Percent
of the age group that is employed.
of the labor force in the age group that is unemployed, that is, looking for a job.
Source: U.S. Department of Labor, Bureau of Labor Statistics, Employment status of the civilian noninstitutional population by sex, race, Hispanic or Latino
ethnicity, and detailed age, 2009 annual averages, preliminary, at http://stats.bls.gov/lau/ptable14full2009.pdf; and U.S. Department of Labor, Bureau of Labor
Statistics, Employment status of the civilian noninstitutional population by sex, race, Hispanic or Latino ethnicity, and detailed age, 2010 annual averages,
preliminary, at http://stats.bls.gov/lau/ptable14full2010.pdf.
2 Percent
D-18
Children’s Defense Fund
The percent of teens without jobs in July 2010 was higher than at any time
in the past five decades.
Youth Unemployment and Joblessness, 1959–2010
Youth Jobless
Rate for July 2
Total Unemployment Rates 1
All
Ages
1959
1960
1961
1962
1963
1964
1965
1966
1967
1968
1969
1970
1971
1972
1973
1974
1975
1976
1977
1978
1979
1980
1981
1982
1983
1984
1985
1986
1987
1988
1989
1990
1991
1992
1993
1994
1995
1996
1997
1998
1999
2000
2001
2002
2003
2004
2005
2006
2007
2008
2009
2010
1 Percent
5.5%
5.5
6.7
5.5
5.7
5.2
4.5
3.8
3.8
3.6
3.5
4.9
5.9
5.6
4.9
5.6
8.5
7.7
7.1
6.1
5.8
7.1
7.6
9.7
9.6
7.5
7.2
7.0
6.2
5.5
5.3
5.5
6.7
7.4
6.8
6.1
5.6
5.4
4.9
4.5
4.2
4.0
4.7
5.8
6.0
5.5
5.1
4.6
4.6
5.8
9.3
9.6
Ages
16–19
Ages
20–24
Ages
16–19
14.6%
14.7
16.8
14.7
17.2
16.2
14.8
12.8
12.9
12.7
12.2
15.3
16.9
16.2
14.5
16.0
19.9
19.0
17.8
16.4
16.1
17.8
19.6
23.2
22.4
18.9
18.6
18.3
16.9
15.3
15.0
15.5
18.6
20.0
19.0
17.6
17.3
16.7
16.0
14.6
13.9
13.1
14.7
16.5
17.5
17.0
16.6
15.4
15.7
18.7
24.3
25.9
8.5%
8.7
10.4
9.0
8.8
8.3
6.7
5.3
5.7
5.8
5.7
8.2
10.0
9.3
7.8
9.1
13.6
12.0
11.0
9.6
9.1
11.5
12.3
14.9
14.5
11.5
11.1
10.7
9.7
8.7
8.6
8.8
10.8
11.3
10.5
9.7
9.1
9.3
8.5
7.9
7.5
7.1
8.3
9.7
10.0
9.4
8.8
8.2
8.2
10.2
14.7
15.5
49.2%
47.4
49.5
48.0
51.9
50.8
47.9
44.0
44.1
44.7
43.4
45.5
46.4
44.8
42.7
43.0
45.4
43.4
42.4
39.9
40.1
42.2
44.3
47.9
46.5
43.3
43.4
43.3
42.7
40.4
40.4
43.6
47.7
48.0
46.7
46.0
45.2
46.0
47.0
45.3
45.5
46.5
48.5
52.3
56.3
56.1
55.7
55.1
57.7
60.8
65.0
68.7
of the labor force unemployed
2 This
rate is derived from substracting the employment-population radio from 100. The employment-population ratio (not seasonally adjusted),
which is the percent of the youth population ages 16-19 without a job.
Source: U.S. Department of Labor, Bureau of Labor Statistics. Calculations by Children’s Defense Fund.
State of America’s Children® 2011
D-19
After a 25 percent decrease in the number of homeless children and youth in public schools
between the 2005 and 2006 school years, the number has increased in most states and increased
41 percent nationally between the 2006–2007 and 2008–2009 school years.
Homeless Children and Youth Enrolled in Public Schools
2006–2007
2007–2008
2008–2009
Percent change
between 2006–2007
and 2008–2009
Alabama
Alaska
Arizona
Arkansas
California
Colorado
Connecticut
Delaware
District of Columbia
Florida
Georgia
Hawaii
Idaho
Illinois
Indiana
Iowa
Kansas
Kentucky
Louisiana
Maine
Maryland
Massachusetts
Michigan
Minnesota
Mississippi
Missouri
Montana
Nebraska
Nevada
New Hampshire
New Jersey
New Mexico
New York
North Carolina
North Dakota
Ohio
Oklahoma
Oregon
Pennsylvania
Rhode Island
South Carolina
South Dakota
Tennessee
Texas
Utah
Vermont
Virginia
Washington
West Virginia
Wisconsin
Wyoming
10,907
3,216
19,628
7,080
178,014
11,978
1,980
1,842
824
30,554
14,017
1,132
1,875
19,821
8,249
2,886
3,569
18,337
34,102
1,055
8,456
11,863
24,066
6,008
12,856
13,620
2,202
1,633
5,374
1,983
4,279
4,383
44,018
12,659
1,209
13,578
8,284
15,517
12,935
667
6,033
1,038
6,567
33,896
9,991
764
9,898
16,853
2,984
8,103
675
11,687
2,963
21,380
5,917
224,249
12,302
2,017
1,982
1,005
33,993
15,700
925
2,125
26,238
8,480
5,918
4,890
17,735
29,234
1,379
8,813
12,449
18,435
8,163
9,926
11,977
887
1,530
6,647
2,087
6,033
6,152
71,218
16,937
686
14,483
9,179
15,839
11,756
746
7,413
1,430
8,031
53,242
11,270
789
11,776
18,670
2,909
9,331
732
12,859
3,401
25,336
6,344
288,233
15,834
2,387
2,598
950
40,967
24,079
1,739
2,710
26,688
10,364
6,824
6,700
22,626
25,362
1,300
10,676
12,269
18,706
7,590
8,525
14,350
1,308
1,752
8,670
2,130
7,890
8,380
76,117
18,693
1,149
16,059
12,139
18,051
12,438
1,099
8,738
1,794
9,836
80,940
14,016
662
12,768
20,780
4,257
10,955
724
17.9%
5.8
29.1
-10.4
61.9
32.2
20.6
41.0
15.3
34.1
71.8
53.6
44.5
34.6
25.6
136.5
87.7
23.4
-25.6
23.2
26.3
3.4
-22.3
26.3
-33.7
5.4
-40.6
7.3
61.3
7.4
84.4
91.2
72.9
47.7
-5.0
18.3
46.5
16.3
-3.8
64.8
44.8
72.8
49.8
138.8
40.3
-13.4
29.0
23.3
42.7
35.2
7.3
United States
673,458
789,655
950,762
41.2
Sources: National Center for Homeless Education, Education for Homeless Children and Youths Program: Data Collection Summary, Analysis of Data
(June 2010), Table 3. Calculations by Children’s Defense Fund.
D-20
Children’s Defense Fund
The number of homeless preschool-age children increased by 43 percent
in the past two school years.
Homeless Preschool Children,* 2006–2009
33,433
(43.0% increase
from 2006–2007)
40,000
27,784
(18.8% increase)
30,000
Number
23,385
20,000
10,000
0
2007–2008
2006–2007
2008–2009
* Ages 3-5 not kindergarten.
Sources: National Center for Homeless Education, Education for Homeless Children and
Youths Program: Data Collection Summary, Analysis of Data (June 2010), Table 5. Calculations by Children’s Defense Fund.
A growing number of Limited English Proficiency and unaccompanied youth enrolled in
school are becoming homeless. The number of homeless students who are LEP, children
with disablities and unaccompanied youth is growing.
Subpopulations of Homeless Students*
Number of enrolled children
2006–2007
2007–2008
2008–2009
Limited English Proficiency (LEP)
Children with Disabilities (IDEA)
Migratory Children/Youth
Unaccompanied Youth**
47,881
51,924
8,862
31,290
62,361
66,306
7,754
43,172
80,525
72,984
8,204
52,950
Percent change between
2006–2007 and
2008–2009
68.2%
40.6
-7.4
69.2
* Served in local education agencies (LEAs) with McKinney-Vento subgrants
** Youth who are not in the physical custody of a parent or guadian.
Sources: National Center for Homeless Education, Education for Homeless Children and Youths Program: Data Collection Summary, Analysis of Data
(June 2010), Table 9. Calculations by Childre’s Defense Fund.
State of America’s Children® 2011
D-21
Two-thirds of homeless children and youth enrolled in school are living doubled up, meaning
they are living with another family, and just under a third are living in shelters.
The number of homeless students who are unsheltered has declined but is still far too high.
Primary Nighttime Residence for Homeless Children and Youth
Enrolled in Public Schools
Number of homeless children
and youths
2006–2007
2007–2008
2008–2009
Shelters
Doubled Up
Unsheltered
Hotels/Motels
Total
161,640
420,995
54,422
51,117
688,174
164,982
502,082
50,445
56,323
773,832
Percent change between
2006–2007 and
2008–2009
211,152
606,764
39,678
57,579
915,173
Primary Nighttime Residence, 2008–2009
Unsheltered
4.8%
Hotels/motels
6.8%
Shelters
28.1%
Doubled Up
66.3%
Sources: National Center for Homeless Education, Education for Homeless Children and Youths Program:
Data Collection Summary, Analysis of Data (June 2010), Table 7. Calculations by Children’s Defense Fund.
D-22
Children’s Defense Fund
30.6
44.1
-27.1
12.6
33.0
Child Health
W
ithout a healthy start in life, a child can fall behind developmentally and have trouble catching
up, physically, emotionally, socially and academically. Unmet health and mental health needs
greatly increase the likelihood of a child entering the cradle to prison pipeline. The lack of access to
health care often is a result of the lack of health coverage. While Medicaid and the Children’s Health
Insurance Program (CHIP) provide health coverage to more than 36 million children each year, still
more than 8 million children – one in 10 – remain uninsured. Two-thirds of these uninsured children
are eligible for coverage in Medicaid or CHIP but are not enrolled largely due to state-imposed barriers
that differ across states. Children of color are disproportionately uninsured and as a result suffer more
from preventable and treatable health conditions from birth through adulthood.
• One in five American Indian children, one in six Hispanic children and one in eight
Black children are uninsured compared to one in 14 White children.
• Black and Hispanic children, poor children and uninsured children are more likely
than White, higher income and insured children to be in poor health. Black and
Hispanic children are almost three times as likely to be in poor or only fair health as
White children, and are more likely to have an unmet medical need due to cost than
White children.
• The United States has the second-highest infant mortality rate among 32 industrialized
nations, and its low birthweight rate is tied for 22nd among those same 32 nations.
Infants born to Black mothers are almost twice as likely to be born at low birthweight
as infants born to White mothers, and more than twice as likely to die before their
first birthday. The rate of babies born at low birthweight has increased by 22 percent
since 1984. After four decades of decline, infant mortality rates increased in 2002 and
again in 2005 and 2007.
• Overall, children from different races and ethnicities have very similar immunization
rates. However, income matters: poor Black children are less likely to be fully immunized
than higher-income Black children.
• Medicaid and the Children’s Health Insurance Program (CHIP) work for children.
The challenge is getting all children who are eligible enrolled. Currently these programs
insure one in three children in the U.S. who would otherwise likely go uninsured.
Although still too high, the number of uninsured children in America is the lowest it
has been in 20 years.
E-2
Children’s Defense Fund
More than half of all uninsured children are Hispanic or Black.
Overall, however, the largest number of uninsured children are White.
Uninsured Children, 2009
Of the 8.3 million uninsured children*:
Percent of
the uninsured
Uninsured
number***
Upper limit,
annual income
for family of 4
Race/Ethnicity**
White
Hispanic
Black
Asian/Pacific Islander
American Indian
Other (multi-racial)
Total
38.5
37.8
16.2
4.5
1.3
1.6
100.0
3.2 million
3.1 million
1.3 million
375,000
110,000
134,000
8.3 million
Age
Birth through age 5
Age 6 through age 12
Age 13 through age 18
Total
28.4
33.5
38.1
100.0
2.4 million
2.8 million
3.2 million
8.3 million
Income
100% poverty & below
Over 100% through 200%
Over 200% through 300%
Over 300% through 400%
Over 400%
Total
31.8
32.0
17.4
8.4
10.4
100.0
2.6 million
2.6 million
1.4 million
694,000
863,000
8.3 million
$22,350
$44,700
$67,050
$89,400
43.6
63.8
81.2
3.6 million
5.3 million
6.7 million
$29,726
$44,700
$67,050
Any earned income
Income from work
No income from work
Total
84.8
15.2
100.0
7.0 million
1.3 million
8.3 million
Citizenship
Child is a U.S. citizen
Child is not a U.S. citizen
Total
90.0
10.0
100.0
7.5 million
826,000
8.3 million
Selected income groups:
133% and below
200% and below
300% and below
* Children are ages birth through 18
** Hispanic children are in a separate category and are not included in the other racial categories
*** Numbers sometimes will not add to total because of rounding
SOURCES: U.S. Census Bureau: 2010 Annual Social and Economic Supplement (ASEC) to the Current Population Survey; and
Income for Federal Poverty Levels: 2011 Poverty Guidelines for 48 Continguous States and the District of Columbia. Federal
Register, January 20, 2011: Vol 76(13), pp. 3637-3638. Calculations by the Children's Defense Fund.
State of America’s Children® 2011
E-3
Hispanic and American Indian children are more than twice as likely as White children to be
uninsured. Children in families below 200 percent of the poverty level are more likely
to be uninsured than families above that level.
Odds of Being Uninsured: Children’s Coverage in 2009
One out of every 10 children in the United States is uninsured.
Percent who
are uninsured
One out of
every:
Number who
are uninsured
All Children
10.4
10
8.3 million
Race/Ethnicity
White
Hispanic
Black
Asian/Pacific Islander
American Indian
Other (multi-racial)
7.3
17.5
11.9
10.6
18.3
5.8
14
6
8
9
5
17
3.2 million
3.1 million
1.3 million
375,000
110,000
134,000
Age
Birth through age 5
Age 6 through age 12
Age 13 through age 18
9.2
9.7
12.5
11
10
8
2.4 million
2.8 million
3.2 million
Income
100% poverty & below
Over 100% through 200%
Over 200% through 300%
Over 300% through 400%
Over 400%
15.8
15.7
10.3
7.0
4.0
6
6
10
14
25
2.6 million
2.6 million
1.4 million
694,000
863,000
133% and below
16.1
6
Any family income from work
No income in family from work
9.9
15.7
10
6
7.0 million
1.3 million
Citizenship
Child is a U.S. citizen
Child is not a U.S. citizen
9.7
33.6
10
3
7.5 million
826,000
Note: Children are ages birth through 18
* Hispanic children are in a separate category and are not included in the other racial categories
** Numbers sometimes will not add to total because of rounding
SOURCES: U.S. Census Bureau: 2010 Annual Social and Economic Supplement (ASEC) to the Current Population Survey; and Income for Federal
Poverty Levels: 2011 Poverty Guidelines for 48 Continguous States and the District of Columbia. Federal Register, January 20, 2011: Vol 76(13),
pp. 3637-3638. Calculations by the Children’s Defense Fund.
E-4
Children’s Defense Fund
One in five American Indian children, one in six Hispanic children and one in eight Black children
are uninsured compared to one in 14 White children.
Percentage of Children Who Are Uninsured, 2009
Children Under Age 19
20
18.3%
17.5%
15
Percent uninsured
11.9%
10.6%
10.4%
10
7.3%
5
0
Total,
All Races
American
Indian
Hispanic
Black
Asian/Pacific
Islander
White
Source: U.S. Department of Commerce, Bureau of the Census, 2009 Annual Social and Economic Supplement
to the Current Population Survey. Calculations by Children’s Defense Fund.
Texas and California have more than one million uninsured children each.
Ten States Where the Majority
of Uninsured Children Live
Texas
California
Florida
New York
Georgia
North Carolina
North Carolina
Illinois
New Jersey
Ohio
Number
uninsured
Percent
uninsured
1,392,000
1,119,000
786,000
382,000
316,000
277,000
277,000
259,000
244,000
227,000
19.2%
11.2
18.3
8.1
11.6
11.5
11.5
7.7
11.3
7.9
Ten States With the Largest Percentages
of Uninsured Children
Texas
Florida
Nevada
New Mexico
Arizona
South Carolina
Mississippi
Alaska
Colorado
Montana
Percent
uninsured
Number
uninsured
19.2%
18.3
15.9
15.5
14.8
13.6
12.8
12.2
12.0
11.8
1,392,000
786,000
113,000
84,000
269,000
156,000
104,000
24,000
155,000
28,000
State of America’s Children® 2011
E-5
A child in Texas is six times as likely to be uninsured as a child in Massachusetts.
The odds of Texas children being uninsured are double those in 32 other states.
Uninsured Children in the States, 2007–2009
Estimated
number
Alabama
Alaska
Arizona
Arkansas
California
Colorado
Connecticut
Delaware
District Of Columbia
Florida
Georgia
Hawaii
Idaho
Illinois
Indiana
Iowa
Kansas
Kentucky
Louisiana
Maine
Maryland
Massachusetts
Michigan
Minnesota
Mississippi
Missouri
Montana
Nebraska
Nevada
New Hampshire
New Jersey
New Mexico
New York
North Carolina
North Dakota
Ohio
Oklahoma
Oregon
Pennsylvania
Rhode Island
South Carolina
South Dakota
Tennessee
Texas
Utah
Vermont
Virginia
Washington
West Virginia
Wisconsin
Wyoming
81,000
24,000
269,000
71,000
1,119,000
155,000
57,000
20,000
9,000
786,000
316,000
14,000
46,000
259,000
116,000
41,000
68,000
101,000
131,000
15,000
118,000
49,000
147,000
81,000
104,000
138,000
28,000
43,000
113,000
15,000
244,000
84,000
382,000
277,000
12,000
227,000
111,000
107,000
222,000
20,000
156,000
20,000
140,000
1,392,000
101,000
9,000
169,000
108,000
23,000
77,000
13,000
United States (2009)*
8.3 million
Percent
6.8%
12.2
14.8
9.5
11.2
12.0
6.6
9.0
7.3
18.3
11.6
4.7
10.3
7.7
6.9
5.4
9.2
9.4
11.0
5.2
8.2
3.2
5.9
6.1
12.8
9.1
11.8
9.1
15.9
4.7
11.3
15.5
8.1
11.5
7.6
7.9
11.4
11.6
7.5
8.0
13.6
9.3
8.9
19.2
11.0
6.5
8.6
6.5
5.6
5.5
9.3
10.4
Children are defined as ages birth to 18.
* The percentage and number of uninsured children in the United States are from the most recent year of data and represent coverage in 2009.
NOTES: The estimated percentage of uninsured children in each state is an average of the percentage of uninsured children in that state over
three years. Three-year averages are used because of small sample sizes in some states. The average percentage of uninsured children in this
table is based on the 2008, 2009 and 2010 ASEC surveys. The estimated number of uninsured children in each state is calculated by applying
that average percentage to the most recent Census estimate of children younger than 19 in the state.
SOURCES: U.S. Census Bureau 2008, 2009, 2010 Annual Social & Economic Supplement (ASEC) to the Current Population Survey (CPS);
Annual Estimates of the Resident Population by Single-Year of Age and Sex for the United States and States, April 1, 2000 to July 1, 2009,
http://www.census.gov/popest/states/asrh/ files/SC-EST2009-AGESEX-RES.csv
E-6
Children’s Defense Fund
Black and Hispanic children are almost three times as likely to be in
poor or only fair health as White children.
Children’s Health Status, 2009
Percent of Children* Who:
Were in only
fair or poor
health
Were ever told
by doctor they
had asthma
Missed one
or more weeks
of school due
to illness
Made two or more
visits to the
emergency room
Race/ethnicity
White, non-Hispanic
Black, non-Hispanic
Asian, non-Hispanic
Hispanic
Insurance status
Uninsured
Insured
Family income
Under 100% of poverty
100% to 199% of poverty
200% of poverty or more
1.1%
3.0
—
3.1
12.6%
21.7
12.0
12.3
28.5%
22.4
14.8
20.1
6.2%
10.8
—
6.7
2.0
1.8
11.1
14.1
20.4
25.8
5.8
7.0
3.6
2.5
18.0
14.0
26.3
28.8
11.8
7.7
0.9
12.6
24.0
4.9
* Children ages 0 through 18, with exception of school days missed, which includes only children ages 5 through 17.
— Sample too small to calculate reliable rates
SOURCE: U.S. Department of Health and Human Services, National Center for Health Statistics, 2009 National Health Interview Survey.
Calculations by the Children’s Defense Fund.
State of America’s Children® 2011
E-7
Hispanic children are 76 percent more likely and Black children are 50 percent more likely
than White children to have an unmet medical need due to cost.
Children’s Access to Health Care, 2009
Percent of Children* Who Had:
No usual
place of
care
Race/ethnicity
White, non-Hispanic
Black, non-Hispanic
Asian, non-Hispanic
Hispanic
Insurance status
Uninsured
Insured
Family income
Under 100% of poverty
100% to 199% of poverty
200% of poverty or more
4.3%
4.8
5.7
8.6
More than two
years since
contact with
health provider**
2.3%
2.9
—
5.6
Delayed
medical care
due to cost
4.6%
4.8
2.3
6.0
Unmet
medical
need
2.1%
3.1
—
3.7
28.9
3.2
15.6
2.0
22.6
3.2
14.2
1.6
8.0
6.3
3.9
5.2
3.9
2.2
5.6
6.7
3.9
3.4
3.3
2.0
* Children ages 0 through 18.
** Includes children who had never seen a health provider
— Sample too small to calculate reliable rates
SOURCE: U.S. Department of Health and Human Services, National Center for Health Statistics, 2009 National Health Interview Survey.
Calculations by the Children’s Defense Fund.
E-8
Children’s Defense Fund
Hispanic children are 77 percent more likely than White children to have an unmet dental need.
Children without insurance are almost three times as likely as others
to have not seen a dentist in more than two years.
Children’s Dental Health and Access to Dental Care, 2009
Percent of Children* Who Had:
More than two
years since last
dental contact**
Unmet
dental need
Race/ethnicity
White, non-Hispanic
Black, non-Hispanic
Asian, non-Hispanic
Hispanic
12.9%
15.9
18.8
17.8
6.0%
6.5
4.5
10.6
Insurance status
Uninsured
Insured
35.2
13.0
27.2
5.1
Family income
Under 100% of poverty
100% to 199% of poverty
200% of poverty or more
18.9
17.5
12.2
9.6
10.3
4.6
* Children ages 2 through 18.
** Includes children who had never seen a dental provider.
SOURCE: U.S. Department of Health and Human Services, National Center for Health Statistics, 2009 National Health Interview Survey.
Calculations by the Children’s Defense Fund.
State of America’s Children® 2011
E-9
More than one in three children in low-income families (below 200 percent of poverty)
is overweight or obese. Black teens are 26 percent and Hispanic teens are
32 percent more likely than White teens to be overweight or obese.
Overweight* and Obesity* Among Children and Teens, 2007–2008
Percent of children and teens who are:
Overweight
Overweight
Obese
or obese
Total, all races
Ages 2 to 5
Ages 6 to 11
Ages 12 to 19
Ages 2 to 19
10.8%
15.9
16.1
14.8
10.4%
19.6
18.1
16.9
21.2%
35.5
34.2
31.7
8.3
15.5
15.7
14.0
9.1
19.0
15.6
15.3
17.4
34.5
31.3
29.3
14.6
18.2
15.1
15.9
11.4
19.4
24.4
20.0
26.0
37.6
39.5
35.9
13.5
17.5
19.5
17.3
14.2
25.1
21.7
20.9
27.7
42.6
41.2
38.2
Insurance status
Uninsured
Insured
16.6
15.4
14.9
14.5
31.4
29.9
Family income
Under 100% of poverty
100% to 199% of poverty
200% of poverty or more
18.5
16.3
14.3
16.0
17.7
13.1
34.6
34.0
27.4
White, non-Hispanic
Ages 2 to 5
Ages 6 to 11
Ages 12 to 19
Ages 2 to 19
Black, non-Hispanic
Ages 2 to 5
Ages 6 to 11
Ages 12 to 19
Ages 2 to 19
Hispanic
Ages 2 to 5
Ages 6 to 11
Ages 12 to 19
Ages 2 to 19
Adolescents ages 12 to 19:
* Overweight and obesity are determined from the body mass index (BMI) for each child. A child is overweight if his or her BMI is at or above the 85th percentile
but below the 95th percentile for age. A child is obese if his or her BMI is at or above the 95th percentile for age. BMI percentiles are in U.S. Department of
Health and Human Services, National Center for Health Statistics, 2000 CDC Growth Charts for the United States: Methods and Development, Vital and Health
Statistics, Series 11, Number 246 (May 2002).
Sources: Data by race/ethnicity are from the U.S. Department of Health and Human Services, National Center for Health Statistics, 2007–2008 National Health
and Nutrition Examination Survey, C.L. in Ogden, M.D. Carroll, L.R. Curtin, et al., Prevalence of High Body Mass in U.S. Children and Adolescents, 2007–2008,
JAMA, at http://jama.ama-assn.org/cgi/content/full/2009.2012v1. Data on insurance coverage and poverty status, available only for children and teens ages 12
through 19, are from the U.S. Department of Health and Human Services, National Center for Health Statistics, 2008 National Health Interview Survey.
Calculations by Children’s Defense Fund.
E-10
Children’s Defense Fund
Overall children from different races and ethnicities have very similar immunization rates.
However, income affects Black children in particular, with poor Black children less
likely to be fully immunized than higher-income Black children.
Immunization of Two-Year-Olds,*
by Race/Ethnicity and Poverty Status, 2009
Percent Fully Immunized
4:3:1:3:3:1 Series**
All income levels
Total, all races
White
Black
Hispanic****
American Indian/ Alaska Native
Asian
Multiracial
4:3:1:3:3:1:4 Series***
69.9%
69.2
66.6
72.8
73.4
69.9
67.1
63.6 %
64.1
58.2
67.1
—
55.0
57.2
Below poverty
Total, all races
White
Black
Hispanic****
American Indian/Alaska Native
Asian
Multiracial
68.4
67.7
63.6
71.2
n/a
n/a
n/a
60.7
61.7
55.1
65.5
n/a
n/a
n/a
At or above poverty
Total, all races
White
Black
Hispanic****
American Indian/Alaska Native
Asian
Multiracial
70.4
69.4
71.2
73.6
—
69.2
69.8
64.8
64.5
62.8
68.2
—
60.4
61.0
*Children ages 19 through 35 months
** Because of shortages in the Hib vaccine, CDC published additional data on immunization series excluding the Hib vaccine from the series
*** Primary series of Hib vaccines completed (2 or 3 doses, depending on brand); see note below.
**** Hispanic children not included in any of the racial groups
Note: The 4:3:1:3:3:1 series includes 4 or more doses of DTP/DT/DTaP, 3 or more doses of poliovirus vaccine, 1 or more doses of any measles-containing vaccine, 3 or more doses of Hib vaccine, 3 or more doses of hepatitis B vaccine, and 1 or more doses of varicella vaccine. The 4:3:1:3:3:1:4
series additionally includes 4 or more doses of PCV. In 2009, CDC tested a more precise measurement for Hib vaccines because, depending on the
brand, a child could have completed the full primary series with either 2 or 3 doses, or could be fully vaccinated for Hib (primary series plus booster
dose) with either 3 or 4 doses. A new series was created with 4 in the Hib dosage location that indicates fully vaccinated (either 3 or 4 doses,
depending on brand). The complex nature of these measurement changes is compounded by the Hib vaccine shortage which led to temporary
recommendations for all two-year-olds to complete the primary series rather than the full Hib vaccine series. CDC published limited data on a series
labeled -S which indicates completion rate for the primary Hib series.
n/a - data not available
— Sample size too small for reliability.
from the table.
There were very few reliable measurements for Native Hawaiian/Pacific Islanders, so this group was excluded
Sources: Centers for Disease Control and Prevention, 2009 National Immunization Survey: tab27a_431331_race_iap-2.xls, tab28a_4314314_race_
iap.xls, tab32_pov_race.xls.
Accessed at: http://www.cdc.gov/vaccines/stats-surv/nis/data/tables_2009.htm#top, November 2010. MMWR: Changes in Measurement of Haemophilus
influenzae serotype b (Hib) Vaccination Coverage — National Immunization Survey, United States, 2009, Vol 59:(33), August 27, 2010; and National,
State, and Local Area Vaccination Coverage Among Children Aged 19-35 Months — United States, 2009, Vol 59:(36), September 17, 2010.
State of America’s Children® 2011
E-11
Immunization rates fell in many states between 2008 and 2009 because of a shortage of the Hib vaccine,
which protects children against a severe bacterial infection.
Estimated Immunization Coverage in 2009 with
Recommended Series Among Two-Year-Olds*
Percent of children fully immunized
4:3:1:3:3:1**
4:3:1:3:3:1:4***
Alabama
Alaska
Arizona
Arkansas
California
Colorado
Connecticut
Delaware
District of Columbia
Florida
Georgia
Hawaii
Idaho
Illinois
Indiana
Iowa
Kansas
Kentucky
Louisiana
Maine
Maryland
Massachusetts
Michigan
Minnesota
Mississippi
Missouri
Montana
Nebraska
Nevada
New Hampshire
New Jersey
New Mexico
New York
North Carolina
North Dakota
Ohio
Oklahoma
Oregon
Pennsylvania
Rhode Island
South Carolina
South Dakota
Tennessee
Texas
Utah
Vermont
Virginia
Washington
West Virginia
Wisconsin
Wyoming
US National****
73.3%
63.8
69.9
63.1
74.9
65.2
46.5
65.3
75.0
74.7
69.3
66.9
51.7
72.6
65.9
65.6
77.0
65.6
76.9
52.5
79.9
81.1
71.0
57.6
73.3
60.5
55.2
59.9
59.4
78.7
67.2
68.2
69.1
55.8
56.4
73.8
70.2
64.8
69.0
50.6
66.9
74.8
74.4
73.9
70.3
65.1
69.6
70.3
64.5
59.1
62.0
69.9
60.1%
55.2
61.6
57.9
68.7
60.6
43.8
60.0
62.7
65.1
62.9
63.8
48.0
68.5
61.9
60.0
65.8
56.0
70.1
49.6
73.4
75.7
65.7
52.1
68.5
50.1
49.4
50.7
54.7
73.3
63.1
63.2
62.2
52.6
52.4
68.8
60.4
60.8
63.9
44.9
59.7
67.1
65.0
67.6
63.2
58.4
63.2
64.8
58.2
53.3
57.3
63.6
*Children born between January 2006 and July 2008. Note: The 4:3:1:3:3:1 series includes 4 or more doses of DTP/DT/DTaP, 3 or more doses of
poliovirus vaccine, 1 or more doses of any measles-containing vaccine, 3 or more doses of Hib vaccine, 3 or more doses of hepatitis B vaccine, and
1 or more doses of varicella vaccine. The 4:3:1:3:3:1:4 series additionally includes 4 or more doses of PCV. In 2009, CDC tested a more precise
measurement for Hib vaccines because, depending on the brand, a child could have completed the full primary series with either 2 or 3 doses, or
could be fully vaccinated for Hib (primary series plus booster dose) with either 3 or 4 doses. A new series was created with 4 in the Hib dosage
location that indicates fully vaccinated (either 3 or 4 doses, depending on brand). The complex nature of these measurement changes was compounded by the Hib vaccine shortage which led to temporary recommendations for all two-year-olds to complete the primary series rather than the
full Hib vaccine series. We include only the 4:3:1:3:3:1 and the 4:3:1:3:3:1:4 series in this table because of the comparability of these two series
to previous years and because the Hib vaccine shortage artificially decreased the immunization rate of the series that includes the more precise Hib
standard.
Sources: Centers for Disease Control and Prevention, 2009 National Immunization Survey: tab03_antigen_state.xls, accessed at:
http://www.cdc.gov/vaccines/stats-surv/nis/data/tables_2009.htm, January 2011. MMWR: Changes in Measurement of Haemophilus influenzae
serotype b (Hib) Vaccination Coverage — National Immunization Survey, United States, 2009, Vol 59:(33), August 27, 2010; and National, State,
and Local Area Vaccination Coverage Among Children Aged 19-35 Months — United States, 2009, Vol 59:(36), September 17, 2010.
**4 or more doses of DTaP, 3 or more doses of poliovirus vaccine, 1 or more doses of any MMR vaccine, 3 or more doses of Hib vaccine of any type,
3 or more doses of HepB vaccine, and one or more doses of varicella vaccine.
***4 or more doses of DTaP, 3 or more doses of poliovirus vaccine, 1 or more doses of any MMR vaccine, 3 or more doses of Hib vaccine of any
type, 3 or more doses of HepB vaccine, and one or more doses of varicella vaccine, and 4 or more doses of PCV.
**** US National estimates include the 50 States plus DC, and exclude the Virgin Islands.
E-12
Children’s Defense Fund
The U.S. and Latvia have the highest infant mortality rates among 30 industrialized nations.
International Rankings, Infant Mortality Rate*
Rate*
Rank
(rounded to nearest
whole number)
Japan
Slovenia
Sweden
Austria
Czech Republic
Denmark
Finland
France
Greece
Israel
Italy
Norway
Portugal
Australia
Belgium
Estonia
Germany
Ireland
Netherlands
Spain
Switzerland
Canada
Hungary
Lithuania
New Zealand
Republic of Korea
United Kingdom
Poland
Slovakia
Latvia
United States
Turkey
2
2
2
3
3
3
3
3
3
3
3
3
3
4
4
4
4
4
4
4
4
5
5
5
5
5
5
6
6
7
7
19
1
1
1
4
4
4
4
4
4
4
4
4
4
14
14
14
14
14
14
14
14
22
22
22
22
22
22
28
28
30
30
32
30 industrialized nations as designated by The State of the World’s Children: 2011, excluding those with
populations of fewer than 1 million.
*Probability of dying between birth and exactly one year of age, per 1,000 live births
Source: United Nation’s Children’s Fund, The State of the World’s Children: 2011. Table 1, Basic
Indicators. Ranks calculated by the Children’s Defense Fund.
State of America’s Children® 2011
E-13
A baby born in the U.S. is about twice as likely to be born at low birthweight
as a baby in Estonia or Lithuania.
International Rankings, Low Birthweight*
Percent
(rounded to nearest
whole number)
Estonia
Finland
Lithuania
Republic of Korea
Sweden
Denmark
Latvia
Norway
Canada
Ireland
Italy
New Zealand
Poland
Spain
Switzerland
Australia
Austria
Czech Republic
France
Germany
Slovakia
Belgium
Greece
Israel
Japan
Portugal
United Kingdom
United States
Hungary
Turkey
Netherlands
Slovenia
4
4
4
4
4
5
5
5
6
6
6
6
6
6
6
7
7
7
7
7
7
8
8
8
8
8
8
8
9
11
n/a
n/a
Rank
1
1
1
1
1
6
6
6
9
9
9
9
9
9
9
16
16
16
16
16
16
22
22
22
22
22
22
22
29
30
n/a
n/a
32 industrialized nations as designated by The State of the World’s Children: 2011, excluding those with
populations of fewer than 1 million.
* Percent of infants with low birthweight , 2005-2008.
Source: United Nationís Children’s Fund, The State of the World’s Children: 2011. Table 1, Basic
Indicators. Ranks calculated by the Children’s Defense Fund.
E-14
Children’s Defense Fund
After four decades of decline, the infant mortality rate in the U.S. increased in 2002
and again in 2005 and 2007.
Trend in Infant Mortality Rates, 1980–2007
Infant deaths before the first birthday
per 1,000 live births
15
10
6.75
5
0
1980
1985
1990
1995
2000
2007
Source: U.S. Department of Health and Human Services, National Center for Health Statistics.
The rate of babies born at low birthweight has increased by 22 percent since 1984.
Trend in Low Birthweight Rates, 1980–2008*
9
Percent of total births
8.2%
8
7
6
0
1980
1985
1990
1995
2000
2008
* Birthweight less than 2,500 g (5 lbs. 8 oz.)
Source: U.S. Department of Health and Human Services, National Center for Health Statistics, National Vital Statistics
Reports, Volume 57, Number 7 (January 7, 2009), Table 33.
State of America’s Children® 2011
E-15
The 8.2 percent of babies born at low birthweight in 2007 was the same as 40 years earlier.
In 2007, Black babies continued to be more than twice as likely to die as infants as White babies.
Trends in Infant Mortality and Low Birthweight
Infant Mortality Rates*
Year
Total
White
Black
1940
1950
1959
1960
1961
1962
1963
1964
1965
1966
1967
1968
1969
1970
1971
1972
1973
1974
1975
1976
1977
1978
1979
1980
1981
1982
1983
1984
1985
1986
1987
1988
1989
1990
1991
1992
1993
1994
1995
1996
1997
1998
1999
2000
2001
2002
2003
2004
2005
2006
2007
2008
47.0
29.2
26.4
26.0
25.3
25.3
25.2
24.8
24.7
23.7
22.4
21.8
20.9
20.0
19.1
18.5
17.7
16.7
16.1
15.2
14.1
13.8
13.1
12.60
11.93
11.52
11.16
10.79
10.64
13.35
10.08
9.95
9.81
9.22
8.94
8.52
8.37
8.02
7.59
7.32
7.23
7.20
7.06
6.91
6.85
6.97
6.85
6.79
6.87
6.69
6.75
n/a
43.2
26.8
23.2
22.9
22.4
22.3
22.2
21.6
21.5
20.6
19.7
19.2
18.4
17.8
17.1
16.4
15.8
14.8
14.2
13.3
12.3
12.0
11.4
10.86
10.34
9.94
9.61
9.30
9.17
8.80
8.48
8.36
8.08
7.56
7.30
6.92
6.82
6.57
6.29
6.07
6.03
5.95
5.77
5.68
5.65
5.79
5.72
5.66
5.73
5.56
5.64
n/a
72.9
43.9
44.8
44.3
41.8
42.6
42.8
42.3
41.7
40.2
37.5
36.2
34.8
32.6
30.3
29.6
28.1
26.8
26.2
25.5
23.6
23.1
21.8
22.19
20.81
20.48
19.98
19.15
19.01
18.90
18.75
18.54
18.61
17.96
17.57
16.85
16.52
15.83
15.12
14.68
14.16
14.31
14.56
14.09
14.02
14.36
14.01
13.79
13.73
13.29
13.24
n/a
Black-White
ratio
Low
birthweight**
1.69
1.64
1.93
1.93
1.87
1.91
1.93
1.96
1.94
1.95
1.90
1.89
1.89
1.83
1.77
1.80
1.78
1.81
1.85
1.92
1.92
1.93
1.91
2.04
2.01
2.06
2.08
2.06
2.07
2.15
2.21
2.22
2.30
2.38
2.41
2.43
2.42
2.41
2.40
2.42
2.35
2.41
2.52
2.48
2.48
2.48
2.45
2.44
2.40
2.39
2.35
n/a
* Infant deaths before the first birthday per 1,000 live births
** Birthweight less than 2,500 grams (5 lbs., 8 oz.)
n/a — data not available
Source: U.S. Department of Health and Human Services, National Center for Health Statistics. Calculations by Children’s Defense Fund.
E-16
Children’s Defense Fund
n/a
n/a
n/a
7.7%
7.8
8.0
8.2
8.2
8.3
8.3
8.2
8.2
8.1
7.9
7.7
7.7
7.6
7.4
7.4
7.3
7.1
7.1
6.9
6.8
6.8
6.8
6.8
6.7
6.8
6.8
6.9
6.9
7.0
7.0
7.1
7.1
7.2
7.3
7.3
7.4
7.5
7.6
7.6
7.6
7.7
7.8
7.9
8.1
8.2
8.3
8.2
8.2
Infants born to Black mothers are almost twice as likely to be born at low birthweight
as infants born to White mothers.
Mothers Giving Birth to Low Birthweight* Babies, 2008
Total 1
Number Rate Rank
Alabama
Alaska
Arizona
Arkansas
California
Colorado
Connecticut
Delaware
District of Columbia
Florida
Georgia
Hawaii
Idaho
Illinois
Indiana
Iowa
Kansas
Kentucky
Louisiana
Maine
Maryland
Massachusetts
Michigan
Minnesota
Mississippi
Missouri
Montana
Nebraska
Nevada
New Hampshire
New Jersey
New Mexico
New York
North Carolina
North Dakota
Ohio
Oklahoma
Oregon
Pennsylvania
Rhode Island
South Carolina
South Dakota
Tennessee
Texas
Utah
Vermont
Virginia
Washington
West Virginia
Wisconsin
Wyoming
United States
6,820
680
7,030
3,757
37,598
6,243
3,237
1,027
957
20,319
13,975
1,574
1,637
14,790
7,398
2,673
3,005
5,360
7,046
907
7,138
5,951
10,378
4,605
5,306
6,573
929
1,901
3,175
890
9,515
2,547
20,508
11,890
610
12,797
4,536
2,975
12,361
953
6,218
780
7,853
34,194
3,785
443
8,865
5,717
2,048
5,068
667
10.6%
6.0
7.1
9.2
6.8
8.9
8.0
8.5
10.5
8.8
9.6
8.1
6.5
8.4
8.3
6.6
7.2
9.2
10.8
6.7
9.2
7.8
8.6
6.4
11.8
8.1
7.4
7.0
8.0
6.5
8.4
8.5
8.2
9.1
6.8
8.6
8.3
6.1
8.3
7.9
9.9
6.5
9.2
8.4
6.8
7.0
8.3
6.3
9.5
7.0
8.3
347,209
8.2
49
1
16
41
10
39
21
34
48
38
46
23
5
31
26
8
17
41
50
9
41
19
36
4
51
23
18
13
21
5
31
34
25
40
10
36
26
2
26
20
47
5
41
31
10
13
26
3
45
13
26
White, non-Hispanic
Number Rate Rank
3,211
321
2,888
2,182
9,743
3,528
1,591
449
161
7,904
4,849
308
1,232
6,806
5,197
2,140
2,045
4,273
2,779
828
2,564
3,693
6,091
2,990
1,942
4,411
752
1,303
1,300
785
3,963
698
8,221
5,518
488
8,332
2,758
2,002
7,527
409
2,676
571
4,685
10,701
2,794
423
4,300
3,421
1,897
3,393
518
163,561
8.4%
5.0
6.8
8.0
6.4
8.5
6.6
7.0
6.8
7.5
7.6
6.4
6.2
7.3
7.7
6.3
6.8
8.7
8.0
6.6
7.2
7.1
7.2
5.7
8.6
7.2
7.3
6.5
8.0
6.4
7.4
8.2
6.8
7.7
6.7
7.4
7.8
5.9
7.1
6.8
7.7
6.2
8.1
7.7
6.5
7.0
7.0
6.0
9.4
6.3
8.1
7.2
47
1
17
41
9
48
14
22
17
34
35
9
5
30
36
7
17
50
41
14
27
25
27
2
49
27
30
12
41
9
32
46
17
36
16
32
40
3
25
17
36
5
44
36
12
22
22
4
51
7
44
Black, non-Hispanic
Number Rate Rank
3,148
48
477
1,209
3,862
465
700
408
686
6,952
6,627
51
12
4,243
1,472
211
392
816
3,865
35
3,400
793
3,242
717
3,188
1,652
6
220
471
17
2,276
60
5,159
4,469
10
3,500
746
131
2,893
111
2,992
21
2,525
6,428
73
10
3,023
355
119
939
8
85,233
15.8%
11.9
11.8
15.1
12.1
14.8
13.6
12.6
13.7
13.5
13.8
10.7
—
13.8
14.1
11.9
12.4
15.0
15.1
9.7
13.1
11.1
14.5
10.8
16.1
13.3
—
12.5
13.1
—
13.1
12.3
12.8
14.4
—
14.5
15.1
10.8
13.5
11.0
14.5
9.8
13.9
14.0
13.0
—
13.0
9.0
14.5
13.0
—
13.7
44
10
9
41
12
39
27
16
28
25
29
4
—
29
33
10
14
40
41
2
21
8
35
5
45
24
—
15
21
—
21
13
17
34
—
35
41
5
25
7
35
3
31
32
18
—
18
1
35
18
—
Hispanic 2
Number Rate Rank
367
56
2,912
278
17,575
1,860
702
128
88
4,798
1,747
231
301
2,826
576
233
416
177
234
16
743
905
601
341
114
276
32
295
1,054
41
2,224
1,466
4,725
1,350
21
527
472
598
1,210
215
401
41
491
15,499
702
3
937
1,038
18
440
97
6.9%
8.6
6.7
6.4
6.1
8.5
8.1
7.0
5.8
7.3
6.8
7.6
7.4
6.6
6.8
7.0
6.1
6.1
7.0
—
7.0
8.3
6.8
6.0
6.5
6.1
7.4
6.9
6.9
7.5
7.6
8.7
7.9
6.2
7.5
7.6
6.7
5.8
8.7
8.3
6.4
8.9
6.2
7.6
7.4
—
6.6
6.0
—
6.2
9.0
72,398
7.0
22
44
17
12
5
43
40
25
1
29
19
35
30
15
19
25
5
5
25
—
25
41
19
3
14
5
30
22
22
33
35
45
39
9
33
35
17
1
45
41
12
47
9
35
30
—
15
3
—
9
48
* Birthweight less than 2,500 grams (5 lbs. 8 oz.)
— Figure does not meet standards of reliability or precision; based on fewer than 20 births in the numerator
1 Includes races other than white and black and origin not stated.
2 Includes all persons of Hispanic origin of any race.
Note: For births statistics, race refers to the race of the mother.
Source: Department of Health and Human Services, National Center for Health Statistics Specific citation: Martin JA, Hamilton BE, Sutton PD, et al.
Births: Final Data for 2008. National Vital Statistics Reports; Vol 59, No 1. Hyattsville, MD: National Center for Health Statistics, December 2010.
Internet Tables: Table I-9.
State of America’s Children® 2011
E-17
Five states with the highest Black infant mortality rate when compared to their overall infant
mortality rate are Wisconsin, Missouri, Rhode Island, Kansas and Indiana.
Infant Deaths, Infant Mortality Rates,* and Rankings, 2007
Total, all races**
Deaths
Alabama
Alaska
Arizona
Arkansas
California
Colorado
Connecticut
Delaware
District of Columbia
Florida
Georgia
Hawaii
Idaho
Illinois
Indiana
Iowa
Kansas
Kentucky
Louisiana
Maine
Maryland
Massachusetts
Michigan
Minnesota
Mississippi
Missouri
Montana
Nebraska
Nevada
New Hampshire
New Jersey
New Mexico
New York
North Carolina
North Dakota
Ohio
Oklahoma
Oregon
Pennsylvania
Rhode Island
South Carolina
South Dakota
Tennessee
Texas
Utah
Vermont
Virginia
Washington
West Virginia
Wisconsin
Wyoming
United States
Rate
641
72
711
317
2,944
433
276
91
116
1,685
1,206
124
169
1,217
681
225
333
397
608
89
625
384
995
409
467
613
79
182
262
76
601
192
1,412
1,112
66
1,160
469
284
1,139
91
539
79
721
2,564
280
33
848
429
164
470
58
9.89
6.51
6.90
7.66
5.20
6.12
6.63
7.48
13.09
7.05
7.98
6.48
6.75
6.73
7.58
5.50
7.93
6.69
9.17
6.30
8.00
4.93
7.94
5.55
10.04
7.48
6.35
6.76
6.36
5.36
5.18
6.27
5.57
8.49
7.47
7.69
8.52
5.75
7.56
7.35
8.57
6.44
8.31
6.29
5.08
5.07
7.79
4.82
7.46
6.46
7.35
29,138
6.75
White
Black
Rank
Deaths
Rate
Rank
Deaths
Rate
Rank
49
21
27
37
6
12
22
33
51
28
42
20
25
24
36
8
40
23
48
15
43
2
41
9
50
33
16
26
17
7
5
13
10
45
32
38
46
11
35
29
47
18
44
14
4
3
39
1
31
19
29
350
36
581
209
2,223
375
197
51
29
950
516
34
158
725
513
201
260
316
238
85
219
283
595
280
165
393
63
144
201
71
342
153
861
600
51
768
307
254
721
68
242
54
421
1,934
259
30
444
313
146
329
49
7.98
5.20
6.57
6.47
4.89
5.85
5.90
6.12
8.52
5.52
5.56
6.11
6.59
5.22
6.61
5.34
7.03
6.01
6.14
6.33
4.79
4.54
6.11
4.69
6.65
5.89
5.94
6.12
6.03
5.34
4.13
5.99
4.95
6.35
6.80
6.34
7.25
5.70
6.12
6.52
6.03
5.55
6.44
5.68
4.98
4.76
5.80
4.33
6.95
5.37
6.65
50
10
41
39
7
21
23
31
51
15
17
29
42
11
43
12
48
26
34
35
6
3
29
4
44
22
24
31
27
12
1
25
8
37
46
36
49
19
31
40
27
16
38
18
9
5
20
2
47
14
44
284
3
65
107
421
45
68
39
87
709
664
8
3
452
166
22
62
72
365
4
371
83
370
82
290
210
3
28
47
3
234
8
482
467
1
382
90
12
394
20
291
3
295
573
4
1
375
50
17
111
1
14.35
—
14.96
13.17
12.35
13.16
12.07
11.84
16.61
12.21
12.77
—
—
14.16
15.99
11.58
18.98
12.69
14.08
—
13.63
8.76
16.39
11.70
13.87
16.48
—
14.04
12.35
—
11.02
—
8.82
15.14
—
14.81
18.03
—
15.07
16.00
13.69
—
15.74
11.51
—
—
15.41
10.28
—
15.18
—
23
—
25
16
11
15
9
8
35
10
14
—
—
22
31
6
37
13
21
—
17
1
33
7
19
34
—
20
11
—
4
—
2
27
—
24
36
—
26
32
18
—
30
5
—
—
29
3
—
28
—
18,807
5.64
8,944
13.24
* Infant deaths before the first birthday per 1,000 live births
** Includes races other than Black and White
— Number of infant deaths too small to calculate a reliable rate.
Source: U.S. Department of Health and Human Services, National Center for Health Statistics Specific citation: Xu JQ, Kochanek KD, Murphy SL, Tejada-Vera
B. Deaths: Final Data for 2007. National Vital Statistics Reports. Vol 58, No 19. Hyattsville, MD: National Center for Health Statistics, May 2010. Table 32.
E-18
Children’s Defense Fund
More than 60 percent of Black and Native American babies are born to unmarried mothers
compared to fewer than 30 percent of White, non-Hispanic babies. These babies are also
more than twice as likely to be born to teen mothers than White babies.
Selected Maternal and Infant Health Indicators,
by Race and Hispanic Origin of Mother, 2007 and 2008
All
races
Characteristic
All births
2008
2007
4,247,694
4,316,233
Percent of all births in group that are:
Preterm births 1
2008
12.3%
2007
12.7
Low birthweight 2
2008
8.2
2007
8.2
Very low birthweight 3
2008
1.5
2007
1.5
Births to teens
2008
10.4
2007
10.5
Births to unmarried mothers
2008
40.6
2007
39.7
Total
White
Non-Hispanic
3,274,163
3,336,626
2,267,817
2,310,333
11.4%
11.7
11.1%
11.5
7.1
7.2
2
3
Black
Non-Hispanic
670,809
675,676
623,029
627,191
17.3%
18.0
17.5%
18.3
7.2
7.3
13.4
13.6
1.2
1.2
1.2
1.2
9.5
9.5
35.7
34.8
Mother’s age at first birth (mean)
2008
25.1
25.3
2007
25.0
25.2
Infant deaths 4 (number)
preliminary 5 2008
28,033
18,162
2007
29,138
18,807
Infant mortality 4 rate (deaths per 1,000 live births)
preliminary 5 2008
6.59
5.54
2007
6.75
5.64
1
Total
Native
Asian, Pacific
American
Islander
49,537
49,443
253,185
254,488
Hispanic
1,041,239
1,062,779
13.6%
13.9
10.7%
10.9
12.1%
12.3
13.7
13.9
7.4
7.5
8.2
8.1
7.0
6.9
2.9
3.1
3.0
3.2
1.3
1.3
1.2
1.1
1.2
1.2
7.5
7.5
17
17.2
17.1
17.3
18.0
18.4
3.0
3.1
14.1
14.2
28.7
27.8
71.8
71.2
72.3
71.6
65.8
65.3
16.9
16.6
52.6
51.3
26.0
26.0
22.8
22.7
22.8
22.7
21.9
21.8
28.7
28.6
23.1
23.1
12,545
12,998
8,513
8,944
8,193
8,629
405
432
953
955
5,891
6,068
5.52
5.63
12.68
13.24
n/a
n/a
n/a
n/a
n/a
n/a
5.67
5.71
Prior to 37 completed weeks of gestation
Less than 2,500 grams (5 lbs., 8 oz.)
Less than 1,500 grams (3 lbs., 4 oz.)
4
Deaths to infants under 1 year of age
5
Final data on infant and maternal deaths in 2008 not yet available. Preliminary data is based on more than 99% of the demographic and medical files for all
deaths in the United States in 2008.
All sources are: U.S. Department of Health and Human Services, National Center for Health Statistics
State of America’s Children® 2011
E-19
In a majority of states, Black and Hispanic babies are more than twice as likely as White babies to
be born to mothers who received late or no prenatal care.
Prenatal Care, 2006
Total 3
Alabama
Alaska
Arizona
Arkansas
California
Colorado
Connecticu
Delaware
District of Columbia
Florida
Georgia
Hawaii
Idaho
Illinois
Indiana
Iowa
Kansas
Kentucky
Louisiana
Maine
Maryland
Massachusetts
Michigan
Minnesota
Mississippi
Missouri
Montana
Nebraska
Nevada
New Hampshire
New Jersey
New Mexico
New York (excluding
New York City)
New York City
North Carolina
North Dakota
Ohio
Oklahoma
Oregon
Pennsylvania
Rhode Island
South Carolina
South Dakota
Tennessee
Texas
Utah
Vermont
Virginia
Washington
West Virginia
Wisconsin
Wyoming
Early Prenatal Care 1
White,
Black,
non-Hispanic non-Hispanic Hispanic4
81.7%
81.1
77.7
79.5
85.9
79.7
85.8
75.9
78.9
69.9
83.3
81.8
71.5
86.2
79.0
86.4
75.2
73.2
87.0
87.7
81.7
88.6
85.4
86.5
83.2
87.2
83.7
75.4
71.5
80.9
77.6
74.7
88.5%
85.0
86.8
83.0
89.8
85.7
91.4
82.5
92.2
76.1
89.4
85.2
74.5
90.7
82.8
88.5
80.5
75.1
92.3
88.3
89.2
91.4
89.5
90.4
89.6
89.5
86.5
78.9
79.9
82.1
87.1
81.4
76.0%
82.9
77.9
72.6
81.9
73.7
75.0
73.1
74.9
61.0
78.9
85.5
64.0
76.7
66.5
73.0
64.4
64.7
79.9
69.8
76.2
80.4
71.9
74.5
77.3
79.2
86.7
64.9
66.3
64.6
62.4
76.3
50.6%
82.4
70.2
69.7
83.8
69.4
75.1
55.5
67.0
66.2
73.3
82.0
58.1
82.5
64.1
71.7
55.6
56.1
79.9
82.5
65.0
81.4
78.6
72.1
73.1
77.6
80.2
62.6
62.5
66.0
66.1
74.3
76.1
79.9
82.6
74.7
72.9
75.6
79.2
71.8
84.5
66.7
70.5
67.6
61.6
80.2
83.8
84.2
70.3
82.8
84.5
72.4
81.6
87.7
89.8
78.8
76.3
79.5
82.4
77.2
90.0
74.1
76.9
74.8
72.2
84.1
84.4
89.7
74.0
83.5
88.0
74.6
60.3
75.0
76.0
64.0
58.6
69.7
72.1
55.8
74.2
60.9
45.5
54.3
53.9
57.4
48.6
79.4
63.7
68.4
75.5
73.1
61.0
77.9
67.6
59.8
60.3
64.5
70.1
55.0
75.7
45.2
48.1
43.4
55.2
66.4
78.1
69.0
60.5
76.1
73.2
63.5
Total 3
4.5%
4.9
6.1
4.7
2.8
4.5
1.8
6.1
5.5
7.2
4.1
3.6
6.1
2.4
4.5
2.5
4.9
5.8
2.6
1.8
4.3
2.3
3.1
2.1
3.2
2.3
3.1
4.2
8.8
4.1
5.0
6.7
4.4
4.9
3.1
5.6
6.3
6.1
4.3
6.6
1.9
8.1
5.7
9.6
11.5
3.9
2.6
4.1
6.6
3.2
3.1
6.5
Late or No Prenatal Care2
White,
Black,
non-Hispanic non-Hispanic Hispanic4
2.2%
3.8
3.0
3.6
2.1
2.8
1.1
3.7
1.8
5.2
2.3
2.3
5.1
1.5
3.4
2.0
3.5
5.2
1.3
1.7
2.2
1.6
2.2
1.3
1.7
1.8
2.2
3.2
6.4
3.8
2.7
4.5
4.8%
—
4.8
7.3
3.8
7.0
3.9
7.1
7.4
10.4
4.9
—
—
5.4
8.5
6.2
8.3
8.9
4.2
—
6.0
5.0
6.6
5.4
4.3
4.5
—
7.2
11.6
—
10.5
5.3
22.4%
4.8
8.7
7.2
3.2
7.2
3.0
13.8
6.3
8.3
8.1
3.4
10.1
2.4
8.0
4.9
9.9
10.5
4.9
—
8.1
3.4
4.0
4.4
9.0
3.8
5.1
7.3
11.1
7.8
6.8
6.8
3.1
2.2
1.7
4.0
5.0
5.4
3.7
5.0
1.0
5.7
3.1
6.3
7.1
2.7
2.4
2.3
5.5
3.0
2.3
5.5
9.1
7.4
4.7
—
11.6
7.5
6.1
12.4
4.0
9.5
10.0
15.1
14.8
16.8
—
5.2
9.2
6.8
6.2
—
6.8
5.3
5.7
9.2
10.9
7.7
5.6
10.1
3.0
16.9
13.6
21.8
14.1
7.5
—
9.0
8.4
—
5.4
10.2
— Number too small to calculate a stable rate.
1
2
3
4
Care begun in the first trimester (first three months) of pregnancy.
Care begun in the last trimester (last three months) of pregnancy, or not at all.
Includes races other than White and Black.
Persons of Hispanic origin can be of any race.
Note: Prior to 2003, information on start of prenatal care was obtained from the mother. Starting in 2003, some states began to use medical records for this
information. These two methods produce different results, and hence the data from these two systems cannot be combined to produce national estimates of
prenatal care. In 2006, 18 states were using the new method to obtain data on prenatal care. New York City’s vital statistics system is separate from that of the
rest of New York State. New York State switched to the new system in 2004; New York City still used the old system in 2006. No overall percentages can be
calculated for New York.
Source: U.S. Department of Health and Human Services, National Center for Health Statistics, National Vital Statistics Reports, Vol. 57, No. 7, “Births: Final
Data for 2006” (January 7, 2009), Tables 26a and 26b.
E-20
Children’s Defense Fund
Children are the least expensive group to cover with health insurance. They represent almost
half of all Medicaid recipients but only one-quarter of Medicaid payments.
Children Enrolled in Medicaid and CHIP
Medicaid, FY 2008
Number of
children ever enrolled
Alabama
Alaska
Arizona
Arkansas
California
Colorado
Connecticut
Delaware
District of Columbia
Florida
Georgia
Hawaii*
Idaho
Illinois
Indiana
Iowa
Kansas
Kentucky
Louisiana
Maine
Maryland
Massachusetts
Michigan
Minnesota
Mississippi
Missouri
Montana
Nebraska
Nevada
New Hampshire
New Jersey
New Mexico
New York
North Carolina
North Dakota
Ohio
Oklahoma
Oregon
Pennsylvania
Rhode Island
South Carolina
South Dakota
Tennessee
Texas
Utah
Vermont
Virginia
Washington
West Virginia
Wisconsin
Wyoming
United States
465,504
67,002
736,896
373,563
4,164,977
333,027
267,551
86,145
74,693
1,592,742
1,011,900
93,440
130,250
1,322,088
586,928
224,616
208,695
417,784
580,686
113,063
370,828
453,740
1,048,896
389,353
389,969
523,652
60,891
129,867
149,923
84,890
524,656
312,302
1,797,053
893,038
35,830
918,010
413,353
267,878
1,043,844
91,718
437,550
71,314
701,934
2,804,650
165,664
65,883
475,706
660,730
196,993
429,111
49,297
28,716,633
CHIP, FY 2010
Children as a percent of:
Enrollment
Payment
Number of
Participation
children ever enrolled
rate1
51.2%
59.1
47.9
54.5
39.3
59.6
48.4
44.8
45.9
52.7
60.1
44.0
63.6
55.3
56.0
47.3
58.8
49.7
55.0
32.9
49.2
30.5
54.7
48.2
52.9
53.0
55.5
58.9
57.7
57.5
55.0
61.7
37.1
53.0
50.4
47.1
57.2
51.5
47.5
49.2
52.1
59.6
47.4
65.6
56.2
39.3
54.9
56.0
49.0
44.1
63.5
33.7%
37.0
36.1
36.7
23.0
26.6
11.4
26.9
19.6
28.3
33.6
22.4
31.7
25.2
23.9
23.9
26.6
30.9
25.0
25.0
24.3
20.2
28.4
25.2
29.1
26.3
30.0
29.8
33.6
26.4
20.1
37.1
14.2
31.7
17.5
16.8
32.2
26.0
28.4
25.9
32.0
31.7
26.0
43.5
32.5
28.6
28.5
27.5
24.1
17.2
29.9
137,545
12,473
39,589
100,770
1,731,605
106,643
21,033
12,852
8,100
403,349
248,268
27,256
42,208
329,104
141,497
63,985
56,384
79,380
157,012
32,994
118,944
142,279
69,796
5,164
95,556
86,261
25,231
47,922
31,554
10,630
187,211
9,654
539,614
253,892
7,192
253,711
122,874
64,727
273,221
23,253
73,438
15,872
81,341
928,483
62,071
7,026
173,515
35,894
37,539
161,469
8,342
85.1%
73.8
76.6
88.4
81.5
68.9
85.2
83.5
95.4
69.8
80.6
91.3
74.4
87.7
80.7
86.5
80.8
89.6
88.5
91.6
86.7
95.2
89.9
80.9
81.1
85.1
69.3
82.8
55.4
85.6
81.4
81.1
89.4
84.7
74.6
83.2
81.4
75.2
85.9
83.5
79.1
82.3
86.7
74.7
66.2
94.0
80.5
83.4
89.4
86.8
78.2
49.1
25.4
7,705,723
81.8
*Hawaii data from 2007 — most recent available.
1 Percentage of children eligible for health coverage through Medicaid or CHIP and actually enrolled in one of the programs.
Notes: Children are ages 0 through 18; excludes children in Medicaid Expansion CHIP.
SOURCE: Centers for Medicare and Medicaid Services: Medicaid Statistical Information System: http://msis.cms.hhs.gov, accessed 1/19/2011.
Calculations by the Children’s Defense Fund, 1/11.
State of America’s Children® 2011
E-21
Simplified Enrollment and Renewal Processes in Place for Medicaid and CHIP, 2010
Highest
income
eligibility
level1
Alabama
300%
Alaska
175
Arizona
200 (closed)
Arkansas
200
California
250
Colorado
250
300
Connecticut
Delaware
200
District of Columbia
300
Florida
200
Georgia
235
Hawaii
300
Idaho
185
Illinois
200 (300)
Indiana
250
Iowa
300
Kansas
241
Kentucky
200
Louisiana
250
Maine
200
Maryland
300
Massachusetts
300
Michigan
200
Minnesota
275
Mississippi
200
Missouri
300
Montana
250
Nebraska
200
Nevada
200
New Hampshire
300
New Jersey
350
New Mexico
235
New York
400
North Carolina
200
North Dakota
160
Ohio
200
Oklahoma
185
Oregon
300
Pennsylvania
300
Rhode Island
250
South Carolina
200
South Dakota
200
Tennessee
250
Texas
200
Utah
200
Vermont
300
Virginia
200
Washington
300
West Virginia
250
Wisconsin
300
Wyoming
200
Improvements
to children’s
CHIPRA
Shorter
health
enrollment
waiting
coverage
Medicaid
bonus
period
during
Expansion
in 2010 4 (in months)
20103
Program2
—
Yes
—
Yes
—
—
—
—
Yes
—
—
Yes
—
—
—
—
—
—
—
—
Yes
—
—
Yes
—
—
—
Yes
—
—
—
Yes
—
—
—
Yes
Yes
—
—
Yes
Yes
—
—
—
—
—
—
—
—
Yes
—
Yes
Yes
—
Yes
Yes
Yes
Yes
Yes
—
—
—
Yes
Yes
—
—
Yes
Yes
—
Yes
Yes
Yes
—
Yes
Yes
Yes
—
Yes
Yes
—
Yes
Yes
—
Yes
Yes
—
Yes
Yes
Yes
Yes
—
Yes
Yes
Yes
—
—
—
Yes
Yes
Yes
Yes
—
Yes
Yes
—
—
—
Yes
—
—
—
—
—
—
—
Yes
—
Yes
Yes
—
Yes
—
Yes
—
Yes
—
—
—
—
—
—
—
Yes
Yes
—
—
—
Yes
—
Yes
—
—
—
—
—
—
—
—
—
Yes
—
Yes
—
3
None
3
6
3
3
2
6
None
2
6
None
6
12
3
1
8
6
12
3
6
6
6
4
None
6
3
None
6
6
3
6
6
None
6
None
None
2
6
None
None
3
3
3
3
1
4
4
3
3
1
5
Express
Lane
eligibility 6
Administrative
verification
of income 7
Medicaid
Yes-Medicaid
Yes
—
—
—
—
—
Yes
—
—
—
Yes
—
Yes
—
—
—
—
—
Yes
—
—
—
Yes
—
Yes
—
—
—
—
Yes— Medicaid
—
—
—
—
—
Yes — Medicaid
—
—
—
Yes
Yes
—
—
—
Yes
—
—
—
—
—
—
—
—
—
—
—
Yes
—
—
Yes — Medicaid
—
—
Yes
—
Yes
—
—
—
—
—
Yes
—
Yes
Yes — Both
—
—
—
—
—
—
—
—
—
—
—
—
—
—
—
Yes
—
Yes
—
Yes
—
Yes
—
—
—
Yes
CHIP
Yes
—
—
n/a
—
Yes
Yes
—
—
Yes
—
n/a
Yes
—
—
—
—
—
—
—
n/a
—
Yes
—
—
—
—
—
—
—
—
n/a
Yes
—
—
n/a
n/a
—
—
—
—
—
Yes
—
Yes
Yes
Yes
Yes
Yes
Yes
12-month continuous
eligibility 8
Medicaid
Yes
Yes
—
—
Yes
—
—
—
—
—
—
—
Yes
Yes
—
Yes
Yes
—
Yes
Yes
—
—
Yes
—
Yes
—
Yes
—
—
—
Yes
Yes
Yes
Yes
Yes
Yes
—
Yes
—
—
Yes
—
—
—
—
—
—
Yes
Yes
—
Yes
CHIP
Yes
n/a
—
—
Yes
Yes
—
Yes
—
Yes
—
—
Yes
Yes
—
Yes
Yes
—
Yes
Yes
—
—
Yes
—
Yes
—
Yes
—
Yes
—
Yes
n/a
Yes
Yes
Yes
n/a
—
Yes
Yes
—
n/a
—
Yes
Yes
Yes
—
Yes
Yes
Yes
—
Yes
— No program
Source: Based on a national survey conducted by the Kaiser Commission on Medicaid and the Uninsured with the Georgetown University Center for Children and Families, 2011.
1 Upper income eligiblity limit for children’s coverage as of percent of poverty as of January 1, 2011.
2 State uses CHIP funding to cover all children eligible for CHIP and Medicaid.
3 State either increased eligibility level or made improvements to the enrollment and renewal system for children’s health coverage in 2010.
4 The Children’s Health Insurance Program Reauthorization Act of 2009 (CHIPRA) established performance bonuses in order to support the enrollment and retention of eligible children
in Medicaid and CHIP. These bonuses provide added federal funding for states that have adopted at least five of eight program features in both Medicaid and CHIP and have also
increased Medicaid enrollment of children above a baseline level. CMS will be awarding over $200 million in performance bonuses to 15 States for FY 2010.
http://www.hhs.gov/news/press/2010pres/12/fy2010_chipra_stateprofiles.pdf.
5 State has shorten the length of time a child is required to be uninsured prior to enrollment in CHIP.
6 States use data and eligibility findings from other public benefit programs when determing children’s eligibility for Medicaid and/or CHIP at enrollment or renewal.
7 When enrolling in coverage or renewing coverage, the state uses administrative data already in the state database in order to determine family income and does not require
burdensome paperwork.
8 Enrollees are guaranteed coverage, without interruption, for 12 months, regardless of changes in their family’s financial circumstances.
E-22
Children’s Defense Fund
More than one in eight preschool children live with a parent who abuses alcohol or
other drugs or is dependent on them.
Children Living with Parents
Who Have Substance Abuse or Dependence, by Age Group
16
14
13.9%
13.6%
12.0%
12
9.9%
Percent
10
8
6
4
2
0
Under 3
3 to 5
6 to 11
12 to 17
Age
Source: U.S. Department of Health and Human Services, Substance Abuse and Mental Health Services Administration,
Children Living with Substance-Dependent or Substance-Abusing Parents: 2002 to 2007, The NSDUH Report
(April 16, 2009), Figure 2.
Children Living with Parents
Who Have Substance Abuse or Dependence,
by Type of Substance Dependence or Abuse
9
8.3
Number in millions
7.3
6
3
2.1
0
Illicit drugs
Alcohol
Alcohol or illicit drugs
Source: U.S. Department of Health and Human Services, Substance Abuse and Mental Health Services Administration,
Children Living with Substance-Dependent or Substance-Abusing Parents: 2002 to 2007, The NSDUH Report
(April 16, 2009), Figure 1.
State of America’s Children® 2011
E-23
Child Hunger and Nutrition
P
roper nutrition is essential to a child’s health, development and well-being, but more than 16 million
U.S. households struggle to afford the food that their family needs. Food insecurity, which refers to
the availability of and access to food for the household, is particularly devastating for children. Hunger
and poor nutrition are linked to low birthweight and birth defects, obesity, mental health problems,
dental health problem, and poor education outcomes. Federal child nutrition programs offer a critical
lifeline for children living in food insecure families.
• In 43 states and the District of Columbia, more than one in 10 households has limited
access to adequate food.
• One in seven Americans receives SNAP benefits (Food Stamps) that help them put
food on the table. The overwhelming majority – three quarters – are in families with
children.
• During 2009, an average of 15.6 million children received food stamps each month,
an increase of 65 percent in just 10 years. This increase accompanied the increase of
children living in poverty over the same time period and the recent recession.
• In 2010, nearly 32 million children participated in the National School Lunch program.
Almost two-thirds of them lived in families with income low enough to qualify them
for either free or reduced-price meals.
• Only one in nine low-income children who eats a free or reduced price school lunch
during the school year is reached by the Summer Food Service Program.
• Almost nine million women and children participate in the Supplemental Nutrition
Program for Women, Infants, and Children (WIC). Infants and young children make
up 76 percent of the programs beneficiaries. Since the recession began in late 2007,
participation has increased by more than 800,000.
F-2
Children’s Defense Fund
After peaking in 1994, the number of children receiving food stamps has been rising
rapidly again since 2000, reaching a record 15.6 million children in 2009.
Children Receiving Food Stamps/SNAP, 1989–2009
16
15.6
15
14
In millions
13
12
11
10
9
8
7
0
1989
1994
1999
2004
2009
Note: The name of the Food Stamp Program was changed to SNAP in 2008.
Source: U.S. Department of Agriculture, Food and Nutrition Service, unpublished tabulations; U.S. Department of Agriculture,
Food and Nutrition Services, Characteristics of Supplemental Nutrition Assistance Program Households: Fiscal Year 2009, Table 3.5
The 38.2 million people receiving SNAP benefits in October 2009 was
the largest number ever receiving food stamps.
Food Stamp/SNAP Recipients, December 2007 – December 2010
38.2
45
Number of recipients in millions
40
35
30
25
20
15
10
5
0
Dec
2007
May
2008
Oct
2008
Mar
2009
Aug
2009
Jan
2010
May
2010
Aug
2010
Dec
2010
Source: U.S. Department of Agriculture, Food and Nutrition Service, at <http://www.fns.usda.gov/pd/34SNAPmonthly.htm>.
State of America’s Children® 2011
F-3
During 2009 an average of 15.6 million children received food stamps each month,
an increase of 65 percent in 10 years.
Average Number of Children Receiving Food Stamps Each Month,
FYs 1989–2009
FY 1989
FY 1994
FY 1999
FY 2004
FY 2007
FY 2008
FY 2009
Alabama
Alaska
Arizona
Arkansas
California
Colorado
Connecticut
Delaware
District of Columbia
Florida
Georgia
Hawaii
Idaho
Illinois
Indiana
Iowa
Kansas
Kentucky
Louisiana
Maine
Maryland
Massachusetts
Michigan
Minnesota
Mississippi
Missouri
Montana
Nebraska
Nevada
New Hampshire
New Jersey
New Mexico
New York
North Carolina
North Dakota
Ohio
Oklahoma
Oregon
Pennsylvania
Rhode Island
South Carolina
South Dakota
Tennessee
Texas
Utah
Vermont
Virginia
Washington
West Virginia
Wisconsin
Wyoming
203,627
13,852
142,460
103,406
1,130,068
108,030
62,617
15,639
29,772
319,164
247,169
39,780
29,783
480,701
139,258
80,704
60,856
190,408
356,575
38,077
127,879
153,172
445,279
120,559
224,555
192,188
26,322
45,161
19,408
9,273
191,648
75,537
722,389
177,509
18,890
492,247
123,659
90,838
441,560
29,370
137,577
25,213
230,158
846,306
52,402
14,362
148,798
153,771
111,043
175,538
14,572
280,653
24,710
280,587
134,327
2,206,228
142,831
123,647
28,661
52,408
748,014
415,623
56,673
43,834
546,825
254,607
96,003
89,723
228,424
403,454
59,146
206,048
240,069
539,922
175,763
252,405
295,224
35,654
62,558
45,887
30,016
290,707
126,461
1,094,408
313,632
22,968
598,321
190,671
134,838
544,571
51,496
205,812
24,734
347,335
1,406,259
68,105
29,579
275,223
231,318
135,908
181,645
16,868
216,200
20,743
150,380
130,021
1,336,701
84,579
86,894
19,432
42,400
425,329
328,559
61,446
29,799
397,268
159,095
60,457
56,731
167,608
280,474
41,572
142,036
131,011
343,440
95,861
152,968
197,603
28,819
45,471
28,936
19,239
193,346
92,563
718,290
258,261
16,147
305,001
131,670
103,126
395,157
41,458
157,901
22,140
217,141
800,811
53,059
18,208
168,992
152,780
96,025
96,597
12,554
256,164
26,409
297,908
160,903
1,241,903
123,636
87,480
28,835
40,083
532,930
421,231
41,147
45,628
529,423
259,955
83,382
78,205
235,191
355,683
50,107
129,061
178,840
449,409
114,724
200,443
291,754
37,002
58,361
59,580
24,456
176,165
118,897
641,795
385,631
18,638
466,333
180,314
185,357
447,651
39,641
250,296
28,656
344,082
1,256,104
67,001
15,969
217,235
192,982
109,115
176,275
14,199
276,831
25,630
298,550
176,187
1,296,318
127,338
80,830
33,312
34,796
546,972
474,327
36,989
44,148
593,394
279,973
105,476
84,800
251,041
307,897
61,232
145,358
191,733
530,380
134,878
207,351
427,138
34,452
59,053
59,270
25,313
192,124
121,240
711,247
430,347
20,513
490,566
198,018
183,006
479,009
35,963
257,284
29,105
374,945
1,365,363
63,880
18,822
235,793
219,633
104,475
202,616
10,681
291,898
26,523
341,683
177,424
1,390,566
129,819
84,597
37,847
35,532
640,032
516,910
38,777
51,601
605,282
297,523
111,610
84,907
257,537
323,236
64,234
159,185
207,960
526,251
139,669
217,663
459,828
34,988
59,931
69,267
25,913
206,272
123,018
779,428
459,199
21,997
523,686
193,676
185,055
502,300
38,382
271,376
30,856
394,134
1,412,481
70,383
21,322
254,592
246,904
108,705
207,662
11,320
335,000
29,000
414,000
190,000
1,586,000
164,000
98,000
46,000
39,000
841,000
624,000
46,000
71,000
676,000
327,000
133,000
100,000
298,000
342,000
74,000
204,000
247,000
575,000
161,000
238,000
359,000
40,000
66,000
96,000
32,000
230,000
151,000
895,000
547,000
23,000
623,000
219,000
228,000
551,000
44,000
312,000
36,000
458,000
1,685,000
97,000
27,000
288,000
328,000
120,000
263,000
13,000
United States
9,429,127
14,390,783
9,332,299
11,772,169
12,695,597
13,470,941
15,589,000
Source: U.S. Department of Agriculture, Food and Nutrition Service, unpublished tabulations from Fiscal Year QC database.
F-4
Children’s Defense Fund
In all but seven states, more than one in 10 households have limited access to adequate food.
Prevalence of Household Level Food Insecurity,1
by State, 2007–2009 (Average)
Food Insecurity (Low or Very Low Food Security)
Percent
Arkansas
Texas
Mississippi
Georgia
Oklahoma
Tennesse
Alabama
Missouri
Maine
North Carolina
Ohio
New Mexico
Arizona
Florida
Kansas
California
Washington
Oregon
Rhode Island
Vermont
South Carolina
Kentucky
Michigan
West Virginia
Alaska
District of Columbia
Nevada
Montana
New York
Indiana
Colorado
Illinois
Nebraska
Pennsylvania
Utah
Idaho
Iowa
New Jersey
Conneticut
Hawaii
Wisconsin
South Dakota
Maryland
Minnesota
Louisiana
Massachusetts
Wyoming
Delaware
Virginia
New Hampshire
North Dakota
1
17.7%
17.4
17.1
15.6
15.2
15.1
15.0
15.0
14.8
14.8
14.8
14.7
14.5
14.2
14.2
14.1
14.0
13.9
13.7
13.6
13.5
13.4
13.4
13.4
12.9
12.9
12.8
12.4
12.4
12.3
12.2
12.2
12.2
11.8
11.8
11.6
11.5
11.5
11.4
11.4
11.4
11.2
11.1
10.5
10.0
10.0
9.8
9.5
9.2
8.9
6.7
Rank
1
2
3
4
5
6
7
7
9
9
9
12
13
14
14
16
17
18
19
20
21
22
22
22
25
25
27
28
28
30
31
31
31
34
34
36
37
37
39
39
39
42
43
44
45
45
47
48
49
50
51
Food Insecurity: access to adequate food is limited by lack of money or other
resources
Source: Nord, Mark, Alisha Coleman-Jensen, Margaret Andrews, and Steven
Carlson. Household Food Insecurity in the United States, 2009. ERR-108,
U.S. Department of Agriculture, Economic Research Service, November 2010.
State of America’s Children® 2011
F-5
Children in Black and Hispanic households are more than twice as likely as children in
White households to experience food insecurity.
Number of Children by Food Security Status of Households and
Selected Household Characteristics, 2009
In Food
Secure Households
In Food
Insecure Households 1
Race and Ethnicity of
Households
Total
Number
(1,000’s)
Percent
Number
(1,000’s)
White non-Hispanic
Black non Hispanic
Hispanic
Other
43,582
10,840
15,139
4,646
36,299
7,088
9,861
3,726
83.3%
65.4
65.1
81.0
7,283
3,752
5,278
884
Percent
16.7%
34.6
35.0
19.0
1 Food Insecurity: access to adequate food is limited by lack of money or other resources (same source as chart)
Source: Nord, Mark, Alisha Coleman-Jensen, Margaret Andrews, and Steven Carlson. Household Food Security in the United States, 2009.
ERR-108, U.S. Department of Agriculture, Economic Research Service, November 2010.
The number of free or reduced-price school lunches increased
15 percent over the past decade.
National School Lunch Program
Fiscal
Year
Average
participation 1
(in millions)
Total lunches
served
(in millions)
Percent of
free/reduced
price lunches
1989
1990
1991
1992
1993
1994
1995
1996
1997
1998
1999
2000
2001
2002
2003
2004
2005
2006
2007
2008
2009
2010
24.2
24.1
24.2
24.6
24.9
25.3
25.7
25.9
26.3
26.6
27.0
27.3
27.5
28.0
28.4
29.0
29.6
30.1
30.6
31.0
31.0
31.8
4,004.90
4,009.00
4,050.70
4,101.40
4,137.70
4,201.60
4,253.30
4,313.20
4,409.00
4,425.00
4,513.60
4,575.00
4,585.20
4,716.60
4,762.90
4,842.40
4,976.50
5,027.90
5,071.30
5,208.60
5,186.20
5,278.50
47.2%
48.3
50.4
53.1
54.8
55.9
56.4
56.9
57.6
57.8
57.6
57.1
56.8
57.6
58.5
59.1
59.4
59.3
59.3
60.1
62.5
65.3
1 This including free, reduced and full price lunches.
Source: U.S. Department of Agriculture, (2011). National school lunch program published tables.
F-6
Children’s Defense Fund
Almost 32 million children participate in the National School Lunch Program.
Almost two-thirds of them receive free or reduced-price meals. Since the recession began
in late 2007, participation increased by 1.2 million children,
Children in National School Lunch Program, FY 2010
Free
Alabama
Alaska
Arizona
Arkansas
California
Colorado
Connecticut
Delaware
District of Columbia
Florida
Georgia
Hawaii
Idaho
Illinois
Indiana
Iowa
Kansas
Kentucky
Louisiana
Maine
Maryland
Massachusetts
Michigan
Minnesota
Mississippi
Missouri
Montana
Nebraska
Nevada
New Hampshire
New Jersey
New Mexico
New York
North Carolina
North Dakota
Ohio
Oklahoma
Oregon
Pennsylvania
Rhode Island
South Carolina
South Dakota
Tennessee
Texas
Utah
Vermont
Virginia
Washington
West Virginia
Wisconsin
Wyoming
United States
Reduced Price
Full Price
Total
333,656
31,265
424,527
210,772
2,168,157
198,322
126,467
46,216
34,140
1,045,815
752,091
49,898
81,639
688,772
359,587
131,229
151,311
294,467
361,586
53,411
221,532
237,182
510,883
410,881
282,237
310,656
38,161
88,781
120,798
32,254
342,533
148,942
1,014,790
558,889
23,190
561,058
262,776
185,688
489,071
45,253
311,555
39,484
414,516
2,167,736
127,676
21,861
326,235
289,748
102,855
238,038
19,409
47,961
6,401
61,253
38,169
392,205
41,339
26,326
6,300
3,742
166,881
115,793
14,140
22,133
90,765
78,702
35,171
38,444
51,274
46,473
9,618
42,645
38,659
78,091
115,873
36,269
60,583
9,916
25,639
19,889
8,478
68,563
24,656
174,888
90,752
6,812
94,241
45,580
31,168
101,031
7,214
40,336
10,392
58,134
302,901
39,922
4,785
68,945
60,261
21,258
49,858
6,942
197,592
17,057
183,502
104,846
679,932
160,593
150,862
39,482
8,485
396,381
435,392
53,288
66,065
388,074
369,498
231,280
170,882
210,522
187,876
47,673
169,367
268,289
331,127
716,500
87,071
278,300
39,400
131,846
47,331
69,260
310,491
53,929
637,171
306,172
52,441
476,378
140,860
98,361
569,613
26,065
150,075
58,174
227,226
890,117
178,270
28,417
362,674
193,895
88,568
314,603
30,190
579,210
54,723
669,283
353,787
3,240,295
400,254
303,655
91,998
46,367
1,609,077
1,303,276
117,326
169,837
1,167,611
807,786
397,681
360,637
556,263
595,935
110,702
433,544
544,130
920,101
1,243,254
405,577
649,539
87,478
246,266
188,017
109,991
721,587
227,526
1,826,848
955,813
82,443
1,131,677
449,216
315,217
1,159,714
78,531
501,965
108,050
699,875
3,360,754
345,867
55,063
757,854
543,904
212,682
602,499
56,540
17,487,995
3,037,768
11,431,460
31,957,223
Source: U.S. Department of Agriculture, Food and Nutrition Service, unpublished tabulations.
State of America’s Children® 2011
F-7
More than 80 percent of the 11.5 million children in the National School Breakfast Program
receive free or reduced-price breakfasts.
Children in National School Breakfast Program, FY 2010
Free
Reduced Price
Full Price
Total
Alabama
Alaska
Arizona
Arkansas
California
Colorado
Connecticut
Delaware
District of Columbia
Florida
Georgia
Hawaii
Idaho
Illinois
Indiana
Iowa
Kansas
Kentucky
Louisiana
Maine
Maryland
Massachusetts
Michigan
Minnesota
Mississippi
Missouri
Montana
Nebraska
Nevada
New Hampshire
New Jersey
New Mexico
New York
North Carolina
North Dakota
Ohio
Oklahoma
Oregon
Pennsylvania
Rhode Island
South Carolina
South Dakota
Tennessee
Texas
Utah
Vermont
Virginia
Washington
West Virginia
Wisconsin
Wyoming
171,944
12,578
193,449
118,721
973,625
78,408
53,892
23,730
17,104
487,285
434,207
20,620
45,134
275,770
168,599
52,773
70,025
178,232
200,843
26,523
104,109
106,252
250,326
95,500
171,090
168,963
17,637
35,887
43,282
13,114
137,876
92,828
433,464
284,425
10,905
275,394
159,172
96,586
220,423
18,749
194,675
17,851
225,336
1,259,525
48,177
13,413
164,825
129,031
59,640
102,631
8,800
15,672
1,957
21,003
15,430
137,367
13,873
6,228
2,324
1,738
55,245
49,673
4,205
8,770
21,912
21,753
8,369
11,618
21,850
17,170
4,171
15,848
10,231
22,551
19,773
14,504
22,881
2,996
6,553
5,433
1,908
16,675
13,007
55,881
30,956
1,899
27,941
20,709
15,083
26,933
1,889
18,426
2,540
23,296
133,390
8,321
2,511
23,175
22,689
9,498
14,005
2,007
29,933
4,133
38,745
23,030
134,056
21,292
11,541
8,473
3,597
102,366
97,647
11,209
16,831
38,993
38,514
23,713
17,951
45,917
36,093
9,548
37,986
22,631
53,310
41,360
18,878
49,837
5,862
17,197
6,578
8,545
26,634
24,311
112,236
55,324
8,187
74,015
38,370
29,507
71,876
3,948
43,003
5,802
43,215
246,751
13,319
6,280
57,058
25,055
26,846
34,894
4,419
217,549
18,668
253,196
157,181
1,245,048
113,574
71,661
34,527
22,438
644,897
581,528
36,034
70,735
336,675
228,866
84,855
99,594
245,999
254,106
40,242
157,943
139,114
326,187
156,634
204,472
241,681
26,495
59,637
55,293
23,567
181,185
130,147
601,581
370,706
20,991
377,350
218,251
141,177
319,232
24,587
256,104
26,193
291,847
1,639,666
69,817
22,204
245,058
176,775
95,984
151,530
15,226
United States
8,563,351
1,033,838
1,926,816
11,524,004
Source: U.S. Department of Agriculture, Food and Nutrition Service, unpublished tabulations.
F-8
Children’s Defense Fund
Only one in nine low-income children who received free or reduced-price school lunch
during the school year is reached by the Summer Food Service Program.
Children in Summer Food Service Program, FY 2010
National School Lunch Program
Total children
Reduced-price
receiving free or
reduced-price meals
Free meals
meals
Alabama
Alaska
Arizona
Arkansas
California
Colorado
Connecticut
Delaware
District of Columbia
Florida
Georgia
Hawaii
Idaho
Illinois
Indiana
Iowa
Kansas
Kentucky
Louisiana
Maine
Maryland
Massachusetts
Michigan
Minnesota
Mississippi
Missouri
Montana
Nebraska
Nevada
New Hampshire
New Jersey
New Mexico
New York
North Carolina
North Dakota
Ohio
Oklahoma
Oregon
Pennsylvania
Puerto Rico
Rhode Island
South Carolina
South Dakota
Tennessee
Texas
Utah
Vermont
Virginia
Washington
West Virginia
Wisconsin
Wyoming
United States
Total children
in Summer Food
Service Program
381,617
37,665
485,780
248,941
2,560,362
239,661
152,793
52,516
37,882
1,212,696
867,884
64,038
103,772
779,537
438,288
166,401
189,755
345,741
408,059
63,029
264,177
275,841
588,974
526,754
318,506
371,238
48,077
114,420
140,687
40,731
411,096
173,598
1,189,678
649,641
30,002
655,299
308,356
216,856
590,102
291,320
52,466
351,890
49,876
472,650
2,470,637
167,597
26,646
395,180
350,010
124,113
287,896
26,350
333,656
31,265
424,527
210,772
2,168,157
198,322
126,467
46,216
34,140
1,045,815
752,091
49,898
81,639
688,772
359,587
131,229
151,311
294,467
361,586
53,411
221,532
237,182
510,883
410,881
282,237
310,656
38,161
88,781
120,798
32,254
342,533
148,942
1,014,790
558,889
23,190
561,058
262,776
185,688
489,071
255,982
45,253
311,555
39,484
414,516
2,167,736
127,676
21,861
326,235
289,748
102,855
238,038
19,409
47,961
6,401
61,253
38,169
392,205
41,339
26,326
6,300
3,742
166,881
115,793
14,140
22,133
90,765
78,702
35,171
38,444
51,274
46,473
9,618
42,645
38,659
78,091
115,873
36,269
60,583
9,916
25,639
19,889
8,478
68,563
24,656
174,888
90,752
6,812
94,241
45,580
31,168
101,031
35,337
7,214
40,336
10,392
58,134
302,901
39,922
4,785
68,945
60,261
21,258
49,858
6,942
26,657
4,498
17,508
18,884
117,957
10,229
9,068
10,873
35,034
129,940
70,218
6,244
21,365
56,217
54,765
10,463
18,147
50,137
25,912
7,630
49,585
51,810
64,732
65,380
25,671
24,877
7,304
9,260
5,964
4,604
46,265
37,964
382,067
66,533
2,747
69,034
11,665
37,957
99,943
44,103
7,543
58,733
4,986
29,892
162,636
16,777
2,913
50,767
36,744
16,959
90,626
3,779
20,502,836
17,743,977
3,073,105
2,291,566
Summer Food
Service participants
as percent of
School Lunch free or
reduced-price recipients
7.0%
11.9
3.6
7.6
4.6
4.3
5.9
20.7
92.5
10.7
8.1
9.8
20.6
7.2
12.5
6.3
9.6
14.5
6.4
12.1
18.8
18.8
11.0
12.4
8.1
6.7
15.2
8.1
4.2
11.3
11.3
21.9
32.1
10.2
9.2
10.5
3.8
17.5
16.9
15.1
14.4
16.7
10.0
6.3
6.6
10.0
10.9
12.8
10.5
13.7
31.5
14.3
11.2
Source: U.S. Department of Agriculture, Food and Nutrition Service, unpublished tabulations.
State of America’s Children® 2011
F-9
Almost 3.3 million children receive nutritious meals and snacks in child care programs
through the Child and Adult Care Food Program.
Participants in the Child and Adult Care Food Program, FY 2010
Family
child care
homes
Child care
centers
Alabama
Alaska
Arizona
Arkansas
California
Colorado
Connecticut
Delaware
District of Columbia
Florida
Georgia
Hawaii
Idaho
Illinois
Indiana
Iowa
Kansas
Kentucky
Louisiana
Maine
Maryland
Massachusetts
Michigan
Minnesota
Mississippi
Missouri
Montana
Nebraska
Nevada
New Hampshire
New Jersey
New Mexico
New York
North Carolina
North Dakota
Ohio
Oklahoma
Oregon
Pennsylvania
Puerto Rico
Rhode Island
South Carolina
South Dakota
Tennessee
Texas
Utah
Vermont
Virginia
Washington
West Virginia
Wisconsin
Wyoming
5,682
2,868
11,336
4,886
118,566
5,900
4,831
4,687
205
12,313
19,841
762
1,748
28,418
23,988
12,730
27,754
3,836
31,965
7,117
16,955
21,178
38,938
70,948
2,353
13,648
6,479
18,485
882
1,165
2,504
15,914
64,458
13,979
9,206
24,042
17,819
15,237
14,690
442
2,213
6,244
5,471
10,097
35,866
14,256
3,619
11,161
17,985
4,843
17,977
3,359
United States
831,838
Adult care
centers
Total
35,467
7,251
30,538
39,260
181,138
29,471
13,672
11,129
5,004
178,140
118,399
8,180
7,260
96,819
41,372
24,812
21,448
39,217
29,907
4,790
22,377
32,235
47,926
26,287
38,014
50,492
7,972
22,934
8,327
5,837
58,327
23,355
217,458
131,714
7,718
99,495
39,645
29,208
113,829
22,833
6,546
24,093
8,650
53,439
256,727
14,670
3,511
46,485
50,800
17,526
43,912
5,881
2,291
130
579
2,904
21,334
491
749
295
50
4,065
3,429
199
0
1,785
212
559
178
2,831
275
85
7,469
4,591
—
429
476
1,181
13
862
353
335
12,497
182
8,438
896
0
1,513
449
270
1,599
—
574
3,217
0
819
23,188
86
252
1,550
808
123
417
—
43,439
10,248
42,453
47,050
321,037
35,862
19,251
16,111
5,259
194,518
141,668
9,141
9,007
127,022
65,572
38,101
49,380
45,883
62,148
11,992
46,801
58,004
86,864
97,663
40,843
65,321
14,464
42,280
9,562
7,337
73,328
39,451
290,354
146,588
16,924
125,049
57,913
44,715
130,118
23,275
9,332
33,553
14,121
64,354
315,781
29,012
7,381
59,196
69,592
22,492
62,306
9,240
2,461,492
115,021
3,408,351
Source: U.S. Department of Agriculture, Food and Nutrition Service, unpublished tabulations.
F-10
Children’s Defense Fund
Infants and young children are 76 percent of WIC recipients. Since the recession began
in late 2007, participation increased by more than 800,000.
Participants in the Supplemental Nutrition Program
for Women, Infants, and Children (WIC), FY 2008
Alabama
Alaska
Arizona
Arkansas
California
Colorado
Connecticut
Delaware
District of Columbia
Florida
Georgia
Hawaii
Idaho
Illinois
Indiana
Iowa
Kansas
Kentucky
Louisiana
Maine
Maryland
Massachusetts
Michigan
Minnesota
Mississippi
Missouri
Montana
Nebraska
Nevada
New Hampshire
New Jersey
New Mexico
New York
North Carolina
North Dakota
Ohio
Oklahoma
Oregon
Pennsylvania
Rhode Island
South Carolina
South Dakota
Tennessee
Texas
Utah
Vermont
Virginia
Washington
West Virginia
Wisconsin
Wyoming
United States
Children
ages 1–4
Women
Infants
Total
33,620
6,187
44,932
24,847
338,479
25,923
13,231
5,026
4,696
126,796
64,697
8,774
10,620
74,182
41,819
17,367
18,320
31,599
37,371
5,933
36,624
30,809
54,938
32,601
23,362
37,932
5,010
10,588
16,659
4,213
39,715
15,016
129,655
64,692
3,092
69,717
25,313
27,404
58,139
5,623
35,029
4,597
44,635
244,307
18,829
3,551
41,744
46,527
12,534
29,795
3,253
37,981
6,246
47,670
26,095
314,978
27,049
15,657
6,339
5,073
124,442
65,085
8,812
10,519
85,693
44,637
17,547
19,386
34,297
41,726
5,817
36,977
29,025
59,385
31,675
32,753
40,547
5,304
10,825
16,586
4,508
42,186
16,036
125,429
68,531
3,225
78,395
25,801
24,990
63,093
5,961
37,548
5,290
47,853
242,889
18,347
3,290
39,611
42,911
12,493
30,454
3,159
69,209
13,383
92,599
43,164
785,549
54,751
31,260
12,663
7,704
254,433
134,951
18,734
25,037
149,995
83,680
40,731
39,283
75,871
69,650
14,740
72,811
68,111
128,952
77,323
54,422
71,666
10,359
23,528
32,852
9,641
87,176
35,619
263,749
141,177
7,067
155,568
51,679
60,854
139,648
14,092
62,176
11,053
82,344
505,258
35,359
10,655
78,795
103,949
28,032
67,643
6,269
140,810
25,816
185,201
94,107
1,439,006
107,722
60,148
24,028
17,473
505,671
264,733
36,320
46,175
309,870
170,137
75,645
76,989
141,768
148,747
26,490
146,411
127,944
243,275
141,598
110,537
150,145
20,673
44,941
66,097
18,362
169,078
66,671
518,833
274,400
13,383
303,679
102,793
113,248
260,879
25,676
134,753
20,940
174,832
992,454
72,535
17,496
160,150
193,387
53,060
127,891
12,680
2,110,322
2,150,125
4,515,211
8,775,657
Data as of March 02, 2011
Source: U.S. Department of Agriculture, Food and Nutrition Services, Monthly Data - Agency Level, Participation and Food Cost by Category per person:
FY 2009 (final), at http://www.fns.usda.gov/pd/wicmain.htm. Calculations by Children’s Defense Fund.
State of America’s Children® 2011
F-11
Early Childhood
F
rom birth to age five children learn social, emotional, behavioral and cognitive competencies that
set the foundation for academic success. Unfortunately, factors such as poverty and the “lottery of
geography” create barriers to young children’s healthy development. Every 42 seconds a baby is born
without health insurance; every minute a baby is born at low birthweight. Cognitive disparities emerge
between children from families with low and higher incomes as early as nine months and more often
than not, these children are unable to catch up by the time they enter kindergarten. The resulting
achievement gap increases over time and can propel children into the cradle to prison pipeline.
• More than 24 percent of children under age five are poor; 41.9 percent of Black and
35.0 percent of Hispanic children under five are poor.
• Almost 70 percent of mothers with children under six are in the workforce.
• The annual cost of center-based child care for a four-year-old is more than the annual
in-state tuition at a public four-year college in 33 states and the District of Columbia.
• In 18 states, a family must have an income that is below 175 percent of the poverty
level ($32,043 for a family of four) to receive a public child care subsidy.
• Center-based care varies dramatically in quality. In 15 states the infant/toddler child
to staff ratio is 5 to 1 or higher. More than half the states do not offer an infant/
toddler credential or qualifications that show specialized knowledge, skills and
professional achievement for this group of children.
• Only 10 states require by statute that all school districts offer full-day kindergarten;
44 states and District of Columbia require half-day programs; six states do not require
local districts to offer any type of kindergarten program. However, 41 states and the
District of Columbia have adopted common core standards that begin assessing student
performance in kindergarten despite the unequal coverage across states.
• Only 13.8 percent of three-year-olds and 38.9 percent of four-year-olds were in statefunded pre-kindergarten programs, Head Start or special education in 2008-2009.
G-2
Children’s Defense Fund
Our youngest children are most at risk of being poor. Young children of color continue
to suffer disproportionately from poverty and extreme poverty.
Trends in Child Poverty Rate, 1969–2009
30
23.8%
20.7%
20
Children under 6
Children under 18
15
10
0
1969
1973
1977
1981
1985
1989
1993
1997
2001
2005
2009
Source: U.S. Department of Commerce, Bureau of the Census. Table 6. People With Income Below Specified Ratios of Their Poverty
Thresholds by Selected Characterstics: 2009
Children Living in Poverty, by Age and Race, 2009
50
Under 18
Under 5
Percent in poverty
41.9%
40
35.7%
33.1%
35.0%
30
24.5%
20.7%
20
14.7%
14.0% 14.3%%
11.9%
10
0
25
All children
White, non-Hispanic
Black
Hispanic*
Asian
Children Living in Extreme Poverty, by Age and Race, 2009
21.6%
Percent in extreme poverty by race
Percent Poor
25
Under 18
20
Under 5
17.9%
15.8%
15
14.1%
11.5%
10
9.3%
8.4%
6.9%
6.3%
5.0%
5
0
All children
White, non-Hispanic
Black
Hispanic*
Asian
* Persons of Hispanic origin can be of any race.
Source: U.S. Department of Commerce, Bureau of the Census, Current Population Survey,
2010 Annual Social and Economic Supplement.
State of America’s Children® 2011
G-3
For 10 years, 60 percent or more of women with young children
have been in the labor force.
Labor Force Participation of Women with Children
Under Age Six, Selected Years
All Women
Number
1950
1955
1960
1965
1970
1975
1980
1985
1990
1999
2000
2001
2002
2003
2004
2005
2006
2007
2008
2009
–
–
–
–
–
–
6,538,000
8,215,000
9,397,000
10,322,000
10,316,000
10,199,000
9,474,000
9,460,000
9,375,000
10,424,000
10,430,000
10,894,000
10,452,000
10,497,000
– Data not available
Source: U.S. Department of Labor, Bureau of Labor Statistics.
G-4
Children’s Defense Fund
Percent
–
–
–
–
–
–
46.8%
53.5
58.2
64.4
65.3
64.9
64.3
63.0
62.5
62.6
63.0
63.5
63.6
63.6
Married Women
Number
Percent
1,399,000
2,012,000
2,474,000
3,117,000
3,914,000
4,518,000
5,227,000
6,406,000
7,247,000
7,246,000
7,341,000
7,317,000
7,057,000
7,051,000
6,980,000
7,309,000
7,366,000
7,664,000
7,285,000
7,231,000
11.9%
16.2
18.6
23.2
30.3
36.7
45.1
53.4
58.9
61.8
62.8
62.5
61.1
60.0
59.6
59.8
60.3
61.5
61.6
61.6
Nationally more than 60 percent of children under six and more than 70 percent of
school-age children live with parents in the labor force.
Parental Labor Force Participation, 2009
Mothers* in the labor force
by age of youngest child
(percent)
Under age 6 Ages 6–17
Children with mothers
in the labor force
(percent)
Under age 6 Ages 6–17
Children with all parents**
in the labor force
(percent)
Under age 6
Ages 6–17
Alabama
Alaska
Arizona
Arkansas
California
Colorado
Connecticut
Delaware
District of Columbia
Florida
Georgia
Hawaii
Idaho
Illinois
Indiana
Iowa
Kansas
Kentucky
Louisiana
Maine
Maryland
Massachusetts
Michigan
Minnesota
Mississippi
Missouri
Montana
Nebraska
Nevada
New Hampshire
New Jersey
New Mexico
New York
North Carolina
North Dakota
Ohio
Oklahoma
Oregon
Pennsylvania
Rhode Island
South Carolina
South Dakota
Tennessee
Texas
Utah
Vermont
Virginia
Washington
West Virginia
Wisconsin
Wyoming
69.2%
65.5
66.4
70.3
66.0
68.2
75.9
74.5
74.2
70.8
69.0
72.0
62.1
71.2
71.1
78.4
74.5
70.4
71.9
72.5
73.4
75.0
71.6
78.1
74.0
74.6
71.4
77.4
66.9
75.9
69.4
64.6
68.3
69.1
79.8
74.9
64.8
69.5
73.1
78.2
73.9
76.8
69.7
64.9
58.4
74.0
69.7
65.4
63.4
78.2
66.0
77.1%
78.2
75.1
77.8
74.6
79.0
81.0
84.0
77.1
79.1
78.1
83.2
77.5
79.2
80.6
86.4
82.7
73.9
76.4
81.8
84.0
81.2
79.2
84.8
77.2
80.2
81.5
85.2
79.0
84.4
79.1
77.8
77.5
79.0
88.2
80.0
75.5
78.4
79.2
78.7
80.1
85.0
77.3
75.4
74.3
86.2
78.9
77.2
71.4
84.1
81.4
61.2%
52.0
52.1
62.6
54.8
58.5
67.3
63.8
66.5
61.1
60.1
62.1
53.6
60.6
60.0
70.0
63.2
60.6
61.6
62.2
64.9
65.4
61.5
68.1
62.7
63.1
58.6
68.9
55.1
66.1
60.3
54.1
57.9
60.1
71.5
63.5
55.8
59.9
61.7
67.0
62.6
68.8
60.8
55.0
47.2
67.4
59.9
55.5
51.8
68.5
59.4
68.1%
64.7
62.7
68.5
63.5
67.2
72.9
74.5
66.9
70.1
69.0
71.6
65.3
69.5
70.7
77.8
71.7
66.0
69.0
72.1
75.0
72.9
70.0
74.8
68.5
70.4
68.4
76.5
66.9
73.7
69.4
65.9
67.5
69.5
79.4
70.0
63.7
66.9
69.3
70.7
70.8
75.7
68.1
64.7
60.7
77.8
69.2
65.2
61.0
74.0
69.2
65.4%
57.8
59.3
66.8
60.9
62.0
70.4
69.0
71.2
67.5
64.8
69.4
57.2
65.9
64.9
75.4
68.5
63.5
66.4
68.4
70.3
68.5
66.1
72.2
68.1
68.5
64.4
73.5
62.5
69.6
64.8
61.7
61.9
65.8
76.1
68.0
61.7
63.7
66.7
70.7
68.0
72.7
66.0
59.5
49.6
71.7
64.9
60.0
57.1
72.9
66.4
70.5%
69.0
67.5
71.1
67.9
70.3
76.1
78.2
71.1
73.8
72.7
76.8
69.1
72.8
73.8
81.7
76.1
67.7
72.1
75.9
78.2
75.3
72.6
77.8
71.1
73.6
72.4
79.1
72.8
77.4
72.1
71.2
70.0
73.2
83.0
73.6
68.9
70.2
72.2
73.3
74.4
79.2
71.7
68.1
63.2
82.0
72.3
69.1
63.3
78.2
76.2
United States
69.9
78.3
59.4
68.2
64.4
71.7
* Mothers ages 20-64 only.
** This includes children living with both parents, living with their father only and living with their mother only
Sources: U.S Department of Commerce, Bureau of the Census, 2009 American Community Survey, Tables B23003 and B23008.
Calculations by Children’s Defense Fund.
State of America’s Children® 2011
G-5
Eligibility for public child care subsidies is limited in 18 states to children in families with
incomes below 175 percent of the poverty level ($32,043 for a family of three).
Child Care Assistance, 2010
Income Limits for a Family of Three
As annual
dollar amount
Alabama
Alaska
Arizona
Arkansas
California
Colorado
Connecticut
Delaware
District of Columbia
Florida
Georgia
Hawaii
Idaho
Illinois
Indiana
Iowa
Kansas
Kentucky
Louisiana
Maine
Maryland
Massachusetts
Michigan
Minnesota
Mississippi
Missouri
Montana
Nebraska
Nevada
New Hampshire
New Jersey
New Mexico
New York
North Carolina
North Dakota
Ohio
Oklahoma
Oregon
Pennsylvania
Rhode Island
South Carolina
South Dakota
Tennessee
Texas
Utah
Vermont
Virginia
Washington
West Virginia
Wisconsin
Wyoming
$ 23,808
46,248
30,216
28,345
45,228
23,803 – 54,108
61,556
36,624
45,775
27,465
35,200
47,124
23,184
36,624
23,256
26,556
33,876
27,468
37,896
45,775
29,990
39,207
23,880
32,994
34,999
23,520
27,468
21,972
43,248
45,775
36,620
36,620
36,620
37,476
29,556
27,468
35,100
33,874
36,620
32,958
27,465
38,150
31,044
27,465 – 44,524
31,992
36,600
27,468 – 45,780
36,624
27,468
33,876
48,175
As percent of
poverty
130%
253
165
155
247
130 – 296
336
200
250
150
192
257
127
200
127
145
185
150
207
250
164
214
130
180
191
128
150
120
236
250
200
200
200
205
161
150
192
185
200
180
150
208
170
150 – 243
175
200
150 – 250
200
150
185
263
As percent of
state median
income
47%
69
54
62
70
37 – 85
75
55
84
49
61
66
46
56
40
45
58
53
73
81
37
50
38
47
79
42
52
37
75
61
45
82
56
69
52
46
73
60
58
47
53
70
60
52 – 85
58
59
40 – 67
56
58
54
79
Note: The income eligibility limits shown in the table represent the maximum income families can have when they apply
for child care assistance. States with an income eligibility range are those that have different income limits for different
regions of the state.
Source: Karen Schulman and Helen Blank, “State Child Care Assistance Policies 2010: New Federal Funds
Help States Weather the Storm,” National Women’s Law Center, Table 1A, (September 2010) at
http://www.nwlc.org/sites/default/files/pdfs/statechildcareassistancepoliciesreport2010.pdf.
G-6
Children’s Defense Fund
In 33 States and the District of Columbia the annual cost of center-based child care for
a 4-year old is more than the annual in-state tuition at a public four-year college.
Child Care vs. College Costs, 2009
Yearly cost
for 4-year-old
in center-based care
Alabama
Alaska
Arizona
Arkansas
California
Colorado
Connecticut
Delaware
District of Columbia
Florida
Georgia
Hawaii
Idaho
Illinois
Indiana
Iowa
Kansas
Kentucky
Louisiana
Maine
Maryland
Massachusetts
Michigan
Minnesota
Mississippi
Missouri
Montana
Nebraska
Nevada
New Hampshire
New Jersey
New Mexico
New York
North Carolina
North Dakota
Ohio
Oklahoma
Oregon
Pennsylvania
Rhode Island
South Carolina
South Dakota
Tennessee
Texas
Utah
Vermont
Virginia
Washington
West Virginia
Wisconsin
Wyoming
$ 5,668
8,268
6,888
4,854
8,234
8,816
10,220
7,280
8,458
6,252
5,676
7,452
5,159
7,810
7,245
7,062
6,880
5,509
4,992
7,606
8,088
13,158
7,549
10,250
4,056
4,628
6,911
6,760
7,132
8,327
9,440
5,931
10,847
7,260
6,341
7,616
5,077
7,500
8,632
9,270
4,756
n/a
4,515
6,454
5,820
7,904
6,656
8,350
5,520
9,039
6,763
Annual in-state
tuition at public
4-year college
$ 5,538
5,008
5,580
5,762
5,254
5,683
7,891
8,288
3,140
3,309
4,270
5,391
4,612
9,847
6,923
6,435
5,746
6,828
4,085
8,018
7,249
8,201
9,078
8,292
4,942
6,904
5,462
5,878
3,348
10,193
10,375
4,413
5,103
4,373
5,780
8,067
5,011
6,286
10,132
7,648
8,976
5,755
5,680
6,030
4,262
11,316
7,448
5,704
4,703
6,554
3,057
Ratio
1.02
1.65
1.23
0.84
1.57
1.55
1.30
0.88
2.69
1.89
1.33
1.38
1.12
0.79
1.05
1.10
1.20
0.81
1.22
0.95
1.12
1.60
0.83
1.24
0.82
0.67
1.27
1.15
2.13
0.82
0.91
1.34
2.13
1.66
1.10
0.94
1.01
1.19
0.85
1.21
0.53
0.79
1.07
1.37
0.70
0.89
1.46
1.17
1.38
2.21
Sources: National Association of Child Care Resource and Referral Agencies, Parents and the High Cost of Child Care
2010 Update, (August 2010), at http://www.naccrra.org/docs/Cost_Report_073010-final.pdf; and U.S. Department of
Education, National Center for Education Statistics, Digest of Education Statistics: 2000 (April 2010), Table 335.
Calculations by Children’s Defense Fund.
State of America’s Children® 2011
G-7
Families received more than $3 million in help through the federal
Child and Dependent Care Tax Credit in 2008.
Child and Dependent Care Tax Credit, 2008
Alabama
Alaska
Arizona
Arkansas
California
Colorado
Connecticut
Delaware
District of Columbia
Florida
Georgia
Hawaii
Idaho
Illinois
Indiana
Iowa
Kansas
Kentucky
Louisiana
Maine
Maryland
Massachusetts
Michigan
Minnesota
Mississippi
Missouri
Montana
Nebraska
Nevada
New Hampshire
New Jersey
New Mexico
New York
North Carolina
North Dakota
Ohio
Oklahoma
Oregon
Pennsylvania
Rhode Island
South Carolina
South Dakota
Tennessee
Texas
Utah
Vermont
Virginia
Washington
West Virginia
Wisconsin
Wyoming
United States
Number
of filers
Amount claimed
(in $1,000s)
105,303
14,027
109,510
52,503
689,872
104,304
81,212
23,996
14,495
417,115
230,136
29,552
29,090
271,763
118,718
84,500
65,507
72,860
93,650
27,198
174,001
147,220
170,488
147,491
62,334
125,700
17,157
54,466
53,632
30,496
230,619
28,674
488,561
220,004
18,442
174,417
62,849
67,007
226,583
19,918
102,842
25,244
123,937
512,835
35,909
13,855
191,534
118,198
17,919
106,754
10,885
$54,991
7,725
56,898
26,606
394,308
53,570
42,618
13,252
8,919
226,677
122,070
13,592
13,781
152,016
58,451
39,887
32,413
34,770
49,732
13,891
103,022
75,354
81,681
67,052
34,414
61,249
7,406
26,274
31,040
15,568
135,532
13,756
297,446
110,428
8,926
85,338
30,957
31,394
118,202
10,623
55,405
12,707
64,294
290,891
17,599
7,029
105,099
61,378
8,046
47,689
5,304
6,415,282
$3,437,270
Source: U.S. Department of the Treasury, Internal Revenue Service, Historical Table 2, SOI Bulletin, at
http://www.irs.gov/taxstats/article/0,,id=171535,00.html. Calculations by Children’s Defense Fund.
G-8
Children’s Defense Fund
1.6 million children – only one out of six eligible children – were assisted under
the Child Care and Development Fund each month in 2008.
Child Care and Development Fund, FY 2008
Monthly Average Number Receiving Assistance
Alabama
Alaska
Arizona
Arkansas
California
Colorado
Connecticut
Delaware
District of Columbia
Florida
Georgia
Hawaii
Idaho
Illinois
Indiana
Iowa
Kansas
Kentucky
Louisiana
Maine
Maryland
Massachusetts
Michigan
Minnesota
Mississippi
Missouri
Montana
Nebraska
Nevada
New Hampshire
New Jersey
New Mexico
New York
North Carolina
North Dakota
Ohio
Oklahoma
Oregon
Pennsylvania
Rhode Island
South Carolina
South Dakota
Tennessee
Texas
Utah
Vermont
Virginia
Washington
West Virginia
Wisconsin
Wyoming
United States
Families
Children
16,800
2,100
19,400
6,600
67,300
10,900
6,100
3,700
1,400
67,100
29,000
6,700
4,300
37,400
19,000
8,600
11,400
17,500
28,100
2,100
14,300
16,900
36,500
14,000
13,500
21,100
2,800
6,200
3,800
5,300
24,600
12,300
69,600
35,600
2,600
27,600
14,500
12,300
54,200
3,600
12,100
3,200
22,300
65,200
6,500
2,400
14,900
29,000
5,100
15,700
2,700
31,900
3,500
32,100
9,600
105,400
18,900
9,400
6,000
2,000
101,000
54,000
10,400
7,900
68,300
36,100
15,300
21,500
31,200
45,300
3,100
24,400
23,100
70,900
24,800
25,400
35,900
4,500
11,100
6,300
7,700
35,800
20,400
116,400
74,000
4,100
48,200
24,700
22,700
93,400
6,000
21,300
5,100
42,700
120,500
12,500
3,500
23,900
48,400
8,300
28,000
4,400
935,900
1,611,300
Source: U.S. Department of Health and Human Services, Administration for Children and Families,
Office of Child Care, Table 1 Child Care and Development Fund Average Monthly Adjusted Number of
Families and Children Served (FFY 2008), at http://www.acf.hhs.gov/programs/ccb/data/ccdf_data/
08acf800/table1.htm. See original source for additional notes. Calculations by Children’s Defense Fund.
State of America’s Children® 2011
G-9
Just over one million low-income children were enrolled in the Head Start programs during 2009.
Head Start Enrollment, 2009
Total
Funded Enrollment*
Early
Head Start Head Start
Head Start Preschool
Migrant
Total
Actual Enrollment**
Early
Head Start Head Start
Head Start Preschool
Migrant
Alabama
Alaska
Arizona
Arkansas
California
Colorado
Connecticut
Delaware
District of Columbia
Florida
Georgia
Hawaii
Idaho
Illinois
Indiana
Iowa
Kansas
Kentucky
Louisiana
Maine
Maryland
Massachusetts
Michigan
Minnesota
Mississippi
Missouri
Montana
Nebraska
Nevada
New Hampshire
New Jersey
New Mexico
New York
North Carolina
North Dakota
Ohio
Oklahoma
Oregon
Pennsylvania
Rhode Island
South Carolina
South Dakota
Tennessee
Texas
Utah
Vermont
Virginia
Washington
West Virginia
Wisconsin
Wyoming
16,475
2,997
19,363
9,615
101,039
10,662
7,035
2,059
3,245
39,213
23,610
2,673
3,987
39,225
14,167
7,749
9,057
16,344
19,909
3,873
10,387
13,018
35,855
14,340
25,601
16,793
4,600
5,443
3,116
1,632
12,550
8,907
49,092
20,369
3,353
37,268
16,590
14,129
35,130
1,764
10,943
4,522
16,414
74,903
6,274
1,522
13,800
16,094
7,588
15,763
1,997
647
305
1,133
640
7,474
798
407
173
291
2,799
1,357
377
406
2,732
908
1,077
1,822
1,094
912
580
867
846
2,018
1,105
971
1,344
455
882
276
204
728
909
3,870
1,487
421
1,458
1,136
749
2,328
381
598
635
880
3,943
423
274
1,138
1,657
394
1,159
311
15,592
2,692
17,478
8,575
87,619
9,164
6,628
1,886
2,954
32,718
21,890
2,296
2,784
36,023
13,259
6,672
7,235
15,105
18,917
3,293
9,520
12,099
32,402
12,256
24,630
15,449
4,145
4,496
2,840
1,428
11,631
7,998
44,607
17,681
2,932
35,810
15,454
10,747
32,376
1,383
9,983
3,887
15,534
62,985
5,449
1,248
12,316
10,867
7,194
14,074
1,686
236
0
752
400
5,946
700
0
0
0
3,696
363
0
797
470
0
0
0
145
80
0
0
73
1,435
979
0
0
0
65
0
0
191
0
615
1,201
0
0
0
2,633
426
0
362
0
0
7,975
402
0
346
3,570
0
530
0
18,984
3,520
21,269
11,640
123,309
13,083
8,587
2,505
4,306
45,858
28,088
3,311
4,593
48,675
17,600
9,347
11,703
19,351
22,712
4,812
12,134
15,739
42,370
17,058
28,237
21,443
5,379
6,502
4,380
2,056
14,488
10,431
56,368
23,522
3,914
47,843
19,926
15,899
41,271
2,433
12,464
5,388
19,718
87,158
7,417
1,916
16,072
19,464
8,767
18,739
2,448
880
407
1,699
1,011
12,100
1,334
653
292
395
4,040
1,742
663
654
4,203
1,574
1,587
3,118
1,626
1,216
937
1,341
1,358
3,039
1,697
1,149
2,255
693
1,331
437
374
1,045
1,377
5,481
2,023
624
2,622
1,885
1,025
3,448
739
839
950
1,236
6,164
707
416
1,674
2,850
595
1,729
462
17,920
3,113
18,818
10,183
105,042
11,071
7,934
2,213
3,911
38,627
25,983
2,648
3,158
43,865
16,026
7,760
8,585
17,572
21,408
3,875
10,793
14,304
37,855
14,382
27,088
19,188
4,686
5,105
3,943
1,682
13,267
9,054
50,243
20,317
3,290
45,221
18,041
12,155
37,404
1,694
11,343
4,438
18,482
72,950
6,305
1,500
14,116
13,094
8,172
16,446
1,986
184
0
752
446
6,167
678
0
0
0
3,191
363
0
781
607
0
0
0
153
88
0
0
77
1,476
979
0
0
0
66
0
0
176
0
644
1,182
0
0
0
2,719
419
0
282
0
0
8,044
405
0
282
3,520
0
564
0
United States
891,312
61,148
795,776
34,388
1,056,789
93,287
929,257
34,245
* The number of funded Head Start slots for the year.
** The number of children enrolled at any point during the year.
Source: Center for Law and Social Policy (CLASP), CLASP DataFinder, at http://www.clasp.org/data. Data are from U.S. Department of Health and Human
Services, 2009 Program Information Report.
G-10
Children’s Defense Fund
Less than three percent of those eligible for Early Head Start and less than 50 percent
of those eligible for Head Start were enrolled.
Head Start Enrollment, by Race and Hispanic Origin, 2009
Percent of Enrollment
Total actual
enrollment
Alabama
Alaska
Arizona
Arkansas
California
Colorado
Connecticut
Delaware
District of Columbia
Florida
Georgia
Hawaii
Idaho
Illinois
Indiana
Iowa
Kansas
Kentucky
Louisiana
Maine
Maryland
Massachusetts
Michigan
Minnesota
Mississippi
Missouri
Montana
Nebraska
Nevada
New Hampshire
New Jersey
New Mexico
New York
North Carolina
North Dakota
Ohio
Oklahoma
Oregon
Pennsylvania
Rhode Island
South Carolina
South Dakota
Tennessee
Texas
Utah
Vermont
Virginia
Washington
West Virginia
Wisconsin
Wyoming
United States
18,984
3,520
21,269
11,640
123,309
13,083
8,587
2,505
4,306
45,858
28,088
3,311
4,593
48,675
17,600
9,347
11,703
19,351
22,712
4,812
12,134
15,739
42,370
17,058
28,237
21,443
5,379
6,502
4,380
2,056
14,488
10,431
56,368
23,522
3,914
47,843
19,926
15,899
41,271
2,433
12,464
5,388
19,718
87,158
7,417
1,916
16,072
19,464
8,767
18,739
2,448
1,056,789
White
Black
Hispanic*
Asian,
Pacific
Islander
0%
5
0
0
6
1
1
1
0
1
0
62
1
1
1
1
1
1
1
1
1
5
1
3
0
1
0
1
2
2
3
0
4
1
1
1
1
3
2
3
0
1
0
0
3
1
1
4
0
3
1
0%
57
24
1
4
3
1
0
6
1
0
1
9
1
1
1
1
0
0
2
3
1
3
8
1
0
41
6
8
0
0
23
2
3
38
1
25
6
0
1
0
50
0
1
9
1
1
11
0
6
16
3
4
22%
19
58
44
39
50
26
10
1
32
22
11
59
23
57
69
53
72
16
85
21
37
46
50
14
53
51
60
54
84
22
39
33
26
49
47
40
60
47
58
11
37
48
60
56
86
34
33
85
51
58
69%
3
3
38
10
7
32
46
83
53
70
6
1
45
26
13
21
17
79
5
62
18
36
20
82
35
1
13
28
4
38
2
26
51
4
39
16
6
34
9
80
5
40
18
2
3
49
7
7
24
2
8%
5
61
16
72
65
48
39
19
33
13
8
38
32
15
19
28
7
2
6
15
42
15
24
3
7
9
28
53
12
48
62
37
24
3
8
16
50
16
27
8
6
9
69
43
3
15
47
1
25
26
40
30
36
American
Indian,
Alaska Native
Other race,
multi-racial or
unspecified race
8%
16
14
17
42
39
39
43
11
12
7
21
30
30
15
16
24
9
3
7
14
38
14
17
2
11
8
19
9
9
38
36
34
20
9
13
19
25
18
29
9
7
10
20
30
10
14
45
7
15
23
24
* Persons of Hispanic origin can be of any race.
Note: The total percentage of children is greater than 100 because the data is not disaggregated by Hispanic or non-Hispanic ethnicity, therefore the percentage of children in each group may be inflated.
Source: Center for Law and Social Policy (CLASP), CLASP DataFinder, at http://www.clasp.org/data. Data are from U.S. Department of Health and Human
Services, 2009 Program Information Report.
State of America’s Children® 2011
G-11
In most states less than three percent of the population birth through two receives
early intervention services under IDEA
Infants and Toddlers Under Three Receiving Early Intervention Services Under
the Individual Disabilities Education Act (IDEA), Part C, by Age and State, 2008
Birth up to
12 months
Alabama
Alaska
Arizona
Arkansas
California
Colorado
Connecticut
Delaware
District of Columbia
Florida
Georgia
Hawaii
Idaho
Illinois
Indiana
Iowa
Kansas
Kentucky
Louisiana
Maine
Maryland
Massachusetts
Michigan
Minnesota
Mississippi
Missouri
Montana
Nebraska
Nevada
New Hampshire
New Jersey
New Mexico
New York
North Carolina
North Dakota
Ohio
Oklahoma
Oregon
Pennsylvania
Rhode Island
South Carolina
South Dakota
Tennessee
Texas
Utah
Vermont
Virginia
Washington
West Virginia
Wisconsin
Wyoming
United States
1 years-old
2 years-old
Total
340
113
601
273
6,323
661
496
113
28
1,368
714
828
399
2,097
1,127
660
551
429
935
75
1,005
1,811
1,400
583
299
616
136
181
263
158
653
736
2,890
1,276
179
2,663
550
308
2,678
278
591
108
602
4,064
323
88
720
410
425
639
149
977
211
1,719
982
13,607
1,469
1,394
276
105
3,968
1,878
1,162
608
5,741
3,229
1,259
1,082
1,600
1,668
277
2,300
4,424
3,243
1,386
703
1,301
215
428
675
428
2,902
1,594
9,502
2,980
300
4,840
1,023
783
5,606
573
1,479
359
1,505
8,454
961
236
2,093
1,555
940
1,714
359
1,638
252
3,463
1,623
21,047
2,598
2,713
459
176
7,925
3,131
1,631
947
10,697
5,400
1,657
1,792
2,970
1,185
630
4,010
8,667
5,380
2,610
1,113
1,867
380
799
1,114
825
6,231
2,075
18,758
5,034
456
7,337
1,350
1,499
8,630
913
2,328
661
2,255
14,259
1,825
434
3,508
2,941
1,317
3,627
583
2,955
576
5,783
2,878
40,977
4,728
4,603
848
309
13,261
5,723
3,621
1,954
18,535
9,756
3,576
3,425
4,999
3,788
982
7,315
14,902
10,023
4,579
2,115
3,784
731
1,408
2,052
1,411
9,786
4,405
31,150
9,290
935
14,840
2,923
2,590
16,914
1,764
4,398
1,128
4,362
26,777
3,109
758
6,321
4,906
2,682
5,980
1,091
44,913
108,073
184,720
337,706
Source: U.S. Department of Education, Office of Special Education Programs, Data Analysis System (DANS), OMB #1820-0557, Infants and Toddlers
Receiving Early Intervention Services in Accordance with Part C, 2008. Data updated as of August 3, 2009, at http://www.ideadata.org/arc_toc10.asp#
partcCC Note: Please see the Part C Child Count Data Notes on www.IDEAdata.org for information the state submitted to clarify its data submission.
*Percentage of population = Number of children birth through 2 served under IDEA Part C, divided by population birth through 2, multiplied by 100.
See table C-2 for the denominator.
G-12
Children’s Defense Fund
In 2008–2009, 38 states had state-funded pre-kindergarten programs, but
these programs served only 25.4 percent of 4-year-olds and 3.7 percent of 3-year-olds.
Pre-kindergarten Enrollment of 3- and 4-year-olds, 2008–2009
Percent of Age Group Enrolled
State-funded pre-kindergarten program
3-year-olds
Alabama
Alaska
Arizona
Arkansas
California
Colorado
Connecticut
Delaware
District of Columbia
Florida
Georgia
Hawaii
Idaho
Illinois
Indiana
Iowa
Kansas
Kentucky
Louisiana
Maine
Maryland
Massachusetts
Michigan
Minnesota
Mississippi
Missouri
Montana
Nebraska
Nevada
New Hampshire
New Jersey
New Mexico
New York
North Carolina
North Dakota
Ohio
Oklahoma
Oregon
Pennsylvania
Rhode Island
South Carolina
South Dakota
Tennessee
Texas
Utah
Vermont
Virginia
Washington
West Virginia
Wisconsin
Wyoming
United States
0.0%
0.0
0.0
5.9
5.4
6.0
8.2
0.0
n/a
0.0
0.0
0.0
0.0
21.2
0.0
1.3
0.0
10.0
0.0
0.0
1.2
2.9
0.0
1.1
0.0
1.9
0.0
2.9
0.6
0.0
17.3
0.0
0.1
0.0
0.0
5.3
0.0
4.8
4.8
0.0
4.1
0.0
0.8
4.7
0.0
17.3
0.0
2.4
8.5
1.0
0.0
3.7
4-year-olds
State-funded pre-kindergarten program,
Head Start, or special education
3-year-olds
4-year-olds
5.5%
0.0
5.4
43.7
12.6
20.2
10.9
7.3
n/a
66.7
53.4
0.0
0.0
28.7
0.0
28.7
21.2
28.3
31.7
19.0
35.1
11.3
19.1
1.6
0.0
3.9
0.0
7.3
2.3
0.0
26.5
16.5
42.6
25.0
0.0
8.1
71.0
8.3
16.4
0.0
38.1
0.0
21.6
45.4
0.0
53.0
14.1
7.2
50.6
48.4
0.0
10.7%
12.5
8.8
21.5
13.0
14.2
18.3
7.3
n/a
8.3
9.6
9.2
7.0
29.6
9.7
11.1
12.5
20.0
18.0
13.0
12.9
13.8
13.8
10.6
24.6
13.0
15.1
12.1
5.5
8.1
26.2
13.6
14.7
7.8
16.9
17.1
14.3
14.1
16.2
9.9
15.6
14.9
9.1
13.5
7.0
29.1
8.0
11.0
19.5
12.8
16.4
23.1%
18.9
20.2
62.7
25.9
32.1
24.4
19.5
n/a
76.8
61.1
14.3
14.5
42.8
14.7
39.2
37.1
44.4
48.2
36.0
47.9
25.7
37.7
15.7
37.6
19.8
22.5
20.6
11.1
11.6
37.4
37.7
56.6
36.0
25.4
24.2
86.6
21.4
31.1
16.0
49.0
25.9
34.7
55.3
11.9
67.8
24.3
19.8
73.3
59.4
26.5
25.4
13.8
38.9
Source: National Institute for Early Education Research, The State of Preschool 2009 (May 2010), Tables 2 and 4.
State of America’s Children® 2011
G-13
Only 10 states require by statute that school districts to provide full-day kindergarten; 44 states
and the District of Columbia require half-day kindergarten.
States that Require Kindergarten and Have Adopted
Common Core K-12 Standards, 2010
State statute requires
districts to provide
half-day K?
Alabama
Alaska
Arizona
Arkansas
California
Colorado
Connecticut
Delaware
District of Columbia
Florida
Georgia
Hawaii
Idaho
Illinois
Indiana
Iowa
Kansas
Kentucky
Louisiana
Maine
Maryland
Massachusetts
Michigan
Minnesota
Mississippi
Missouri
Montana
Nebraska
Nevada
New Hampshire
New Jersey
New Mexico
New York
North Carolina
North Dakota
Ohio
Oklahoma
Oregon
Pennsylvania
Rhode Island
South Carolina
South Dakota
Tennessee
Texas
Utah
Vermont
Virginia
Washington
West Virginia
Wisconsin
Wyoming
Yes
No
Yes
Yes
Yes
Yes
Yes
Yes
Yes
Yes
Yes
Yes
No
Yes
Yes
Yes
Yes
Yes
Yes
Yes
Yes
Yes
Yes
Yes
Yes
Yes
Yes
Yes
Yes
Yes 3
No
Yes
No
Yes
No
Yes
Yes
Yes
No
Yes
Yes
Yes
Yes
Yes
Yes
Yes
Yes
Yes
Yes
Yes
Yes
State statute requires
districts to provide
full-day K?
Kindergarten funded
at same level as
1st grade?
State has adopted
common core
K-12 standards?
Yes
No
No
Yes
No
No
No
Yes
No
No
Yes
No
No
No
No
No
No
No
Yes
No
Yes
No
No
No
Yes
No
No
No
No
No
No
No
No
Yes
No
No
No
No
No
No
Yes
No
No
No
No
No
No
No
Yes
No
No
Yes
Yes
No
Yes
Yes
No
Yes
No
n/a
Yes
Yes
n/a 1
No
Yes
No
Yes
No
No
Yes
Yes
Yes 2
Yes
Yes
No
Yes
Yes
No
Yes
No
No
No
Yes
Yes
Yes
No
Yes
Yes
No
Yes
n/a 1
Yes
Yes
Yes
Yes
No
Yes
Yes
Yes
Yes
Yes
No
Yes
No
Yes
Yes
Yes
Yes
Yes
Yes
Yes
Yes
Yes
Yes
No
Yes
Yes
Yes
Yes
Yes
Yes
No
Yes
Yes
Yes
Yes
Yes
Yes
No
No
Yes
Yes
Yes
Yes
Yes
Yes
No
Yes
Yes
Yes
Yes
Yes
Yes
Yes
Yes
No
Yes
Yes
No
No
Yes
Yes
Yes
* The Common Core State Standards Initiative is a state-led effort to establish a shared set of clear educational standards for English language arts and
mathematics that states can voluntarily adopt. http://www.corestandards.org/
Source: Education Commission of the States (2010). StateNotes: State Kindergarten Statutes: 50-State Report. Denver, CO Education Commission of the
States (2005 update). StateNotes: How states fund full-day Kindergarten. Denver, CO: Author.
1 Hawaii and Rhode Island do not have school funding formulas that permit comparison of relative funding levels of grades.
2 As of fiscal year 2008, Maryland provides funding for kindergarten at a level that is equivalent to that provided for first grade (Md. Code Ann., Educ. ß 5-202).
3 In accordance with a bill passed in 2007 defining an adequate education, every school district in New Hampshire must provide Kindergarten.
G-14
Children’s Defense Fund
The median salary for preschool teachers is only half that of kindergarten teachers.
Annual Salaries of Early Childhood Educators, 2009
Alabama
Alaska
Arizona
Arkansas
California
Colorado
Connecticut
Delaware
District of Columbia
Florida
Georgia
Hawaii
Idaho
Illinois
Indiana
Iowa
Kansas
Kentucky
Louisiana
Maine
Maryland
Massachusetts
Michigan
Minnesota
Mississippi
Missouri
Montana
Nebraska
Nevada
New Hampshire
New Jersey
New Mexico
New York
North Carolina
North Dakota
Ohio
Oklahoma
Oregon
Pennsylvania
Rhode Island
South Carolina
South Dakota
Tennessee
Texas
Utah
Vermont
Virginia
Washington
West Virginia
Wisconsin
Wyoming
United States
Head Start
teachers
(mean)
Child care
workers
(median)
Preschool
teachers
(median)
Kindergarten
teachers
(median)
Elementary
teachers
(median)
$ 19,437
24,523
25,577
23,803
31,794
27,340
30,686
19,914
37,191
28,157
23,753
33,571
17,232
32,418
23,254
26,484
26,030
24,984
24,179
25,840
33,922
27,064
27,257
23,211
18,163
22,514
18,935
26,396
28,751
22,420
38,556
24,673
31,767
23,561
25,654
25,567
26,620
24,470
30,779
29,048
19,983
24,005
24,858
25,929
20,161
17,723
27,841
25,116
27,310
27,939
25,612
$ 17,560
23,670
19,970
16,750
23,730
22,890
23,280
20,030
24,590
19,660
18,360
19,660
17,850
22,010
18,940
19,210
18,980
18,430
18,190
21,780
21,940
24,480
21,590
20,340
16,950
19,880
17,740
18,150
19,850
20,520
22,710
18,960
24,040
18,800
17,440
22,030
17,880
21,340
20,170
22,530
17,960
18,300
17,800
18,210
18,640
22,100
21,400
22,520
18,070
23,080
20,720
$ 25,050
29,300
25,440
25,570
30,500
29,850
30,050
23,960
32,680
25,170
24,440
30,860
19,880
28,320
24,140
26,460
28,610
27,000
21,690
27,390
29,000
32,120
31,370
31,050
22,570
24,030
22,970
23,330
23,840
27,040
33,770
25,690
32,920
22,530
25,720
22,130
26,560
24,710
25,610
31,630
25,660
26,380
24,290
26,690
22,980
28,140
27,100
28,660
26,040
23,460
29,280
$ 45,570
63,970
39,480
42,760
56,660
46,560
61,870
50,670
38,930
48,690
47,150
43,730
34,940
45,380
46,570
41,920
44,360
47,860
44,500
44,680
47,190
56,640
50,500
50,580
40,640
42,510
34,800
43,200
41,570
45,060
59,210
52,160
66,450
40,860
38,890
47,530
39,310
45,220
51,220
67,720
45,580
36,190
44,980
47,460
38,550
48,140
55,320
48,050
44,620
45,590
52,320
$ 46,810
68,070
42,450
42,570
61,230
48,010
66,660
50,480
64,200
49,400
52,390
48,730
48,340
58,510
47,540
41,720
41,490
47,350
44,620
45,270
61,000
60,810
54,290
51,290
41,770
43,200
39,540
43,850
47,110
49,280
60,860
50,930
65,820
42,550
42,880
51,970
41,530
50,550
52,370
68,410
45,310
38,350
46,280
49,970
45,730
51,940
58,320
55,960
43,960
51,240
55,390
26,751
20,940
27,450
50,380
53,150
Footnotes: Annual wages have been calculated by multiplying the hourly mean wage by 2080 hours; where an hourly mean wage is not published the
annual wage has been directly calculated from the reported survey data.
* Head Start Teacher Salaries 2009 taken from Clasp Data Finder, at http://www.clasp.org/data analysis of Head Start Program Information Report
(PIR) Data. U.S. totals include territories. Average includes all programs (including part-day and Migrant/Seasonal). Salary range may vary greatly.
Source: US Department of Labor, Bureau of Labor Statistics, Occupational Employment Statistics Query System, data extracted on March 17, 2011,
at http://www.bls.gov/oes/current/oes_nat.htm.
State of America’s Children® 2011
G-15
In more than a third of the states, child care center directors and teachers are required to have
10 or fewer hours of training a year.
Number of Ongoing Training Hours Required for Child Center Staff Roles in 2008
(Reported in hours)
Alabama
Alaska*
Arizona
Arkansas
California
Colorado
Connecticut
Delaware
District of Columbia
Florida
Georgia
Hawaii
Idaho
Illinois
Indiana
Iowa*
Kansas
Kentucky*
Louisiana
Maine
Maryland
Massachusetts
Michigan
Minnesota
Mississippi
Missouri
Montana
Nebraska
Nevada
New Hampshire
New Jersey
New Mexico
New York*
North Carolina*
North Dakota
Ohio*
Oklahoma
Oregon
Pennsylvania
Rhode Island
South Carolina*
South Dakota
Tennessee*
Texas
Utah
Vermont
Virginia
Washington
West Virginia
Wisconsin
Wyoming
Director
24
45 every two years
12
10
0
9
1% of hours worked/year
18
18
10
10
0
NL
15
12
8
5
12
3
30
6
20
12
2% of hours worked/year
15
12
15
0
15
6
12
24
30 every two years
20
13
0
20
15
6
20
20
20
18
20
20
12
10
10
15
25
30 every two years
Teacher
12
20
12
10
0
9
1% of hours worked/year
18
18
10
10
0
NL
15
12
6
10
12
3
30
3
20
12
2% of hours worked/year
15
12
8
12
15
6
8
24
30 every two years
20
13
15
12
15
6
20
15
20
12
15
20
12
10
10
15
25
30 every two years
Assistant Teacher
12
NR
12
NR
NR
9
1% of hours worked/year
18
18
NR
10
0
NL
15
NR
NR
0
NR
0
30
NR
20
NR
2% of hours worked/year
15
NR
NR
12
NR
0
NR
NR
NR
NR
NR
NR
12
15
6
NR
15
20
NR
0
20
12
10
0
15
25
NR
These are minimum hours required by state licensing.
NL= Facilty not licensed
NR= Role not regulated
Source: National Association of Regulatory Administration, Findings from the 2008 Child Care Licensing Study, Table 23. Number of Ongoing Training
Hours required for Center Staff Roles in 2008 http://www.naralicensing.org/.
NOTE: There may be some exceptions to the ongoing training hour requirements in some states under certain circumstances. For example, some states
have different training requirements during the first year. See original source for details.
G-16
Children’s Defense Fund
In most states, the child-staff ratio in child care centers is 4:1 for 9-month old infants;
in 15 states it is 5:1 or higher.
Infant and Toddler Child-Staff Ratios and Group Sizes, 2008
6 weeks
Alabama
Alaska
Arizona
Arkansas
California
Colorado
Connecticut
Delaware
District of Columbia
Florida
Georgia
Hawaii
Idaho
Illinois
Indiana
Iowa
Kansas
Kentucky
Louisiana
Maine
Maryland
Massachusetts
Michigan
Minnesota
Mississippi
Missouri
Montana
Nebraska
Nevada
New Hampshire
New Jersey
New Mexico
New York
North Carolina
North Dakota
Ohio
Oklahoma
Oregon
Pennsylvania
Rhode Island
South Carolina
South Dakota
Tennessee
Texas
Utah
Vermont
Virginia
Washington
West Virginia
Wisconsin
Wyoming
5:1
5:1
5:1 or 11:2
6:1
4:1
5:1
4:1
4:1
4:1
4:1
6:1
4:1
NL
4:1
4:1
4:1
3:1
5:1
6:1
4:1
3:1
3:1 or 7:2
4:1
4:1
5:1
4:1
4:1
4:1
4:1
4:1
4:1
6:1
4:1
5:1
4:1
5:1 or 12:2
4:1
4:1
4:1
4:1
5:1
5:1
4:1
4:1
4:1
4:1
4:1
4:1
4:1
4:1
4:1
Maximum children
per caretaker in child care centers
9 months 18 months 27 months
5:1
5:1
5:1 or 11:2
6:1
4:1
5:1
4:1
4:1
4:1
4:1
6:1
4:1
NL
4:1
4:1
4:1
3:1
5:1
6:1
4:1
3:1
3:1 or 7:2
4:1
4:1
5:1
4:1
4:1
4:1
6:1
4:1
4:1
6:1
4:1
5:1
4:1
5:1 or 12:2
4:1
4:1
4:1
4:1
5:1
5:1
4:1
4:1
4:1
4:1
4:1
4:1
4:1
4:1
4:1
7:1
5:1
6:1 or 13:2
9:1
6:1
5:1
4:1
6:1
4:1
6:1
8:1
6:1
NL
5:1
5:1
4:1
5:1
6:1
8:1
4:1 or 5:1
3:1
4:1 or 9:2
4:1
7:1
9:1
4:1
4:1
6:1
8:1
5:1
6:1
6:1
5:1
6:1
4:1
7:1
6:1
4:1
5:1
6:1
6:1
5:1
6:1
9:1
4:1
4:1
5:1
7:1
4:1
4:1
5:1
8:1
6:1
8:1
9:1
6:1
7:1
4:1
8:1
4:1
11:1
10:1
8:1
NL
8:1
5:1
6:1
7:1
10:1
12:1
4:1 or 5:1
6:1
4:1 or 9:2
4:1
7:1
12:1
8:1
8:1
6:1
10:1
6:1
10:1
10:1
5:1
10:1
5:1
7:1
8:1
5:1
6:1
6:1
9:1
5:1
7:1
11:1
7:1
5:1
10:1
7:1
8:1
6:1
8:1
6 weeks
NR
10
NR
12
NR
10
8
NR
8
NR
12
8
NL
12
8
NR
9
10
NR
8
6
7
12
8
10
8
NR
12
NR
12
12
NR
8
10
8
10
8
8
8
8
NR
20
8
10
8
8
NR
8
8
8
10
Maximum group size in
child care centers
9 months 18 months 27 months
NR
10
NR
12
NR
10
8
NR
8
NR
12
8
NL
12
8
NR
9
10
NR
8
6
7
12
8
10
8
NR
12
NR
12
12
NR
8
10
8
10
8
8
8
8
NR
20
8
10
8
8
NR
8
8
8
10
NR
10
NR
18
12
10
8
NR
8
NR
16
12
NL
15
10
NR
10
12
NR
10 or 12
9
9
12
14
10
8
NR
NR
NR
15
20
NR
12
12
8
14
12
8
10
12
NR
20
12
18
8
8
NR
14
12
8
12
NR
12
NR
18
12
14
8
NR
8
NR
20
NR
NL
16
10
NR
14
20
NR
10 or 12
12
9
12
14
14
16
NR
NR
NR
18
20
NR
12
20
10
14
16
10
12
12
NR
20
14
22
14
10
NR
14
16
12
18
NL - not licensed at the state level
NR - not regulated at the state level
Note: There may be some exceptions to these ratio and group size requirements in some states under certain circumstances. For example, some states have
different requirements for small centers, classes with mixed-age groups, or different levels of licensing. See original source for details.
Source: National Association for Regulatory Administration (NARA), Findings from the 2008 Child Care Licensing Study, Tables 27 and 28,
at http://www.naralicensing.org/.
State of America’s Children® 2011
G-17
Most states exceed the recommended maximum child-staff ratios for
pre-school age children in licensed centers.
Child-Staff Ratios in Licensed Centers 1
3-year-olds
Alabama
Alaska
Arizona
Arkansas
California
Colorado
Connecticut
Delaware
District of Columbia
Florida
Georgia
Hawaii
Idaho
Illinois
Indiana
Iowa
Kansas
Kentucky
Louisiana
Maine
Maryland
Massachusetts
Michigan
Minnesota
Mississippi
Missouri
Montana
Nebraska
Nevada
New Hampshire
New Jersey
New Mexico
New York
North Carolina
North Dakota
Ohio
Oklahoma
Oregon
Pennsylvania
Rhode Island
South Carolina
South Dakota
Tennessee
Texas
Utah
Virginia
Washington
West Virginia
Wisconsin
Wyoming
Maximum Recommended Level
4-year-olds
5-year-olds
8:1
10:1
13:1
12:1
12:1
10:1
10:1
10:1
8:1
15:1
15:1
12:1
NL
10:1
10:1
8:1
12:1
12:1
14:1
8:1 or 10:1
10:1
10:1
10:1
10:1
14.1
10.1
8:1
10:1
13:1
8:1
10:1
12:1
7:1
15:1
7:1
12:1
12:1
10:1
10:1
9:1
13:1
10:1
9:1
15:1
12:1
10:1
10:1
10:1
10:1
10:1
18:1
10:1
15:1
15:1
12:1
12:1
10:1
12:1
10:1
20:1
18:1
16:1
NL
10:1
12:1
12:1
12:1
14:1
16:1
8:1 or 10:1
10:1
10:1
12:1
10:1
16:1
10:1
10:1
12:1
13:1
12:1
12:1
12:1
8:1
20:1
10:1
14:1
15:1
10:1
10:1
10:1
18:1
10:1
13:1
18:1
15:1
12:1
10:1
12:1
13:1
12:1
21:1
14:1
20:1
18:1
14:1
15:1
10:1
15:1
15.1
25:1
20:1
20:1
NL
20:1
15:1
15:1
14:1
15:1
20:1
13:1
15:1
15:1
12:1
10:1
20:1
16:1
10:1
12:1
13:1
15:1
15:1
15:1
9:1
25:1
12:1
14:1
15:1
15:1
10:1
12:1
21:1
10:1
16:1
22:1
20:1
12:1
15:1
12:1
17:1
12:1
7:1
8:1 to 10:1
8:1 to 10:1 2
NL – not licensed at the state level
NR – not regulated at the state level
1 There may be some exceptions to these ratio and group size requirements in some states under certain circumstances.
For example, some states have different requirements for small centers, classes with mixed-age groups, or different
levels of licensing. See original source for details.
2 Maximum Recommended Level: As recommended in the accreditation guidelines developed by the National Association
for the Education of Young Children and in the National Health and Safety Performance Standards developed by the
American Public Health Association and the American Academy of Pediatrics.
Source: National Association for Regulatory Administration, Findings from the 2008 Child Care Licensing Study, Table 27,
Center Child-Staff Ratio Requirements in 2008 at <http://www.naralicensing.org/>.
G-18
Children’s Defense Fund
In nearly half the states, small family child care homes are not required
to be licensed until five or more children are in the home.
Licensing of Small Family Child Care Homes, 2008
Alabama
Alaska
Arizona
Arkansas
California
Colorado
Connecticut
Delaware
District of Columbia
Florida
Georgia
Hawaii
Idaho
Illinois
Indiana
Iowa
Kansas
Kentucky
Louisiana
Maine
Maryland
Massachusetts
Michigan
Minnesota
Mississippi
Missouri
Montana
Nebraska
Nevada
New Hampshire
New Jersey
New Mexico
New York
North Carolina
North Dakota
Ohio
Oklahoma
Oregon
Pennsylvania
Rhode Island
South Carolina
South Dakota
Tennessee
Texas
Utah
Vermont
Virginia
Washington
West Virginia
Wisconsin
Wyoming
Number of children for
licensing to be required
Visit before
licensing
1
5
6
6
3
3
1
1
1
3
4
4
7
5
7
7
1
5
Voluntary Licensing Only
4
1
1
1
4
7
6
3
5
6
3
Voluntary Licensing Only
5
3
4
6
8
1
4
5
6
1
12
5
1
6
4
7
1
4
5
4
Yes
Yes
Yes
Yes
Yes
Yes
Yes
Yes
Yes
Yes
No
Yes
No
Yes
No
No
No
Yes
No
Yes
Yes
Yes
No
Yes
No
Yes
No
Yes
Yes
Yes
No
Yes
Yes
Yes
Yes
No
Yes
Yes
No
Yes
No
No
Yes
No
Yes
Yes
No
Yes
No
Yes
Yes
Source: Leaving Children to Chance: NACCRRA's Ranking of State Standards and Oversight of Small Family Child Care
Homes: 2010 Update http://www.naccrra.org/publications/naccrrapublications/publications/Lvng%20Children%202%
20Chance_alpha_rank_031510.pdf
State of America’s Children® 2011
G-19
In 35 states a high school diploma is not required for family providers in small
family child care homes.
Initial Training Requirements (Selected) for Small Family Child Care Homes
and Annual Training Requirements, 2008
Alabama
Alaska
Arizona
Arkansas
California
Colorado
Connecticut
Delaware
District of Columbia
Florida
Georgia
Hawaii
Idaho
IlliNois
Indiana
Iowa
Kansas
Kentucky
Louisiana
Maine
Maryland
Massachusetts
Michigan
Minnesota
Mississippi
Missouri
Montana
Nebraska
Nevada
New Hampshire
New Jersey
New Mexico
New York
North Carolina
North Dakota
Ohio
Oklahoma
Oregon
Pennsylvania
Rhode Island
South Carolina
South Dakota
Tennessee
Texas
Utah
Vermont
Virginia
Washington
West Virginia
Wisconsin
Wyoming
High school
diploma
required
Number of
pre-service (initial)
training hours
Number of annual
training hours
required
CPR
training
First-aid
training
Yes
No
Yes
Yes
No
No
No
Yes
Yes
No
Yes
No
No
No
No
No
No
Yes
No
No
No
No
Yes
No
No
No
No
No
No
Yes
No
No
No
Yes
No
No
Yes
No
Yes
Yes
No
No
Yes
No
Yes
No
No
No
No
No
Yes
32
10
60
12
15
26
6
14
9
40
8
8
—
8
0
0
2
14
—
12
32
11
14
8
0
0
8
12
0
17
—
0
15
8
8
—
12
15
0
36
0
—
7
0
10
0
—
12
0
40
6
20
16
12
10
4
19
0
12
15
10
4
4
—
15
0
—
0
13
—
16
6
7
16
8
0
12
12
12
15
9
—
6
15
12
9
—
12
4
6
16
15
—
14
0
20
9
—
10
8
15
15
Yes
Yes
Yes
Yes
Yes
Yes
No
Yes
Yes
Yes
Yes
Yes
No
No
No
No
No
Yes
No
Yes
Yes
Yes
Yes
Yes
No
No
Yes
Yes
No
Yes
No
No
No
Yes
Yes
No
Yes
Yes
No
Yes
No
No
Yes
No
Yes
No
No
Yes
No
No
No
Yes
Yes
Yes
No
Yes
Yes
Yes
Yes
Yes
Yes
Yes
Yes
No
Yes
No
No
Yes
Yes
No
Yes
Yes
Yes
Yes
Yes
No
No
Yes
Yes
No
Yes
No
No
No
Yes
Yes
No
Yes
Yes
No
Yes
No
No
Yes
No
Yes
No
No
Yes
No
No
No
— Information was not provided in the original report.
Source: Leaving Children to Chance: NACCRRA's Ranking of State Standards and Oversight of Small Family Child Care Homes, 2010, at
http://www.naccrra.org/publications/naccrra-publications/publications/854-0000_Lvng%20Children%202%20Chance_rev_031510.pdf; and
NACCRRA, Initial Training Requirements, Annual Training Requirements, and Areas of Training Required in Initial Training, FCC Providers, at
http://www.naccrra.org/randd/data/ FamilyProviderTraining.php
G-20
Children’s Defense Fund
Education
A
merican education, which used to be the envy of the world, is in dire straits. The United States
ranks 24th among 30 developed countries on overall educational achievement for 15-year-olds.
Many public school students, kindergarten through 12th grade, are struggling; minority children and
poor children struggle the most. Too often they fall behind in school and drop out, increasing their risk
of entering the cradle to prison pipeline. Staying in school and receiving a quality education are the
best deterrents to juvenile delinquency and the surest route towards responsible, productive adulthood.
• American schools are resegregating: 78 percent of Hispanic students and 73 percent of
Black students are in predominantly minority schools.
• More than 60 percent of fourth, eighth and 12th grade public school students are reading
or doing math below grade level. Seventy-nine percent or more of Black and Hispanic
students in these grades are reading or doing math below grade level.
• Black, Hispanic, and American Indian students are underrepresented in gifted and
talented programs, but Black children are in special education classes for children with
mental retardation and emotional disturbances at much higher rates than other children.
• Black students are more than three times as likely as White or Asian/Pacific Islander
and more than twice as likely as Hispanic students to be suspended from school.
• Thirty-five percent of Black and 29 percent of Hispanic high school students
attend the more than 1,600 “dropout factories” across our country, where less than
60 percent or fewer of the freshman class will graduate in four years with a regular
diploma.
• Black high school students have the lowest averaged freshman graduation rate (61.5%)
of any group, with Hispanic students’ graduation rate only slightly higher;
Asian/Pacific Islander students have the highest graduation rate (91.4%).
• The Black/White gap in college completion persists, and the Hispanic/White college
completion gap is even greater. College graduates’ lifetime earnings are more than one
and a half times those of high school graduates and more than twice the earnings of
high school dropouts.
• The U.S. spends almost two and a half times as much per prisoner as per public
school pupil. Almost half of the states spend more than three times as much
per prisoner as per public school pupil.
• In a study of education systems in 60 countries, the United States ranked 31st
in math achievement and 23rd in science achievement for 15-year-old students.
• Almost one in five high school students admitted carrying a weapon in 2007;
one-third of those students brought the weapon to school. One in 20 admitted
carrying a gun. More than one-third had been in a physical fight.
• One in 18 high school students reported staying home from school because they
felt unsafe at school or going to or from school.
H-2
Children’s Defense Fund
How America Ranks Among Industrialized Countries in Education
Science
PISA Score
China
Finland
China (Hong Kong)
Singapore
Japan
Korea
New Zealand
Canada
Estonia
Australia
Netherlands
Taiwan
Germany
Liechtenstein
Switzerland
United Kingdom
Slovenia
China(Macao)
Poland
Ireland
Belgium
Hungary
United States
Czech Republic
Norway
Denmark
France
Iceland
Sweden
Austria
Latvia
Portugal
574.6
554.1
549.0
541.7
539.4
538.0
532.0
528.7
527.8
527.3
522.2
520.4
520.4
519.9
516.6
513.7
511.8
511.1
508.1
508.0
506.6
502.6
502.0
500.5
499.9
499.3
498.2
495.6
495.1
494.3
493.9
492.9
Reading
Rank
1
2
3
4
5
6
7
8
9
10
11
12
13
14
15
16
17
18
19
20
21
22
23
24
25
26
27
28
29
30
31
32
PISA Score
China (Shanghai)
Korea
Finland
China (Hong Kong)
Singapore
Canada
New Zealand
Japan
Australia
Netherlands
Belgium
Norway
Estonia
Switzerland
Poland
Iceland
United States
Liechtenstein
Sweden
Germany
Ireland
France
Taiwan
Denmark
United Kingdom
Hungary
Portugal
China (Macao)
Italy
Latvia
Slovenia
Greece
555.8
539.3
535.9
533.2
525.9
524.2
520.9
519.9
514.9
508.4
505.9
503.2
501.0
500.5
500.5
500.3
499.8
499.3
497.4
497.3
495.6
495.6
495.2
494.9
494.2
494.2
489.3
486.6
486.1
484.0
483.1
482.8
Math
Rank
1
2
3
4
5
6
7
8
9
10
11
12
13
14
15
16
17
18
19
20
21
22
23
24
25
26
27
28
29
30
31
32
PISA Score
China (Shanghai)
Singapore
China (Hong Kong)
Korea
Taiwan
Finland
Liechtenstein
Switzerland
Japan
Canada
Netherlands
China (Macao)
New Zealand
Belgium
Australia
Germany
Estonia
Iceland
Denmark
Slovenia
Norway
France
Slovak Republic
Austria
Poland
Sweden
Czech Republic
United Kingdom
Hungary
Luxembourg
United States
Ireland
600.1
562.0
554.5
546.2
543.2
540.5
536.0
534.0
529.0
526.8
525.8
525.3
519.3
515.3
514.3
512.8
512.1
506.7
503.3
501.5
498.0
496.8
496.7
495.9
494.8
494.2
492.8
492.4
490.2
489.1
487.4
487.1
Rank
1
2
3
4
5
6
7
8
9
10
11
12
13
14
15
16
17
18
19
20
21
22
23
24
25
26
27
28
29
30
31
32
Note:The Programme for International Student Assessment (PISA) is an internationally standardised assessment that was jointly developed by participating
economies and administered to15-year-olds in schools.
Source: U.S. Department of Education, National Center for Education Statistics, International Data Explorer, PISA IDE, at
http://nces.ed.gov/surveys/pisa/idepisa/report.aspx.
Cumulative Expenditures by Educational Institutions Per Student
Across the Duration of Primary and Secondary Studies, 2007
200,000
150,000
100,000
50,000
xe
m
Sw bou
itz rg
er
la
n
Un No d
ite rwa
y
d
St
at
Ic es
el
De and
nm
ar
Un
k
ite Au
d str
Ki ia
ng
do
Ire m
la
Sw nd
ed
en
Ita
Au ly
st
ra
Be lia
lg
iu
Fr m
an
Ca ce
na
da
Ja
Ge pan
rm
an
y
Ne Sp
th ain
er
la
Sl nds
ov
en
Fi ia
nl
an
Ko d
P rea
Ne ort
w ug
Ze al
al
an
Cz
d
Ru ec
I
sr
h
a
ss
ia Rep el
n
Fe ubl
de ic
ra
ti
Es on
to
Hu nia
ng
a
Sl
ov Po ry
ak la
Re nd
pu
b
M lic
ex
ic
o
Ch
ile
Br
az
il
0
Lu
Cumulative expenditures in equivalent USD
250,000
Source: OECD (2010), Education at a Glance 2010: OECD Indicators, Table B1.3a. Cumulative expenditure by
educational institutions per student for all services over the theoretical duration of primary and secondary studies (2007),
at http://dx.doi.org/10.1787/888932310282.
State of America’s Children® 2011
H-3
The Four Americas
How 15-year-old Minority Youth Compare to Other Youth Around the World
American 15 year olds rank 17th among industrialized countries in Reading.
• Asian students rank 2nd, just behind China and ahead of Korea.
• White students rank 7th, just behind Singapore and ahead of Canada.
• Hispanic students rank 43rd, just behind Lithuania and ahead of Turkey.
• Black students rank 49th, just behind Serbia and ahead of Bulgaria.
American 15 year olds rank 31st among industrialized countries in Math.
• Asian students rank 13th, just behind Macao and ahead of New Zealand.
• White students rank 16th, just behind Belgium and ahead of Australia.
• Hispanic students rank 43rd, just behind Croatia and ahead of Dubai.
• Black students rank 52nd, just behind Uruguay and ahead of Chile.
American 15 year olds rank 23rd among industrialized countries in Science.
• Asian students rank 7th, just behind Korea and ahead of New Zealand.
• White students rank 9th, just behind New Zealand and ahead of Canada.
• Hispanic students rank 44th, just behind Dubai and ahead of Israel.
• Black students rank 52nd, just behind Bulgaria and Uruguay and ahead of
Romania.
H-4
Children’s Defense Fund
College graduates earn more than twice as much annually as those with only a high school
diploma and more than two-and-a-half times the amount earned by high school dropouts.
Lifetime earnings follow a similar pattern.
Earnings by Educational Attainment, 2009
Mean Earnings of Persons Who Worked Full-Time, Year-Round
Highest level of
education
Earnings
Amount
Increase
Some high school, no diploma
High school, including GED
Some college, no degree
Associate (2-year) degree
College degree or more
$29,785
38,745
45,200
48,886
79,105
8,960
6,455
3,686
30,219
Percent
30.1%
16.7
8.2
61.8
Source: U.S. Department of Commerce, Bureau of the Census, 2010 Current Population Survey, Annual Social and Economic Supplement, Table
PINC-04, Educational Attainment ñ People 18 Years Old and Over, by Total Money Earnings in 2009, Work Experience in 2009, Age, Race, Hispanic
Origin, and Sex. Calculations by Childrenís Defense Fund.
Expected Lifetime Earnings by Education Level
Compared to
High School Grad
Not a high school graduate
High school graduate
Some college, no degree
Associate degree
Bachelor’s degree
Bachelor’s degree or higher
Master’s degree
Doctoral degree
Professional degree
Compared to
High School Dropout
Lifetime
earnings
Ratio
Amount
Ratio
$ 941,370
1,266,730
1,518,300
1,620,730
2,054,380
2,284,110
2,401,565
3,073,240
3,706,910
0.74
1.00
1.20
1.28
1.62
1.80
1.90
2.43
2.93
$ -325,360
1.00
1.35
1.61
1.72
2.18
2.43
2.55
3.26
3.94
251,570
354,000
787,650
1,017,380
1,134,835
1,806,510
2,440,180
Amount
$ 325,360
576,930
679,360
1,113,010
1,342,740
1,460,195
2,131,870
2,765,540
Source: College Board, Education Pays: The Benefits of Higher Education for Individuals and Society, 2007 (2009), Appendix A, p. 44.
State of America’s Children® 2011
H-5
American schools are resegregating 56 years after Brown v. Board
of Education outlawed school segregation.
Racial Isolation of Black and Latino Students in the Public
Schools, 1968–2006
Percent of Black Students in:
Predominantly (>50%)
minority Schools
1968
1980
1988
1991
2005
2006
77%
63
63
66
73
73
Intensely segregated
(90–100%) minority schools
64%
33
32
34
38
39
Gary Orfield and Chungmei Lee, Historic Reversals, Accelerating Resegregation, and the Need for New
Integration Strategies (2007), Tables 10 and 14; and Gary Orfield, Reviving the Goal of an Integrated Society:
A 21st Century Challenge (January 2009), Table 23.
Percent of Latino Students in:
Predominantly (>50%)
minority schools
1968
1980
1984
1988
1994
2005
2006
55%
68
71
74
74
78
78
Intensely segregated
(90–100%) minority schools
23%
29
31
33
34
39
40
Gary Orfield and Chungmei Lee, Historic Reversals, Accelerating Resegregation, and the Need for New Integration Strategies (2007),
Tables 16 and 17; and Gary Orfield, Reviving the Goal of an Integrated Society: A 21st Century Challenge (January 2009), Table 23.
Southern schools, which became the least segregated in the nation
in the 50 years following Brown, are rapidly resegregating.
Change in Black Segregation in the South, 1954–2005
Percent of Black Students in Majority White Schools
1954
1960
1964
1967
1968
1970
1972
1976
1980
1986
1988
1991
1994
1996
1998
2000
2001
2005
0.001%
0.1
2.3
13.9
23.4
33.1
36.4
37.6
37.1
42.9
43.5
39.2
36.6
34.7
32.7
31.0
30.2
27.0
(one in 100,000)
(one in 1,000)
(330 in 1,000)
(435 in 1,000)
(270 in 1,000)
Source: Gary Orfield and Chungmei Lee, Historic Reversals, Accelerating Resegregation, and the Need for New Integration
Strategies (2007), Table 8.
H-6
Children’s Defense Fund
More than 60 percent of all public students in fourth, eighth and 12th grades
are not reading or doing math at grade level. Seventy-nine percent
or more of Black and Hispanic students in these same grades
are not reading or doing math at grade level.
Reading and Math Performance
Percent of Public School Students Not Reading or Doing Math at Grade Level:
NAEP Scores for fourth, eighth and 12th Grade
Reading
Math
Fourth graders
Total, all races
White
Black
Hispanic
Asian, Pacific Islander
American Indian, Alaska Native
68%
59
85
84
52
78
62%
50
85
79
39
77
70
61
87
84
56
79
67
57
88
83
47
80
64
55
84
79
51
75
69
94
90
48
Eighth graders
Total, all races
White
Black
Hispanic
Asian, Pacific Islander
American Indian, Alaska Native
12th graders
Total, all races
White
Black
Hispanic
Asian, Pacific Islander
Percent of Public School Students Reading or Doing Math at Grade Level
Fourth graders
Eligible for school lunch
Not eligible for school lunch
83%
55
78%
46
Eighth graders
Eligible for school lunch
84%
83%
Not eligible for school lunch
59
55
Sources: U.S. Department of Education, National Assessment of Educational Progress, The Nation’s Report Card:
Reading 2009 (2009), Tables A-11, A-12, A-14, A-19, A-20 and A-22; U.S. Department of Education, National
Assessment of Educational Progress, The Nation’s Report Card: Mathematics 2009 (2009), Tables A-11, A-12, A14, A-19, A-20 and A-22; and U.S. Department of Education, National Assessment of Educational Progress, The
Nation’s Report Card: Grade 12 Reading and Mathematics 2009 (2010) National and Pilot State Results, Figure
22 and 24, Table A-6 and A-16. Calculations of children who are not proficient at specified grade levels by
Children’s Defense Fund.
State of America’s Children® 2011
H-7
Eighty percent or more of Black fourth grade public school students are performing below grade
level in reading and math in 33 states and the District of Columbia.
Reading and Math Performance of Fourth Graders, 2009
Percent of Fourth-Grade Public School Students Performing Below Grade Level
Reading
Math
Asian,
Pacific
Black Hispanic Islander
American
Indian,
Alaska
Native
Total
American
Asian, Indian,
Pacific Alaska
White Black Hispanic Islander Native
Total
White
Alabama
Alaska
Arizona
Arkansas
California
Colorado
Connecticut
Delaware
District of Columbia
Florida
Georgia
Hawaii
Idaho
Illinois
Indiana
Iowa
Kansas
Kentucky
Louisiana
Maine
Maryland
Massachusetts
Michigan
Minnesota
Mississippi
Missouri
Montana
Nebraska
Nevada
New Hampshire
New Jersey
New Mexico
New York
North Carolina
North Dakota
Ohio
Oklahoma
Oregon
Pennsylvania
Rhode Island
South Carolina
South Dakota
Tennessee
Texas
Utah
Vermont
Virginia
Washington
West Virginia
Wisconsin
Wyoming
72%
73
75
71
76
60
58
65
83
64
71
74
68
68
66
66
65
64
82
65
63
53
70
63
78
64
65
65
76
59
60
80
64
68
65
64
72
69
63
64
72
67
72
72
69
59
62
67
74
67
67
64%
62
63
65
61
49
48
53
25
55
60
58
64
56
62
64
60
61
72
64
50
44
64
57
65
60
63
60
66
58
49
65
55
56
63
58
67
65
58
56
62
63
66
57
64
58
53
60
74
62
66
87%
87
80
86
86
73
78
81
89
82
85
82
—
89
85
78
80
87
91
82
81
77
91
88
90
84
—
81
86
72
82
87
82
86
—
87
89
83
85
83
89
—
88
80
86
71
82
79
84
91
—
82%
73
86
84
89
82
85
76
83
69
80
73
86
84
85
80
80
78
84
—
70
80
83
87
81
74
74
80
87
70
81
86
78
83
—
70
83
87
86
86
83
71
84
82
90
—
74
86
—
84
78
—
81%
59
—
52
47
45
43
—
44
47
78
67
37
—
54
50
44
—
—
41
44
58
66
—
—
—
60
62
55
38
61
48
48
—
—
—
57
39
70
—
—
—
48
70
—
43
65
—
64
—
—
91%
88
—
—
—
—
—
—
—
—
—
—
—
—
—
—
—
—
—
—
—
—
80
—
—
84
—
—
—
—
90
—
82
84
—
73
83
—
—
—
89
—
—
83
—
—
73
—
82
81
76%
62
72
64
70
55
54
64
83
60
66
63
59
62
58
59
54
63
77
55
56
43
65
46
78
59
55
62
68
44
51
74
60
57
55
55
67
63
54
61
66
58
72
62
59
49
57
57
72
55
60
66%
48
56
54
49
43
42
50
19
47
52
49
56
48
52
55
45
61
63
54
40
33
57
39
63
54
51
55
54
43
37
53
50
41
51
46
60
57
47
50
54
53
64
39
52
49
46
49
72
47
56
93%
83
81
88
87
77
86
83
91
80
85
67
—
89
87
83
82
86
92
72
79
70
91
75
92
83
—
90
88
—
81
81
81
82
—
86
86
82
83
85
86
83
93
77
85
—
84
76
80
89
—
89%
73
85
74
86
76
82
78
76
67
74
72
82
80
77
83
76
78
77
—
68
75
80
71
—
63
59
84
81
69
75
82
75
73
—
75
80
84
77
86
72
73
81
74
84
—
72
80
—
78
78
—
65%
55
—
39
49
35
34
—
27
40
65
—
27
—
34
36
31
—
—
33
30
45
56
—
38
—
45
55
33
28
—
33
38
—
—
—
52
38
60
—
—
—
29
61
—
36
44
—
61
—
—
86%
87
—
—
—
—
—
—
—
—
—
—
—
—
—
—
—
—
—
—
—
—
73
—
—
77
—
—
—
—
86
—
70
83
—
71
85
—
—
—
85
—
—
83
—
—
79
—
79
—
United States
68
59
85
84
52
78
62
50
85
79
39
77
— Data not reported because number of students too small to calculate a reliable rate.
Sources: U.S. Department of Education, National Assessment of Educational Progress, The Nation’s Report Card: Reading 2009 (2010), Tables A–11 and
A–12; and U.S. Department of Education, National Assessment of Educational Progress, The Nation’s Report Card: Mathematics 2009 (2009), Tables A–11
and A–12. Calculations by Children’s Defense Fund.
H-8
Children’s Defense Fund
More than two-thirds of eighth grade public school students are unable to read or do math
at grade level. For Black, Hispanic, and American Indian/Alaska Native students,
the percentages range from 79 to 88.
Reading and Math Performance of Eighth Graders, 2009
Percent of Eighth-Grade Public School Students Performing Below Grade Level
Reading
Math
Asian,
Pacific
Black Hispanic Islander
American
Indian,
Alaska
Native
Total
American
Asian, Indian,
Pacific Alaska
White Black Hispanic Islander Native
Total
White
Alabama
Alaska
Arizona
Arkansas
California
Colorado
Connecticut
Delaware
District of Columbia
Florida
Georgia
Hawaii
Idaho
Illinois
Indiana
Iowa
Kansas
Kentucky
Louisiana
Maine
Maryland
Massachusetts
Michigan
Minnesota
Mississippi
Missouri
Montana
Nebraska
Nevada
New Hampshire
New Jersey
New Mexico
New York
North Carolina
North Dakota
Ohio
Oklahoma
Oregon
Pennsylvania
Rhode Island
South Carolina
South Dakota
Tennessee
Texas
Utah
Vermont
Virginia
Washington
West Virginia
Wisconsin
Wyoming
76%
73
73
73
78
68
57
69
86
68
73
78
67
67
68
68
67
67
80
65
64
57
69
62
81
66
62
65
78
61
58
78
67
71
66
63
74
67
60
72
76
63
72
73
67
59
68
64
78
66
66
69%
64
61
67
63
59
49
59
—
60
65
65
63
58
64
66
61
65
72
65
52
51
64
56
69
62
60
61
69
60
49
62
56
61
65
58
71
63
54
66
66
60
66
58
63
59
60
59
78
61
64
91%
88
79
92
89
85
89
84
90
85
85
80
—
90
85
88
86
85
90
78
84
83
91
90
92
86
—
88
90
—
83
84
87
88
—
87
84
—
84
91
90
—
89
87
—
—
86
87
82
91
—
77%
75
85
81
87
84
81
79
79
73
80
76
89
82
85
82
84
70
—
—
75
83
74
84
—
75
—
81
87
73
80
86
84
81
—
84
86
86
88
89
70
—
79
83
87
—
78
83
—
85
77
—
79%
44
—
65
57
36
62
—
36
39
81
—
40
—
—
64
—
—
—
40
50
—
70
—
—
—
—
72
—
36
—
51
54
—
—
—
52
40
65
—
—
—
47
67
—
52
58
—
66
—
—
89%
87
—
—
—
—
—
—
—
—
—
—
—
—
—
75
—
—
—
—
—
—
74
—
—
80
—
—
—
—
88
—
84
78
—
75
72
—
—
—
84
—
—
90
—
—
75
—
—
—
80%
67
71
73
77
60
60
68
89
71
73
75
62
67
64
66
61
73
80
65
60
48
69
53
85
65
56
65
75
57
56
80
66
64
57
64
76
63
60
72
70
58
75
64
65
57
64
61
81
61
65
71%
56
58
66
61
49
51
57
—
61
61
69
57
56
59
63
55
71
71
64
44
41
63
47
75
61
53
59
64
56
46
61
56
51
54
59
71
59
55
65
57
54
70
46
60
56
56
54
80
55
62
94%
83
77
92
90
84
90
87
92
87
89
79
—
91
86
91
85
92
93
86
85
77
95
87
95
89
—
90
90
—
83
87
87
88
—
89
90
88
87
92
88
—
90
83
—
—
86
84
89
89
—
90%
77
84
85
89
82
86
78
82
78
82
74
85
83
81
85
78
78
—
—
74
79
83
79
—
63
73
90
87
78
78
88
85
76
—
84
88
85
82
92
84
87
81
75
89
—
77
87
—
80
85
—
69%
48
—
54
45
39
31
—
45
51
75
—
40
—
—
—
—
—
—
24
34
41
65
—
—
—
—
67
38
23
—
37
35
—
—
62
50
40
60
—
—
—
33
73
—
45
47
—
60
—
—
85%
88
—
—
—
—
—
—
—
—
—
—
—
—
—
—
—
—
—
—
—
—
79
—
—
84
—
—
—
—
90
—
86
84
—
81
75
—
—
—
83
—
—
82
—
—
77
—
—
—
United States
70
61
87
84
56
79
67
57
88
83
47
80
— Data not reported; number of students too small to calculate a reliable rate.
Sources: U.S. Department of Education, National Assessment of Educational Progress, The Nation’s Report Card: Reading 2009 (2010), Tables A–19 and
A–20; and U.S. Department of Education, National Assessment of Educational Progress, The Nation’s Report Card: Mathematics 2009 (2009), Tables A–19
and A–20. Calculations by Children’s Defense Fund.
State of America’s Children® 2011
H-9
Alaska, New York and the District of Columbia rank in the top five for public school per pupil
expenditures but have graduation rates below the national average.
Public School Education, Selected Indicators
Pupil/
teacher ratio
Fall 2008
Averaged
freshman
graduation rate*
2007–2008
Expenditures per pupil
2007–2008
Dollars
Rank
Alabama
Alaska
Arizona
Arkansas
California
Colorado
Connecticut
Delaware
District of Columbia
Florida
Georgia
Hawaii
Idaho
Illinois
Indiana
Iowa
Kansas
Kentucky
Louisiana
Maine
Maryland
Massachusetts
Michigan
Minnesota
Mississippi
Missouri
Montana
Nebraska
Nevada
New Hampshire
New Jersey
New Mexico
New York
North Carolina
North Dakota
Ohio
Oklahoma
Oregon
Pennsylvania
Rhode Island
South Carolina
South Dakota
Tennessee
Texas
Utah
Vermont
Virginia
Washington
West Virginia
Wisconsin
Wyoming
15.6
16.5
19.9
12.9
20.8
16.8
11.7
15.1
12.9
14.1
13.9
15.9
18.2
15.6
16.7
13.6
13.1
15.4
16.6
12.1
14.3
13.6
17.5
15.7
14.7
13.5
14.8
14.4
19.7
12.6
12.0
14.5
12.6
13.6
11.6
16.1
13.9
19.1
13.7
12.8
14.4
13.7
15.0
14.5
23.7
10.7
17.3
19.1
14.0
14.7
12.5
69.0%
69.1
70.7
76.4
71.2
75.4
82.2
72.1
56.0
66.9
65.4
76.0
80.1
80.4
74.1
86.4
79.1
74.4
63.5
79.1
80.4
81.5
76.3
86.4
63.9
82.4
82.0
83.8
51.3
83.4
84.6
66.8
70.8
72.8
83.8
79.0
78.0
76.7
82.7
76.4
—
84.4
74.9
73.1
74.3
89.3
77.0
71.9
77.3
89.6
76.0
$ 9,197
14,641
7,727
8,677
9,706
9,152
14,610
12,153
16,353
9,084
9,718
11,800
6,951
10,353
8,867
9,520
9,883
8,740
10,006
11,761
13,235
13,667
10,075
10,048
7,890
9,532
9,786
10,565
8,187
11,951
17,620
9,291
16,794
7,798
9,324
10,340
7,683
9,565
11,741
14,459
9,060
8,535
7,820
8,350
5,978
14,421
10,664
9,058
10,059
10,791
13,856
United States
15.3
74.9
$10,297
34
4
48
41
28
35
5
11
3
36
27
13
50
19
39
31
25
40
24
14
10
9
21
23
45
30
26
18
44
12
1
33
2
47
32
20
49
29
15
6
37
42
46
43
51
7
17
38
22
16
8
* Percent of 9th graders who graduate within four years with a regular diploma.
Source: U.S. Department of Education, National Center for Education Statistics, Digest of Education Statistics 2010, Table
70, accessed March 16th, 2011; U.S. Department of Education, National Center for Education Statistics, Public School
Graduates and Dropouts from the Common Core of Data: School Year 2007-08 (NCES 2010-341), Table 1; and U.S.
Department of Education, National Center for Education Statistics, Digest of Education Statistics 2010, Table 191, accessed
March 16th, 2011. Ranks calculated by Children’s Defense Fund.
H-10
Children’s Defense Fund
The averaged graduation rate for Black students is 20 percentage points below White students and
30 percentage points below that for Asian/Pacific Islander students. Graduation rates for Hispanic students
and American Indian/Alaska Native students are only slightly higher than those for Black students.
Graduation Rates, by Race, 2007–2008
Averaged Freshman Graduation Rates of Public Secondary Schools
Total
White
Alabama
Alaska
Arizona
Arkansas
California
Colorado
Connecticut
Delaware
District of Columbia
Florida
Georgia
Hawaii
Idaho
Illinois
Indiana
Iowa
Kansas
Kentucky
Louisiana
Maine
Maryland
Massachusetts
Michigan
Minnesota
Mississippi
Missouri
Montana
Nebraska
Nevada
New Hampshire
New Jersey
New Mexico
New York
North Carolina
North Dakota
Ohio
Oklahoma
Oregon
Pennsylvania
Rhode Island
South Carolina
South Dakota
Tennessee
Texas
Utah
Vermont
Virginia
Washington
West Virginia
Wisconsin
Wyoming
69.0%
69.1
70.7
76.4
71.2
75.4
82.2
72.1
56.0
66.9
65.4
76.0
80.1
80.4
74.1
86.4
79.1
74.4
63.5
79.1
80.4
81.5
76.3
86.4
63.9
82.4
82.0
83.8
51.3
83.4
84.6
66.8
70.8
72.8
83.8
79.0
78.0
76.7
82.7
76.4
NA
84.4
74.9
73.1
74.3
89.3
77.0
71.9
77.3
89.6
76.0
73.9%
70.3
73.6
77.7
80.1
82.9
87.5
NA
88.9
70.1
70.7
72.7
81.7
87.7
75.9
88.0
82.4
74.2
71.9
NA
84.9
84.4
81.6
90.3
67.0
85.2
84.7
88.6
NA
83.3
88.3
74.7
82.7
77.3
87.8
84.4
79.0
77.1
86.9
79.0
NA
88.3
77.3
81.6
77.9
81.1
80.8
73.6
77.3
94.0
78.5
United States
74.9
81.0
Hispanic
Asian,
Pacific
Islander
60.6%
51.8
76.9
70.2
57.4
65.1
71.1
NA
58.8
55.7
57.4
69.6
78.2
61.5
52.6
71.9
64.7
67.8
53.3
NA
73.0
69.6
59.2
66.6
60.5
68.0
64.6
57.0
NA
100.0
72.9
71.4
54.7
61.9
95.1
55.5
72.4
65.8
64.5
74.7
NA
88.4
67.4
65.7
54.4
91.2
65.3
58.2
72.3
63.1
61.8
62.2%
90.7
66.7
77.9
61.2
56.7
65.8
NA
54.2
63.9
55.4
71.3
68.7
69.6
66.6
70.2
62.2
75.6
72.3
NA
75.9
64.7
63.8
62.3
65.9
83.6
69.5
67.2
NA
48.1
76.4
62.3
53.1
63.7
63.7
65.6
73.0
71.0
67.8
70.1
NA
71.0
72.3
65.9
50.6
100.0
70.5
60.3
87.8
75.0
65.5
87.3%
76.6
98.5
100.0
91.1
92.1
99.0
NA
74.4
91.4
92.9
77.3
91.5
100.0
100.0
93.2
93.4
100.0
86.1
NA
100.0
89.1
94.8
87.9
88.3
100.0
100.0
97.8
NA
99.2
100.0
100.0
84.2
86.9
85.9
95.3
100.0
91.2
100.0
74.4
NA
97.4
94.3
98.6
73.5
81.8
99.1
84.4
100.0
97.5
98.5
82.3%
51.9
56.3
86.9
65.3
62.0
65.8
NA
100.0
70.3
72.1
80.3
65.8
95.8
69.8
63.6
63.9
51.0
65.2
NA
73.4
66.8
66.6
55.6
58.0
93.2
63.3
55.1
NA
60.0
100.0
61.0
55.5
60.7
47.0
74.1
76.4
62.8
63.8
78.0
NA
51.3
71.9
80.1
57.6
83.9
55.2
50.6
70.0
73.9
38.5
61.5
63.5
91.4
64.2
Black
American
Indian, Alaska
Native
Source: U.S. Department of Education, National Center for Education Statistics, Public School Graduates and Dropouts From the Common Core of Data:
School Year 2007-08 (NCES 2010-341), tables 2 and 3. Data from “NCES Common Core of Data State Dropout and Completion Data File,”
School Year 2007-08, Version 1a, at http://dashboard.ed.gov/
State of America’s Children® 2011 H-11
The U.S. spends almost two and a half times as much per prisoner as per public school pupil.
Spending on Prisoners vs. Spending on Public School Students, 2007
Alabama
Alaska
Arizona
Arkansas
California
Colorado
Connecticut
Delaware
District of Columbia*
Florida
Georgia
Hawaii
Idaho
Illinois**
Indiana
Iowa
Kansas
Kentucky
Louisiana
Maine
Maryland
Massachusetts
Michigan
Minnesota
Mississippi
Missouri
Montana
Nebraska
Nevada
New Hampshire
New Jersey
New Mexico
New York
North Carolina
North Dakota
Ohio
Oklahoma
Oregon
Pennsylvania
Rhode Island
South Carolina
South Dakota
Tennessee
Texas
Utah
Vermont
Virginia
Washington
West Virginia
Wisconsin
Wyoming
United States
Expenditure
per prisoner
Expenditure
per pupil
$ 13,518
63,979
22,984
18,788
37,709
22,429
45,004
47,266
1.61
5.19
3.13
2.24
4.21
2.71
3.29
4.02
20,534
26,926
26,928
19,037
10,422
52,077
44,342
78,580
29,843
24,307
12,832
17,838
32,018
20,208
17,496
27,005
37,839
38,079
38,483
30,357
35,695
15,940
17,379
26,124
30,701
55,452
17,133
25,659
15,691
17,140
29,044
30,948
21,017
35,267
37,364
33,175
36,306
$ 8,398
12,324
7,338
8,391
8,952
8,286
13,659
11,760
15,511
8,567
9,102
11,060
6,648
9,596
9,080
8,791
9,243
7,940
8,937
11,644
11,975
12,857
9,922
9,589
7,459
8,848
9,191
10,068
7,806
11,037
16,163
8,849
15,546
7,878
8,671
9,940
7,430
8,958
10,905
13,453
8,566
8,064
7,129
7,850
5,706
13,629
10,214
8,524
9,727
10,367
13,266
22,722
9,683
2.35
18,994
19,700
41,107
22,199
Ratio
2.22
2.16
3.72
3.34
2.26
3.06
2.91
2.40
1.17
4.47
3.70
6.11
3.01
2.53
1.72
2.02
3.48
2.01
2.24
2.45
2.34
4.30
2.48
3.85
4.12
1.60
2.34
2.92
2.82
4.12
2.00
3.18
2.20
2.18
5.09
2.27
2.06
4.14
3.84
3.20
2.74
* The District of Columbia does not have a prison system.
** Illinois did not provide data.
Sources: U.S. Department of Justice, Bureau of Justice Statistics, Justice Expenditure and Employment Abstracts, 2007
(September 2010), Table cjee0710, Detail of direct expenditure for correctional activities of State governments by character
and object, fiscal 2007, at <http://bjs.ojp.usdoj.gov/index.cfm?ty=pbdetail&iid=2315>; U.S. Department of Justice,
Bureau of Justice Statistics, Prison Inmates at Midyear 2007 (June 2008), Appendix Table 2; and U.S. Department of
Education, National Center for Education Statistics, Digest of Education Statistics 2009 (April 2010), Table 185.
Calculations by Children’s Defense Fund.
H-12
Children’s Defense Fund
Black students are more than three times as likely as White or Asian/Pacific Islander students and
more than twice as likely as Hispanic students to be suspended.
School Discipline, 2006
Number of Suspensions per 100 Public School Students
Alabama
Alaska
Arizona
Arkansas
California
Colorado
Connecticut
Delaware
District of Columbia
Florida
Georgia
Hawaii
Idaho
Illinois
Indiana
Iowa
Kansas
Kentucky
Louisiana
Maine
Maryland
Massachusetts
Michigan
Minnesota
Mississippi
Missouri
Montana
Nebraska
Nevada
New Hampshire
New Jersey
New Mexico
New York
North Carolina
North Dakota
Ohio
Oklahoma
Oregon
Pennsylvania
Rhode Island
South Carolina
South Dakota
Tennessee
Texas
Utah
Vermont
Virginia
Washington
West Virginia
Wisconsin
Wyoming
United States
Total,
all
races
American Indian,
Alaska
Native
Asian,
Pacific
Islander
Hispanic
Black
White
10.113
5.895
5.892
7.313
7.507
6.031
6.838
10.938
0.360
10.459
8.831
5.473
3.585
6.439
7.377
2.963
5.091
6.565
10.349
4.565
7.087
5.563
8.205
3.731
10.216
7.286
4.475
3.702
7.400
5.567
5.670
5.265
3.799
10.763
2.173
6.246
4.887
4.942
6.786
8.380
11.882
2.686
7.240
5.563
3.197
3.994
7.233
5.947
10.206
4.970
2.850
4.835
8.209
9.973
4.684
12.238
8.652
5.218
—
—
7.170
3.742
5.996
8.607
2.906
6.063
5.181
5.807
3.791
6.791
6.365
8.543
4.976
6.754
10.016
12.689
6.999
9.597
6.712
6.612
—
3.654
8.282
4.473
14.883
8.047
3.724
3.992
7.169
3.425
11.771
9.571
6.841
3.415
3.053
6.859
—
4.039
11.305
8.201
13.506
6.416
3.188
4.609
2.609
3.492
3.268
3.242
2.386
3.312
—
2.871
2.110
5.528
1.649
1.664
1.791
1.605
2.921
1.514
2.618
2.935
2.156
2.520
2.202
2.463
3.000
2.888
2.333
1.913
3.859
2.235
1.433
2.526
0.690
2.661
—
2.055
1.778
2.091
2.669
7.162
2.873
2.988
2.694
1.625
4.210
—
2.065
3.689
2.369
2.119
—
4.289
5.944
6.359
4.879
7.876
8.138
11.407
9.216
—
7.702
5.424
5.655
5.105
5.971
7.383
3.190
6.559
3.982
4.716
5.732
12.907
11.952
7.422
5.350
4.259
5.366
3.501
5.047
8.482
12.104
6.897
5.388
2.790
7.206
3.139
5.970
5.309
5.479
8.694
12.576
6.500
4.310
5.351
5.730
6.662
4.121
5.598
7.158
11.208
7.528
3.102
18.272
10.014
11.805
15.892
17.093
13.153
17.182
20.058
0.400
19.334
15.007
7.008
3.486
14.478
17.266
11.432
14.614
13.324
14.643
8.956
8.176
10.277
17.782
14.432
14.757
20.153
4.919
12.584
15.476
8.733
12.371
6.988
7.285
20.027
5.003
14.602
12.056
8.807
18.903
14.617
19.220
7.122
12.847
12.674
7.759
5.838
13.939
11.979
21.493
19.721
3.168
5.801
4.564
4.462
5.011
5.962
4.544
4.019
6.384
—
7.863
4.798
4.879
3.278
3.758
5.957
2.432
3.824
5.809
7.063
4.453
5.760
4.230
6.091
2.427
5.548
4.573
3.737
2.564
5.139
5.365
3.668
3.951
3.350
6.480
1.478
4.558
3.910
4.780
4.165
6.664
6.892
1.934
5.538
2.887
2.432
3.989
4.723
5.255
9.683
2.714
2.721
6.864
7.931
2.712
6.777
14.982
4.760
— Number too small to calculate a stable rate.
Source: U.S. Department of Education, Office for Civil Rights, 2006 Civil Rights Data Collection, projections. Calculations by Children’s Defense Fund.
State of America’s Children® 2011 H-13
In 2007 almost one in five high school students admitted carrying a weapon; one-third of
them brought a weapon to school. One in 18 high school students reported staying home
from school because they felt unsafe at school or going to or from school.
Violence and Risk Behaviors of High School Students, 2007
Total
Race/Ethnicity
White
Black Hispanic
18.0%
18.2%
17.2%
18.5%
20.1%
Carried a gun
5.2
4.3
6.2
6.2
5.2
5.5
4.6
5.0
Carried a weapon
to school
5.9
5.3
6.0
7.3
6.0
5.8
5.5
6.0
Threatened or injured
with a weapon on
school property
7.8
6.9
9.7
8.7
9.2
8.4
6.8
6.3
35.5
31.7
44.7
40.4
40.9
36.2
34.8
28.0
4.2
3.0
5.3
6.3
5.6
3.7
3.5
3.3
In a physical fight on
school property
12.4
10.2
17.6
15.5
17.0
11.7
11.0
8.6
Did not go to school
because felt unsafe
at school or on way
to/from school
5.5
4.0
6.6
9.6
6.6
5.4
4.7
4.8
Carried a weapon
In a physical fight
Injured in a physical fight
Grade
9
10
11
18.8% 16.7%
12
15.5%
Source: Centers for Disease Control and Prevention, Surveillance Summaries, “Youth Risk Behavior Surveillance – United States, 2007,” MMWR,
Vol. 57, No. SS-4 (June 6, 2008), Tables 7, 9, 13, 15 and 17.
H-14
Children’s Defense Fund
A New Look at America’s “Dropout Factories”
In 2004, Johns Hopkins University researchers identified 2,000 schools in the United States
as “dropout factories” – high schools where 60 percent or fewer of the students in any given
ninth grade class will graduate in four years. Although they represented a relatively small
percentage (18%) of all high schools in the country, these “dropout factories” were responsible for turning out over half of the nation’s dropouts. The students attending these failing
schools were overwhelmingly minority and overwhelmingly poor. In fact, researchers found
that, at the time, almost half of all Black high school students and 39 percent of all Latino
high school students in America attended a “dropout factory,”
while only 11 percent of White students did so.
Today, thanks in large part to the John Hopkins researchers’ unrelenting spotlight on these
low-performing high schools, the number of “dropout factories” has been reduced, as has
the proportion of minority children who attend them. However, there is still much work
to be done to turn all of these high schools that manufacture failure into ones that program
students for success.
Currently,
• 2.1 million students, about 13 percent of all high school students in America,
are enrolled in America’s 1,634 Dropout Factories.
• 35 percent of all Black high school students in the nation, 29 percent of all
Hispanic high school students, and only 8 percent of all White high school
students attend Dropout Factories.
• Dropout Factories are still responsible for producing half the nation’s dropouts.
• 849 Dropout Factories are located in cities, 367 in suburbs, and 295 in
rural areas.
• There is at least one Dropout Factory in every state. Seventy percent are found
in just 12 states: Pennsylvania, New York, Mississippi, Ohio, South Carolina,
North Carolina, Florida, Texas, Louisiana, Michigan, Georgia, and California.
• Between 2008 and 2009, nationally there was a reduction, by 112, in the total
number of Dropout Factories. However, over the same period, nine states added
three or more, and New York and Georgia each added 10.
President Obama has set a goal that, by 2020, America will once again lead the world in
college completion. To reach that goal, our nation will first need to do a better job of
keeping high school students in school through graduation and preparing them adequately
for success in college, without remediation. We must push forward and accelerate our
successes to bring the number of Dropout Factories to zero.
Sources: “Locating the Dropout Crisis: Which High Schools Produce the Nation’s Dropouts? Where are they Located? Who
Attends Them?” Robert Balfanz and Nettie Legers, 2004: Center for Research on the Education of Students Placed at Risk
(CRESPAR); “Building a Grad Nation: Progress and Challenge in Ending the High School Dropout Epidemic,” Robert Balfanz,
John Bridgeland, Laura Moore, and Joanna Fox, 2010: America’s Promise Alliance, Civic Enterprises, Everyone Graduates
Center. “Building a Grad Nation: 2010-2011 Annual Update,” 2011.
State of America’s Children® 2011 H-15
Nevada and Louisiana have the highest dropout rates among 16- to 19-year-olds; Minnesota and
New Hampshire have the lowest. Almost two-thirds of teen dropouts do not have a job.
Dropouts, 2009
Persons Ages 16–19 Who Are Not Enrolled in School and Do Not Have a High School Credential
Number of
dropouts
Alabama
Alaska
Arizona
Arkansas
California
Colorado
Connecticut
Delaware
District of Columbia
Florida
Georgia
Hawaii
Idaho
Illinois
Indiana
Iowa
Kansas
Kentucky
Louisiana
Maine
Maryland
Massachusetts
Michigan
Minnesota
Mississippi
Missouri
Montana
Nebraska
Nevada
New Hampshire
New Jersey
New Mexico
New York
North Carolina
North Dakota
Ohio
Oklahoma
Oregon
Pennsylvania
Rhode Island
South Carolina
South Dakota
Tennessee
Texas
Utah
Vermont
Virginia
Washington
West Virginia
Wisconsin
Wyoming
United States
19,382
2,551
27,017
11,145
112,937
20,124
9,100
2,928
2,841
67,497
44,884
4,775
6,125
44,137
26,772
8,965
8,305
16,986
20,456
2,943
15,609
15,991
34,067
10,959
14,079
24,139
5,096
5,389
15,663
2,072
15,805
10,984
61,388
38,766
1,956
32,753
17,488
12,199
37,346
4,320
17,681
2,840
17,932
105,456
8,449
1,737
16,794
22,519
8,539
12,869
2,479
1,053,234
Percent of all
16- to 19-year-olds
7.2%
5.5
7.5
7.0
5.2
7.5
4.4
5.8
7.4
7.1
7.5
7.4
6.2
5.9
7.3
5.1
5.1
7.0
7.8
3.9
4.7
4.2
5.7
3.7
7.4
7.2
8.6
5.2
11.0
2.6
3.4
9.1
5.5
7.3
4.7
5.0
8.3
5.9
5.1
6.7
6.6
5.5
5.1
7.3
4.8
4.5
3.6
6.1
8.8
3.9
7.8
6.0
Percent in the
labor force
(labor force
participation rate)
Percent
with a job
(employmentpopulation ratio)
Percent of the
labor force that
is unemployed
(unemployment rate)
51.5%
45.6
46.3
53.2
50.5
62.3
63.9
63.6
33.2
45.3
42.7
30.2
63.5
46.5
59.0
63.2
64.3
43.1
48.9
49.3
49.7
53.9
43.7
56.8
40.3
54.3
37.5
66.0
59.4
82.4
48.1
49.9
39.9
48.8
43.7
51.2
53.1
67.2
43.2
59.6
45.0
41.1
53.4
53.6
65.3
35.0
44.7
50.4
40.2
57.1
55.4
25.3%
32.9
27.0
28.3
31.9
41.2
41.7
—
—
22.7
20.4
23.9
42.0
25.1
35.0
45.9
40.0
16.6
30.0
30.2
30.3
33.1
16.9
37.1
20.5
30.9
16.2
41.0
34.0
45.3
31.0
25.3
25.6
24.3
37.3
27.5
36.9
37.6
26.7
29.6
25.8
37.3
25.9
35.9
32.3
—
25.5
32.9
15.5
38.4
25.5
50.9%
27.7
41.6
46.8
36.8
33.9
34.6
76.7
—
50.0
52.3
—
33.8
45.9
40.6
27.3
37.8
61.5
38.6
38.7
38.9
38.6
61.4
34.7
49.3
43.2
56.7
37.9
42.7
45.0
35.7
49.4
35.7
50.1
—
46.3
30.5
44.0
38.3
50.3
42.7
—
51.4
33.0
50.6
41.6
42.9
34.8
61.4
32.7
54.0
49.8
29.0
41.8
Sample too small to calculate a reliable number or rate.
Source: U.S.Department of Commerce, Bureau of the Census, 2009 American Community Survey, Table 14005. Calculations by Children’s Defense Fund.
H-16
Children’s Defense Fund
Many states and local school districts with high poverty rates receive less Title I funding per pupil
than wealthier districts because of formulas that favor school districts with large numbers of students.
Title I of the Elementary and Secondary Education Act
Number of
pupils served,
2007–2008
Alabama
Alaska
Arizona
Arkansas
California
Colorado
Connecticut
Delaware
District of Columbia
Florida
Georgia
Hawaii
Idaho
Illinois
Indiana
Iowa
Kansas
Kentucky
Louisiana
Maine
Maryland
Massachusetts
Michigan
Minnesota
Mississippi
Missouri
Montana
Nebraska
Nevada
New Hampshire
New Jersey
New Mexico
New York
North Carolina
North Dakota
Ohio
Oklahoma
Oregon
Pennsylvania
Rhode Island
South Carolina
South Dakota
Tennessee
Texas
Utah
Vermont
Virginia
Washington
West Virginia
Wisconsin
Wyoming
United States
Total
allocations,
2009
(in 1,000s)
400,838
69,920
584,110
320,015
4,571,485
213,792
223,263
122,574
78,108
1,637,345
815,047
110,834
188,337
1,383,148
820,671
275,136
303,616
544,230
531,838
143,690
158,155
464,659
1,610,785
313,734
339,471
369,610
114,199
103,518
82,970
78,572
692,273
195,603
1,777,301
504,978
50,539
1,193,471
382,025
206,999
1,255,637
118,996
535,894
54,762
701,532
3,001,541
109,129
51,870
321,442
531,769
101,948
527,152
37,800
$ 242,060
46,044
300,152
170,408
1,800,558
166,968
115,601
42,313
49,535
702,690
506,877
44,783
53,409
640,580
269,669
80,164
115,985
235,930
315,407
54,832
194,194
248,911
566,379
144,364
201,042
238,468
47,250
73,880
93,546
40,758
291,371
119,878
1,264,435
378,758
36,283
555,749
164,244
148,129
589,777
53,545
213,873
45,102
278,045
1,437,805
72,333
34,913
251,482
215,768
94,877
217,408
34,981
29,326,331
14,301,514
Percent of
pupils who
are eligible,
2008–2009
21.9%
13.5
19.6
22.3
18.5
13.8
14.6
29.1
12.5
17.0
18.5
11.8
14.6
17.5
15.9
12.5
14.9
20.9
26.3
14.8
11.0
15.7
18.2
11.6
27.2
18.8
17.4
13.5
14.3
9.8
14.9
23.3
20.8
19.4
12.0
17.3
19.8
16.8
17.3
17.9
20.7
15.2
19.7
22.8
10.1
12.2
12.9
14.2
23.0
13.9
11.6
Grant
per eligible
pupil,
2008–2009
$ 1,344
2,108
1,363
1,477
1,310
1,531
1,833
2,082
2,336
1,364
1,586
1,731
1,225
1,850
1,515
1,267
1,574
1,508
1,373
1,763
1,866
1,847
1,727
1,532
1,318
1,337
1,663
1,652
1,472
2,252
1,769
1,387
2,034
1,261
2,822
1,640
1,274
1,342
1,796
1,807
1,356
2,004
1,380
1,352
1,298
2,885
1,591
1,298
1,423
1,825
3,149
Sources: U.S. Department of Education, National Center for Education Statistics, Common Core of Data (CCD), Public Elementary/Secondary School
Universe Survey, 2007-2008, Table 3; U.S. Department of Education, National Center for Education Statistics, Digest of Education Statistics 2009 (March
2010), Table 379; and Rural School and Community Trust, analysis of data from the Congressional Research Service.
Calculations by Childrenís Defense Fund.
State of America’s Children® 2011 H-17
More than 6.8 million children and youths with disabilities, ages birth through 21, receive
special education and related services under IDEA.
Children Receiving Services Under the Individuals with
Disabilities Education Act (IDEA), by Age, 2008
Part C
Ages 0–2
Alabama
Alaska
Arizona
Arkansas
California
Colorado
Connecticut
Delaware
District of Columbia
Florida
Georgia
Hawaii
Idaho
Illinois
Indiana
Iowa
Kansas
Kentucky
Louisiana
Maine
Maryland
Massachusetts
Michigan
Minnesota
Mississippi
Missouri
Montana
Nebraska
Nevada
New Hampshire
New Jersey
New Mexico
New York
North Carolina
North Dakota
Ohio
Oklahoma
Oregon
Pennsylvania
Rhode Island
South Carolina
South Dakota
Tennessee
Texas
Utah
Vermont
Virginia
Washington
West Virginia
Wisconsin
Wyoming
United States
Ages 3–5
Ages 6–11
Part B
Ages 12–17
Ages 18–21
Ages 3–21
2,955
576
5,783
2,878
40,977
4,728
4,603
848
309
13,261
5,723
3,621
1,954
18,535
9,756
3,576
3,425
4,999
3,788
982
7,315
14,902
10,023
4,579
2,115
3,784
731
1,408
2,052
1,411
9,786
4,405
31,150
9,290
935
14,840
2,923
2,590
16,914
1,764
4,398
1,128
4,362
26,777
3,109
758
6,321
4,906
2,682
5,980
1,091
7,079
1,941
14,028
12,288
70,497
11,255
7,911
2,237
543
33,796
16,185
2,501
3,981
36,997
18,834
5,944
9,896
19,755
9,860
3,700
12,203
16,317
24,488
14,361
8,968
15,245
1,954
4,522
6,170
2,891
15,379
6,487
61,799
18,682
1,576
23,209
7,431
9,008
29,496
2,930
10,763
2,734
12,325
38,169
8,366
—
17,124
14,006
5,899
15,153
3,083
33,543
8,076
53,449
24,033
271,056
34,677
26,572
7,640
3,539
157,492
76,943
7,694
12,052
127,977
75,044
26,297
27,183
48,321
38,391
13,343
41,224
67,516
94,749
48,132
27,283
55,495
7,291
20,056
19,700
11,123
95,926
18,525
168,213
82,768
5,512
99,902
40,428
34,117
110,940
10,448
43,674
8,224
50,854
172,768
29,956
—
66,049
55,188
20,532
49,809
5,933
37,236
6,736
51,966
25,500
294,272
33,361
30,825
8,165
5,497
171,823
78,657
9,305
10,700
137,137
72,382
31,606
25,750
35,648
33,359
14,701
44,974
76,472
100,108
49,995
24,804
54,774
7,613
17,632
20,634
14,616
103,089
18,317
192,674
76,879
5,507
123,665
41,563
32,355
137,230
12,726
41,536
6,084
49,325
216,219
24,092
—
73,615
49,715
18,036
54,333
5,112
5,003
909
5,350
2,898
35,270
4,284
3,545
1,042
1,092
21,864
7,922
630
1,197
16,418
9,854
3,515
2,901
4,008
4,412
1,540
5,050
8,192
13,099
7,503
3,352
7,432
787
1,828
1,824
1,526
9,516
2,628
21,653
9,399
683
18,102
4,514
3,924
17,292
1,492
5,923
825
5,921
25,155
2,670
—
9,901
6,425
2,511
6,009
639
82,861
17,662
124,793
64,719
671,095
83,577
68,853
19,084
10,671
384,975
179,707
20,130
27,930
318,529
176,114
67,362
65,730
107,732
86,022
33,284
103,451
168,497
232,444
119,991
64,407
132,946
17,645
44,038
48,328
30,156
223,910
45,957
444,339
187,728
13,278
264,878
93,936
79,404
294,958
27,596
101,896
17,867
118,425
452,311
65,084
—
166,689
125,334
46,978
125,304
14,767
337,706
699,966
2,635,657
2,808,320
339,429
6,483,372
Source: U.S. Department of Education, Office of Special Education Programs, Data Analysis Systems (DANS), Tables AR 1-1 and AR 8-1. Calculations by
Children’s Defense Fund.
H-18
Children’s Defense Fund
Black students are far more likely than other students to be enrolled in special education classes for
children with mental retardation and emotional disturbances. American Indian/Alaska Native and
Black students are more likely to be enrolled in classes for students with learning disabilities.
Enrollment in Classes for Students with Mental Retardation, by Race, 2006
2.0
1.9%
1.5
Percent
1.1%
1.0%
1.0
0.9%
0.8%
0.6%
0.5
0
Total,
All Races
Black
American Indian,
Alaska Native
White
Hispanic
Asian,
Pacific Islander
Source: U.S. Department of Education, Office for Civil Rights, 2006 Civil Rights Data Collection, projections.
Calculations by Children's Defense Fund.
Enrollment in Classes for Students with Emotional Disturbances, by Race, 2006
1.5
1.4%
1.1%
1.0
Percent
0.9%
0.8%
0.5%
0.5
0.2%
0
Total,
All Races
Black
American Indian,
Alaska Native
White
Hispanic
Asian,
Pacific Islander
Source: U.S. Department of Education, Office for Civil Rights, 2006 Civil Rights Data Collection, projections.
Calculations by Children’s Defense Fund.
Enrollment in Classes for Students with Learning Disabilities, by Race, 2006
7.0%
7
6.3%
6
5.4%
5.3%
5.5%
Percent
5
4
3
1.9%
2
1
0
Total,
All Races
Black
American Indian,
Alaska Native
White
Hispanic
Asian,
Pacific Islander
Source: U.S. Department of Education, Office for Civil Rights, 2006 Civil Rights Data Collection, projections.
Calculations by Children’s Defense Fund.
State of America’s Children® 2011 H-19
In all but seven of 44 states, Black students are overrepresented in special education classes for
students with mental retardation, often by a ratio of 2:1 or greater. American Indian/
Alaska Native students also are overrepresented in these classes.
Enrollment in Classes for Students with Mental Retardation,* 2006
Percent Enrolled
Total,
all
races
American Indian,
Alaska
Native
Asian,
Pacific
Islander
Hispanic
Black
White
Alabama
Alaska
Arizona
Arkansas
California
Colorado
Connecticut
Delaware
District of Columbia
Florida
Georgia
Hawaii
Idaho
Illinois
Indiana
Iowa
Kansas
Kentucky
Louisiana
Maine
Maryland
Massachusetts
Michigan
Minnesota
Mississippi
Missouri
Montana
Nebraska
Nevada
New Hampshire
New Jersey
New Mexico
New York
North Carolina
North Dakota
Ohio
Oklahoma
Oregon
Pennsylvania
Rhode Island
South Carolina
South Dakota
Tennessee
Texas
Utah
Vermont
Virginia
Washington
West Virginia
Wisconsin
Wyoming
1.051%
0.433
0.867
1.777
0.748
0.440
0.445
1.764
0.597
1.241
1.437
0.841
0.667
1.150
1.846
1.213
0.914
2.506
1.281
0.437
0.626
1.547
1.593
1.044
0.864
1.182
0.771
1.622
0.456
0.436
0.499
0.546
0.526
1.578
1.084
1.674
1.112
0.745
1.272
0.711
1.442
0.877
0.757
0.692
0.626
1.008
0.878
0.524
2.864
1.235
0.610
0.649%
0.741
1.252
1.064
0.864
0.613
—
—
—
0.944
—
—
0.742
—
2.058
1.313
0.753
—
0.951
—
—
1.195
1.445
1.715
—
—
1.187
2.789
0.612
—
—
0.630
0.646
2.868
1.919
1.712
1.050
1.098
—
—
—
1.568
—
0.735
0.654
—
0.717
0.973
—
1.651
—
—
—
0.511%
0.518
0.842
0.229
0.240
—
—
0.602
0.502
0.919
—
0.489
0.497
0.646
0.390
0.505
0.313
—
—
0.793
0.686
0.733
—
0.498
—
0.871
0.390
—
0.235
—
0.274
0.499
—
0.371
0.392
0.490
0.414
0.649
0.501
—
0.245
0.424
0.399
—
0.491
0.330
—
0.995
—
0.378%
—
0.961
1.046
0.734
0.563
0.497
1.390
—
0.895
0.863
0.732
0.764
0.866
1.350
1.292
0.749
0.933
0.429
—
0.620
3.832
1.294
1.067
0.335
0.745
0.996
1.701
0.435
0.634
0.648
0.566
0.574
0.891
—
1.932
0.792
0.607
1.516
1.289
0.493
1.489
0.355
0.598
0.667
—
0.657
0.590
1.596
1.193
0.674
1.530%
—
1.447
3.399
1.135
0.888
0.703
2.953
0.664
2.358
2.201
—
—
2.329
3.891
2.081
2.070
3.517
1.881
—
0.943
5.483
3.159
1.858
1.211
2.145
—
2.615
0.742
—
0.921
0.816
0.876
2.978
1.720
3.233
2.117
1.433
2.127
1.169
2.324
1.333
0.823
1.299
1.013
1.926
1.565
0.789
3.155
2.529
—
0.822%
0.324
0.688
1.387
0.629
0.352
0.394
1.205
—
0.897
0.973
0.516
0.650
0.835
1.595
1.167
0.832
2.441
0.819
0.434
0.418
0.793
1.254
0.963
0.508
1.002
0.693
1.504
0.406
0.430
0.348
0.464
0.415
0.925
0.974
1.358
1.023
0.750
1.101
0.526
0.866
0.751
0.770
0.597
0.621
1.000
0.613
0.494
2.877
1.067
0.602
United States
1.027
1.107
0.599
0.768
1.919
0.885
* According to the American Association on Intellectual and Developmental Disabilities (AAIDD): “Intellectual disability is the currently preferred term for
the disability historically referred to as mental retardation.” Frequently Asked Questions on Intellectual Disability and the AAIDD Definition, at
<http://www.aamr.org/Policies/faq_intellectual_disability.shtml>; accessed November 2008.
— Number too small to calculate a stable rate.
Source: U.S. Department of Education, Office for Civil Rights, 2006 Civil Rights Data Collection, projections. Calculations by Children’s Defense Fund.
H-20
Children’s Defense Fund
Black children are more than three times as likely as Hispanic children and more than
seven times as likely as Asian/Pacific Islander children to be in special education classes
for students with emotional disturbances.
Enrollment in Classes for Students with Emotional Disturbances, 2006
Percent Enrolled
Total,
all
races
American Indian,
Alaska
Native
Asian,
Pacific
Islander
Hispanic
Black
White
Alabama
Alaska
Arizona
Arkansas
California
Colorado
Connecticut
Delaware
District of Columbia
Florida
Georgia
Hawaii
Idaho
Illinois
Indiana
Iowa
Kansas
Kentucky
Louisiana
Maine
Maryland
Massachusetts
Michigan
Minnesota
Mississippi
Missouri
Montana
Nebraska
Nevada
New Hampshire
New Jersey
New Mexico
New York
North Carolina
North Dakota
Ohio
Oklahoma
Oregon
Pennsylvania
Rhode Island
South Carolina
South Dakota
Tennessee
Texas
Utah
Vermont
Virginia
Washington
West Virginia
Wisconsin
Wyoming
0.215%
0.404
0.731
0.174
0.325
0.910
0.794
0.709
0.559
1.111
1.354
1.118
0.506
1.101
1.317
0.855
0.733
0.883
0.437
1.361
0.749
1.137
1.121
1.993
0.302
0.872
0.679
0.734
0.484
1.163
0.694
0.685
1.288
0.770
1.044
0.931
0.809
0.790
1.183
1.207
0.698
1.055
0.316
0.747
0.507
1.956
0.795
0.448
0.760
1.732
1.011
—
0.510%
0.640
—
0.858
1.785
1.555
—
—
0.982
—
—
—
0.772
1.272
—
0.956
—
—
—
—
1.608
1.280
5.677
—
—
0.809
2.411
0.627
—
—
0.742
1.970
1.204
1.526
—
0.671
1.254
—
3.264
—
—
—
1.053
0.863
—
1.052
0.821
—
5.691
2.308
—
0.151%
0.216
—
0.091
0.259
0.160
—
—
0.091
0.183
1.051
—
0.247
0.219
—
—
—
—
—
0.082
0.347
0.213
0.410
—
—
—
—
0.140
0.133
0.117
—
0.191
—
—
0.113
—
0.204
0.201
—
—
—
—
0.150
0.209
—
0.167
0.119
—
0.325
—
0.085%
0.202
0.382
0.068
0.174
0.637
0.992
0.397
—
0.600
0.358
1.299
0.193
0.542
0.396
0.603
0.319
0.277
—
—
0.556
1.569
0.673
1.451
—
0.332
—
0.319
0.164
0.580
0.557
0.587
1.384
0.168
—
0.855
0.241
0.365
1.036
1.195
0.168
1.291
0.082
0.484
0.391
—
0.454
0.215
—
0.995
0.895
0.226%
0.773
1.568
0.162
0.809
1.804
1.238
0.917
0.624
1.805
1.721
1.268
—
1.888
2.122
2.324
1.318
1.933
0.607
1.595
1.039
2.432
1.482
5.084
0.271
1.468
—
1.825
0.969
0.936
1.341
1.147
2.692
1.367
2.241
1.742
1.111
1.683
2.059
2.148
0.987
0.590
0.293
1.183
1.520
1.926
1.126
1.050
1.689
2.844
2.550
0.221%
0.372
0.994
0.194
0.514
0.964
0.695
0.667
—
1.083
1.306
1.392
0.560
1.058
1.288
0.799
0.749
0.769
0.314
1.368
0.630
0.976
1.091
1.729
0.341
0.779
0.661
0.668
0.674
1.211
0.614
0.810
0.889
0.557
0.977
0.777
0.903
0.868
1.036
1.113
0.534
United States
0.845
1.114
0.203
0.460
1.426
0.857
0.342
0.967
0.515
1.994
0.737
0.471
0.719
1.632
0.962
— Number too small to calculate a stable rate.
Source: U.S. Department of Education, Office for Civil Rights, 2006 Civil Rights Data Collection, projections.
Calculations by Children’s Defense Fund.
State of America’s Children® 2011 H-21
About 1 in 20 public school students is in a special education class for students
with learning disabilities.
Enrollment in Classes for Students with Learning Disabilities, 2006
Percent Enrolled
Alabama
Alaska
Arizona
Arkansas
California
Colorado
Connecticut
Delaware
District of Columbia
Florida
Georgia
Hawaii
Idaho
Illinois
Indiana
Iowa
Kansas
Kentucky
Louisiana
Maine
Maryland
Massachusetts
Michigan
Minnesota
Mississippi
Missouri
Montana
Nebraska
Nevada
New Hampshire
New Jersey
New Mexico
New York
North Carolina
North Dakota
Ohio
Oklahoma
Oregon
Pennsylvania
Rhode Island
South Carolina
South Dakota
Tennessee
Texas
Utah
Vermont
Virginia
Washington
West Virginia
Wisconsin
Wyoming
Total,
all
races
5.357%
3.692
5.434
4.779
4.613
3.898
3.719
8.007
1.393
6.484
3.334
5.046
4.199
6.674
6.122
7.848
5.659
2.309
4.097
5.420
3.887
6.684
5.502
3.969
5.477
5.118
5.831
5.449
6.116
6.629
6.899
6.001
6.148
4.343
5.313
5.516
7.326
5.102
7.905
7.397
6.487
5.370
4.245
5.068
5.429
4.725
5.039
4.474
5.848
4.847
5.357
United States
5.353
American Indian,
Alaska
Native
4.113%
5.844
9.013
4.836
5.868
5.662
4.566
—
—
6.524
2.946
5.443
8.558
6.857
6.063
8.792
6.994
—
4.757
6.506
3.745
7.127
7.563
6.405
6.250
4.287
8.102
8.249
10.851
6.346
5.592
7.237
7.700
4.805
8.934
6.550
7.163
7.522
6.245
11.474
5.701
9.508
3.610
5.225
10.114
—
5.760
7.476
10.582
7.671
9.116
Asian,
Pacific
Islander
1.228%
1.105
1.662
1.323
1.473
1.449
0.988
2.024
—
1.885
1.088
5.032
1.474
1.919
1.594
3.288
2.631
0.488
0.637
2.138
0.992
2.446
1.409
2.969
1.017
1.514
2.640
2.462
2.291
1.836
1.686
3.098
1.854
1.786
—
1.564
2.214
1.619
2.121
3.435
1.645
3.071
0.952
1.213
2.948
—
2.193
2.337
—
3.317
—
Hispanic
3.724%
2.381
5.719
3.775
5.064
4.579
4.419
8.576
1.780
6.458
3.384
6.424
4.760
6.431
4.487
7.166
5.168
1.872
2.173
3.992
5.307
7.574
6.073
5.594
2.594
3.431
6.006
4.978
5.704
7.030
7.392
6.105
6.598
4.216
6.475
5.716
5.950
4.965
9.345
9.273
4.176
5.564
2.477
5.230
7.281
—
6.231
5.727
6.166
4.688
6.732
Black
7.135%
2.254
6.588
5.441
7.901
5.267
4.479
10.556
1.369
6.605
3.329
5.381
4.835
7.850
6.515
10.378
7.296
2.101
5.383
4.531
4.237
7.509
6.371
5.793
6.558
6.120
6.114
5.413
9.419
5.047
8.962
7.816
7.432
4.733
4.846
5.786
9.684
6.342
9.410
8.637
7.173
4.998
3.302
6.910
7.658
3.970
5.964
6.739
6.497
6.366
5.873
6.995
1.906
5.503
6.322
White
4.484%
3.182
4.820
4.765
4.239
3.570
3.571
6.752
1.040
6.663
3.468
4.765
4.067
6.638
6.283
7.843
5.632
2.367
3.121
5.505
3.692
6.756
5.374
3.675
4.466
5.053
5.516
5.545
6.110
6.757
6.770
5.350
6.068
4.234
4.970
5.529
7.322
5.242
7.692
6.958
6.271
4.811
4.744
4.469
5.092
4.793
4.690
4.170
5.843
4.670
5.133
5.261
— Number too small to calculate a stable rate
Source: U.S. Department of Education, Office for Civil Rights, 2006 Civil Rights Data Collection, projections. Calculations by Children’s Defense Fund.
H-22
Children’s Defense Fund
Black, Hispanic and American Indian/Alaska Native children are less likely than Asian/Pacific
Islander or White students to be in gifted and talented programs.
Enrollment in Programs for the Gifted and Talented, 2006
Percent Enrolled
Alabama
Alaska
Arizona
Arkansas
California
Colorado
Connecticut
Delaware
District of Columbia
Florida
Georgia
Hawaii
Idaho
Illinois
Indiana
Iowa
Kansas
Kentucky
Louisiana
Maine
Maryland
Massachusetts
Michigan
Minnesota
Mississippi
Missouri
Montana
Nebraska
Nevada
New Hampshire
New Jersey
New Mexico
New York
North Carolina
North Dakota
Ohio
Oklahoma
Oregon
Pennsylvania
Rhode Island
South Carolina
South Dakota
Tennessee
Texas
Utah
Vermont
Virginia
Washington
West Virginia
Wisconsin
Wyoming
United States
Total,
all races
American Indian,
Alaska
Native
Asian,
Pacific
Islander
Hispanic
Black
5.469%
4.109
6.319
9.548
8.279
6.835
3.793
5.616
—
4.747
9.269
6.240
4.194
5.839
7.888
8.204
3.022
14.605
3.361
3.221
16.083
0.682
3.422
8.763
6.112
3.553
5.161
11.404
1.935
2.572
6.978
3.979
2.903
10.757
2.818
7.288
13.694
6.938
4.518
1.412
10.987
2.666
1.687
7.563
5.018
0.846
12.615
3.872
2.200
6.423
2.157
6.147%
1.090
3.688
8.181
5.845
4.337
4.315
3.665
—
5.008
9.594
4.797
0.989
5.132
3.930
2.919
1.796
7.172
2.657
3.112
12.580
0.543
1.203
4.612
3.693
2.391
2.115
3.120
1.090
2.058
4.762
2.070
1.522
6.205
3.333
5.437
11.845
3.900
1.894
0.297
8.159
1.421
1.366
7.093
2.657
0.000
13.289
1.393
2.910
3.172
0.978
10.221%
4.961
14.232
10.311
16.067
10.408
7.328
13.155
—
9.303
19.277
5.785
6.095
13.314
14.128
12.204
5.394
21.305
11.747
5.616
37.771
1.674
8.065
16.486
13.450
9.097
8.226
18.197
3.078
5.934
13.855
12.035
5.541
17.275
5.432
14.024
21.454
11.121
9.727
2.262
19.287
4.232
4.204
15.961
11.990
1.350
26.392
5.770
10.934
6.113
6.719
2.923%
2.536
3.545
5.763
4.784
3.785
1.790
3.539
—
4.410
3.112
3.935
1.328
3.122
3.895
3.149
0.830
5.739
3.285
2.252
14.667
0.474
1.381
5.398
4.528
1.330
3.871
3.947
0.796
0.852
3.453
2.426
1.475
3.150
1.373
3.274
6.762
1.967
1.712
0.969
4.614
0.666
0.606
5.468
4.137
1.333
7.456
1.690
0.943
3.528
0.920
2.776%
2.544
3.431
7.279
4.259
4.963
2.309
3.630
—
1.964
4.080
2.942
2.024
4.152
4.098
3.853
0.960
6.959
1.562
1.106
6.960
0.718
1.863
6.678
2.900
1.452
2.249
4.811
0.860
1.077
3.493
2.814
2.433
4.261
1.720
4.713
7.419
3.453
2.394
1.237
5.074
0.916
0.676
4.354
4.589
0.467
5.174
1.446
1.598
3.686
2.009
6.675
5.225
13.051
4.184
3.564
White
7.091%
5.769
9.056
10.703
11.903
8.205
4.308
6.759
—
6.087
14.056
9.742
4.716
6.983
8.675
8.771
3.569
15.792
4.758
3.251
21.107
0.640
3.801
8.773
9.599
4.013
5.663
13.268
2.953
2.588
8.413
7.144
3.287
15.447
2.789
7.843
16.221
7.982
4.981
1.504
15.945
2.924
2.047
10.817
4.948
0.843
15.616
4.392
2.174
7.133
2.265
8.009
— Data not reported.
Source: U.S. Department of Education, Office for Civil Rights, 2006 Civil Rights Data Collection, projections. Calculations by Children’s Defense Fund.
State of America’s Children® 2011 H-23
Just over two-thirds of U.S. high school math teachers majored in math.
High School Teachers with Undergraduate Major
in Subject Matter Taught, 2007–2008
Teaching Field
Arts, music
Health, physical education
Natural sciences
Social sciences
English, language arts
Foreign languages
Vocational, technical
Math
Special Education
Percent with Undergraduate
Major in Field
90.3%
88.5
83.5
82.8
81.7
79.9
73.6
67.3
4.4
Source: U.S. Department of Education, National Center for Education Statistics, Digest of Education Statistics 2009 (April 2010), Table 70.
Demographics of Public School Teachers, Grades 9–12
Sex
Female
Male
58.0%
42.0
Race/ethnicity
White
Black
Hispanic
Asian, Pacific Islander
Two or more races
American Indian, Alaska Native
83.5
6.9
6.6
1.5
0.9
0.5
Source: U.S. Department of Education, National Center for Education Statistics, Digest of Education Statistics 2009 (April 2010), Table 70.
H-24
Children’s Defense Fund
Although the college graduation rates for Black and Hispanic young adults has increased
over the past 40 years, the rates are still far behind White graduation rates.
College Graduation Rates Among Young Adults,* 1957–2009
35
31.3%
Percent ages 25–29 who completed
4 years of college or more
30
White
25
20
19.0%
15
Black
12.2%
10
Hispanic
5
0
1957
1962
1967
1972
1977
1982
1987
1992
1997
2001
2005
2009
* People 25 to 29 years old.
Source: U.S. Department of Commerce, Bureau of the Census, Table A-2, Percent of People 25 Years Old and Over Who Have
Completed High School or College, by Race, Hispanic Origin and Sex: Selected Years 1940 to 2009, at <http://www.census.gov/
population /socdemo/ education/cps2009/tabA-2.xls>.
State of America’s Children® 2011 H-25
White men ages 25 to 29 are almost twice as likely as Black men and almost two-and-a-half times
more likely than Hispanic men to complete four or more years of college. White women are more
than one-and-a-half times as likely as Black woman and more than two-and-a-half times
as likely as Hispanic women to complete four or more years of college.
Percent of Young Adults* Who Completed Four or More Years of College
by Race/Ethnicity and Sex, 1957 to 2009
1957
1959
1962
1964
1965
1966
1967
1968
1969
1970
1971
1972
1973
1974
1975
1976
1977
1978
1979
1980
1981
1982
1983
1984
1985
1986
1987
1988
1989
1990
1991
1992
1993
1994
1995
1996
1997
1998
1999
2000
2001
2002
2003
2004
2005
2006
2007
2008
2009
All Races
(of any race)
Total Male Female
White
Total Male
10.4%
11.1
13.1
12.8
12.4
14.0
14.6
14.7
16.0
16.4
16.9
19.0
19.0
20.7
21.9
23.7
24.0
23.3
23.1
22.5
21.3
21.7
22.5
21.9
22.2
22.4
22.0
22.5
23.4
23.2
23.2
23.6
23.7
23.3
24.7
27.1
27.8
27.3
28.2
29.1
28.4
29.3
28.4
28.7
28.8
28.4
29.6
30.8
30.6
11.1%
11.9
14.3
13.6
13.0
14.7
15.5
15.6
17.0
17.3
17.9
19.9
19.9
22.0
22.8
24.6
25.3
24.5
24.3
23.7
22.4
22.7
23.4
23.1
23.2
23.5
23.0
23.5
24.4
24.2
24.6
25.0
24.7
24.2
26.0
28.1
28.9
28.4
29.3
29.6
28.5
29.7
28.3
28.9
28.9
28.3
29.8
31.1
31.3
13.5%
14.8
17.2
16.6
15.6
16.8
17.2
18.0
19.4
20.0
20.1
22.0
21.6
23.9
25.1
27.5
27.0
26.0
25.6
24.0
23.1
23.3
23.9
23.2
23.1
22.9
22.3
23.2
23.9
23.7
23.0
23.2
23.4
22.5
24.5
26.1
26.3
25.6
26.8
27.9
25.5
26.9
26.0
26.1
25.5
25.3
26.3
26.8
26.6
7.5%
7.6
9.2
9.2
9.5
11.3
12.1
11.6
12.8
12.9
13.8
16.0
16.4
17.6
18.7
20.1
21.1
20.6
20.5
21.0
19.6
20.2
21.1
20.7
21.3
21.9
21.7
21.9
22.9
22.8
23.4
24.0
23.9
24.0
24.9
28.2
29.3
29.0
29.5
30.1
31.3
31.8
30.9
31.4
32.2
31.6
33.0
34.9
34.8
14.5%
15.9
18.7
17.5
16.4
17.9
18.3
19.1
20.6
21.3
21.3
23.1
22.8
25.3
26.3
28.7
28.5
27.6
27.1
25.5
24.3
24.5
25.0
24.3
24.2
24.1
23.3
24.0
24.8
24.2
24.1
24.2
24.4
23.6
25.4
27.2
27.2
26.5
27.6
27.8
25.1
26.5
25.3
25.8
25.3
25.0
25.8
26.7
27.0
Female
Total
Black
Male Female
7.8%
8.1
10.0
9.9
9.8
11.8
12.7
12.3
13.4
13.3
14.6
16.7
17.0
18.8
19.4
20.6
22.1
21.4
21.5
22.0
20.5
20.9
21.8
21.9
22.2
22.9
22.8
22.9
24.0
24.3
25.0
25.7
25.1
24.8
26.6
29.1
30.7
30.4
30.9
31.3
32.1
33.1
31.5
32.1
32.7
31.7
34.0
35.9
36.0
4.1%
4.6
4.2
5.5
6.8
5.9
5.4
5.3
6.7
7.3
6.4
8.3
8.1
7.9
10.7
13.0
12.6
11.8
12.4
11.6
11.6
12.6
12.9
11.6
11.5
11.8
11.4
12.2
12.7
13.4
11.0
11.3
13.2
13.7
15.3
14.6
14.4
15.8
15.0
17.5
16.8
17.5
17.2
16.9
17.4
18.6
18.9
20.6
19.0
3.3%
5.6
5.7
7.5
7.3
5.4
4.2
5.3
8.1
6.7
6.4
7.1
7.1
8.8
11.4
12.0
12.8
10.7
13.3
10.5
12.1
11.8
13.1
12.9
10.3
10.1
11.6
12.6
12.0
15.1
11.5
12.0
12.6
11.7
17.2
12.4
12.1
14.2
13.1
18.1
15.6
17.4
17.5
13.4
14.1
14.9
17.9
18.7
15.2
5.0%
3.7
3.0
3.9
6.8
6.4
6.3
5.3
5.5
8.0
6.5
9.4
8.8
7.2
10.1
13.6
12.4
12.6
11.7
12.5
11.1
13.2
12.8
10.5
12.6
13.3
11.1
11.9
13.3
11.9
10.6
10.6
13.8
15.4
13.6
16.4
16.4
17.0
16.5
17.0
17.9
17.7
17.0
19.7
20.1
21.6
19.9
22.3
22.4
Total
n/a
n/a
n/a
n/a
n/a
n/a
n/a
n/a
n/a
n/a
n/a
n/a
n/a
5.7%
8.8
7.4
6.7
9.6
7.3
7.7
7.5
9.7
10.4
10.6
11.1
9.0
8.7
11.4
10.1
8.1
9.2
9.5
8.3
8.0
8.9
10.0
11.0
10.4
8.9
9.7
10.5
8.9
10.0
10.9
11.2
9.5
11.6
12.4
12.2
Hispanic
Male Female
n/a
n/a
n/a
n/a
n/a
n/a
n/a
n/a
n/a
n/a
n/a
n/a
n/a
7.2%
10.0
10.3
7.2
9.6
7.9
8.4
8.6
10.7
9.6
9.6
10.9
8.9
9.2
12.1
9.6
7.3
8.1
8.8
7.1
6.6
7.8
10.2
9.6
9.5
7.5
8.3
8.2
8.3
8.4
9.6
10.2
6.9
8.6
10.0
11.0
n/a
n/a
n/a
n/a
n/a
n/a
n/a
n/a
n/a
n/a
n/a
n/a
n/a
4.6%
7.3
4.8
6.4
9.7
6.8
6.9
6.5
8.7
11.1
11.6
11.2
9.1
8.2
10.6
10.6
9.1
10.4
10.3
9.8
9.8
10.1
9.8
10.1
11.3
10.4
11.0
13.3
9.7
12.0
12.4
12.4
12.8
15.4
15.5
13.8
* People 25 to 29 years old
Source: U.S. Department of Commerce, Bureau of the Census, Table A-2, Percent of People 25 Years Old and Over Who Have Completed High School or College,
by Race, Hispanic Origin and Sex: Selected Years 1940 to 2009, at <http://www.census.gov/population/socdemo/ education/cps2009/tabA-2.xls>.
H-26
Children’s Defense Fund
Child Welfare
C
hild abuse and neglect and the mental health, substance abuse and other problems often associated
with it, can push children into the cradle to prison pipeline. Prevention services and treatment to
help children exposed to trauma heal are often lacking. Parents don’t get the mental health and substance
abuse treatment they need. Children in foster care frequently move from home to home, disrupting any
sense of stability and their education. Some move from foster care to the juvenile justice system.
• A child is abused or neglected every 42 seconds; almost 80 percent of them are victims
of neglect. Infants are the most likely to suffer from maltreatment. Forty percent of
child victims receive no post-investigation services and many more receive far fewer
services than they need. Nearly 40 percent are served at home and 20.8 percent are
placed in foster care.
• 1,161 children enter foster care each day and remain there on average more than two
years. Every two minutes a child enters foster care.
• About two-thirds of the children who exit from foster care in a year exit to a family
member. An estimated 115,000 children in foster care are waiting to be adopted.
• While the number of children and Black children in foster care is declining, Black
children are still overrepresented. Thirty percent of the children in foster care are
Black, double the percent of the child population who are Black.
• Foster care often promotes instability. In every state but one, more than half the children
in care for two or more years experience at least three placements.
• More than 29,000 youth aged out of foster care at 18 or older in 2009; in most states
more than 60 percent of these youth entered foster care when they older were than 12.
I-2
Children’s Defense Fund
Who Are the Children Who Are Abused and Neglected?
• Infants and toddlers are the most likely to be victims of abuse and neglect. One-third of all victims
are three or younger.
• Of all maltreated victims 78.6 percent are victims of neglect; 2.4 percent of medical neglect;
17.8 percent of physical abuse; 9.6 percent of sexual abuse; 7.1 percent of psychological abuse,
and 9.8 percent are victims of other or unknown types of maltreatment.
• Nearly half of all abused and neglected children are White; more than one-fifth are African
American; and one-fifth are Hispanic.
• Boys and girls are almost equally likely to be victims of abuse or neglect, with girls just slightly
more likely.
• More than half of the child victims are reported to child protection agencies by teachers, police
officers and other social services or medical professionals.
• Forty percent of child victims receive no services after the investigation.
• Three-quarters of child victims have no history of prior victimization.
• Approximately one in five child victims in 2009 was maltreated by someone other than
his/her parents.
Sources: U.S. Department of Health and Human Services, Administration on Children, Youth, and Families, Child Maltreatment: 2009
(December 2010). Calculations by Children’s Defense Fund.
State of America’s Children® 2011
I-3
A child is abused or neglected every 42 seconds; almost eight out of ten are victims of neglect.
Children three or younger are the most likely victims of maltreatment.
Child Maltreatment, 2009*
Type of maltreatment** (percent distribution)
Victims of
maltreatment
Number
Rate*** Neglect
Alabama
Alaska
Arizona
Arkansas
California
Colorado
Connecticut
Delaware
District of Columbia
Florida
Georgia
Hawaii
Idaho
Illinois
Indiana
Iowa
Kansas
Kentucky
Louisiana
Maine
Maryland
Massachusetts
Michigan
Minnesota
Mississippi
Missouri
Montana
Nebraska
Nevada
New Hampshire
New Jersey
New Mexico
New York
North Carolina
North Dakota
Ohio
Oklahoma
Oregon
Pennsylvania
Rhode Island
South Carolina
South Dakota
Tennessee
Texas
Utah
Vermont
Virginia
Washington
West Virginia
Wisconsin
Wyoming
United States
8,123
3,544
3,803
9,926
73,962
11,341
9,090
2,015
3,279
45,841
23,249
2,007
1,571
27,446
22,330
11,636
1,329
16,187
9,063
3,809
15,310
34,639
29,976
4,668
7,369
5,226
1,521
4,871
4,443
924
8,725
4,915
77,620
22,371
n/r
31,270
7,157
n/r
3,913
2,804
12,381
1,443
8,822
66,359
12,704
696
5,951
6,070
4,978
4,654
707
7.2
19.3
2.2
14.0
7.8
9.2
11.3
9.7
28.8
11.3
9.0
6.9
3.7
8.6
14.0
16.3
1.9
16.0
8.1
14.0
11.3
24.2
12.8
3.7
9.6
3.7
6.9
10.8
6.5
3.2
4.3
9.6
17.5
9.8
n/r
11.5
7.8
n/r
1.4
12.4
11.5
7.2
5.9
9.6
14.6
5.5
3.2
3.9
12.9
3.6
5.4
37.3%
89.3
72.0
65.7
82.9
78.4
97.0
42.5
67.5
52.7
69.1
15.4
74.9
74.0
87.5
92.2
17.5
95.3
82.8
75.3
72.7
103.6
90.1
75.2
65.2
53.5
84.1
97.4
75.8
80.4
79.1
83.4
107.0
87.4
n/r
47.7
89.0
n/r
3.9
93.1
72.4
93.6
59.0
81.8
21.0
4.0
63.1
82.7
56.2
55.4
70.7
682,038
9.6
78.6
Medical
neglect
Other,
unknown,
or missing
Physical
abuse
Sexual
abuse
Psychological
maltreatment
—
1.9%
—
7.8
—
1.6
3.9
1.1
4.1
2.3
4.7
1.7
1.1
2.3
2.2
1.1
3.2
—
—
—
—
—
2.9
1.4
4.2
2.8
1.6
0.0
1.8
3.2
2.4
2.6
6.2
1.9
n/r
1.5
2.5
n/r
2.9
1.4
3.8
—
2.9
3.3
0.3
2.0
2.7
—
1.2
1.5
1.3
48.7%
12.7
25.8
19.2
11.5
15.1
6.9
18.0
15.7
10.5
13.2
9.6
20.8
22.5
12.1
13.2
22.0
10.0
28.0
17.5
25.7
13.8
23.6
20.5
19.0
33.1
13.7
11.8
29.6
12.0
18.7
14.9
11.4
10.7
n/r
37.5
19.0
n/r
34.0
14.5
34.3
12.5
15.3
21.4
13.1
52.3
27.9
24.7
30.4
22.2
8.1
23.1%
2.9
9.1
23.4
7.4
9.9
4.5
7.7
3.2
4.7
5.0
3.8
5.9
16.3
17.7
5.0
35.4
4.5
7.8
7.1
12.4
2.8
4.2
16.9
14.7
28.5
6.2
8.1
8.3
16.1
10.3
4.9
3.6
8.2
n/r
19.4
7.8
n/r
64.2
4.3
6.5
4.9
31.2
9.5
17.8
52.9
15.8
7.4
4.9
29.9
12.6
0.4%
20.3
0.6
1.2
17.5
4.6
4.6
32.9
1.2
1.4
20.8
0.5
0.1
0.1
0.8
0.7
10.5
0.4
0.9
46.1
0.4
0.2
28.1
0.8
11.0
5.4
22.8
0.5
3.1
1.8
0.2
18.2
1.0
0.3
n/r
6.5
20.0
n/r
1.1
0.1
1.0
3.1
2.4
1.0
51.5
1.4
1.2
—
32.4
1.2
13.0
—
—
—
0.0%
0.1
0.7
—
9.0
30.0
56.2
—
94.9
8.6
—
—
5.6
23.0
—
0.4
—
—
0.0
32.2
—
0.4
—
0.3
—
—
—
—
—
30.0
0.8
n/r
2.4
17.8
9.6
7.1
9.8
0.0
n/r
—
1.7
0.3
—
—
0.0
22.0
—
—
—
12.1
—
3.8
* The methodology for this analysis was modified by using unique counts of children, rather than duplicate counts. Unique counts identify and count a child once,
regardless of the number of reports that received a CPS response, and the duplicate counts identify a child each time that he or she was a subject of a report
that received a CPS response.
** May add to more than 100 percent in a state because some children experience more than one type of maltreatment.
*** Number of victims per 1,000 children.
Note: Because of differences in definitions of child abuse and neglect, comparisons of data between states should not be made.
— category not reported by state.
n/r — no data reported by state.
Source: U.S. Department of Health and Human Services, Administration for Children and Families, Administration on Children, Youth, and Families, Children’s Bureau,
Child Maltreatment 2009 (December 2010), Table 3–13 “Reported Maltreatment Types of Victims, 2009” (unique counts). Available at
http://www.acf.hhs.gov/programs/cb/pubs/cm09/cm09.pdf#page=31, page 46. Calculations by Children’s Defense Fund.
I-4
Children’s Defense Fund
Consistent with recent years, about 40 percent of children abused or neglected in 2009
received no services following the investigation of their maltreatment.
National Estimates of Children Served
Following an Investigation of Child Abuse or Neglect
All child
victims
Year
2002
2003
2004
2005
2006
2007
2008
2009
910,000
905,000
892,000
900,000
905,000
794,000
772,000
763,000
Served
Number
Percent
535,000
525,000
528,000
542,000
533,000
497,000
489,000
457,000
58.8%
58.0
59.2
60.2
58.9
62.6
63.3
59.9
Served
in home
Number Percent
363,000
358,000
359,000
346,000
338,000
333,000
331,000
298,000
39.9%
39.6
40.2
38.4
37.4
41.9
42.9
39.1
Removed to
foster care
Number Percent
172,000
167,000
170,000
196,000
195,000
164,000
161,000
159,000
18.9%
18.5
19.0
21.8
21.5
20.7
20.9
20.8
Not served
Number Percent
375,000
380,000
364,000
358,000
372,000
297,000
283,000
306,000
41.2%
42.0
40.8
39.8
41.1
37.4
36.7
40.1
Source: U.S. Congress, Library of Congress, Congressional Research Service, “The Child Abuse Prevention and Treatment Act (CAPTA): Background,
Programs, and Funding” (November 4, 2009), Table D-1;and U.S. Department of Health and Human Services, Administration for Children and
Families, Administration on Children, Youth, and Families, Children’s Bureau, Child Maltreatment 2009 (April 2010), pp. x. Calculations by Children’s
Defense Fund.
The number of children in foster care has decreased 20 percent since 2005 and exits
from care have exceeded entries from care for the past three years.
Trends in Foster Care and Adoption, FYs 2002–2009
Year
In care on
September 30
Entries
Exits
Waiting to
be adopted
2002
2003
2004
2005
2006
2007
2008
2009
523,000
510,000
508,000
511,000
505,000
489,000
460,000
424,000
295,000
289,000
298,000
307,000
305,000
293,000
274,000
255,000
278,000
278,000
281,000
287,000
295,000
295,000
288,000
276,000
134,000
131,000
130,000
131,000
135,000
134,000
127,000
115,000
Adopted
51,000
50,000
51,000
52,000
51,000
53,000
55,000
57,000
Source: U.S. Department of Health and Human Services, Administration for Children and Families, Children’s Bureau, AFCARS Data,
“Trends in Foster Care and Adoption – FY2002-FY2009,” at http://www.acf.hhs.gov/programs/cb/stats_research/afcars/trends02-09.pdf.
State of America’s Children® 2011
I-5
Domestic Minor Sex Trafficking
Domestic minor sex trafficking is the commercial sexual exploitation of children under age 18 within U.S.
borders. It includes child sex slavery, prostitution of children, commercial sexual exploitation of children, and
rape of children. An estimated 100,000 youth are victimized through prostitution in America each year. Too
often the child victims, rather than the perpetrators, are the ones reported, arrested and prosecuted.
• In 2008, 643 female and 206 male children were reported to the FBI as having been
•
•
•
•
•
•
•
arrested for prostitution and commercialized vice.1
Since 2003, the Innocence Lost Initiative2 has recovered over 1,600 child victims of sex
trafficking. 3
Children as young as seven have been forced into sex trafficking due to fears about sexually transmitted disease among customers.4
A 2001 report by the University of Pennsylvania estimated that about 293,000 American
youth are at risk of commercial sexual exploitation.5 Most of these children have run
away from home or been abandoned by their parents, and turn to the sex trade as a means of
survival.
Fifty-five percent of girls who have been away or been forced to live on the street are
engaged in formal prostitution, 75 percent of which was controlled by a pimp.6
About 20 percent of children involved in the sex trade are trafficked nationally by
organized crime syndicates. These children are often required to pay the costs of their
transportation, shelter, and false identity papers.7
The majority of trafficked children both use and sell illegal drugs.8
The risk of a child 10-17 being sexually exploited for commercial purposes is higher
than the risk that she or he will die in an accident or be raped or sexually assaulted.9
1 “Trafficking in Persons Report, 10th Edition.” (2010). Washington, DC: U.S. State Department.
http://www.state.gov/documents/organization/142979.pdf
2 The Innocence Lost Initiative is a coalition of federal and state law enforcement authorities and victim assistance providers
focused on eliminating child prostitution.
3 “Innocence Lost.” (2011). Washington, DC: Federal Bureau of Investigation.
http://www.fbi.gov/about-us/investigate/vc_majorthefts/cac/innocencelost
4 Miko, Francis T. (2006). “Trafficking in Persons: The U.S. and International Response.“ Washington, DC: Congressional Research Service.
http://www.usembassy.it/pdf/other/RL30545.pdf
5 Richard J. Estes and Neil Alan Weiner. (2002). “Commercial Sexual Exploitation of Children in the U.S, Canada and Mexico:
Executive Summary of the U.S. National Study.” Philadelphia, PA: University of Pennsylvania.
http://www.sp2.upenn.edu/restes/CSEC_Files/Exec_Sum_020220.pdf
6 Ibid.
7 Ibid.
8 Ibid.
9 Ibid.
I-6
Children’s Defense Fund
Black children are only 15 percent of the child population but 30 percent of
children in foster care. About two-thirds of the children who leave foster care exit to
a family member; 20 percent are adopted.
Who is in Foster Care?
Number of Children in Foster Care: 423,773
Percent in foster care
2009
Percent in
U.S. child population
2009
Race and ethnicity
White, non-Hispanic
Black
Hispanic
American Indian,
Alaska Native
Asian
Two or more races
40%
30
20
55%
15
23
2
1
5
1
4
3
Age
Under age 1
1-5 years
6-10 years
11-15 years
16-18 years
19 + years
6
30
20
24
20
2
Type of placement
Non-relative foster home
Relative foster home
Institution
Group home
Pre-adoptive home
Trial home visit
Runaway
Supervised independent living
48
24
10
6
4
5
2
1
Exit from foster care during year
Reunification
Adoption
Emancipation
Living with relative
Guardianship
Transfer to another agency
Runaway
51
20
11
8
7
2
1
Note: Race/ethnicity, age, and placement are estimates of children in foster care on September 30, 2009; exit data reflect
outcomes for children exiting foster care during FY 2009.
Source: U.S. Department of Health and Human Services, Administration for Children and Families, Children’s Bureau,
“The AFCARS Report: Preliminary FY 2009 Estimates as of July 2010,” at <http://www.acf.hhs.gov/programs/cb/
stats_research/afcars/tar/report17.htm>. Calculations by Children’s Defense Fund.
State of America’s Children® 2011
I-7
The number of children in foster care has declined each year since 2005. More than half of
the children in foster care live in just nine states.*
Children in Foster Care, FYs 2004–2009
Number in foster care on September 30 of each year
Alabama
Alaska
Arizona
Arkansas
California*
Colorado
Connecticut
Delaware
District of Columbia
Florida*
Georgia
Hawaii
Idaho
Illinois*
Indiana*
Iowa
Kansas
Kentucky
Louisiana
Maine
Maryland
Massachusetts
Michigan*
Minnesota
Mississippi
Missouri
Montana
Nebraska
Nevada
New Hampshire
New Jersey
New Mexico
New York*
North Carolina
North Dakota
Ohio*
Oklahoma
Oregon
Pennsylvania*
Rhode Island
South Carolina
South Dakota
Tennessee
Texas*
Utah
Vermont
Virginia
Washington
West Virginia
Wisconsin
Wyoming
United States
FY 2004
FY 2005
FY 2006
FY 2007
FY 2008
FY 2009
5,934
1,825
9,194
3,124
82,641
8,196
6,459
849
2,641
28,864
14,216
2,939
1,565
19,931
9,778
5,384
6,060
6,998
4,397
2,589
11,111
12,562
21,173
6,540
2,989
11,778
2,030
6,292
4,037
1,236
12,282
2,157
33,445
10,077
1,314
18,004
11,821
10,048
21,944
2,414
4,635
1,582
9,590
24,529
2,108
1,432
6,869
9,368
3,990
7,812
1,184
6,913
1,660
9,685
3,238
80,247
8,213
6,249
962
2,519
29,312
13,965
2,743
1,818
19,419
11,243
6,794
5,833
7,220
4,833
2,339
10,867
12,197
20,498
6,989
3,269
11,433
2,222
6,231
4,656
1,178
11,205
2,316
30,458
10,698
1,370
17,446
11,334
11,020
21,691
2,509
4,757
1,704
9,017
28,883
2,285
1,436
7,022
10,068
4,629
8,076
1,244
7,157
1,919
9,767
3,434
76,405
8,139
6,359
1,074
2,378
29,229
13,175
2,357
1,850
18,815
11,401
8,922
6,237
7,695
5,213
2,076
9,051
11,499
20,142
6,813
3,126
10,207
1,909
6,187
5,068
1,148
10,740
2,357
29,973
11,115
1,331
15,741
11,736
10,661
21,135
2,998
4,920
1,648
8,618
30,848
2,427
1,379
7,672
10,457
4,018
7,459
1,304
7,262
2,107
9,569
3,616
73,998
7,777
5,764
1,157
2,197
26,788
12,197
1,940
1,870
17,864
11,372
8,005
6,631
7,207
5,333
1,971
8,415
10,497
20,830
6,711
3,328
10,233
1,737
5,875
5,070
1,102
9,056
2,423
30,072
10,827
1,263
14,532
11,785
9,562
20,999
2,768
5,147
1,566
7,751
30,137
2,765
1,309
7,718
11,107
4,432
7,541
1,231
6,876
2,168
10,425
3,522
67,703
7,921
5,373
938
2,217
22,187
9,984
1,622
1,723
17,843
12,386
6,743
6,306
7,182
5,065
1,864
7,613
10,427
20,171
6,028
3,292
10,128
1,600
5,591
5,023
1,029
8,510
2,221
29,493
9,841
1,222
13,703
10,595
8,988
19,218
2,407
4,999
1,482
7,219
28,154
2,714
1,200
7,099
11,247
4,412
7,403
1,154
6,894
2,166
10,175
3,657
60,198
7,927
4,761
814
2,111
19,156
8,020
1,455
1,446
17,080
12,437
6,564
5,691
6,872
4,786
1,646
7,052
9,650
17,723
5,410
3,320
9,912
1,639
5,343
4,779
930
7,809
2,009
27,992
9,547
1,224
12,197
8,712
8,650
16,878
2,112
4,938
1,484
6,723
26,686
2,759
1,062
5,927
9,922
4,237
6,785
1,155
499,937
503,913
497,289
482,414
454,231
418,422
Source: U.S. Department of Health and Human Services, Administration for Children and Families, “Foster Care FY2002 - FY2009 Entries, Exits, and
Numbers of Children In Care on the Last Day of Each Federal Fiscal Year,” at http://www.acf.hhs.gov/programs/cb/stats_research/
afcars/statistics/entryexit2009.pdf. Calculations by Children’s Defense Fund.
* States where more than half of children in foster care live.
I-8
Children’s Defense Fund
In 2009 more children nationally and in 34 states exited from foster care than entered care.
Number of Children Entering, Exiting and In Foster Care, FY 2009
Number of children:
Entering foster care
during the year
Alabama
Alaska
Arizona
Arkansas
California
Colorado
Connecticut
Delaware
District of Columbia
Florida
Georgia
Hawaii
Idaho
Illinois
Indiana
Iowa
Kansas
Kentucky
Louisiana
Maine
Maryland
Massachusetts
Michigan
Minnesota
Mississippi
Missouri
Montana
Nebraska
Nevada
New Hampshire
New Jersey
New Mexico
New York
North Carolina
North Dakota
Ohio
Oklahoma
Oregon
Pennsylvania
Rhode Island
South Carolina
South Dakota
Tennessee
Texas
Utah
Vermont
Virginia
Washington
West Virginia
Wisconsin
Wyoming
United States
Exiting foster care
during the year
In foster care
on September 30, 2009
3,124
927
7,588
4,161
34,826
6,353
2,466
445
624
14,313
5,857
1,332
1,215
5,176
9,464
4,728
3,163
5,387
3,631
753
2,772
6,171
7,863
5,999
2,107
5,636
976
3,563
2,905
505
4,800
1,991
12,876
4,971
940
8,741
4,734
4,601
11,226
1,447
3,719
1,448
5,952
12,769
2,060
550
2,582
6,092
3,000
4,560
1,139
2,885
915
7,232
3,917
39,226
6,204
2,972
555
703
16,400
7,770
1,447
1,452
5,876
8,448
4,687
3,615
5,434
3,683
959
3,265
6,673
10,182
6,283
2,064
4,834
939
3,619
3,092
558
5,418
2,164
13,658
4,968
877
10,074
6,580
4,743
12,507
1,604
3,698
1,381
6,214
14,160
1,966
647
3,360
5,849
3,039
4,923
1,079
6,894
2,166
10,175
3,657
60,198
7,927
4,761
814
2,111
19,156
8,020
1,455
1,446
17,080
12,437
6,564
5,691
6,872
4,786
1,646
7,052
9,650
17,723
5,410
3,320
9,912
1,639
5,343
4,779
930
7,809
2,009
27,992
9,547
1,224
12,197
8,712
8,650
16,878
2,112
4,938
1,484
6,723
26,686
2,759
1,062
5,927
9,922
4,237
6,785
1,155
254,228
274,798
418,422
Source: U.S. Department of Health and Human Services, Administration for Children and Families, Children’s Burearu, “Foster Care FY 2002 FY 2009 Entries, Exits, and Numbers of Children In Care on the Last Day of Each Federal Fiscal Year,” at
http://www.acf.hhs.gov/programs/cb/stats_research/afcars/statistics/entryexit2009.htm.
State of America’s Children® 2011
I-9
One-third of the children in foster care are five or younger; one-third are 14 or older.
Children who enter care at younger ages stay longer.
Children in Foster Care,* by Age, FY 2009
Number of
children
in foster care
Alabama
Alaska
Arizona
Arkansas
California
Colorado
Connecticut
Delaware
District of Columbia
Florida
Georgia
Hawaii
Idaho
Illinois
Indiana
Iowa
Kansas
Kentucky
Louisiana
Maine
Maryland
Massachusetts
Michigan
Minnesota
Mississippi
Missouri
Montana
Nebraska
Nevada
New Hampshire
New Jersey
New Mexico
New York
North Carolina
North Dakota
Ohio
Oklahoma
Oregon
Pennsylvania
Rhode Island
South Carolina
South Dakota
Tennessee
Texas
Utah
Vermont
Virginia
Washington
West Virginia
Wisconsin
Wyoming
6,894
2,166
10,175
3,657
60,198
7,927
4,761
814
2,111
19,156
8,020
1,455
1,446
17,080
12,437
6,564
5,691
6,872
4,786
1,646
7,052
9,650
17,723
5,410
3,320
9,912
1,639
5,343
4,779
930
7,809
2,009
27,992
9,547
1,224
12,197
8,712
8,650
16,878
2,112
4,938
1,484
6,723
26,686
2,759
1,062
5,927
9,922
4,237
6,785
1,155
Percent distribution by age
Under 1
4.9%
5.6
7.1
7.7
5.1
4.8
5.4
6.1
2.2
8.0
6.9
7.0
6.1
4.3
6.3
5.1
4.8
5.6
6.8
6.6
4.3
5.0
5.6
5.3
6.0
5.3
4.9
3.7
6.5
3.8
8.7
5.4
3.8
5.8
4.9
6.5
6.9
5.4
5.0
5.8
6.5
6.0
4.5
6.8
5.1
3.8
3.4
6.7
4.9
5.4
2.8
1–2
3–5
6–9
12.5%
15.5
16.7
17.1
12.1
10.2
11.7
11.1
8.9
18.5
16.0
14.9
17.2
14.2
16.9
13.7
12.8
12.9
17.8
18.0
11.5
12.1
13.3
10.9
15.2
12.7
16.9
11.2
18.9
12.5
18.6
16.9
10.9
14.9
10.4
14.8
19.1
14.9
13.2
10.2
14.5
16.1
11.3
17.4
10.8
8.6
10.3
17.8
13.7
13.5
10.7
14.5%
18.6
17.2
16.6
13.8
11.0
11.5
10.8
11.1
18.9
15.8
18.3
18.3
17.1
18.4
13.8
15.5
13.9
19.1
18.3
13.0
12.5
16.1
11.4
16.4
14.4
19.0
13.5
20.7
14.5
16.8
20.6
13.7
16.8
13.4
13.8
21.3
17.9
13.6
10.1
16.0
19.7
12.3
18.5
10.7
10.1
11.9
18.0
15.0
16.6
14.5
14.9%
21.7
17.3
17.6
15.0
11.7
12.0
15.5
12.3
16.9
16.7
17.8
19.5
16.3
18.0
13.5
17.6
14.5
18.6
16.3
14.6
14.5
15.9
12.7
16.7
15.4
19.4
14.1
20.0
15.6
15.2
23.2
15.0
17.1
13.5
14.2
21.0
17.9
13.7
11.4
16.7
18.9
12.3
19.3
12.7
11.2
14.9
18.7
15.5
15.9
13.7
10–13
14–17
18–20+
15.9%
17.0
14.2
15.6
16.6
13.1
15.4
16.6
13.7
14.7
16.0
16.2
15.4
13.2
15.2
13.9
16.4
15.1
15.0
14.7
18.2
16.6
13.9
16.4
15.3
14.9
15.6
13.2
15.2
17.2
14.5
16.8
14.1
16.2
16.7
14.3
15.6
17.0
13.5
13.8
17.8
16.9
13.2
16.8
15.8
14.8
16.4
16.1
15.2
14.9
15.2
25.7%
16.4
21.7
25.6
32.1
34.8
41.9
37.0
26.8
22.9
28.5
25.7
23.6
18.9
22.0
37.4
32.0
37.0
22.8
25.0
35.4
39.1
28.9
41.6
25.1
27.2
22.4
36.5
18.2
29.5
23.2
17.0
28.9
25.5
38.6
30.3
16.1
21.2
32.7
40.1
28.0
21.2
43.5
21.1
37.0
46.6
40.2
19.4
34.3
31.1
37.7
11.3%
4.3
6.0
0.0
5.4
14.1
1.8
2.7
24.8
0.0
0.2
0.1
0.0
13.5
3.2
2.6
0.6
0.8
0.1
0.9
3.0
0.1
6.3
1.5
5.3
10.1
1.7
7.7
0.4
6.4
3.1
0.0
13.2
3.8
2.4
5.9
0.0
5.8
8.3
8.7
0.4
1.1
2.6
0.0
8.0
5.0
2.8
3.3
1.2
2.4
5.3
* In foster care on September 30, 2009.
Source: U.S. Department of Health and Human Services, Administration for Children and Families, Children’s Bureau, Child Welfare Outcomes Report Data,
“Age of Children in Foster Care: In Foster Care on 9/30,” at http://cwoutcomes.acf.hhs.gov/data/. Calculations by Children’s Defense Fund.
I-10
Children’s Defense Fund
Children in foster care are disproportionately Black. Black children account for 45 percent or more
of the children in foster care in about a quarter of the states and the District of Columbia.
Children in Foster Care, by Race/Ethnicity, FY 2009
Alabama
Alaska
Arizona
Arkansas
California
Colorado
Connecticut
Delaware
District of Columbia
Florida
Georgia
Hawaii
Idaho
Illinois
Indiana
Iowa
Kansas
Kentucky
Louisiana
Maine
Maryland
Massachusetts
Michigan
Minnesota
Mississippi
Missouri
Montana
Nebraska
Nevada
New Hampshire
New Jersey
New Mexico
New York
North Carolina
North Dakota
Ohio
Oklahoma
Oregon
Pennsylvania
Rhode Island
South Carolina
South Dakota
Tennessee
Texas
Utah
Vermont
Virginia
Washington
West Virginia
Wisconsin
Wyoming
Number of
children
in foster care
White
6,894
2,166
10,175
3,657
60,198
7,927
4,761
814
2,111
19,156
8,020
1,455
1,446
17,080
12,437
6,564
5,691
6,872
4,786
1,646
7,052
9,650
17,723
5,410
3,320
9,912
1,639
5,343
4,779
930
7,809
2,009
27,992
9,547
1,224
12,197
8,712
8,650
16,878
2,112
4,938
1,484
6,723
26,686
2,759
1,062
5,927
9,922
4,237
6,785
1,155
46.6%
24.8
37.0
57.6
21.5
44.1
32.0
32.3
0.6
46.5
40.7
10.7
70.1
35.0
58.1
63.5
65.2
73.7
46.9
82.8
21.0
46.3
40.8
42.5
41.9
65.8
48.8
54.7
39.9
79.9
24.3
23.8
18.4
45.5
55.2
50.1
36.1
55.5
38.8
48.1
44.5
29.5
60.5
28.7
63.1
96.5
46.0
49.6
85.1
43.6
74.2
Black
43.1%
3.7
10.0
25.9
23.4
13.6
28.0
54.5
86.7
36.2
47.4
1.3
2.1
56.7
27.9
15.1
20.6
15.3
48.0
2.4
69.7
16.4
44.9
18.3
52.8
29.0
1.2
18.9
25.2
2.7
49.1
3.4
48.3
39.7
3.7
37.8
17.6
0.9
45.0
15.5
44.7
2.8
28.5
24.8
4.9
1.8
37.7
9.4
5.2
36.2
4.8
Percent distribution by race/ ethnicity
Native
American
Hawaiian,
Indian/
Other
Two
Alaska
Pacific or more
Hispanic
Native
Asian
Islander
races Unknown
3.9%
4.6
42.2
6.7
47.5
36.9
32.1
7.9
6.9
12.7
7.1
4.5
13.0
5.6
7.7
8.3
8.9
4.3
1.6
4.6
3.4
26.9
5.6
9.6
2.1
2.8
5.5
12.5
24.7
8.7
15.6
58.6
21.8
8.1
5.5
3.1
15.1
12.0
10.1
23.8
3.9
6.6
5.6
40.9
23.7
0.8
9.3
15.5
1.8
8.9
12.3
0.1%
55.5
3.7
0.1
0.7
0.7
0.1
0.2
0.0
0.3
0.1
0.1
7.7
0.1
0.1
2.0
1.0
0.1
0.3
1.1
0.1
0.2
0.8
15.4
0.1
0.3
35.5
7.6
1.0
0.3
0.1
9.7
0.2
1.2
25.1
0.1
8.7
1.3
0.2
0.9
0.1
52.8
0.2
0.2
3.8
0.0
0.0
10.9
0.0
4.0
1.8
0.1%
0.4
0.1
0.3
1.8
0.6
0.4
0.5
0.1
0.2
0.2
10.2
0.9
0.3
0.1
0.7
0.4
0.1
0.1
0.1
0.2
2.0
0.1
1.9
0.1
0.2
0.1
0.7
1.0
0.4
0.3
0.1
0.5
0.2
1.1
0.1
0.1
0.3
0.4
2.4
0.1
0.2
0.1
0.2
0.5
0.1
0.4
0.8
0.1
0.8
0.1
0.0%
1.4
0.3
0.1
0.3
0.2
0.1
0.0
0.0
0.1
0.0
20.6
0.1
0.0
0.1
0.4
0.1
0.1
0.1
0.0
0.1
0.1
0.1
0.1
0.1
0.1
0.1
0.1
0.8
0.0
0.1
0.1
0.0
0.2
0.2
0.1
0.1
0.3
0.0
0.0
0.1
0.1
0.1
0.1
0.6
0.0
0.0
0.4
0.1
0.1
0.0
3.9%
7.8
3.7
9.3
4.5
3.8
6.3
4.5
2.8
3.6
4.3
50.2
6.1
0.1
5.8
2.2
3.3
4.2
1.6
5.3
3.2
4.6
7.4
8.9
1.7
0.9
6.8
2.2
7.3
2.9
2.2
3.8
2.7
4.5
8.9
4.9
22.4
22.1
0.7
7.0
6.3
8.1
2.6
4.0
2.6
0.0
5.8
11.3
7.1
4.5
1.2
2.2%
0.5
2.9
0.2
0.3
0.2
1.1
0.0
0.0
0.3
0.3
2.0
0.0
2.2
0.3
7.4
0.3
2.2
1.6
3.6
1.8
3.6
0.3
3.2
1.2
0.9
2.1
3.4
0.1
5.0
8.3
0.3
8.1
0.6
0.1
1.6
0.0
7.7
4.8
2.2
0.4
0.0
2.4
1.2
0.8
0.6
0.8
1.4
0.4
0.9
5.6
* In Foster Care on September 30, 2009
Source: U.S. Department of Health and Human Services, Administration of Children and Families, Children’s Bureau, Child Welfare Outcomes Report Data,
2009 Race and Ethnicity of Children in Foster Care, available at http://cwoutcomes.acf.hhs.gov/data/. Calculations by Children’s Defense Fund.
State of America’s Children® 2011
I-11
In 21 states, the percent of Black children in foster care is more than
twice their proportion in the general child population.
Overrepresentation of Black Children in Foster Care, FY 2009
Black children as a percent of
Number of children
Total
Black
Alabama
Alaska
Arizona
Arkansas
California
Colorado
Connecticut
Delaware
District of Columbia
Florida
Georgia
Hawaii
Idaho
Illinois
Indiana
Iowa
Kansas
Kentucky
Louisiana
Maine
Maryland
Massachusetts
Michigan
Minnesota
Mississippi
Missouri
Montana
Nebraska
Nevada
New Hampshire
New Jersey
New Mexico
New York
North Carolina
North Dakota
Ohio
Oklahoma
Oregon
Pennsylvania
Rhode Island
South Carolina
South Dakota
Tennessee
Texas
Utah
Vermont
Virginia
Washington
West Virginia
Wisconsin
Wyoming
1,128,864
183,546
1,732,019
709,968
9,435,682
1,227,763
807,985
206,993
114,036
4,057,773
2,583,792
290,361
419,190
3,177,377
1,589,365
713,155
704,951
1,014,323
1,123,386
271,176
1,351,935
1,433,002
2,349,892
1,260,797
767,742
1,431,338
219,828
451,641
681,033
289,071
2,045,848
510,238
4,424,083
2,277,967
143,971
2,714,341
918,849
872,811
2,775,132
226,825
1,080,732
199,616
1,493,252
6,895,969
868,824
126,275
1,847,182
1,569,592
386,449
1,310,250
132,025
342,322
9,985
96,390
137,298
647,685
66,997
103,817
51,501
74,129
877,281
845,665
13,724
7,615
556,475
181,052
31,058
54,418
98,717
425,858
6,650
444,146
138,706
401,986
89,815
333,446
203,097
3,449
28,475
63,692
7,161
345,066
21,657
898,042
548,973
2,871
405,986
90,643
25,589
397,320
20,111
352,136
4,153
309,559
863,664
16,904
2,233
414,029
78,341
19,283
117,931
3,265
All children
30.3%
5.4
5.6
19.3
6.9
5.5
12.8
24.9
65.0
21.6
32.7
4.7
1.8
17.5
11.4
4.4
7.7
9.7
37.9
2.5
32.9
9.7
17.1
7.1
43.4
14.2
1.6
6.3
9.4
2.5
16.9
4.2
20.3
24.1
2.0
15.0
9.9
2.9
14.3
8.9
32.6
2.1
20.7
12.5
1.9
1.8
22.4
5.0
5.0
9.0
2.5
Children in
foster care
43.1%
3.7
10.0
25.9
23.4
13.6
28.0
54.5
86.7
36.2
47.4
1.3
2.1
56.7
27.9
15.1
20.6
15.3
48.0
2.4
69.7
16.4
44.9
18.3
52.8
29.0
1.2
18.9
25.2
2.7
49.1
3.4
48.3
39.7
3.7
37.8
17.6
0.9
45.0
15.5
44.7
2.8
28.5
24.8
4.9
1.8
37.7
9.4
5.2
36.2
4.8
Ratio of Black
children in
foster care to
Black children
in population
1.4
0.7
1.8
1.3
3.4
2.5
2.2
2.2
1.3
1.7
1.4
0.3
1.2
3.2
2.4
3.5
2.7
1.6
1.3
1.0
2.1
1.7
2.6
2.6
1.2
2.0
0.8
3.0
2.7
1.1
2.9
0.8
2.4
1.6
1.9
2.5
1.8
0.3
3.1
1.7
1.4
1.3
1.4
2.0
2.5
1.0
1.7
1.9
1.0
4.0
1.9
Source: U.S. Department of Commerce, Bureau of the Census, State by Age, Sex, Race, and Hispanic Origin, at http://www.census.gov/popest/datasets.html;
and U.S. Department of Health and Human Services, Administration of Children and Families, Children’s Bureau,
Child Welfare Outcomes Report Data, “2009 Race and Ethnicity of Children in Foster Care,” available at http://cwoutcomes.acf.hhs.gov/data/.
Calculations by Children’s Defense Fund.
I-12
Children’s Defense Fund
In the majority of states and the District of Columbia, at least one-third of children in foster care
between one and two years experience three or more placements.
Placement Stability, 2009
Number of Placements by Time in Care
Children with two or fewer placements:
In care less
In care at least
In care
than 12
12 but less
24 months
months
than 24 months
or longer
Alabama
Alaska
Arizona
Arkansas
California
Colorado
Connecticut
Delaware
District of Columbia
Florida
Georgia
Hawaii
Idaho
Illinois
Indiana
Iowa
Kansas
Kentucky
Louisiana
Maine
Maryland
Massachusetts
Michigan
Minnesota
Mississippi
Missouri
Montana
Nebraska
Nevada
New Hampshire
New Jersey
New Mexico
New York
North Carolina
North Dakota
Ohio
Oklahoma
Oregon
Pennsylvania
Rhode Island
South Carolina
South Dakota
Tennessee
Texas
Utah
Vermont
Virginia
Washington
West Virginia
Wisconsin
Wyoming
69.8%
82.6
87.0
74.8
82.8
83.3
86.7
82.1
78.0
84.9
74.3
87.1
88.2
83.0
89.1
88.0
78.5
86.6
78.9
86.0
84.6
74.0
85.8
86.8
78.2
91.0
87.1
84.2
82.9
86.0
87.4
88.5
89.1
92.8
85.2
74.0
73.7
87.4
87.0
88.4
77.6
87.1
79.8
82.5
77.2
72.2
86.1
86.7
86.7
86.7
82.9
49.8%
54.8
65.5
44.0
61.7
64.3
66.1
59.8
55.2
60.8
52.7
67.1
61.9
68.7
66.0
61.3
52.3
60.1
54.3
69.3
76.8
48.7
72.6
58.3
56.6
92.7
63.9
55.4
57.2
63.1
72.4
55.1
72.4
75.7
54.6
70.3
47.2
63.6
64.7
62.0
40.8
55.7
54.8
55.1
41.2
43.9
66.0
66.2
66.2
64.7
59.1
27.6%
23.9
29.2
16.8
33.8
33.8
30.8
28.1
21.5
30.5
27.2
40.5
35.3
35.6
36.7
26.6
28.8
29.6
28.3
26.1
32.1
23.3
46.5
28.2
26.4
91.0
34.9
26.0
26.3
42.9
45.7
25.3
43.9
44.6
38.6
37.3
25.3
33.4
43.4
34.7
17.8
19.0
35.8
22.2
17.0
18.5
36.4
45.2
36.2
40.7
38.5
Children with three or more placements:
In care less
In care at least
In care
than 12
12 but less
24 months
months
than 24 months
or longer
19.4%
17.4
11.8
24.4
16.9
11.1
13.3
17.7
20.7
14.7
23.7
10.2
11.8
17.0
10.9
12.0
21.0
13.4
20.3
13.3
9.3
25.9
14.2
13.2
17.7
9.0
12.9
15.8
16.3
13.1
12.6
11.5
10.2
7.2
14.8
10.0
25.4
12.6
13.0
11.6
22.4
12.9
19.7
17.5
21.4
27.8
13.5
12.7
13.3
13.3
13.7
45.8%
45.2
34.5
55.8
38.2
34.9
33.9
40.2
44.8
39.0
47.1
32.4
38.1
31.3
34.0
38.7
45.5
39.9
45.7
30.8
19.5
51.3
27.4
41.7
42.9
7.3
36.1
44.6
42.4
36.9
27.6
44.9
27.5
24.3
45.4
29.4
52.8
36.4
35.3
38.0
59.2
44.3
45.2
44.9
58.8
56.1
33.8
33.8
33.8
35.3
39.6
69.7%
76.1
70.8
83.1
66.1
65.9
66.1
71.9
78.0
69.3
72.7
59.5
64.7
64.4
63.3
73.4
69.8
70.4
71.7
73.9
66.9
76.7
53.5
71.8
73.6
9.0
65.1
74.0
73.6
57.1
54.3
74.7
56.1
55.4
61.4
62.6
74.6
66.6
56.6
65.3
82.2
81.0
64.2
77.8
83.0
81.5
63.5
54.7
63.8
59.3
61.5
* In care on September 30, 2009.
Source: U.S. Department of Health and Human Services, Administration for Children and Families, Children’s Bureau,” Child Welfare Outcomes Report Data,
Table 6.1 “Number of Placements by Time in Care,” at http://cwoutcomes.acf.hhs.gov/data/. Calculations by Children’s Defense Fund.
State of America’s Children® 2011
I-13
The median length of time a child spends in foster care before exiting is over a year;
more than half of the children exit through reunification with family.
Exits of Children from Foster Care, 2009
Number of
children who
exited foster care
Median length
of stay (months)
Adoption
Guardianship
Reunification
Other,
missing data
2,822
851
7,233
3,891
36,643
5,971
2,932
555
703
16,064
7,483
1,403
1,446
5,108
8,382
4,457
3,615
5,183
3,660
928
2,692
6,553
9,010
6,237
1,952
4,983
912
3,588
3,089
561
5,320
2,149
12,808
4,970
821
8,218
6,465
4,745
12,271
1,493
3,669
1,374
6,218
13,942
1,962
644
3,304
5,504
2,928
4,772
1,030
13.3
23.0
11.0
3.3
14.8
8.4
17.3
16.9
26.6
12.4
13.6
8.7
11.3
33.0
9.7
14.4
16.9
9.4
11.7
20.5
27.4
11.6
20.9
5.3
12.7
14.2
12.3
14.7
12.3
14.9
13.8
6.4
15.2
17.2
9.5
11.1
18.7
16.6
12.7
12.8
7.2
5.5
10.4
17.6
11.0
18.5
18.9
13.9
11.8
11.2
8.1
8.0%
37.1
22.9
15.1
19.4
15.9
22.3
22.5
15.2
21.7
17.4
19.1
23.3
27.6
17.7
20.1
22.8
15.6
15.8
33.2
24.1
11.9
22.6
10.5
14.8
20.2
20.2
15.0
17.2
25.8
26.1
23.1
18.1
29.2
11.1
16.0
23.1
23.2
18.2
18.7
14.3
12.1
16.1
35.2
24.2
23.8
20.0
30.9
17.9
14.5
6.6
0.0%
3.8
9.1
3.3
6.6
4.8
8.9
14.4
12.2
24.0
7.6
8.0
6.1
10.0
8.5
6.8
7.1
0.2
0.9
8.3
6.4
7.2
4.1
8.6
4.7
11.1
5.0
8.0
3.9
2.1
5.5
1.5
0.0
12.4
0.0
9.4
7.6
6.1
8.4
5.5
0.9
5.4
2.3
2.3
8.8
2.8
0.0
25.0
5.2
5.0
4.8
69.6%
49.0
52.6
73.6
56.1
64.1
46.7
43.4
46.5
45.0
63.2
59.2
61.2
40.0
65.2
62.5
54.0
66.8
73.9
40.2
35.0
63.8
52.3
66.7
74.6
62.3
63.6
65.0
67.8
51.3
58.9
68.2
66.0
46.7
66.5
59.6
59.3
59.0
58.4
60.3
74.0
60.7
70.2
50.2
51.9
57.0
44.9
37.2
71.6
67.8
82.4
22.4%
10.1
15.4
8.0
17.9
15.2
22.1
19.6
26.0
9.3
11.8
13.7
9.4
22.4
8.7
10.7
16.0
17.4
9.4
18.3
34.5
17.1
21.1
14.1
5.9
6.5
11.1
12.0
11.1
20.7
9.6
7.3
15.9
11.7
22.4
15.0
10.0
11.7
15.0
15.5
10.8
21.8
11.4
12.2
15.2
16.4
35.1
6.8
5.4
12.6
6.2
276,266
13.7
20
51
22
Alabama
Alaska
Arizona
Arkansas
California
Colorado
Connecticut
Delaware
District of Columbia
Florida
Georgia
Hawaii
Idaho
Illinois
Indiana
Iowa
Kansas
Kentucky
Louisiana
Maine
Maryland
Massachusetts
Michigan
Minnesota
Mississippi
Missouri
Montana
Nebraska
Nevada
New Hampshire
New Jersey
New Mexico
New York
North Carolina
North Dakota
Ohio
Oklahoma
Oregon
Pennsylvania
Rhode Island
South Carolina
South Dakota
Tennessee
Texas
Utah
Vermont
Virginia
Washington
West Virginia
Wisconsin
Wyoming
United States
Percent distribution by type of exit
7
Source: U.S. Department of Health and Human Services, Administration for Children and Families, Children's Bureau, Child Welfare Outcomes Report Data,
“Overview Foster Care Information: Exited Care” and Table 3.1 “Exits of Children From Foster Care,” at http://cwoutcomes.acf.hhs.gov/data/; and U.S.
Department of Health and Human Services, Administration for Children and Families, Children’s Bureau, “The AFCARS Report: Preliminary FY 2009
Estimates as of July 2010,” at <http://www.acf.hhs.gov/programs/cb/stats_research/afcars/tar/report17.pdf>. Calculations by Children’s Defense Fund.
I-14
Children’s Defense Fund
Over 29,000 youth emancipated from foster care in 2009. These youth are at increased risk of not
graduating from high school, not enrolling in college and being unemployed, incarcerated or homeless.
Youth Who Exit Foster Care to Emancipation, 2009
Number
Alabama
Alaska
Arizona
Arkansas
California
Colorado
Connecticut
Delaware
District of Columbia
Florida
Georgia
Hawaii
Idaho
Illinois
Indiana
Iowa
Kansas
Kentucky
Louisiana
Maine
Maryland
Massachusetts
Michigan
Minnesota
Mississippi
Missouri
Montana
Nebraska
Nevada
New Hampshire
New Jersey
New Mexico
New York
North Carolina
North Dakota
Ohio
Oklahoma
Oregon
Pennsylvania
Rhode Island
South Carolina
South Dakota
Tennessee
Texas
Utah
Vermont
Virginia
Washington
West Virginia
Wisconsin
Wyoming
280
46
700
292
5,137
590
452
103
167
1,472
708
138
108
1,094
137
474
476
865
293
157
778
1,070
1,143
680
76
52
51
330
263
69
370
106
1,397
492
92
1,033
485
255
942
151
359
72
587
1,522
193
88
943
263
72
472
37
Percent of youth who
exited foster care
through emancipation
9.9%
5.4
9.7
7.5
14.0
9.9
15.4
18.6
23.8
9.2
9.5
9.8
7.5
21.4
1.6
10.6
13.2
16.7
8.0
16.9
28.9
16.3
12.7
10.9
3.9
1.0
5.6
9.2
8.5
12.3
7.0
4.9
10.9
9.9
11.2
12.6
7.5
5.4
7.7
10.1
9.8
5.2
9.4
10.9
9.8
13.7
28.5
4.8
2.5
9.9
3.6
Of the youth who emancipated out of foster,
the percent who:
Entered care at age 12
or younger
37.9%
34.8
17.0
18.2
38.8
20.7
36.3
15.5
46.7
25.4
26.7
29.7
16.7
54.7
13.1
24.1
17.0
14.8
39.6
44.6
44.9
25.1
30.5
28.1
27.6
21.2
43.1
11.8
19.4
29.0
22.7
22.6
38.8
23.4
15.2
20.6
39.8
43.1
23.2
35.1
31.8
40.3
10.2
41.4
13.0
17.0
22.0
51.7
20.8
28.6
8.1
Entered care older
than 12
62.1%
63.0
83.0
81.8
61.2
79.3
63.7
84.5
53.3
74.5
73.3
70.3
83.3
45.3
86.9
75.9
83.0
85.2
60.4
55.4
55.1
74.9
69.3
71.9
72.4
78.8
56.9
88.2
80.6
71.0
73.0
77.4
61.1
76.4
84.8
79.4
60.2
56.9
76.8
64.9
68.2
59.7
89.8
58.6
87.0
83.0
78.0
48.3
79.2
71.4
91.9
Source: U.S. Department of Health and Human Services, Administration for Children and Families, Children’s Bureau, Child Welfare Outcomes Report Data,
“Overview Foster Care Information: Exited Care” and Table 3.4, at http://cwoutcomes.acf.hhs.gov/data/. Calculations by Children’s Defense Fund.
State of America’s Children® 2011
I-15
The number of children adopted from foster care almost doubled between 1995 and 2000,
but increased by less than seven thousand children (13%) between 2000 and 2009.
Adoptions from Foster Care, Selected Years, FYs 1995–2009
FY 1995
Alabama
Alaska
Arizona
Arkansas
California
Colorado
Connecticut
Delaware
District of Columbia
Florida
Georgia
Hawaii
Idaho
Illinois
Indiana
Iowa
Kansas
Kentucky
Louisiana
Maine
Maryland
Massachusetts
Michigan
Minnesota
Mississippi
Missouri
Montana
Nebraska
Nevada
New Hampshire
New Jersey
New Mexico
New York
North Carolina
North Dakota
Ohio
Oklahoma
Oregon
Pennsylvania
Rhode Island
South Carolina
South Dakota
Tennessee
Texas
Utah
Vermont
Virginia
Washington
West Virginia
Wisconsin
Wyoming
United States
FY 2000
FY 2005
FY 2009
128
103
215
84
3,094
338
198
38
86
904
383
42
46
1,759
520
227
333
197
292
85
324
1,073
1,717
232
109
538
104
208
155
51
616
141
4,579
289
42
1,202
226
427
1,018
216
231
42
458
804
283
62
320
645
139
360
10
202
202
853
325
8,818
711
499
103
319
1,629
1,091
280
140
5,664
1,160
729
468
398
476
379
552
861
2,804
614
288
1,265
238
293
231
97
832
347
4,234
1,337
108
2,044
1,096
831
1,712
260
378
94
431
2,045
303
117
448
1,141
352
736
61
324
204
1,012
316
7,490
954
740
78
310
3,019
1,127
452
149
1,837
1,010
947
649
876
469
316
620
832
2,883
732
242
1,309
244
352
412
124
1,377
289
3,407
1,203
152
2,044
1,013
1,030
2,065
217
382
113
1,114
3,181
346
166
510
1,305
368
906
61
629
329
1,653
601
7,438
1,070
768
125
103
3,711
1,389
279
353
1,429
1,488
967
836
842
578
323
734
790
3,200
660
306
1,096
192
588
525
135
1,347
437
2,398
1,725
137
1,453
1,564
1,101
2,243
272
513
167
1,001
4,976
502
156
663
2,091
541
769
71
25,693
50,596
51,278
57,264
Source: U.S. Department of Health and Human Services, Children’s Bureau, “Adoptions of Children with Public Welfare Agency Involvement by State
FY 2002 – FY 2009,” at http://www.acf.hhs.gov/programs/cb/stats_research/afcars/adoptchild09.pdf. Calculations by Children’s Defense Fund.
I-16
Children’s Defense Fund
While the number of children waiting in foster care to be adopted has declined nationally and
in all but a handful of states, the number is still way too high.
Children in Public Foster Care Waiting to be Adopted, FYs 2004–2009
Alabama
Alaska
Arizona
Arkansas
California
Colorado
Connecticut
Delaware
District of Columbia
Florida
Georgia
Hawaii
Idaho
Illinois
Indiana
Iowa
Kansas
Kentucky
Louisiana
Maine
Maryland
Massachusetts
Michigan
Minnesota
Mississippi
Missouri
Montana
Nebraska
Nevada
New Hampshire
New Jersey
New Mexico
New York
North Carolina
North Dakota
Ohio
Oklahoma
Oregon
Pennsylvania
Rhode Island
South Carolina
South Dakota
Tennessee
Texas
Utah
Vermont
Virginia
Washington
West Virginia
Wisconsin
Wyoming
United States
FY2004
FY2005
FY2006
FY2007
FY2008
FY 2009
1,599
649
2,124
949
16,299
1,684
986
218
837
7,690
2,507
1,019
310
3,432
2,550
1,139
1,926
1,969
1,179
851
2,202
3,006
6,486
1,795
914
3,227
713
920
1,573
239
5,110
634
10,650
3,074
277
4,814
4,471
3,302
3,996
331
1,769
480
1,776
9,957
437
267
1,611
2,317
976
1,341
171
2,128
520
2,478
1,191
16,700
1,785
953
274
620
7,379
2,370
980
373
3,408
3,194
1,265
1,811
2,125
1,162
787
1,954
2,925
7,061
1,579
858
3,532
646
916
1,701
272
4,845
711
9,238
3,137
344
4,350
3,504
3,441
3,679
407
1,819
472
1,717
10,947
436
265
1,823
2,167
1,312
1,364
200
1,658
698
2,644
945
21,202
2,099
963
302
667
7,480
2,305
808
555
5,746
3,345
1,419
2,005
2,091
1,079
679
1,626
2,705
6,164
1,638
903
2,722
606
972
1,786
252
4,725
860
8,040
3,116
321
4,087
3,657
2,776
3,559
405
1,771
507
1,788
12,542
475
251
1,783
2,361
1,204
1,237
209
1,824
766
2,492
780
20,830
1,762
1,162
311
560
7,927
2,162
733
593
5,598
3,211
1,299
1,812
2,153
1,137
614
1,660
2,868
6,115
1,674
898
2,836
597
805
1,936
325
3,262
963
7,659
3,095
337
3,762
4,022
2,527
3,408
400
1,779
452
1,622
13,552
574
257
1,834
2,837
1,278
1,284
151
1,692
807
2,153
872
17,847
1,878
1,430
304
493
7,942
2,244
555
576
4,608
2,931
1,158
1,960
2,101
1,069
619
1,506
2,846
5,674
1,393
996
2,606
521
881
2,200
297
3,009
907
7,014
2,903
288
3,477
3,766
2,206
3,037
415
1,803
423
1,477
13,414
553
225
1,769
3,025
1,300
1,329
98
1,582
751
2,691
850
15,634
1,647
1,354
239
486
6,349
1,791
401
498
2,728
3,136
1,003
1,852
2,048
1,093
571
1,220
2,837
4,902
1,227
975
2,335
537
831
2,095
272
2,688
878
6,890
2,722
315
3,382
3,429
1,840
3,016
333
1,807
380
1,326
12,844
565
231
1,612
2,865
1,220
1,255
73
128,753
129,125
133,738
132,495
124,597
113,606
Source: U.S. Department of Health and Human Services, Administration for Children and Families, Children’s Bureau, “Children in Public Foster Care on
September 30th of Each Year Who are Waiting to be Adopted FY2002–FY2009,” at http://www.acf.hhs.gov/programs/cb/stats_research/afcars/waiting2009.pdf.
State of America’s Children® 2011
I-17
Some children are being raised by grandparents or other relatives when their parents are unable to
do so. More than 2.8 million grandchildren live with grandparents who are responsible for them.
One-third of them have no parent living with them.
Children Living with Grandparents or Other Relatives, 2009
Living in households headed by:
Grandparent
Alabama
Alaska
Arizona
Arkansas
California
Colorado
Connecticut
Delaware
District of Columbia
Florida
Georgia
Hawaii
Idaho
Illinois
Indiana
Iowa
Kansas
Kentucky
Louisiana
Maine
Maryland
Massachusetts
Michigan
Minnesota
Mississippi
Missouri
Montana
Nebraska
Nevada
New Hampshire
New Jersey
New Mexico
New York
North Carolina
North Dakota
Ohio
Oklahoma
Oregon
Pennsylvania
Rhode Island
South Carolina
South Dakota
Tennessee
Texas
Utah
Vermont
Virginia
Washington
West Virginia
Wisconsin
Wyoming
United States
Other Relative
Grandchildren living with grandparents
responsible for them:
No parent of grandchild present
Total
Number
Percent
110,977
12,532
144,835
58,192
735,450
61,202
48,152
14,852
13,397
315,514
213,418
40,584
18,862
213,258
105,558
26,755
31,443
88,582
121,196
11,521
106,405
73,562
134,355
42,631
105,511
92,581
13,540
19,563
50,791
13,669
114,430
51,013
304,458
155,146
5,309
158,704
67,976
49,809
172,803
13,236
96,450
12,506
138,120
610,289
46,812
4,365
119,711
82,908
38,366
57,033
7,303
26,954
3,482
50,610
11,772
367,117
26,556
11,862
4,487
6,169
97,802
73,132
11,314
6,117
74,899
21,877
7,098
11,160
19,953
29,973
3,143
34,245
22,430
35,082
14,487
22,131
24,177
3,678
4,932
21,094
2,603
42,586
11,144
106,983
48,977
1,117
40,364
16,136
14,646
41,379
4,799
25,705
3,710
32,339
194,691
16,885
1,138
39,017
28,925
6,741
19,260
1,603
71,625
6,925
77,722
39,302
313,542
33,170
23,508
9,075
5,802
171,592
130,841
10,509
11,156
113,181
66,730
14,120
18,083
63,493
75,238
5,572
51,916
30,637
68,951
21,194
69,008
50,460
8,829
11,119
28,337
6,247
50,741
29,365
140,185
99,144
3,048
90,061
43,479
27,189
85,003
4,835
56,740
8,207
80,695
356,410
18,381
1,928
62,220
43,781
23,603
29,199
5,027
26,980
2,241
22,396
15,335
75,160
13,047
8,444
2,469
1,691
58,614
48,057
2,788
3,652
33,817
21,124
4,650
7,081
28,348
29,128
2,564
15,109
8,630
20,963
6,623
22,358
19,245
4,195
4,531
7,135
1,909
16,147
9,593
39,526
40,564
1,030
33,999
17,062
8,319
32,900
1,554
22,721
2,818
29,230
103,547
4,489
1,115
21,890
16,690
9,916
9,563
2,399
37.7%
32.4
28.8
39.0
24.0
39.3
35.9
27.2
29.1
34.2
36.7
26.5
32.7
29.9
31.7
32.9
39.2
44.6
38.7
46.0
29.1
28.2
30.4
31.2
32.4
38.1
47.5
40.8
25.2
30.6
31.8
32.7
28.2
40.9
33.8
37.8
39.2
30.6
38.7
32.1
40.0
34.3
36.2
29.1
24.4
57.8
35.2
38.1
42.0
32.8
47.7
5,345,635
1,748,481
2,867,125
943,356
32.9
Source: U.S. Department of Commerce, Bureau of the Census, 2009 American Community Survey, Tables B09006 and B10002.
Calculations by Children’s Defense Fund.
I-18
Children’s Defense Fund
Juvenile Justice
T
he juvenile justice system is often the end of the line for youth facing multiple risks. Children
born poor, with unmet health and mental health needs, and/or who have been victims of violence
and spend time in foster care are at increased risk of ending up in the criminal justice system. Racial
and ethnic disparities are rampant. Every night, approximately 87,000 youth are housed in juvenile
residential placements, ranging from non-secure community-based group homes to long-term confinement in youth prisons located far away from their homes. An additional 10,000 youth are in adult jails
and prisons awaiting trial or serving sentences. As youth return to their communities from confinement,
challenges continue. They may need support to stay in school, find a job, and manage substance abuse
and mental illness. Too often they end up reentering the system or moving on in the prison pipeline.
• Minority youth make up approximately two-thirds of the youth in the juvenile
justice system.
• Total juvenile arrest rates peaked in 1996 at 9,443 per 100,000 youth ages 10 to 17
and fell by one-third in 2008 (to 6,318 per 100,000). In 2008 juvenile arrest rates fell
below 1980 levels for all racial groups (White, Asian, and American Indian), except
for Black youth.
• The number of girls arrested has grown by 50 percent since 1980; American Indian
girls are four times and Black girls three times more likely to be incarcerated than
White girls.
• Black juveniles are over three times more likely than all other groups to be arrested for
a violent offense.
• Black youth are more than four times as likely and Hispanic youth two times as likely
as White youth to be in residential placement.
• Black youth represent only 17 percent of the overall youth population; however, they
make up 62 percent of youth prosecuted in adult court.
J-2
Children’s Defense Fund
Young people face multiple risk factors that can lead them off course from a path
toward successful adulthood to prison or death.
Youth at Risk
Averaged
freshman
completion
rate2
Percent
of youth
(ages 10-20+)
in foster care
Juvenile
arrests3
(2009)
(2007-08)
(2009)
(2009)
(2007)
19,382
2,551
27,017
11,145
112,937
20,124
9,100
2,928
2,841
67,497
44,884
4,775
6,125
44,137
26,772
8,965
8,305
16,986
20,456
2,943
15,609
15,991
34,067
10,959
14,079
24,139
5,096
5,389
15,663
2,072
15,805
10,984
61,388
38,766
1,956
32,753
17,488
12,199
37,346
4,320
17,681
2,840
17,932
105,456
8,449
1,737
16,794
22,519
8,539
12,869
2,479
7.2
5.5
7.5
7.0
5.2
7.5
4.4
5.8
7.4
7.1
7.5
7.4
6.2
5.9
7.3
5.1
5.1
7.0
7.8
3.9
4.7
4.2
5.7
3.7
7.4
7.2
8.6
5.2
11.0
2.6
3.4
9.1
5.5
7.3
4.7
5.0
8.3
5.9
5.1
6.7
6.6
5.5
5.1
7.3
4.8
4.5
3.6
6.1
8.8
3.9
7.8
69.0
69.1
70.7
76.4
71.2
75.4
82.2
72.1
56.0
66.9
65.4
76.0
80.1
80.4
74.1
86.4
79.1
74.4
63.5
79.1
80.4
81.5
76.3
86.4
63.9
82.4
82.0
83.8
51.3
83.4
84.6
66.8
70.8
72.8
83.8
79.0
78.0
76.7
82.7
76.4
n/a
84.4
74.9
73.1
74.3
89.3
77.0
71.9
77.3
89.6
76.0
52.9
37.7
41.9
41.2
54.1
62.0
59.1
56.3
65.3
37.6
44.7
42.0
39.0
45.6
40.4
53.9
49.0
52.9
37.9
40.6
56.6
55.8
49.1
59.5
45.7
52.2
39.7
57.4
33.8
53.1
40.8
33.8
56.2
45.5
57.7
50.5
31.7
44.0
54.5
62.6
46.2
39.2
59.3
37.9
60.8
66.4
59.4
38.8
50.7
48.4
58.2
11,035
3,780
50,921
11,745
203,345
37,890
18,665
6,647
768
105,805
42,572
11,341
13,735
29,961
35,390
18,341
9,585
7,946
18,674
6,899
41,400
16,079
35,771
42,324
11,715
43,005
6,948
14,591
23,988
7,417
48,407
9,666
41,671
36,830
6,170
40,191
20,280
24,411
87,747
5,184
21,129
6,091
34,792
170,190
26,491
1,531
33,789
26,080
2,244
84,143
6,071
1,650
321
1,485
810
14,034
1,752
426
369
288
5,733
2,736
129
528
2,565
2,727
954
1,146
1,116
1,350
204
930
969
2,748
1,317
450
1,227
210
708
996
156
1,677
378
3,612
1,035
213
4,332
864
1,299
4,554
312
1,200
456
1,263
7,035
867
45
2,124
1,527
570
1,422
249
63
14
78
31
424
32
14
7
25
169
102
0
14
146
50
14
35
40
106
5
83
30
113
28
48
78
7
15
37
1
53
34
107
86
3
99
41
15
123
0
56
6
59
235
15
2
73
30
9
52
6
1,053,234
6.0
74.9
49.0
1,621,391
86,814
2,913
Dropouts1
Number
Percent
(2009)
Alabama
Alaska
Arizona
Arkansas
California
Colorado
Connecticut
Delaware
District of Columbia
Florida
Georgia
Hawaii
Idaho
Illinois
Indiana
Iowa
Kansas
Kentucky
Louisiana
Maine
Maryland
Massachusetts
Michigan
Minnesota
Mississippi
Missouri
Montana
Nebraska
Nevada
New Hampshire
New Jersey
New Mexico
New York
North Carolina
North Dakota
Ohio
Oklahoma
Oregon
Pennsylvania
Rhode Island
South Carolina
South Dakota
Tennessee
Texas
Utah
Vermont
Virginia
Washington
West Virginia
Wisconsin
Wyoming
United States
1 Youths
Juveniles in
Firearm
residential-deaths,
placement ages 10–19 4
(2007)
ages 16–19 not enrolled who have not graduated from high school or received an alternate credential.
2 Percent
of ninth graders graduating within four years with a regular diploma.
3 Data
reporting incomplete for District of Columbia, Florida, Illinois, New York and Minnesota.
4 Total
firearm deaths and homicide firearm deaths exclude firearm deaths by legal (police or corrections) intervention.
Sources: U.S. Department of Commerce, Bureau of the Census, 2009 American Community Survey, Table B14005; U.S. Department of Education, National
Center for Education Statistics, Public School Graduates and Dropouts From the Common Core of Data: School Year 2007–08 (October 2010), Table 2 and 3;
U.S. Department of Health and Human Services, Administration for Children and Families, Children's Bureau, Child Welfare Outcomes Report Data, Age of
Children in Foster Care (%): In Foster Care on 9/30, at http://cwoutcomes.acf.hhs.gov/data/; U.S. Department of Justice, Federal Bureau of Investigation, Crime in
the United States, 2009 (September 2010), Table 69; and U.S. Department of Justice, Bureau of Justice Statistics, Office of Juvenile Justice and Delinquency
Prevention, Juveniles in Residential Placement, 1997–2008 (February 2010), p. 2; U.S. Department of Health and Human Services, National Center for Injury
Prevention and Control, WISQARS, data accessed February 2008, April 2009, and June 2010. Calculations by Children’s Defense Fund.
State of America’s Children® 2011
J-3
Black children and teens 10–17 are more likely to be arrested than any other race.
Juvenile Arrest Rates, by Race, 1980–2008
Arrests per 100,000 persons ages 10–17
Arrests per 100,000 ages 10–17
18,000
16,000
14,000
12,160.7
Black
12,000
10,000
All races
8,000
6,317.7
White
6,000
5,562.0
5,549.9
American Indian
4,000
Asian
2,120.2
2,000
0
1980
1981
1982
1983
1984
1985
1986
1987
1988
1989
1990
1991
1992
1993
1994
1995
1996
1997
1998
1999
2000
2001
2002
2003
2004
2005
2006
2007
2008
1980
1985
1990
1995
2000
2005
All Races
White
Black
American
Indian
Asian
7,414.3
7,384.8
7,345.0
6,750.8
6,765.8
7,245.2
7,505.0
7,527.5
7,599.9
7,730.9
8,031.3
8,376.6
8,230.0
8,422.8
9,252.8
9,286.2
9,443.4
9,404.2
8,528.1
7,888.2
7,288.6
6,882.9
6,751.7
6,565.9
6,512.8
6,342.5
6,630.6
6,567.8
6,317.7
6,905.8
6,751.3
6,583.5
6,159.4
6,235.4
6,781.4
6,985.7
6,928.6
6,946.5
6,962.0
7,225.8
7,448.3
7,173.9
7,213.4
8,022.2
7,958.4
8,331.2
8,156.0
7,621.3
7,145.1
6,753.4
6,312.4
6,259.2
6,018.1
5,890.8
5,535.0
5,783.1
5,698.2
5,549.9
11,599.9
12,765.7
13,299.5
11,953.3
11,760.0
12,154.8
12,845.1
13,189.8
13,574.9
14,698.0
14,062.5
15,177.1
15,638.6
16,231.8
17,131.7
17,495.8
16,647.0
15,504.8
13,966.0
12,371.0
11,525.3
11,379.8
10,752.3
10,709.5
10,874.3
11,443.9
12,190.1
12,282.3
12,160.7
7,456.2
6,216.9
6,055.2
5,356.3
5,520.3
6,435.0
6,252.0
6,434.3
6,751.1
6,965.1
7,254.6
6,969.2
6,878.4
7,413.3
8,000.1
8,218.2
8,791.4
8,547.8
6,928.3
7,129.9
6,193.7
5,781.9
5,978.0
5,934.1
5,711.5
5,885.8
5,480.2
5,940.2
5,562.0
3,417.0
3,138.1
3,191.4
2,743.4
2,676.1
3,022.3
2,965.2
3,269.3
3,549.4
2,234.1
3,417.5
3,784.4
3,804.9
3,965.4
4,261.3
4,136.9
4,382.7
3,926.3
3,213.7
3,155.1
2,921.5
2,491.3
2,562.6
2,467.2
2,179.1
1,903.9
2,143.2
1,412.8
2,120.2
2008
Note: Person of Hispanic ethnicity may be of any race. Arrests of Hispanics are not reported separately.
Source: U.S. Department of Justice, Office of Juvenile Justice and Delinquency Prevention, Juvenile Arrest Rates by Offense, Sex,
and Race (1980–2008).
J-4
Children’s Defense Fund
Juvenile arrest rates for violent offenses peaked in 1994, and steadily declined for almost a
decade. The rate for Black youth increased in 2005, and is currently more than
five times the rate for White youth.
Juvenile Arrest Rates for Violent Offenses,* by Race, 1980–2008
Arrests per 100,000 persons ages 10–17
Arrests per 100,000 persons ages 10–17
1,800
1,600
1,400
Black
1,200
926.2
1,000
800
600
400
All races
American Indian
288.1
177.6
153.0
70.7
White
200
Asian
0
1980
1985
1990
1995
2000
2005
2008
*Includes murder, nonnegligent manslaughter, forcible rape, robbery, and aggravated assault.
Source: U.S. Department of Justice, Office of Juvenile Justice and Delinquency Prevention, Juvenile Arrest Rates by Offense, Sex,
and Race (1980-2008), at <http://ojjdp.ncjrs.gov/ojstatbb/crime/excel/jar_2008.xls>.
1980
1981
1982
1983
1984
1985
1986
1987
1988
1989
1990
1991
1992
1993
1994
1995
1996
1997
1998
1999
2000
2001
2002
2003
2004
2005
2006
2007
2008
All Races
White
Black
American
Indian
Asian
334.1
322.6
314.5
296.0
297.5
303.0
316.7
310.6
326.5
381.6
428.4
460.8
481.6
503.6
525.4
516.3
458.6
440.7
367.9
337.4
307.8
295.8
276.4
272.4
269.4
282.4
302.0
292.5
288.1
189.4
178.9
174.6
162.0
163.2
172.3
178.8
172.6
184.7
218.2
253.5
282.9
291.8
298.6
315.1
308.2
292.4
271.2
255.3
241.5
219.7
211.4
196.1
186.4
182.4
176.4
184.6
180.3
177.6
1,190.4
1,193.1
1,146.7
1,102.7
1,110.4
1,096.3
1,150.0
1,142.4
1,160.6
1,360.9
1,433.8
1,503.8
1,579.4
1,664.0
1,697.4
1,668.2
1,398.9
1,138.0
983.9
856.3
818.6
787.7
735.6
751.9
746.0
850.8
935.0
902.7
926.2
211.8
169.1
200.5
161.1
153.9
183.3
175.7
181.8
205.3
204.1
217.4
225.6
243.9
274.9
315.6
312.3
282.9
249.2
247.2
235.4
198.5
185.2
201.2
173.4
174.2
181.5
174.2
182.8
153.0
134.0
106.7
118.0
98.2
90.2
86.5
86.8
91.9
113.7
109.1
133.9
157.0
157.9
172.0
193.1
189.3
201.1
152.2
132.3
127.3
116.3
99.5
96.1
87.8
77.9
71.0
78.8
56.8
70.7
* Includes murder, nonnegligent manslaughter, forcible rape, robbery, and aggravated assault.
Source: U.S. Department of Justice, Office of Juvenile Justice and Delinquency Prevention, Juvenile Arrest Rates by Offense, Sex,
and Race (1980–2008).
State of America’s Children® 2011
J-5
The national rate of residential placement 1 in the United States is 295 per 100,000. Black youth have
the highest rate of residential placement at 767 per 100,000. The rate for Black youth is four times,
for American Indian youth three times, and Hispanic youth two times that of White youth.
Juveniles in Residential Placement, by Race, 2007
Percent of total
Total,
all races
White,
non-Hispanic
Black,
non-Hispanic
Hispanic
Alabama
Alaska
Arizona
Arkansas
California
Colorado
Connecticut
Delaware
District of Columbia
Florida
Georgia
Hawaii
Idaho
Illinois
Indiana
Iowa
Kansas
Kentucky
Louisiana
Maine
Maryland
Massachusetts
Michigan
Minnesota
Mississippi
Missouri
Montana
Nebraska
Nevada
New Hampshire
New Jersey
New Mexico
New York
North Carolina
North Dakota
Ohio
Oklahoma
Oregon
Pennsylvania
Rhode Island
South Carolina
South Dakota
Tennessee
Texas
Utah
Vermont
Virginia
Washington
West Virginia
Wisconsin
Wyoming
1,650
321
1,485
810
14,034
1,752
426
369
288
5,733
2,736
129
528
2,565
2,727
954
1,146
1,116
1,350
204
930
969
2,748
1,317
450
1,227
210
708
996
156
1,677
378
3,612
1,035
213
4,332
864
1,299
4,554
312
1,200
456
1,263
7,035
867
45
2,124
1,527
570
1,422
249
39%
38
38
46
15
41
27
24
1
41
20
12
71
33
62
66
51
62
24
69
23
33
39
42
25
49
51
44
35
75
13
19
29
31
52
43
43
68
29
46
37
39
44
21
62
93
28
52
74
44
64
59%
11
15
41
27
26
42
67
97
53
71
0
5
44
30
19
28
33
74
18
71
33
53
34
64
44
17
33
33
10
66
11
46
58
8
51
37
9
59
33
47
15
49
36
10
0
62
17
16
43
13
2%
1
38
10
54
30
27
7
2
5
6
7
18
18
6
8
16
2
1
7
4
29
3
7
7
3
9
17
27
13
19
62
20
6
6
3
9
16
10
17
14
7
4
42
22
0
7
20
5
5
14
United States
85,068
42
36
14
American
Indian
Asian
American
0%
37
7
1
1
2
1
0
0
0
0
0
7
2
0
2
2
0
0
0
0
0
1
12
1
0
19
5
2
2
0
6
1
1
32
0
9
4
0
0
1
37
0
0
4
0
0
5
0
3
6
0%
5
0
1
3
1
1
0
0
0
0
67
0
1
0
1
2
0
0
0
1
3
0
3
1
1
0
0
2
2
1
0
1
1
1
0
2
1
0
1
1
1
0
0
1
0
1
3
1
3
0
4
2
Source: U.S. Department of Justice, Office of Juvenile Justice and Delinquency Prevention, and National Center for Juvenile Justice, Census of Juveniles in
Residential Placement Databook, Race/Ethnicity by State, 2007, available at <http://www.ojjdp.gov/ojstatbb/ezacjrp/>.
J-6
Children’s Defense Fund
Juveniles in Residential Placement, by Race, 2007
Rate per 100,000 juveniles
Total,
all races
White,
non-Hispanic
Black,
non-Hispanic
Hispanic
American Indian/
Alaska Native
Asian American/
Pacific Islander
323
386
208
259
331
341
149
400
583
313
286
101
298
205
381
295
371
246
314
150
148
166
275
231
131
217
205
360
348
125
177
171
236
145
324
339
219
331
342
282
291
514
191
288
259
70
260
218
320
269
443
200
241
166
170
143
212
57
156
47
240
108
53
258
116
294
222
246
179
136
110
63
73
148
119
65
135
125
196
250
101
38
103
124
73
197
183
142
297
129
180
181
250
117
151
198
69
114
157
256
149
336
590
801
653
518
1,164
1,575
519
1,026
743
780
578
0
998
471
953
1,323
1,274
815
600
1,293
310
681
767
1,167
186
621
2,612
1,868
1,121
610
725
616
597
315
1,690
1,093
753
974
1,413
1,263
391
3,956
426
788
1,527
0
669
668
1,048
1,236
3,170
162
57
204
361
390
408
265
340
145
75
225
62
378
202
372
407
514
166
62
625
90
418
181
305
400
161
423
575
284
477
198
200
248
102
659
279
195
357
505
290
964
1,010
191
283
431
0
253
330
1,112
193
656
109
688
243
347
317
570
369
0
0
195
118
0
1,268
1,468
146
1,059
698
0
217
0
157
188
312
1,715
318
0
400
1,340
508
843
0
94
454
123
1,174
275
173
869
130
0
957
1,365
0
127
752
0
253
567
0
670
785
0
310
35
156
82
103
32
0
0
59
11
110
0
71
0
222
321
0
47
0
31
107
25
139
187
104
0
84
105
136
18
0
31
39
464
16
225
108
66
90
112
741
63
35
95
0
47
90
238
280
0
Alabama
Alaska
Arizona
Arkansas
California
Colorado
Connecticut
Delaware
District of Columbia
Florida
Georgia
Hawaii
Idaho
Illinois
Indiana
Iowa
Kansas
Kentucky
Louisiana
Maine
Maryland
Massachusetts
Michigan
Minnesota
Mississippi
Missouri
Montana
Nebraska
Nevada
New Hampshire
New Jersey
New Mexico
New York
North Carolina
North Dakota
Ohio
Oklahoma
Oregon
Pennsylvania
Rhode Island
South Carolina
South Dakota
Tennessee
Texas
Utah
Vermont
Virginia
Washington
West Virginia
Wisconsin
Wy-oming
271
158
979
337
438
103
United States
State of America’s Children® 2011
J-7
Approximately one-third of juveniles in residential placement are held for offenses against persons,
and about two-thirds are held for property, public order, a drug offense,
technical violations and status offenses.
Offense Profile of Juveniles in Residential Placements, 2007
40
36%
35
30
24%
Percent
25
20
15%
13%
15
8%
10
4%
5
0
1
2
3
Person1
Property2
Technical
violation
Public
order
Drug
Status
offense3
Person (aggravated assault, simple assault, robbery)
Property (burglary, theft, auto theft)
Status offense (running away, underage drinking, incorrigibility)
Source: U.S. Department of Justice, Office of Juvenile Justice and Delinquency Prevention, and National Center for Juvenile Justice,
Census of Juveniles in Residential Placement Databook, Detailed Offense Profile for United States, 2007, available at
<http://www.ojjdp.gov/ojstatbb/ezacjrp/>.
J-8
Children’s Defense Fund
The Bureau of Justice Statistics reported that approximately 2,778 youth
under age 18 were held in custody in adult state prisons in 2009.1
Some states do not hold any youth in adult prisons, but the vast majority do.
Youth Under 18 in Adult Prisons, 2009
United States
Florida
Connecticut*
North Carolina*
New York
Arizona
Texas
Michigan
Nevada
Alabama
Illinois
Georgia
South Carolina
Ohio
Colorado
Pennsylvania
Maryland
Indiana
Wisconsin
Missouri
Mississippi
Delaware*
Tennessee
Nebraska
New Jersey**
Oklahoma
Arkansas
Virginia
Louisiana**
Oregon
Minnesota
Iowa
Massachusetts
Alaska*
Utah
Kansas
Vermont*
New Mexico
Washington**
Hawaii*
Wyoming
Montana
South Dakota**
Rhode Island*
Idaho
California**
West Virginia
Kentucky
North Dakota
New Hampshire
Maine
2,778
393
332
215
190
157
156
156
118
118
106
99
89
86
79
61
58
54
37
31
28
28
22
21
21
19
17
16
15
13
13
13
8
7
6
5
4
3
2
2
1
1
1
0
0
0
0
0
0
0
0
0
500
1000
1500
2000
2500
3000
* Prisons and jails form one integrated system. Data include total jail and prison populations.
** Counts include those held in privately-operated facilities.
1
Most states unless noted reported the number of youth held in adult prisons only; the number of youth in adult jails was reported
separately. The estimated number of juveniles held in adult prisons and jails is approximately 10,000.
Source: U.S. Department of Justice, Office of Justice Programs, Bureau of Justice Statistics, Prison Inmates at Midyear 2009 – Statistical
Tables, Table 21, available at <http://bjs.ojp.usdoj.gov/content/pub/pdf/pim09st.pdf>.
State of America’s Children® 2011
J-9
Treating Children Like Adults in the Justice System
In the “tough on crime” era of the 1980s and ’90s, many states enacted laws making it easier to prosecute
children as adults. Today, approximately 250,000 children are prosecuted, sentenced or incarcerated as adults
each year in the United States.1 Many researchers, advocates and practitioners agree that children in adult
facilities are at greater risk of abuse, injury and death. Evidence also suggests that incarcerating children with
adults is not good for public safety. In 2007, the Centers for Disease Control and Prevention conducted a
study and found that children transferred to adult court are approximately 34 percent more likely to be
rearrested for a violent offense than children retained in the juvenile system who committed similar offenses.2
In 2011, the Campaign For Youth Justice reported the following key facts about children transferred to the
adult criminal justice system:3
• About 10,000 children are held in adult jails and prisons on any given night.
• Two-thirds of children who are sent to adult court reside in adult facilities while they are awaiting trial.
• Most of the children prosecuted in adult court are charged with non-violent offenses.
• A survey of adult facilities found that 40 percent of jails offer no educational services at all;
only 11 percent provide special education services; and seven percent provide vocational training.
• The National Prison Rape Elimination Commission found that “more than any other group
of incarcerated persons, youth incarcerated with adults are probably at the highest risk for
sexual abuse.”
• Florida is the state with the highest number of children in adult prisons (393).
• African-American youth represent only 17 percent of the overall youth population, however, they
make up 62 percent of those prosecuted in adult court. They are also nine times more likely than
White youth to receive an adult prison sentence.
J-10
1
Griffin, Patrick. National Institute of Corrections Convening, June 18, 2010.
2
Centers for Disease Control and Prevention. (2007) Effects on Violence of Laws and Policies Facilitating the Transfer of Youth from the Juvenile to
the Adult Justice System: A Report on Recommendations of the Task Force on Community Preventative Services. MMWR 2007; 56 (No. RR-9).
Available online at http://www.cdc.gov/mmwr/pdf/rr/rr5609.pdf.
3
Campaign For Youth Justice. (2007) State Trends: Legislative Victories from 2005 to 2010 Removing Youth from the Adult Criminal Justice System.
Available online at http://www.campaignforyouthjustice.org/documents/CFYJ_State_Trends_Report.pdf.
Children’s Defense Fund
More Girls Enter the Juvenile Justice System
The caseload of girls in the juvenile justice system has greatly increased in the last 30 years. In 1980, girls
made up 20 percent of all juvenile arrests.1 By 2009, girls made up 30 percent of all juvenile arrests. The
rise in the number of girls in the system seems to be largely due to changes in arrest policies, rather than
changes in behavior among girls. 2 Girls are disproportionately arrested for status offenses, or acts that are
illegal only when a minor has committed them, such as curfew violations, under-age drinking, running away,
and truancy. Most states are attempting to divert status offenders to counseling or other community-based
services to prevent entry into the juvenile justice system. However, these alternatives are not available to all
who need them, and there are many problems associated with incarcerating girls for status offenses.
Girls are overrepresented in the juvenile justice system for status offenses
• In 2007, the most recent national data on girls in residential placement showed that girls made up
about 14 percent of all youth in placement. These data also showed that girls were disproportionately
incarcerated for status offenses. Girls made up
I 51 percent of juveniles in residential placement for running away;
I
31 percent of truancy offenses;
I 36 percent of underage drinking offenses; and
I 40 percent of incorrigibility offenses.3
• Girls made up 55 percent of runaway arrests in 2009.4
Other characteristics about girls in the juvenile justice system
• Estimates of girls in the juvenile justice system who have been abused range from 40 to
73 percent.5
• Seventy-five percent of girls in the system report being regular users of alcohol and/or drugs.6
• Girls (9%) were more likely than boys (2%) to report forced sexual activity with other youth while in
confinement.7
• American Indian and Black girls are four and three times more likely to be incarcerated than White
girls, respectively.8
1 U.S. Department of Justice, Office of Justice Programs, Office of Juvenile Justice and Delinquency Prevention, Snyder, Howard N. and Sickmund,
Melissa, Juvenile Offenders and Victims: 2006 National Report, at http://www.ojjdp.gov/ojstatbb/nr2006/downloads/nr2006.pdf>.
2 U.S. Department of Justice, Office of Justice Programs, Office of Juvenile Justice and Delinquency Prevention, OJJDP In Focus, Girls’ Delinquency,
at <http://www.ncjrs.gov/pdffiles1/ojjdp/228414.pdf>.
3 U.S. Department of Justice, Office of Juvenile Justice and Delinquency Prevention, and National Center for Juvenile Justice, Census of Juveniles in
Residential Placement Databook, Race/Ethnicity by State, 2007, available at <http://www.ojjdp.gov/ojstatbb/ezacjrp/>.
4 U.S. Department of Justice, Federal Bureau of Investigation, Crime in the United States 2009, Table 33, available at
<http://www2.fbi.gov/ucr/cius2009/data/table_33.html>.
5 Chesney-Lind, M. & Sheldon, R.G. (1998). Girls, delinquency, and juvenile justice. Grove, CA: Brooks/Cole.
6 Acoca, L. (1999). Investing in girls: A 21st century strategy. Juvenile Justice, vol 6 (1). Office of Juvenile Justice and Delinquency Prevention.
7 U.S. Department of Justice, Office of Justice Programs, Bureau of Justice Statistics, Special Report, Sexual Victimization in Juvenile Facilities
Reported by Youth, 2008-2009, available at <http://bjs.ojp.usdoj.gov/content/pub/pdf/svjfry09.pdf>.
8 U.S. Department of Justice, Office of Juvenile Justice and Delinquency Prevention, and National Center for Juvenile Justice, Census of
Juveniles in Residential Placement Databook, Race/Ethnicity by State, 2007, available at <http://www.ojjdp.gov/ojstatbb/ezacjrp/>.
State of America’s Children® 2011
J-11
Gun Violence
F
or thousands of teens, death from gun violence is the end of the pipeline. In 2007, 3,042 children
and teens died from gunfire in the United States—eight every day—as a result of homicide, suicide or
accidental shootings. Almost six times as many children and teens – 17,523 – suffered non-fatal gun
injuries, which have serious physical and emotional consequences. Random violence, especially in poor
communities, drives thousands of vulnerable young people into the pipeline to prison where they
remain trapped with little chance of escape.
• The 3,042 deaths of children and teens from gunfire in 2007 alone nearly equaled the
total number of U.S. combat deaths in Iraq through July 2011 (3,480).
• Although there are fewer Black children in America more Black than White children
and teens were killed by firearms in 2007.
• Black males ages 15–19 are more than five times as likely as White males and more
than twice as likely as Hispanic males to be killed by a firearm. White children
and teens are six times as likely as any other racial or ethnic group to be victims of
firearm-related suicide.
• The annual number of firearm deaths of White children and teens decreased by about
54 percent between 1979 and 2007, while the deaths of Black children and teens
increased by 61 percent.
• Since 1979 gun violence has ended the lives of 110,645 children and teens in America.
For additional data on gun violence, see Protect Children, Not Guns 2010.
K-2
Children’s Defense Fund
Children and Teens Killed by Firearms: A Portrait
The latest data from the U.S. Centers for Disease Control and Prevention show that 3,042
children and teens died from gunfire in the United States in 2007—one every three hours,
eight every day, 58 every week.
2,161
683
198
were homicide victims
committed suicide
died in accidental or undetermined circumstances
2,665
377
were boys
were girls
397
154
85
1,499
1,460
611
43
40
were under age 15
were under age 10
were under age 5
were Black
were White
were Hispanic*
were Asian or Pacific Islander
were American Indian or Alaska Native
Almost six times as many children and teens—17,523—suffered non-fatal gun injuries, which also
can have serious physical and emotional consequences.
There are more than 280 million privately owned firearms in the United States, which is the
equivalent of nine firearms for every 10 men, women and children in this country.
* Persons of Hispanic/Latino origin can be of any race; these 678 deaths are included in the four race categories.
State of America’s Children® 2011
K-3
Since 1979, more than 110,000 children and teens have been killed by firearms.
Fifty-seven percent were homicides and 31 percent were suicides.
Firearm Deaths of Children and Teens, by Manner, 1979–2007
Total*
Homicide*
Suicide
Accident
Unknown
1979
3,710
1,651
1,220
726
113
1980
3,749
1,743
1,214
689
103
1981
3,589
1,660
1,213
604
112
1982
3,332
1,498
1,207
550
77
1983
2,962
1,238
1,150
504
70
1984
3,030
1,289
1,114
552
75
1985
3,169
1,322
1,256
519
72
1986
3,349
1,513
1,293
472
71
1987
3,400
1,573
1,281
467
79
1988
3,974
1,953
1,387
543
91
1989
4,384
2,367
1,380
567
70
1990
4,935
2,852
1,476
541
66
1991
5,329
3,247
1,436
551
95
1992
5,353
3,336
1,426
501
90
1993
5,715
3,625
1,460
526
104
1994
5,793
3,579
1,565
512
137
1995
5,254
3,249
1,450
440
115
1996
4,613
2,836
1,309
376
92
1997
4,205
2,562
1,262
306
75
1998
3,761
2,184
1,241
262
74
1999
3,365
1,990
1,078
214
83
2000
3,012
1,776
1,007
193
36
2001
2,911
1,771
928
182
30
2002
2,867
1,830
828
167
42
2003
2,827
1,822
810
151
44
2004
2,825
1,804
846
143
32
2005
3,006
1,972
822
173
39
2006
3,184
2,225
763
154
42
2007
3,042
2,161
683
138
60
Total
110,645
62,628
34,105
11,723
2,189
*Total firearm deaths and homicide firearm deaths exclude firearm deaths by legal (police or corrections) intervention.
Sources: U.S. Department of Health and Human Services, Centers for Disease Control and Prevention, CDC WONDER, at
<http://wonder.cdc.gov/mortSQL.html>, accessed December 2004; and U.S. Department of Health and Human Services, Centers for Disease Control
and Prevention, National Center for Injury Control and Prevention, WISQARS, at <http://www.cdc.gov/ ncipc/wisqars/>, accessed December 2004,
January 2006, December 2006, January 2008, April 2009, and June 2010.
Calculations by Children's Defense Fund.
K-4
Children’s Defense Fund
More Black than White children and teens were killed by firearms in 2007. Black children and teens are
more likely to be victims of homicide. White children and teens are more likely to be victims of suicide.
Firearm Deaths of Children and Teens, by Age,
Manner, and Race/Hispanic Origin, 2007
Under
5
Ages
5–9
Ages
10–14
Ages
15–19
Total under
age 20
All races
Accident
Suicide
Homicide
Undetermined intent
85
19
0
63
3
69
20
0
47
2
243
26
53
154
10
2,645
73
630
1,897
45
3,042
138
683
2,161
60
White
Accident
Suicide
Homicide
Undetermined intent
50
12
0
36
2
43
10
0
31
2
144
22
43
72
7
1,223
43
518
645
17
1,460
87
561
784
28
Black
Accident
Suicide
Homicide
Undetermined intent
32
6
0
25
1
25
9
0
16
0
91
4
9
76
2
1,351
29
80
1,217
25
1,499
48
89
1,334
28
American Indian, Alaska Native
Accident
Suicide
Homicide
Undetermined intent
3
1
0
2
0
1
1
0
0
0
4
0
1
3
0
32
1
19
10
2
40
3
20
15
2
Asian, Pacific Islander
Accident
Suicide
Homicide
Undetermined intent
0
0
0
0
0
0
0
0
0
0
4
0
0
3
1
39
0
13
25
1
43
0
13
28
2
Hispanic*
Accident
Suicide
Homicide
Undetermined intent
19
4
0
14
1
8
2
0
6
0
45
2
2
39
2
539
14
90
427
8
611
22
92
486
11
*Persons of Hispanic origin can be of any race.
Source: U.S. Department of Health and Human Services, Centers for Disease Control and Prevention, National Center for Injury Prevention and Control,
WISQARS, at <http://www.cdc.gov/ncipc/wisqars>, accessed June 2010. Calculations by Children’s Defense Fund.
State of America’s Children® 2011
K-5
Black males ages 15 to 19 are more than five times as likely as White males and more than
twice as likely as Hispanic and American Indian males to be killed by firearms.
Firearm Death Rates of Males Ages 15–19, by Race and
Hispanic Origin, 2007
80
69.84
Deaths per 100,000 males ages 15–19
70
60
50
40
30
25.81
21.64
18.69
20
12.40
10
6.97
0
White
Black
Hispanic*
American
Indian,
Alaska Native
Asian,
Pacific Islander
Total,
All Races
*Persons of Hispanic origin can be of any race.
Source: U.S. Department of Health and Human Services, Centers for Disease Control and Prevention, National Center for
Injury Prevention and Control, WISQARS, at <http://www.cdc.gov/ncipc/wisqars>, accessed June 2010.
Calculations by Children’s Defense Fund.
K-6
Children’s Defense Fund
Since 1979 the annual number of firearm deaths of White children and teens decreased by
about 54 percent, but deaths of Black children and teens increased by 61 percent.
Firearm Deaths of Children and Teens, by Race/Hispanic Origin,
1979–2007
Total
Black
White
American
Indian,
Alaska
Native*
Asian,
Pacific
Islander*
Hispanic**
1979
3,710
929
2,700
—
—
—
1980
3,749
944
2,739
—
—
—
1981
3,589
944
2,569
49
27
1982
3,332
811
2,450
55
23
—
1983
2,962
739
2,155
42
25
—
1984
3,030
716
2,238
44
32
—
1985
3,169
850
2,241
42
36
—
1986
3,349
938
2,337
43
31
—
1987
3,400
1,117
2,199
28
54
—
1988
3,974
1,458
2,405
76
53
—
1989
4,384
1,694
2,563
50
76
—
1990
4,935
2,047
2,753
47
87
748
1991
5,329
2,297
2,878
60
91
883
1992
5,353
2,359
2,834
55
105
924
1993
5,715
2,600
2,925
51
139
977
1994
5,793
2,559
3,024
75
135
993
1995
5,254
2,153
2,898
73
130
1,005
1996
4,613
1,976
2,475
64
98
817
1997
4,205
1,687
2,357
59
102
748
1998
3,761
1,416
2,197
60
88
661
1999
3,365
1,301
1,934
57
73
605
2000
3,012
1,149
1,762
44
57
568
2001
2,911
1,128
1,695
49
39
518
2002
2,867
1,112
1,639
52
64
581
2003
2,827
1,172
1,554
50
51
553
2004
2,825
1,149
1,568
57
51
574
2005
3,006
1,271
1,624
51
60
614
2006
3,184
1,441
1,618
48
77
678
2007
3,042
1,499
1,460
40
43
611
Total
110,645
41,456
65,791
1,421
1,847
13,058
* Data for American Indian/Alaska Native and Asian/Pacific Islander not available for 1979-1980.
** Persons of Hispanic origin can be of any race. Hispanic data not available prior to 1990. For 1990 to 1996, a small number of states with small
Hispanic populations did not include Hispanic identifiers in their reporting to the federal government.
Sources: U.S. Department of Health and Human Services, Centers for Disease Control and Prevention, CDC WONDER, at
<http://wonder.cdc.gov/mortSQL.html>, accessed December 2004; and U.S. Department of Health and Human Services, Centers for Disease Control
and Prevention, National Center for Injury Control and Prevention, WISQARS, at <http://www.cdc.gov/ncipc/ wisqars/>, accessed December 2004,
January 2006, December 2006, January 2008, April 2009, and June 2010.
Calculations by Children’s Defense Fund.
State of America’s Children® 2011
K-7
The number of children and teens killed by firearms increased in 19 states and the District of Columbia
and decreased in 29 states between 2006 and 2007.
Firearm Deaths of Children and Teens, by Manner, 2005–2007
Total*
Homicide*
2005 2006 2007
Alabama
Alaska
Arizona
Arkansas
California
Colorado
Connecticut
Delaware
District of Columbia
Florida
Georgia
Hawaii
Idaho
Illinois
Indiana
Iowa
Kansas
Kentucky
Louisiana
Maine
Maryland
Massachusetts
Michigan
Minnesota
Mississippi
Missouri
Montana
Nebraska
Nevada
New Hampshire
New Jersey
New Mexico
New York
North Carolina
North Dakota
Ohio
Oklahoma
Oregon
Pennsylvania
Rhode Island
South Carolina
South Dakota
Tennessee
Texas
Utah
Vermont
Virginia
Washington
West Virginia
Wisconsin
Wyoming
United States
Suicide
2005 2006 2007
Undetermined
Intent
Accident
2005 2006 2007
2005 2006 2007
2005 2006 2007
64
13
102
46
474
44
10
7
26
148
80
2
16
130
62
15
18
36
110
1
75
27
92
42
30
73
18
19
34
1
45
25
93
91
11
118
35
17
138
7
41
11
77
264
10
3
79
44
19
56
7
59
17
112
34
511
46
24
6
23
172
87
1
22
154
74
28
25
30
98
6
79
24
128
28
41
90
6
17
41
2
58
33
115
94
10
106
46
24
159
5
51
9
69
237
15
4
66
38
10
46
4
69
14
82
35
431
33
14
7
26
176
114
0
14
150
50
15
36
42
114
5
82
31
119
27
50
85
8
20
38
1
53
36
107
91
3
104
45
15
126
0
60
5
61
250
15
2
76
32
10
57
6
39
5
62
17
392
19
7
4
26
96
54
1
5
111
41
4
11
17
67
0
64
26
65
16
12
44
2
3
20
1
40
11
66
58
1
78
19
2
99
6
24
2
48
164
3
1
54
20
9
33
3
39
5
68
20
435
22
20
4
22
122
60
0
5
133
51
11
9
11
75
3
66
21
93
17
24
63
0
9
26
1
54
15
96
60
0
72
30
11
121
3
37
0
43
162
1
1
40
13
4
27
0
52
5
53
23
376
13
10
6
25
136
87
0
0
128
31
4
19
21
82
1
73
26
92
11
20
55
2
10
27
0
50
14
93
67
0
65
24
3
93
0
46
0
40
160
5
1
57
16
3
35
1
17
8
35
23
54
20
2
3
0
46
21
1
9
13
18
10
4
16
30
1
10
0
23
23
9
16
15
15
14
0
4
12
20
26
9
28
12
12
32
1
12
7
22
84
7
2
22
21
9
20
4
18
9
35
13
54
19
4
2
0
37
18
1
15
16
18
15
14
14
14
3
10
3
32
11
6
19
4
8
14
1
2
18
17
27
7
29
12
13
30
2
11
7
21
58
13
2
21
19
5
18
4
11
8
17
8
43
16
3
1
0
31
16
0
12
17
16
10
17
17
21
4
9
4
23
16
16
20
6
8
9
1
2
16
13
17
3
32
16
11
21
0
8
5
19
73
9
1
19
15
4
14
5
7
0
2
5
25
4
1
0
0
5
5
0
2
6
1
1
3
2
12
0
0
1
2
1
7
10
1
1
0
0
1
2
6
6
1
12
2
3
4
0
5
2
7
13
0
0
1
1
0
3
0
2
3
3
0
20
1
0
0
1
11
5
0
2
5
4
2
2
4
8
0
2
0
3
0
9
7
2
0
1
0
2
0
2
4
1
5
3
0
8
0
3
2
4
14
1
0
3
3
1
1
0
4
0
4
4
8
1
0
0
0
3
8
0
2
4
3
1
0
3
10
0
0
1
2
0
13
5
0
2
2
0
1
3
1
7
0
3
5
1
8
0
4
0
2
15
1
0
0
1
2
4
0
1
0
3
1
3
1
0
0
0
1
0
0
0
0
2
0
0
1
1
0
1
0
2
2
2
3
0
0
0
0
0
0
1
1
0
0
2
0
3
0
0
0
0
3
0
0
2
2
1
0
0
0
0
6
1
2
4
0
0
0
2
4
0
0
0
1
0
0
1
1
0
1
0
0
0
2
1
0
0
0
0
0
0
0
3
2
0
1
0
0
0
0
0
1
3
0
1
2
3
0
0
0
2
1
8
0
4
3
1
0
1
6
3
0
0
1
0
0
0
1
1
0
0
0
2
0
1
5
0
0
0
0
0
3
0
0
0
4
0
0
4
0
2
0
0
2
0
0
0
0
1
4
0
3,006
3,184
3,042
1,972
2,225
2,161
822
763
683
173
154
138
39
42
60
*Total firearm deaths and homicide firearm deaths exclude firearm deaths by legal (police or corrections) intervention.
Source: U.S. Department of Health and Human Services, National Center for Injury Prevention and Control, WISQARS, at <http://www.cdc.gov/ncipc/ wisqars/>. data accessed
February 2008, April 2009, and June 2010. Calculations by Children’s Defense Fund.
K-8
Children’s Defense Fund
Children and teens killed by gunfire in 2006 nearly equaled the total number
of U.S. combat deaths in Iraq since the war started and were more than
four times the number of American combat fatalities in Afghanistan.
It’s Time to Stop the Deaths
U.S. Soldiers Killed in Action
Revolutionary War, 1775–1783
4,435
War of 1812, 1812–1815
2,260
Mexican War, 1846–1848
1,733
Civil War (Union Forces), 1861–1865
140,414
Spanish-American War, 1898
385
World War I, 1917–1918
53,402
World War II, 1941–1945
291,557
Korean War, 1950–1953
33,741
Vietnam War, 1961–1973
47,424
Persian Gulf War, 1990–1991
147
Military fatalities by hostile action in Afghanistan
(through May 1, 2010)
762
Military fatalities by hostile action in Iraq
(through May 1, 2010)
3,475
Persons Killed in the Terrorist Attacks on 9/11
2,927
U.S. Firearm Deaths
Firearm deaths in America since 1968 when
Dr. King and Robert Kennedy were assassinated
Child and teen firearm deaths since 1979
Children and teens killed by firearms in 2007
1,265,734
110,645
3,042
Source: U.S. Department of Defense, Office of the Secretary of Defense, Statistical Information Analysis
Division, “Principal Wars in Which the United States Participated: U.S. Military Personnel Serving and
Casualties,” at http://siadapp.dmdc.osd.mil/personnel/CASUALTY/WCPRINCIPAL.pdf, “Operation Enduring
Freedom: Military Deaths, October 1, 2001 through May 1, 2010,” at http://siadapp.dmdc.osd.mil/
personnel/CASUALTY/oefdeaths.pdf, and “Operation Iraqi Freedom: Military Deaths, March 19, 2003
through May 1, 2010,” at http://siadapp.dmdc.osd.mil/ personnel/ CASUALTY/oif-deaths-total.pdf; and
U.S. Department of Health and Human Services, National Center for Health Statistics, Vital Statistics
of the United States, various years; and U.S. Department of Health and Human Services, National Center
for Injury Prevention and Control, WISQARS, at http://www.cdc.gov/injury/wisqars/index.html.
For more information on the State of America’s Children,
contact the Children’s Defense Fund
25 E Street, NW
Washington, DC 20001
(202) 628-8787 • 1 (800) 233-1200
www.childrensdefense.org
State of America’s Children® 2011
K-9
25 E Street, NW, Washington, DC 20001
(202) 628-8787
1 (800) 233-1200
www.childrensdefense.org

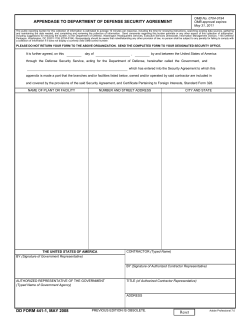


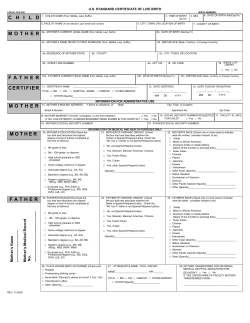

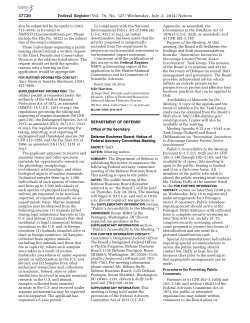
© Copyright 2026