
Quality of Health Care for Children and Adolescents: A Chartbook
ChildChartbook-Cover-D3c.qxd
2/23/04 10:57 AM
Page 1
Quality of Health Care for
Children and Adolescents: A Chartbook
S H E I L A L E AT H E R M A N | D O U G L A S M C C A R T H Y
U N C P R O G R A M O N H E A LT H O U T C O M E S
T H E U N I V E R S I T Y O F N O R T H C A R O L I N A AT C H A P E L H I L L
The Commonwealth Fund
One East 75th Street
New York, NY 10021-2692
Telephone 2 1 2 . 6 0 6 . 3 8 0 0
Facsimile 2 1 2 . 6 0 6 . 3 5 0 0
Email c m w f @ c m w f. o r g
Web w w w. c m w f. o r g
APRIL 2004
p1-CalloutForPDF.qxd
3/22/04 12:42 PM
Page 1
Quality of Health Care for
Children and Adolescents: A Chartbook
S H E I L A L E AT H E R M A N | D O U G L A S M C C A R T H Y
U N C P R O G R A M O N H E A LT H O U T C O M E S
T H E U N I V E R S I T Y O F N O R T H C A R O L I N A AT C H A P E L H I L L
We'd like to know what you think about this chartbook. To take a short, anonymous
user survey, click on the following link or copy the address into your Web browser:
http://64.73.28.22/s.asp?u=50446418798. Or, e-mail [email protected] to receive
an invitation to take the survey. You can also view and download the chartbook through
the Commonwealth Fund Web site (www.cmwf.org).
Support for this research was provided by The Commonwealth Fund. The views presented here
are those of the authors and should not be attributed to The University of North Carolina or
The Commonwealth Fund or its directors, officers, or staff.
APRIL 2004
ChildChartbook-p1to30.qxd
3/22/04 10:04 AM
Page 2
Authors
Sheila Leatherman Research Professor, School of Public Health, and Senior Investigator, UNC Program on Health
Outcomes, The University of North Carolina at Chapel Hill; and Senior Associate, Judge Institute,
University of Cambridge, England
Douglas McCarthy President, Issues Research, Inc., Durango, Colo.
(under contract to The University of North Carolina at Chapel Hill)
Pediatric Expert Consultants
Charles Homer, M.D., M.P.H. President and CEO, National Initiative for Children’s Healthcare Quality, Boston, Mass.
Mark Schuster, M.D., Ph.D. Associate Professor of Pediatrics and Health Services, UCLA Schools of Medicine and Public Health;
Senior Natural Scientist, RAND, Santa Monica, Calif.; and Director of the UCLA/RAND Center
for Adolescent Health Promotion
Editorial and Scientific Consultants
Kathleen Lohr, Ph.D. Research Professor, School of Public Health, and Senior Investigator, UNC Program on
Health Outcomes, The University of North Carolina at Chapel Hill; and Distinguished Fellow,
RTI International
Joanne Garrett, Ph.D. Professor, Department of Medicine, The University of North Carolina at Chapel Hill
Advisory Board
Anne-Marie Audet, M.D., M.Sc.
Donald Berwick, M.D., M.P.P.
Robert Galvin, M.D.
Judith Hibbard, Dr.P.H.
Elizabeth McGlynn, Ph.D.
William Roper, M.D., M.P.H.
Assistant Vice President, The Commonwealth Fund, New York, N.Y.
President and CEO, Institute for Healthcare Improvement, Boston, Mass.
Director, Global Health Care, General Electric Company, Fairfield, Conn.
Professor, Department of Planning, Public Policy, and Management, University of Oregon, Eugene
Associate Director, RAND Health, Santa Monica, Calif.
Dean, School of Public Health, The University of North Carolina at Chapel Hill
Project Administration
Sue Tolleson-Rinehart, Ph.D. Administrator, UNC Program on Health Outcomes, The University of North Carolina at Chapel Hill
Sara Massie Research Assistant, UNC Program on Health Outcomes, The University of North Carolina at Chapel Hill
Design
Jim Walden Walden Creative, LLC, Bayfield, Colo.
ChildChartbook-Front-D3g.qxd
2/26/04 8:32 AM
Page 3
Table of Contents
Acknowledgments
•
page 4
Summary of Charts and Findings
•
page 5
Introduction and Overview
The quality of children’s health care today
Defining quality of health care for children
Challenges and considerations in measuring quality of health care for children
A systems approach to improving quality of health care for children
Conclusion
•
page 15
page 15
page 17
page 19
page 21
page 24
Methods and Organization of the Chartbook
Development process
The conceptual framework for reporting on quality of health care
Scientific issues and terminology
•
Charts
Section 1. Effectiveness
Section 2. Patient Safety
Section 3. Access and Timeliness
Section 4. Patient and Family Centeredness
Section 5. Disparities
Section 6. Capacity to Improve
•
•
page 31
page 32
page 52
page 58
page 74
page 80
page 92
Technical Appendix
•
page 111
References
•
page 119
About the Authors
•
page 132
•
•
•
•
•
•
•
•
•
•
•
•
•
page 25
page 25
page 26
page 29
Leatherman and McCarthy, Quality of Health Care for Children and Adolescents: A Chartbook, 2004. The Commonwealth Fund
3
ChildChartbook-Front-D3g.qxd
2/26/04 8:32 AM
Page 4
Leatherman and McCarthy, Quality of Health Care for Children and Adolescents: A Chartbook, 2004. The Commonwealth Fund
Acknowledgments
This chartbook is a compendium of data representing the efforts of many
researchers, to whom we are indebted for their contributions. We especially wish
to thank the individuals who kindly provided data, sources, clarification, or
advice: Magaly Angeloni, Rhode Island Department of Health; Anne Beal, M.D.,
M.P.H., The Commonwealth Fund; Christina Bethell, Ph.D., Foundation for
Accountability; Stephen Blumberg, Ph.D., Centers for Disease Control and
Prevention; Monica Brooks and Leslie Hazle, M.S., R.N., C.P.N., Cystic Fibrosis
Foundation; John Patrick Co, M.D., M.P.H., Harvard Medical School; Diane
Cousins, R.Ph., and Rodney Hicks, R.N., M.S.N., U.S. Pharmacopeia; Missy
Fleming, Ph.D., American Medical Association; Jeffrey Geppert, M.A., National
Bureau of Economic Research; Mary Margaret Gottesman, Ph.D., R.N., C.P.N.P.,
National Association of Pediatric Nurse Practitioners; Margaret Grey, Dr.P.H.,
Yale University; Sheryl Kataoka, M.D., M.S.H.S., University of California, Los
Angeles; Howard Kilbride, M.D., Children’s Mercy Hospital; Michael Konstan,
M.D., Case Western Reserve University; Sharon Lau, M.S., Medical Management
Planning, Inc.; Tracy Lieu, M.D., M.P.H., Harvard Medical School; Jun Ma, M.D.,
R.D., Ph.D., and Kathryn McDonald, M.M., Stanford University; Merle
McPherson, M.D., M.P.H., Michael Kogan, Ph.D., and Stella Yu, Sc.D., M.P.H.,
Maternal and Child Health Bureau; Russell Mardon, Ph.D., and Eric Szaal,
NCQA; Paul Miles, M.D., American Board of Pediatrics; Cynthia Minkovitz,
M.D., M.P.P., Johns Hopkins University; James Perrin, M.D., Harvard Medical
School; Jenna Rabideaux, Health Research and Educational Trust; Denise Remus,
Ph.D., R.N., and Anne Elixhauser, Ph.D., Agency for Healthcare Research and
Quality; Patrick Romano, M.D., M.P.H., University of California, Davis; Ellen
Schwalenstocker, National Association of Children’s Hospitals and Related
Institutions; Lisa Simpson, M.B., B.Ch., M.P.H., University of South Florida;
Anthony Slonim, M.D., M.P.H., Children’s National Medical Center; Michael
Steinman, M.D., Veterans Affairs Medical Center, San Francisco; Patrick Vivier,
M.D., Ph.D., Brown University; Robert Weech-Maldonado, Ph.D., The
Pennsylvania State University; Nora Wells, M.S.Ed., and Connie Sun, Family
Voices; Timothy Whitmire, Ph.D., North Carolina Department of Health and
Human Services; Joanne Wolfe, M.D., M.P.H., Dana-Farber Cancer Institute and
Children's Hospital Boston. We regret that, due to space limitations, we were
unable to include all the information that was provided us.
We thank the staff at The Commonwealth Fund and especially Anne-Marie Audet,
M.D., M.Sc., and Stephen Schoenbaum, M.D., M.P.H., for their advice and support,
and Bill Silberg and the communications team. We also thank The University of
North Carolina School of Public Health for institutional support of this project, and
the staff of the UNC Program on Health Outcomes for their untiring assistance.
We gratefully acknowledge the consultants and advisory board members, whose
names are listed on the credits page, as well as the following reviewers, who
kindly provided comments and advice to help improve the chartbook.
Denise Dougherty, Ph.D., Senior Advisor, Child Health,
Agency for Healthcare Research and Quality
Bernard Guyer, M.D., M.P.H., Zanvyl Kreiger Professor and Chair,
Department of Population and Family Health Sciences,
Johns Hopkins Bloomberg School of Public Health
Jonathan Klein, M.D., M.P.H., Professor, Department of Pediatrics, and
Division of Adolescent Medicine, Strong Children’s Research Center,
University of Rochester School of Medicine
Edward Schor, M.D., Assistant Vice President, The Commonwealth Fund
Barbara Starfield, M.D., M.P.H., University Distinguished Service Professor,
Johns Hopkins Bloomberg School of Public Health
The authors retain sole responsibility for any errors or omissions in the content
of the chartbook.
Cover photography: Roger Carr (top left, top right);
Lynn Johnson (bottom left); Bill Gallery (bottom right)
4
ChildChartbook-Front-D3g.qxd
2/26/04 8:32 AM
Page 5
Summary of Charts and Findings
CHART/TOPIC
D E V E L O P. S T A G E
DATA S O U R C E
FINDINGS
I M P L I C AT I O N S
PAG E
E F F E C T I V E N E S S : S TAY I N G H E A LT H Y
1:1 Receipt of
Recommended
Preventive Health
Care Visits
Early childhood to
adolescence
(3–17 years)
1999 National Survey
of America’s Families
(Yu et al. 2002)
Nearly one-quarter (23%) of children
and adolescents did not have an annual
preventive health care visit at
recommended ages. Adolescents were
less likely to have preventive care visits
than were younger children.
Lack of regular preventive care
represents missed opportunity for
prevention, early detection, and
treatment of health and developmental
problems, and is associated with more ER
visits and hospitalizations.
32
1:2 Immunizations for
Young Children
Early childhood
(19–35 months)
2002 National
Immunization Survey
(CDC 2003b)
One-quarter (25%) of young children
were not up to date on all recommended
doses of five key vaccines nationally.
Among the states, this gap ranged from
one of seven children (14%) in
Massachusetts to more than one-third
(37%) in Colorado.
Unvaccinated children are vulnerable to
infectious disease outbreaks, resulting in
missed school and work days for parents
and additional doctor visits, hospitalizations, and potential deaths.
34
1:3 Guidance on
Childrearing
for Parents of
Young Children
Early childhood
(0–36 months)
1995–1996
Commonwealth Fund
Survey of Parents with
Young Children
(Schuster et al. 2000)
Many parents (38% to 77%) had not
discussed one of six recommended
childrearing topics with a health
professional at appropriate child ages;
more than one-third (37%) had not
discussed any of the six topics.
Many parents (9% to 42%) had not
discussed a topic and wanted more
information about the topic. Unmet
needs for information represent missed
opportunities to promote child and
family well-being and to build positive
patient relationships.
36
1:4 Speech and
Language
Development:
Assessment
and Guidance
Early childhood
(4–35 months)
2000 National Survey of
Early Childhood Health
(Halfon et al. 2002)
Up to one-third (21% to 32%) of parents
reported that their child’s health
professional had not discussed how the
child communicates; more than one-third
(36% to 39%) said that the health
professional had not discussed the
importance of reading to their child.
Lack of discussion represents missed
opportunities to address parent concerns
about development, screen children for
developmental delays, and promote early
childhood literacy development, which is
linked to success in school.
38
1:5 Counseling
Adolescents on
Healthy Behaviors
Adolescence
(fifth through
twelfth grades)
1997 Commonwealth
Fund Survey of the
Health of Adolescents
(Ackard and
Neumark–Sztainer 2001)
Less than one-half of adolescents
reported that they had ever discussed
most recommended health risk topics
(e.g., eating, exercise, smoking, alcohol,
STD, and pregnancy prevention) with
their health professional.
The health system misses many
opportunities to promote healthy
behaviors and help prevent or reduce
risky behaviors in teens. Many teens say
they would like to discuss such
information with their health professional.
40
Leatherman and McCarthy, Quality of Health Care for Children and Adolescents: A Chartbook, 2004. The Commonwealth Fund
5
ChildChartbook-Front-D3g.qxd
2/26/04 8:32 AM
Page 6
Leatherman and McCarthy, Quality of Health Care for Children and Adolescents: A Chartbook, 2004. The Commonwealth Fund
CHART/TOPIC
1:6 STD Screening
for Adolescents:
Chlamydia Infection
D E V E L O P. S T A G E
DATA S O U R C E
FINDINGS
I M P L I C AT I O N S
PAG E
Adolescence
(16–20 years)
2000–2002 HEDIS for
private and Medicaid
managed care plans
(NCQA 2003a)
Among sexually active adolescent females
enrolled in managed care plans, seven of
ten (73%) with private insurance and six
of ten (59%) with Medicaid coverage did
not receive a test for chlamydia infection
in the past year.
Chlamydia infection often goes
undetected. Left untreated, it can lead to
pelvic inflammatory disease and
complications such as chronic pain,
infertility, and problems in pregnancy.
42
Clinicians reduced antibiotic prescribing
at pediatric visits for the common cold by
50 percent from 1991 to 1999. Yet, they
still prescribed antibiotics at one of five
such visits (21%) in 1999 and more often
prescribed broad-spectrum drugs.
Prescribing antibiotics when they are not
necessary accelerates the spread of
antibiotic resistant bacteria, potentially
endangering all patients. Using broadspectrum antibiotics inappropriately makes
the resistance problem even worse.
44
EFFECTIVENESS: GETTING BETTER WHEN SICK OR INJURED
1:7 Inappropriate
Antibiotic
Treatment for the
Common Cold
Early childhood to
early adolescence
(0–14 years)
1991–1999 National
Ambulatory Medical
Care Survey (Steinman
et al. 2003)
EFFECTIVENESS: LIVING WITH ILLNESS
1:8 Prescription of
Preventive
Medication for
Long-Term
Asthma Control
Middle childhood to
adolescence
(5–17 years)
2000–2002 HEDIS for
private and Medicaid
managed care plans
(NCQA 2003a)
Among children and adolescents with
persistent asthma enrolled in managed
care plans, one of three (30% to 35%)
with private insurance and two of five
(38% to 40%) in Medicaid did not receive
a prescription for an appropriate medication to control their asthma in 2002.
Underuse of recommended long-acting
medication results in worse asthma
control, which can lead to more asthma
attacks, activity limitations, missed school
and parent work days, ER visits,
hospitalizations, and potential deaths.
46
1:9 Antibiotics
to Prevent
Infection among
Young Children
with Sickle
Cell Disease
Early childhood
(0–3 years)
1999 Medicaid
administrative claims
and encounter data
for two states (Sox et
al. 2003)
Low-income young children with sickle
cell disease were dispensed an average of
only 148 days (41%) of an expected 365day supply of prophylactic antibiotics.
One of ten (10%) received no antibiotics
during the year.
Young children with sickle cell disease are
highly susceptible to severe and
potentially life-threatening pneumococcal
infections. A randomized controlled trial
demonstrated an 84 percent reduction in
such infections when young children took
daily penicillin.
48
1:10 Monitoring and
Evaluation for
Cystic Fibrosis
Early childhood to
adolescence
(0–17 years)
2002 Cystic Fibrosis
Foundation Patient
Registry Annual Data
Report (CFF 2003b)
One of three children and adolescents
(33%) with cystic fibrosis, a life-shortening
genetic disease, did not receive all
recommended monitoring visits, and up to
one of five (4% to 19%) did not receive
other recommended tests to help direct
treatment and reduce complications.
In a comparison of process and outcomes
of care across cystic fibrosis specialty
centers, children who received care in
accordance with guidelines had better
lung function, an important outcome
associated with survival.
50
6
ChildChartbook-Front-D3g.qxd
2/26/04 8:32 AM
CHART/TOPIC
Page 7
D E V E L O P. S T A G E
DATA S O U R C E
FINDINGS
I M P L I C AT I O N S
PAGE
P A T I E N T S A F E T Y: M U L T I - P E R S P E C T I V E
2:1 Patient Safety
Indicators:
Potential Medical
Mistakes in
Hospitals
Early childhood
to adolescence
(0–17 years)
2000 Healthcare
Cost and Utilization
Project Nationwide
Inpatient Sample
(AHRQ 2003b)
Potentially preventable adverse events
among hospitalized infants, children, and
adolescents ranged from 0.003 per 1,000
patients at risk for transfusion reactions
to 7.67 per 1,000 at risk for decubitus
ulcers (bed sores).
Children and adolescents who experience
potential medical mistakes detected by
Patient Safety Indicators have 2 to 18
times higher hospital death rates and
hospital stays that are 2 to 6 times longer
and 2 to 12 times more costly.
52
2:2 Pediatric
Medication
Mistakes in
the Hospital
Early childhood
to adolescence
(pediatric inpatients)
Clinician report and
chart review at two
hospitals during six
weeks in 1999 (Kaushal
et al. 2001)
Medication mistakes were detected in six
of every 100 medication orders. One of
every five medication mistakes either
caused patient harm or had the potential
to do so. The most frequent mistake was
an incorrect medication dose.
The rate of potential adverse drug events
was three times higher than for adults in
a similar study, suggesting that children
are at greater risk than adults from
potentially harmful medication mistakes.
54
2:3 Hospital-Acquired
Infections
in Pediatric
Intensive
Care Units
Early childhood
to adolescence
(0–17 years)
National Nosocomial
Infections Surveillance
System (NCHS 2001;
NCID 2001; 2003).
The risk-adjusted rate of certain
infections acquired by patients in
pediatric intensive care units declined by
up to 36 percent among hospitals
participating in a national surveillance
system during 1995–2003 compared to
1986–1990.
Hospital-acquired infections can be
reduced through ongoing monitoring and
appropriate infection-control measures,
which can improve patient survival, avoid
unnecessary treatment, and reduce
health care costs.
56
AC C E S S A N D T I M E L I N E S S : M U LT I - P E R S P E C T I V E
3:1 Parent
Perceptions
of Accessibility
and Timeliness
of Care
Early childhood
to adolescence
(0–17 years)
2000 Medical
Expenditure Panel
Survey (AHRQ 2002b)
Parents reported that up to one in five
children and adolescents (12% to 22%)
had problems getting needed care and up
to one-half (36% to 48%) did not always
get care or appointments as quickly as
the parent wanted.
Parents’ perceptions of accessibility of
care may affect care-seeking behavior,
such as whether to use routine primary
care or visit the ER, and decisions related
to selecting or changing physicians and
health plans. Accessibility is linked to
health outcomes.
58
3:2 Regular Source
and Unmet Needs
for Care
Early childhood
to adolescence
(0–17 years)
2000 National Health
Interview Survey
(Blackwell et al. 2003)
Among uninsured children and adolescents,
more than one of four (27%) did not have a
regular source of health care, one of six
(16%) delayed care because of cost, one of
eight (13%) did not get needed health care
because of cost, and one of five (19%) did
not get needed dental care because of cost.
An estimated 7.3 million U.S. children and
adolescents have unmet health and dental
care needs—as perceived by parents—or
delayed care because of cost. Unmet
needs may have long-term effects on
health and developmental outcomes,
leading to more costly care later.
60
Leatherman and McCarthy, Quality of Health Care for Children and Adolescents: A Chartbook, 2004. The Commonwealth Fund
7
ChildChartbook-Front-D3g.qxd
2/26/04 8:32 AM
Page 8
Leatherman and McCarthy, Quality of Health Care for Children and Adolescents: A Chartbook, 2004. The Commonwealth Fund
CHART/TOPIC
3:3 Unmet Need
for Mental
Health Care
D E V E L O P. S T A G E
DATA S O U R C E
FINDINGS
I M P L I C AT I O N S
PAGE
Middle childhood
to adolescence
(6–17 years)
1997 National Survey of
America’s Families
(Kataoka et al. 2002)
Among children and adolescents with
mental health problems severe enough to
indicate a clinical need for mental health
evaluation, four of five (79%) did not
receive a mental health evaluation or
treatment in the past year.
An estimated 7.5 million children and
adolescents have unmet need for mental
health care. Consequences include
preventable suicide, poor academic
performance, substance abuse, and future
unemployment.
62
A C C E S S A N D T I M E L I N E S S : S TAY I N G H E A LT H Y
3:4 Time Since Last
Dental Visit
Early childhood
to adolescence
(2–17 years)
2000 National Health
Interview Survey
(Blackwell et al. 2003)
One of four children and adolescents
(26%) did not receive dental care in the
past year and one of seven (15%) did not
receive any dental care in the past five
years. Minority, low-income, publicly
insured, and uninsured children are less
likely to receive regular dental care.
Dental caries (tooth decay)—the most
common childhood chronic disease—is
largely preventable. Left untreated, tooth
decay can lead to abscesses and infections,
pain, dysfunction, and low weight. One
third of children do not have any private
or public dental insurance.
64
3:5 Timely Initiation
of Prenatal Care
Prenatal development
2001 U.S. birth
certificate data
(Martin et al. 2002)
One of six mothers of live-born babies
(17%) did not start prenatal care in the
first trimester of pregnancy. Among the
states, this gap ranged from one of
eleven mothers (9%) in Rhode Island to
three of ten (31%) in New Mexico.
Late or no prenatal care may lead to
untreated maternal health problems and
lack of timely advice and referrals for
services such as smoking cessation that
can help improve birth outcomes.
66
A C C E S S A N D T I M E L I N E S S / PAT I E N T A N D F A M I LY C E N T E R E D N E S S : L I V I N G W I T H I L L N E S S
3:6 and 3:7 National
Goals for Children
with Special
Health Care
Needs (CSHCN)*
Early childhood
to adolescence
(0–17 years)
2001 National Survey of
Children with Special
Health Care Needs
(CDC 2003d)
One-quarter to one-half (26% to 47%)
of CSHCN lacked adequate access to or
failed to receive well-organized, continuous, coordinated, comprehensive, and
family-centered care. Most teens (94%)
did not receive all recommended services
to support their transition to adulthood.
Improvement is needed in serving
CSHCN to catch health problems early,
keep health problems from worsening,
limit their adverse impact, maintain and
restore normal functioning to the degree
possible, and support successful
transition to adulthood.
68
3:8 Medical Home for
Children with
Special Health
Care Needs
(CSHCN): State
Performance*
Early childhood
to adolescence
(0–17 years)
2001 National Survey
of Children with Special
Health Care Needs
(CDC 2003d)
Among the states, the proportion of
CSHCN who did not receive
coordinated, ongoing, comprehensive,
family-centered care in a medical home
ranged from two of five (39%) in
Massachusetts to three of five (59%) in
the District of Columbia.
CSHCN have more unmet health care
needs and are less satisfied with their
usual source of health care than other
children, even though they are more
likely to have insurance and a regular
care provider.
72
*Data represent children who have a chronic physical, developmental,
behavioral, or emotional condition and who require health and related
services beyond what is usual for children generally.
8
ChildChartbook-Front-D3g.qxd
2/26/04 8:32 AM
CHART/TOPIC
Page 9
D E V E L O P. S T A G E
DATA S O U R C E
FINDINGS
I M P L I C AT I O N S
PAG E
PAT I E N T A N D F A M I LY C E N T E R E D N E S S : M U LT I - P E R S P E C T I V E
4:1 Parent
Perceptions of
Interpersonal
Quality of Care
Early childhood
to adolescence
(0–17 years)
2000 Medical
Expenditure Panel
Survey (AHRQ 2002b)
About one of three parents (32% to
35%) reported that the child’s health
professional did not always communicate
well. More than four of ten parents
(44%) reported that the health
professional did not always spend enough
time with the parent and child.
The quality of parents’ communication
with their child’s health professional may
affect parents’ receptivity to receiving
advice, how they oversee their child’s
compliance with treatment regimens,
perception of time spent with the
clinician, and satisfaction with and
outcomes of care.
74
4:2 Parent-Reported
Problems with
Hospital Care
Early childhood
to adolescence
(pediatric inpatients)
1997–1999 Picker
Institute Pediatric
Inpatient Surveys in 38
hospitals (Co et al. 2003)
Parents reported problems on 18 percent
to 33 percent (average 27 percent) of the
questions that they were asked within
each of seven dimensions of patientcentered quality of care.
Parents’ overall rating of quality
correlated most strongly with being
provided information and partnership in
care. Parents reported relatively more
problems for children than adults
reported about their own hospital care in
a similar survey.
76
PAT I E N T A N D F A M I LY C E N T E R E D N E S S : S TAY I N G H E A LT H Y
4:3 Supporting Family
Well-Being:
Preferences and
Practices
Early childhood
(4–35 months)
2000 National Survey of
Early Childhood Health
(Halfon et al. 2002)
The majority (56% to 94%) of parents of
young children agreed that their child’s
health professional should ask about six
topics related to family well-being. More
than three-quarters (77%) were asked
whether a household member smoked
tobacco. Less than half (10% to 44%)
reported that health professionals had
discussed the other five topics.
Parents potentially agree with a familyoriented approach to pediatric care,
but it is not yet universally accepted in
practice. Parent emotional support and
economic concerns were the topics
exhibiting the greatest divergence
between parent endorsement and
actual discussion.
78
1999 National Survey of
America’s Families (Yu
et al. 2002)
Publicly insured, minority, and poor
children and adolescents were more
likely to receive recommended
preventive health care visits than those
with private or no insurance, white
children, or those with family income
above the poverty level (respectively).
More comprehensive coverage for
preventive care by Medicaid and State
Children's Health Insurance Programs
(SCHIP) probably accounts for higher
rates of preventive care visits among
publicly insured, minority, and poor
children and adolescents.
80
D I S PA R I T I E S : S TAY I N G H E A LT H Y
5:1 Differences in
Receipt of
Preventive Care
Visits by Type
of Insurance,
Race, Ethnicity,
and Income
Early childhood
to adolescence
(3–17 years)
Leatherman and McCarthy, Quality of Health Care for Children and Adolescents: A Chartbook, 2004. The Commonwealth Fund
9
ChildChartbook-Front-D3g.qxd
2/26/04 8:32 AM
Page 10
Leatherman and McCarthy, Quality of Health Care for Children and Adolescents: A Chartbook, 2004. The Commonwealth Fund
CHART/TOPIC
5:2 Income, Racial,
Ethnic, and
Geographic
Differences in
Childhood
Immunizations
D E V E L O P. S T A G E
DATA S O U R C E
FINDINGS
I M P L I C AT I O N S
PAG E
Early childhood
(19–35 months)
1994–2002 National
Immunization Survey
(Eberhardt et al. 2001;
CDC 2003e)
Poor, minority, and urban young children
are less likely than nonpoor, white, and
suburban young children (respectively) to
be up to date on immunizations.
Disparity has narrowed between poor
and nonpoor children and between
Hispanic and white children, but has
widened between black and white
children and between urban and
suburban children.
Poverty and related factors are the “most
powerful and persistent barriers to
timely immunization” of children. Failure
to ensure that vulnerable children were
immunized was a major factor
contributing to the severe measles
outbreak of 1989–1991.
82
DISPARITIES: LIVING WITH ILLNESS
5:3 Racial and
Ethnic Differences
in Asthma
Management
Early childhood to
adolescence
(2–16 years)
1999 survey of parents
of children enrolled
in five Medicaid HMOs
in three states
(Lieu et al. 2002)
Compared to white children, black and
Latino children had similar access to
care. Yet, black and Latino children were
less likely to be regularly using an inhaled
anti-inflammatory medication when
indicated for persistent asthma, even
though they had worse asthma than
white children.
Disparity in asthma medication use
persists even when children are equally
insured. Disparity may reflect
deficiencies in prescribing and patient
adherence as well as the effects of
cultural differences in communication.
Rates of medication use were
unacceptably low among all children.
84
5:4 Gender and
Racial Differences
in Evaluation
and Treatment
for AttentionDeficit/
Hyperactivity
Disorder (ADHD)
Middle childhood
(elementary school age)
1998 survey of
parents and teachers
of children in one
school district
(Bussing et al. 2003)
Most children with symptoms of ADHD
were recognized by their parent as having
behavior problems. Boys were more likely
than girls and white children were more
likely than African American children to
have been professionally evaluated,
diagnosed, and treated for ADHD.
Seeking professional evaluation is a key
factor determining treatment for ADHD.
Girls may be less likely than boys to
manifest behaviors that prompt parents
to seek evaluation. African American
parents are more likely than white
parents to face barriers to seeking help
for their children.
86
5:5 Effect of Family
Income on Parent
Perceptions of
Quality of Care
for Children with
Special Health
Care Needs
(CSHCN)
Early childhood to
adolescence
(0–17 years)
2001 National Survey
of Children with
Special Health Care
Needs (van Dyck 2003;
Blumberg 2003)
CSHCN with family income below the
poverty level were three-and-one-half
times more likely than those with higher
family income to have an unmet need
for health care (32% vs. 9%) and twice
as likely to lack family centeredness
(50% vs. 25%) in the care that they did
receive, according to parent report.
Economically disadvantaged CSHCN
experience the greatest difficulties with
care. Inadequate insurance and other
access barriers such as lack of
transportation may be especially
problematic for low-income families with
special needs children.
88
10
ChildChartbook-Front-D3g.qxd
2/26/04 8:32 AM
CHART/TOPIC
Page 11
D E V E L O P. S T A G E
DATA S O U R C E
FINDINGS
I M P L I C AT I O N S
PAG E
Compared to white parents, ratings were
lower for African American and American
Indian/Alaskan Native parents. Asian and
Hispanic parents who did not speak
English as their primary language gave
significantly lower ratings than both
white parents and their English-speaking
Asian and Hispanic counterparts.
Language barriers and communication
problems figure prominently in disparities
for racial and ethnic minorities. Adverse
consequences of cultural and language
differences in health care for children
may include misdiagnosis,
misunderstanding of treatment
instructions, and inappropriate
medication, testing, and hospitalization.
90
D I S PA R I T I E S : M U LT I - P E R S P E C T I V E
5:6 Effect of Race,
Ethnicity, and
Language on
Parent Assessment
of Accessibility
and Interpersonal
Quality of Care
Early childhood to
adolescence
(0–17 years)
1997–1998 CAHPS
Benchmarking Database
for children enrolled in
Medicaid managed care
plans in six states
(Weech-Maldonado et
al. 2001)
C A PA C I T Y T O I M P R O V E : S TAY I N G H E A LT H Y
6:1 Improving Primary
Care Office
Systems to
Increase
Preventive Care
Early childhood
(0–3 years)
1995–1998 random
samples of medical
records from eight
group practices and
clinics in one
community (Bordley et
al. 2001)
After the intervention, combined rates of
preventive care increased for three of
four goals: being up to date on
immunizations (by 7 to 12 percentage
points), screening for anemia (by 30
percentage points), and screening for
lead poisoning (by 36 percentage points
for performing a risk assessment or
blood testing).
The practices established multidisciplinary teams and received technical
assistance to set objectives, monitor
performance, and adopt or enhance
quality improvement systems including
chart prescreening, risk assessment forms,
flowsheets, prompting and reminder
systems, and patient education materials.
92
6:2 Enhancing
Primary Care
Developmental
Services for
Young Children
Early childhood
(30–33 months)
Parent interviews and
medical records at 15
primary care sites.
Initial enrollment
occurred during
1996–1998 (Minkovitz
et al. 2003)
Compared to those with usual care,
those in Healthy Steps were more likely
to receive recommended preventive and
developmental services, reported more
patient-centered care, had greater
continuity of care, and were less likely to
engage in severe child discipline.
Healthy Steps integrates a trained child
development specialist into primary care
practices to enhance information and
other services such as child
development and family health
checkups, home visits, a telephone
hotline, parent support groups, and
linkage to community resources.
94
6:3 Promoting Lead
Screening for
Medicaid-Insured
Young Children
Early childhood
(1 and 2 years)
1996–1997 medical
records (Vivier et al.
2001); 1995–1996
Medicaid claims data
(GAO 1999)
Four of five Medicaid-insured Rhode
Island children (80%) had ever received a
blood lead test by age 19–35 months,
compared to only one of five children
(21%) ages 1 and 2 years enrolled in
traditional Medicaid in 15 other states.
A multifaceted educational and outreach
strategy includes performance incentives
for health plans and a statewide tracking
system to notify health plans, health
professionals, and clinics of children who
are in need of screening.
96
Leatherman and McCarthy, Quality of Health Care for Children and Adolescents: A Chartbook, 2004. The Commonwealth Fund
11
ChildChartbook-Front-D3g.qxd
2/26/04 8:32 AM
Page 12
Leatherman and McCarthy, Quality of Health Care for Children and Adolescents: A Chartbook, 2004. The Commonwealth Fund
CHART/TOPIC
D E V E L O P. S T A G E
DATA S O U R C E
FINDINGS
I M P L I C AT I O N S
PAG E
6:4 Improving Delivery
of Adolescent
Preventive Care
in Community
and Migrant
Health Centers
(CMHCs)
Adolescence
(14–19 years)
1995–1997 surveys of
poor and/or uninsured
adolescents visiting five
CMHCs for well-child
care (Klein et al. 2001)
After CMHCs implemented the
Guidelines for Adolescent Preventive
Services (GAPS), rates of screening and
counseling were higher (by 10 to 29
percentage points) than before the
intervention for 19 of 31 content areas.
CMHCs received training and technical
assistance and made improvements in
care delivery including scheduling 30minute well-child visits, encouraging
confidential counseling time, using a
patient questionnaire to screen for
health risks, and enhancing patient
education materials and referral
networks when possible.
98
6:5 Improving
Screening for
Chlamydia among
Adolescent
Girls Seen at
HMO Clinics
Adolescence
(14–18 years)
2000–2002 patient
encounter and
laboratory data
for visits to 10 pediatric
HMO clinics (Shafer
et al. 2002)
After the intervention, the proportion of
girls screened for chlamydia infection
increased significantly in the intervention
clinics (from 5% to 65%) and was
significantly higher than in the usual care
clinics (21%).
The intervention included team
development to identify and address
barriers, performance monitoring, and
clinical practice improvements such as
flowcharts, universal urine specimen
collection, and an educational campaign.
100
Among children who visited in both the
baseline and intervention years, there
was a relative intervention effect of 12
percent to 16 percent fewer antibiotics
dispensed in the intervention practices,
beyond the change in antibiotic use in the
control practices.
The intervention involved peer-led
physician education and performance
feedback combined with educational
materials mailed to parents and displayed
in clinic waiting rooms.
102
Children in the intervention group were
more likely than those in the control
group to receive influenza immunization.
Anti-inflammatory medication use
increased and ER visits and
hospitalizations decreased in the
intervention group but not in the control
group. Annual average health care
charges declined $543 more per child in
the intervention group.
The intervention group children and their
caregiver received individual asthma selfmanagement education and a written
action plan for exacerbations. An
outreach nurse contacted children once a
month to monitor their status, review
medications, refill prescription, schedule
follow-up care, and assist with
transportation needs. The nurse also
coordinated with school personnel.
104
CAPACITY TO IMPROVE: GETTING BETTER WHEN SICK OR INJURED
6:6 Reducing
Unnecessary
Antibiotic Use
Among Young
Children in HMOs
Early to middle childhood
(3 months to 6 years)
1996–1998 pharmacy
claims for children
visiting 12 urban
and suburban clinics
affiliated with two
HMOs (Finkelstein
et al. 2001)
CAPACITY TO IMPROVE: LIVING WITH ILLNESS
6:7 Education
and Outreach
to Improve
Asthma Care
and Outcomes
at an Inner-City
Hospital
Specialty Clinic
Early childhood
to adolescence
(2–16 years)
1999 interviews with
parents and medical
records of Medicaidinsured children at an
inner-city hospital
specialty clinic (Kelly
et al. 2000)
12
ChildChartbook-Front-D3g.qxd
2/26/04 8:32 AM
CHART/TOPIC
6:8 Improving
Diabetes
Outcomes
Through Coping
Skills Training
Page 13
D E V E L O P. S T A G E
DATA S O U R C E
FINDINGS
I M P L I C AT I O N S
PAG E
Adolescence
(12–20 years)
1995–1998 clinical data
and youth self-reports
(Grey et al. 1999, 2000)
Teens in a coping skills training group
achieved better blood sugar control and
improvement in their quality of life as
compared to a similar group of teens
engaged in intensive diabetes
management only.
Nurses led teens in social problem
solving and cognitive behavior
modification training to promote
adherence to intensive therapy without
compromising peer relationships. Each
teen attended six small group sessions
with monthly follow-up.
106
The average rate of nosocomial
coagulase-negative staphylococcus
infections in very low birthweight infants
declined to a level 44 percent lower than
before the intervention. The change was
significantly different from the trend at
comparison NICUs and yielded $9 in
savings for every $1 invested.
Multidisciplinary teams from the six
NICUs engaged in a collaborative process
that included training on quality
improvement, agreeing on common goals
and metrics, reviewing performance data,
developing a list of “potentially better
practices” for improvement, and site
visits to benchmark performance and
stimulate shared learning.
108
C A PAC I T Y T O I M P R OV E : PAT I E N T S A F E T Y
6:9 Decreasing
Infections
Acquired in
the Neonatal
Intensive Care
Unit (NICU)
Early childhood
(neonatal period)
1994–1997 data from six
neonatal intensive care
units of the Vermont
Oxford Network
(Horbar et al. 2001;
Rogowski et al. 2001)
Leatherman and McCarthy, Quality of Health Care for Children and Adolescents: A Chartbook, 2004. The Commonwealth Fund
13
ChildChartbook-Front-D3g.qxd
2/26/04 8:32 AM
Page 14
ChildChartbook-p1to30.qxd
3/22/04 10:05 AM
Page 15
Introduction and Overview
Advances in public health and health care have resulted in
remarkable improvement in the health of America’s children over
the past century. To cite two telling examples: infant and child
death rates have dropped dramatically (Brown et al. 2003) and
advances in treatment mean that most children diagnosed with
cancer now survive (Ries et al. 2003). Yet, serious challenges
remain to improve health care for America’s children.*
T H E Q U A L I T Y O F C H I L D R E N ' S H E A LT H C A R E T O D AY
A mixed picture emerges in comparisons to other
industrial nations. U.S. children fare comparatively worse on
measures of process and outcomes of care that depend on good
primary care, such as timely immunizations (OECD 2003) and
post-neonatal mortality (Starfield and Shi 2002). Children in the
U.S. benefit from earlier introduction of some high-technology
care, such as advanced cancer treatment (La Vecchia et al. 1998).
Although the U.S. has more neonatal intensive care services per
capita than three other highly developed English-speaking nations
(Australia, Canada, and the United Kingdom), the U.S. does not
achieve better comparative (birthweight-specific) neonatal
mortality outcomes. Infant mortality is higher in the U.S. even
among normal birthweight infants. Reducing the U.S. mortality
rate among these infants to that of Canada would prevent 3,000
deaths annually (Thompson et al. 2002).
*For narrative simplicity, we use the term children generically in this introduction
to mean both children and adolescents, unless the context indicates otherwise.
This convention should not be interpreted to minimize the unique health care
needs of adolescents, which are examined in several charts.
One-quarter to three-quarters of children do not receive
the health care that is scientifically proven and/or that
experts recommend to prevent disease, reduce disease
complications, and achieve optimal health and
development. For example: one-quarter of young children are
not fully up to date on their immunizations (Chart 1:2), up to onethird of parents of young children are not asked about their child’s
speech and language development (Chart 1:4), less than half of
adolescents discuss health behaviors with their clinician (Chart
1:5), up to three-quarters of sexually active adolescent girls do not
receive chlamydia screening (Chart 1:6), one-third of children with
persistent asthma do not get a prescription for long-acting
medications to control their asthma (Chart 1:8), and low-income
young children with sickle cell disease do not regularly receive
antibiotics to help prevent serious infections (Chart 1:9).
Up to one of five pediatric patients receives inappropriate
care. For example, 21 percent of pediatric patients visiting the
doctor for the common cold are prescribed antibiotics (Chart 1:7).
Several studies have found that 2 percent to 11 percent of pediatric
hospital admissions and 4 percent to 22 percent of the days that
children spent in the hospital were unnecessary (Kemper 1988;
Kreger and Restuccia 1989; Payne et al. 1995; Waldrop et al. 1998).
Some pediatric patients experience medical mistakes and
acquire infections in the hospital that can result in
harm (Charts 2:1 to 2:3). These children have longer and more
costly hospital stays and higher hospital death rates. Fortunately,
Leatherman and McCarthy, Quality of Health Care for Children and Adolescents: A Chartbook, 2004. The Commonwealth Fund
15
ChildChartbook-Front-D3g.qxd
2/26/04 8:32 AM
Page 16
Leatherman and McCarthy, Quality of Health Care for Children and Adolescents: A Chartbook, 2004. The Commonwealth Fund
some hospitals have demonstrated improvement in patient safety
over the past decade (Chart 2:3).
Health care for many children is not always accessible,
timely, or patient-centered. For example, up to one of five
children has problems getting needed care, one of four does not
get annual dental care (Chart 3:4), four of five in need of a mental
health evaluation do not receive any mental health care (Chart
3:3), and up to one-half of children with special health care needs
do not receive well-organized, continuous, coordinated,
comprehensive, family-centered care (Charts 3:6 to 3:8).
Poor, minority, and/or uninsured children experience
disparities in health care. For example, poor, minority,
and/or uninsured children are more likely than their counterparts
to have incomplete immunizations (Klevens and Luman
2001)(Chart 5:2), inadequate dental care (Chart 3:4), unmet
needs for care (Charts 3:2, 3:3, and 5:5), long waits at the doctor’s
office or clinic (Newacheck et al. 1996), and hospitalizations that
might be preventable through better outpatient management
(Parker and Schoendorf 2000). Minority children are less likely
than white children to receive proven treatments, such as
medications to control asthma and ADHD (Charts 5:3 and 5:4),
anti-depressants and specialty care for depression (Richardson et
al. 2003), and placement on the waiting list for a kidney
transplant (Furth et al. 2000).
Geographic variations have been documented in the
provision, quality, and availability of several health care
services for children, including: immunizations (Chart 1:2),
neonatal intensive care resources (Goodman et al. 2002),
tonsillectomy (Wennberg and Gittelsohn 1982), mental health
services (Sturm et al. 2003), preventable hospitalizations (Parker
and Schoendorf 2000), prenatal care for pregnant women (Chart
3:5), and a “medical home” for children with special health care
needs (Chart 3:8). These variations appear to reflect factors
unrelated to the need for services, such as differences in local
practice style and the social, market, and policy environment.
Systematic efforts must be directed toward improving the
quality, availability, and equity of health care services
for children to ensure continuing progress in
improving their health. Less attention has been devoted to
measuring and reporting on quality of care for children than for
adults. The quality of health care for adults is not necessarily a
good proxy for the quality of health care for children, however
(for examples, see narratives for Charts 2:1 to 2:3). Since
measurement is a prerequisite to improvement, this discrepancy
in quality measurement puts children at a relative disadvantage to
adults in improving health care quality.
Children have unique health and developmental needs that can
make them vulnerable to adverse effects of poor quality health care,
which in turn has implications for their life course. Many health
conditions that manifest in adulthood have their origins in
childhood; likewise, health behaviors begun in childhood often
persist into adulthood. Hence, it makes little sense to subordinate
the quality of children’s health care to that of adults, when the health
of adults depends in part on the quality of health care that they
received as children (Forrest et al. 1997).
16
ChildChartbook-Front-D3g.qxd
2/26/04 8:32 AM
Page 17
Through this chartbook, we join with others in seeking to raise
greater public awareness of the state of health care quality for
children and adolescents. As a compendium of data and
interpretation, it illustrates both successes achieved to date and
gaps warranting improvement. We provide practical guidance,
based on scientific evidence and expert recommendations, to help
policymakers, health care professionals, and patient advocates
consider what actions might be taken to better meet the unique
needs of children and adolescents in the future.
D E F I N I N G Q UA L I T Y O F H E A LT H C A R E
FOR CHILDREN
Differences between children and adults. When
conceptualizing quality of health care for children, one must not
think of children as simply “little adults.” Health and health care
are different for children than for adults in numerous ways, with
implications for quality measurement (Jameson and Wehr 1993;
Forrest et al. 1997; Gidwani et al. 2003).
1. Children have different demographics than adults, which
may accentuate socioeconomic, racial, and ethnic disparities
in health care. Proportionally more children than adults are
poor and of minority race and ethnicity, which puts them at a
disadvantage in obtaining health care and achieving good
health (Starfield 1997). Minority children—who represent onequarter of all children today and are projected to comprise
nearly half of all children by the year 2025—may face cultural
and language barriers to care (Federal Interagency Forum
2003)(Chart 5:6).
2. Children undergo rapid and continuous developmental
change—cognitive, emotional, social, and physical—such that
health issues and appropriate services change with age and general
developmental stage. Although all children have inherent
developmental vulnerabilities, some children face greater
vulnerability from adverse social conditions (Halfon and
Hochstein 1997). Many health promotion and preventive services
are recommended for children to foster healthy development and
to identify developmental vulnerabilities and risks warranting
early intervention (Chart 1:4).
3. Children have different disease patterns and manifestations
than adults. Children typically experience many short or recurrent
illnesses, but most are generally healthy. Death is a relatively rare
event, caused chiefly by injury and accidents. Whereas many
adults are affected by a relatively small number of chronic
conditions, a minority of children are affected by a relatively large
number of rare diseases that are “usually related to birth or
congenitally acquired conditions, rather than the degenerative
conditions that affect adults” (Halfon and Hochstein 1997). Even
when children experience the same diseases as adults, they do so
in different ways requiring special approaches to diagnosis and
treatment (Palmer and Miller 2001).
Changes in families and society are putting children—and
especially adolescents—at risk of “new morbidities” such as
alcohol and drug abuse, unsafe sexual practices, exposure to
violence, and growing childhood obesity, with consequences for
their long-term health and success in life (Carnegie 1995;
Haggerty 1995). Addressing these issues requires coordinated and
ongoing preventive effort among multiple sectors including but
transcending health care.
4. Children are dependent on their parents or other caregivers to
foster a safe and healthy home environment and to obtain health
Leatherman and McCarthy, Quality of Health Care for Children and Adolescents: A Chartbook, 2004. The Commonwealth Fund
17
ChildChartbook-Front-D3g.qxd
2/26/04 8:32 AM
Page 18
Leatherman and McCarthy, Quality of Health Care for Children and Adolescents: A Chartbook, 2004. The Commonwealth Fund
care and adhere to treatment regimens. In many ways, the child’s
family can be considered the “patient” in child health care
encounters (Szilagyi and Schor 1998). This dynamic creates
challenges for including children appropriately in communication
with health professionals and addressing parents’ health problems
that may affect children (Gidwani et al. 2003)(Chart 4:3).
Dependency decreases with age: adolescents need confidential
time with a health professional to discuss risky health behaviors
and their prevention (Klein and Auerbach 2002)(Chart 1:5).
5. Children often rely on different sources of coverage and
systems of care than adults. Proportionally more children than
working-age adults are insured by public programs such as
Medicaid and State Children’s Health Insurance Programs (Mills
and Bhandari 2003). Nearly two-thirds of physician office visits by
children and adolescents are with general pediatricians (Freed et
al. 2004). Many also receive services through school-based and
community clinics, public health agencies, children’s hospitals,
and an array of special federal and state programs that are often
not well coordinated (Halfon et al. 2001). Children also may
receive care in facilities or be treated with equipment that is not
ideally suited or appropriate for children, potentially
compromising the quality of their care (Palmer and Miller 2001).
Typology of quality and quality measures. Different
stakeholders have varying interests and needs with regard to the
definition of quality and application of quality measurement for
purposes of accountability, improvement, and decision-making.
At a fundamental level, quality can be conceived of and measured
in terms of structure, process, and outcomes (Donabedian 1980).
Structural quality refers to the effect of health system
attributes on the availability and provision of services. Attributes
such as organizational leadership, culture, and information
systems are important in determining the success of efforts at
quality improvement (Ferlie and Shortell 2001). Other attributes,
such as the availability and types of health care providers and
insurance coverage, are the result of market forces and public
policy. One important example in this chartbook shows that
children (ages 3 and older) covered by public insurance such as
Medicaid are more likely than privately insured children to receive
annual preventive health care visits, probably because of more
comprehensive coverage under Medicaid (Chart 5:1).
Process quality refers to the technical proficiency and the
interpersonal facets of interactions with patients. To improve
quality, physicians need to know what processes of care—
diagnosing, treating, and educating patients—achieve better
outcomes under given circumstances (Hammermeister et al.
1995). Establishing a firm cause-and-effect link between process
and outcome of care is often difficult for children's health care,
however. Ethical concerns and the small number of children
affected by many conditions mean that randomized controlled
trials are infeasible in many cases. Hence, many services or
interventions for children must be evaluated in actual practice
using nonexperimental study designs that are often challenging to
conduct well (Kaplan et al. 2001).
Outcomes refer to the results of health care on children’s
development, well-being, and family satisfaction. Outcomes often
are difficult to measure for children because of the natural range
of developmental variability, the length of time before some
18
ChildChartbook-Front-D3g.qxd
2/26/04 8:32 AM
Page 19
outcomes manifest, and, in some cases, their rare occurrence.
Measuring proxy or intermediate outcomes—such as lost school
days, activity limitation, changed behaviors, and preventable
adverse events—is often necessary (Christakis et al. 2001b).
The Institute of Medicine has formulated a widely accepted
definition of health care quality that integrates these concepts:
“Quality of health care is the degree to which health
services for individuals and populations increase the
likelihood of desired health outcomes and are consistent
with current professional knowledge” (IOM 1990).
“Consistent with current professional knowledge” means
following “the best available scientific evidence concerning the
processes of care that are likely to improve outcomes” (Palmer and
Miller 2001). For children, lack of strong scientific evidence for the
effectiveness of many health care services means that clinical quality
measures must often rely on expert opinion (Schuster et al. 1997).
“Desired health outcomes” means that both societal values and
individual preferences must be considered in the context of
children’s dependency. The former implies a duty of protecting
children from harm and providing life-saving treatment when
needed. The latter implies the need for good communication,
shared decision-making, and cultural sensitivity in interpersonal
interactions between the health professional and the parent and
child, as appropriate to the child’s age and developmental
maturity (Schuster and McGlynn 1999).
C H A L L E N G E S A N D C O N S I D E R AT I O N S
I N M E A S U R I N G Q UA L I T Y O F H E A LT H C A R E
FOR CHILDREN
The issues described above have several consequences for
conducting quality measurement for children.
Lack of evidence raises questions about boundaries for
quality measurement. What level of evidence to require for a
quality measure is a thorny issue for children’s health care. Quality
measurement should be comprehensive to fairly reflect the current
state of knowledge and practice. Quality measures must be based
on scientifically sound evidence and professional consensus, be
relevant to intended users, and feasible to implement with
available data. These criteria cannot always be met for measures of
child health care quality. For example, the National Committee
for Quality Assurance recently abandoned its effort to develop a
measure of appropriate treatment for childhood ear infection
because the evidence was not sufficient to support it (MangioneSmith et al. 2003).
The RAND Quality Assessment Tools used expert panels to rate
the validity and feasibility of outpatient quality indicators
(McGlynn et al. 2000). Less than one-fifth (18%) of the final
indicators selected for children could be based on strong evidence.
By comparison, two-fifths (40%) of indicators for women and
nearly three-fifths (59%) for cancer and HIV care were based on
rigorous evidence. The authors note that this approach “does not
eliminate the goal of basing indicators on the strongest possible
evidence, but it does suggest that it may be necessary to set more
modest expectations for the level of evidence that will be
available” (Schuster et al. 1997).
Leatherman and McCarthy, Quality of Health Care for Children and Adolescents: A Chartbook, 2004. The Commonwealth Fund
19
ChildChartbook-Front-D3g.qxd
2/26/04 8:32 AM
Page 20
Leatherman and McCarthy, Quality of Health Care for Children and Adolescents: A Chartbook, 2004. The Commonwealth Fund
Expert recommendations often leave questions of
interpretation for quality measurement. Expert
recommendations for health supervision (well-child visits) specify
many topics for behavioral counseling but not their relative
importance or precise timing for discussion over a series of visits.
Some topics may warrant repeated discussion with patients at each
visit (e.g., current sexual activity for teens), whereas other topics
might be tailored for discussion based on the needs and health
risks of individual patients and families at particular visits (Epner
et al. 1998; Downs and Uner 2002). This variability can make it
difficult to interpret rates of discussion. Additional research is
needed on the best way to measure quality of preventive services
for children, such as whether to adjust rates to reflect patients’
reported health risks and needs.
Many adolescents and parents say that they want more
information from their health professional on recommended
health behavior and childrearing topics, and many parents say
they would be willing to pay more for it (Schuster et al. 2000;
Klein and Wilson 2002)(Chart 1:3). This kind of feedback appears
to validate expert recommendations from a patient- and familycentered perspective, but it must be interpreted with caution.
Schuster and colleagues note that some individuals may have an
“insatiable” demand for information. Hence, data that may reflect
a desire for more information may not reflect inadequate
discussions with a clinician.
Quality measurement is influenced by policy and market
issues. For this chartbook, we take a broad approach to show
where quality is falling short of an ideal, whether because of
public policy or market constraints, insurance coverage and
benefit limits, organizational management, or clinical practice.
The services available in a community and the time available for
clinical encounters are to some degree a function of policy and
market factors. Health systems and health care providers may
reasonably argue that they should be held accountable only for
the care that purchasers, consumers, and the community are
willing and able to fund.
Quality of personal health care services is too narrow a
focus for children. Addressing the needs of vulnerable
children and those at risk of social and behavioral challenges
requires a multi-sectoral approach involving health care providers
as well as community organizations including schools, social
services and public health agencies, and voluntary organizations.
Hence, quality measurement for children needs to account for
expected collaboration and coordination among various sectors.
Several communities have produced community health report
cards to promote a more comprehensive view of children’s health
needs (Halfon et al. 1998). An accepted set of standardized,
systems-level community quality indicators is needed to
encourage broader community accountability for children’s health
outcomes (DuPlessis et al. 1998).
A paucity of representative data for children makes it
difficult to report comprehensively on quality. National
and state-specific sources of data often do not provide data
needed for quality measurement for the child population. For
example, there are no nationally representative data to monitor
diabetes trends and treatment among youth. Many quality
measures and instruments have been developed for children’s
health care, but they are not evenly available across all quality
domains nor are they regularly used (Beal et al. 2004).
20
ChildChartbook-Front-D3g.qxd
2/26/04 8:32 AM
Page 21
Several promising efforts are under way to improve the data,
tools, and methods of quality measurement for children, such as
the Child and Adolescent Health Measurement Initiative
(CAHMI), the National Initiative for Children’s Healthcare
Quality (NICHQ), the Pediatric Research in Office Settings
(PROS), the Pediatric Prevention Network (PRN), and new
national surveys on children’s health and health care being fielded
by the federal government. Better data should be possible going
forward assuming adequate funding to repeat surveys on a regular
basis and to analyze and report on the results.
A condition-specific approach to quality measurement for
children leaves many gaps. Quality of care often cannot be
validly measured or compared between different health care
systems or providers for specific rare health conditions because of
small numbers. One approach is to aggregate quality scores into
composite measures of specific aspects of care across different
clinical conditions (McGlynn et al. 2001). Another approach is to
use noncategorical or generic measures of quality, such as unmet
health care needs (Charts 3:2 and 3:3) and the degree to which
children receive care within a “medical home” (Chart 3:8). There
is growing interest in measuring child and family functioning and
quality of life (see Chart 6:8 for one example). Two recent reviews
identified a number of generic quality-of-life instruments for
children and adolescents, though only a few have been tested
adequately (Eiser and Morse 2001; Schmidt et al. 2002). The use
of such outcomes measures in quality evaluation for children
deserves further research.
The child’s perspective is often ignored, but is important
to quality measurement. Children often have a different
perspective on their health and health care than either parents or
physicians, yet the child’s perspective is often ignored, both in
practice and in research, which may lead to biased information
(Gidwani et al. 2003). Asking parents to rate the experience of care
for adolescents is especially problematic, because adolescents may
receive confidential care and care in school- or community-based
settings about which parents may have limited knowledge. Health
status measures have been developed that include the child or
adolescent’s perspective (Starfield et al. 1995; Landgraf et al. 1999;
Varni et al. 2001). Additional research is needed on appropriate
survey instruments that can be used to obtain the multifaceted
perspective of parents, children, and health professionals
regarding the quality of children’s health care (Mangione-Smith
and McGlynn 1998).
A SYSTEMS APPROACH TO IMPROVING
Q UA L I T Y O F H E A LT H C A R E F O R C H I L D R E N
Improving performance requires systematic approaches to
evaluate and incorporate evidence into practice, more effective
education for patients and practitioners, and more rigorous
methods of assessment and accountability. As the Institute of
Medicine reported, “no one clinician can retain all the
information necessary for sound, evidence-based practice” (IOM
2001a). Effective quality improvement initiatives provide both
feedback on performance and the tools needed by health care
providers and systems of care to “close the gap” between current
and desired level of performance.
There is a rapidly growing literature that identifies causes of
poor quality and/or barriers to improvement and that
recommends actions that may be effective in overcoming them.
Leatherman and McCarthy, Quality of Health Care for Children and Adolescents: A Chartbook, 2004. The Commonwealth Fund
21
ChildChartbook-Front-D3g.qxd
2/26/04 8:32 AM
Page 22
Leatherman and McCarthy, Quality of Health Care for Children and Adolescents: A Chartbook, 2004. The Commonwealth Fund
Lack of priority for children’s health care quality. A relative
shortage of credible quality data or children’s health may be
explained by the common method of prioritizing quality issues
based on cost and prevalence. Given that children suffer from
many rare conditions and their expenditures per capita are less
than for adults, issues related to child and adolescent health care
may be undervalued. An alternative approach would be to
prioritize based on “services that modify health states and
behaviors that predispose individuals to future morbidity and
mortality” (Forrest et al. 1997).
Fragmentation of health care delivery and financing. The
current array of health care services and programs for children has
been characterized as a “non-system” of care that is often difficult
for families to navigate (Grason and Morreale 1997; Krauss et al.
2001). Improvement strategies proposed by experts (Halfon and
Hochstein 1997; Halfon et al. 2001) include:
• decategorizing separate federal and state funding programs to
promote greater integration of services;
• consolidating state programs to create a package of enhanced
services that “wrap around” basic private and public insurance
coverage for vulnerable children; and
• developing new integrated care models, such as a childspecific version of the social health maintenance organization.
Lack of awareness or agreement. Physicians may not follow
guidelines for children’s health care because few have been
rigorously evaluated to establish their validity in improving
outcomes (Cabana and Flores 2002). Even when a guideline is
well supported by evidence (such as for asthma medications),
health professionals may not practice in accordance with the
guideline because they lack knowledge of or are not in agreement
with it (Cabana et al. 1999). Strategies to promote evidence-based
guidelines include:
• developing more salient formats and using multiple modes
for communicating guidelines (Flores et al. 2000);
• instituting one-on-one education and performance feedback
delivered by peer leaders (Davis and Taylor-Vaisey 1997); and
• involving physicians in the change process, e.g., teaching
quality improvement skills, educating about the problem to
be solved, enlisting participation on teams (Greco and
Eisenberg 1993)(Charts 6:4, 6:5, and 6:9).
Insufficient time and reimbursement. Adequate time and
reimbursement are necessary but not sufficient to ensure that
comprehensive, patient-centered care will be delivered. Increasing
visit length was associated with increased preventive service
delivery in the context of one quality improvement intervention
(Klein et al. 2001)(Chart 6:4). Given current fiscal constraints,
other strategies that experts (Berry et al. 2003) have proposed to
address these issues include:
• redesigning care processes, appointment scheduling, and
patient flow to use time more productively;
• making greater use of innovations to extend professional
resources such as group well-child care and telephone and
electronic communications to supplement face-to-face
encounters; and
• expanding roles for mid-level practitioners as members of the
care team (Charts 6:2, 6:7, and 6:8).
22
ChildChartbook-Front-D3g.qxd
2/26/04 8:32 AM
Page 23
Insufficient professional skill or confidence. Physicians may
recognize their responsibility for improved performance but lack
the necessary skill or confidence that they can apply a skill (Cheng
et al. 1999). Passive continuing medical education is rarely
effective in changing outcomes (Davis et al. 1995). Strategies for
improvement may include:
• enhanced medical education incorporating quality
improvement skills as a core competency (IOM 2003b);
• interactive skills training that permits “skills rehearsal” (Clark
et al. 1998; Thomson O’Brien et al. 2001);
• decision support tools and computerized prompts to help
clinicians apply evidence (Balas et al. 2000; Bates et al. 2003); and
• quality improvement-focused peer review (Ramsey et al.
1993) and other opportunities for professionals to receive
coaching and feedback.
Insufficient systems and supports for improvement. Small
health plans, community hospitals, clinical practices, and solo
practitioners may not have the operational capacity to implement
changes in systems or practices (Dickey and Kamerow 1996; Ferris
et al. 2001). Enablement strategies may include:
• providing technical assistance on quality improvement and
information technology solutions (Chart 6:1);
• collaborating with other organizations to develop and test
solutions (Kilo 1999)(Chart 6:9); and
• disseminating toolkits and templates that can be adapted for
local use to improve the care process and support
organizational assessment and change (Charts 6:2 and 6:4).
For example, the National Initiative for Children’s Healthcare
Quality partnered with the Pediatric Research in Office Settings
network to pilot test tools for improving the evaluation and
management of children with asthma and ADHD. The American
Academy of Pediatrics has incorporated these tools into an online
learning program called Education in Quality Improvement for
Pediatric Practice (McInerny et al. 2003). Through lessons learned
from national implementation efforts, the American Medical
Association’s Guidelines for Adolescent Preventive Services (GAPS)
have expanded into a broader, adaptable model that includes a
“train the trainers” program and tools to help local entities plan
and implement improvement (Fleming et al. 2001)(Chart 6:4).
Insufficient motivation for change. Health plans and
practitioners may lack incentives to adopt innovations and to
improve their performance—or worse, may face perverse
incentives that discourage them from doing so (Casalino et al.
2003; Leatherman et al. 2003). Potential solutions include:
• using innovative financial and contractual mechanisms to
create incentives that reward improvements in quality
(Shortell et al. 2001; Dyer et al. 2002);
• reporting publicly on quality to create market demand and
accountability for improvement (Hibbard et al. 2003); and
• promoting organizational cultures that encourage and reward
innovation (Berwick 2003).
For example, some Medicaid programs are combining public
performance reporting with increased reimbursement for
improved quality of care for children (Silow-Carroll 2003). Some
insurers are paying pediatricians who complete the Education in
Leatherman and McCarthy, Quality of Health Care for Children and Adolescents: A Chartbook, 2004. The Commonwealth Fund
23
p24-CalloutForPDF.qxd
3/22/04 12:42 PM
Page 24
Leatherman and McCarthy, Quality of Health Care for Children and Adolescents: A Chartbook, 2004. The Commonwealth Fund
Quality Improvement for Pediatric Practice course described
above (McInerny et al. 2003). The American Board of Pediatrics
has adopted an emphasis on assessment and improvement of
quality of care as a requirement for ongoing board certification
(Stockman et al. 2003). Incentives for patients may include
reducing out-of-pocket costs for preventive services such as
immunizations (Briss et al. 2000).
Evaluating and sustaining the gains. Quality improvement
interventions must be evaluated to determine whether and when
they are cost effective in achieving their aims for improving
outcomes and patient experience. Many interventions are
evaluated on a relatively short-term basis; a critical challenge is to
ensure that these gains are sustained over time through ongoing
monitoring and reinforcement. Some examples in the Capacity to
Improve section illustrate that gains may be variable in different
settings, so interventions should be evaluated across multiple
institutions or practices whenever possible (for example, see Charts
6:1 and 6:9). Such an approach also can help ensure that the
intervention design is replicable by other organizations.
Finally, several of the issues described above may be
relevant to a particular quality issue. For example, gaps in
clinical quality for medications to control asthma (Chart 1:8) and
antibiotic prophylaxis for children with sickle cell disease (Chart
1:9) appear related to both lack of professional compliance with
evidence-based guidelines and lack of parent adherence to
obtaining prescription refills or administering medications to their
children. These gaps may reflect both potential access barriers and
insufficient partnership to educate parents and children.
CONCLUSION
Given society’s collective aspiration to improve the well-being of
children, optimizing health care for children must be a national
priority. Efforts at quality measurement to date suggest that the
health care system is missing many opportunities to do so.
Although in some cases knowledge and tools remain limited and
in need of advancement, in many other cases the nation is simply
failing to apply what is known and to use the tools and strategies
already available to improve care.
The examples in the Capacity to Improve section demonstrate
that improvement and innovation in health care delivery are
possible when health professionals, health plans, and others have
the motivation and resources to apply the tools of quality
improvement. The challenge is to provide the means and
incentives for such improvement to occur as a matter of course.
Because good data often are lacking on quality of health care
for children, this undertaking was a challenging exercise that
undoubtedly leaves many unanswered questions. It is our hope
that it will spur progress toward more robust research and
reporting in the future. Research is urgently needed to establish
the effectiveness of many recommended services for children,
identify the processes and systems that promote improved
outcomes, and expand the data, methods, and tools for measuring
quality of care for children more comprehensively.
–––––––
We'd like to know what you think about this chartbook. To take a short,
anonymous user survey, click on the following link or copy the address
into your Web browser: http://64.73.28.22/s.asp?u=50446418798.
Or, e-mail [email protected] to receive an invitation to take the
survey. You can also view and download the chartbook through the
Commonwealth Fund Web site (www.cmwf.org).
24
ChildChartbook-Front-D3g.qxd
2/26/04 8:32 AM
Page 25
Methods and Organization of the Chartbook
DEVELOPMENT PROCESS
The charts selected for this chartbook are intended to represent
the best available published data in terms of relevance to policy,
representativeness or generalizability of the results, scientific
soundness of measures, balance in depicting various aspects of
quality, and feasibility for presentation in chart format. Because of
limitations in data (described in the previous section), the
chartbook does not present a comprehensive picture. The number
of charts was limited by our available resources and our sense for
a manageable amount of information of interest to a wide
audience. Our process was as follows:
1. We first reviewed the general literature on children’s quality of
care and synthesized available frameworks for organizing and
presenting such information. We solicited feedback on our
approach from a number of recognized experts and organizations
involved in pediatric health care quality.
2. We conducted a literature review using PubMed and searches of
bibliographies to identify potential studies of interest, focusing on
relatively recent data published since 1998 (the ending date of a
prior review conducted for the IOM Crossing the Quality Chasm
report). Topics were drawn from several existing quality
measurement frameworks including:
• The RAND Quality Assessment Tools for children and
adolescents, which were rated for validity and feasibility by a
pediatric expert panel (McGlynn et al. 2000).
• The Child and Adolescent Health Measurement Initiative
framework and tools, developed by the Foundation for
Accountability in collaboration with other organizations.
• The Pediatric Excellence in Health Delivery System Framework,
developed by the National Association of Children’s Hospitals
and Related Institutions.
• The Quality Framework for State Child Health Insurance
Programs, developed by the Foundation for Accountability,
and the State Children’s Health Insurance Program Evaluation
Tool, developed by the American Academy of Pediatrics.
• The State of Managed Care Quality, which presents HEDIS
measures developed by the National Committee for Quality
Assurance (NCQA 2003a).
• The Institute of Medicine’s report on Priority Areas for National
Action (IOM 2003c).
3. From 500 studies identified, we selected a subset of 100 that we
judged most relevant and feasible for presentation. Three
pediatric expert reviewers prioritized this list based on the criteria
described above and we made other adjustments based on
considerations of balance.
4. The final form of charts and narrative was determined in
consultation with quality experts (members of the Chartbook
Advisory Board, project consultants, and other independent
reviewers listed on the credits and acknowledgment pages).
Leatherman and McCarthy, Quality of Health Care for Children and Adolescents: A Chartbook, 2004. The Commonwealth Fund
25
ChildChartbook-Front-D3g.qxd
2/26/04 8:32 AM
Page 26
Leatherman and McCarthy, Quality of Health Care for Children and Adolescents: A Chartbook, 2004. The Commonwealth Fund
THE CONCEPTUAL FRAMEWORK FOR
R E P O R T I N G O N Q UA L I T Y O F H E A LT H C A R E
In a recent, widely noted report, Crossing the Quality Chasm, the
Institute of Medicine outlined six aims for improvement of the
health care system: effectiveness, safety, timeliness, patientcenteredness, equity, and efficiency (IOM 2001a). A subsequent
report, Envisioning the National Health Care Quality Report (IOM
2001b), adapted these aims as related components or domains
constituting one dimension of a framework for publicly reporting
on health care quality. To be consistent with this framework, we
adapted these aims or domains for organizing this chartbook. We
did not find representative national data to report on all aspects
of this framework for children and adolescents.
Effectiveness: “providing services based on scientific
knowledge to all who could benefit and refraining from
providing services to those not likely to benefit
(avoiding underuse and overuse).”
Given the focus on preventive and developmental services for
children, most measures of effectiveness included in this
chartbook report on underuse of services, which we define (in
the context of children’s health care quality) as the failure to
provide a service that would have been likely to produce a
desired outcome. There is relatively less data showing that
children overuse services, which means providing a health service
when its risk of harm exceeds its potential benefit. Prescribing
antibiotics for the common cold is one of the best examples of
overuse in children (Chart 1:7).
Safety: “avoiding injuries to patients from the care that is
intended to help them.”
Safety issues include wrong diagnoses, medication mistakes,
surgery performed on the wrong body part, and infections
acquired in the hospital. Ensuring safety may require redesigning
and improving faulty systems and processes of care, which may
involve better staff training, communication, and coordination as
well as standardization of equipment and procedures.
Relatively little national data are currently available to portray
this domain for children. Different approaches to measuring
medical mistakes offer strengths and weaknesses. Chart 1:1
depicts potential medical mistakes in hospitals based on billing
records (administrative data), while Chart 2:2 uses a combination
of medical records and reports by clinicians to depict medication
errors. Another approach involves reporting to state and national
databases (USP 2002). The “ideal reporting system may involve
triangulation between administrative data, chart review, and
voluntary self reports of critical incidents to maximize the ability
to identify events” (Miller et al. 2003).
Timeliness: “reducing waits and sometimes harmful delays
for both those who receive and those who give care.”
The IOM Envisioning report expands the definition of timeliness to
“obtaining needed care and minimizing unnecessary delays in
getting that care” and distinguishes three aspects of timeliness:
(1) access to routine primary and specialty care when needed;
(2) timeliness in getting care for a specific problem once having
accessed the system, including waiting time for an appointment
and time from diagnosis to treatment; and (3) timeliness for an
episode of care, including waiting time in the doctor’s office and
coordination of care among multiple providers (IOM 2001b).
26
ChildChartbook-Front-D3g.qxd
2/26/04 8:32 AM
Page 27
We refer to this domain as “Access and Timeliness” to
emphasize the important link between these concepts. There is
growing interest in the “medical home” as a concept for
describing key aspects of quality of care for children spanning the
access and timeliness and family-centeredness domains. We show
data to illustrate this concept for children with special health care
needs (Charts 3:6 to 3:8), although it is important for all children.
Patient-centeredness: “providing care that is respectful of
and responsive to individual patient preferences, needs,
and values and ensuring that patient values guide all
clinical decisions.”
The IOM Envisioning report distinguishes two aspects of patientcenteredness: 1) partnership in decision-making and 2) patient
experience with care. This domain of quality is especially
important because “what patients experience…as much as the
technical quality of care, will determine how people use the
health care system and how they benefit from it” (Gerteis et al.
1993). Partnership is perhaps even more important for children’s
health care given the involvement of parents in the physicianpatient relationship and the need to rely on family values to guide
decision-making. Given the intermediary role that parents and
other family caregivers play in health care for children, we refer to
this dimension as “Patient and Family Centeredness” and include
assessment of family well-being.
Equity: “providing care that does not vary in quality because
of personal characteristics such as gender, ethnicity,
geographic location, and socioeconomic status.”
The IOM distinguishes equity at two different levels: 1)
population level: “differences in access to health care services by
various subpopulations,” focusing especially on disparities
between those with and without insurance; and 2) individual
level: “differences in treatment received based on unrelated
personal characteristics” (IOM 2001b). We highlight this concept
in a section titled “Disparities,” but we also include data on
disparities in other sections as appropriate.
Understanding the causes of disparities is important for
determining changes that need to be made by the health care
system or in wider social policies that influence health and health
care. For example: socioeconomic factors such as income and
education generally are stronger determinants of primary health
care use than race or ethnicity alone (Fiscella et al. 2000), but
racial and ethnic disparities remain in some studies even after
controlling for socioeconomic factors (Flores et al. 1999; Elster et
al. 2003). Moreover, disparities in access or treatment often
remain among those who are equally insured, indicating that
insurance coverage and ability to pay are necessary but not
sufficient conditions for equal care (Rosenbach et al. 1999).
Efficiency: “avoiding waste, in particular waste of
equipment, supplies, ideas, and energy.”
The IOM Envisioning report did not include this aim in its
recommended framework for the National Healthcare Quality
Report, on the grounds that it is a related but separate concept
that demands additional research. For example, some research has
found that improving the patient-centeredness of care has reduced
costs (Tidikis and Strasen 1994). In other research, hospitals that
scored higher on patient-centeredness tended to have better
outcomes (rates of unexpected deaths and complications) but also
had higher costs (Bechel et al. 2000). Research is needed to
determine whether improved outcomes and patient-centered care
Leatherman and McCarthy, Quality of Health Care for Children and Adolescents: A Chartbook, 2004. The Commonwealth Fund
27
ChildChartbook-Front-D3g.qxd
2/26/04 8:32 AM
Page 28
Leatherman and McCarthy, Quality of Health Care for Children and Adolescents: A Chartbook, 2004. The Commonwealth Fund
can be achieved at equal or lower cost for children. We
acknowledge the importance of this domain but do not include it
given limited space. We do cite information on costs, when
available and relevant, in our narrative discussion.
Capacity to improve: achieving the aims
We have adapted the IOM framework by including an additional
section of charts intended to demonstrate the health care system’s
capacity to improve in achieving the aims described above. The
IOM states that “[w]ithout substantial changes in the ways health
care is delivered, the problems resulting from the growing
complexity of health care science and technology are unlikely to
abate; in fact, they will increase” (IOM 2001a). Thus, it is vital to
find examples of change that can be replicated and adapted in
local settings. The charts in this section are intended to provide a
few such examples to stimulate interest; they are by no means a
comprehensive treatment of this subject.
Consumer perspective on quality
The IOM framework for the National Healthcare Quality Report
incorporates a second dimension, adapted from the Foundation
for Accountability’s Consumer Information Framework. This
dimension includes four perspectives representing different types
of health care needs or reasons that people seek health care,
reflecting the “life cycle of their involvement with the health care
system” (IOM 2001b).
1. Staying healthy refers to “getting help to avoid illness and remain
well.” For children, this perspective must be broadened to include
helping children achieve their developmental potential. Most
nationally representative data on clinical quality for children fall
into this perspective.
2. Getting better refers to “getting help to recover from an illness or
injury.” We denote this perspective as “Getting Better When Sick
or Injured” for clarity. The only nationally representative data
within this perspective are for antibiotic treatment of respiratory
infections (Chart 1:7).
3. Living with illness or disability refers to “getting help with
managing an ongoing, chronic condition or dealing with a
disability that affects function.” There was only limited nationally
representative data to depict this perspective.
4. Coping with the end of life refers to “getting help to deal with a
terminal illness.” Although nationally representative data are
lacking to illustrate this perspective, a recent Institute of Medicine
report describes many deficiencies in supportive care for children
with terminal illnesses (IOM 2002).
Quality measures and data (theoretically) can be subclassified
along these four perspectives within each of the domains of
quality described above. Some quality measures and data—
particularly within the “Patient Safety” and “Patient and Family
Centeredness” domains—cross multiple consumer perspectives
and therefore cannot be classified within a particular consumer
perspective (these are denoted “Multi-Perspective” in the titles).
Developmental stage
Because children’s needs for health care change as they develop,
quality of health care for children must be measured and reported
in developmentally appropriate ways. We have distinguished and
reported on developmental stages as follows:
• Prenatal development (for charts depicting prenatal care);
• Early childhood (ages birth to 5 years) including infancy and
the preschool years;
28
ChildChartbook-Front-D3g.qxd
2/26/04 8:32 AM
Page 29
• Middle childhood (ages 6–10 years), corresponding to the
elementary school years; and
• Adolescence (ages 11–17 years), corresponding to the middle
and high school years.
The American Medical Association’s Guidelines for Adolescent
Preventive Services (GAPS) subclassifies adolescence into early
(11–14 years), middle (15–17 years), and late (18–21 years) stages.
We defined the age range for this chartbook to include children
and adolescents younger than 18 years, so we generally do not
report on late adolescence except when it has been included in the
same data on those younger than 18 years.
SCIENTIFIC ISSUES AND TERMINOLOGY
Generalizability. We preferred studies using nationally representative data. When no national data were available on an important
issue, we used studies of lesser scope to depict an important topic
(such as medication errors) where the results are likely to be
generalizable to broad segments of the population or other
similar practice settings, health care providers, or plans.
Strength of evidence. The evidence base for children’s health care
is variable. We included data in the Effectiveness domain for
clinical services recommended by recognized national
organizations, such as the American Academy of Pediatrics, when
there was some evidence of efficacy to support the recommendation (described in the chart narrative). Evidence is strongest for
immunizations (Chart 1:2), chlamydia screening (Chart 1:6), and
antibiotics and asthma medications (Charts 1:7, 1:8, and 1:9).
Compliance with the recommended schedule of preventive health
care visits (Chart 1:1) is associated with reduced hospitalizations
and ER visits, suggesting improved outcomes. For anticipatory
guidance on childrearing topics (Chart 1:3), we included all topics
reported by the source so as to portray relative performance on the
scope of recommended topics measured, although the evidence
for different topics is variable. For anticipatory guidance for
adolescents (Chart 1:5), we limited topics to reflect the consensus
of recommendations of national organizations.
Terminology. We use the personal terms “health professional,”
“clinician,” and “practitioner” when referring to individuals
including physicians, nurses or nurse practitioners, and
physician’s assistants. We generally reserve the use of the term
“health care provider” to encompass a broader category including
both individual professionals and institutions such as hospitals.
We report on race and ethnicity generally following the terms
(e.g., black or African American) reported in the original survey
or publication.
Statistical reporting. We generally discuss differences only when
they are statistically significant (i.e., 95 percent confidence or
greater that differences are not due to chance), where
significance has been reported or can be inferred based on large
sample size. We use the term “significant” only in this context.
In other cases, we describe what we considered to be
meaningful differences. Percentages generally are rounded to
the nearest whole number, except where rounding would mask
significant or meaningful differences.
Please see the technical appendix for details on study methodologies.
Leatherman and McCarthy, Quality of Health Care for Children and Adolescents: A Chartbook, 2004. The Commonwealth Fund
29
ChildChartbook-Front-D3g.qxd
2/26/04 8:32 AM
Page 30
ChildChartbook-Sec1-D3c.qxd
2/23/04 9:44 AM
Page 31
Charts
ChildChartbook-Sec1-D3c.qxd
2/23/04 9:44 AM
Page 32
1: EFFECTIVENESS
Leatherman and McCarthy, Quality of Health Care for Children and Adolescents: A Chartbook, 2004. The Commonwealth Fund
E F F E C T I V E N E S S — S TAY I N G H E A LT H Y — E A R LY C H I L D H O O D T O A D O L E S C E N C E — C H A R T 1 : 1
Receipt of Recommended Preventive Health Care Visits
Why is this important? The American Academy of Pediatrics and
the national Bright Futures initiative (sponsored by the federal
Maternal and Child Health Bureau and supported by the Centers
for Medicare and Medicaid Services and 31 professional and
voluntary organizations) recommend a series of regular health
supervision or well-child visits from birth to age 21 (AAP 1997;
Green and Palfrey 2002). The schedule calls for nine visits from
age 1 month through 2 years and annual visits from ages 3 to 21
years, skipping ages 7 and 9 years.
The purpose of these visits is to: “screen for disease, provide
counseling about how to foster healthy development of the child
and prevent disease and injury (anticipatory guidance), identify
problems at a sufficiently early stage to intervene to prevent
further problems, provide immunizations, answer questions, and
allow a physician to become familiar with a child and his/her
family” (Schuster 2000a).
Regular preventive care for children is associated with fewer
adverse health care events, suggesting improved health outcomes
(additional research is needed to establish these benefits more
conclusively):
• Nationally, young children who received all recommended
well-child visits had fewer emergency room visits (Hakim and
Ronsaville 2002).
• Medicaid-insured young children in three states who received
all recommended well-child visits had fewer avoidable
hospitalizations (Hakim and Bye 2001).
• Medicaid-insured children of all ages in one state who received
more preventive visits had fewer avoidable hospitalizations
(Gadomski et al. 1998).
Findings: Nearly one-quarter (23%) of U.S. children and adolescents
(ages 3 to 17 years) did not have an annual well-child visit at
recommended ages, according to parent report in 1999 (data not
available for children ages birth to 2 years). Adolescents were less
likely to have a preventive health care visit than younger children.
Source: Urban Institute/Child Trends, 1999 National Survey of
America’s Families, as reported by Yu et al. (2002).
Implications: Many children and adolescents are not receiving the
preventive care recommended by experts to promote optimal
health and well-being. In other studies of children younger than 3
years (not included in this chart), a range of 19 percent to 84
percent did not receive the recommended number of well-child
visits (Freed et al. 1999; Ronsaville and Hakim 2000).
The potential for improved outcomes and the link between
well-child visits and recommended preventive services such as
immunizations argue for interventions to improve preventive
care-seeking, such as parent reminders in combination with
efforts to make primary care more accessible (Briss et al. 2000).
For example, the San Mateo County, Calif., “Pre-to-Three”
program has increased preventive care for low-income young
children through assessment, case management, home visitation,
and partnerships between community agencies to promote a
“seamless network of services” (Cuellar et al. 2003).
See the narrative for Charts 1:2 and 3:1 for examples of other
improvement interventions. See Chart 5:1 for disparities in preventive
health visits.
32
ChildChartbook-Sec1-D3c.qxd
2/23/04 9:44 AM
Page 33
E F F E C T I V E N E S S — S TAY I N G H E A LT H Y — E A R LY C H I L D H O O D T O A D O L E S C E N C E — C H A R T 1 : 1
Receipt of Recommended Preventive Health Care Visits
Children who receive regular preventive care are less likely to
have emergency visits and preventable hospitalizations. Threequarters (77%) of U.S. children and adolescents received an
100%
U.S. children and adolescents
(ages 3–17 years) in 1999
90%
80%
annual preventive health visit at recommended ages,
according to parent report in 1999. Adolescents were less
likely to have a preventive care visit than younger children.
77%
84%
81%
70%
70%
66%
60%
50%
40%
30%
20%
10%
0%
Total ages 3–17
Ages 3–4
Ages 5–10
Ages 11–14
Ages 15–17
Received annual well-child visit at recommended ages*
Source: Urban Institute/Child Trends, 1999 National Survey of America's Families
(N=35,938), as reported by Yu et al. (2002). *Pediatric experts recommend an annual
well-child visit at ages 3–6, 8, and 10–21 years; children ages 7 and 9 years were
considered compliant with the recommendations whether or not they received a wellchild visit. Data were not sufficient to calculate compliance with recommendations for
children ages 0–2 years.
Leatherman and McCarthy, Quality of Health Care for Children and Adolescents: A Chartbook, 2004. The Commonwealth Fund
1: EFFECTIVENESS
33
ChildChartbook-Sec1-D3c.qxd
2/23/04 9:44 AM
Page 34
1: EFFECTIVENESS
Leatherman and McCarthy, Quality of Health Care for Children and Adolescents: A Chartbook, 2004. The Commonwealth Fund
E F F E C T I V E N E S S — S TAY I N G H E A LT H Y — E A R LY C H I L D H O O D — C H A R T 1 : 2
Immunizations for Young Children
Why is this important? Vaccination is a very cost-effective disease
prevention strategy. High vaccination levels protect children
against periodic outbreaks of infectious disease. For example, a
measles epidemic in 1989–1991 resulted in 120 deaths, 11,000
people hospitalized, and $100 million in medical costs (DHHS
2000a). More recently, nearly 8,000 cases of pertussis (whooping
cough) were reported in 2000, resulting in 62 deaths (CDC
2002a). Vaccination also protects against mild illnesses that lead
to absence from school and lost workdays for parents.
Findings: One-quarter (25%) of young children (ages 19 to 35
months) in the United States were not fully up to date on all
recommended doses of five key vaccines in 2002. This
combined coverage rate has changed little since 1999, when it
was first reported.
The combined immunization rate for these five vaccines varied
substantially among the states, from 63 percent in Colorado to 86
percent in Massachusetts. Only 11 states met the national Healthy
People 2010 goal of 80 percent coverage for the combined measure.
However, two-thirds or more of the states and the nation as a
whole met the goal of 90 percent coverage for four of the five
specific vaccines included in this measure:
• 4 doses of diphtheria, tetanus toxoids, and pertussis vaccine,
or diphtheria and tetanus toxoids only (82% national; state
range 66% to 94%; 4 states met goal);
• 3 doses of poliovirus vaccine (90% national; state range 84%
to 97%; 33 states met goal);
• 1 dose of measles-mumps-rubella vaccine (92% national; state
range 85% to 96%; 41 states met goal);
• 3 doses of Haemophilus influenzae type b vaccine (93%
national; state range 86% to 98%; 48 states met goal); and
• 3 doses of hepatitis B vaccine (90% national; state range 82%
to 97%; 35 states met goal).
Source: National Center for Health Statistics, National
Immunization Survey, as reported by the CDC (2003b).
Implications: More progress is needed to reach and sustain national
immunization goals in every area of the country. The U.S. lags
many other nations in timely vaccination of children: 63 countries
exceeded the U.S. in reported rate of coverage for three doses of
diphtheria-tetanus-pertussis vaccine in 2002 (WHO 2003). Steps
to improvement include:
• public policies to ensure adequate vaccine supply and
financing (several vaccines were in short supply during 2002)
(IOM 2003a),
• improved tracking systems and participation in state and local
immunization registries (Wood et al. 1999),
• multi-component community interventions that include
education and outreach (Briss et al. 2000), and
• wider adoption of effective practices by health care providers,
such as reminders for parents when immunizations are due,
assessing the immunization status of all children, and
prompts about needed vaccines during visits by children
(Briss et al. 2000).
See Chart 5:2 for data on disparities and Chart 6:1 for an
intervention that increased childhood immunization rates.
34
ChildChartbook-Sec1-D3c.qxd
2/23/04 9:44 AM
Page 35
E F F E C T I V E N E S S — S TAY I N G H E A LT H Y — E A R LY C H I L D H O O D — C H A R T 1 : 2
Immunizations for Young Children
Only three-quarters of young children in the U.S. were up to
date on their immunizations in 2002. Just 11 states met the
national goal of at least 80 percent coverage for this
combined measure.
Percentage of children (ages 19– 35 months) who received
all recommended doses of five key vaccines in 2002*
69
81
78
67
77
70
78
80
80
69
82
73
79
78
76
76
63
73
72
73
68
65
65
75
79 76
67
68
75
77 72
67
80
High: 86% (Mass.)
Avg: 75% (U.S.)
75
75
D.C. 70
79
71
77
84
86
85
82
76
79
79
82
78
76
81
Low: 63% (Colo.)
80– 89%
70– 79%
79
60– 69%
Source: National Center for Health Statistics, 2002 National Immunization Survey
(N=30,000+ households), as reported by the CDC (2003b). *4:3:1:3:3 series = 4+
doses of diphtheria and tetanus toxoids and pertussis vaccine or diphtheria and
tetanus toxoids only, 3+ doses of poliovirus vaccine, 1+ dose of a measlescontaining vaccine, 3+ doses of Haemophilus influenzae type b vaccine, and 3+
doses of hepatitis B vaccine.
Leatherman and McCarthy, Quality of Health Care for Children and Adolescents: A Chartbook, 2004. The Commonwealth Fund
1: EFFECTIVENESS
35
ChildChartbook-Sec1-D3c.qxd
2/23/04 9:44 AM
Page 36
1: EFFECTIVENESS
Leatherman and McCarthy, Quality of Health Care for Children and Adolescents: A Chartbook, 2004. The Commonwealth Fund
E F F E C T I V E N E S S — S TAY I N G H E A LT H Y — E A R LY C H I L D H O O D — C H A R T 1 : 3
Guidance on Childrearing for Parents of Young Children
Why is this important? Parents often look to their child’s doctor as
a trusted source of information on child behavior and
development. Both the American Academy of Pediatrics and the
national Bright Futures initiative recommend a variety of ageappropriate topics that physicians should address to promote
child development, effective parenting, and healthy family
practices (Schuster et al. 2000; AHRQ 2002a).
Some evidence suggests that certain anticipatory guidance can
have a positive impact on childrearing, such as increasing some
child safety practices and use of nonviolent discipline, promoting
positive mother-child interactions and parental understanding of
child temperament, reducing infant crying, and improving infant
sleep patterns (DiGuiseppi and Roberts 2000; Regalado and
Halfon 2001). Parents in three managed care plans reported more
confidence in parenting skills and less concern about their child’s
behavior when they had talked to their child’s health professional
about such topics (Bethell et al. 2001).
Findings: Many parents (38% to 77%) of young children (ages birth
to 36 months) in the U.S. reported in 1995–1996 that a health
professional (such as a doctor or nurse) had not discussed one of
six age-appropriate childrearing topics with them; more than onethird (37%) had not discussed any of the topics. Many parents (9%
to 42%) had not discussed one of these topics with a health
professional and wanted more information about the topic.
Parents who had discussed more topics were more likely to report
that they received excellent care.
Source: Commonwealth Fund Survey of Parents with Young
Children, as reported by Schuster et al. (2000).
Implications: Health professionals do not always counsel parents
on recommended childrearing topics, resulting in unmet needs
for information, missed opportunities to help improve parenting
skills and child and family well-being, and potentially lower
satisfaction with care.
Parents with concerns about their child’s learning,
development, or behavior are more likely to get needed
information when their child’s health professional asks whether
they have any concerns (Bethell et al. 2002). Parents of young
children who visit the same practitioner for well-child care also
report more discussion of these topics (Halfon et al. 2003),
suggesting that continuity of care is beneficial.
More structured approaches—such as the use of a
questionnaire or checklist—may facilitate discussion of these
topics, although additional research is needed about the best way
to incorporate such approaches into clinical practice (Regalado
and Halfon 2002). Providing printed materials to parents, or
showing instructional videotapes in the waiting room, can
reinforce discussions and facilitate parent recall and use of
information (Glascoe et al. 1998).
System-level issues that may increase guidance for parents
include assuring adequate time and reimbursement for these
services and providing additional education and training for
health professionals (Halfon et al. 2003). See Chart 6:2 for an
intervention that integrated a child development specialist into primary
care practices to enhance information and other services for parents.
36
ChildChartbook-Sec1-D3c.qxd
2/23/04 9:44 AM
Page 37
E F F E C T I V E N E S S — S TAY I N G H E A LT H Y — E A R LY C H I L D H O O D — C H A R T 1 : 3
Guidance on Childrearing for Parents of Young Children
Less than half of parents of young children reported that they
had ever discussed five of six age-appropriate childrearing
topics with a health professional (such as a doctor or nurse)
during 1995–1996. Many parents had not discussed a topic
and wanted more information about the topic, indicating
unmet need.
Parents who had not discussed
topic and said they could use more
information on the topic
Parent reported that a health
professional had ever discussed
topic at appropriate ages
62%
Care for newborn (<3 mos)
41%
Sleeping patterns
Crying
35%
Toilet training (18– 36 mos)
34%
Discipline (6– 36 mos)
25%
Encouraging learning
23%
0%
9%
20%
40%
17%
15%
24%
30%
42%
60%
80%
100%
0%
20%
40%
60%
80%
100%
Parents of U.S. children (ages 0– 36 months) in 1995– 1996
Source: 1995-1996 Commonwealth Fund Survey of Parents with Young Children
(N=2,017), as reported by Schuster et al. (2000).
Leatherman and McCarthy, Quality of Health Care for Children and Adolescents: A Chartbook, 2004. The Commonwealth Fund
1: EFFECTIVENESS
37
ChildChartbook-Sec1-D3c.qxd
2/23/04 9:44 AM
Page 38
1: EFFECTIVENESS
Leatherman and McCarthy, Quality of Health Care for Children and Adolescents: A Chartbook, 2004. The Commonwealth Fund
E F F E C T I V E N E S S — S TAY I N G H E A LT H Y — E A R LY C H I L D H O O D — C H A R T 1 : 4
Speech and Language Development: Assessment and Guidance
Why is this important? Speech and language development is
typically the most useful early indicator of a child’s overall
development and cognitive ability (Schuster 2000b). Early
identification of children at risk for developmental delay or
related problems can help the family prepare and seek
intervention services to support the child from a young age when
chances are best to effect change (Schuster 2000b). A systematic
review of research found that speech and language therapy for
children can be effective in improving expressive disorders (Law et
al. 2003). Research suggests that eliciting parent concerns and
reports about a child’s skills is an effective way for physicians to
screen for developmental problems (Regalado and Halfon 2001).
Reading aloud to young children helps children develop oral
language skills and learn to read, which is important to success in
school and life (Wells 1985; Bus et al. 1995; Mendelsohn 2002).
Nationally, 6 percent to 16 percent of parents of young children
report that they never read to their child and another 15 percent
to 23 percent read only infrequently; half of low-income families
with young children do not regularly read aloud (Young et al.
1998; Halfon et al. 2002). The American Academy of Pediatrics
encourages physicians to promote early literacy development
(AAP 1999), which can be especially beneficial among young
children from disadvantaged backgrounds (High et al. 2000).
Findings: Up to one-third (21% to 32%) of parents of young
children (ages 4 to 35 months) reported in 2000 that their child’s
doctor or other health professional had not discussed how the
child communicates or about words and phrases that the child
uses and understands. More than one-third (36% to 39%) said
that the doctor or health professional had not discussed the
importance of reading to their child.
Source: National Center for Health Statistics, National Survey
of Early Childhood Health, as reported by Halfon et al. (2002).
Implications: Although discussion of speech and language appears
to be common, there is opportunity for improvement, especially
concerning the importance of reading to children. The Healthy
Steps demonstration program is one approach that has increased
provision of developmental services to young children through
enhanced well-child care services and the addition of a child
development specialist to the care team (Minkovitz et al.
2001)(see Chart 6:2).
The “Reach Out and Read” initiative has engaged more than
1,400 physician practices nationwide in an intervention (during
well-child visits) that encourages early literacy development
through physician counseling and giving parents developmentally
and culturally appropriate picture books (Reach Out and Read
2003). Evaluations in urban clinics serving low-income and
multicultural families have found this intervention effective at
encouraging reading and improving child language development
(High et al. 2000; Mendelsohn et al. 2001; Sharif et al. 2002;
Silverstein et al. 2002).
38
ChildChartbook-Sec1-D3c.qxd
2/23/04 9:44 AM
Page 39
E F F E C T I V E N E S S — S TAY I N G H E A LT H Y — E A R LY C H I L D H O O D — C H A R T 1 : 4
Speech and Language Development: Assessment and Guidance
About two-thirds or more of parents of young children
reported in 2000 that their child's doctor or other health
professional had discussed speech and language development
100%
U.S. young children
(ages 4– 35 months) in 2000
90%
79%
issues and the importance of reading aloud to their child
to promote early literacy development.
■
■
How child communicates,
or words and phrases that child
uses and understands
Importance of
reading to child
80%
70%
64%
72%
68%
63%
61%
60%
50%
40%
30%
20%
10%
0%
4– 9 months
10– 18 months
19– 35 months
Parent reported that child's health professional had discussed topic
Source: National Center for Health Statistics, 2000 National Survey of Early Childhood
Health (N=2,068), as reported by Halfon et al. (2002). See technical appendix for
differences in survey wording by age group.
Leatherman and McCarthy, Quality of Health Care for Children and Adolescents: A Chartbook, 2004. The Commonwealth Fund
1: EFFECTIVENESS
39
ChildChartbook-Sec1-D3c.qxd
2/23/04 9:44 AM
Page 40
1: EFFECTIVENESS
Leatherman and McCarthy, Quality of Health Care for Children and Adolescents: A Chartbook, 2004. The Commonwealth Fund
E F F E C T I V E N E S S — S TAY I N G H E A LT H Y — A D O L E S C E N C E — C H A R T 1 : 5
Counseling Adolescents on Healthy Behaviors
Why is this important? Adolescence is a time of rapid change
when youth experiment with and establish behaviors that can
have both immediate and life-long consequences for their health.
The Carnegie Council on Adolescent Development estimated that
“nearly half of American adolescents are at high or moderate risk
of seriously harming their life chances” (Carnegie 1995).
Several national organizations—including the American
Medical Association, American Academy of Pediatrics, American
Academy of Family Physicians, U.S. Preventive Services Task Force,
and the Maternal and Child Health Bureau’s Bright Futures
initiative—have recommended that primary care physicians screen
and/or counsel as appropriate to help adolescents prevent injuries
(such as through seat belt use), reduce the risk for future heart
disease (such as through tobacco cessation, good nutrition, and
adequate exercise), and prevent or reduce certain risky behaviors
(such as alcohol use and unsafe sexual behaviors) (Elster 1998).
Some evidence suggests that clinical counseling can help
adolescents make behavioral changes, such as decreasing alcohol
consumption, increasing condom and contraceptive use, and
increasing seat belt use (Klein and Auerbach 2002; Manlove et al.
2002). In other cases, recommendations may be extrapolated from
studies showing the efficacy of counseling adults. Adolescent
health care experts advise that counseling by health professionals
should be part of a coordinated preventive effort involving family,
schools, and the community (Santelli et al. 1999).
Findings: In 1997, one-half or less of surveyed adolescents (in the
fifth through the twelfth grades in the U.S.) reported ever
discussing most recommended health risk topics with their doctor
or other health professional.
Source: Commonwealth Fund Survey of the Health of
Adolescents, as reported by Ackard and Neumark-Sztainer (2001).
Implications: Although many adolescents say that they want to
discuss health behaviors with a doctor or other health
professional (Klein and Wilson 2002), health professionals miss
many opportunities to do so. Reasons for this gap may include
limited time during visits, lack of professional confidence, or skill
deficiency to address teen issues (Park et al. 2001). Adolescents
who have confidential time with their clinician and who visit teen
health clinics are more likely to receive counseling (Blum et al.
1996; Klein and Wilson 2002).
Interventions that increase clinical counseling of adolescents
(see Chart 6:4) include:
• skills-based training for health professionals (Lustig et al. 2001),
• use of structured risk assessments and supportive office
systems (Boekeloo et al. 1999; Klein et al. 2001), and
• a combination of educational “priming” for patients and
reminders for health professionals (Boekeloo et al. 2003).
40
ChildChartbook-Sec1-D3c.qxd
2/23/04 9:44 AM
Page 41
E F F E C T I V E N E S S — S TAY I N G H E A LT H Y — A D O L E S C E N C E — C H A R T 1 : 5
Counseling Adolescents on Healthy Behaviors
In 1997, less than one-half of adolescents reported that they
had ever discussed most recommended health risk topics with
their doctor or other health professional.
53%
Good eating habits
44%
■
Girls
■
Boys
41%
41%
Exercise
Drugs
28%
34%
Smoking
27%
32%
28%
24%
STDs
23%
Alcohol
27%
26%
Preventing pregnancy
0%
15%
10%
20%
30%
40%
50%
60%
70%
80%
90%
100%
U.S. students (fifth through twelfth grade) in 1997
Source: 1997 Commonwealth Fund Survey of the Health of Adolescents (N=6,728), as
reported by Ackard and Neumark-Sztainer (2001). Topics shown represent a subset of
those included in the survey that matched the consensus of recommendations of
national organizations for screening and/or counseling adolescents at the time of the
survey (Elster 1998). “Good eating habits” represents the highest rate achieved for any
of the topics included in the survey.
Leatherman and McCarthy, Quality of Health Care for Children and Adolescents: A Chartbook, 2004. The Commonwealth Fund
1: EFFECTIVENESS
41
ChildChartbook-Sec1-D3c.qxd
2/23/04 9:44 AM
Page 42
1: EFFECTIVENESS
Leatherman and McCarthy, Quality of Health Care for Children and Adolescents: A Chartbook, 2004. The Commonwealth Fund
E F F E C T I V E N E S S — S TAY I N G H E A LT H Y — A D O L E S C E N C E — C H A R T 1 : 6
STD Screening for Adolescents: Chlamydia Infection
Why is this important? Genital chlamydia is the most common
bacterial sexually transmitted disease (STD) in the U.S., costing $3
billion or more for treatment of complications. Nearly half (46%)
of the infections newly reported each year occur in sexually active
15- to 19-year-old girls, among whom prevalence rates may reach
10 percent (CDC 2001).
Although chlamydia can be cured with antibiotics, most
infected people do not have symptoms and remain unaware that
they need treatment. When untreated, up to 40 percent of women
with chlamydia develop pelvic inflammatory disease, which can
result in chronic pelvic pain, infertility, or life-threatening tubal
pregnancy (CDC 2001).
Screening females at risk for chlamydia reduces the incidence
of pelvic inflammatory disease and is likely to be cost-saving
(USPSTF 2003). The U.S. Preventive Services Task Force
recommends that clinicians routinely screen all sexually active
females age 25 and younger (evidence was insufficient to
determine the effectiveness of screening men). The Centers for
Disease Control and Prevention recommend annual screening for
sexually active females younger than age 20—who are at greatest
risk of infection (CDC 1993).
Findings: Among sexually active adolescent females (ages 16 to 20
years) enrolled in managed care plans, more than seven of 10
(73%) with private insurance and nearly six of 10 (59%) with
Medicaid coverage did not receive a test for chlamydia infection
in the past year. There was a small increase in rates from 2000 to
2002.
Source: National Committee for Quality Assurance, HEDIS, as
reported by the NCQA (2003a). See technical appendix for a
description of how sexually active women were defined. Although
this data source is not representative of all adolescents, it is the best
available data on this topic.
Implications: The rate of chlamydia screening remains very low in
private health plans, although the higher rate in Medicaid plans is
encouraging (the best-performing Medicaid plans achieved
screening rates of 60 percent).
Only one-third to one-half of primary care physicians report
regularly testing for chlamydia when they determine that an
adolescent girl is sexually active. Factors associated with physician
adherence to screening guidelines include: a sense of
responsibility for STD prevention, confidence in addressing teen
sexuality, and an understanding of the risk of infection and
effectiveness of screening (IOM 1997; Torkko et al. 2000; Cook et
al. 2001). Teens say that privacy and confidentiality are important
to receiving STD screening (Blake et al. 2003).
A multifaceted intervention aimed at improving clinical
practice substantially increased chlamydia screening rates in
pediatric clinics of one HMO (Shafer et al. 2002)(see Chart 6:5).
School-based STD screening programs also hold promise for
reaching more youth (Nsuami and Cohen 2000).
42
ChildChartbook-Sec1-D3c.qxd
2/23/04 9:44 AM
Page 43
E F F E C T I V E N E S S — S TAY I N G H E A LT H Y — A D O L E S C E N C E — C H A R T 1 : 6
STD Screening for Adolescents: Chlamydia Infection
Chlamydia—a sexually transmitted genital infection—
often goes undetected and can lead to infertility or
problems in pregnancy if left untreated. Among sexually
active adolescent females enrolled in managed care plans,
100%
less than three of 10 in private plans and four of 10 in
Medicaid plans had been screened for chlamydia infection
in the past year.
Sexually active females (ages 16– 20 years)
enrolled in managed health care plans
■
■
■
2000
2001
2002
90%
80%
70%
60%
50%
37%
40%
30%
24%
25%
40%
41%
27%
20%
10%
0%
Privately insured
Medicaid-insured
Received a test for chlamydia infection in the past year
Source: National Committee for Quality Assurance, HEDIS (N=282 to 334 private plans
and 85 to 100 Medicaid plans), as reported by the NCQA (2003a). Used and adapted
with permission from the National Committee for Quality Assurance.
Leatherman and McCarthy, Quality of Health Care for Children and Adolescents: A Chartbook, 2004. The Commonwealth Fund
1: EFFECTIVENESS
43
ChildChartbook-Sec1-D3c.qxd
2/23/04 9:44 AM
Page 44
1: EFFECTIVENESS
Leatherman and McCarthy, Quality of Health Care for Children and Adolescents: A Chartbook, 2004. The Commonwealth Fund
E F F E C T I V E N E S S — G E T T I N G B E T T E R W H E N S I C K O R I N J U R E D — E A R LY C H I L D H O O D T O A D O L E S C E N C E — C H A R T 1 : 7
Inappropriate Antibiotic Treatment for the Common Cold
Why is this important? Children use antibiotics at a higher rate
than other age groups (McCaig and Hughes 1995). Widespread
overprescribing of antibiotics contributes to the emergence of
antibiotic-resistant strains of bacteria, which are increasing in
prevalence (Whitney et al. 2000), potentially endangering all
patients. Therefore, experts recommend limiting antibiotics to
patients who are most likely to benefit (Dowell et al. 1998).
The common cold is caused by a virus, for which antibiotics
are not effective and never indicated (Rosenstein et al. 1998).
When an infection is caused by bacteria, then antibiotics may be
appropriate, but experts recommend the use of narrow-spectrum
antibiotics whenever possible to target specific bacteria. Using
broad-spectrum antibiotics when they are not indicated makes the
resistance problem even worse by unnecessarily exposing more
diverse bacteria to antibiotics (Lewis 1995; CDC 2003a).
Findings: The inappropriate practice of prescribing antibiotics for
children and adolescents (younger than age 15) suffering from the
common cold (and other unspecified upper respiratory infections
likely to be caused by a virus) decreased by 50 percent during the
past decade, from two of five such visits (41%) in 1991–1992 to
one of five such visits (21%) in 1998–1999. By the end of the
decade, however, clinicians were more often prescribing broadspectrum antibiotics at such visits (8% in 1998–1999 vs. 6% in
1991–1992).
Source: National Center for Health Statistics, National Ambulatory
Medical Care Survey, as reported by Steinman et al. (2003).
Implications: Clinicians treating children have achieved the
national objective of reducing antibiotic prescribing for the
common cold by 50 percent. Further progress is needed to ensure
that antibiotics are used appropriately so that they remain
effective when truly needed.
Parents often hold misconceptions about the proper use of
antibiotics (Lee et al. 2003). Physicians may prescribe antibiotics
for viral infections to meet perceived parental expectations or
demands for antibiotics (Bauchner et al. 1999; Mangione-Smith et
al. 1999; Stivers 2002), or based on a belief that antibiotics will
prevent bacterial complications from developing (Pichichero
2002). These are not valid or effective reasons for using
antibiotics, however (Rosenstein et al. 1998).
Research has found that parent satisfaction with the physician
visit depends on meeting their expectations for good
communication rather than on whether antibiotics were
prescribed; this suggests that parent satisfaction can be maintained if physicians take time to explain the decision not to
prescribe an antibiotic (Hamm et al. 1996; Mangione-Smith et al.
1999). Interventions that combine education for parents and
physicians can decrease unnecessary antibiotic use among
children (Finkelstein et al. 2001; Perz et al. 2002) (see Chart 6:6).
44
ChildChartbook-Sec1-D3c.qxd
2/23/04 9:44 AM
Page 45
EFFECTIVENESS — GETTING BETTER WHEN SICK OR INJURED — EARLY CHILDHOOD TO ADOLESCENCE — CHART 1:7
Inappropriate Antibiotic Treatment for the Common Cold
Antibiotics are never indicated for treating the common cold.
From 1991 to 1999, clinicians reduced—by 50 percent—the
prescribing of antibiotics for children and adolescents with the
■
■
Narrow-spectrum
antibiotic prescribed
Broad-spectrum
antibiotic prescribed
34%
1991– 1992
12%
1998– 1999
0%
common cold (from 41 to 21 percent of visits). Yet, they more
often prescribed broad-spectrum antibiotics, which risks
spreading antibiotic resistance to more bacteria.
10%
8%
6%
Antibiotics prescribed at 41% of visits
Antibiotics prescribed at 21% of visits
20%
30%
40%
50%
60%
70%
80%
90%
100%
Physician visits by children and adolescents (younger than 15 years) diagnosed with the common cold
(and other unspecified upper respiratory tract infections likely to be caused by a virus)
Source: National Center for Health Statistics, National Ambulatory Medical Care Survey
(N=1,976 pediatric visits), as reported by Steinman et al. (2003) and personal
communication with Michael A. Steinman (2003). Percentages do not add to 100
because of rounding. Adapted and republished from the Annals of Internal Medicine with
permission of the American College of Physicians.
Leatherman and McCarthy, Quality of Health Care for Children and Adolescents: A Chartbook, 2004. The Commonwealth Fund
1: EFFECTIVENESS
45
ChildChartbook-Sec1-D3c.qxd
2/23/04 9:44 AM
Page 46
1: EFFECTIVENESS
Leatherman and McCarthy, Quality of Health Care for Children and Adolescents: A Chartbook, 2004. The Commonwealth Fund
EFFECTIVENESS — LIVING WITH ILLNESS — MIDDLE CHILDHOOD AND ADOLESCENCE — CHART 1:8
Prescription of Preventive Medication for Long-Term Asthma Control
Why is this important? Asthma—the most common childhood
chronic health problem (after dental caries)—has increased in
prevalence since 1980. Four million children suffered an asthma
attack in 2000, resulting in 728,000 emergency room visits,
214,000 hospitalizations, and 223 deaths (CDC 2003c). Onequarter of children with asthma have symptoms severe enough to
limit their activities (CDC 2002b) and 14 million school days are
missed each year because of asthma (ALA 2003). Medical and
societal costs of childhood asthma were estimated at $3.2 billion
in 1994 dollars (Weiss et al. 2000).
The National Asthma Education and Prevention Program has
issued evidence-based guidelines for effective asthma
management including patient education and monitoring, control
of environmental factors, and appropriate drug therapy (NAEPP
1997; 2002). Children with asthma often overuse short-acting
bronchodilators to relieve their symptoms, which can lead to poor
outcomes (Lozano et al. 2003). Children with persistent asthma
who use recommended long-acting medication (such as an
inhaled corticosteroid) to control the inflammation that causes
asthma achieve better outcomes, including fewer symptoms,
emergency room visits, and hospitalizations (Calpin et al. 1997;
Adams et al. 2001).
Findings: Among children and adolescents (ages 5 to 17 years) with
persistent asthma enrolled in managed care plans, about one of
three (30% to 35%) covered by private insurance and two of five
(38% to 40%) covered by Medicaid did not receive a prescription
for an appropriate medication to control their asthma in 2002.
Performance improved from 2000 to 2002 for both private and
Medicaid plans.
Source: National Committee for Quality Assurance, HEDIS, as
reported by the NCQA (2003a).
Implications: National data show a substantial increase in the
prescribing of medications to control asthma over the past decade
(Stafford et al. 2003). Still, parents reported in 2000 that only two
of five children (42%) who had an asthma attack in the past year
used the recommended first-line medication (inhaled
corticosteroid) to control their asthma (Krauss 2003). Further
improvement is needed.
Although most pediatricians are aware of the medication
guideline, some do not agree with it and therefore do not always
prescribe medication as guidelines recommend (Cabana et al.
2001). Likewise, some parents and children report concerns or
misunderstanding about these medications, resulting in failure to
follow prescriptions about half the time (Bender et al. 1997;
Leickly et al. 1998; Farber et al. 2003).
Improvement in asthma management will require a “planned
asthma care approach” (IOM 2003c) that creates stronger
professional partnerships with families to address concerns and
support medication adherence (Bender 2002) (see Chart 6:7).
• An interactive professional training program improved
physician communication with parents, prescribing of
medications, and parent knowledge and satisfaction while
lowering resource use (Clark et al. 1998).
• Asthma self-management education programs improve
outcomes for children including fewer absences from
school, activity restrictions, and emergency room visits
(Wolf et al. 2003).
46
ChildChartbook-Sec1-D3c.qxd
2/23/04 9:44 AM
Page 47
EFFECTIVENESS — LIVING WITH ILLNESS — MIDDLE CHILDHOOD AND ADOLESCENCE — CHART 1:8
Prescription of Preventive Medication for Long-Term Asthma Control
Only about two-thirds of children and adolescents with
persistent asthma enrolled in managed care plans receive a
prescription for a recommended medication to control their
100%
asthma and prevent asthma attacks. Performance improved
sequentially over the past three years.
■ ■ ■
Managed health care plan
enrollees with persistent asthma
2000
2001
2002
90%
80%
70%
61%
66%
70%
60%
53% 55%
60%
60%
62% 65%
56% 58%
62%
50%
40%
30%
20%
10%
0%
Privately insured
Medicaid-insured
Ages 5– 9 years
Privately insured
Medicaid-insured
Ages 10– 17 years
Received a prescription for an appropriate preventive medication for long-term asthma control
Source: National Committee for Quality Assurance, HEDIS (N= 242 to 285 private plans
and 53 to 90 Medicaid plans), as reported by the NCQA (2003a). Used and adapted with
permission from the National Committee for Quality Assurance.
Leatherman and McCarthy, Quality of Health Care for Children and Adolescents: A Chartbook, 2004. The Commonwealth Fund
1: EFFECTIVENESS
47
ChildChartbook-Sec1-D3c.qxd
2/23/04 9:44 AM
Page 48
1: EFFECTIVENESS
Leatherman and McCarthy, Quality of Health Care for Children and Adolescents: A Chartbook, 2004. The Commonwealth Fund
E F F E C T I V E N E S S — L I V I N G W I T H I L L N E S S — E A R LY C H I L D H O O D — C H A R T 1 : 9
Prescription of Antibiotics to Prevent Infection among Medicaid-Insured
Young Children with Sickle Cell Disease
Why is this important? Sickle cell disease (SCD) is a genetic
disorder that affects 2,000 infants born in the U.S. each year,
predominantly African Americans (CORN 2002). Children with
sickle cell disease require expert, comprehensive care in a medical
home (a multidisciplinary team or a knowledgeable primary care
physician who coordinates care with specialists) to prevent and
treat complications (AAP 2002b). Chief among these is a high
susceptibility to severe bacterial infection that can lead to
meningitis, pneumonia, septicemia (the spread of pathogens and
their toxins in the blood), and death.
Based on strong evidence from a randomized controlled trial
(Gaston et al. 1986), experts recommend that children with two
types of sickle cell disease (sickle cell anemia and S-ߺ
thalessemia) receive prophylactic antibiotics (twice-daily
penicillin or the equivalent) to prevent pneumococcal infection
continuously from age 2 months until age 5 years, with
pneumococcal vaccinations as a first line of defense and prompt
treatment of suspected infections when they do occur (AAP 2000;
NHLBI 2002).
Findings: During 1995–1999, children younger than 4 years with
sickle cell disease who were continuously enrolled in Medicaid
for one year in two states were dispensed an average of only 148
days (41%) of an expected 365-day supply of antibiotics of a
type that could have prevented pneumococcal infection.
(Antibiotics may have been prescribed for therapeutic reasons
as well as prophylaxis.) The amount of antibiotics dispensed
varied greatly among children: 10 percent received no
antibiotics and 22 percent received more than 270 days of
medication. Children had an average of 13 outpatient visits
during the year, suggesting that there were many missed
opportunities to provide antibiotic prescriptions.
Source: Medicaid administrative claims and encounter data, as
reported by Sox et al. (2003).
Implications: Even under generous assumptions, low-income young
children with sickle cell disease went without antibiotics to
prevent potentially life-threatening infections on three of five days
during the year. Other research suggests that parents of children
with sickle cell disease often fail to obtain antibiotic prescription
refills on a timely basis (often due to transportation barriers) and
frequently forget to administer these medications when they do
have them (Elliott et al. 2001).
Interventions are needed to increase the prescribing of
prophylactic antibiotics and encourage better adherence to
prescriptions among these children. Some researchers
recommend that clinicians monitor prescription adherence and
review parental beliefs and barriers to achieving strict compliance
(Elliott et al. 2001). Others have reported success with an
intensive parent education program (Day et al. 1992). Survival
has greatly improved for children with sickle cell disease in recent
years (Davis et al. 1997) but could likely improve further with
better care and medication compliance.
48
ChildChartbook-Sec1-D3c.qxd
2/23/04 9:44 AM
Page 49
E F F E C T I V E N E S S — L I V I N G W I T H I L L N E S S — E A R LY C H I L D H O O D — C H A R T 1 : 9
Prescription of Antibiotics to Prevent Infection among
Medicaid-Insured Young Children with Sickle Cell Disease
During a one-year period, Medicaid-insured young children
with sickle cell disease were dispensed an average of only 148
days (41%) of an expected 365-day supply of prophylactic
antibiotics to prevent potentially life-threatening
pneumococcal infections.
Children (younger than 4 years) with sickle cell
disease* continuously enrolled in Medicaid in two
states for a one-year period during 1995– 1999
148
days
Average number
of days of antibiotics
dispensed (41%
of an expected
365-day supply)
217
days
Average number of
days without antibiotic
prophylaxis (59%
of the year)
Source: Medicaid administrative claims and encounter data (N=261), as reported by Sox et al.
(2003). *Diagnosis of sickle cell anemia (hemoglobin SS) or sickle-beta (S-ߺ) thalessemia.
Leatherman and McCarthy, Quality of Health Care for Children and Adolescents: A Chartbook, 2004. The Commonwealth Fund
1: EFFECTIVENESS
49
ChildChartbook-Sec1-D3c.qxd
2/23/04 9:44 AM
Page 50
1: EFFECTIVENESS
Leatherman and McCarthy, Quality of Health Care for Children and Adolescents: A Chartbook, 2004. The Commonwealth Fund
E F F E C T I V E N E S S — L I V I N G W I T H I L L N E S S — E A R LY C H I L D H O O D T O A D O L E S C E N C E — C H A R T 1 : 1 0
Monitoring and Evaluation for Cystic Fibrosis
Why is this important? Cystic fibrosis (CF) is a life-shortening
genetic disorder characterized by chronic respiratory infections and
gradual loss of lung function, typically accompanied by digestive
disorder and malnutrition (CFF 2003a). Cystic fibrosis is diagnosed
in about 1,000 Americans each year, most frequently among white
children. Through aggressive treatment, the average life-expectancy
for people with cystic fibrosis has increased to more than 30 years
today from less than five years in the 1950s (CFF 2003a).
The Cystic Fibrosis Foundation (CFF 1997) recommends that
people with cystic fibrosis should receive:
• regular health care visits (at least four per year) to anticipate
and treat physical and psychosocial problems,
• lung function measurements (spirometry) every three to six
months to anticipate and treat complications and establish
patterns of response to treatment,
• at least one respiratory tract culture annually to detect and
treat respiratory pathogens,
• an annual chest X-ray to detect deterioration in lung structure
(especially important for young children in whom lung
function cannot yet be measured),
• an annual nutritional assessment to anticipate and treat
nutritional deficits, and
• other annual routine laboratory tests for disease
complications, such as cystic fibrosis-related diabetes.
In a comparison of process and outcomes of care across cystic
fibrosis specialty centers, children who received care in accordance
with CFF guidelines had better lung function, an important
outcome associated with survival (Johnson et al. 2003).
Findings: Among children and adolescents (ages birth to 17 years)
with cystic fibrosis, one of three (33%) did not receive the
recommended four monitoring visits and one of 20 (4%) did not
receive at least one respiratory tract culture during 2002. One of six
of those ages 6 to 17 years (16%) did not receive at least two lung
function measurements. One of five of those ages 14 to 17 years
(19%) did not receive a blood glucose test for glucose intolerance or
cystic fibrosis-related diabetes.
Source: Cystic Fibrosis Foundation Patient Registry Annual
Data Report (CFF 2003b). (Data were not available on chest X-ray
or nutritional assessment.)
Implications: Improvement is needed to ensure that all children
and adolescents with cystic fibrosis receive recommended
monitoring and evaluation that is associated with better
outcomes. The Cystic Fibrosis Foundation is working with its
network of care centers to identify and share best practices for
improving processes and outcomes of care, such as earlier
identification and management of cystic fibrosis-related diabetes
(Marshall 2003). As part of this effort, the National Initiative for
Children Healthcare Quality is working with several cystic fibrosis
centers on a learning collaborative to improve the quality of care
for children with cystic fibrosis. A toolkit has been developed to
assist professionals and parents in good nutritional management
and reducing children’s exposure to environmental tobacco
smoke (NICHQ 2003b).
50
ChildChartbook-Sec1-D3c.qxd
2/23/04 9:44 AM
Page 51
E F F E C T I V E N E S S — L I V I N G W I T H I L L N E S S — E A R LY C H I L D H O O D T O A D O L E S C E N C E — C H A R T 1 : 1 0
Monitoring and Evaluation for Cystic Fibrosis
Only two of three children and adolescents with cystic fibrosis,
a life-shortening genetic disease, received all recommended
monitoring visits during 2002, and about four of five received
100%
Cystic fibrosis patients (ages 0– 17 years)
in a national patient registry
90%
84%
recommended tests that can help anticipate problems and
direct treatment to maintain better lung function and reduce
the impact of disease complications.
96%
81%
80%
70%
67%
60%
50%
40%
30%
20%
10%
0%
Had four or more
outpatient visits
Had two or more lung
function measurements*
Had at least one culture
for respiratory pathogens
Had at least one
blood glucose test**
Received recommended monitoring and/or testing during 2002
Source: CFF Patient Registry Annual Data Report (N=13,817) as reported by the
Cystic Fibrosis Foundation (2003b). *Lung function was measured by spirometry
primarily for patients ages 6 and older. **Blood glucose test to detect glucose
intolerance or potential cystic fibrosis-related diabetes was measured for patients
ages 14 years and older.
Leatherman and McCarthy, Quality of Health Care for Children and Adolescents: A Chartbook, 2004. The Commonwealth Fund
1: EFFECTIVENESS
51
ChildChartbook-Sec2-D3c.qxd
2/23/04 9:50 AM
Page 52
2: SAFETY
Leatherman and McCarthy, Quality of Health Care for Children and Adolescents: A Chartbook, 2004. The Commonwealth Fund
PAT I E N T S A F E T Y — M U LT I - P E R S P E C T I V E — E A R LY C H I L D H O O D T O A D O L E S C E N C E — C H A R T 2 : 1
Patient Safety Indicators: Potential Medical Mistakes in Hospitals
Why is this important? Medical mistakes—which represent “the
failure of a planned action to be completed as intended or the use
of a wrong plan to achieve an aim” (Reason 1990)—are by
definition preventable. They account for thousands of adverse
events and deaths among hospital patients, including children,
each year (IOM 1999). A national public opinion poll found that
nearly one-half the public is very concerned about a medical
mistake that could injure them or a family member during a
hospital stay (KFF 2003).
The Institute of Medicine’s landmark 1999 report on medical
errors has prompted national efforts to measure and diminish
these threats to patient safety. As one response, the federal
government created Patient Safety Indicators (PSIs), which use
hospital billing records to “screen for problems that patients
experience as a result of exposure to the healthcare system, and
that are likely amenable to prevention by changes at the system or
provider level” (AHRQ 2003a).
Findings: Patient Safety Indicators identified potentially preventable
adverse events (potential medical mistakes) among newborns,
children, and adolescents (ages birth to 17 years) during hospital
stays nationally in 2000. They include a wide array of problems
related to medical, surgical, and nursing interventions. PSI rates
ranged from a low of 0.003 per 1,000 patients at risk for
transfusion reactions to a high of 7.67 per 1,000 patients at risk
for decubitus ulcers (bed sores).
Compared to adults (data not shown), children experienced
lower or similar rates of complications for about half the
indicators. Children had higher rates of complications of
anesthesia and postoperative physiologic and metabolic
derangement compared to nonelderly adults (ages 18–64).
Children had higher rates of accidental puncture or laceration
during procedures, postoperative respiratory failure, and
decubitus ulcers compared to younger adults (ages 18–44) only.
Children’s rates exceeded those of elderly adults (ages 65 and
over) only for infections due to intravenous lines and catheters.
Source: Agency for Healthcare Research and Quality,
Healthcare Cost and Utilization Project, Nationwide Inpatient
Sample, as reported by AHRQ (2003b).
Implications: Children and adolescents who experience potential
medical mistakes identified by PSIs have 2- to 6-fold longer
hospital stays, 2- to 18-fold higher rates of death, and 2- to 20-fold
higher hospital costs compared to those who do not have such
complications (Miller et al. 2003).
Data limitations mean that PSIs cannot offer definitive results,
but they are relatively inexpensive to implement. Thus, they offer
a good starting point to identify potential failures in processes and
systems of care that hospitals should evaluate for quality
improvement (Miller et al. 2003). Tools such as Pathways to
Medication Safety (HRET 2003) can help hospitals plan
appropriate changes—such as better organization, work
environment, training, procedures, teamwork, and
communication—to improve patient safety in the hospital.
52
ChildChartbook-Sec2-D3c.qxd
2/23/04 9:50 AM
Page 53
PAT I E N T S A F E T Y — M U LT I - P E R S P E C T I V E — E A R LY C H I L D H O O D T O A D O L E S C E N C E — C H A R T 2 : 1
Patient Safety Indicators: Potential Medical Mistakes in Hospitals
Infants, children, and adolescents hospitalized in 2000
experienced adverse events or complications that may be
preventable with improved quality of care.
Decubitus ulcers 1
Birth trauma
7.670
injury 2
6.680
Postoperative septicemia 3
3.870
failure 4
2.266
Accidental puncture or laceration during procedures 5
2.217
Postoperative respiratory
Infections due to intravenous lines or
catheters 6
1.893
Postoperative abdominal wound dehiscence 7
1.249
thrombosis 8
1.168
Postoperative pulmonary embolus or deep vein
Postoperative hemorrhage or hematoma 9
Postoperative physiologic and metabolic
1.024
derangements 10
0.913
Complications of anesthesia 11
0.718
groups 12
0.496
Iatrogenic pneumothorax 13
0.478
Deaths in low-mortality diagnosis-related
procedure 14
0.072
Transfusion reactions 15
0.003
Foreign body left in during
0.0
1.0
2.0
3.0
4.0
5.0
6.0
7.0
8.0
9.0
Adjusted rate of potentially preventable adverse events in 2000
per 1,000 U.S. hospital patients (ages 0–17 years) at risk*
Source: Agency for Healthcare Research and Quality, 2000 Healthcare Cost and
Utilization Project, Nationwide Inpatient Sample, as reported by AHRQ (2003b). *See
technical appendix for footnotes defining populations at risk and rate adjustments,
which vary by indicator.
Leatherman and McCarthy, Quality of Health Care for Children and Adolescents: A Chartbook, 2004. The Commonwealth Fund
2: SAFETY
53
ChildChartbook-Sec2-D3c.qxd
2/23/04 9:50 AM
Page 54
2: SAFETY
Leatherman and McCarthy, Quality of Health Care for Children and Adolescents: A Chartbook, 2004. The Commonwealth Fund
PAT I E N T S A F E T Y — M U LT I - P E R S P E C T I V E — E A R LY C H I L D H O O D T O A D O L E S C E N C E — C H A R T 2 : 2
Pediatric Medication Mistakes in the Hospital
Why is this important? Mistakes often occur in prescribing,
preparing, and administering medication for hospitalized patients
and these mistakes sometimes cause patient injury (IOM 1999).
Special procedures required for children, such as calculating
medication doses based on the child’s weight, may create
additional chance for error (Fortescue et al. 2003).
This chart presents data on medication mistakes among
pediatric patients at two Boston teaching hospitals, detected
during six weeks in 1999 (Kaushal et al. 2001). These data represent
one of the most in-depth analyses among the few studies on this topic to
date, although it may not be representative of all hospitals.
Findings: Medication mistakes were detected in six of every 100
medication orders for pediatric patients, occurring at a rate of 55
per 100 pediatric admissions or 157 per 1,000 patient-days. About
one of every five medication mistakes either caused patient harm
or had the potential to do so.
Preventable Adverse Drug Events: One of every 100 medication
mistakes resulted in patient injury. The rate of these events (0.05
per 100 medication orders) was the same as for adults in a similar
study.
Potential Adverse Drug Events: Another 19 of every 100
medication mistakes had the potential to cause patient harm. Two
of five (41%) of these mistakes were not caught before reaching
the patient. Moreover, they occurred at the highest rate among
“the youngest, most vulnerable” children in the neonatal intensive
care unit. The rate of potential adverse drug events (1.1 per 100
medication orders) was three times higher than reported for
adults in a similar study.
Stage of medication process: Nearly three-quarters (74%) of the
pediatric medication mistakes occurred when physicians
prescribed medication (data not shown).
Types of mistakes: Common mistakes were using an incorrect
medication dose, giving medication via the wrong route of
administration, failing to have full or accurate documentation,
missing a date or using a wrong date, and giving medication at the
wrong frequency.
Source: medical records, medication orders, medication
administration records, and clinician self-reports (Kaushal et al. 2001).
Implications: The potential for harm from pediatric medication
mistakes indicates an urgent need for efforts to examine and
“error-proof” the medication process for hospitalized children.
Attention also must be given to measuring and preventing
mistakes that occur in primary care and other outpatient settings.
Researchers judged that most of the preventable and potential
adverse drug events in these hospitals could have been averted by
one of three interventions: (1) using a computerized physician
order entry system with clinical decision support (such systems
must be tailored to include weight-based dosing for children), (2)
assigning full-time clinical pharmacists to support the medication
process on patient wards, or (3) improving communication
among physicians, nurses, and pharmacists (Fortescue et al.
2003). Simple tools also may be useful in reducing errors, such as
checklists and precalculated dosing guidelines (Goldman and
Kaushal 2002; USP 2002).
54
ChildChartbook-Sec2-D3c.qxd
2/23/04 9:50 AM
Page 55
PAT I E N T S A F E T Y — M U L T I - P E R S P E C T I V E — E A R LY C H I L D H O O D T O A D O L E S C E N C E — C H A R T 2 : 2
Pediatric Medication Mistakes in the Hospital
Medication mistakes occurred in six of every 100 medication
orders during a study at two hospitals. One of every five
medication mistakes either caused patient harm or had the
potential to cause harm. An incorrect medication dose was
the most common type of pediatric medication mistake.
Pediatric Medication Mistakes Detected at Two Hospitals During Six Weeks in 1999
BY TYPE
Other*
BY OUTCOME
Potential adverse
drug event
(mistake had the
potential to cause
19%
patient harm)
Incorrect
dose
19%
28%
Wrong
frequency
9%
12%
No/wrong
date
Mistake did not
cause harm and
did not have the
potential to do so
18%
14%
Wrong
route
81%
1%
Preventable adverse
drug event (mistake
caused patient harm)
MAR transcription
or documentation
Source: medical records, medication orders, medication administration records (MAR),
and clinician self-reports (N=616 errors), as reported by Kaushal et al. (2001). May not
be representative of all U.S. hospitals or of all pediatric medication mistakes.
Percentages may not add to 100 because of rounding. *Other includes: missing or wrong
weight (3.7%), illegible order (2.3%), wrong drug (1.3%), known allergy (1.3%), wrong
patient (0.2%), and other (9.9%).
Leatherman and McCarthy, Quality of Health Care for Children and Adolescents: A Chartbook, 2004. The Commonwealth Fund
2: SAFETY
55
ChildChartbook-Sec2-D3c.qxd
2/23/04 9:50 AM
Page 56
2: SAFETY
Leatherman and McCarthy, Quality of Health Care for Children and Adolescents: A Chartbook, 2004. The Commonwealth Fund
PAT I E N T S A F E T Y — M U LT I - P E R S P E C T I V E — E A R LY C H I L D H O O D T O A D O L E S C E N C E — C H A R T 2 : 3
Hospital-Acquired Infections in Pediatric Intensive Care Units
Why is this important? Hospital-acquired infections affect an
estimated two million Americans—including 500,000 intensive
care patients—each year (DHHS 2000b). Such infections result
in longer hospital stays (10 days per patient on average),
increased costs ($39,000 per case on average), and higher inhospital death rates (4 percentage points higher on average)
(Zhan and Miller 2003).
Patients in intensive care units (ICUs) are at increased risk of
acquiring infections because of frequent use of invasive medical
technologies and procedures, which save lives but also carry an
inherent risk for infection. A recent survey of 31 children’s
hospitals found that an average of 12 percent of patients being
cared for in pediatric ICUs had hospital-acquired infections on a
given day (Grohskopf et al. 2002).
Findings: Risk-adjusted rates of infection acquired by patients in
pediatric intensive care units declined for two types of deviceassociated infection monitored by hospitals participating in a
voluntary national surveillance system during 1995–2003
compared to 1986–1990.
• The rate of bloodstream infections associated with use of
central intravenous lines decreased by 36 percent (from 11.4
infections per 1,000 device-days of use during 1986–1990 to
7.3 during 1995–2003).
• The rate of urinary tract infections associated with use of
urinary catheters decreased by 19 percent (from 5.8 infections
per 1,000 device-days of use during 1986–1990 to 4.7 during
1995–2003).
There was little change in the rate of hospital-acquired
pneumonia associated with use of ventilators (4.7 infections
per 1,000 device-days of use during 1986–1990 vs. 4.9 during
1995–2001). Compared to general medical and surgical ICUs,
pediatric ICUs had a higher rate of bloodstream infections and
lower rates of urinary tract infections and pneumonias (data
not shown).
Source: National Center for Infectious Diseases, National
Nosocomial Infections Surveillance System, as reported by NCHS
(2001) and NCID (2001; 2003). Data may not be representative of
all U.S. hospitals.
Implications: Hospital-acquired infections can be substantially
reduced through ongoing monitoring and appropriate infection
control measures (Rowin et al. 2003). Proper hand hygiene is
perhaps the most important measure but is often not observed
(Elward and McGann 2002). Differences between children and
adults in factors such as immune system maturity, site and types
of infections, process of care, and patient interactions mean that a
child-specific approach often is necessary (Harris 1997).
Collaborative quality improvement initiatives such as the
Pediatric Prevention Network, sponsored by the National
Association of Children’s Hospitals and Related Institutions
(NACHRI) with support from the CDC, are studying pediatric
hospital-acquired infections so as to identify and validate
interventions to reduce their occurrence (Levine 2001). See Chart
6:9 for a collaborative project that reduced hospital-acquired infections
in neonatal intensive care units.
56
ChildChartbook-Sec2-D3c.qxd
2/23/04 9:50 AM
Page 57
PAT I E N T S A F E T Y — M U L T I - P E R S P E C T I V E — E A R LY C H I L D H O O D T O A D O L E S C E N C E — C H A R T 2 : 3
Hospital-Acquired Infections in Pediatric Intensive Care Units
Hospitals participating in a national surveillance system
have reduced the rates of two types of infections acquired by
patients in pediatric intensive care units.
Average device-related nosocomial
infection rate per 1,000 days of device use
12.0
■
■
1986–1990
1995–2001 / 2003*
11.4
10.0
8.0
7.3
5.8
6.0
4.7
4.7
4.9
4.0
2.0
0.0
Bloodstream infections associated
with use of central intravenous lines
Urinary tract infections associated
with use of urinary catheters
Source: National Center for Infectious Diseases, National Nosocomial Infections
Surveillance System (N=75 to 79 hospitals), as reported by NCHS (2001) and NCID
(2001; 2003). May not be representative of all U.S. hospitals.
Pneumonia associated with
use of ventilators
*January 1995 to June 2003, except ventilator-associated pneumonia rate is for
January 1995 to June 2001 (see technical appendix).
Leatherman and McCarthy, Quality of Health Care for Children and Adolescents: A Chartbook, 2004. The Commonwealth Fund
2: SAFETY
57
ChildChartbook-Sec3-D3c.qxd
2/23/04 9:57 AM
Page 58
3: ACCESS
Leatherman and McCarthy, Quality of Health Care for Children and Adolescents: A Chartbook, 2004. The Commonwealth Fund
A C C E S S A N D T I M E L I N E S S — M U LT I - P E R S P E C T I V E — E A R LY C H I L D H O O D T O A D O L E S C E N C E — C H A R T 3 : 1
Parent Perceptions of Accessibility and Timeliness of Care
Why is this important? Parents and other caregivers—especially
mothers—typically act as intermediaries in health care for
children, at least until the adolescent years. Parents’ perceptions of
the accessibility and interpersonal quality of care may affect their
care-seeking behavior, such as whether to use routine primary care
or visit the emergency room (Forrest and Starfield 1998;
Doobinin et al. 2003), and decisions related to selecting or
changing physicians and health plans (Kasteler et al. 1976;
Hickson et al. 1988; Guadagnoli et al. 2000). Greater accessibility
of primary care is associated with better health outcomes
(Starfield 1985; Shi et al. 2002).
Findings: According to parents of U.S. children and adolescents
(ages birth to 17 years) surveyed in 2000:
• One of eight (12%) children who had a doctor or clinic visit
in the past year had problems receiving care that the doctor or
parent thought was necessary.
• One of five (22%) children had problems getting a referral to a
specialist in the past year when the doctor or parent thought
the child needed to see a specialist.
• One of three (36%) children who needed care right away for
an illness or injury in the past year did not always get that care as
soon as the parent wanted.
• One of two (48%) children who had an appointment for
routine care in the past year did not always receive an
appointment as soon as the parent wanted.
Children and adolescents without insurance or covered only
by public insurance (such as Medicaid or State Children’s Health
Insurance Programs) were more likely than those with any private
insurance to have a parent report gaps in access to and timeliness
of care (data not shown).
Source: Agency for Healthcare Research and Quality, Medical
Expenditure Panel Survey (AHRQ 2002b).
Implications: Improvements are needed to better meet parent
expectations for timely and convenient access to care for children
and adolescents. Poorer ratings by parents of children without
insurance or with public coverage may reflect numerous barriers
such as concern about out-of-pocket costs, lack of geographically
accessible providers, and language differences (see Chart 5:6).
Extending health insurance to the uninsured is the most
important step to improving equitable access to health care
(Hargraves and Hadley 2003). The President’s Advisory
Commission on Consumer Protection and Quality in Health Care
(1997) recommended that children with chronic conditions who
need frequent specialty care should be allowed direct access to
specialists. Other interventions that experts (Berry et al. 2003)
have proposed to improve accessibility and timeliness of care
include:
• making appointment scheduling systems more flexible,
• increasing the use of mid-level practitioners such as physician
assistants and nurse practitioners,
• offering group appointments with team care,
• scheduling telephone consultations or using electronic
communications (with appropriate reimbursement) to
supplement face-to-face care, and
• extending after-hours (evening and weekend) care.
58
ChildChartbook-Sec3-D3c.qxd
2/23/04 9:57 AM
Page 59
A C C E S S A N D T I M E L I N E S S — M U LT I - P E R S P E C T I V E — E A R LY C H I L D H O O D T O A D O L E S C E N C E — C H A R T 3 : 1
Parent Perceptions of Accessibility and Timeliness of Care
In 2000, parents reported that up to one of five children and
adolescents (12% to 22%) had problems getting needed care
and up to half (36% to 48%) did not always get care as
quickly as desired.
U.S. children and adolescents (ages 0–17 years) in 2000
100%
90%
2%
10%
80%
70%
■
5%
A Big
Problem
17%
100%
80%
50%
30%
30%
No Problem
20%
20%
10%
10%
0%
0%
Problems (if any)
getting care that a doctor
or the parent
believed necessary1
■
40%
78%
■
33%
Usually
89%
40%
15%
Sometimes
or Never
■
60%
A Small
Problem
50%
26%
■
70%
■
60%
10%
90%
Problems (if any) getting
a referral to a specialist
that the child
needed to see2
Source: Agency for Healthcare Research and Quality, 2000 Medical Expenditure Panel
Survey, Parent-Administered Questionnaire (N=6,577) as reported by AHRQ (2002b).
Percentages may not add to 100 because of rounding.
64%
Always
52%
Child got care for an
illness or injury as soon
as parent wanted3
Child got an appointment
for routine care as soon
as parent wanted4
Notes:
1. among those who had a doctor or clinic visit in the past year
2. among those whose doctor or parent thought they needed to see a specialist in the past year
3. among those who had an illness or injury that needed care right away in the past year
4. among those who had an appointment for routine care in the past year.
Leatherman and McCarthy, Quality of Health Care for Children and Adolescents: A Chartbook, 2004. The Commonwealth Fund
3: ACCESS
59
ChildChartbook-Sec3-D3c.qxd
2/23/04 9:57 AM
Page 60
3: ACCESS
Leatherman and McCarthy, Quality of Health Care for Children and Adolescents: A Chartbook, 2004. The Commonwealth Fund
A C C E S S A N D T I M E L I N E S S / D I S PA R I T I E S — M U LT I - P E R S P E C T I V E — E A R LY C H I L D H O O D T O A D O L E S C E N C E — C H A R T 3 : 2
Regular Source and Unmet Needs for Care
Why is this important? Twelve percent of U.S. children and
adolescents—8.5 million—did not have any public or private
health insurance during the year in 2002 (Mills and Bhandari
2003). Twenty-two percent of U.S. children and adolescents live
in poverty or near poverty (up to 125 percent of poverty)
(Proctor and Dalaker 2003). Although Medicaid expansions and
the State Children’s Health Insurance Program (SCHIP) have
covered millions more children and adolescents in recent years,
one of five who live in poverty or near poverty remain
uninsured. Three-quarters of uninsured children are eligible for
Medicaid or SCHIP but remain unenrolled because of lack of
parental knowledge or interest or burdensome enrollment
procedures (Holahan et al. 2003).
The most important benefit of insurance is to facilitate having
a regular source of care (Starfield 2000). Children without a usual
source of care are more likely to have unmet needs for care
(Newacheck et al. 2000a), more hospitalizations, and higher costs
of care, and they are less likely to keep doctor appointments and
receive preventive care (Starfield 1998). The extent to which
children’s regular source of care is oriented toward primary care
greatly determines the benefit that children derive from that care
(Starfield 2000).
Findings: In 2000, U.S. children and adolescents (ages birth to 17
years) without insurance were much more likely than those with
insurance to lack a regular source for care and to have unmet
needs for health and dental care, as perceived by parents. Among
the uninsured, more than one of four (27%) did not have a
regular source of health care, one of six (16%) delayed care
because of cost, one of eight (13%) did not get needed health care
because of cost, and one of five (19%) did not get needed dental
care because of cost.
Source: National Center for Health Statistics, National Health
Interview Survey, as reported by Blackwell et al. (2003).
Implications: An estimated 7.3 million U.S. children and adolescents have unmet health and dental care needs, as perceived by
parents, or delayed care because of cost (Simpson et al. 1997).
Unmet needs may have long-term effects on health and
developmental outcomes (IOM 1998; Hadley 2003).
More effort and funding is needed to expand health insurance
coverage for children and adolescents (Lewit et al. 2003), enroll
those who are already eligible for Medicaid and SCHIP (such as
through outreach and simplified enrollment and renewal
procedures)(Ross and Hill 2003), and strengthen safety net
providers such as community and migrant health centers that can
help reduce disparities in access for those in underserved areas
(Politzer et al. 2001).
Formerly uninsured children who gain coverage are more
likely to have a usual source of care, fewer unmet needs for care,
increased use of preventive care, and improved health status (Lave
et al. 1998; Holl et al. 2000; Slifkin et al. 2002).
60
ChildChartbook-Sec3-D3c.qxd
2/23/04 9:57 AM
Page 61
ACCESS AND TIMELINESS / DISPARITIES — MULTI-PERSPECTIVE — EARLY CHILDHOOD TO ADOLESCENCE — CHART 3:2
Regular Source and Unmet Needs for Care
In 2000, children without insurance were much more likely
than those with private or public insurance to lack a regular
50%
U.S. children and adolescents
(ages 0– 17 years*) in 2000
source of health care and to have unmet needs for health and
dental care, as perceived by parents.
■
■
■
Private Insurance
Public Insurance
Uninsured
40%
30%
27%
19%
20%
16%
13%
10%
3%
4%
4%
3%
4%
6%
2%
1%
0%
No usual place
for health care
Did not get needed
health care in past year
because of cost
Delayed seeking
health care in past year
because of cost
Did not get needed
dental care in past year
because of cost
Source: National Center for Health Statistics, 2000 National Health Interview Survey
(N=13,376), as reported by Blackwell et al. (2003). *Ages 2–17 years for dental care.
“Other insurance” category omitted for clarity.
Leatherman and McCarthy, Quality of Health Care for Children and Adolescents: A Chartbook, 2004. The Commonwealth Fund
3: ACCESS
61
ChildChartbook-Sec3-D3c.qxd
2/23/04 9:57 AM
Page 62
3: ACCESS
Leatherman and McCarthy, Quality of Health Care for Children and Adolescents: A Chartbook, 2004. The Commonwealth Fund
A C C E S S A N D T I M E L I N E S S / D I S PA R I T I E S — M U LT I - P E R S P E C T I V E — M I D D L E C H I L D H O O D A N D A D O L E S C E N C E — C H A R T 3 : 3
Unmet Need for Mental Health Care
Why is this important? One of five children and adolescents
experience mental health problems severe enough to need mental
health evaluation in a given year (Kataoka et al. 2002) and one in
10 suffer a mental illness that causes some level of impairment
(DHHS 1999). Medication and psychosocial therapies are
efficacious for treating many mental health disorders in children
and adolescents such as attention-deficit/hyperactivity disorder,
depression, and disruptive disorders. Identifying children at risk of
developing psychosocial problems arising from factors such as
parental depression, maltreatment, or other family dysfunction is
important, because early intervention may prevent lifelong
problems (DHHS 1999).
Findings: Among children and adolescents (ages 6 to 17 years)
with mental health problems severe enough to indicate a clinical
need for mental health evaluation, four of five (79%) did not
receive a mental health evaluation or treatment in the past year,
according to parent report in 1997. Children and adolescents of
Hispanic ethnicity were more likely than white children and
adolescents to have an unmet need for mental health care;
children and adolescents covered by public insurance (such as
Medicaid) were less likely to have an unmet need than those
without health insurance.
Source: Urban Institute/Child Trends, 1997 National Survey of
America’s Families, as reported by Kataoka et al. (2002).
Implications: This data suggests that about 7.5 million U.S. children
and adolescents have an unmet need for mental health services
(Kataoka et al. 2002). Other research has found that the rate of
mental health care services provided to children varies among
states but not in proportion to need (Sturm et al. 2003). Social
consequences of this unmet need include lost opportunities to
prevent suicide, poor academic performance, substance abuse, and
future unemployment (DHHS 1999).
In a survey of pediatricians regarding depression in children,
most agreed that it is their responsibility to recognize depression,
but nearly half reported a lack of confidence in their ability to do
so (Olson et al. 2001). Assessment tools are recommended to help
primary care clinicians screen for mental health disorders in
adults, but their effectiveness has not yet been established for
children (USPSTF 2002) and they remain infrequently used at
pediatric visits (Gardner et al. 2003).
Potential solutions recommended by experts (DHHS 1999;
Wells et al. 2001; Farmer et al. 2003; Gilbody et al. 2003) include:
•
•
improving coverage for mental health care services;
coordinating resources among different sectors, programs,
and systems of care;
• implementing systematic quality improvement interventions
that include physician education, nurse case management, and
enhanced linkages between primary care clinicians, schools,
and mental health specialists; and
• increasing the availability of culturally competent care for
ethnic minorities.
In a study at one school-based health center, screening
adolescents for psychosocial problems resulted in decreased rates
of school absence and tardiness among those who were referred
for free mental health services (Gall et al. 2000).
62
ChildChartbook-Sec3-D3c.qxd
2/23/04 9:57 AM
Page 63
ACCESS AND TIMELINESS / DISPARITIES — MULTI-PERSPECTIVE — MIDDLE CHILDHOOD AND ADOLESCENCE — CHART 3:3
Unmet Need for Mental Health Care
Among children and adolescents with mental health problems
severe enough to indicate a clinical need for mental health
evaluation, four of five had not received any mental health
100%
U.S. children and adolescents (ages 6– 17 years in 1997)
with a need for mental health care*
88%
90%
80%
services during the past year, according to parent report in
1997. Children of Hispanic ethnicity and those without
insurance were more likely to have an unmet need for care.
87%
76%
77%
79%
White
Black
Private
79%
73%
70%
60%
50%
40%
30%
20%
10%
0%
Hispanic
Total
By race/ethnicity
Public
Uninsured
By insurance status
Did not receive any mental health care services in the past year
Source: Urban Institute/Child Trends, 1997 National Survey of America's Families
(N=21,824), as reported by Kataoka et al. (2002). *Need for mental health care was
defined by researchers based on parent-reported child behavior (see technical appendix
for methodology).
Leatherman and McCarthy, Quality of Health Care for Children and Adolescents: A Chartbook, 2004. The Commonwealth Fund
3: ACCESS
63
ChildChartbook-Sec3-D3c.qxd
2/23/04 9:57 AM
Page 64
3: ACCESS
Leatherman and McCarthy, Quality of Health Care for Children and Adolescents: A Chartbook, 2004. The Commonwealth Fund
A C C E S S A N D T I M E L I N E S S / D I S PA R I T I E S — S TAY I N G H E A LT H Y — E A R LY C H I L D H O O D T O A D O L E S C E N C E — C H A R T 3 : 4
Time Since Last Dental Visit
Why is this important? Dental caries (tooth decay) is the most
common childhood chronic disease—five times more prevalent
than asthma. Yet, tooth decay is largely preventable with good oral
hygiene, diet, and fluoride for parent and child. Once tooth decay
occurs it does not improve without treatment. Left untreated, it
can lead to abscesses and infections, pain, dysfunction, and low
weight (NIDCR 2000).
The American Academy of Pediatrics and the American
Academy of Pediatric Dentistry recommend that children have an
early assessment to identify those at high risk for tooth decay and
that all children establish a relationship with a regular dental
provider by age one year (AAPD 2002; AAP 2003). The American
Academy of Pediatric Dentistry and the federal Maternal and
Child Health Bureau’s Bright Futures initiative recommend two
dental visits annually starting at age one year to provide education
and services to prevent tooth decay, although a single annual
dental visit may be a more customary practice (Yu et al. 2002).
Findings: Among U.S. children and adolescents (ages 2 to 17 years),
more than one of four (26%) did not receive dental care in the
past year and one in seven (15%) did not receive any dental care
in the past five years, according to parent report in 2000. Minority
children, children in families with lower income, and those with
public or no insurance are less likely to receive regular dental care
than white, nonpoor, and privately insured children (respectively).
For example, only one-half of uninsured children and three of five
Hispanic children had a dental visit in the past year and about
one-quarter did not have a dental visit in the past five years.
Although about four of five white, nonpoor, and privately insured
children had a dental visit in the past year, one of eight did not
have a dental visit in the past five years.
Source: National Center for Health Statistics, 2000 National
Health Interview Survey, as reported by Blackwell et al. (2003).
(Visits may have included both preventive visits and visits to treat
a dental problem.)
Implications: A substantial proportion of U.S. children do not
receive regular dental care or any dental care, putting them at risk
of serious tooth decay. One-third of children lacked any dental
coverage in 1996 (Edelstein 2002). Those in low-income families
are more likely to have dental coverage through enrollment in
Medicaid and State Children’s Health Insurance Programs
(SCHIP). Yet, Medicaid-insured children are less likely to make
preventive dental visits and more likely to have tooth decay
(Colmers et al. 1999).
Medicaid spends just one-tenth of the national per capita
average on dental services for children (Colmers et al. 1999).
Few dentists participate in Medicaid because of low reimbursement and perceived administrative hassles (GAO 2000). Some
Medicaid and SCHIP programs are increasing the participation
of dentists through higher reimbursement and simplified
administration, and improving availability and use of services
through greater use of dental hygienists and outreach to
beneficiaries (Almeida et al. 2001; Gehshan et al. 2001; Mofidi
et al. 2002). Other barriers to care that need to be addressed for
low-income families include lack of transportation and
inability to get time off from work to take a child to the dentist
(GAO 2000).
64
ChildChartbook-Sec3-D3c.qxd
2/23/04 9:57 AM
Page 65
ACCESS AND TIMELINESS / DISPARITIES — STAYING HEALTHY — EARLY CHILDHOOD TO ADOLESCENCE — CHART 3:4
Time Since Last Dental Visit
One of four children and adolescents (26%) did not receive
dental care in the past year, and one of seven (15%) did not
receive any in the past five years, according to parents in
U.S. children and adolescents
(ages 2– 17 years) in 2000
2000. Minority children, children in families with lower
income, and children with public insurance or without
insurance are less likely to receive regular dental care.
■
■
■
More than 5 years
since last dental visit, or
have never seen a dentist
More than 1 year,
but not more than 5 years,
since last dental visit
One year or less
since last dental visit
100%
90%
80%
15%
13%
13%
17%
22%
8%
11%
17%
20%
70%
18%
13%
13%
7%
8%
17%
23%
15%
17%
18%
26%
60%
50%
40%
79%
74%
30%
80%
70%
63%
60%
80%
69%
65%
51%
20%
10%
0%
Hispanic
Total
White
Black
Poor
By race and ethnicity*
Near poor Not poor
By family income**
Source: National Center for Health Statistics, 2000 National Health Interview Survey
(N=13,376), as reported by Blackwell et al. (2003). Percentages may not add to 100 because
of rounding. *White and black race are non-Hispanic ethnicity. **For family income, poor
Private
Public
Uninsured
By type of insurance***
means below the federal poverty level, near poor means 100 percent to less than 200 percent
of the poverty level, and not poor means 200 percent of the poverty level or greater.
***Other insurance category omitted for clarity.
Leatherman and McCarthy, Quality of Health Care for Children and Adolescents: A Chartbook, 2004. The Commonwealth Fund
3: ACCESS
65
ChildChartbook-Sec3-D3c.qxd
2/23/04 9:57 AM
Page 66
3: ACCESS
Leatherman and McCarthy, Quality of Health Care for Children and Adolescents: A Chartbook, 2004. The Commonwealth Fund
A C C E S S A N D T I M E L I N E S S — S TAY I N G H E A LT H Y — P R E N ATA L D E V E L O P M E N T — C H A R T 3 : 5
Timely Initiation of Prenatal Care
Why is this important? The American College of Obstetricians and
Gynecologists recommends that women initiate prenatal care in
the first three months of their pregnancy. Early initiation of
prenatal care can be beneficial through early identification of risk
factors and provision of preventive advice to encourage healthy
lifestyle, treatment of conditions such as diabetes and high blood
pressure, and referrals to services such as nutrition and smoking
cessation programs (Alexander and Korenbrot 1995; McCormick
and Siegel 2001). Prenatal care helps improve maternal health and
survival and may contribute to improved infant survival by linking
women with high-risk pregnancies to better obstetrical and
neonatal care (Bronstein et al. 1995; McCormick and Siegel 2001;
Vintzileos et al. 2002). Mothers who obtain adequate prenatal
care appear to establish positive care-seeking behavior that makes
them more likely to obtain preventive care for their infants
(Kogan et al. 1998).
Findings: Among mothers of babies born live in the United States in
2001, one of six (17%) did not start prenatal care in the first
trimester of her pregnancy—an improvement compared to 1990,
when one of four (24%) mothers did not begin prenatal care early.
In 2001, state-specific rates of early entry into prenatal care
ranged from 69 percent in New Mexico to 91 percent in Rhode
Island. Only three states achieved the national Healthy People
2010 goal of 90 percent.
Source: National Center for Health Statistics, U.S. birth
certificate data, as reported by Martin et al. (2002).
Implications: Access to prenatal care improved during the past
decade as a result of expansions in Medicaid coverage for lowincome pregnant women (Howell 2001). Yet, the women most
likely to benefit from early and adequate prenatal care because of
their higher risk of poor birth outcomes—teens, blacks, and those
who are unmarried and have less education—remain less likely to
receive it (Alexander et al. 2002). Moreover, some women do not
receive all the content of prenatal care recommended by experts
(Petersen et al. 2001) and these women are more likely to have
worse birth outcomes (Kogan et al. 1994).
Half of women who started prenatal care late said they would
have liked to start care earlier, but many didn’t know that they
were pregnant (CDC 2000). Commonly cited barriers to prenatal
care include not being able to afford it, lack of transportation and
child care, not being able to get an appointment, and negative
attitudes toward health professionals or health care in general
(Alexander and Korenbrot 1995; Sanders-Phillips and Davis 1998;
CDC 2000).
Despite increased access to prenatal care, rates of premature
and low birthweight births have worsened during the past decade
(Martin et al. 2002). This trend may be caused by multiple factors
that adversely affect the health and well-being of disadvantaged
women throughout their life-course (Lu and Halfon 2003).
Further increases in prenatal care may have limited impact on
birth outcomes unless effective medical and psychosocial
interventions can be established and provided to those at need,
both before and during pregnancy (Shiono and Behrman 1995;
Alexander and Kotelchuck 2001).
66
ChildChartbook-Sec3-D3c.qxd
2/23/04 9:57 AM
Page 67
A C C E S S A N D T I M E L I N E S S — S TAY I N G H E A LT H Y — P R E N ATA L D E V E L O P M E N T — C H A R T 3 : 5
Timely Initiation of Prenatal Care
Five of six mothers (83%) began prenatal care in their first
three months of pregnancy in 2001, up from three-quarters
(76%) in 1990. Rates varied among the states, and only
three states met the national goal of 90 percent in 2001.
Percentage of infants born live in 2001 whose mother
began prenatal care in the first trimester of pregnancy
83
89
86
83
85
82
81
84
78
82
85
83
88
83
76
79
80
88
87
85
77
77
69
80
87
84 81
87
85
86 85
83
86
High: 91% (R.I.)
Avg: 83% (U.S.)
84
81
D.C. 74
79
80
82
91
90
91
89
80
87
84
84
83
83
88
Low: 69% (N.M.)
90– 100%
80– 89%
84
60– 79%
Source: National Center for Health Statistics, 2001 U.S. birth certificate data, as
reported by Martin et al. (2002).
Leatherman and McCarthy, Quality of Health Care for Children and Adolescents: A Chartbook, 2004. The Commonwealth Fund
3: ACCESS
67
ChildChartbook-Sec3-D3c.qxd
2/23/04 9:57 AM
Page 68
3: ACCESS
Leatherman and McCarthy, Quality of Health Care for Children and Adolescents: A Chartbook, 2004. The Commonwealth Fund
A C C E S S A N D T I M E L I N E S S / PAT I E N T A N D FA M I LY C E N T E R E D N E S S — L I V I N G W I T H I L L N E S S —
E A R LY C H I L D H O O D T O A D O L E S C E N C E — C H A R T S 3 : 6 A N D 3 : 7
Progress Toward Implementing National Goals for Community-Based Systems of Services
for Children with Special Health Care Needs
Why is this important? Children with special health care needs
(CSHCN) are defined as those “who have or are at increased risk
for a chronic physical, developmental, behavioral, or emotional
condition and who also require health and related services of a
type or amount beyond that required by children generally”
(McPherson et al. 1998).
About 13 percent of U.S. children and adolescents have existing
conditions that meet this definition (Blumberg 2003).* These
children are more likely than other children to be hospitalized,
restricted to bed, and absent from school (Newacheck et al. 1998).
Access to high-quality health care is important for these
vulnerable children to catch health problems early, keep health
problems from worsening, limit their adverse impact, and
maintain and restore normal functioning to the degree possible.
The federal Maternal and Child Health Bureau has identified
six outcome goals for community-based systems of services for
CSHCN nationally and at the state level. These goals have been
endorsed by over 70 professional and voluntary organizations
(MCHB 2003).
transition to adulthood. (See Chart 3:7 for performance on the
specific components by which these goals were measured.)
Source: National Center for Health Statistics, National Survey
of Children with Special Health Care Needs, as reported by the
CDC (2003d).
Implications: There is substantial room for improvement in serving
CSHCN, and especially for teens as they transition to adulthood.
Other research has found that CSHCN have more unmet health
care needs and are less satisfied with their usual source of health
care than other children, even though they are more likely to have
insurance coverage and a regular care provider (Newacheck et al.
1998; Silver and Stein 2001).
Improving community systems of care for these children
requires collaborative effort among health professionals, families,
health plans, and government and nongovernmental
organizations (McPherson et al. 1998). Although the children
represented in this data have greatest current needs for care, all
children can benefit from the kind of community-based care
described in the goals shown on these charts.
Findings: During 2001, parents reported that about one-quarter to
one-half (26% to 47%) of CSHCN (ages birth to 17 years) lacked
adequate access to or failed to receive the kind of well-organized,
continuous, coordinated, comprehensive, and family-centered
care that experts believe is essential to promote their well-being.
Most teens (ages 13–17 years) with special health care needs did
not receive all the services recommended to support their
* The National Survey of Children with Special Health Care Needs included nearly
all children and adolescents with existing complex health conditions such as autism,
cerebral palsy, cystic fibrosis, developmental delay, diabetes, Down syndrome,
mental retardation, muscular dystrophy, rare metabolic and genetic disorders,
sickle cell disease, and other rare disorders, as well as some children with more
common conditions such as allergies, asthma, and ADHD who have a high need for
services (Blumberg 2003). The survey did not include children at risk for
developing special needs.
68
ChildChartbook-Sec3-D3c.qxd
2/23/04 9:57 AM
Page 69
A C C E S S A N D T I M E L I N E S S / P AT I E N T A N D F A M I LY C E N T E R E D N E S S — L I V I N G W I T H I L L N E S S —
E A R LY C H I L D H O O D T O A D O L E S C E N C E — C H A R T S 3 : 6 A N D 3 : 7
Progress Toward Implementing National Goals for Community-Based
Systems of Services for Children with Special Health Care Needs
Among six goals identified by the Maternal and Child Health
Bureau to promote the health and well-being of children with
special health care needs (CSHCN), four were achieved by
one-half to three-quarters of CSHCN, according to parent
report in 2001. Very few teens received all the services needed
to help them make a successful transition to adulthood.
G OA L # 1 : Families of CSHCN partner in decision-making
and are satisfied with services*
58%
G OA L #2: CSHCN receive coordinated, ongoing,
comprehensive care in a medical home*
53%
G OAL #3: CSHCN are adequately
insured for services they need*
60%
G OAL #4: All children are screened early and
continuously for special health care needs
(Data not yet available for this goal)
G OAL #5: Services for CSHCN are organized
so families can use them easily
74%
G OA L #6: Teenage CSHCN receive services needed
to support transition to adulthood*
6%
0%
10% 20% 30% 40% 50% 60% 70% 80% 90% 100%
U.S. children with special health care needs in 2001**
Source: National Center for Health Statistics, 2001 National Survey of Children with
Special Health Care Needs (N=38,866 households), as reported by the CDC (2003d).
*See Chart 3:7 for components of these goals. **Ages 0–17 years for Goals #1–5 and
ages 13–17 years for Goal #6.
Leatherman and McCarthy, Quality of Health Care for Children and Adolescents: A Chartbook, 2004. The Commonwealth Fund
3: ACCESS
69
ChildChartbook-Sec3-D3c.qxd
2/23/04 9:57 AM
Page 70
3: ACCESS
Leatherman and McCarthy, Quality of Health Care for Children and Adolescents: A Chartbook, 2004. The Commonwealth Fund
A C C E S S A N D T I M E L I N E S S / P AT I E N T A N D F A M I LY C E N T E R E D N E S S — L I V I N G W I T H I L L N E S S —
E A R LY C H I L D H O O D T O A D O L E S C E N C E — C H A R T 3 : 7 A
Elements of Goals for Children with Special Health Care Needs
The Maternal and Child Health Bureau has identified six
goals for community-based systems of services for children
with special health care needs (CSHCN) nationally and at
G OA L # 1
the state level (see Chart 3:6). These charts show more
detailed performance on the specific components of certain
goals, based on a parent survey in 2001.
84%
Doctors made family feel like a partner
60%
Family was very satisfied with services received
G OA L # 2
91%
Child had a usual place to go for care
89%
Child had a personal doctor or nurse
40%
Effective care coordination was received when needed
78%
Child had no problems obtaining referrals when needed*
67%
Child received family-centered care**
0%
20%
40%
60%
80%
100%
U.S. children with special health care needs in 2001***
Source: National Center for Health Statistics, 2001 National Survey of Children with
Special Health Care Needs (N=38,866), as reported by the CDC (2003d). *Among
those who needed specialty care and a referral. **Family-centered care means that the
doctor usually or always spent enough time, listened carefully, was sensitive to values
and customs, provided needed information, and made the family feel like a partner.
***Ages 0–17 years for these goals.
70
ChildChartbook-Sec3-D3c.qxd
2/23/04 9:57 AM
Page 71
A C C E S S A N D T I M E L I N E S S / P AT I E N T A N D F A M I LY C E N T E R E D N E S S — L I V I N G W I T H I L L N E S S —
E A R LY C H I L D H O O D T O A D O L E S C E N C E — C H A R T 3 : 7 B
Elements of Goals for Children with Special Health Care Needs
G OA L # 3
95%
Child had public or private insurance
88%
Child had no gaps in coverage during the past year
86%
Insurance met child's needs*
72%
Costs not covered by insurance were reasonable*
88%
Insurance permitted child to see needed providers*
G OA L # 6 **
42%
Doctors discussed shift to an adult provider
50%
Doctors talked about changing needs
59%
Child had a plan for addressing changing needs
0%
20%
40%
60%
80%
100%
U.S. children with special health care needs in 2001***
Source: National Center for Health Statistics, 2001 National Survey of Children with
Special Health Care Needs (N=38,866), as reported by the CDC (2003d). Goal
#4 and Goal #5 do not have data components other than shown on Chart 3:6. *Among
those with insurance who answered “usually or always.” **Goal #6 includes a
measure of whether teens received vocational or career training, which is included in
the overall performance shown on Chart 3:6 but is not shown here because
performance is not under the control of the health care system. ***Ages 0–17 years for
Goal #3 and ages 13–17 years for Goal #6.
Leatherman and McCarthy, Quality of Health Care for Children and Adolescents: A Chartbook, 2004. The Commonwealth Fund
3: ACCESS
71
ChildChartbook-Sec3-D3c.qxd
2/23/04 9:57 AM
Page 72
3: ACCESS
Leatherman and McCarthy, Quality of Health Care for Children and Adolescents: A Chartbook, 2004. The Commonwealth Fund
ACCESS AND TIMELINESS / PATIENT AND FAMILY CENTEREDNESS — LIVING WITH ILLNESS — EARLY CHILDHOOD TO ADOLESCENCE — CHART 3:8
Medical Home for Children with Special Health Care Needs: State Performance
Why is this important? The American Academy of Pediatrics
recommends that all children and adolescents have a primary care
professional (or a multidisciplinary team for children with severe
chronic illnesses) whose practice serves as a “medical home,” to
help ensure that health care and other needed services are
accessible, continuous, comprehensive, family-centered,
coordinated, culturally competent, and compassionate (AAP
2002a; 2002b). A medical home is especially important to
children with special health care needs and their families, who
often need help to access and integrate needed services from a
complex web of providers and programs (Ziring et al. 1999;
Krauss et al. 2001).
Research suggests that children who have good primary care
have better outcomes (Starfield 1998). Children who have
continuity with a regular practitioner are more likely to adhere to
prescribed medication, receive preventive care and care that is
well-coordinated, resource efficient, and family-centered, less
likely to have ER visits and hospitalizations, and their physician is
more likely to recognize problems and track information about
the child (Starfield 1998; Christakis et al. 2000; 2001c; 2002;
2003). Some children seeing specialists as their regular source of
care report unmet general and preventive care needs, indicating a
need for coordination with primary care (Palfrey et al. 1980;
Carroll et al. 1983).
Findings: Among the states during 2001, the proportion of children
with special health care needs (ages birth to 17 years) who
received coordinated, ongoing comprehensive care in a medical
home ranged from 41 percent in the District of Columbia to 61
percent in Massachusetts. (The components of the medical home
measure are shown on Chart 3:7A.)
Source: National Center for Health Statistics, National Survey
of Children with Special Health Care Needs, as reported by the
CDC (CDC 2003d).
Implications: Many CSHCN do not receive care that meets the
elements of a medical home. Barriers that must be overcome to
achieve the medical home for all children include lack of
adequate reimbursement for coordination services, lack of
available community services, and fragmentation among different
programs, health plans, and providers serving these children
(Regalado and Halfon 2002).
Some states are partnering with and providing resources to
support health care providers and other community-based
organizations to create integrated systems of care (Gillespie and
Mollica 2003). Tools and resources are available to train and
support physician practices in developing and improving their
medical home for pediatric patients (Silva et al. 2000; CMHI
2003; NCMHI 2003). Improved coordination and coverage of
services needed by children with chronic illnesses reduced
hospitalizations and health care costs in one community (Liptak
et al. 1998). Electronic records may help improve coordination
and information tracking among different health care providers
(Starfield et al. 1977).
72
ChildChartbook-Sec3-D3c.qxd
2/23/04 9:57 AM
Page 73
A C C E S S A N D T I M E L I N E S S / P AT I E N T A N D F A M I LY C E N T E R E D N E S S — L I V I N G W I T H I L L N E S S —
E A R LY C H I L D H O O D T O A D O L E S C E N C E — C H A R T 3 : 8
Medical Home for Children with Special Health Care Needs
Among children who have a chronic physical, developmental, behavioral, or emotional condition and who
require health and related services beyond what is usual for
children generally, only one-half (53%) receive
coordinated, ongoing, comprehensive, family-centered care
from a health professional or team.
Percentage of CSHCN (ages 0– 17 years) who had an
effective medical home, according to parent report in 2001
54
57
55
52
49
52
49
52
57
55
56
56
57
54
49
56
52
56
56
45
51
53
45
56
51 56
59
58
51
57 55
49
49
High: 61% (Mass.)
Avg: 53% (U.S.)
47
47
D.C. 41
54
52
54
56
61
54
57
52
53
56
56
56
44
60
Low: 41% (D.C.)
60– 69%
50– 59%
48
40– 49%
Source: National Center for Health Statistics, 2001 National Survey of Children with
Special Health Care Needs (N=38,866) as reported by the CDC (2003d). Components
of this measure include: child had a usual source of care, child had a personal doctor
or nurse, effective care coordination was received when needed, child had no
problems obtaining referrals when specialty care was needed, and child received
family-centered care.
Leatherman and McCarthy, Quality of Health Care for Children and Adolescents: A Chartbook, 2004. The Commonwealth Fund
3: ACCESS
73
ChildChartbook-Sec4-D3a.qxd
2/19/04 11:30 AM
Page 74
4 : PAT I E N T / F A M I LY
Leatherman and McCarthy, Quality of Health Care for Children and Adolescents: A Chartbook, 2004. The Commonwealth Fund
PAT I E N T A N D F A M I LY C E N T E R E D N E S S — M U LT I - P E R S P E C T I V E — E A R LY C H I L D H O O D T O A D O L E S C E N C E — C H A R T 4 : 1
Parent Perceptions of Interpersonal Quality of Care
Why is this important? Parents have a substantial role in seeking
and overseeing their child’s health care. Parents’ perceptions of
interpersonal communication and time spent with health
professionals are important indicators of patient and family
centeredness and are closely tied to overall assessments of the
quality of care (Gross et al. 1998; Homer et al. 1999; Darby 2002).
The quality of parents’ communication with their child’s
health professional may affect parents’ receptivity to receiving
advice, how they oversee their child’s compliance with treatment
regimens, and satisfaction with and outcomes of care (Korsch et
al. 1968; Francis et al. 1969; Stewart 1995). The amount of time
that parents and pediatric patients have with clinicians may affect
their ability to raise questions or address issues that fall outside
the stated reason for a visit.
Findings: In 2000, among children and adolescents (ages birth to 17
years) who received health care in the past year:
• About one of three parents (32% to 35%) reported that the
child’s doctor or other health professional did not always
communicate well (in terms of listening carefully, showing
respect, and explaining things well).
• More than four of 10 parents (44%) reported that the doctor
or other health professional did not always spend enough
time with the parent and child.
Children and adolescents without insurance or covered only
by public insurance (such as Medicaid) were more likely than
those with any private insurance to have a parent report gaps in
timely access to and quality of care.
Source: Agency for Healthcare Research and Quality, Medical
Expenditure Panel Survey (AHRQ 2002b).
Implications: Improvements are needed to better meet parent
expectations. Interpersonal deficits in care may account for some
of the perception of inadequate time spent with the patient and
parent (Gross et al. 1998). Greater attention also needs to be paid
to the child’s role in communications with health professionals
(Tates and Meeuwesen 2001). Interventions that might address
these gaps include:
• education and incentives for health professionals and their
staff to help improve patient-centered communication skills
(Lewin et al. 2001);
• formal or informal patient feedback to help professionals
assess needs for improvement (O’Keefe 2001);
• culturally relevant questionnaires, written and audiovisual
materials, and coaching in the waiting room to help prepare
parents and children for effective health care encounters (Post
et al. 2002; Ashton et al. 2003);
• interpreter services and teams of professionals that include at
least one bilingual professional to overcome language barriers
(Brach and Fraser 2000);
• use of mid-level practitioners (physician assistants and nurse
practitioners) to increase time spent with patients during
intake and follow-up care (Berry et al. 2003); and
• follow-up services such as telephone calls to determine how
the child is doing post-care (Car and Sheikh 2003).
74
ChildChartbook-Sec4-D3a.qxd
2/19/04 11:30 AM
Page 75
PATIENT AND FAMILY CENTEREDNESS — MULTI-PERSPECTIVE — EARLY CHILDHOOD TO ADOLESCENCE — CHART 4:1
Parent Perceptions of Interpersonal Quality of Care
In 2000, just two-thirds of parents reported that their child's
doctor or other health professional always communicated well
and little more than half reported that the doctor or health
professional always spent enough time during the child's visit.
■
■
■
Always
Usually
Sometimes/Never
Child's doctor or other
health professional listened
carefully to parent
66%
28%
7%
Health professional
showed respect to what
parent had to say
67%
26%
6%
Health professional
explained things in a way
parent could understand
68%
Health professional
spent enough time
with parent and the child
26%
56%
0%
10%
20%
30%
34%
40%
50%
60%
70%
6%
10%
80%
90%
100%
U.S. children and adolescents (ages 0–17 years in 2000) who received care in the past year
Source: Agency for Healthcare Research and Quality, 2000 Medical Expenditure Panel
Survey, Parent-Administered Questionnaire (N=6,577), as reported by AHRQ (2002b).
Percentages may not add to 100 because of rounding.
Leatherman and McCarthy, Quality of Health Care for Children and Adolescents: A Chartbook, 2004. The Commonwealth Fund
4 : PAT I E N T / F A M I LY
75
ChildChartbook-Sec4-D3a.qxd
2/19/04 11:30 AM
Page 76
4 : PAT I E N T / F A M I LY
Leatherman and McCarthy, Quality of Health Care for Children and Adolescents: A Chartbook, 2004. The Commonwealth Fund
PAT I E N T A N D F A M I LY C E N T E R E D N E S S — M U LT I - P E R S P E C T I V E — E A R LY C H I L D H O O D T O A D O L E S C E N C E — C H A R T 4 : 2
Parent-Reported Problems with Hospital Care
Why is this important? Many hospitals are interested in learning
about patients’ experiences in an effort to promote patientcentered caregiving and to identify processes of care that they can
take steps to improve. Hundreds of hospitals internationally use
Picker Institute surveys to assess patients’ impressions of specific
aspects of hospital care, which are conceptually grouped into
seven dimensions of quality (Cleary et al. 1991; Co et al. 2003).
Example questions asked for the pediatric survey (several
questions are asked in each of these dimensions) include:
• Information to the child: Was information discussed in a way
that your child could understand?
• Coordination of care: Did one doctor or nurse say one thing and
then another say something quite different?
• Partnership in care: How much did you participate in your
child’s care?
• Information to parents: When you had important questions to
ask the doctors, did you get answers you could understand?
• Confidence and trust: Did you have confidence and trust in the
doctors caring for your child?
• Continuity and transition: Did someone on the hospital staff tell
you what you needed to know to care for your child at home?
• Physical comfort: Was the pain your child experienced more
than you were told it would be?
Findings: Summing across 38 hospitals that used the Picker Institute
Pediatric Inpatient Survey during 1997–1999 (primarily academic
or teaching institutions), parents reported problems on 18 percent
to 33 percent of the questions that they were asked within each of
seven dimensions of patient-centered quality of care (multiple
questions were asked within each dimension). Averaging across all
seven dimensions, parents reported problems on more than onequarter (27%) of the measures of hospital care for children who
were treated for medical conditions (not surgical or intensive care)
at these hospitals.
Source: Picker Institute Pediatric Inpatient Survey, as
reported by Co et al. (2003). Results may not be representative
of all hospitals.
Implications: These data demonstrate the importance of asking
specific questions to identify hospital care processes that warrant
attention and improvement. Parents’ overall rating of quality
(not shown) correlated most strongly with being provided
information and partnership in care, “indicating that parents
view being kept informed and involved in the care of their child
as the highest priority dimensions of patient-centered quality of
care” (Co et al. 2003).
Compared to similar surveys measuring adults’ perceptions of
their own care in the hospital, parents reported relatively more
problems for children in most dimensions, including
coordination of care, information sharing, partnership in care
(respect for patient preferences), and physical comfort. Adults
reported more problems for continuity and transition (Coulter
and Cleary 2001).
76
ChildChartbook-Sec4-D3a.qxd
2/19/04 11:30 AM
Page 77
PATIENT AND FAMILY CENTEREDNESS — MULTI-PERSPECTIVE — EARLY CHILDHOOD TO ADOLESCENCE — CHART 4:2
Parent-Reported Problems with Hospital Care
Parents of children who were treated for medical problems at
38 hospitals during 1997–1999 reported problems on 18
percent to 33 percent of the questions that they were asked
Average across all dimensions
about seven dimensions of quality. Averaging across all
dimensions, parents reported problems on more than onequarter (27%) of the survey measures of hospital care.
27%
Information to child
33%
Coordination of care
31%
Partnership in care
30%
Information to parent
29%
Confidence / trust
29%
Continuity / transition
22%
Physical comfort
18%
0%
10%
20%
30%
40%
50%
60%
70%
80%
90%
100%
Frequency that parents reported problems on questions
within each quality dimension during 1997– 1999
Source: 1997–1999 Picker Institute Pediatric Inpatient Survey (N=6,300 parents of
children hospitalized for nonsurgical, non-intensive care unit medical conditions) as
reported by Co et al. (2003). Results may not be representative of all U.S. hospitals.
Adapted and reproduced by permission of Pediatrics, Volume 111, Page 311,
Figure 1, Copyright 2003.
Leatherman and McCarthy, Quality of Health Care for Children and Adolescents: A Chartbook, 2004. The Commonwealth Fund
4 : PAT I E N T / F A M I LY
77
ChildChartbook-Sec4-D3a.qxd
2/19/04 11:30 AM
Page 78
4 : PAT I E N T / F A M I LY
Leatherman and McCarthy, Quality of Health Care for Children and Adolescents: A Chartbook, 2004. The Commonwealth Fund
PAT I E N T A N D F A M I LY C E N T E R E D N E S S — S TAY I N G H E A LT H Y — E A R LY C H I L D H O O D — C H A R T 4 : 3
Supporting Family Well-Being: Preferences and Practices
Why is this important? Children’s health and development
depends heavily on family well-being (Schor 2003). Family stress
or dysfunction from factors such as poverty, parental depression,
and substance abuse in the home can disrupt parenting and put
children at risk of developmental, behavioral, and emotional
problems. On the other hand, parents who quit smoking not
only avoid exposing their child to second-hand smoke but also
reduce the likelihood that their child will take up smoking
(Farkas et al. 1999).
To help children achieve better outcomes, the American
Academy of Pediatrics’ Task Force on the Family recommended
that pediatricians “strengthen parental partnerships in different
family types, screen for family circumstances that put children at
risk, and help create family-friendly practice environments”
(Schor 2003). Family-oriented care also is a core attribute of
family practice as articulated by the American Academy of
Family Physicians.
While most physicians say that they involve families in
decision-making around children, family-oriented pediatric care
goes further by addressing family issues that may affect the health
and well-being of children—such as by providing brief
counseling or referring a parent for treatment or services when
appropriate (Schor 2003).
Findings: In a national survey in 2000, the majority (56% to 94%)
of parents of young children (ages 4 to 35 months) agreed that
their child’s doctor or health professional should ask about six
topics related to family well-being, including parents’ health and
emotional support, violence in the community, difficulty
providing for the child’s needs, and substance abuse and tobacco
use in the household. More than three-quarters (77%) of parents
reported being asked whether a household member smoked
tobacco. Less than half (10% to 44%) of parents reported that
health professionals had discussed the other five topics with them.
Parent emotional support and economic concerns were the topics
exhibiting the greatest divergence between parent endorsement
and actual discussion.
Source: National Center for Health Statistics, National Survey
of Early Childhood Health, as reported by Halfon et al. (2002).
Implications: These data suggest that parents potentially agree with
a family-oriented approach to pediatric care, but it may not yet be
universally accepted in practice. In another study of primary care
practices, two of three mothers of young children reported health
behaviors or conditions (such as smoking or depression) that may
affect children; most said that they “would welcome” or “would
not mind” screening and referral for services at their child’s visit
(Kahn et al. 1999). Yet, a survey of pediatricians found that only
one-third conduct family risk assessments (Minkovitz et al. 1998).
One study found that it is feasible to provide brief smoking
cessation counseling and Nicotine Replacement Therapy for
parents at pediatric visits along with referrals to primary care and
follow-up telephone counseling (Winickoff et al. 2003). Greater
knowledge is needed about other interventions to realize the goals
of family-oriented care.
78
ChildChartbook-Sec4-D3a.qxd
2/19/04 11:30 AM
Page 79
PAT I E N T A N D F A M I LY C E N T E R E D N E S S — S TAY I N G H E A LT H Y — E A R LY C H I L D H O O D — C H A R T 4 : 3
Supporting Family Well-Being: Preferences and Practices
Most parents of young children want their child’s health
professional to ask about family well-being during pediatric
visits. Although health professionals often asked about
U.S. children ages
4– 35 months in 2000
■
smoking in the household, less than half (10% to 44%) of
parents reported in 2000 that their child's health professional
had asked about five other family well-being topics.
,
Parent agreed that child s health
professional should discuss topic
100%
80%
94%
89%
85%
90%
■
,
Parent reported that child s health
professional had asked about topic
77%
75%
73%
70%
56%
60%
50%
40%
44%
39%
32%
30%
20%
10%
10%
0%
Parent,s
physical health
Whether parent
has someone
for emotional
support
Violence in
community
12%
Difficulty paying
for child’s
basic needs
Drug / alcohol
use in
household
Smoker in
household
Source: National Center for Health Statistics, 2000 National Survey of Early Childhood
Health (N=2,068), as reported by Halfon et al. (2002).
Leatherman and McCarthy, Quality of Health Care for Children and Adolescents: A Chartbook, 2004. The Commonwealth Fund
4 : PAT I E N T / F A M I LY
79
ChildChartbook-Sec5-D3c.qxd
2/23/04 10:04 AM
Page 80
5: DISPARITIES
Leatherman and McCarthy, Quality of Health Care for Children and Adolescents: A Chartbook, 2004. The Commonwealth Fund
D I S PA R I T I E S — S TAY I N G H E A LT H Y — E A R LY C H I L D H O O D T O A D O L E S C E N C E — C H A R T 5 : 1
Differences in Receipt of Recommended Preventive Health Care Visits by
Type of Insurance, Race, Ethnicity, and Family Income
Why is this important? Without regular preventive health care
visits for children and adolescents, immunizations may be
delayed, health and developmental problems may go undetected,
parents will not receive advice on child safety and childrearing,
and adolescents will miss the opportunity for counseling to
encourage healthy lifestyles and help prevent risky behaviors. Lack
of preventive care is associated with more ER visits and avoidable
hospitalizations among young children (Hakim and Bye 2001;
Hakim and Ronsaville 2002).
Findings: Among children and adolescents (ages 3 to 17 years) in
1999, those with public insurance, minorities, and those with
family income below poverty were more likely than those with
private or no insurance, whites, and those with family income
above poverty (respectively) to receive preventive health care
(well-child) visits at recommended ages in the past year.*
• One of three (32%) without insurance missed well-child visits,
compared to one of four (24%) with private insurance and
one of seven (15%) with public insurance.
• One of eight black children (12%) and one of five of Hispanic
ethnicity (21%) or other race (22%) missed well-child visits,
versus one of four white children (26%).
• One of six (17%) in families with income below the poverty
level, versus one of four (24% to 26%) in families with
income above poverty, missed preventive visits.
Source: Urban Institute/Child Trends, 1999 National Survey of
America’s Families, as reported by Yu et al. (2002).
Implications: The higher rate of preventive health care visits among
minority and poor children probably reflects more comprehensive
coverage of preventive care for low-income children enrolled in
Medicaid and State Children’s Health Insurance Programs
(SCHIP). Federal standards for Medicaid Early and Periodic
Screening Diagnosis and Treatment (EPSDT) require coverage of
preventive health care visits in accordance with expert
recommendations. Two-thirds of the states operate their SCHIP
programs in whole or in part as a Medicaid expansion subject to
the EPSDT requirements. Medicaid prohibits cost-sharing for
categorically needy children and both Medicaid and SCHIP limit
copayments for other children (Pernice et al. 2001).
Improving rates of preventive care for children requires
expanding coverage for the uninsured and outreach to parents to
encourage greater preventive care-seeking. Reducing patient outof-pocket costs has been shown to increase immunization rates
(Briss et al. 2000). Private sector purchasers and health plans
should consider whether it would be cost-effective and feasible to
reduce out-of-pocket costs to encourage greater use of preventive
care among privately insured children. Primary care also needs to
be made more accessible, especially for low-income families
(Slifkin et al. 2002)(see Chart 3:1).
* Other research has found that minority and Medicaid-insured young children are
less likely to receive recommended well-child visits than are white and privately
insured young children (Ronsaville and Hakim et al. 2000; Thompson et al. 2003).
80
ChildChartbook-Sec5-D3c.qxd
2/23/04 10:04 AM
Page 81
D I S PA R I T I E S — S TAY I N G H E A LT H Y — E A R LY C H I L D H O O D T O A D O L E S C E N C E — C H A R T 5 : 1
Differences in Receipt of Recommended Preventive Health Care
Visits by Type of Insurance, Race, Ethnicity, and Family Income
Uninsured children and adolescents were least likely and
those with public insurance were most likely to receive
recommended preventive health visits, according to parent
report in 1999. More comprehensive public coverage probably
accounts for higher rates of preventive visits among minority
and poor children and adolescents.
U.S. children and adolescents (ages 3–17 years) in 1999
100%
88%
85%
80%
79%
76%
78%
74%
83%
76%
74%
76%
200% to
299% of
poverty
300% of
poverty
or more
68%
60%
40%
20%
0%
Private
Public
Uninsured
By type of insurance
Hispanic
White
not
Hispanic
Black
not
Hispanic
Other
not
Hispanic
Less than 100% to
100% of 199% of
poverty
poverty
By race and ethnicity
By family income*
Received an annual well-child visit at recommended ages**
Source: Urban Institute/ Child Trends, 1999 National Survey of America's Families
(N=35,938), as reported by Yu et al. (2002). *Poverty means the federal poverty level.
**Pediatric experts recommend an annual well-child visit at ages 3–6, 8, and 10–21
years; children ages 7 and 9 years were considered compliant with the
recommendations whether or not they received a well-child visit. Data were not
sufficient to measure compliance with recommendations for children ages 0–2 years.
Leatherman and McCarthy, Quality of Health Care for Children and Adolescents: A Chartbook, 2004. The Commonwealth Fund
5: DISPARITIES
81
ChildChartbook-Sec5-D3c.qxd
2/23/04 10:04 AM
Page 82
5: DISPARITIES
Leatherman and McCarthy, Quality of Health Care for Children and Adolescents: A Chartbook, 2004. The Commonwealth Fund
D I S PA R I T I E S — S TAY I N G H E A LT H Y — E A R LY C H I L D H O O D — C H A R T 5 : 2
Income, Racial, Ethnic, and Geographic Differences in Childhood Immunizations
Why is this important? High rates of vaccination are needed to
protect against periodic outbreaks of infectious disease. The
measles epidemic of 1989–1991, which caused 120 deaths and
11,000 hospitalizations (DHHS 2000a), was associated with low
vaccination rates among inner-city and minority preschool
children (NVAC 1991; Gindler et al. 1992). A review of research by
the National Vaccine Advisory Committee concluded that the
“most powerful and persistent barriers to timely immunization
are poverty and factors associated with poverty” (NVAC 1999).
Findings: Poor, minority, and urban children are less likely than
nonpoor, white, and suburban children (respectively) to be up to
date on recommended childhood immunizations. From 1994 to
2002, the disparity in combined coverage rate for four key
immunizations among children ages 19 to 35 months:
• narrowed between poor and nonpoor children (from an 11
percentage point difference in 1994 to a 7 percentage point
difference in 2002);
• narrowed between Hispanic and white children (from 10
percentage points in 1994 to 4 percentage points in 2002);
• widened between black and white children (from 5 percentage
points in 1994 to 9 percentage points in 2002);
• widened between urban and suburban children (from 2
percentage points in 1994 to 5 percentage points in 2002).
Source: National Center for Health Statistics, National
Immunization Survey, as reported by Eberhardt et al. (2001) and
the CDC (2003e).
Implications: Actions to increase childhood immunizations must
include ways to eliminate disparities for vulnerable children.
Parents may face obstacles to obtaining timely immunization for
their children, including inadequate clinic hours and convenient
locations (Orenstein et al. 1990). Many parents cannot remember
the immunization schedule (NVAC 1999) and many health care
providers do not send parents reminders when immunizations are
due (Tierney et al. 2003). Moreover, some eligible children are not
immunized when they do have contact with the health care
system (Szilagyi and Rodewald 1996).
Initiatives to link immunization to the federal Special
Supplemental Nutrition Program for Women, Infants, and
Children (WIC) have increased immunization rates up to 34
percentage points among low-income children. Interventions have
included education, assessment, referral, and incentives (varying
the frequency of required voucher pick-up based on
immunization status) (Briss et al. 2000).
Several studies have that found home visiting programs can
be effective in increasing immunization rates among hard-toreach subpopulations (such as children living in public housing
communities), although they can be resource intensive (Briss et
al. 2000). One innovative program reduced disparities by
assigning lay outreach workers to help inner-city physician
practices track immunization status, contact families by mail,
telephone, or home visits (for those with complex needs), and
provide assistance with scheduling or transportation as needed
(Szilagyi et al. 2002).
82
ChildChartbook-Sec5-D3c.qxd
2/23/04 10:04 AM
Page 83
D I S PA R I T I E S — S TAY I N G H E A LT H Y — E A R LY C H I L D H O O D — C H A R T 5 : 2
Income, Racial, Ethnic, and Geographic Differences in Immunizations
Poor, minority, and urban young children are less likely than
nonpoor, white, and suburban young children to be up to date
on immunizations. Disparity in rates of immunization has
narrowed between poor and nonpoor and between Hispanic
and white children, but has widened between black and white
and between urban and suburban children.
U.S. children ages 19– 35 months
100%
90%
80%
82%
82%
79%
72%
70%
74%
60%
72%
72%
75%
73%
67%
80%
81%
80%
77%
75%
70%
76%
71%
68%
62%
61%
50%
40%
By race and ethnicity:
By poverty status:
At or above poverty
Below poverty
30%
20%
By residence in:
Suburbs
Central cities
White, non-Hispanic
Black, non-Hispanic
Hispanic
10%
0%
1994
1998
2002
1994
1998
2002
1994
1998
2002
Received all recommended doses of four key vaccines (4:3:1:3 series)*
Source: National Center for Health Statistics, National Immunization Survey (N=25,247
households for Apr.-Dec. 1994 and 30,000+ households for Jan.-Dec. of other years),
as reported by Eberhardt et al. (2001) and the CDC (2003e). *4:3:1:3: series =4+
doses of diphtheria and tetanus toxoids and pertussis vaccine or diphtheria and tetanus
toxoids only, 3+ doses of poliovirus vaccine, 1+ dose of measles-containing vaccine,
and 3+ doses of Haemophilus influenzae type b vaccine.
Leatherman and McCarthy, Quality of Health Care for Children and Adolescents: A Chartbook, 2004. The Commonwealth Fund
5: DISPARITIES
83
ChildChartbook-Sec5-D3c.qxd
2/23/04 10:04 AM
Page 84
5: DISPARITIES
Leatherman and McCarthy, Quality of Health Care for Children and Adolescents: A Chartbook, 2004. The Commonwealth Fund
D I S PA R I T I E S — L I V I N G W I T H I L L N E S S — E A R LY C H I L D H O O D T O A D O L E S C E N C E — C H A R T 5 : 3
Racial and Ethnic Differences in Asthma Management
Why is this important? Although the burden of asthma has been
increasing among all children in the U.S, minority and poor
children suffer disproportionately from asthma (Akinbami et al.
2002). For example, compared to white children, black children
are 44 percent more likely to have an asthma attack, three times
more likely to visit an emergency room and to be hospitalized,
and four times more likely to die from asthma. Good asthma
management in accordance with national guidelines—such as
having a written plan to manage asthma at home and using antiinflammatory medication when indicated to control underlying
symptoms—can prevent asthma attacks and reduce adverse
outcomes such as emergency room visits and hospitalizations
(NAEPP 1997).
Findings: In 1999, rates of using recommended medication and
having a written management plan were low among all Medicaidinsured children (ages 2 to 16 years) with asthma enrolled in five
managed health care plans.
Compared to white children, black and Latino children were
equally or more likely to have made a primary care visit for
asthma care, to have seen a specialist for asthma care, and to have
an asthma management plan, suggesting similar access to care.
Yet, black and Latino children were less likely to be regularly using
an inhaled anti-inflammatory medication when indicated for
persistent asthma, despite having worse asthma than white
children.
Source: parent telephone interviews and computerized
medical records and claims data (Lieu et al. 2002).
Implications: Racial and ethnic differences in asthma antiinflammatory medication use persist among low-income children
even when they are equally insured with full prescription drug
coverage. This disparity may reflect deficiencies in both physician
prescribing and patient adherence.
Other research suggests that minority families are more likely
than white families to view asthma as being uncontrollable and to
have negative attitudes about anti-inflammatory medications
(Yoos et al. 2003). Cultural and ethnic differences in
communication between physicians and parents and older
children may prevent the physician from making an accurate
diagnosis and treatment plan as well as lead to poor
understanding of the physician’s recommendations and, thus, less
adherence to treatment regimens (Flores et al. 2002).
Several interventions have improved asthma care and
outcomes for low-income and minority children living in the
inner city, including use of:
• evidence-based professional education and supports for
practitioners in inner-city public health clinics serving children
(Evans et al. 1997),
• intensive patient and family education and outreach at an
inner-city hospital specialty clinic (Kelly et al. 2000)
(see Chart 6:7), and
• social workers to improve communication between inner-city
children and their physicians (Evans et al. 1999).
84
ChildChartbook-Sec5-D3c.qxd
2/23/04 10:04 AM
Page 85
D I S PA R I T I E S — L I V I N G W I T H I L L N E S S — E A R LY C H I L D H O O D T O A D O L E S C E N C E — C H A R T 5 : 3
Racial and Ethnic Differences in Asthma Management
Among low-income children with asthma insured by
Medicaid during 1999, black and Latino children were
equally or more likely to have primary and specialty care
visits and to receive a written plan to help them manage
100%
their asthma symptoms compared to white children. Yet,
black and Latino children were less likely to be regularly
using preventive medication when indicated to control their
asthma symptoms.
Medicaid-insured children and adolescents
(ages 2– 16 years) enrolled in five Medicaid
managed care plans in three states in 1999
■ ■ ■
White
Black
Latino
90%
80%
70%
60%
62%
58%
53%
50%
40%
33%
30%
18%
20%
21% 23%
27%
17%
28%
22%
22%
10%
0%
Made a primary care
visit for asthma care
in past 6 months
Visited a specialist
for asthma
in past 6 months
Had a written asthma
management plan
Used daily
anti-inflammatory
medication
(among children with
persistent asthma)
Source: 1999 Asthma Care Quality Assessment Project, telephone survey with parents
(N=1,658) and computerized medical records and claims data, as reported by Lieu et al. (2002).
Leatherman and McCarthy, Quality of Health Care for Children and Adolescents: A Chartbook, 2004. The Commonwealth Fund
5: DISPARITIES
85
ChildChartbook-Sec5-D3c.qxd
2/23/04 10:04 AM
Page 86
5: DISPARITIES
Leatherman and McCarthy, Quality of Health Care for Children and Adolescents: A Chartbook, 2004. The Commonwealth Fund
D I S PA R I T I E S — L I V I N G W I T H I L L N E S S — M I D D L E C H I L D H O O D — C H A R T 5 : 4
Gender and Racial Differences in Evaluation and Treatment for
Attention-Deficit/Hyperactivity Disorder
Why is this important? Attention-deficit/hyperactivity disorder
(ADHD) is the most commonly diagnosed childhood behavioral
problem in the U.S. (NIMH 1999). Seven percent of children and
adolescents have been diagnosed with ADHD, according to parent
report in 2000 (Blackwell et al. 2003). Treatment for ADHD—
which may include medication and/or behavioral therapy—can
improve symptoms and academic performance (Dulcan 1997;
AHRQ 1999; AAP 2001).
Several studies have reported that girls and minorities are less
likely to receive ADHD treatment; such disparities may arise from
multiple factors including recognition by parents and teachers,
care-seeking behaviors, barriers to accessing care, and actions of
health professionals (Bussing et al. 2003).
Findings: In a 1998 study in one school district, most elementary
school-age children identified by researchers as having
symptoms of ADHD were recognized by their parent as having
behavior problems. Among these children, boys were more
likely than girls and white children were more likely than
African American children to have been professionally
evaluated, diagnosed, and treated for ADHD. Those with a
regular source of health care were more likely to be evaluated
(data not shown).
Source: parent and teacher surveys (Bussing et al. 2003).
Implications: This study suggests that seeking professional
evaluation is a key factor determining treatment for ADHD. Girls
with ADHD may be less likely than boys with ADHD to manifest
behaviors that prompt parents to seek evaluation (Gaub and
Carlson 1997). African American parents are less likely than white
parents to know about ADHD, less likely to receive information
about ADHD from their child’s health professional, and more
likely to report low expectations for health care—all potential
barriers to seeking help for their children (Bussing et al. 2003).
Providing education for parents of children with symptoms of
ADHD, ensuring support from school personnel, and providing
improved access to family-centered, routine pediatric care may
help to reduce disparity in care-seeking (Bussing et al. 2003). The
National Initiative for Children’s Healthcare Quality has developed
a toolkit—including educational resources for parents—to assist
clinicians caring for children with ADHD (NICHQ 2003a), based
on evidence-based guidelines developed by the American Academy
of Pediatrics (AAP 2001). The AAP has incorporated these tools
into an online learning program called Education in Quality
Improvement for Pediatric Practice (McInerny et al. 2003).
86
ChildChartbook-Sec5-D3c.qxd
2/23/04 10:04 AM
Page 87
D I S PA R I T I E S — L I V I N G W I T H I L L N E S S — M I D D L E C H I L D H O O D — C H A R T 5 : 4
Gender and Racial Differences in Evaluation and Treatment
for Attention-Deficit/Hyperactivity Disorder
In 1998, most elementary school children with symptoms of
attention-deficit/hyperactivity disorder (ADHD) were
recognized by their parent as having behavior problems. Boys
were more likely than girls and white children were more
■
Elementary school children
with symptoms of ADHD in
one school district in 1998
100%
likely than African American children to have been
professionally evaluated and subsequently diagnosed and
treated for ADHD.
Behavior problems
recognized by parent
93%
Evaluated for ADHD by
health professional
91%
90%
■
■
Diagnosed
with ADHD
Treated
for ADHD
■
85%
82%
80%
70%
60%
50%
57%
51%
47%
40%
44%
35%
30%
31%
20%
20%
28%
20%
15%
15%
9%
10%
0%
Boys
Girls
White
African American
Source: 1998 teacher and parent surveys (N=1,615 children screened and 389 identified
with symptoms), as reported by Bussing et al. (2003). Note: study did not assess the
appropriateness of diagnosis or treatment.
Leatherman and McCarthy, Quality of Health Care for Children and Adolescents: A Chartbook, 2004. The Commonwealth Fund
5: DISPARITIES
87
ChildChartbook-Sec5-D3c.qxd
2/23/04 10:04 AM
Page 88
5: DISPARITIES
Leatherman and McCarthy, Quality of Health Care for Children and Adolescents: A Chartbook, 2004. The Commonwealth Fund
D I S PA R I T I E S — L I V I N G W I T H I L L N E S S — E A R LY C H I L D H O O D T O A D O L E S C E N C E — C H A R T 5 : 5
Effect of Family Income on Parent Perceptions of Accessibility and Interpersonal
Quality of Care for Children with Special Health Care Needs
Why is this important? Children living in poverty have worse
health and greater disability than children in higher income
families, even when they suffer from the same diseases (Starfield
1997). Families with low income are less likely to have health
insurance and their children are less likely to get needed health
care. Moreover, poverty is associated with other risk factors such as
poor living conditions and inadequate nutrition (Starfield 1997).
Children with special health care needs (CSHCN*) are more
likely than other children to have unmet needs for health care
across all income levels (Silver and Stein 2001). These children
may be especially vulnerable to the effects of income disparities in
access to care and in the degree to which services are tailored to
meet the family’s unique needs (Newacheck et al. 1998). See Chart
3:6 for additional background on this population.
Findings: In 2001, parents of children with special health care
needs (ages birth to 17 years) with family income below the
federal poverty level were three-and-one-half times more likely
than those with higher family income (400 percent of poverty or
higher) to report that their child had one or more unmet needs
for health care (32% vs. 9%) and twice as likely to report a lack
of family centeredness (50% vs. 25%) in the health care that their
child did receive.**
Source: National Center for Health Statistics, National Survey
of Children with Special Health Care Needs, as reported by van
Dyck (2003) and Blumberg (2003).
Implications: Children with special health care needs who
“experienc[e] the greatest difficulties are concentrated among the
most disadvantaged segments of [this] population” (Newacheck
et al. 2003). Lack of or inadequate insurance coverage and other
access barriers such as lack of transportation may be especially
problematic for low-income families whose children have special
health care needs.
Children with special health care needs insured by public
programs such as Medicaid are more likely than those without
insurance, but less likely than those with private insurance, to see
a regular health professional and to have access to after-hours
care (Newacheck et al. 2000b). These families may especially
benefit from more comprehensive coverage, greater integration
among health and social programs, improved community
services, and culturally sensitive, family-centered assistance to
navigate the health care system (Halfon and Hochstein 1997;
Garwick et al. 1998).
* Children with special health care needs are defined as those “who have or are at
increased risk for a chronic physical, developmental, behavioral, or emotional
condition and who also require health and related services of a type or amount beyond
that required by children generally” (McPherson et al. 1998). The survey identified
only those with existing conditions, not those at risk of developing special needs.
** Family-centered care means that the doctor usually or always spends enough time,
listens carefully, provides needed information, is sensitive to the family ’s culture and
values, and makes the family feel like a partner.
88
ChildChartbook-Sec5-D3c.qxd
2/23/04 10:04 AM
Page 89
D I S PA R I T I E S — L I V I N G W I T H I L L N E S S — E A R LY C H I L D H O O D T O A D O L E S C E N C E — C H A R T 5 : 5
Effect of Family Income on Parent Perceptions of Accessibility and
Interpersonal Quality of Care for Children with Special Health Care Needs
Among children who have a chronic physical, developmental,
behavioral, or emotional condition and who require health
and related services beyond what is usual for children
100%
U.S. children with special health
care needs (ages 0– 17 years) in 2001
90%
generally, those with lower family income were more likely to
have an unmet need for health care and to lack family
centeredness in their care, according to parent report in 2001.
■
■
■
■
Family income
less than 100%
of poverty*
100%–199%
of poverty
200%–399%
of poverty
400% of
poverty or more
80%
70%
60%
50%
50%
40%
30%
20%
38%
32%
30%
27%
25%
15%
9%
10%
0%
One or more unmet need
for health care services
Lacks one or more components
of family-centered care**
Source: National Center for Health Statistics, preliminary data from the 2001 National
Survey of Children with Special Health Care Needs (N=38,866), as reported by van
Dyck (2003) and Blumberg (2003). *Poverty means the federal poverty level.
**Components of family-centered care include: the doctor spends enough time with
child, listens carefully, provides needed information, is sensitive to the family ’s culture
and values, and makes the family feel like a partner in the child’s care.
Leatherman and McCarthy, Quality of Health Care for Children and Adolescents: A Chartbook, 2004. The Commonwealth Fund
5: DISPARITIES
89
ChildChartbook-Sec5-D3c.qxd
2/23/04 10:04 AM
Page 90
5: DISPARITIES
Leatherman and McCarthy, Quality of Health Care for Children and Adolescents: A Chartbook, 2004. The Commonwealth Fund
D I S PA R I T I E S — M U LT I - P E R S P E C T I V E — E A R LY C H I L D H O O D T O A D O L E S C E N C E — C H A R T 5 : 6
Effect of Race, Ethnicity, and Language on Parent Assessment of Accessibility
and Interpersonal Quality of Care
Why is this important? Racial and ethnic minorities may have
unique cultural beliefs and practices as well as language
differences that affect their access to and experience with health
care (Flores and Vega 1998; Flores et al. 2002). “Ethnic and
cultural norms influence a patient’s propensity to ask questions,
express concerns, and be assertive during a medical interaction,”
which may influence a physician’s propensity to share
information and express empathy (Ashton et al. 2003). Adverse
consequences of cultural and language differences in health care
for children may include misdiagnosis, misunderstanding of
treatment instructions, and inappropriate medication, testing, and
hospitalization (Flores et al. 1998; 2002).
One of every 12 U.S. residents (8%) speaks a language other
than English at home and does not speak English very well or at
all (U.S. Census Bureau 2003). Courses in English as a second
language typically do not teach the terminology needed to
communicate well about medical care (Downing and Roat 2002).
A national survey found that only half of Spanish-speaking
Hispanics who needed an interpreter to speak with their doctor
always or usually had access to one (Doty 2003). Another study
found a high rate of errors in interpreting, especially by ad hoc
interpreters, during pediatric visits at one hospital outpatient
clinic (Flores et al. 2003). Only five states currently use federalstate matching funds to pay for language services as part of
Medicaid and SCHIP programs (Andrulis et al. 2002).
Findings: Minority parents of children (ages birth to 17 years)
enrolled in Medicaid managed care plans in six states, surveyed
during 1997–1998, generally rated accessibility and interpersonal
quality of care lower than did white parents. Most ratings were
significantly lower for parents who identified themselves as
black/African American or American Indian/Alaskan Natives
(nearly all of whom were English-speaking). Those who identified
themselves as Asian/Pacific Islander or of Hispanic ethnicity and
who did not speak English as their primary language gave
significantly lower ratings than both white parents and their
English-speaking Asian and Hispanic counterparts.
Source: Consumer Assessment of Health Plans (CAHPS)
Benchmarking Database, as reported by Weech-Maldonado et al.
(2001), and personal communication with Robert WeechMaldonado (2003).
Implications: Language barriers and communication problems may
figure prominently in disparities for racial and ethnic minorities
(Ashton et al. 2003). Policy options for overcoming these barriers
include increasing the availability of competent interpreter services
(including appropriately trained and supervised volunteers) and of
bilingual and minority health professionals and staff, and
encouraging the use of culturally and language- and literacyappropriate materials (Betancourt et al. 2002; Downing and Roat
2002). Experts recommend that doctors evaluate their
communication competence and seek training when needed to
improve culturally competent health care, such as by helping
patients to ask questions and express concerns (Ashton et al. 2003).
90
ChildChartbook-Sec5-D3c.qxd
2/23/04 10:04 AM
Page 91
D I S PA R I T I E S — M U L T I - P E R S P E C T I V E — E A R LY C H I L D H O O D T O A D O L E S C E N C E — C H A R T 5 : 6
Effect of Race, Ethnicity, and Language on Parent Assessment of
Accessibility and Interpersonal Quality of Care
Minority parents of children and adolescents enrolled in
Medicaid health plans in six states rated the accessibility and
interpersonal quality of their child’s care lower than white
Parent ratings for children
(ages 0– 17 years) in Medicaid
managed care plans in six states
during 1997– 1998*
100%
90%
80%
70%
60%
50%
40%
30%
20%
10%
0%
83
78 80 74
84
■
■
■
■
■
■
■
White
Black /
African
American
HispanicEnglish
speaking
HispanicSpanish
speaking
AsianEnglish
speaking
Asianother
language
American
Indian /
Alaskan
Native
79
73 73
parents during 1997–1998. Language barriers were a major
factor in disparity of ratings for Asian and Hispanic parents.
85 85 83
73 74
74
75
81
77 80
66
65
58
Getting needed care
Getting care quickly
How well health
professionals communicate
Source: 1997–1998 Consumer Assessment of Health Plans (CAHPS) Benchmarking
Database (N=9,540), as reported by Weech-Maldonado et al. (2001), and personal
communication with Robert Weech-Maldonado (2003). *Scores were adjusted for
differences in parent’s age, parent’s gender, parent’s education, and child’s health status.
Leatherman and McCarthy, Quality of Health Care for Children and Adolescents: A Chartbook, 2004. The Commonwealth Fund
5: DISPARITIES
91
ChildChartbook-Sec6-D3c.qxd
2/23/04 11:02 AM
Page 92
6 : C A PAC I T Y
Leatherman and McCarthy, Quality of Health Care for Children and Adolescents: A Chartbook, 2004. The Commonwealth Fund
C A PA C I T Y T O I M P R O V E — S TAY I N G H E A LT H Y — E A R LY C H I L D H O O D — C H A R T 6 : 1
Improving Primary Care Office Systems to Increase Preventive Care for Young Children
Why is this important? Research indicates that primary care
practitioners improve their ability to deliver preventive care when
they adopt a systematic, organized approach—such as using
information tools, improving office processes, and increasing
teamwork among office staff (Dietrich et al. 1997; Dickey et al.
1999; Goodwin et al. 2001). Yet, less than half of primary care
physicians report using such office systems (Dickey and Kamerow
1996). For example, only two of five pediatricians (38%) report
assessing immunization performance and one of six (16%)
report using systems to remind parents about upcoming or
overdue immunizations (Tierney et al. 2003)—techniques that
are effective and recommended for improving immunization
rates (CDC 1999a).
Intervention: This study evaluated the impact of a year-long,
community-wide collaborative effort to increase preventive care
for young children (Bordley et al. 2001). All the major primary
care group practices and clinics serving young children in
Durham, North Carolina, established multidisciplinary teams and
received technical assistance to set objectives, monitor
performance, and adopt or enhance quality-improvement systems
directed at one or more levels:
1. patients—educational materials and activation cards to prompt
discussions with the doctor or nurse;
2. practitioners—post-it reminders on patient charts and risk
assessments to prompt screening when appropriate; and
3. the practice—chart prescreening to identify needed services,
flowsheets indicating recommended age-specific services, and
tracking systems to identify patients in need of care.
Findings: After the intervention, the combined rates of preventive
care provided to patients of these practices increased significantly
for three of four project goals compared to preintervention rates:
• being up to date on immunizations (by 7 percentage points at
age 12 months and by 12 percentage points at age 24 months),
• screening for anemia (by 30 percentage points), and
• screening (risk assessment or blood testing) for lead poisoning
(by 36 percentage points).
Rates of screening for tuberculosis, the fourth goal, increased
at practices that focused on this objective but not in aggregate
(data not shown).
Source: random samples of medical records (Bordley et al. 2001).
Implications: With assistance, primary care practitioners can
establish and improve office systems to increase preventive care
for children. The degree of improvement achieved varied among
practices depending on whether they targeted a particular service
for improvement and based on their ability to successfully
implement changes in office systems (Bordley et al. 2001).
Controlled studies may be useful to verify the effectiveness of this
approach and compare the relative effectiveness of different tools.
Other research suggests that having an organizational
“champion” is important to lead efforts at adopting such tools
(Tierney et al. 2003).
92
ChildChartbook-Sec6-D3c.qxd
2/23/04 11:02 AM
Page 93
C A PA C I T Y T O I M P R O V E — S TAY I N G H E A LT H Y — E A R LY C H I L D H O O D — C H A R T 6 : 1
Improving Primary Care Office Systems to Increase
Preventive Care for Young Children
Rates of preventive care increased among young children who
were patients of primary care practices and clinics in one
community that collaborated with researchers to adopt and
Young children visiting eight primary care practices
and clinics in one community
100%
90%
80%
70%
60%
50%
40%
30%
20%
10%
0%
86%
enhance quality-improvement systems, such as chart
prescreening, risk-assessment forms, flowsheets, prompting
and reminder systems, and patient education materials.
■
■
Before intervention
(baseline sample ages 24–36 months)
After intervention
(one year later)
93%
79%
75%
67%
48%
45%
12%
Immunizations
up to date
by age 12 months
Received anemia
screening (blood test)
between ages
6–18 months
Follow-up sample #1
(ages 12–18 months)
Follow-up sample #2
(ages 19–23 months)
Immunizations
up to date
by age 24 months
Received lead screening
(risk assessment
or blood test)
by age 24 months
Follow-up sample #3 (ages 24–30 months)
Source: random samples of medical records (N=339 in baseline sample and 285 to 300 in
follow-up samples) as reported by Bordley et al. (2001). Samples were not the same
children. Some results omitted for clarity.
Leatherman and McCarthy, Quality of Health Care for Children and Adolescents: A Chartbook, 2004. The Commonwealth Fund
6: CAPACITY
93
ChildChartbook-Sec6-D3c.qxd
2/23/04 11:02 AM
Page 94
6 : C A PAC I T Y
Leatherman and McCarthy, Quality of Health Care for Children and Adolescents: A Chartbook, 2004. The Commonwealth Fund
C A PA C I T Y T O I M P R O V E — S TAY I N G H E A LT H Y — E A R LY C H I L D H O O D — C H A R T 6 : 2
Enhancing Primary Care Developmental Services for Young Children
Why is this important? Recent research has led to new
appreciation for the importance of early life experience in shaping
children’s intellectual, emotional, and social development (NRC
2000). Yet, changes in family and society are challenging parents
and creating stresses that can harm children’s life chances
(Carnegie 1994). Reflecting this dynamic, many parents say they
want more information about child development from their
health professional (see Chart 1:3). Primary health care appears to
offer an excellent opportunity to support parents in creating the
environment for favorable developmental outcomes, since most
young children already have regular contact with a primary care
practitioner for immunizations and other well-child care (AHRQ
2002a; VanLandeghem et al. 2002).
Intervention: The Healthy Steps for Young Children program
promotes a new multidisciplinary model of pediatric care
emphasizing “a close relationship between health care
professionals and mothers and fathers in addressing the physical,
emotional, and intellectual growth and development of children
from birth to age three” (Healthy Steps 2003). The program
integrates a trained child development specialist (nurse, early
childhood educator, or social worker with experience in child
development) into primary care practices to enhance
developmental information and other services, including:
enhanced well-child care, child development and family health
checkups, home visits at critical developmental stages, telephone
hotline for parents to discuss developmental concerns, parent
support groups, written information materials, and linkage to
community resources.
Findings: Parents of young children (ages 30 to 33 months) taking
part in the Healthy Steps program at 15 primary health care sites
were more likely than parents with usual care at the same or
matched sites to report:
• receiving developmental information and services promoted
by the program,
• being satisfied with support from the practice and
communication with health professionals,
• engaging in nonphysical child discipline behaviors
promoted by the program,
• discussing their own sadness with someone at the practice
(among mothers at risk for depression), and
• maintaining continuity of care at the same practice after their
child reached age 20 months.
Children enrolled in Healthy Steps were more likely to receive
well-child visits at recommended ages and to be up to date on
selected immunizations at age 24 months.
Source: Parent interviews and medical records (Minkovitz
et al. 2003).
Implications: Enhancing early child development services in primary
care will require structural changes in practice. Given current health
care market constraints, the authors conclude, “it is unlikely that
physicians will be able to extend the length of visits or provide
more direct services to families without relying on other
professional staff” (Minkovitz et al. 2001). The Healthy Steps
program represents one model for accomplishing this goal, with an
incremental cost ranging from $402 to $933 per child per year.
94
ChildChartbook-Sec6-D3c.qxd
2/23/04 11:02 AM
Page 95
C A PA C I T Y T O I M P R O V E — S TAY I N G H E A LT H Y — E A R LY C H I L D H O O D — C H A R T 6 : 2
Enhancing Primary Care Developmental Services for Young Children
The Healthy Steps program integrates child development
specialists into primary care along with other enhanced
services to promote the physical, emotional, and intellectual
development of young children. Families taking part in
Healthy Steps were more likely to receive recommended
preventive and developmental services and continuous,
patient-centered care.
Young children (ages 30– 33 months) at 15 study sites
■
■
Usual care families
Healthy Steps families
100%
87%
90%
83%
83%
80%
75%
57%
60%
50%
70%
66%
70%
50%
43%
41%
40%
30%
20%
10%
0%
Physician discussed
more than six topics
with parent
Child had
developmental
assessment
Child was
up to date
on immunizations
at 24 months*
Parent said
someone in practice
went out of their
way to help
Continuity at
same practice
after 20 months
Source: Parent interviews and medical records (N=3,737), as reported by Minkovitz et al.
(2003). *4 doses of diphtheria-tetanus-pertussis vaccine; 3 doses of oral polio or inactivated
poliovirus vaccine; and 1 dose of measles-mumps-rubella vaccine.
Leatherman and McCarthy, Quality of Health Care for Children and Adolescents: A Chartbook, 2004. The Commonwealth Fund
6: CAPACITY
95
ChildChartbook-Sec6-D3c.qxd
2/23/04 11:02 AM
Page 96
6 : C A PAC I T Y
Leatherman and McCarthy, Quality of Health Care for Children and Adolescents: A Chartbook, 2004. The Commonwealth Fund
C A PA C I T Y T O I M P R O V E — S TAY I N G H E A LT H Y — E A R LY C H I L D H O O D — C H A R T 6 : 3
Promoting Lead Screening for Medicaid-Insured Young Children
Why is this important? Young children are susceptible to lead
poisoning when exposed to lead in their environment, especially
deteriorating lead-based paint and paint dust in older housing
(NRC 1993). Low-level lead poisoning typically does not
manifest in medical symptoms and therefore cannot be detected
without blood testing. Lead poisoning is associated with
developmental delays, learning disabilities, and behavioral
problems (AAP 1998a).
Lead poisoning has been declining in the U.S. since lead
was banned in paint and gasoline. Yet, 8 percent of low-income
young children (ages birth to 5 years) and 11 percent of young
black children had elevated blood lead levels (greater than 10
micrograms per deciliter) in 1991–1994, compared to 4 percent
of children generally (CDC 1997a). Three of five young
children (62%) with elevated blood levels are enrolled in
Medicaid (GAO 1999).
The Centers for Disease Control and Prevention recommend
lead screening for young children at risk of lead poisoning—
including all low-income children receiving public assistance—to
identify those in need of interventions to lower blood lead levels
(CDC 1991; 1997b). Interventions depend on severity of lead
toxicity and may include follow-up testing, family education,
abatement of the source of lead exposure, and medical
management. The federal government has required since 1992
that all Medicaid-insured children receive a blood lead test at ages
1 and 2 years, and that children age 36 to 72 months be tested if
they have not previously been screened. Only half the states had
fully complied with this policy as of 1999 (GAO 1999).
Intervention: The State of Rhode Island requires universal lead
screening of all young children and promotes screening through a
multifaceted educational and outreach strategy (Rhode Island
DOH 2003). A statewide public health tracking system is used to
notify managed care plans, health professionals, and clinics of
children who are in need of screening (AECLP 2001). Head Start
providers and Women, Infants, and Children (WIC) nutrition
clinics also check children’s status and notify physicians when
screening is needed (personal communication with Magaly
Angeloni 2003). Medicaid managed care plans are eligible for
state performance incentives for meeting goals including lead
screening rates. The state offers bilingual case management
services and an abatement program that funds replacement of
lead-painted windows (Silow-Carroll 2003).
Findings: During 1996–1997, 80 percent of Rhode Island children
(ages 19 to 35 months) who were enrolled in the state’s Medicaid
managed care program for at least one year had ever received a
blood lead test. In contrast, only 21 percent of young children
who were enrolled in traditional Medicaid in 15 other states for at
least one year during 1995–1996 had received a blood lead test
within six months of their first or second birthday (state rates
ranged from 1 percent to 46 percent).
Sources: medical records (Vivier et al. 2001); Medicaid
administrative claims data (GAO 1999).
Implications: A multifaceted statewide education and outreach
intervention can increase lead screening rates to high levels among
low-income young children.
96
ChildChartbook-Sec6-D3c.qxd
2/23/04 11:02 AM
Page 97
C A PA C I T Y T O I M P R O V E — S TAY I N G H E A LT H Y — E A R LY C H I L D H O O D — C H A R T 6 : 3
Promoting Lead Screening for Medicaid-Insured Young Children
Lead poisoning remains a danger to low-income children who
often live in older housing with lead-based paint. The CDC
recommends (and federal policy requires) that all children
insured by Medicaid be screened at ages 1 and 2 years to
detect lead poisoning, but rates have remained low nationally.
Rhode Island has achieved a high screening rate among
Medicaid children through a multifaceted education and
outreach program.
Medicaid-insured children
100%
90%
80%
80%
70%
60%
50%
40%
30%
21%
20%
10%
0%
15 States (average)
Rhode Island
Received blood lead test within 6 months
of turning age 1 or 2 years in 1995– 1996
Ever received blood lead test
by ages 19– 35 months in 1996– 1997
Sources: Medicaid fee-for-service claims data for 15 states (N=288,963), as reported by
the GAO (1999); physician medical record audit for Rhode Island (N=1,988), as reported
by Vivier et al. (2001).
Leatherman and McCarthy, Quality of Health Care for Children and Adolescents: A Chartbook, 2004. The Commonwealth Fund
6: CAPACITY
97
ChildChartbook-Sec6-D3c.qxd
2/23/04 11:02 AM
Page 98
6 : C A PAC I T Y
Leatherman and McCarthy, Quality of Health Care for Children and Adolescents: A Chartbook, 2004. The Commonwealth Fund
C A PA C I T Y T O I M P R O V E — S TAY I N G H E A LT H Y — A D O L E S C E N C E — C H A R T 6 : 4
Improving Delivery of Adolescent Preventive Care in Community and Migrant Health Centers
Why is this important? Adolescents face many behavioral and
lifestyle choices—such as whether to use tobacco, alcohol, or
drugs, eat healthy foods, get regular exercise, engage in risky sexual
behaviors, and take precautions to prevent injury—that can have
both immediate and lasting consequences for their health and
success in life (Klein and Auerbach 2002).
The American Medical Association’s Guidelines for Adolescent
Preventive Services (GAPS) recommend that physicians provide
guidance to adolescents to help encourage healthy lifestyles and
screen for medical, behavioral, and emotional problems for which
treatment, counseling, or referral to other services is indicated
(Elster and Kuznets 1994). Many adolescents reporting health or
behavioral risks say they would like to discuss these issues with a
physician, yet most have not done so (Klein and Wilson 2002).
Intervention: This study evaluated the experience of five urban and
rural community and migrant health centers (CMHCs) that
received training and technical assistance to implement the
American Medical Association’s Guidelines for Adolescent Preventive
Services (GAPS) among poor and uninsured adolescents ages 14 to
19 years (Klein et al. 2001). All five CMHCs made improvements
in preventive care delivery including: scheduling 30-minute wellchild visits, encouraging confidential counseling time, using a
patient questionnaire to screen for health risks, and enhancing
patient education materials and referral networks when possible.
Findings: Adolescents visiting for well-child care nine to 15 months
after GAPS implementation were significantly more likely than
those who had visited before the intervention to report receiving
educational materials and discussing preventive topics with their
health professional in 19 of 31 content areas. Rates of counseling
were 10 to 29 percentage points higher for these 19 topics after the
intervention. Rates of counseling did not increase significantly for
topics that had relatively higher rates before the intervention.
Source: patient surveys (Klein et al. 2001). (The chart
displays the 10 topics with the greatest absolute increase in
reported discussion.)
Implications: Health centers and similar clinical practice settings
can improve preventive care for adolescents when they adopt
guidelines along with a program of supportive practice
improvements. Given limited time and the need to tailor
screening and counseling to meet individual patient needs, rates
of 100 percent would not be expected across all topics for every
visit, but there is room for additional improvement. Effectively
coordinating preventive care for adolescents requires commitment
to recognize adolescents’ unique developmental needs as well as
the importance of providing adequate time and privacy for
confidential screening and counseling (Klein et al. 2001).
98
ChildChartbook-Sec6-D3c.qxd
2/23/04 11:02 AM
Page 99
C A PA C I T Y T O I M P R O V E — S TAY I N G H E A LT H Y — A D O L E S C E N C E — C H A R T 6 : 4
Improving Delivery of Adolescent Preventive Care
in Community and Migrant Health Centers
Implementing adolescent preventive care guidelines as part of
an intervention that included training, changes in scheduling
policies, use of a risk-assessment tool, and enhanced
education and referral services significantly increased the
100%
rates at which poor and uninsured adolescents reported
discussing several health- and lifestyle-related topics with
their clinician.
Adolescents (ages 14– 19 years) making well-child visits
at five community and migrant health centers
■
■
Before guideline
implementation
After guideline
implementation
90%
80%
72%
70%
65%
60%
60%
48%
50%
40%
48%
52%
45%
34%
29%
30%
20%
37%
34%
19%
28%
22%
16%
11%
10%
10%
22%
7%
5%
0%
Immunizations
Family
functioning
Weight
School
Smokeless
performance
tobacco
Depression
Eating
disorders
Guns &
weapons
Peer
relations
Suicide
Discussed topic with their health professional at most recent well-child visit*
Source: Patient surveys (N=260 pre-intervention and 274 post-intervention) as reported
by Klein et al. (2001). *Nineteen of 31 measured topics showed significant increase in
discussion; topics shown are the 10 exhibiting the greatest percentage point increase
in reported discussion, arranged from left to right by magnitude of change.
Leatherman and McCarthy, Quality of Health Care for Children and Adolescents: A Chartbook, 2004. The Commonwealth Fund
6: CAPACITY
99
ChildChartbook-Sec6-D3c.qxd
2/23/04 11:02 AM
Page 100
6 : C A PAC I T Y
Leatherman and McCarthy, Quality of Health Care for Children and Adolescents: A Chartbook, 2004. The Commonwealth Fund
C A PA C I T Y T O I M P R O V E — S TAY I N G H E A LT H Y — A D O L E S C E N C E — C H A R T 6 : 5
Improving Screening for Chlamydia Infection Among Adolescent Girls Seen at HMO Clinics
Why is this important? Expert recommendations to screen sexually
active adolescent girls for chlamydia infection are not widely
followed in routine clinical practice (see Chart 1:6). This gap in
quality results in many missed opportunities to treat patients who
have contracted this sexually transmitted disease without knowing
it and who remain at risk of developing potentially severe
complications.
Intervention: This study tested the effectiveness of an intervention to
increase compliance with screening guidelines for an ethnically
diverse population of adolescent girls (ages 14 to 18 years) during
checkup visits (Shafer et al. 2002). Ten pediatric clinics of a large
health maintenance organization were randomly assigned to
provide usual care or to implement the intervention. To reduce
screening barriers, all clinics used a urine test (rather than culture
obtained through pelvic exam). The intervention consisted of:
1. engaging clinic leadership and raising awareness of the gap in quality;
2. building teams at each clinic to implement the intervention,
including identifying and addressing barriers to improvement;
3. developing clinical practice improvements such as customizing
clinic flowcharts to summarize patient information from multiple
sources, instituting universal urine specimen collection at patient
registration (but only specimens from sexually active girls, as
determined confidentially by the practitioner, were sent for
laboratory analysis), and raising awareness about screening
through an educational campaign; and
4. sustaining gains through continuous performance monitoring.
Findings: Before the intervention, the 10 clinics did not differ
significantly in the proportion of sexually active adolescent girls
screened for chlamydia infection at preventive health visits; both
groups had very low rates of such screening. During visits 16 to 18
months after the intervention, the proportion of girls screened for
chlamydia infection had increased significantly in the intervention
clinics (from 5% before to 65% after the intervention) and was
significantly higher than in the usual care clinics (21%).
Source: Patient encounter and laboratory data (Shafer et al. 2002).
Implications: A multifaceted, systems-level intervention can increase
rates of screening for chlamydia infection in organized group
practice and may be replicable to other similar practice settings.
100
ChildChartbook-Sec6-D3c.qxd
2/23/04 11:02 AM
Page 101
C A PA C I T Y T O I M P R O V E — S TAY I N G H E A LT H Y — A D O L E S C E N C E — C H A R T 6 : 5
Improving Screening for Chlamydia Infection Among
Adolescent Girls Seen at HMO Clinics
HMO clinics that implemented an intervention—including
team development, performance monitoring, and clinical
practice improvements such as flowcharts, universal urine
100%
Sexually active adolescent girls (ages 14– 18 years)
making preventive health visits to HMO clinics
specimen collection, and an educational campaign—
significantly boosted the proportion of adolescent girls
screened for chlamydia infection.
■
■
In the 2 months
before the intervention
In the 2 months
16–18 months after
start of intervention
90%
80%
70%
65%
60%
50%
40%
30%
20%
21%
14%
5%
10%
0%
Usual care (control) group—
5 randomly assigned clinics
Intervention group—
5 randomly assigned clinics
Received screening for chlamydia infection
Source: patient encounter and laboratory data (N=7,920 routine checkup visits),
as reported by Shafer et al. (2002).
Leatherman and McCarthy, Quality of Health Care for Children and Adolescents: A Chartbook, 2004. The Commonwealth Fund
6: CAPACITY
101
ChildChartbook-Sec6-D3c.qxd
2/23/04 11:02 AM
Page 102
6 : C A PAC I T Y
Leatherman and McCarthy, Quality of Health Care for Children and Adolescents: A Chartbook, 2004. The Commonwealth Fund
C A P A C I T Y T O I M P R O V E — G E T T I N G B E T T E R W H E N S I C K O R I N J U R E D — E A R LY C H I L D H O O D — C H A R T 6 : 6
Reducing Unnecessary Antibiotic Use Among Young Children Visiting
Physician Group Practices and HMO Clinics
Why is this important? To curb the spread of antibiotic-resistant
pathogens, unnecessary use of antibiotics must be reduced. This
goal may be especially important among young children, who
have a higher rate of infection with antibiotic-resistant pathogens
than other age groups (Whitney et al. 2000). Although physicians
have reduced antibiotic prescribing over the past decade (McCaig
et al. 2002), further progress is needed (see Chart 1:7). Many
physicians say that parents pressure them to prescribe antibiotics
for a sick child when antibiotics are not clinically indicated
(Bauchner et al. 1999). A multifaceted intervention to educate
patients and physicians was successful in reducing unnecessary
antibiotic use among adults (Gonzales et al. 2001).
Intervention: This study evaluated a one-year targeted educational
intervention to reduce unnecessary antibiotic prescriptions for
children (Finkelstein et al. 2001). Twelve urban and suburban
group practices and multispecialty clinics affiliated with two
geographically unique managed health care plans were
randomized by matched pairs to intervention and control groups.
Parents of enrolled children receiving care at intervention
practices were mailed a pamphlet on appropriate antibiotic use
that was developed by the Centers for Disease Control and
Prevention (CDC), with a cover letter signed by their physician.
Additional CDC pamphlets and posters were displayed in
intervention clinic waiting rooms. A CDC-trained pediatric peer
leader conducted small-group educational sessions with
physicians in the intervention practices at the start of the
intervention and again four months later, with the follow-up
presentation including feedback on group and individual
physician antibiotic prescribing performance.
Findings: Antibiotic dispensing decreased by 10 percent to 12
percent from the baseline to the intervention year among young
children visiting control group practices, probably because of
national public health initiatives. Antibiotic dispensing decreased
significantly more, by 15 percent to 19 percent, in the intervention
clinics. Among children who visited in both the baseline and
intervention years (data not shown), there was a “relative
intervention effect” of 12 percent to 16 percent fewer antibiotics
dispensed in the intervention practices, beyond the change in
antibiotic use in the control practices after adjusting for baseline
use of antibiotics.
Source: computerized claims data (Finkelstein et al. 2001).
Implications: A multifaceted educational intervention directed at
both physicians and parents was successful in boosting the
reduction in antibiotic prescribing beyond the preexisting trend
toward lower antibiotic use.
102
ChildChartbook-Sec6-D3c.qxd
2/23/04 11:02 AM
Page 103
C A PA C I T Y T O I M P R O V E — G E T T I N G B E T T E R W H E N S I C K O R I N J U R E D — E A R LY C H I L D H O O D — C H A R T 6 : 6
Reducing Unnecessary Antibiotic Use Among Young Children
Visiting Physician Group Practices and HMO Clinics
An education and outreach intervention, directed at
physicians and parents of young children visiting practices
affiliated with two managed health care plans, reduced
antibiotic dispensing beyond an independent trend toward
lower antibiotic use in control group practices. The
intervention involved peer-led physician education and
performance feedback combined with educational materials
mailed to parents and displayed in clinic waiting rooms.
Change in antibiotic dispensing (per person-year)
from baseline year to intervention year
5%
Children ages 3 months up to 3 years
Children ages 3 years up to 6 years
0%
-5%
-10%
-10%
-12%
-15%
-15%
-20%
-19%
-25%
■
■
Control group practices
Intervention practices
Source: computerized claims data (N=14,468 and 13,460 patients in baseline and
intervention years, respectively), as reported by Finkelstein et al. (2001).
Leatherman and McCarthy, Quality of Health Care for Children and Adolescents: A Chartbook, 2004. The Commonwealth Fund
6: CAPACITY
103
ChildChartbook-Sec6-D3c.qxd
2/23/04 11:02 AM
Page 104
6 : C A PAC I T Y
Leatherman and McCarthy, Quality of Health Care for Children and Adolescents: A Chartbook, 2004. The Commonwealth Fund
C A PA C I T Y T O I M P R O V E — L I V I N G W I T H I L L N E S S — E A R LY C H I L D H O O D T O A D O L E S C E N C E — C H A R T 6 : 7
Education and Outreach to Improve Asthma Care and Outcomes at an Inner-City Hospital
Specialty Clinic Serving Low-Income Children
Why is this important? Many children with asthma and their
families are not practicing effective asthma management,
including the regular use of anti-inflammatory medication when
indicated to control asthma symptoms (see Chart 1:8). Poor and
minority children suffer disproportionately from asthma and its
consequences (Akinbami et al. 2002); hence, they may have even
greater need for improvement in care and outcomes. Passive
education alone is not enough to bring about change, but more
intensive programs can be effective (Guevara et al. 2003).
Intervention: This study examined the effect of an intensive asthma
education and outreach program at an inner-city hospital
specialty clinic (Kelly et al. 2000). Medicaid-insured children and
adolescents (ages 2 to 16 years) who had visited the emergency
room twice or been hospitalized once in the past year, and who
consented to participate, were alternately assigned to an
intervention or control group. There were no baseline differences
between the groups.
The intervention group children and their caregiver received
individual asthma self-management education and a written action
plan for exacerbations. An outreach nurse contacted these children
once per month to monitor their status, review medications, refill
prescription, schedule follow-up care, and assist with
transportation needs. The nurse worked with school personnel on
behalf of school-age children. Intervention group children could
use the specialty clinic for care, but control group children were
referred to their primary care physician for treatment.
Findings: During the intervention year, children in the intervention
group received better quality of care, as measured by 95 percent
who received an influenza immunization compared to 23 percent
of children in the control group. Use of anti-inflammatory
medication increased nearly three-fold (from 34% to 95%)
among intervention children but did not change greatly in the
control group (60% to 65%).
Adverse outcomes declined significantly in the intervention
group (half as many emergency room visits and two-thirds fewer
days in the hospital on average compared to the baseline year) but
not in the control group. Intervention group children had a
clinically meaningful improvement in their quality-of-life scores
(data not shown).
Annual average health care charges declined $543 more per
child in the intervention group than in the control group in the
intervention year.
Source: parent interviews and medical records (Kelly et al. 2000).
Implications: An intensive education program combined with a
series of outreach activities conducted by a nurse substantially
improved quality of care and patient outcomes while also
reducing treatment costs at an asthma specialty clinic.
104
ChildChartbook-Sec6-D3c.qxd
2/23/04 11:02 AM
Page 105
C A PA C I T Y T O I M P R O V E — L I V I N G W I T H I L L N E S S — E A R LY C H I L D H O O D T O A D O L E S C E N C E — C H A R T 6 : 7
Education and Outreach to Improve Asthma Care and Outcomes at
an Inner-City Hospital Specialty Clinic Serving Low-Income Children
A comprehensive asthma intervention that provided
Medicaid-insured children with education, treatment, and
regular follow-up in an inner-city hospital-based specialty care
clinic improved quality of care and outcomes.
■
■
Before intervention
Intervention year
Children and adolescents (ages 2– 16 years)
95%
100%
95%
90%
3.6
3.5
3.5
80%
70%
60%
60%
3.0
65%
2.5
40%
34%
2.4
2.3
2.0
50%
30%
4.0
1.7
1.8 1.7
1.5
23%
0.9
1.0
20%
0.5
10%
0%
0
Control
Intervention
Influenza
immunization
Control
Intervention
Anti-inflammatory
medication
Control
Intervention
Emergency visits
(average number)
Control
Intervention
Hospital days
(average number)
Adverse outcomes (lower is better)
Quality of care (higher is better)
Source: parent interviews and medical records (N=78) as reported by Kelly et al. (2000).
Adapted and reproduced by permission of Pediatrics, Volume 105, Page 1032, Figure 1,
Copyright 2000.
Leatherman and McCarthy, Quality of Health Care for Children and Adolescents: A Chartbook, 2004. The Commonwealth Fund
6: CAPACITY
105
ChildChartbook-Sec6-D3c.qxd
2/23/04 11:02 AM
Page 106
6 : C A PAC I T Y
Leatherman and McCarthy, Quality of Health Care for Children and Adolescents: A Chartbook, 2004. The Commonwealth Fund
C A PAC I T Y T O I M P R OV E — L I V I N G W I T H I L L N E S S — A D O L E S C E N C E — C H A R T 6 : 8
Improving Diabetes Outcomes Through Coping Skills Training
Why is this important? Each year, about 13,000 children and
adolescents are diagnosed with type 1 diabetes, in which the body
does not produce insulin necessary to digest sugar and other food
(LaPorte et al. 1995). An individual’s ability to cope with a
chronic disease like diabetes influences the success of treatment
(Lazarus and Fokman 1984). The physical, emotional, and social
demands of intensive diabetes self-management—which requires
monitoring blood sugar, regulating diet and exercise, and making
multiple insulin injections daily—are especially challenging for
adolescents given developmental changes and stresses (Grey et al.
1999). As a result, adolescents with diabetes are at risk for poor
disease control leading to hospitalizations and long-term
complications, such as eye, kidney, and nerve damage.
Intervention: In this study, all 77 participating adolescents (ages
12 to 20 years) received intensive diabetes team management,
including monthly visits at a specialty clinic and telephone
follow-up. About half the teens were randomly selected to
receive coping skills training during four to eight weekly small
group sessions, followed by monthly booster sessions, to
increase their “sense of competence and mastery by retraining
inappropriate or non-constructive coping styles and forming
more positive styles and patterns of behavior” (Grey et al. 2000).
A nurse practitioner with experience in pediatric psychiatry and
diabetes led teens in role-playing to model and give feedback on
appropriate behavior in various social situations identified as
problematic by youth, such as managing food choices with
friends, decision-making about drugs and alcohol, and handling
conflicts (Grey et al. 1999).
Findings: Glycosylated hemoglobin A1c test results (which give a
three-month average reading of blood sugar control) were nearly
identical at the start of the study among youth selected to receive
coping skills training (intervention group) and those who did not
(control group). One year after the start of the intervention:
• Average glycemic (blood sugar) control improved more in the
intervention group than the control group (1.6 vs. 0.7
percentage point reduction in hemoglobin A1c level). A one
percentage point reduction in this test is associated with a 15
to 30 percent reduction in risk of developing long-term
diabetes complications (ADA 2002).
• Average quality of life impact score improved in the
intervention group (13 percent lower perceived impact of
diabetes) but worsened in the control group (9 percent higher
impact), such that the average score was 14 percent better for
teens who received coping skills training than the control
group after one year.
Source: ABCs of Diabetes Study (clinical data and youth selfreports), as reported by Grey et al. (1999; 2000); and personal
communication with Margaret Grey (2003).
Implications: Adding a behavioral intervention to intensive
diabetes management improves disease control and quality of
life for adolescents. The Diabetes Complications and Control
Trial demonstrated a 50 percent lower risk of developing eye
disease after seven years among adolescents who reduced their
average hemoglobin A1c level to about 8 percent (DCCT
Research Group 1994).
106
ChildChartbook-Sec6-D3c.qxd
2/23/04 11:02 AM
Page 107
C A PA C I T Y T O I M P R O V E — L I V I N G W I T H I L L N E S S — A D O L E S C E N C E — C H A R T 6 : 8
Improving Diabetes Outcomes Through Coping Skills Training
A nurse-led behavioral intervention to teach coping skills for
stresses associated with intensive diabetes management helped
adolescents (ages 12–20 years) achieve better blood sugar
12%
10%
Average hemoglobin
A1c level (lower is better)
6%
2%
Intensive
diabetes
management
only (control
group)
8.5%
9.1%
7.9%
4%
70
9.2%
8.4%
8%
control and improvement in quality of life as compared to a
similar group of youth engaged in intensive diabetes
management only.
7.5%
A one percentage point reduction
in A1c level is associated with a
15 percent to 30 percent reduction
in the risk of developing long-term
complications (American Diabetes
Association 2002).
Coping skills
training and
intensive
management
(intervention
group)
0%
Average quality of life
impact score (lower is better)
60
51.5
45.2
50
40
52.0
47.7
45.2
44.8
After
6 months
After
12 months
30
20
10
0
Before
intervention
After
6 months
After
12 months
Glycemic (blood sugar) control
Before
intervention
Impact of diabetes on quality of life
Source: ABCs of Diabetes Study (N=77), clinical data and youth self-reports, as
reported by Grey et al. (1999, 2000), and personal communication with Margaret
Grey (2003).
Adapted and reprinted from the Journal of Pediatrics, Volume 127, Margaret Grey
et al., Coping skills training for youth with diabetes mellitus, Page 110, Copyright
2000, with permission from Elsevier.
Leatherman and McCarthy, Quality of Health Care for Children and Adolescents: A Chartbook, 2004. The Commonwealth Fund
6: CAPACITY
107
ChildChartbook-Sec6-D3c.qxd
2/23/04 11:02 AM
Page 108
6 : C A PAC I T Y
Leatherman and McCarthy, Quality of Health Care for Children and Adolescents: A Chartbook, 2004. The Commonwealth Fund
C A PA C I T Y T O I M P R O V E — PAT I E N T S A F E T Y — E A R LY C H I L D H O O D — C H A R T 6 : 9
Decreasing Infections Acquired in the Neonatal Intensive Care Unit
Why is this important? Very low birthweight infants being cared
for in neonatal intensive care units (NICU) are especially
vulnerable to hospital-acquired (nosocomial) infections because
of their immature immune systems and prolonged hospital stays
(Harris 1997). Sepsis affects up to one of five very low birthweight
infants in the NICU and is associated with substantially higher
death rates and longer hospital stays (Stoll et al. 2002). The
coagulase-negative staphylococcus (CONS) bacterium is the most
frequent cause of such infections.
Intervention: Multidisciplinary teams from six NICUs engaged in a
three-year collaborative process that included training on quality
improvement, agreeing on common improvement goals and
metrics, reviewing performance data, and developing a list of
“potentially better practices” for improvement (Horbar et al.
2001). These practices were identified by sharing detailed analyses
of care processes conducted by each site, reviewing the medical
literature for evidence on prevention practices, and benchmarking
the practices of participating sites and other superior performing
NICUs through a series of site visits. Each NICU selected specific
practices for improvement that its team considered most relevant,
in the following areas: handwashing, nutrition, skin care,
diagnosis, respiratory care, vascular access (intravenous line
management), and organizational culture.
Findings: Among six NICUs participating in the improvement
collaborative, the average rate of hospital-acquired CONS infections
in very low birthweight infants decreased by 5.4 percentage points
in absolute terms from 1994 (before the intervention) to 1996
(after the intervention). This change was significantly greater than a
0.9 percentage point decrease in the average infection rate among
66 comparison NICUs during this time. One year later (1997), the
infection rate at the six collaborative sites continued to decline, to a
level 9.7 percentage points lower than before the intervention,
representing a 44 percent relative decrease since 1994. This change
was significantly different from the trend at comparison NICUs.
Infection rates improved at four of the six intervention sites, while
worsening at the other two sites.
During the project, treatment costs were reduced by $10,932
per infant among the six collaborating NICUs, representing
average savings of $2.3 million in annual patient care costs per
NICU. Treatment costs rose at comparison NICUs. With an
average resource commitment of $68,206 per NICU, plus grantfunded support, the quality improvement produced $9 in savings
for every $1 invested.
Source: Vermont Oxford Network, Neonatal Intensive Care
Collaborative Quality Project, as reported by Horbar et al. (2001)
and Rogowski et al. (2001).
Implications: An intensive, multidisciplinary, multicenter
collaborative learning process conducted among highly motivated
participants can support changes in local institutional practices
that lead to improvement in average clinical outcomes and a
reduction in patient care costs.
108
ChildChartbook-Sec6-D3c.qxd
2/23/04 11:02 AM
Page 109
C A PA C I T Y T O I M P R O V E — PAT I E N T S A F E T Y — E A R LY C H I L D H O O D — C H A R T 6 : 9
Decreasing Infections Acquired in the Neonatal Intensive Care Unit
The coagulase-negative staphylococcus (CONS) bacterium is
the most frequent cause of infections acquired by premature,
very low birthweight infants in the neonatal intensive care
unit (NICU). A collaborative quality-improvement project
30%
25%
among six NICUs resulted in a 44 percent lower incidence of
CONS infection among such infants. This change was
significantly different from the trend in infection rates among
66 other NICUs participating in a surveillance system.
Average coagulase-negative
staphylococcus infection rate
Intervention NICUs
Comparison NICUs
22.0%
20%
16.6%
16.5%
15%
15.4%
14.5%
10%
12.3%
5%
0%
1994 (Before intervention)
1996 (After intervention)
Source: Vermont Oxford Network, Neonatal Intensive Care Collaborative Quality
Project (N=745 to 789 infants at six intervention sites and 5,108 to 5,572 infants at 66
comparison sites, all with birthweight 501 to 1500 grams and admitted at or within 28
1997 (One year later)
days of birth in each year), as reported by Horbar et al. (2001). Adapted and
reproduced by permission of Pediatrics, Volume 107, Page 19, Figure 3, Copyright 2001.
Leatherman and McCarthy, Quality of Health Care for Children and Adolescents: A Chartbook, 2004. The Commonwealth Fund
6: CAPACITY
109
p110-CalloutForPDF.qxd
3/22/04 12:43 PM
Page 1
We'd like to know what you think about this chartbook. To take a short,
anonymous user survey, click on the following link or copy the address
into your Web browser: http://64.73.28.22/s.asp?u=50446418798.
Or, e-mail [email protected] to receive an invitation to take the
survey. You can also view and download the chartbook through the
Commonwealth Fund Web site (www.cmwf.org).
ChildChartbook-Back-D3f.qxd
2/23/04 2:17 PM
Page 111
Technical Appendix
This appendix provides information on data sources and study participants and
methodologies. Since the chartbook presents data from many different kinds of sources
and studies conducted by different researchers, methodologies differ from chart to chart.
All differences described as significant reflect a 95 percent confidence level or greater.
Chart 1:1—The National Survey of America’s Families is a random-digit-dialing
survey of households with telephones and an area probability sample of
households without telephones that provide national estimates for the civilian,
noninstitutionalized population younger than age 65. Interviews for the 1999
survey were conducted in English or Spanish between February and October
1999 on behalf of the Urban Institute and Child Trends. Low-income families
(under 200 percent of the federal poverty level) were oversampled. The 1999
Child Public Use File included 35,938 children younger than 18 years sampled
from 44,499 households. Up to two children were sampled per household: one
child age 5 or younger and one child ages 6 to 17 years. Information was
obtained from the adult (typically a parent) who was most knowledgeable about
the child. The 1999 response rate for child interviews was 81 percent. Child’s age
was significantly associated with receipt of recommended well-child care in
bivariate analysis (Yu et al. 2002; Safir et al. 2000).
Chart 1:2—The National Immunization Survey (NIS) has been conducted
annually since 1994 by the National Immunization Program and the National
Center for Health Statistics. The NIS provides national, state, and selected urban
area estimates of vaccination coverage rates for U.S. children between the ages
of 19 and 35 months at the time of the survey. The NIS combines two stages: 1)
a random-digit-dialing telephone survey of nearly 1 million households
conducted in English and Spanish (with interpreter services for other languages)
to identify approximately 34,000 households with age-eligible children and
obtain parent-reported vaccination histories based on written records whenever
possible, and 2) a mail survey of all parent-identified child vaccination
providers to validate the immunization record (the Provider Record Check
Survey). Household and provider data are combined to produce provideradjusted vaccination estimates. Provider vaccination record data was obtained
for 21,317 children in 2002; the overall response rate for eligible households
was 62 percent. Final estimates are weighted to represent all children ages 19 to
35 months and adjusted to account for nonresponse and households without
telephones (Zell et al. 2000; CDC 2003b).
Chart 1:3—The Commonwealth Fund Survey of Parents with Young Children was
a random-digit-dialing telephone survey of parents with children ages birth to
36 months. A nationally representative sample of 2,017 parents (response rate
68 percent) was interviewed from July 1995 to January 1996, including an
oversample of African American and Hispanic households. One parent was
randomly selected when two were present and one child was randomly selected
when the household had more than one child ages birth to 36 months. Analysis
for each topic was limited to parents of children between the ages for which
that topic is recommended for discussion (N=170 parents of children younger
than 3 months for newborn care, 1,645 parents of children ages 6 to 36 months
for discipline, 1,011 parents of children ages 18 to 36 months for toilet training,
and 2,017 parents of children ages birth to 36 months for all other topics).
Analyses were weighted to reflect the overall distribution of parents in the U.S.
with children younger than 3 years (Schuster et al. 2000).
Chart 1:4—The National Survey of Early Childhood Health is a telephone survey of a
national random sample of 2,068 young children (ages 4 to 35 months), including
an oversample of Hispanic and black children. The parent or guardian who is
primarily responsible for the child’s medical care was selected for the interview. The
survey was conducted in English and Spanish by the National Center for Health
Statistics between February and July 2000, as a module of the State and Local Area
Integrated Telephone Survey, which uses the National Immunization Survey
sampling frame (see description of Chart 1:2 above). Results are adjusted to
account for nonresponse and households without telephones so as to reflect the
entire U.S. population of children ages 4 to 35 months. Only parents of children
ages 4 to 9 months (N=432) were asked whether the child’s doctors or other health
care providers had talked with them since the child’s birth about how the child
communicates his/her needs. Only parents of children ages 10 to 18 months
(N=674) and 19 to 35 months (N=962) were asked whether the child’s doctors or
other health care providers had talked with them in the last 12 months (or since
the child’s birth if the child was less than age 1 year) about words and phrases that
the child uses and understands (Halfon et al. 2002; Blumberg et al. 2002).
Leatherman and McCarthy, Quality of Health Care for Children and Adolescents: A Chartbook, 2004. The Commonwealth Fund
111
ChildChartbook-Back-D3f.qxd
2/23/04 2:17 PM
Page 112
Leatherman and McCarthy, Quality of Health Care for Children and Adolescents: A Chartbook, 2004. The Commonwealth Fund
Chart 1:5—The Commonwealth Fund Survey of the Health of Adolescent Girls
and Boys was a nationally representative, stratified, school-based sample of
6,728 students (3,153 boys and 3,575 girls) in the fifth through the twelfth
grades. A total of 297 public, private, and parochial schools (including an
oversample of 32 urban schools) were randomly selected in accordance with
their student representation in the population from a list maintained by the
national Center for Educational Statistics. The survey was self-completed in the
classroom setting during 1997. Results were weighted to reflect the U.S.
population of in-school adolescents (Klein et al. 1999; Ackard and NeumarkSztainer 2001).
Chart 1:6—National Committee for Quality Assurance (NCQA) Quality Compass
data represent Health Plan Employer Data and Information Set (HEDIS) results
submitted to NCQA for public dissemination by commercial and Medicaid
health plans (NCQA 2003a). Data for this measure are collected from
administrative claims data. The denominator includes female plan members
ages 16 to 20 years by December 31st of the measurement who were
continuously enrolled (no more than a 45-day gap) during the year and who
had a visit code during the year for a service, procedure, or medication likely to
be provided to sexually active females (such as pregnancy-related services, Pap
smear, pelvic exam, screening and/or treatment for STDs, or contraceptive
medications). The numerator includes those in the denominator who had at
least one test for chlamydia during the measurement year (NCQA 2003b).
Chart 1:7—The National Ambulatory Medical Care Survey is an annual survey of
office-based community physicians conducted by the National Center for
Health Statistics. “Visits were sampled by using a multi-stage clustered
probability sample design based on geographic location, provider specialty, and
visits within individual physician offices.” Participating physicians (response
rates 63 percent to 73 percent) complete a one-page encounter form for each
patient visit during a randomly selected week, listing new or ongoing diagnoses
and prescribed medications. Annual data were combined for 1991–1992
(60,252 visits) and 1998–1999 (37,467 visits). Visits to dermatologists and
ophthalmologists were excluded. Antibiotics prescribed almost exclusively in
topical or intravenous form and antimycobacterial medications were not
counted. Patients diagnosed with more than one infectious disease were
excluded from diagnosis-specific analyses. All rates were weighted to represent
national estimates. The frequency of antibiotic prescribing and the use of broadspectrum antibiotics were significantly different in 1998–1999 compared to
1991–1992 (Steinman et al. 2003).
Chart 1:8—National Committee for Quality Assurance (NCQA) Quality Compass
data represent Health Plan Employer Data and Information Set (HEDIS) results
submitted to NCQA for public dissemination by commercial and Medicaid
health plans (NCQA 2003a). Data for this measure are collected from
administrative claims data. The denominator includes health plan members
with persistent asthma who were ages 5 to 9 years or 10 to 17 years by
December 31st of the measurement year and who were continuously enrolled
during the measurement year and the year prior to the measurement year (with
no more than one 45-day gap in enrollment in each year). The numerator
includes those in the denominator who had at least one dispensed prescription
during the measurement year for a medication recommended for long-term
asthma control by the National Asthma Education and Prevention Program: an
inhaled corticosteroid, nedocromil, cromolyn sodium, leukotriene modifier, or
methylxanthine (NCQA 2003b).
Chart 1:9—This study used administrative claim and encounter data from
TennCare and Washington State Medicaid from 1995 to 1999. The study
population included children ages 1 to 48 months at the start of a 365-day
study period who were continuously enrolled during the 365-day study period
and who had one inpatient or two outpatient claims or encounters with a
diagnosis code for sickle cell disease (excluding codes for sickle cell trait and
hemoglobin SC). Each subject’s 365-day study period began on the date of
hospital discharge or the second outpatient visit. The outcome measure was the
number of days during a 365-day period covered by prescription fills (regardless
of overlap in dates) for a penicillin or macrolide antibiotic, or for
trimethoprim-sulfamethoxazole (Sox et al. 2003).
Chart 1:10—The Cystic Fibrosis Foundation Patient Registry collected data in 2002
on 23,105 patients (including 972 newly diagnosed during 2002) with cystic
fibrosis who received care at more than 115 Cystic Fibrosis Foundation–
accredited care centers across the U.S. The registry thus includes about threequarters of the estimated 30,000 people with cystic fibrosis in the U.S. Three of
five (59.8%) of these patients (approximately 13,817) were younger than age 18
years in 2002. Rates reflect services received during 2002 (CFF 2003b).
Chart 2:1—The Healthcare Cost and Utilization Project (HCUP) Nationwide
Inpatient Sample (NIS) is “the largest publicly available U.S. all-payer database,
with data from nearly 1,000 hospitals in 28 states, approximating a 20 percent
stratified random sample of nonfederal short-term, general, and other specialty
hospitals.” All results were weighted to reflect the entire population of discharges
from U.S. community hospitals. Patient Safety Indicators were developed
112
ChildChartbook-Back-D3f.qxd
2/23/04 2:17 PM
Page 113
through a multi-step process including literature review of validity and reliability,
expert clinician panel review, coding review, and empirical testing against
medical records to ensure that the algorithm was more likely to identify process
of care failures than a random sample of control cases. Rates were calculated
using a beta version (dated July 2002) of the PSI software and were adjusted by
age, gender, age-gender interactions, comorbidities, and diagnosis-related group
(DRG) clusters, except as noted below. The denominator for each indicator is
limited to the population most likely to be at risk for the complication, as
described in the following footnotes to the chart. The hospital-level indicators
shown in the chart generally use only secondary diagnoses to eliminate
complications that were present on admission (AHRQ 2003a, 2003b):
(10) postoperative physiologic and metabolic derangements per 1,000 electivesurgery patients, excluding obstetric admissions, patients with diabetic coma,
and patients with renal failure who also were diagnosed with acute myocardial
infarction, cardiac arrhythmia, cardiac arrest, shock, hemorrhage, or
gastrointestinal hemorrhage (N=161,121).
(11) complications of anesthesia per 1,000 surgical discharges, excluding patients
who also had substance use disorders (N=400,278).
(12) deaths per 1,000 admissions for low-mortality DRGs with a NIS 1997
benchmark of less than 0.5 percent mortality, excluding trauma,
immunocompromised, and cancer patients (N=5,238,794).
(1) decubitus ulcer per 1,000 discharges of length four or more days, excluding
paralysis patients, patients admitted from long-term care facilities, neonates,
and obstetrical admissions (N=364,783).
(13) iatrogenic pneumothorax per 1,000 discharges, excluding neonates, obstetrical
admissions, and patients with trauma, thoracic surgery, lung or pleural biopsy,
or cardiac surgery (N=1,866,063).
(2) birth trauma injury (any diagnosis) per 1,000 live births, excluding preterm and
osteogenesis imperfecta births; this rate was adjusted only for gender
(N=4,056,052).
(14) foreign body left in during procedure per 1,000 discharges, excluding neonates
(N=2,128,169).
(3) postoperative septicemia per 1,000 elective-surgery discharges of longer than 3
days, excluding patients admitted for infection, patients with cancer or
immunocompromised states, and obstetric conditions (N=47,197).
(4) postoperative respiratory failure per 1,000 elective-surgery discharges,
excluding patients with respiratory disease, circulatory disease, and obstetric
conditions (N=139,353).
(5) accidental puncture or laceration during procedures per 1,000 discharges,
excluding obstetric admissions (N=1,931,018).
(6) infections due to medical care per 1,000 discharges, excluding
immunocompromised or cancer patients and neonates (N=2,039,840).
(7) postoperative abdominal wound dehiscence per 1,000 abdominopelvic surgery
discharges, excluding obstetric conditions (N=125,313).
(8) postoperative pulmonary embolus or deep vein thrombosis (DVT) per 1,000
surgical discharges, excluding patients admitted for DVT, obstetrics, neonatal,
and plication of vena cava before or after surgery (N=371,850).
(9) postoperative hemorrhage or hematoma with surgical drainage or evacuation,
not verifiable as following surgery, per 1,000 surgical discharges, excluding
obstetrical admissions (N=372,041).
(15) transfusion reaction per 1,000 discharges, excluding neonates; this rate was
adjusted only for gender (N=2,128,169).
Chart 2:2—This chart presents data describing medication mistakes among
hospitalized children at two Boston teaching hospitals, detected by querying
and receiving voluntary reports from clinicians and by reviewing medication
orders, medication administration records, and medical records during six
weeks in 1999. At the first hospital, a freestanding children’s hospital, the study
included randomly selected general medical, general surgical, and short-stay
wards and pediatric medical/surgical ICU. At the second hospital, which treats
both adults and children, the study included all pediatric wards, including
general medical/surgical wards, pediatric medical/surgical ICU, and neonatal
ICU. Data collectors were nurses, pharmacists, and physicians trained in an
identical manner. Two physicians reviewers independently classified suspected
and potential adverse drug events and rated the severity of any injury to the
patient. Medication errors were defined as errors in ordering, transcribing,
dispensing, administering, or monitoring a drug, excepting rule violations with
little potential for harm that are usually interpreted correctly by pharmacy and
nursing staff. Adverse drug events were defined as injuries that result from use
of a drug (Kaushal et al. 2001).
Chart 2:3—The National Nosocomial Infections Surveillance (NNIS) System
includes more than 300 participating hospitals that report data on certain
Leatherman and McCarthy, Quality of Health Care for Children and Adolescents: A Chartbook, 2004. The Commonwealth Fund
113
ChildChartbook-Back-D3f.qxd
2/23/04 2:17 PM
Page 114
Leatherman and McCarthy, Quality of Health Care for Children and Adolescents: A Chartbook, 2004. The Commonwealth Fund
hospital-acquired infections to the CDC using standard protocols for at least
one month each year. Accuracy of reporting is generally high (Emori et al.
1998). Participating NNIS hospitals must have at least 100 beds and meet
minimum requirements for infection control staffing; they are larger on average
but have similar geographic distribution compared to U.S. hospitals generally
(Richards et al. 2001). The number of participating hospitals has increased since
the mid-1980s (Sartor et al. 1995). Data includes only those pediatric intensive
care units (PICUs) that reported at least 50 device- or patient-days (N=79 PICUs
with 428,104 central line days for bloodstream infections during 1995–2003;
75 PICUs with 201,096 urinary catheter-days for urinary tract infection during
1995–2003, and 75 PICUs with 285,607 ventilator-days for pneumonias during
1995–2001). Ventilator-associated pneumonia was reported for January 1995 to
June 2001 (rather than for January 1995 to June 2003 as for other infections)
because the NNIS began using new criteria to define nosocomial pneumonia in
January 2002 that would not be comparable to the 1986–1990 reference period
shown in the chart (NCID 2001; 2003).
Chart 3:1—The Medical Expenditure Panel Survey (MEPS), sponsored by the
Agency for Healthcare Research and Quality (AHRQ), collects nationally
representative data on health care use, expenditures, coverage, and quality for
the U.S. civilian, noninstitutionalized population. The household component is
a subsample of participants in the prior year’s National Health Interview Survey
(see Chart 3:2). Data shown were collected using questions derived from
AHRQ’s Consumer Assessment of Health Plans (CAHPS®) survey asked on the
MEPS Parent Administered Questionnaire (PAQ), a mail-back survey of parents
of children ages 17 and younger. In 2000, the PAQ was completed by 6,577
respondents representing 90 percent of those eligible for the PAQ and an overall
response rate of 63 percent (AHRQ 2002b; www.meps.ahrq.gov).
Chart 3:2—The National Health Interview Survey (NHIS) is an annual, nationally
representative, multi-stage probability sample survey of the civilian,
noninstitutionalized population of the U.S., conducted by the U.S. Census
Bureau for the National Center for Health Statistics. Data on children are
collected through face-to-face interviews with adults familiar with the health of
one randomly selected child per family. In 2000, interviews were completed for
13,376 children, representing 91 percent of the children eligible for the child
sample and an overall response of 79 percent (Blackwell et al. 2003).
Chart 3:3—The 1997 National Survey of America’s Families sampled 28,867
children in more than 44,000 households, with a response rate 65 percent (see
Chart 1:1 above for general information on this survey). “Children were
categorized as having unmet need if they had exceeded a cutoff point on a
mental health screening measure [the Mental Health Indicator] but had not
received any mental health services in the past 12 months.” The Mental Health
Indicator is a validated tool comprised of selected items from the Child
Behavior Checklist that “best discriminated between demographically similar
children who were or were not referred for mental health services, [and] is thus
a measure of need for clinical mental health evaluation.” A stringent cutoff
point was set to “avoid concerns about overinclusion of minor or transient
symptoms,” resulting in specificity of 88 percent to 90 percent for each agegender category. In both bivariate and multivariate analyses, Hispanic children
had significantly greater odds of unmet need compared to white children, and
publicly insured children had significantly lower odds of unmet need compared
to uninsured children. There were no significant differences in unmet need by
age category (middle childhood vs. adolescence), by gender, by income (poor
vs. not poor), between children of white race and those of black or other race,
or between uninsured and privately insured children. Multivariate analysis
controlled for predisposing sociodemographic factors, enabling resources, and
child’s mental health status (Kataoka et al. 2002).
Chart 3:4—The 2000 National Health Interview Survey is described above for
Chart 3:2. Time since last dental visit was assessed with this question: “About
how long has it been since [child] last saw or talked to a dentist? Include all
types of dentists, such as orthodontists, oral surgeons, and all other dental
specialists, as well as dental hygienists.”
Chart 3:5—Birth certificate data provided to the National Center for Health
Statistics include all of the 4 million births registered in the 50 states and
District of Columbia in 2001. More than 99 percent of births in the U.S. are
registered. The rate of first trimester prenatal care was computed using birth
certificates that listed the month that prenatal care began (98 percent of all
birth certificates in 2001) (Martin et al. 2002).
Chart 3:6 to 3:8—The National Survey of Children with Special Health Care Needs
is sponsored by the federal Maternal and Child Health Bureau and conducted in
cooperation with the National Center for Health Statistics (NCHS). Using the
State and Local Area Integrated Telephone Survey (SLAITS) mechanism, a
random-digit-dialing sample of 196,888 households with children younger than
age 18 years in each of the 50 states and the District of Columbia was screened
from October 2000 to March 2002. Among these households, 38,866 interviews
114
ChildChartbook-Back-D3f.qxd
2/23/04 2:17 PM
Page 115
were completed (approximately 750 in each state) with a parent who was most
knowledgeable about a child identified as having special health care needs. One
child was randomly selected when there was more than one child with special
needs in the same household. Children with special health care needs (CSHCN)
were identified using the CSHCN Screening Tool, which asks whether the child:
1) needs or uses more medical, mental health, or educational services than usual
for most children of the same age, 2) needs or uses prescribed medicine other
than vitamins, 3) is limited in the ability to do things that most children of the
same age can do, 4) needs or gets special therapy, or 5) has any kind of
emotional, developmental, or behavioral problem needing treatment or
counseling. Two follow-up probes ask whether the need for services is because of
a medical, behavioral, or other health condition and whether the condition has
lasted more than a year. The population at risk for developing special needs was
not included because there is no currently accepted method for identifying such
children using a survey questionnaire (van Dyck et al. 2002). The weighted overall
response rate for special needs interviews was 61 percent (Blumberg et al. 2003).
Results shown in the charts were compiled by staff of the NCHS Special
Population Surveys Branch (CDC 2003d), based on specifications that are
forthcoming (McPherson et al. 2004).
Chart 4:1—The 2000 Medical Expenditure Panel Survey and Parent Administered
Questionnaire are described above for Chart 3:1.
Chart 4:2—The Picker Institute’s Pediatric Inpatient Survey was adapted from the
Picker Adult Inpatient Survey and a quality of care survey developed by
Children’s Hospital of Boston. Psychometric analysis indicates that the
instrument is reliable and has high correlation with overall satisfaction and
dimension problem scores. Survey item responses were dichotomized as
“problems” or “not problems.” Each survey question was mapped to one of
seven quality dimensions and a percentage of problem responses was calculated
for each patient for each dimension. A problem score of 0 would mean no
problems were reported and 100 would mean problems were reported on 100
percent of processes asked about in the survey. The overall problem score is an
average of all the dimensions. Surveys were mailed to parents about two weeks
after their child was discharged from one of 38 participating hospitals
(primarily academic and teaching institutions) for a nonsurgical condition that
did not require intensive care, followed by reminders to nonrespondents.
Completed surveys were received from 12,600 parents, representing 48 percent
of the surveys mailed (Co et al. 2003).
Chart 4:3—The 2000 National Survey of Early Childhood Health is described
above for Chart 1:4.
Chart 5:1—The 1999 National Survey of America’s Families is described for Chart
1:1. In bivariate analysis, all independent variables shown in the chart were
significantly associated with receipt of recommended well-child care. In
multivariate analysis (after controlling for the child’s health insurance, family
income, race and ethnicity, health status, and parent’s age and education),
children who were uninsured or had poor health status or a parent with low
educational attainment had significantly greater odds of not receiving
recommended well-child visits. Children of Hispanic ethnicity or black race,
covered by public insurance, or with a parent younger than 30 years, had
significantly lower odds of not receiving recommended well-child visits.
Differences in well-child visits by family income were no longer significant in
multivariate analysis (Yu et al. 2002).
Chart 5:2—The National Immunization Survey (NIS) is described above for Chart
1:2 (which describes 2002 data). For the 1994 NIS, 25,247 household
interviews were completed from April to December and 7,594 provider surveys
were returned (41 percent of children eligible for provider follow-up) (CDC
1995). For the 1998 NIS, 31,664 household interviews were completed and
21,827 provider surveys were returned (67 percent of eligible children) (CDC
1999b). The 95 percent confidence intervals of the rates did not overlap for any
of the comparisons shown on the chart for 1998 and 2002 (confidence intervals
not available for 2004). Rates for rural areas (non-MSA) are not shown because
their confidence intervals overlapped with those of urban and/or suburban
areas. Data were not available in all years for other racial groups, which are not
shown. The category “unknown poverty” was omitted for clarity. (See
www.cdc.gov/nis for NIS data tables.)
Chart 5:3—The Asthma Care Quality Assessment Project involved five large
health plans: three group model HMOs serving employer- and Medicaidinsured populations and two mixed-model Medicaid managed care
organizations. Medicaid-insured children (ages 2 to 16 years) were included if
computerized data indicated a physician diagnosis for asthma or a
prescription for an asthma medication and a parent confirmed that the child
had physician-diagnosed asthma (all eligible children were identified in four
plans and a random sample was drawn in one large plan). A total of 1,658
interviews with parents were completed in English or Spanish during 1999
and included in the analysis (63 percent of those eligible). Interview
Leatherman and McCarthy, Quality of Health Care for Children and Adolescents: A Chartbook, 2004. The Commonwealth Fund
115
ChildChartbook-Back-D3f.qxd
2/23/04 2:17 PM
Page 116
Leatherman and McCarthy, Quality of Health Care for Children and Adolescents: A Chartbook, 2004. The Commonwealth Fund
questions were based on previously validated instruments. Persistent asthma
was defined as having five or more symptom days in past two weeks, using
beta-agonist medications three or more times per week in the past two weeks,
or using anti-inflammatory medications daily in the past two weeks.
Compared to white children (31 percent of the sample), black children (38
percent of the sample) had worse asthma status, and Latino children (19
percent of the sample) missed more school days. In multivariate analyses that
controlled for sociodemographic variables and asthma status, minority
children had significantly lower odds of using inhaled anti-inflammatory
medication in comparison to white children, while process of care measures
were equal or better for minority children (Lieu et al. 2002).
Chart 5:4—The help-seeking analysis shown in this chart is derived from the first
stage of a two-stage study. A gender-stratified random sample of 3,158 children
(limited to one child per household) was drawn from children in kindergarten
through fifth grade in one north central Florida school district who lived in a
household with a telephone, were not receiving special education services for
mental retardation or autism, and were white (reported as “Caucasian”) or
African American (other minorities made up less than five percent of the
student population). Parents of 1,615 children were contacted and agreed to
participate in a telephone interview between October and December 1998.
Mailed teacher questionnaires were completed with parent permission for
1,197 children. A total of 389 children were included in the help-seeking
analysis if they had been diagnosed or treated for ADHD or scored two standard
deviations above the norm by parent or teacher rating on a standardized
screening measure, the SNAP IV. Estimates were adjusted for sampling and
nonparticipation effects. All gender and racial differences in parent recognition
and help-seeking were significant in bivariate analysis. Gender and racial
differences in help-seeking remained significant in multivariate analyses after
controlling for predisposing sociodemographic factors, enabling factors, and
need for services. However, there were no significant differences by gender or
race for parents’ recognition of behavioral problems after controlling for these
factors (Bussing et al. 2003).
Chart 5:5—The National Survey of Children with Special Health Care Needs is
described above for Charts 3:6 to 3:8.
Chart 5:6—The Consumer Assessment of Health Plans Benchmarking Database
1.0 included 9,540 children (younger than age 18 years) enrolled in Medicaid
managed care plans in Arkansas, Kansas, Minnesota, Oklahoma, Vermont, and
Washington State in 1997 and 1998. Surveys were administered in English and
Spanish by phone and mail with a 42 percent average response rate. Language
for Hispanic and Asian parents was based on what she/he reported primarily
speaking at home. Data for missing race and language and other race were
omitted from the chart for clarity. The chart presents composite scores for three
of five performance domains measured by the survey (see Charts 3:1 and 4:1 for
examples of items included in these domains). After controlling for parent age,
gender, and education and child’s health status, ratings given by African
Americans, American Indians, and non-English-speaking Hispanic and Asian
parents were significantly different from ratings given by white parents for most
domains shown on the chart, except for “Provider Communication” among
African Americans and “Getting Needed Care” among Hispanic Spanishspeaking parents. Ratings given by English-speaking Hispanic and Asian parents
were not significantly different from ratings given by white parents (WeechMaldonado et al. 2001).
Chart 6:1—This before-and-after study included all physician practices in
Durham, N.C., that enrolled at least five patients per month: two family
practice group practices, three pediatric group practices, an HMO pediatric
clinic, a university medical center, and a federally qualified community health
center. A random sample of 40 medical records was abstracted at each practice
at baseline (N=339) and separate follow-up samples were abstracted 12
months after each practice’s office systems were operational. The follow-up
samples consisted of 35 charts from each of three age groups at each practice:
12 to 18 months (N=289), 19 to 24 months (N=285), and 25 to 30 months
(N=300). All rates of preventive services shown in the chart were significantly
different at follow-up from rates at baseline. Longer time of exposure to the
intervention was associated with a significant trend toward increased rates of
preventive care. Logistic models accounted for clustering of patients within
practices (Bordley et al. 2001).
Chart 6:2—This prospective controlled trial was conducted at 15 pediatric
practice sites located in 14 states with enrollment staggered between Sept.
1996 through Nov. 1998. Newborns up to 4 weeks old were consecutively
enrolled at birth or at their first office visit if they were not to be adopted or
placed in foster care, were not too ill to make an office visit by age 4 weeks,
their mother spoke English or Spanish, and the family intended to continue at
the practice for at least 6 months. At each of six sites, 400 newborns were
randomized to intervention or control groups (the same clinicians cared for
children in both groups). At each of nine sites, about 200 newborns were
116
ChildChartbook-Back-D3f.qxd
2/23/04 2:17 PM
Page 117
enrolled in an intervention practice and 200 at a matched comparison practice.
Data was obtained from telephone interviews in English and Spanish when the
child was 30 to 33 months (N=3,737 primarily mothers, representing 67
percent of 5,565 enrolled families), enrollment forms, and a random sample
of medical records at each practice. In bivariate analyses of results from all sites
combined, 21 of 24 quality of care outcomes measured in the study (only five
of which are shown in the chart) were significantly improved for the
intervention versus control group and comparison sites. These results were
confirmed in multivariate analysis that controlled for site of enrollment and
characteristics of the child, parent, and family, for the fact that families within
sites tend to respond more similarly than those at different sites, and for
nonrandom assignment at quasi-experimental sites or selective reporting of
outcome data (Minkovitz et al. 2003).
Chart 6:3—This chart compares two separate retrospective data analyses. Rhode
Island data were derived from a random sample of 2,000 children ages 19 to 35
months as of June 30, 1997, who were continuously enrolled (with no more
than a 30-day gap) in the Rhode Island Medicaid managed care program from
July 1996 through June 1997. Data on lead screening performed from birth to
June 30, 1997, were available from the medical records of the primary care
provider(s) for 1,988 of such children (Vivier et al. 2001). Comparison data
were derived from Medicaid claims for 15 states that submitted complete 1994
and 1995 data to the federal government’s State Medicaid Research Files. The
analysis was limited to young children who had an opportunity to receive a
blood lead test paid for directly by Medicaid (N=288,963), specifically those
that: 1) were enrolled in Medicaid for six months before and after their first or
second birthday; 2) had their first or second birthday between July 1994 and
June 1995; 3) had made at least one visit to a Medicaid provider; 4) had no
evidence of ever being enrolled in Medicaid managed care; and 5) had no
evidence of coverage by private health insurance before 19 months for one-year
olds and 31 months for two-year-olds (GAO 1999).
Chart 6:4—In this before-and-after study, five community and migrant health
centers (CMHCs) were selected for study participation based on diversity of
geography, patient population, and clinician types; adequacy of information
infrastructure; and stability and commitment of leadership. Data shown in the
chart were derived from telephone interviews conducted by research staff with
two independent samples of adolescent patients (ages 14 to 19 years) at preintervention (N=260) and nine to 15 months post-intervention (N=274).
Adolescents and their parents seen at clinic visits were consented and enrolled
by clinic staff. Interviews, conducted two to four weeks after clinic visits,
assessed whether adolescents recalled receiving each of 31 recommended
counseling, screening, examination, or laboratory services. Differences in rates
of screening (before versus after the intervention) were significant for all topics
shown in the chart (Klein et al. 2001).
Chart 6:5—In this cluster-randomized controlled trial, the 10 largest pediatric
clinics affiliated with a large HMO were selected for participation from those
that were willing, had no adolescent-specific clinic, had a minimum of 500
sexually active adolescent girls (ages 14 to 18 years) visiting for routine
checkups each year, and served an ethnically diverse population. Sites were
randomly assigned to intervention or usual care; site staff were blinded to study
conditions and assignment. Screening rates were determined using a patient
encounter and laboratory database. Site-specific sexual activity rates were
determined using an anonymous survey administered after routine checkup
visits. Among adolescent girls ages 14 to 18 years who had 7,920 routine
checkup visits during the April 2000 through March 2002 study period, 1,017
and 1,194 were estimated to be eligible for screening in the intervention and
control sites, respectively. Estimated screening rates were calculated (number of
chlamydia tests done divided by the product of the number of girls seen for
checkups and the sexual activity rate) at baseline and six consecutive threemonth periods during the intervention (only baseline and final rates are shown
in the chart). The screening rate was significantly higher in the intervention
clinics than in control clinics by the four- to six-month period after the start of
the intervention and remained so throughout most of the post-intervention
period. A statistical test (repeated measures analysis of variance) of time period
by study group interaction effect found that the change in screening rates
differed significantly for the intervention and control sites (Shafer et al. 2002).
Chart 6:6—In this cluster-randomized controlled trial, 12 clinical practices
affiliated with two managed care organizations were stratified by size and
randomly assigned (by pairs based on similar ranked baseline antibiotic
prescribing rates) to intervention or control groups. Computerized claims data
were analyzed for enrolled children ages 3 months up to 72 months if they had
pharmacy benefits for at least three months during the study period and had a
record of ambulatory visits and antimicrobial prescribing during the study
period. There were 14,468 and 13,460 patients in the baseline and intervention
years, respectively. Observation time in person-years was determined for each
child as the period of membership in the age subgroup (based on age at the
start of the intervention year) during the baseline and intervention years.
Leatherman and McCarthy, Quality of Health Care for Children and Adolescents: A Chartbook, 2004. The Commonwealth Fund
117
ChildChartbook-Back-D3f.qxd
2/23/04 2:17 PM
Page 118
Leatherman and McCarthy, Quality of Health Care for Children and Adolescents: A Chartbook, 2004. The Commonwealth Fund
Baseline antibiotic use was significantly lower in the intervention sites. The
change in unadjusted dispensing rates (shown in the chart) was significantly
greater for intervention versus control sites. In a comparison of rates for 8,815
children enrolled during both years of observation (not shown), a significant
intervention effect was confirmed after adjusting for each patient’s antibiotic use
in the baseline year, their age, and correlation between prescription rates for
children in each practice site. This effect was confirmed in separate practice-level
analyses, which found that the improvement was not attributable to extreme
results at any one practice site (Finkelstein et al. 2001).
Chart 6:7—Participants in this controlled before-and-after study included
Medicaid-insured children and adolescents, ages 2 to 16 years, who had visited
an inner-city hospital emergency room two or more times or been hospitalized
one or more times for asthma in the past year, had received primary care in the
hospital’s outpatient clinic, had not been evaluated by an asthma specialist in
the past two years, and whose family consented to participate. Participants were
alternately assigned to intervention or control groups (the family and
interviewer were not aware of group assignment at recruitment), which were
demographically similar at baseline. Most children continued to receive the
majority of their care from the hospital’s outpatient clinic during the
intervention. Utilization data were collected through monthly telephone
interviews with parents of children and verified by comparison to medical
records. Data were obtained from hospital financial records on charges for
outpatient medical care of study patients; charges for hospitalizations and ER
visits that occurred in other institutions were imputed based on the study
hospital’s average charges. The cost of the outreach nurse (12 hours per week or
$15,000/year) was included in the cost of the intervention. In logistic regression
analysis controlling for individual history of asthma outcomes in the prior year,
children in the control group were significantly more likely than those in the
intervention group to have an ED visit and to be hospitalized for asthma in the
study year (Kelly et al. 2000).
Chart 6:8—Adolescent patients (ages 12 to 20 years) attending a universityaffiliated diabetes clinic were invited to participate in this randomized
controlled trial if they had no other health problems except for treated
hypothyroidism, had been taking insulin for at least one year, had recent
hemoglobin A1c between 7 percent and 14 percent, had no severe
hypoglycemic events in the past six months, and were in school grade
appropriate to their age within one year. Between November 1, 1995, and
December 1, 1997, 77 of 105 invited patients agreed to participate and were
randomly assigned to control or intervention groups; there were no significant
differences between participants and non-participants or between control and
intervention groups on measured variables at baseline. Diabetes care providers
and data collectors were blinded to study group assignment. Analysis of
variance for repeated measures and simple post hoc contrast tests found that
average hemoglobin A1c levels and quality-of-life scores (measured using the
Diabetes Quality of Life: Youth instrument) improved significantly more over
time and were significantly different at six months and 12 months for the
intervention group compared to the control group (Grey et al. 2000).
Chart 6:9—This comparative before-and-after study involved six self-selected
members of the Vermont Oxford Network, a voluntary group of professionals
committed to research, education, and quality improvement. Data on project
outcomes were derived from the Network’s database of standardized
information on infants weighing 401 to 1,500 grams at birth who were born at
or transferred to participating NICUs within 28 days of birth. Nosocomial
infection was defined as the occurrence, after the third day of life, of an
infection from a predefined list of bacterial pathogens. “Coagulase-negative
staphylococcal infection [CONS] required the recovery of the organism from
blood or spinal fluid, signs of systemic illness, and treatment for 5 or more days
antibiotics.” The comparison group included 66 North American NICUs that
contributed 25 or more cases to the Network database from 1994 to 1996 and
were not participating in the intervention. Primary analyses compared change
in average CONS infection rates from baseline (1994) to a predefined end-point
(1996) with additional comparisons to 1997. The study included infants
weighing 501 to 1,500 grams who were hospitalized more than three days at
intervention sites (N=745 born in 1994, 772 born in 1996, and 789 born in
1997) and at comparison sites (5,108 born in 1994, 5,528 born in 1996, and
5,572 born in 1997). Significant differences in magnitude of change in average
CONS infection rates at intervention and comparison sites (group-by-year
interaction) were found using a logistic regression model that controlled for
birth weight, location of birth, multiple birth, assisted ventilation, and year of
birth. Secondary analysis (based on variable, year of birth) found a significant
change in outcome over time among intervention NICUs from 1994 to 1997.
There was also a significant decline in the average rate of all measured
nosocomial infections at the intervention sites during this time, attributable to
the decline in CONS infections (Horbar et al. 2001).
118
ChildChartbook-Back-D3f.qxd
2/23/04 2:17 PM
Page 119
References
AAP (American Academy of Pediatrics). 1997. Guidelines for health supervision III.
Elk Grove, Ill.: American Academy of Pediatrics.
— 1998a. Screening for elevated blood lead levels. Pediatrics 101:1072-8.
— 1998b. Screening for retinopathy in the pediatric patient with type 1 diabetes
mellitus. Pediatrics 101:313-4.
— 1999. Literacy Promotion. Elk Grove, Ill., American Academy of Pediatrics,
Division of Community-based Initiatives.
— 2000. Policy statement: recommendations for the prevention of pneumococcal infections, including the use of pneumococcal conjugate vaccine
(Prevnar), pneumococcal polysaccharide vaccine, and antibiotic prophylaxis.
Pediatrics 106:362-6.
— 2001. Clinical practice guideline: Treatment of the school-aged child with
attention-deficit/hyperactivity disorder. Pediatrics 108:1033-44.
— 2002a. The medical home. Pediatrics 110:184-6.
— 2002b. Health supervision for children with sickle cell disease. Pediatrics
109:526-35.
— 2003. Oral health risk assessment timing and establishment of the dental
home. Pediatrics 111:1113-6.
AAPD (American Academy of Pediatric Dentistry). 2002. Clinical guideline on periodicity of examination, preventive dental services, anticipatory guidance and oral
treatment for children. Chicago: American Academy of Pediatric Dentistry.
Ackard, D. M. and D. Neumark-Sztainer. 2001. Health care information sources
for adolescents: Age and gender differences on use, concerns, and needs. J
Adolesc Health 29:170-6.
ADA (American Diabetes Association). 2002. Standards of medical care for
patients with diabetes mellitus. Diabetes Care 25:213-29.
Adams, R. J., et al. 2001. Impact of inhaled antiinflammatory therapy on hospitalization and emergency department visits for children with asthma. Pediatrics
107:706-11.
Program workshop brief, January 30-February 1, 2002. Rockville, Md.: U.S.
Department of Health and Human Services.
— 2002b. Statistical brief #3: Children’s health care quality, Fall 2000. Washington,
D.C.: U.S. Department of Health and Human Services.
— 2003a. AHRQ quality indicators. Guide to patient safety indicators. Rockville,
Md.: U.S. Department of Health and Human Services.
— 2003b. National healthcare quality report. Rockville, Md.: U.S. Department of
Health and Human Services.
Akinbami, L. J., et al. 2002. Racial and income disparities in childhood asthma in
the United States. Ambul Pediatr 2:382-7.
ALA (American Lung Association). 2003. Trends in asthma morbidity and mortality.
New York: American Lung Association.
Alexander, G. R. and C. C. Korenbrot. 1995. The role of prenatal care in preventing low birth weight. Future Child 5:103-20.
Alexander, G. R. and M. Kotelchuck. 2001. Assessing the role and effectiveness of
prenatal care: History, challenges, and directions for future research. Public
Health Rep 116:306-16.
Alexander, G. R., et al. 2002. Racial differences in prenatal care use in the United
States: Are disparities decreasing? Am J Public Health 92:1970-5.
Almeida, R., et al. 2001. Does SCHIP spell better dental care access for children? An
early look at new initiatives. Washington, D.C.: The Urban Institute.
Andrulis, D., et al. 2002. What a difference an interpreter can make. Health care experiences of uninsured with limited English proficiency. Boston: The Access Project.
Ashton, C. M., et al. 2003. Racial and ethnic disparities in the use of health services: Bias, preferences, or poor communication? J Gen Intern Med 18:146-52.
Balas, E. A., et al. 2000. Improving preventive care by prompting physicians. Arch
Intern Med 160:301-8.
AECLP (Alliance to End Childhood Lead Poisoning). 2001. The foundations of
better lead screening for children in Medicaid. Washington, D.C.: Alliance for
Healthy Homes.
Bates, D. W., et al. 2003. Ten commandments for effective clinical decision
support: Making the practice of evidence-based medicine a reality. J Am Med
Inform Assoc 10:523-30.
AHRQ (Agency for Healthcare Research and Quality). 1999. Treatment of attentiondeficit/hyperactivity disorder. Evidence report/technology assessment number 11.
Rockville, Md.: U.S. Department of Health and Human Services.
— 2002a. Improving early childhood development: promising strategies. User Liaison
Bauchner, H., et al. 1999. Parents, physicians, and antibiotic use. Pediatrics
103:395-401.
Beal, A. C., et al. 2004. Quality measures for children’s health care: State of the
science. Pediatrics 113:199-209.
Leatherman and McCarthy, Quality of Health Care for Children and Adolescents: A Chartbook, 2004. The Commonwealth Fund
119
ChildChartbook-Back-D3f.qxd
2/23/04 2:17 PM
Page 120
Leatherman and McCarthy, Quality of Health Care for Children and Adolescents: A Chartbook, 2004. The Commonwealth Fund
Bechel, D. L., et al. 2000. Does patient-centered care pay off? Jt Comm J Qual
Improv 26:400-9.
Brach, C. and I. Fraser. 2000. Can cultural competency reduce racial and ethnic
health disparities? A review and conceptual model. Med Care Res Rev 57:181-217.
Bender, B., et al. 1997. Nonadherence in asthmatic patients: Is there a solution to
the problem? Ann Allergy Asthma Immunol 79:177-85.
Briss, P. A., et al. 2000. Reviews of evidence regarding interventions to improve
vaccination coverage in children, adolescents, and adults. The Task Force on
Community Preventive Services. Am J Prev Med 18:97-140.
Bender, B. G. 2002. Overcoming barriers to nonadherence in asthma treatment. J
Allergy Clin Immunol 109:S554-9.
Berry, L. L., et al. 2003. Innovations in access to care: A patient-centered approach.
Ann Intern Med 139:568-74.
Berwick, D. M. 2003. Disseminating innovations in health care. JAMA 289:1969-75.
Betancourt, J. R., et al. 2002. Cultural competence in health care: Emerging frameworks and practical approaches. New York: The Commonwealth Fund.
Bethell, C., et al. 2001. Assessing health system provision of well-child care: The
Promoting Healthy Development Survey. Pediatrics 107:1084-94.
— 2002. Partnering with parents to promote the healthy development of young children
enrolled in Medicaid. New York: The Commonwealth Fund.
Blackwell, D. L., et al. 2003. Summary health statistics for U.S. children. National
Health Interview Survey, 2000. National Center for Health Statistics. Vital
Health Stat 10(213).
Blake, D. R., et al. 2003. Improving participation in chlamydia screening programs: Perspectives of high-risk youth. Arch Pediatr Adolesc Med 157:523-9.
Blum, R. W., et al. 1996. Don’t ask, they won’t tell: The quality of adolescent
health screening in five practice settings. Am J Public Health 86:1767-72.
Blumberg, S. J., et al. 2002. Design and operation of the National Survey of
Early Childhood Health, 2000. National Center for Health Statistics. Vital
Health Stat 1(40).
Blumberg, S. 2003. Overview of the National Survey of Children with Special Health
Care Needs. Atlanta: Centers for Disease Control and Prevention.
Blumberg, S., et al. 2003. Design and operation of the National Survey of
Children with Special Health Care Needs. National Center for Health
Statistics. Vital Health Stat 1(41).
Boekeloo, B. O., et al. 1999. A STD/HIV prevention trial among adolescents in
managed care. Pediatrics 103:107-15.
— 2003. Effect of patient priming and primary care provider prompting on adolescent-provider communication about alcohol. Arch Pediatr Adolesc Med
157:433-9.
Bordley, W. C., et al. 2001. Improving preventive service delivery through office
systems. Pediatrics 108:E41.
Bronstein, J. M., et al. 1995. Access to neonatal intensive care for low-birthweight
infants: The role of maternal characteristics. Am J Public Health 85:357-61.
Brown, B. V., et al. 2003. A century of children’s health and well-being. Washington,
D.C.: Child Trends.
Bus, A. G., et al. 1995. Joint book reading makes for success in learning to read. A
meta-analysis on intergenerational transmission of literacy. Review of
Educational Research 65:1-21.
Bussing, R., et al. 2003. Barriers to detection, help-seeking, and service use for
children with ADHD symptoms. J Behav Health Serv Res 30:176-89.
Cabana, M. D., et al. 1999. Why don’t physicians follow clinical practice guidelines? A framework for improvement. JAMA 282:1458-65.
— 2001. Reasons for pediatrician nonadherence to asthma guidelines. Arch
Pediatr Adolesc Med 155:1057-62.
Cabana, M. D. and G. Flores. 2002. The role of clinical practice guidelines in
enhancing quality and reducing racial/ethnic disparities in paediatrics.
Paediatr Respir Rev 3:52-8.
Calpin, C., et al. 1997. Effectiveness of prophylactic inhaled steroids in childhood
asthma: A systemic review of the literature. J Allergy Clin Immunol 100:452-7.
Car, J. and A. Sheikh. 2003. Telephone consultations. BMJ 326:966-9.
Carnegie Council on Adolescent Development. 1995. Great transitions: Preparing
adolescents for a new century. New York: Carnegie Corporation.
Carnegie Task Force on Meeting the Needs of Young Children. 1994. Starting
points: Meeting the needs of our youngest children. New York: Carnegie
Corporation.
Carroll, G., et al. 1983. Adolescents with chronic disease. Are they receiving comprehensive health care? J Adolesc Health Care 4:261-5.
Casalino, L., et al. 2003. External incentives, information technology, and organized processes to improve health care quality for patients with chronic diseases. JAMA 289:434-41.
CDC (Centers for Disease Control and Prevention). 1991. Preventing lead poisoning
in young children. Atlanta: U.S. Department of Health and Human Services.
— 1993. Recommendations for the prevention and management of chlamydia
trachomatis infections, 1993 MMWR Recomm Rep 42(RR-12):1-39.
120
ChildChartbook-Back-D3f.qxd
2/23/04 2:17 PM
Page 121
— 1995. State and national vaccination coverage levels among children aged 1935 months—United States, April-December 1994. MMWR Morb Mortal Wkly
Rep 44:613, 619-23.
— 1997a. Update: blood lead levels—United States, 1991-1994. MMWR Morb
Mortal Wkly Rep 46:141-6.
— 1997b. Screening young children for lead poisoning. Atlanta: U.S. Department of
Health and Human Services.
— 1997c. National, state, and urban area vaccination coverage levels among
children aged 19-35 months—United States, January-December 1995.
MMWR Morb Mortal Wkly Rep 46:176-82.
— 1999a. Vaccine preventable diseases: Improving vaccination coverage in
children, adolescents, and adults: A report of the recommendations of the
Task Force on Community Preventive Services. MMWR Morb Mortal Wkly
Rep 48:1-15.
— 1999b. National, state, and urban area vaccination coverage levels among
children aged 19-35 months—United States, 1998. MMWR Morb Mortal Wkly
Rep 48:829-30.
— 2000. Entry into prenatal care—United States, 1989-1997. MMWR Morb
Mortal Wkly Rep 49:393-7.
— 2001. Chlamydia in the United States. Atlanta: U.S. Department of Health and
Human Services.
— 2002a. Pertussis—United States, 1997-2000. MMWR Morb Mortal Wkly Rep
51:73-6.
— 2002b. Surveillance for asthma—United States, 1980-1999. MMWR Morb
Mortal Wkly Rep 51(SS-1):1-13.
— 2003a. Promoting appropriate antibiotic use in the community. Atlanta: U.S.
Department of Health and Human Services.
— 2003b. National, state, and urban area vaccination levels among children
aged 19-35 months—United States 2002. MMWR Morb Mortal Wkly Rep
52:728-32.
— 2003c. Asthma prevalence, health care use and mortality, 2000-2001. Atlanta: U.S.
Department of Health and Human Services.
— 2003d. Progress toward implementing community-based systems of services for children with special health care needs. Summary tables from the National Survey of
Children with Special Health Care Needs, 2001. Altanta: U.S. Department of
Health and Human Services.
— 2003e. National immunization survey data tables. Atlanta: U.S. Department of
Health and Human Services, www.cdc.gov/nis, accessed Oct., 2003.
— 2003f. National diabetes fact sheet. Atlanta: U.S. Department of Health and
Human Services.
CFF (Cystic Fibrosis Foundation). 1997. Clinical practice guidelines for cystic fibrosis.
Bethesda, Md.: Cystic Fibrosis Foundation.
— 2003a. Facts about CF. Bethesda, Md.: Cystic Fibrosis Foundation.
— 2003b. Patient Registry Annual Data Report 2002. Bethesda, Md.: Cystic
Fibrosis Foundation.
Cheng, T. L., et al. 1999. Determinants of counseling in primary care pediatric
practice. Arch Pediatr Adolesc Med 153:629-35.
CMHI (Center for Medical Home Improvement). 2003. Medical home improvement
kit. Lebanon, N.H.: Children’s Hospital at Dartmouth-Hitchcock Medical
Center, Hood Center for Children and Families.
Christakis, D. A., et al. 2000. The association between greater continuity of care
and timely measles-mumps-rubella vaccination. Am J Public Health 90:962-5.
— 2001a. Continuity and quality of care for children with diabetes who are
covered by Medicaid. Ambul Pediatr 1:99-103.
— 2001b. Methodologic issues in pediatric outcomes research. Ambul Pediatr
1:59-62.
— 2001c. Association of lower continuity of care with greater risk of emergency
department use and hospitalization in children. Pediatrics 107:524-9.
— 2002. Continuity of care is associated with high-quality care by parental
report. Pediatrics 109:E54.
— 2003. Continuity of care is associated with well-coordinated care. Ambul
Pediatr 3:82-6.
Clark, N. M., et al. 1998. Impact of education for physicians on patient outcomes.
Pediatrics 101:831-6.
Cleary, P. D., et al. 1991. Patients evaluate their hospital care: A national survey.
Health Aff (Millwood) 10(4):254-67.
Co, J. P., et al. 2003. Are hospital characteristics associated with parental views of
pediatric inpatient care quality? Pediatrics 111:308-14.
Colmers, J. M., et al. 1999. Pediatric dental care in CHIP and Medicaid. New York:
Milbank Memorial Fund.
Cook, R. L., et al. 2001. Barriers to screening sexually active adolescent women for
chlamydia: A survey of primary care physicians. J Adolesc Health 28:204-210.
CORN (Council of Regional Networks for Genetic Services). 2002. National
newborn screening report—2002. New York: Council of Regional Networks for
Genetic Services.
Coulter, A. and P. D. Cleary. 2001. Patients’ experiences with hospital care in five
countries. Health Aff (Millwood) 20(3):244-52.
Cuellar, A. E., et al. 2003. New opportunities for integrated child health systems.
Am J Public Health 93:1889-90.
Darby, C. 2002. Patient/parent assessment of the quality of care. Ambul
Pediatr 2:345-8.
Leatherman and McCarthy, Quality of Health Care for Children and Adolescents: A Chartbook, 2004. The Commonwealth Fund
121
ChildChartbook-Back-D3f.qxd
2/23/04 2:17 PM
Page 122
Leatherman and McCarthy, Quality of Health Care for Children and Adolescents: A Chartbook, 2004. The Commonwealth Fund
Davis, D. A., et al. 1995. Changing physician performance. A systematic review of
the effect of continuing medical education strategies. JAMA 274:700-5.
Dowell, S. F., et al. 1998. Principles of judicious use of antimicrobial agents for
pediatric upper respiratory infection. Pediatrics 101:165-71.
Davis, D. A. and A. Taylor-Vaisey. 1997. Translating guidelines into practice. A systematic review of theoretic concepts, practical experience and research evidence in the adoption of clinical practice guidelines. CMAJ 157:408-16.
Downing, B. and C. Roat. 2002. Models for the provision of language access in health
care setting. Santa Rosa, Calif.: National Council on Interpreting in Health
Care.
Davis, H., et al. 1997. National trends in the mortality of children with sickle cell
disease, 1968 through 1992. Am J Public Health 87:1317-22.
Downs, S. M. and H. Uner. 2002. Expected value prioritization of prompts and
reminders. Proc AMIA Symp: 215-9.
Day, S., et al. 1992. A successful education program for parents of infants with
newly diagnosed sickle cell disease. J Pediatr Nurs 7:52-7.
Dulcan, M. 1997. Practice parameters for the assessment and treatment of children, adolescents, and adults with attention-deficit/hyperactivity disorder.
American Academy of Child and Adolescent Psychiatry. J Am Acad Child
Adolesc Psychiatry 36:85S-121S.
DCCT (Diabetes Control and Complications Trial) Research Group. 1993. The
effect of intensive treatment of diabetes on the development and progression
of long-term complications in insulin-dependent diabetes mellitus. N Engl J
Med 329:977-86.
— 1994. Effect of intensive diabetes treatment on the development and progression of long-term complications in adolescents with insulin-dependent diabetes mellitus. J Pediatr 125:177-88.
DHHS (Department of Health and Human Services). 1999. Mental health: A report
of the Surgeon General. Rockville, Md.: National Institute of Mental Health.
— 2000a. Healthy People 2010: Understanding and improving health. Washington,
D.C.: U.S. Government Printing Office.
— 2000b. Tracking Healthy People 2010. Washington, D.C.: U.S. Government
Printing Office.
Dickey, L. L. and D. B. Kamerow. 1996. Primary care physicians’ use of office
resources in the provision of preventive care. Arch Fam Med 5:399-404.
Dickey, L. L., et al. 1999. Office system interventions supporting primary carebased health behavior change counseling. Am J Prev Med 17:299-308.
DuPlessis, H. M., et al. 1998. Assessing the performance of community systems
for children. Health Serv Res 33:1111-42.
Dyer, M. B., et al. 2002. Are incentives effective in improving the performance of
managed care plans? Princeton, N.J.: Center for Health Care Strategies, Inc.
Eberhardt, M. S., et al. 2001. Health, United States, 2001. Hyattsville, Md.: National
Center for Health Statistics.
Edelstein, B. L. 2002. Disparities in oral health and access to care: Findings of
national surveys. Ambul Pediatr 2:141-7.
Eiser, C. and R. Morse. 2001. A review of measures of quality of life for children
with chronic illness. Arch Dis Child 84:205-11.
Elliott, V., et al. 2001. Parental health beliefs and compliance with prophylactic
penicillin administration in children with sickle cell disease. J Pediatr Hematol
Oncol 23:112-6.
Dietrich, A. J., et al. 1997. An office systems approach to cancer prevention in
primary care. Cancer Pract 5:375-81.
Elster, A. B. 1998. Comparison of recommendations for adolescent clinical preventive services developed by national organizations. Arch Pediatr Adolesc Med
152:193-8.
DiGuiseppi, C. and I. G. Roberts. 2000. Individual-level injury prevention strategies in the clinical setting. Future Child 10:53-82.
Elster, A. B. and N. J. Kuznets. 1994. AMA Guidelines for Adolescent Preventive
Services. Baltimore: Williams & Wilkins.
Donabedian, A. 1980. The definition of quality and approaches to its measurement.
Chicago, Ill.: Health Administration Press.
Elster, A., et al. 2003. Racial and ethnic disparities in health care for adolescents: A
systematic review of the literature. Arch Pediatr Adolesc Med 157:867-74.
Doobinin, K. A., et al. 2003. Nonurgent pediatric emergency department visits:
Care-seeking behavior and parental knowledge of insurance. Pediatr Emerg
Care 19:10-14.
Elward, A. M. and K. A. McGann. 2002. Steps to reduce nosocomial infections in
children. Infect Med 19:414-24.
Doty, M. M. 2003. Hispanic patients’ double burden: Lack of health insurance and
limited English. New York: The Commonwealth Fund.
Emori, T. G., et al. 1998. Accuracy of reporting nosocomial infections in intensive-care-unit patients to the National Nosocomial Infections Surveillance
System. Infect Control Hosp Epidemiol 19:308-16.
122
ChildChartbook-Back-D3f.qxd
2/23/04 2:17 PM
Page 123
Epner, J. E., et al. 1998. Primary care providers’ responsiveness to health-risk
behaviors reported by adolescent patients. Arch Pediatr Adolesc Med
152:774-80.
Evans, D., et al. 1997. Improving care for minority children with asthma:
Professional education in public health clinics. Pediatrics 99:157-64.
Evans, R., 3rd, et al. 1999. A randomized clinical trial to reduce asthma morbidity
among inner-city children: Results of the National Cooperative Inner-City
Asthma Study. J Pediatr 135:332-8.
— 2002. The importance of cultural and linguistic issues in the emergency care
of children. Pediatr Emerg Care 18:271-84.
— 2003. Errors in medical interpretation and their potential clinical consequences in pediatric encounters. Pediatrics 111:6-14.
Forrest, C. B. and B. Starfield. 1998. Entry into primary care and continuity: The
effects of access. Am J Public Health 88:1330-6.
Forrest, D., et al. 1997. Child health services research: Challenges and opportunities. JAMA 277:1787-93.
Farber, H. J., et al. 2003. Misunderstanding of asthma controller medications:
Associations with nonadherence. J Asthma 40:17-25.
Fortescue, E. B., et al. 2003. Prioritizing strategies for preventing medication errors
and adverse drug events in pediatric inpatients. Pediatrics 111:722-9.
Farkas, A. J., et al. 1999. Does parental smoking cessation discourage adolescent
smoking? Prev Med 28:213-8.
Francis, V., et al. 1969. Gaps in doctor-patient communication. Patients’ response
to medical advice. N Engl J Med 280:535-40.
Farmer, E. M., et al. 2003. Pathways into and through mental health services for
children and adolescents. Psychiatr Serv 54:60-6.
Federal Interagency Forum on Child and Family Statistics. 2003. America’s children: Key national indicators of well-being 2003. Washington, D.C.: U.S.
Government Printing Office.
Freed, G. L., et al. 1999. Influences on the receipt of well-child visits in the first
two years of life. Pediatrics 103:864-9.
— 2004. Which physicians are providing health care to America’s children?
Trends and changes during the past 20 years. Arch Pediatr Adolesc Med
158:22-6.
Ferlie, E. B. and S. M. Shortell. 2001. Improving the quality of health care in the
United Kingdom and the United States: A framework for change. Milbank Q
79:281-315.
Furth, S. L., et al. 2000. Racial differences in access to the kidney transplant
waiting list for children and adolescents with end-stage renal disease.
Pediatrics 106:756-61.
Ferris, T. G., et al. 2001. A report card on quality improvement for children’s
health care. Pediatrics 107:143-55.
Gadomski, A., et al. 1998. Impact of a Medicaid primary care provider and preventive care on pediatric hospitalization. Pediatrics 101:E1.
Finkelstein, J. A., et al. 2001. Reducing antibiotic use in children. A randomized
trial in 12 practices. Pediatrics 108:1-7.
Gall, G., et al. 2000. Utility of psychosocial screening at a school-based health
center. J Sch Health 70:292-8.
Fiscella, K., et al. 2000. Inequality in quality: Addressing socioeconomic, racial,
and ethnic disparities in health care. JAMA 283:2579-84.
GAO (General Accounting Office). 1999. Lead poisoning: Federal health care programs are not effectively reaching at-risk children. Washington, D.C.: U.S.
General Accounting Office.
— 2000. Factors contributing to low use of dental services by low-income populations.
Washington, D.C.: U.S. General Accounting Office.
Fleming, M., et al. 2001. Lessons learned: National development to local implementation of Guidelines for Adolescent Preventive Services. Chicago: American
Medical Association.
Flores, G. and L. R. Vega. 1998. Barriers to health care access for Latino children.
Fam Med 30:196-205.
Flores, G., et al. 1998. Access barriers to health care for Latino children. Arch
Pediatr Adolesc Med 152:1119-25.
— 1999. The impact of ethnicity, family income, and parental education on children’s health and use of health services. Am J Public Health 89:1066-71.
— 2000. Pediatricians’ attitudes, beliefs, and practices regarding clinical practice
guidelines: A national survey. Pediatrics 105:496-501.
Gardner, W., et al. 2003. Primary care clinicians’ use of standardized tools to
assess child psychosocial problems. Ambul Pediatr 3:191-5.
Garwick, A. W., et al. 1998. Families’ recommendations for improving services for
children with chronic conditions. Arch Pediatr Adolesc Med 152:440-8.
Gaston, M. H., et al. 1986. Prophylaxis with oral penicillin in children with sickle
cell anemia. A randomized trial. N Engl J Med 314:1593-9.
Gaub, M. and C. L. Carlson. 1997. Gender differences in ADHD: A meta-analysis
and critical review. J Am Acad Child Adolesc Psychiatry 36:1036-45.
Leatherman and McCarthy, Quality of Health Care for Children and Adolescents: A Chartbook, 2004. The Commonwealth Fund
123
ChildChartbook-Back-D3f.qxd
2/23/04 2:17 PM
Page 124
Leatherman and McCarthy, Quality of Health Care for Children and Adolescents: A Chartbook, 2004. The Commonwealth Fund
Gehshan, S., et al. 2001. Increasing dentist’s participation in Medicaid and SCHIP.
Denver: National Conference of State Legislatures, Forum for State Health
Policy Leadership.
Gerteis, M., et al., Eds. 1993. Through the patient’s eyes: Understanding and promoting
patient-centered care. San Francisco: Jossey-Bass Publishers.
Gidwani, P., et al. 2003. Laying the foundation: Identifying major issues in
applied child health services research. Child Health Services Research:
Applications, Innovations, and Insights. Edited by E. J. Sobo and P. S. Kurtin. San
Francisco: Jossey-Bass, 25-63.
Gilbody, S., et al. 2003. Educational and organizational interventions to improve
the management of depression in primary care: A systematic review. JAMA
289:3145-51.
Gillespie, J. and R. L. Mollica. 2003. Coordinating care for the chronically ill: How
do we get there from here? Baltimore: Johns Hopkins University, Partnership
for Solutions.
Grey, M., et al. 1999. Coping skills training for youths with diabetes on intensive
therapy. Appl Nurs Res 12:3-12.
— 2000. Coping skills training for youth with diabetes mellitus has long-lasting
effects on metabolic control and quality of life. J Pediatr 137:107-13.
Grohskopf, L. A., et al. 2002. A national point-prevalence survey of pediatric intensive care unit-acquired infections in the United States. J Pediatr 140:432-8.
Gross, D. A., et al. 1998. Patient satisfaction with time spent with their physician.
J Fam Pract 47:133-7.
Guadagnoli, E., et al. 2000. Providing consumers with information about the
quality of health plans: The Consumer Assessment of Health Plans demonstration in Washington State. Jt Comm J Qual Improv 26:410-20.
Guevara, J. P., et al. 2003. Effects of educational interventions for self-management of asthma in children and adolescents: Systematic review and metaanalysis. BMJ 326:1308-9.
Gindler, J. S., et al. 1992. Epidemiology of measles in the United States in 1989
and 1990. Pediatr Infect Dis J 11:841-6.
Hadley, J. 2003. Sicker and poorer—the consequences of being uninsured: A
review of the research on the relationship between health insurance, medical
care use, health, work, and income. Med Care Res Rev 60:3S-76S.
Glascoe, F. P., et al. 1998. Brief approaches to educating patients and parents in
primary care. Pediatrics 101:E10.
Haggerty, R. J. 1995. Child health 2000: New pediatrics in the changing environment of children’s needs in the 21st century. Pediatrics 96:804-12.
Goldman, D. and R. Kaushal. 2002. Time to tackle the tough issues in patient
safety. Pediatrics 110:823-6.
Hakim, R. B. and B. V. Bye. 2001. Effectiveness of compliance with pediatric preventive care guidelines among Medicaid beneficiaries. Pediatrics 108:90-7.
Gonzales, R., et al. 2001. Impact of reducing antibiotic prescribing for acute bronchitis on patient satisfaction. Eff Clin Pract 4:105-11.
Hakim, R. B. and D. S. Ronsaville. 2002. Effect of compliance with health supervision guidelines among U.S. infants on emergency department visits. Arch
Pediatr Adolesc Med 156:1015-20.
Goodman, D. C., et al. 2002. The relation between the availability of neonatal
intensive care and neonatal mortality. N Engl J Med 346:1538-44.
Goodwin, M. A., et al. 2001. A clinical trial of tailored office systems for preventive service delivery. The Study to Enhance Prevention by Understanding
Practice (STEP-UP). Am J Prev Med 21:20-8.
Grason, H. and M. Morreale. 1997. The role of the individual child health care
practitioner. Health care for children: What’s right, what’s wrong, what’s next.
Edited by R. E. Stein. New York: United Hospital Fund, 107-134.
Greco, P. J. and J. M. Eisenberg. 1993. Changing physicians’ practices. N Engl J
Med 329:1271-3.
Green, M. and J. S. Palfrey, Eds. 2002. Bright futures: Guidelines for health supervision of infants, children, and adolescents. Arlington, Va.: National Center for
Education in Maternal and Child Health.
Halfon, N. and M. Hochstein. 1997. Developing a system of care for all: What the
needs of vulnerable children tell us. Health care for children: What’s right,
what’s wrong, what’s next. Edited by R. E. Stein. New York: United Hospital
Fund, 303-338.
Halfon, N., et al. 1998. Community health monitoring: Taking the pulse of
America’s children. Matern Child Health J 2:95-109.
— 2001. Health reform for children and families. Changing the U.S. health
care system. Edited by R. M. Andersen et al. San Francisco, Calif.: JosseyBass, 261-290.
— 2002. Summary statistics from the National Survey of Early Childhood
Health, 2000. National Center for Health Statistics. Vital Health Stat 15(4).
— 2003. Building a bridge from birth to school: Improving developmental and behavioral health services for young children. New York: The Commonwealth Fund.
Hamm, R., et al. 1996. Antibiotics and respiratory infections: Are patients more
satisfied when expectations are met? J Fam Pract 43:56-62.
124
ChildChartbook-Back-D3f.qxd
2/23/04 2:17 PM
Page 125
Hammermeister, K. E., et al. 1995. Why it is important to demonstrate linkages
between outcomes of care and processes and structures of care. Med Care
33:OS5-16.
Hargraves, J. L. and J. Hadley. 2003. The contribution of insurance coverage and
community resources to reducing racial/ethnic disparities in access to care.
Health Serv Res 38:809-29.
Harris, J. A. 1997. Pediatric nosocomial infections: Children are not little adults.
Infect Control Hosp Epidemiol 18:739-42.
Healthy Steps. 2003. Frequently asked questions about Healthy Steps. New York: The
Commonwealth Fund. www.healthysteps.org, accessed Oct., 2003.
Hibbard, J. H., et al. 2003. Does publicizing hospital performance stimulate
quality improvement efforts? Health Aff (Millwood) 22(2):84-94.
Hickson, G. B., et al. 1988. First step in obtaining child health care: Selecting a
physician. Pediatrics 81:333-8.
High, P. C., et al. 2000. Literacy promotion in primary care pediatrics: Can we
make a difference? Pediatrics 105:927-34.
— 1998. America’s children: Health insurance and access to care. Edited by M.
Edmunds and M. J. Coye. Washington, D.C.: National Academy Press.
— 1999. To err is human: Building a safer health system. Edited by L. T. Kohn et al.
Washington, D.C.: National Academy Press.
— 2001a. Crossing the quality chasm: A new health system for the 21st century.
Edited by J. M. Corrigan et al. Washington, D.C.: National Academy Press.
— 2001b. Envisioning the national health care quality report. Edited by M. P.
Hurtado et al. Washington, D.C.: National Academy Press.
— 2002. When children die: Improving palliative and end-of-life care for children and
their families. Edited by M. J. Field and R. E. Behrman. Washington, D.C.:
National Academy Press.
— 2003a. Financing vaccines in the 21st century: Assuring access and availability.
Edited by M. P. Hurtado et al. Washington, D.C.: National Academy Press.
— 2003b. Health professions education: A bridge to quality. Edited by A. C. Greiner
and E. Knebel. Washington, D.C.: National Academy Press.
— 2003c. Priority areas for national action. Edited by K. Adams and J. M. Corrigan.
Washington, D.C.: National Academy Press.
Holahan, J., et al. 2003. Which children are still uninsured and why. Future Child
13:55-79.
Jameson, E. J. and E. Wehr. 1993. Drafting national health care reform legislation to protect the health interests of children. Stanford Law & Policy Review
5:152-76.
Holl, J. L., et al. 2000. Evaluation of New York State’s Child Health Plus: Access,
utilization, quality of health care, and health status. Pediatrics 105:711-8.
Johnson, C., et al. 2003. Factors influencing outcomes in cystic fibrosis: A centerbased analysis. Chest 123:20-7.
Homer, C. J., et al. 1999. The Consumer Assessment of Health Plan Study
(CAHPS) survey of children’s health care. Jt Comm J Qual Improv 25:369-77.
Kahn, R. S., et al. 1999. The scope of unmet maternal health needs in pediatric
settings. Pediatrics 103:576-81.
Horbar, J. D., et al. 2001. Collaborative quality improvement for neonatal intensive care. NIC/Q Project Investigators of the Vermont Oxford Network.
Pediatrics 107:14-22.
Kaplan, S. H., et al. 2001. Methodologic issues in the conduct and interpretation
of pediatric effectiveness research. Ambul Pediatr 1:63-70.
Hostetler, M. A., et al. 2002. Parenteral analgesic and sedative use among ED
patients in the United States: Combined results from the National Hospital
Ambulatory Medical Care Survey (NHAMCS) 1992-1997. Am J Emerg Med
20:139-43.
Kasteler, J., et al. 1976. Issues underlying prevalence of “doctor-shopping” behavior. J Health Soc Behav 17:329-39.
Kataoka, S. H., et al. 2002. Unmet need for mental health care among U.S.
children: Variation by ethnicity and insurance status. Am J Psychiatry
159:1548-55.
Howell, E. M. 2001. The impact of the Medicaid expansions for pregnant women:
A synthesis of the evidence. Med Care Res Rev 58:3-30.
Kaushal, R., et al. 2001. Medication errors and adverse drug events in pediatric
inpatients. JAMA 285:2114-20.
HRET (Hospital Research and Educational Trust). 2003. Pathways for medication
safety. Chicago: American Hospital Association, Hospital Research and
Educational Trust, and the Institute for Safe Medication Practices.
IOM (Institute of Medicine). 1990. Medicare: A strategy for quality assurance. Vol. I.
Edited by K. T. Lohr. Washington, D.C.: National Academy Press.
— 1997. The hidden epidemic: Confronting sexually transmitted diseases.
Washington, D.C.: National Academy Press.
Kelly, C. S., et al. 2000. Outcomes evaluation of a comprehensive intervention
program for asthmatic children enrolled in Medicaid. Pediatrics 105:1029-35.
Kemper, K. J. 1988. Medically inappropriate hospital use in a pediatric population. N Engl J Med 318:1033-7.
KFF (Kaiser Family Foundation). 2003. Public opinion on medical errors.
Washington, D.C.: Kaiser HealthPoll Report.
Leatherman and McCarthy, Quality of Health Care for Children and Adolescents: A Chartbook, 2004. The Commonwealth Fund
125
ChildChartbook-Back-D3f.qxd
2/23/04 2:17 PM
Page 126
Leatherman and McCarthy, Quality of Health Care for Children and Adolescents: A Chartbook, 2004. The Commonwealth Fund
Kilo, C. M. 1999. Improving care through collaboration. Pediatrics 103:384-93.
Klein, J. D., et al. 1999. Access to medical care for adolescents: Results from the
1997 Commonwealth Fund Survey of the Health of Adolescent Girls. J
Adolesc Health 25:120-30.
— 2001. Improving adolescent preventive care in community health centers.
Pediatrics 107:318-27.
Klein, J. D. and M. M. Auerbach. 2002. Improving adolescent health outcomes.
Minerva Pediatrica 54:25-39.
Klein, J. D. and K. M. Wilson. 2002. Delivering quality care: Adolescents’ discussion of health risks with their providers. J Adolesc Health 30:190-5.
Kleinman, L. C., et al. 1994. The medical appropriateness of tympanostomy tubes
proposed for children younger than 16 years in the United States. JAMA
271:1250-5.
Klevens, R. M. and E. T. Luman. 2001. U.S. children living in and near poverty:
Risk of vaccine-preventable diseases. Am J Prev Med 20:41-6.
Kogan, M. D., et al. 1994. Relation of the content of prenatal care to the risk of
low birth weight. Maternal reports of health behavior advice and initial prenatal care procedures. JAMA 271:1340-5.
— 1998. The association between adequacy of prenatal care utilization and subsequent pediatric care utilization in the United States. Pediatrics 102:25-30.
Lave, J. R., et al. 1998. Impact of a children’s health insurance program on newly
enrolled children. JAMA 279:1820-5.
Law, J., et al. 2003. Speech and language therapy interventions for children with
primary speech and language delay or disorder. Cochrane Database Syst Rev
CD004110.
Lazarus, R. S. and S. Fokman. 1984. Coping and adaptation. The handbook of
behavioral medicine. Edited by W. D. Gentry. New York: Guilford, 282-325.
Leatherman, S., et al. 2003. The business case for quality: Case studies and an
analysis. Health Aff (Millwood) 22(2):17-30.
Lee, G. M., et al. 2003. Misconceptions about colds and predictors of health
service utilization. Pediatrics 111:231-6.
Leickly, F. E., et al. 1998. Self-reported adherence, management behavior, and barriers to care after an emergency department visit by inner city children with
asthma. Pediatrics 101:E8.
Levine, G. 2001. Pediatric prevention network works to reduce hospital infections.
Children’s Hospitals Today: Winter.
Lewin, S. A., et al. 2001. Interventions for providers to promote a patient-centred
approach in clinical consultations. Cochrane Database Syst Rev CD003267.
Lewis, R. 1995. The rise of antibiotic-resistant infections. FDA Consumer Magazine.
Korsch, B. M., et al. 1968. Gaps in doctor-patient communication. 1. Doctorpatient interaction and patient satisfaction. Pediatrics 42:855-71.
Lewit, E. M., et al. 2003. Health insurance for children: Analysis and recommendations. Future Child 13:5-29.
Krauss, M., et al. 2001. Navigating systems of care: Results from a national survey
of families of children with special health care needs. Children’s Services
4:165-87.
Lieu, T. A., et al. 2002. Racial/ethnic variation in asthma status and management
practices among children in managed Medicaid. Pediatrics 109:857-65.
Krauss, N. A. 2003. Statistical brief #13. Asthma treatment: Use of Medications and
Devices, 2000. Rockville, Md.: Agency for Healthcare Research and Quality.
Kreger, B. E. and J. D. Restuccia. 1989. Assessing the need to hospitalize children:
Pediatric appropriateness evaluation protocol. Pediatrics 84:242-7.
La Vecchia, C., et al. 1998. Trends in childhood cancer mortality as indicators of
the quality of medical care in the developed world. Cancer 83:2223-7.
Landgraf, J. M., et al. 1999. The CHQ: A user’s manual. Boston: HealthAct.
LaPorte, R. E., et al. 1995. Prevalence and incidence of insulin-dependent diabetes. Diabetes in America. Edited by National Diabetes Data Group. Bethesda,
Md.: National Institutes of Health, National Institute of Diabetes and
Digestive and Kidney Diseases, 37-46.
Liptak, G. S., et al. 1998. Effects of providing comprehensive ambulatory services
to children with chronic conditions. Arch Pediatr Adolesc Med 152:1003-8.
Lozano, P., et al. 2003. Asthma medication use and disease burden in children in
a primary care setting. Arch Pediatr Adolesc Med 157:81-8.
Lu, M. C. and N. Halfon. 2003. Racial and ethnic disparities in birth outcomes: A
life-course perspective. Matern Child Health J 7:13-30.
Lustig, J. L., et al. 2001. Improving the delivery of adolescent clinical preventive
services through skills-based training. Pediatrics 107:1100-7.
Ma, J. and R. S. Stafford. 2003. U.S. physician adherence to standards in asthma
pharmacotherapy varies by patient and physician characteristics. J Allergy Clin
Immunol 112:633-5.
Mangione-Smith, R. and E. A. McGlynn. 1998. Assessing the quality of healthcare
provided to children. Health Serv Res 33:1059-90.
126
ChildChartbook-Back-D3f.qxd
2/23/04 2:17 PM
Page 127
Mangione-Smith, R., et al. 1999. The relationship between perceived parental
expectations and pediatrician antimicrobial prescribing behavior. Pediatrics
103:711-8.
— 2000. Screening for chlamydia in adolescents and young women. Arch Pediatr
Adolesc Med 154:1108-13.
— 2003. Deciding not to measure performance: The case of acute otitis media. Jt
Comm J Qual Saf 29:27-36.
Mendelsohn, A. L., et al. 2001. The impact of a clinic-based literacy intervention on
language development in inner-city preschool children. Pediatrics 107:130-4.
Manlove, J., et al. 2002. Preventing teenage pregnancy, childbearing, and sexually
transmitted disease: What the research shows. Washington, D.C.: Child Trends.
Minkovitz, C., et al. 1998. Have professional recommendations and consumer
demand altered pediatric practice regarding child development? J Urban
Health 75:739-50.
— 2001. Early effects of The Healthy Steps for Young Children Program. Arch
Pediatr Adolesc Med 155:470-9.
Marshall, B. 2003. Quality improvement is priority one. Homeline (February).
Bethesda, Md.: Cystic Fibrosis Services, Inc.
Martin, J. A., et al. 2002. Births: Final data for 2001. Natl Vital Stat Rep 51:1-102.
Miller, M. R., et al. 2003. Patient safety events during pediatric hospitalizations.
Pediatrics 111:1358-66.
Mills, R. J. and S. Bhandari. 2003. Health Insurance Coverage in the United States:
2002. Washington, D.C.: U.S. Census Bureau.
McCaig, L. F. and J. M. Hughes. 1995. Trends in antimicrobial drug prescribing
among office-based physicians in the United States. JAMA 273:214-9.
Minkovitz, C. S., et al. 2003. A practice-based intervention to enhance quality of
care in the first 3 years of life: The Healthy Steps for Young Children Program.
JAMA 290:3081-91.
McCaig, L. F., et al. 2002. Trends in antimicrobial prescribing rates for children
and adolescents. JAMA 287:3096-102.
Mofidi, M., et al. 2002. The impact of a state children’s health insurance program
on access to dental care. J Am Dent Assoc 133:707-14.
McCormick, M. C. and J. E. Siegel. 2001. Recent evidence on the effectiveness of
prenatal care. Ambul Pediatr 1:321-5.
NAEPP (National Asthma Education and Prevention Program). 1997. Expert panel
report II: Guidelines for the diagnosis and management of asthma. Bethesda, Md.:
National Institutes of Health, National Heart, Lung and Blood Institute.
— 2002. Guidelines for the diagnosis and management of asthma. Update on selected
topics, 2002. Bethesda, Md.: National Institutes of Health, National Heart,
Lung and Blood Institute.
McGlynn, E. A., et al., Eds. 2000. Quality of care for children and adolescents: A
review of selected clinical conditions and quality indicators. Santa Monica, Calif.:
RAND.
McGlynn, E. A., et al. 2001. Designing a comprehensive national report on effectiveness of care: Measurement, data collection, and reporting strategies.
Envisioning the national health care quality report. Edited by M. P. Hurtado et al.
Washington, D.C.: National Academy Press.
MCHB (Maternal and Child Health Bureau). 2003. Achieving and measuring
success: A national agenda for children with special health care needs. Rockville,
Md.: Health Resources and Services Administration.
McInerny, T. K., et al. 2003. Incorporating quality improvement into pediatric
practice management. Pediatrics 112:1163-5.
McPherson, M., et al. 1998. A new definition of children with special health care
needs. Pediatrics 102:137-40.
— 2004. Implementing community-based systems of services for children and
youth with special health care needs: How well are we doing? Pediatrics. In
press.
Mendelsohn, A. L. 2002. Promoting language and literacy through reading aloud:
The role of the pediatrician. Curr Probl Pediatr Adolesc Health Care 32:188-202.
NCHS (National Center for Health Statistics). 2001. Healthy People 2000 Final
Review. Hyattsville, Md.: U.S. Department of Health and Human Services.
NCID (National Center for Infectious Diseases). 2001. National Nosocomial
Infections Surveillance (NNIS) system report, data summary from January
1992-June 2001, issued August 2001. Am J Infect Control 29: 404-21.
— 2003. National Nosocomial Infections Surveillance (NNIS) system report,
data summary from January 1992 through June 2003, issued August 2003.
Am J Infect Control 31:481-98.
NCMHI (National Center of Medical Home Initiatives for Children with Special
Needs). 2003. Every child deserves a medical home: Training program. Elk Grove,
Ill.: American Academy of Pediatrics.
NCQA (National Committee for Quality Assurance). 2003a. The state of
health care quality: 2003. Washington, D.C.: National Committee for
Quality Assurance.
— 2003b. HEDIS 2004. Health plan employer data and information set. Volume
2, technical specifications. Washington, D.C.: National Committee for
Quality Assurance.
Leatherman and McCarthy, Quality of Health Care for Children and Adolescents: A Chartbook, 2004. The Commonwealth Fund
127
ChildChartbook-Back-D3f.qxd
2/23/04 2:17 PM
Page 128
Leatherman and McCarthy, Quality of Health Care for Children and Adolescents: A Chartbook, 2004. The Commonwealth Fund
NDEP (National Diabetes Education Program). 2003. Making systems changes for
better diabetes care. Bethesda, Md.: National Institutes of Health.
Newacheck, P. W., et al. 1996. Children’s access to primary care: Differences by
race, income, and insurance status. Pediatrics 97:26-32.
— 1998. An epidemiologic profile of children with special health care needs.
Pediatrics 102:117-23.
— 2000a. The unmet health needs of America’s children. Pediatrics 105:989-97.
— 2000b. Access to health care for children with special health care needs.
Pediatrics 105:760-6.
— 2003. Building community-based systems of care for children with special health
care needs: A national perspective. San Francisco: University of California.
NHLBI (National Heart Lung and Blood Institute). 2002. The management of sickle
cell disease. Bethesda, Md.: National Institutes of Health.
Olson, A. L., et al. 2001. Primary care pediatricians’ roles and perceived responsibilities in the identification and management of depression in children and
adolescents. Ambul Pediatr 1:91-8.
Orenstein, W. A., et al. 1990. Barriers to vaccinating preschool children. J Health
Care Poor Underserved 1:315-30.
Palfrey, J. S., et al. 1980. Use of primary care facilities by patients attending specialty clinics. Pediatrics 65:567-72.
Palmer, R. H. and M. R. Miller. 2001. Methodologic challenges in developing and
implementing measures of quality for child health care. Ambul Pediatr 1:39-52.
Park, M. J., et al. 2001. Investing in clinical preventive health services for adolescents.
San Francisco: University of California, San Francisco, Policy Information
and Analysis Center for Middle Childhood and Adolescence.
NICHQ (National Initiative for Children’s Healthcare Quality). 2003a. Caring for
children with ADHD: A resource toolkit for clinicians. Boston: National Initiative
for Children’s Healthcare Quality.
— 2003b. Learning collaborative: Improving care for children with cystic fibrosis.
Boston: National Initiative for Children’s Healthcare Quality.
Parker, J. D. and K. C. Schoendorf. 2000. Variation in hospital discharges for
ambulatory care-sensitive conditions among children. Pediatrics 106:942-8.
NIDCR (National Institute of Dental and Craniofacial Research). 2000. Oral
health in America: A report of the Surgeon General. Rockville, Md.: U.S.
Department of Health and Human Services.
Pernice, C., et al. 2001. Charting SCHIP: Report of the second national survey of the
State Children’s Health Insurance Program. Portland, Maine: National Academy
for State Health Policy.
NIMH (National Institute of Mental Health). 1999. Mental health: A report of the
Surgeon General. Rockville, Md.: U.S. Department of Health and Human
Services.
Perz, J. F., et al. 2002. Changes in antibiotic prescribing for children after a community-wide campaign. JAMA 287:3103-9.
NRC (National Research Council). 1993. Measuring lead exposure in infants, children,
and other sensitive populations. Washington, D.C.: National Academy Press.
— 2000. From neurons to neighborhoods: The science of early childhood development.
Washington, D.C.: National Academy Press.
Nsuami, M. and D. A. Cohen. 2000. Participation in a school-based sexually
transmitted disease screening program. Sex Transm Dis 27:473-9.
NVAC (National Vaccine Advisory Committee). 1991. The measles epidemic. The
problems, barriers, and recommendations. JAMA 266:1547-52.
— 1999. Strategies to sustain success in childhood immunizations. JAMA
282:363-70.
OECD (Organisation for Economic Co-operation and Development). 2003.
Health at a glance. OECD indicators 2003. Paris: Organisation for Economic
Co-operation and Development.
O’Keefe, M. 2001. Should parents assess the interpersonal skills of doctors who
treat their children? A literature review. J Paediatr Child Health 37:531-8.
Payne, S. M., et al. 1995. Variations in pediatric pneumonia and
bronchitis/asthma admission rates. Is appropriateness a factor? Arch Pediatr
Adolesc Med 149:162-9.
Petersen, R., et al. 2001. Preventive counseling during prenatal care: Pregnancy
Risk Assessment Monitoring System. Am J Prev Med 20:245-50.
Pichichero, M. E. 2002. Dynamics of antibiotic prescribing for children. JAMA
287:3133-5.
Politzer, R. M., et al. 2001. Inequality in America: The contribution of health
centers in reducing and eliminating disparities in access to care. Med Care Res
Rev 58:234-48.
Post, D. M., et al. 2002. The other half of the whole: Teaching patients to communicate with physicians. Fam Med 34:344-52.
President’s Advisory Commission on Consumer Protection and Quality in the
Health Care Industry. 1997. Consumer bill of rights and responsibilities: Report to
the President. Washington, D.C.: U.S. Government Printing Office.
Proctor, B. D. and J. Dalaker. 2003. Poverty in the United States: 2002. Current
Population Reports, P60-222. Washington, D.C.: U.S. Census Bureau.
Ramsey, P. G., et al. 1993. Use of peer ratings to evaluate physician performance.
JAMA 269:1655-60.
128
ChildChartbook-Back-D3f.qxd
2/23/04 2:17 PM
Page 129
Reach Out and Read. 2003. Research summary. Somerville, Mass.: Reach Out and
Read. www.reachoutandread.org/about_summary.html, accessed May, 2003.
Santelli, J. S., et al. 1999. Sexually transmitted diseases, unintended pregnancy,
and adolescent health promotion. Adolesc Med 10:87-108.
Reason, J. T. 1990. Human error. Cambridge, Mass.: Cambridge University Press.
Sartor, C., et al. 1995. Evolution of hospital participation in the National
Nosocomial Infections Surveillance System, 1986 to 1993. Am J Infect Control
23:364-8.
Regalado, M. and N. Halfon. 2001. Primary care services promoting optimal child
development from birth to age 3 years: Review of the literature. Arch Pediatr
Adolesc Med 155:1311-22.
— 2002. Primary care services: Promoting optimal child development from birth to
three years. New York: The Commonwealth Fund.
Rhode Island Department of Health (DOH). 2003. Public and professional health
education, health promotion, and outreach plan. Providence, R.I.: Childhood
Lead Poisoning Prevention Program.
Richards, C., et al. 2001. Characteristics of hospitals and infection control professionals participating in the National Nosocomial Infections Surveillance
System. Am J Infect Control 29:400-3.
Richardson, L. P., et al. 2003. Depression in Medicaid-covered youth: Differences
by race and ethnicity. Arch Pediatr Adolesc Med 157:984-9.
Ries, L., et al. 2003. SEER cancer statistics review, 1975-2000. Bethesda, Md.:
National Cancer Institute.
Rogowski, J. A., et al. 2001. Economic implications of neonatal intensive care unit
collaborative quality improvement. Pediatrics 107:23-9.
Romano, P. S., et al. 2003. A national profile of patient safety in U.S. hospitals.
Health Affairs 22:154-66.
Ronsaville, D. S. and R. B. Hakim. 2000. Well child care in the United States: Racial
differences in compliance with guidelines. Am J Public Health 90:1436-43.
Rosenbach, M. L., et al. 1999. Access for low-income children: Is health insurance
enough? Pediatrics 103:1167-74.
Rosenstein, N., et al. 1998. The common cold—principles of judicious use of
antimicrobial agents. Pediatrics 101:181-4.
Ross, D. C. and I. T. Hill. 2003. Enrolling eligible children and keeping them
enrolled. Future Child 13:81-97.
Rowin, M. E., et al. 2003. Pediatric intensive care unit nosocomial infections:
Epidemiology, sources and solutions. Crit Care Clin 19:473-87.
Schmidt, L. J., et al. 2002. Child/parent-assessed population health outcome measures: A structured review. Child Care Health Dev 28:227-37.
Schor, E. L. 2003. Family pediatrics: Report of the Task Force on the Family.
Pediatrics 111:1541-71.
Schuster, M. A. 2000a. Well child care. Quality of care for children and adolescents: A
review of selected clinical conditions and quality indicators. Edited by E. A.
McGlynn et al. Santa Monica, Calif.: RAND, 391-404.
— 2000b. Developmental screening. Quality of care for children and adolescents: A
review of selected clinical conditions and quality indicators. Edited by E. A.
McGlynn et al. Santa Monica, Calif.: RAND, 157-168.
Schuster, M. A. and E. A. McGlynn. 1999. Measuring the quality of care in pediatrics. Oski’s pediatrics: Principles and practice. Philadelphia: Lippincott
Williams and Wilkins, 29-35.
Schuster, M. A., et al. 1997. Development of a quality of care measurement
system for children and adolescents. Methodological considerations and
comparisons with a system for adult women. Arch Pediatr Adolesc Med
151:1085-92.
— 2000. Anticipatory guidance: What information do parents receive? What
information do they want? Arch Pediatr Adolesc Med 154:1191-8.
Shafer, M. A., et al. 2002. Effect of a clinical practice improvement intervention on
chlamydial screening among adolescent girls. JAMA 288:2846-52.
Sharif, I., et al. 2002. Exposure to Reach Out and Read and vocabulary outcomes
in inner city preschoolers. J Natl Med Assoc 94:171-7.
Shi, L., et al. 2002. Primary care, self-rated health, and reductions in social disparities in health. Health Serv Res 37:529-50.
Shiono, P. H. and R. E. Behrman. 1995. Low birth weight: Analysis and recommendations. Future Child 5:4-18.
Safir, A., et al. 2000. National Survey of America’s Families: Survey methods and data
reliability: 1997 and 1999. Washington, D.C.: The Urban Institute.
Shortell, S. M., et al. 2001. Implementing evidence-based medicine: The role of
market pressures, compensation incentives, and culture in physician organizations. Med Care 39:I62-78.
Sanders-Phillips, K. and S. Davis. 1998. Improving prenatal care services for
low-income African American women and infants. J Health Care Poor
Underserved 9:14-29.
Silow-Carroll, S. 2003. Building quality into Rite Care: How Rhode Island is improving
health care for its low-income populations. New York: The Commonwealth Fund.
Leatherman and McCarthy, Quality of Health Care for Children and Adolescents: A Chartbook, 2004. The Commonwealth Fund
129
ChildChartbook-Back-D3f.qxd
2/23/04 2:17 PM
Page 130
Leatherman and McCarthy, Quality of Health Care for Children and Adolescents: A Chartbook, 2004. The Commonwealth Fund
Silva, T. J., et al. 2000. Practicing comprehensive care: A physician’s operations manual
for implementing a medical home for children with special health care needs.
Boston: Institute for Community Inclusion.
Silver, E. J. and R. E. Stein. 2001. Access to care, unmet health needs, and poverty
status among children with and without chronic conditions. Ambul Pediatr
1(6):314-20.
Stockman, J. A., et al. 2003. The program for maintenance of certification in pediatrics (PMCP). J Pediatr 143:292-5.
Stoll, B. J., et al. 2002. Late-onset sepsis in very low birth weight neonates: The
experience of the NICHD Neonatal Research Network. Pediatrics 110:285-91.
Sturm, R., et al. 2003. Geographic disparities in children’s mental health care.
Pediatrics 112:E308.
Silverstein, M., et al. 2002. An English-language clinic-based literacy program is
effective for a multilingual population. Pediatrics 109:E76.
Szilagyi, P. and L. Rodewald. 1996. Missed opportunities for immunizations: A
review of the evidence. J Public Health Manag Prac 2:18-25.
Simpson, G., et al. 1997. Access to health care. Part 1: Children. Vital Health Stat
10:1-46.
Szilagyi, P. G. and E. L. Schor. 1998. The health of children. Health Serv Res
33:1001-39.
Slifkin, R. T., et al. 2002. Effect of the North Carolina State Children’s Health
Insurance Program on Beneficiary Access to Care. Arch Pediatr Adolesc Med
156:1223-9.
Szilagyi, P. G., et al. 2002. Reducing geographic, racial, and ethnic disparities in
childhood immunization rates by using reminder/recall interventions in
urban primary care practices. Pediatrics 110:E58.
Sox, C. M., et al. 2003. Provision of pneumococcal prophylaxis for publicly
insured children with sickle cell disease. JAMA 290:1057-61.
Tates, K. and L. Meeuwesen. 2001. Doctor-parent-child communication: A
(re)view of the literature. Soc Sci Med 52:839-51.
Stafford, R. S., et al. 2003. National trends in asthma visits and asthma pharmacotherapy, 1978-2002. J Allergy Clin Immunol 111:729-35.
Thompson, J. W., et al. 2003. Quality of care for children in commercial and
Medicaid managed care. JAMA 27:1486-93.
Starfield, B. 1985. Effectiveness of medical care: Validating clinical wisdom. Baltimore,
Md.: Johns Hopkins University Press.
— 1997. Social, economic, and medical care determinants of children’s health.
Health care for children: What’s right, what’s wrong, what’s next. Edited by R. E.
Stein. New York: United Hospital Fund, 39-52.
— 1998. Primary care: Balancing health needs, services, and technology. New York:
Oxford University Press.
— 2000. Evaluating the State Children’s Health Insurance Program: Critical considerations. Annu Rev Public Health 21:569-85.
Thompson, L. A., et al. 2002. Is more neonatal intensive care always better?
Insights from a cross-national comparison of reproductive care. Pediatrics
109:1036-43.
Tidikis, F. and L. Strasen. 1994. Patient-focused care units improve service and
financial outcomes. Healthc Financ Manage 48:38-40, 42, 44.
Starfield, B., et al. 1977. Coordination of care and its relationship to continuity
and medical records. Med Care 15:929-38.
Tierney, C. D., et al. 2003. Adoption of reminder and recall messages for immunizations by pediatricians and public health clinics. Pediatrics 112:1076-82.
— 1995. The adolescent child health and illness profile. A population-based
measure of health. Med Care 33:553-66.
Torkko, K. C., et al. 2000. Testing for chlamydia and sexual history taking in adolescent families: Results from a statewide survey of Colorado primary care
providers. Pediatrics 106:E32.
Starfield, B. and L. Shi. 2002. Policy relevant determinants of health: An international perspective. Health Policy 60:201-18.
Thomson O’Brien, M. A., et al. 2001. Continuing education meetings and workshops: Effects on professional practice and health care outcomes. Cochrane
Database Syst Rev CD003030.
Steinman, M. A., et al. 2003. Changing use of antibiotics in community-based
outpatient practice, 1991-1999. Ann Intern Med 138:525-33.
U.S. Census Bureau. 2003. Language use, English ability, and linguistic isolation by
state. (Census 2000 Summary File 3, PCT13 and PCT14). Washington, D.C.:
U.S. Census Bureau.
Stewart, M. A. 1995. Effective physician-patient communication and health outcomes: A review. CMAJ 152:1423-33.
USP Center for the Advancement of Patient Safety. 2002. Summary of information
submitted to MEDMARX in the year 2001. Rockville, Md.: U.S. Pharmacopeia.
Stivers, T. 2002. Participating in decisions about treatment: Overt parent pressure
for antibiotic medication in pediatric encounters. Soc Sci Med 54:1111-30.
130
ChildChartbook-Back-D3f.qxd
2/23/04 2:17 PM
Page 131
USPSTF (U.S. Preventive Services Task Force). 2002. Screening for depression:
Recommendations and rationale. Ann Intern Med 136: 760-4.
— 2003. Screening for chlamydial infection: Recommendations and rationale.
Am J Prev Med 20(3S):90-4.
van Dyck, P. C. 2003. Children with special health care needs: Findings from the
National Survey of Children with Special Health Care Needs. Rockville, Md.:
Maternal and Child Health Bureau.
van Dyck, P. C., et al. 2002. The National Survey of Children with Special Health
Care Needs. Ambul Pediatr 2:29-37.
VanLandeghem, K., et al. 2002. Reasons and strategies for strengthening childhood development services in the healthcare system. New York: The Commonwealth Fund.
Varni, J. W., et al. 2001. PedsQL 4.0: Reliability and validity of the Pediatric
Quality of Life Inventory version 4.0 generic core scales in healthy and
patient populations. Med Care 39:800-12.
Vintzileos, A. M., et al. 2002. The impact of prenatal care on neonatal deaths in
the presence and absence of antenatal high-risk conditions. Am J Obstet
Gynecol 186:1011-6.
Vivier, P. M., et al. 2001. A statewide assessment of lead screening histories of
preschool children enrolled in a Medicaid managed care program. Pediatrics
108:E29.
Waldrop, R., et al. 1998. Comparison of pediatric hospitalization using the pediatric appropriateness evaluation protocol at three diverse hospitals in
Louisiana. J La State Med Soc 150:211-7.
Weech-Maldonado, R., et al. 2001. Racial and ethnic differences in parents’ assessments of pediatric care in Medicaid managed care. Health Serv Res 36:575-94.
Weiss, K. B., et al. 2000. Trends in the cost of illness for asthma in the United
States, 1985-1994. J Allergy Clin Immunol 106:493-9.
WHO (World Health Organization). 2003. WHO vaccine-preventable disease monitoring system. Geneva: World Health Organization.
Winickoff, J. P., et al. 2003. Intervention with parental smokers in an outpatient
pediatric clinic using counseling and nicotine replacement. Pediatrics
112:1127-33.
Wolf, F., et al. 2003. Educational interventions for asthma in children. Cochrane
Database Syst Rev CD000326.
Wood, D., et al. 1999. Immunization registries in the United States: Implications
for the practice of public health in a changing health care system. Annu Rev
Public Health 20:231-55.
Yawn, B. P., et al. 2002. Are we ready for universal school-based asthma screening?
An outcomes evaluation. Arch Pediatr Adolesc Med 156:1256-62.
Yoos, H. L., et al. 2003. Barriers to anti-inflammatory medication use in childhood asthma. Ambul Pediatr 3:181-90.
Young, K. T., et al. 1998. Listening to parents: A national survey of parents with
young children. Arch Pediatr Adolesc Med 152:255-62.
Yu, S. M., et al. 2002. Factors that influence receipt of recommended preventive
pediatric health and dental care. Pediatrics 110:E73.
Zell, E. R., et al. 2000. National Immunization Survey: The methodology of a vaccination surveillance system. Public Health Rep 115:65-77.
Zhan, C. and M. R. Miller. 2003. Excess length of stay, charges, and mortality
attributable to medical injuries during hospitalization. JAMA 290:1868-74.
Ziring, P. R., et al. 1999. Care coordination: Integrating health and related systems
of care for children with special health care needs. American Academy of
Pediatrics. Committee on Children With Disabilities. Pediatrics 104:978-81.
Wells, C. G. 1985. Preschool literacy-related activities and success in school.
Literacy, language, and learning: The nature and consequences of literacy. Edited
by D. Olson et al. Cambridge, England: Cambridge University Press.
Wells, K. B., et al. 2001. Affective disorders in children and adolescents:
Addressing unmet need in primary care settings. Biol Psychiatry 49: 1111-20.
Wennberg, J. and A. Gittelsohn. 1982. Variations in medical care among small
areas. Sci Am 246:120-34.
Whitney, C. G., et al. 2000. Increasing prevalence of multidrug-resistant
Streptococcus pneumoniae in the United States. N Engl J Med 343:1917-24.
Leatherman and McCarthy, Quality of Health Care for Children and Adolescents: A Chartbook, 2004. The Commonwealth Fund
131
ChildChartbook-Back-D3f.qxd
2/23/04 2:17 PM
Page 132
Leatherman and McCarthy, Quality of Health Care for Children and Adolescents: A Chartbook, 2004. The Commonwealth Fund
About the Authors
Sheila Leatherman is a research professor at the School of Public Health,
The University of North Carolina at Chapel Hill, and a Senior Associate of
The Judge Institute of Management (1996) and Distinguished Associate of
Darwin College at the University of Cambridge, England. She conducts
research and policy analysis in the United States and the United Kingdom,
focusing on quality of care, health systems reform, performance
measurement and improvement, and the economic implications of
implementing quality enhancing interventions in health care delivery.
In the United States, she conducted pioneering methodological
research in quality measurement for managed care populations, resulting in
a program that was awarded a U.S. patent in 1996. She was appointed by
President Clinton in 1997 to the President’s Advisory Commission on
Consumer Protection and Quality in the Health Care Industry, chairing the
sub-committee to develop a national strategy for quality measurement and
reporting. She subsequently served on the Strategic Framework Board of the
National Quality Forum. She is the lead author of a series of chartbooks on
quality of health care in the U.S., commissioned by the Commonwealth
Fund. In the United Kingdom, she was commissioned by The Nuffield Trust
to assess the British Labour Government’s proposed quality reforms for the
National Health Service in 1997–1998 and evaluated the mid-term impact
of the 10 year quality agenda in the NHS, resulting in publication of the
book, Quest for Quality in the NHS, in December 2003.
Professor Leatherman is an elected member of the Institute of
Medicine of the U.S. National Academy of Sciences (2002), where she
serves on the Health Care Advisory Board, and of the National Academy of
Social Insurance (1997). She has a broad background in health care
management in state and federal health agencies, as chief executive of an
HMO, and as senior executive of a large national managed care company
in the U.S. She is a senior advisor to The Nuffield Trust and to The Health
Foundation in the United Kingdom, a member of the RAND Health
Advisory Board, and serves on the board of directors of the international
organization Freedom From Hunger.
Douglas McCarthy is president of Issues Research, Inc., in Durango,
Colorado. He has 20 years of experience in public and private sector
research, policymaking, and management. He has authored or coauthored
reports and articles on a range of topics including health care coverage and
quality, information privacy, technology assessment, corporate
philanthropy, and public performance reporting.
He was previously research director in a health services research center
affiliated with a national health care company, where he researched health
system performance and implemented quality evaluation tools in health
plans nationally. He began his career as an internal consultant for a local
government, where he supported quality improvement through operations
research and information systems development.
He received his bachelor’s degree with honors from Yale College and a
master’s degree in health care management from the University of
Connecticut, where he was the Blue Cross Blue Shield of Connecticut
health care management scholar. During 1996–1997, he was a public
policy fellow at the Humphrey Institute of Public Affairs at the University of
Minnesota. He serves on a local citizens’ health care advisory committee
working to improve the accessibility of rural health care in his community.
132
ChildChartbook-Covers.qxd
4/5/04 5:42 PM
Page 2
The Commonwealth Fund
One East 75th Street
New York, NY 10021-2692
Telephone 2 1 2 . 6 0 6 . 3 8 0 0
Facsimile 2 1 2 . 6 0 6 . 3 5 0 0
Email c m w f @ c m w f. o r g
Web w w w. c m w f. o r g
The Commonwealth Fund is a private foundation established in 1918 by Anna M. Harkness
with the broad charge to enhance the common good. The Fund carries out this mandate by
supporting efforts that help people live healthy and productive lives, and by assisting specific
groups with serious and neglected problems. The Fund supports independent research on
health and social issues and makes grants to improve health care practice and policy.
The Fund’s two national program areas are improving health insurance coverage and access
to care and improving the quality of health care services. The Fund is dedicated to helping
people become more informed about their health care, and improving care for vulnerable
populations such as children, elderly people, low-income families, minority Americans, and
the uninsured. In addition, an international program in health policy is designed to stimulate
innovative policies and practices in the United States and other industrialized countries. In its
own community, New York City, the Fund makes grants to improve health care.


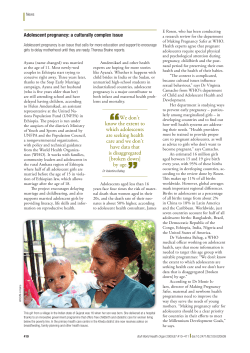

© Copyright 2026