
Fourth National Incidence Study of Child Abuse and Neglect (NIS–4) Executive Summary
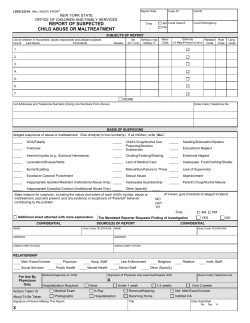
Fourth National Incidence Study
of Child Abuse and Neglect (NIS–4)
Report to Congress
Executive Summary
U.S. DEPARTMENT OF HEALTH AND HUMAN SERVICES
U.S.
Department of Health and Human Services (DHHS)
Substance Abuse and Mental Health Services Administration
Administration
for Children
and Families (ACF)
Center for Mental
Health Services
Office
of Planning, Research, and Evaluation (OPRE)
www.samhsa.gov
and the Children’s Bureau
This document reports the findings from the Fourth National Incidence Study of Child Abuse
and Neglect (NIS–4), which was conducted by Westat, Inc., with the assistance of its
subcontractor Walter R. McDonald and Associates, Inc. (WRMA), under contract number
GS23F81144H, Order No. HHSP233200400058U, Requisition No. 04Y004193 from the
Department of Health and Human Services. The authors were Andrea J. Sedlak, Jane
Mettenburg, Monica Basena, Ian Petta, Karla McPherson, Angela Greene, and Spencer Li.
This document, as well as the NIS–4 technical reports (NIS–4 Data Collection Report and NIS–4
Analysis Report) and reports on six NIS–4 supplementary studies (CPS Structure and Practices
Mail Survey, CPS Screening Policies Study, Sentinel Definitions Survey, Comparison of NIS–4
and NCANDS, Supplementary Analysis of Race Differences in the NIS–4, and Incidence
Projections in the 2009 Recession Economy) will be available at the Office of Planning,
Research, and Evaluation (OPRE) website
http://www.acf.hhs.gov/programs/opre/abuse_neglect/natl_incid/index.html.
The NIS–4 public use data file will be available from the National Data Archive on Child Abuse
and Neglect, www.ndacan.cornell.edu.
Material contained in this publication is in the public domain and may be reproduced, fully or
partially, without permission of the Federal Government. The courtesy of source credit is
requested. The recommended citation follows:
Sedlak, A.J., Mettenburg, J., Basena, M., Petta, I., McPherson, K., Greene, A., and Li, S. (2010).
Fourth National Incidence Study of Child Abuse and Neglect (NIS–4): Report to Congress,
Executive Summary. Washington, DC: U.S. Department of Health and Human Services,
Administration for Children and Families.
Fourth National Incidence Study
of Child Abuse and Neglect (NIS–4)
Report to Congress
Executive Summary
Andrea J. Sedlak
Jane Mettenburg, Monica Basena
Ian Petta, Karla McPherson
Angela Greene, & Spencer Li
U.S. Department of Health and Human Services (DHHS)
Administration for Children and Families (ACF)
Office of Planning, Research, and Evaluation (OPRE) and
the Children’s Bureau
ACKNOWLEDGEMENTS
The National Institute of Child Health and Human Development (NICHD) contributed funding
for the NIS–4 Sentinel Definitions Survey (SDS).
Walter R. McDonald and Associates, Inc. (WRMA) collaborated on several NIS–4 tasks under a
subcontract to Westat, Inc. WRMA provided the 2004 data file from the National Child Abuse
and Neglect Data System (NCANDS) to assist in sample design. Several WRMA staff recruited
a number of the sampled CPS agencies to participate. The questionnaire for the supplementary
study CPS Structure and Practices Mail Survey (SPM) was a modified version of the instrument
WRMA developed for the 2002 Local Agency Survey in the CPS Systems and Reforms project;
they helped the NIS–4 team modify that instrument and had a primary role in analyzing the SPM
data and writing the SPM report. During NIS–4 weighting, WRMA staff constructed a special
NCANDS file and computed the annualization factors. WRMA staff were also key collaborators
on the Comparison of NIS–4 and NCANDS. Finally, they participated in the NIS–4 Consultant
Group meetings, where they provided formative suggestions during the study design and offered
feedback on the implications of the findings.
The NIS–4 Consultant Group members provided their expertise and advice at the outset, on the
study plans, and during the final stage, on the presentation of findings. Participating members
were Mark Applebaum (University of California, San Diego), Steve Christian (Casey Family
Programs), John Eckenrode (Cornell University), Diana English (University of Washington
School of Social Work), Patrick Fagan (Family Research Council), Richard Heyman (State
University of New York at Stony Brook), Brenda Jones-Harden (University of Maryland),
Robert Ortega (University of Michigan), and Fred Wulczyn (Chapin Hall Center for Children,
University of Chicago).
Authors of this report include Westat staff with responsibilities for NIS–4 tasks: Andrea Sedlak
(project director), Jane Mettenburg (team leader for CPS recruitment and evaluative coding and
for the Comparison of NIS–4 and NCANDS), Spencer Li (manager and analyst of the NIS–4
supplementary study, CPS Structure and Practices Mail Survey), Monica Basena (analyst for this
report and a leader on Incidence Projections in the 2009 Recession Economy), Angela Greene
(leader of the NIS–4 supplementary study, CPS Screening Policies Study), Karla McPherson
(analyst for this report, leader of the NIS–4 supplementary study, Sentinel Definitions Survey and
a leader on Supplementary Analysis of Race Differences in the NIS–4), and Ian Petta (analyst).
Other senior Westat staff whose dedication and expertise contributed to the success of this study
include John Brown (systems analyst), Janet Ciarico (unduplication team leader), Frances Gragg
(sentinel recruitment team leader), John Hartge (field director), Elizabeth Quinn (leader of
instrument design), Kristin Madden (lead programmer) and Marianne Winglee (lead statistician).
This study would not have been possible without the support of hundreds of agencies and
individual caseworkers, teachers, police officers, social workers, probation officers, nurses, and
other professionals in the study counties who contributed their enthusiastic support and much of
their time in the effort to accurately assess the incidence, nature, and distribution of child abuse
and neglect in the United States.
EXECUTIVE SUMMARY
This executive summary describes the Fourth National Incidence Study of
Child Abuse and Neglect (NIS–4). It discusses the NIS–4 background and objectives,
reports on the design and methods, and presents the key findings and implications.
1.
Background and Objectives
The National Incidence Study (NIS) is a congressionally mandated, periodic
effort of the United States Department of Health and Human Services. In 1974, Public
Law (P.L.) 93–247 mandated the first NIS (NIS–1), which collected data in 1979 and
1980. The NIS–2 was mandated under P.L. 98–457 (1984) and collected data in 1986.
The NIS–3, mandated by the Child Abuse Prevention, Adoption, and Family Services
Act of 1988 (P.L. 100–294) and the Child Abuse, Domestic Violence, Adoption and
Family Services Act of 1992 (P.L. 102–295), collected data in 1993. The Keeping
Children and Families Safe Act of 2003 (P.L. 108-36) mandated the NIS–4, which
collected data in 2005 and 2006. The principal objectives of the NIS–4 were to provide
updated estimates of the incidence of child abuse and neglect in the United States and
measure changes in incidence from the earlier studies.
2.
Design and Methods
Main study. The NIS serves as the nation’s needs assessment on child abuse
and neglect. It offers a unique perspective on the scope of the problem beyond the
children that child protective service (CPS) agencies investigate. While the NIS includes
children who were investigated by CPS agencies, it also obtains data on other children
who were not reported to CPS or who were screened out by CPS without investigation.
These additional children were recognized as maltreated by community professionals.
Thus, the NIS estimates include both abused and neglected children who are in the
official CPS statistics and those who are not.
The NIS follows a nationally representative design, so the estimates reflect
the numbers of abused and neglected children in the United States who come to the
1
attention of community professionals. The fact that there have been three previous cycles
using comparable methods and definitions means that one can compare NIS–4 estimates
with those from the earlier studies in order to identify changes over time in the incidence
and distribution of abused and neglected children.
The NIS–4 data derive from a nationally representative sample of 122
counties. The 126 CPS agencies serving these counties were key participants, providing
basic demographic data on all the children who were reported and accepted for
investigation during the 3-month study reference period (either September 4 through
December 3, 2005 or February 4 through May 3, 2006). The NIS–4 obtained further
details about the child’s maltreatment and the outcome of the CPS investigation for a
representative sample of these cases.
Like the earlier NIS cycles, the NIS–4 employed a sentinel survey
methodology. In this approach, community professionals who work in certain categories
of agencies and who typically encounter children and families in the course of their job
duties serve as lookouts for victims of child abuse and neglect. In each county, these
professionals, called “sentinels,” represent all staff that have contact with children and
families in police and sheriffs’ departments, public schools, day care centers, hospitals,
voluntary social service agencies, mental health agencies, the county juvenile probation
and public health departments, public housing, and shelters for runaway and homeless
youth and for victims of domestic violence. The participating sentinels in the NIS–4
were 10,791 professionals in 1,094 sentinel agencies. They submitted data forms on any
children they encountered who were maltreated during the study data period. The NIS–4
collected a total of 6,208 completed data forms from sentinels and 10,667 completed
forms on the investigation outcomes and the abuse and neglect involved in cases sampled
at participating CPS agencies.
The NIS uses standard definitions of abuse and neglect, so its estimates of the
numbers of maltreated children and incidence rates have a calibrated, standard meaning
across the various sites (multiple states and agencies), sources (CPS and community
professionals), and NIS cycles. As in previous cycles, children submitted by sentinels
and those described in the CPS sampled cases were evaluated according to standard study
definitions of abuse and neglect, and only children who fit the standards were used in
generating the national estimates.
2
In the NIS classifications, maltreatment encompasses both abuse and neglect.
Abuse includes physical abuse, sexual abuse, and emotional abuse. Neglect includes
physical neglect, emotional neglect, and educational neglect. Each of these categories
comprises more specific forms of abuse or neglect. The standardized NIS definitions
describe the acts and omissions for each specific form. The NIS–4 applied a more
differentiated system for classifying the specific forms of maltreatment than the earlier
NIS cycles used. However, the NIS–4 definitional standards were identical to those used
in the NIS–2 and NIS–3. These standards specify the criteria for deciding whether a
child’s situation “counts” as maltreatment to include in the study estimates. The criteria
specify a number of required features, such as the child’s relationship to the perpetrator
(the abuse or neglect must be within the jurisdiction of CPS, perpetrated or permitted by a
parent or caretaker), the severity of the injury or harm that resulted, and the degree of
evidence for holding the alleged perpetrator(s) responsible for the maltreatment.
The NIS applies two definitional standards in parallel: the Harm Standard
and the Endangerment Standard. The Harm Standard has been in use since the NIS–1. It
is relatively stringent in that it generally requires that an act or omission result in
demonstrable harm in order to be classified as abuse or neglect. It permits exceptions in
only a few specific maltreatment categories, where the nature of the maltreatment itself is
so egregious that one can infer that the child was harmed. The chief advantage of the
Harm Standard is its strong objectivity. Its principal disadvantage is that it is so stringent
that it provides a perspective that is too narrow for many purposes, excluding even many
children whom CPS substantiates or indicates as abused or neglected.
The Endangerment Standard has been in use since the NIS–2. It includes all
children who meet the Harm Standard but adds others as well. The central feature of the
Endangerment Standard is that it counts children who were not yet harmed by abuse or
neglect if a sentinel thought that the maltreatment endangered the children or if a CPS
investigation substantiated or indicated their maltreatment.
In addition, the
Endangerment Standard is slightly more lenient than the Harm Standard in allowing a
broader array of perpetrators, including adult caretakers other than parents in certain
maltreatment categories and teenage caretakers as perpetrators of sexual abuse.
Following procedures that corresponded to those used in earlier NIS cycles,
the NIS–4 study team unduplicated the data (so the study estimates represent each
maltreated child only once), weighted the records (so the sample data could generate
3
national estimates of the number of maltreated children), and annualized the final weights
(to enable the 3-month reference period to provide estimates reflecting a full year).
Supplementary studies. In addition to the main study, the NIS–4 included
several supplementary studies, three of which are used in this report to interpret the main
study findings. Two were surveys of CPS agencies—one on their overall policies,
procedures and practices and the second on their screening standards, to determine how
they would treat referrals concerning the uninvestigated cases that sentinels identified.
The third supplementary study was a survey of sentinels on their backgrounds and
definitions of child abuse and neglect and concerning their standards for reporting
suspected maltreatment to CPS or submitting data on maltreated children to the NIS.
The CPS Structure and Practices Mail Survey (SPM) was modeled after the
Local Agency Survey (LAS) in the 2002 National Study of Child Protective Service and
Reform Efforts. The SPM questionnaire included 4 modules, each focused on a specific
CPS function: Administration, Screening/Intake, Investigation, and Alternative CPS
Response. CPS agencies that participated in the NIS–4 responded to the SPM.
The CPS Screening Policies Study (SPS) involved telephone interviews with
intake/screening supervisors (or their delegates) in participating NIS–4 CPS agencies to
identify the criteria their agency used in deciding whether to investigate a referral. The
SPS coders then applied these screening criteria to the uninvestigated children in the
NIS–4 main study to infer whether CPS agencies would have screened these children in
for an investigation according to their stated policies.
The Sentinel Definitions Survey (SDS) asked sentinels who had participated
in the NIS–4 about their characteristics and backgrounds—including their demographics,
job title and tenure, whether they had received any written information or training on
reporting child abuse and neglect while working at their agency, their agency’s policy on
reporting to CPS, and whether they had made any reports while working at their agency.
The questionnaire also included vignettes that described situations of Harm Standard
abuse and neglect. Follow-up questions asked whether the respondent considered the case
to be maltreatment, would report it to CPS, would submit it to a national study on child
abuse and neglect, or would not respond in any of these ways.
4
3.
The National Incidence of Child Abuse and Neglect
The findings of the Fourth National Incidence Study of Child Abuse and
Neglect (NIS–4) show an overall decrease in the incidence of maltreatment since the
NIS–3, as well as decreases in some specific maltreatment categories and increases in
others.
Incidence of Harm Standard maltreatment. Using the stringent Harm
Standard definition, more than 1.25 million children (an estimated 1,256,600 children)
experienced maltreatment during the NIS–4 study year (2005–2006). This corresponds to
one child in every 58 in the United States. A large percentage (44%, or an estimated total
of 553,300) were abused, while most (61%, or an estimated total of 771,700) were
neglected. The NIS classifies children in every category that applies, so the components
(here and throughout the NIS findings) sum to more than 100%. Most of the abused
children experienced physical abuse (58% of the abused children, an estimated total of
323,000). Slightly less than one-fourth were sexually abused (24%, an estimated
135,300), while slightly more than one-fourth were emotionally abused (27%, an
estimated 148,500). Almost one-half of the neglected children experienced educational
neglect (47% of neglected children, an estimated 360,500 children), more than one-third
were physically neglected (38%, an estimated 295,300 children), and one-fourth were
emotionally neglected (25%, an estimated 193,400 children).
Unlike the dramatic increase in the incidence of Harm Standard maltreatment
that occurred between the NIS–2 and NIS–3, where the rate increased by 56%, the NIS–4
reveals a smaller change since the NIS–3, in the opposite direction. The NIS–4 estimate
of the incidence of overall Harm Standard maltreatment in the 2005–2006 study year
reflects a 19% decrease in the total number of maltreated children since the NIS–3 in
1993. Taking into account the increase in the number of children in the United States
over the interval, this change is equivalent to a 26% decline in the rate of overall Harm
Standard maltreatment per 1,000 children in the population. This decrease is close-tosignificant, meaning the probability that it is due to chance factors is less than 10%. This
decrease returned the incidence of Harm Standard maltreatment to a level that does not
differ from the NIS–2 estimate for 1986.
The number of children who experienced Harm Standard abuse declined
significantly, by 26%, from an estimated 743,200 in the NIS–3 to 553,300 in the NIS–4.
5
This reflects a 32% decrease in the rate of Harm Standard abuse per 1,000 children in the
nation. Moreover, the incidence of all specific categories of abuse decreased: The
incidence of sexual abuse decreased significantly, while the declines in physical abuse
and emotional abuse were both close-to-significant:
•
The estimated number of sexually abused children under the Harm
Standard decreased from 217,700 in 1993 to 135,300 in 2005–2006 (a
38% decrease in the number of sexually abused children and a 44%
decrease in the rate of sexual abuse);
•
The number of children who experienced Harm Standard physical
abuse decreased from an estimated 381,700 at the time of the NIS–3 to
an estimated 323,000 in the NIS–4 (a 15% decrease in number and a
23% decline in the rate);
•
The estimated number of emotionally abused children under the Harm
Standard was 204,500 at the time of the NIS–3, which decreased to
148,500 during the NIS–4 (a 27% decrease in number; a 33% decline in
the rate).
The incidence of Harm Standard neglect showed no statistically reliable
changes since the NIS–3, neither overall nor in any of the specific neglect categories
(physical, emotional, and educational neglect).
Classifying these abused and neglected children according to the level of
injury or harm they suffered from Harm Standard maltreatment revealed only one
change: a significant decrease in the incidence of children for whom injury could be
inferred due to the severe nature of their maltreatment. This group declined from
165,300 children in the NIS–3 to 71,500 in the NIS–4 (a 57% decrease in number; a 60%
decline in the rate in the population).
Incidence of Endangerment Standard maltreatment.
Defining
maltreatment according to the more inclusive Endangerment Standard provides a very
different picture of the incidence and distribution of child abuse and neglect. Nearly 3
million children (an estimated 2,905,800) experienced Endangerment Standard
maltreatment during the NIS–4 2005–2006 study year. This corresponds to one child in
every 25 in the United States. While 29% (an estimated 835,000 children) were abused,
more than three-fourths (77%, an estimated 2,251,600 children) were neglected. Most
abused children (57%, or 476,600 children) were physically abused, more than one-third
6
(36%, or 302,600 children) were emotionally abused, and less than one-fourth (22%, or
180,500 children) were sexually abused. Under the Endangerment Standard definitions,
more than one-half of the neglected children were physically neglected (53%, or
1,192,200 children) and a similar percentage were emotionally neglected (52%, or
1,173,800), whereas 16% (an estimated 360,500) were educationally neglected.
Between 1993 and 2005–2006, the overall incidence of children who
experienced Endangerment Standard maltreatment showed no statistically reliable
change. However, within Endangerment Standard maltreatment, counterbalancing
changes occurred in the incidence of abuse and neglect. Significant decreases in the
incidence of abuse and all specific categories of abuse contrast with a significant increase
in the incidence of emotional neglect:
•
The estimated number of children who experienced Endangerment
Standard abuse decreased from 1,221,800 to 835,000 (a 32% decrease
in number, a 38% decline in the rate);
•
The estimated number of physically abused children decreased from an
estimated 614,100 children to 476,600 (a 22% decrease in number, a
29% decline in the rate);
•
The incidence of children with Endangerment Standard sexual abuse
decreased from 300,200 in 1993 to 180,500 in 2005–2006 (reflecting a
40% decrease in number and a 47% decline in the rate);
•
The incidence of emotionally abused children decreased from 532,200
to 302,600 (a 43% decrease in number, a 48% decline in the rate); and
•
The estimated number of emotionally neglected children more than
doubled in the interval between the studies, rising from 584,100 in 1993
to 1,173,800 in 2005–2006 (a 101% increase in number, an 83%
increase in the rate).
Classifying these children according to the severity of harm they suffered as a
result of their Endangerment Standard maltreatment revealed no significant changes in
the incidence of children with any specific level of injury or harm.
7
4.
Distribution of Child Abuse and Neglect by the Child’s
Characteristics
The child’s sex, age, race, disability status, and school enrollment were all
related to rates of maltreatment.
Child’s sex. Girls were sexually abused much more often than boys, under
both the Harm Standard and the Endangerment Standard. This finding is consistent with
earlier NIS results, so females’ disproportionately greater risk of sexual abuse has been
stable over time. This sex difference in incidence rates of sexual abuse leads to higher
rates of abuse in general among girls. Also, because the definitional guidelines permit
the inference that injury or harm occurred in connection with the more extreme forms of
sexual abuse, girls’ greater risk of sexual abuse also accounts for their higher incidence
rates for inferred injury.
Boys’ rates of Harm Standard physical neglect and of serious harm under
both standards decreased more since the NIS–3 than the corresponding rates for girls.
The incidence of boys who experienced Endangerment Standard emotional neglect
increased less since the NIS–3 than that of girls. Moreover, trends in the incidence of
inferred harm from Endangerment Standard maltreatment moved in opposite directions
for girls and boys—the incidence of girls with inferred harm declined slightly since the
NIS–3, while the incidence of boys with inferred harm rose.
Child’s age. A consistent feature of the age differences in NIS–4 incidence
rates is the lower incidence of maltreatment among the youngest children in the Harm
Standard abuse and neglect rates and in the rates of Endangerment Standard abuse. In
most cases, the 0- to 2-year-olds had significantly lower maltreatment rates than older
children. It is possible that the lower rates at these younger ages reflect some
undercoverage of these age groups. That is, prior to attaining school age, children are
less observable to community professionals.
In contrast, the age differences in Endangerment Standard neglect (overall, as
well as in the specific categories of physical neglect and emotional neglect) revealed a
distinctly different pattern. In these categories, the oldest children (15- to 17-year-olds)
have the lowest rates and 6- to 8-year-olds have the highest rates. This curvilinear age
pattern may reflect the combination of opposing age distributions for different
8
maltreatment outcomes—rates of children with serious and moderate harm from
maltreatment generally increase with increasing age, whereas rates of children who were
endangered, but not demonstrably harmed, by their maltreatment experiences sharply
decrease across the age continuum. Because the endangered children are more prevalent
among those who experienced Endangerment Standard physical and emotional neglect,
this opposing age trend primarily affected the age distribution in these categories, shaping
the curvilinear pattern.
Another recurring theme in connection with age was that of disproportionate
increases since the NIS–3 in the incidence of maltreatment among the youngest children
(ages 0 to 2). This occurred for rates of Harm Standard sexual abuse and, in the
Endangerment Standard, for overall maltreatment, neglect, emotional neglect, and the
endangerment outcome. All of these are categories where the NIS–4 maltreatment rates
for the youngest children are not lower than those for the older children. The changes
since the NIS–3 have essentially flattened the age differences in incidence rates,
evidencing broad vulnerability across the age spectrum. These changes may reflect true
increases in maltreatment of the youngest children or could instead represent
improvement in the NIS coverage of these maltreatment events among 0- to 2-year-olds.
Race/ethnicity. Unlike previous NIS cycles, the NIS–4 found strong and
pervasive race differences in the incidence of maltreatment. In nearly all cases, the rates
of maltreatment for Black children were significantly higher than those for White and
Hispanic children. These differences occurred under both definitional standards in rates
of overall maltreatment, overall abuse, overall neglect, and physical abuse and for
children with serious or moderate harm from their maltreatment. They also occurred in
the incidence of Harm Standard sexual abuse, in the incidence of children who were
inferred to be harmed by Harm Standard maltreatment, and in Endangerment Standard
rates for physical neglect, emotional maltreatment, and children who were endangered
but not demonstrably harmed by their maltreatment.
In part, the emergence of race/ethnicity differences in the NIS–4 may stem
from the greater precision of the NIS–4 estimates. Statistical tests are able to detect more
of the underlying differences when estimates are more precise. However, the recently
identified race/ethnicity differences are also consistent with changes in maltreatment rates
since the NIS–3. While general declines in rates of maltreatment were noted since the
NIS–3, these declines did not occur equally for all races and ethnicities. Rather, under
9
both definitional standards, rates of maltreatment for White children declined more than
the rates for Black and Hispanic children in the incidence of abuse, physical abuse, and
children seriously harmed by maltreatment. For Harm Standard emotional neglect,
maltreatment rates for White children declined while rates for Black and Hispanic
children increased. For Endangerment Standard emotional neglect, rates for White
children increased less than the rates for Black and Hispanic children.
Disability. The NIS–4 is the first NIS cycle to examine the relationship
between the incidence of maltreatment and children’s disability status. Under the Harm
Standard, children with confirmed disabilities had significantly lower rates of physical
abuse and of moderate harm from maltreatment, but they had significantly higher rates of
emotional neglect and of serious injury or harm. Using the Endangerment Standard to
define maltreatment revealed more extensive differences, some similar to the Harm
Standard findings, but also some quite different results. Children with disabilities had a
significantly lower rate of Endangerment Standard abuse overall, consistent with their
lower rate of physical abuse under both standards. Children with disabilities also had
significantly lower rates of Endangerment Standard sexual abuse, neglect, physical
neglect, and emotional neglect; and they were significantly less likely to be moderately
harmed or endangered but not demonstrably harmed by the maltreatment. Similar to the
Harm Standard finding, the children with disabilities were significantly more likely to be
seriously injured or harmed when they experienced maltreatment. The findings on the
incidence of emotional neglect are exactly opposite under the two standards. This
indicates that, although children with confirmed disabilities were less likely to be
emotionally neglected, they more often suffered harm from that maltreatment (in fact,
serious harm) and so were more often countable under the Harm Standard in this
category.
School enrollment. For the first time in the NIS, the NIS–4 gathered
information about children’s enrollment in school. Across both definitional standards,
school-aged children who were not enrolled in school were sexually abused more often
than enrolled children and more often qualified for inferred harm, an outcome frequently
associated with sexual abuse. Enrolled children had significantly higher rates of
moderate harm as a result of maltreatment and they were at marginally higher risk of
educational neglect. This latter finding warrants explanation. On the one hand, simply
knowing that a school-age child is not enrolled in school is not sufficient to classify the
child as educationally neglected in NIS. Data on most nonenrolled children lacked
10
details that would exclude legitimate reasons for their circumstance, such as the child
being seriously ill, suspended, expelled, or recently moved and not yet enrolled at a new
location. On the other hand, since schools regularly track absences of enrolled children,
NIS sentinels are likely to describe these to the study.
Enrolled children had higher rates of Harm Standard physical abuse and of
overall Harm Standard maltreatment. In contrast, nonenrolled school-age children had
higher rates of Endangerment Standard maltreatment, overall and in the categories of
neglect, physical neglect, and emotional neglect. The nonenrolled children were also
more likely to be classified as endangered, but not demonstrably harmed, by their
Endangerment Standard maltreatment.
5.
Distribution of Child Abuse and Neglect by Family
Characteristics
The incidence of child maltreatment varied as a function of several
characteristics of children’s families, including their parents’ employment, family
socioeconomic status, family structure and living arrangement, grandparent caregivers,
family size, and the metropolitan status of the county.
Parents’ employment. Unemployed parents were those described as
unemployed or laid off but looking for work either currently (at the time of maltreatment)
or at any time during the past year. Employed parents were those who had steady full- or
part-time work, with no reported unemployment currently or in the previous year.
Parents who were not in the labor force were not employed or actively looking for work.
These included parents who were retired, disabled, homemakers, receiving Temporary
Assistance for Needy Families (TANF), on maternity leave, in the hospital, or in jail.
Under both definitional standards, the incidence of maltreatment and of all severities of
injury or harm was higher for children with no parent in the labor force and those with an
unemployed parent and lowest for those with employed parents. Compared to children
with employed parents, those with no parent in the labor force had 2 to 3 times the rate of
maltreatment overall, about 2 times the rate of abuse, and 3 or more times the rate of
neglect. Children with unemployed parents had 2 to 3 times higher rates of neglect than
those with employed parents.
11
Socioeconomic status. To contend with missing data on individual items,
the NIS–4 analyses combined three indicators into a general measure of socioeconomic
status: household income, household participation in any poverty program, and parents’
education. Low socioeconomic status households were those in the bottom tier on any
indicator: household income below $15,000 a year, parents’ highest education level less
than high school, or any member of the household a participant in a poverty program,
such as TANF, food stamps, public housing, energy assistance, or subsidized school
meals. Children in low socioeconomic status households had significantly higher rates of
maltreatment in all categories and across both definitional standards. They experienced
some type of maltreatment at more than 5 times the rate of other children; they were more
than 3 times as likely to be abused and about 7 times as likely to be neglected.
Family structure and living arrangement. Family structure reflects the
number of parents in the household and their relationship to the child; living arrangement
reflects their marital or cohabitation status. Considering both factors, the NIS–4
classified children into six categories: living with two married biological parents, living
with other married parents (e.g., step-parent, adoptive parent), living with two unmarried
parents, living with one parent who had an unmarried partner in the household, living
with one parent who had no partner in the household, and living with no parent. The
groups differed in rates of every maltreatment category and across both definitional
standards. Children living with their married biological parents universally had the
lowest rate, whereas those living with a single parent who had a cohabiting partner in the
household had the highest rate in all maltreatment categories. Compared to children
living with married biological parents, those whose single parent had a live-in partner had
more than 8 times the rate of maltreatment overall, over 10 times the rate of abuse, and
nearly 8 times the rate of neglect.
Comparable data were available to assess changes since the NIS–3 in
maltreatment rates for two groups of children: those living with two parents and those
living with one parent. In nearly all categories, the incidence of maltreatment and levels
of harm increased since the NIS–3 for children living with one parent but decreased for
those living with two parents. The largest rate increase for children with one parent was
in Endangerment Standard neglect (58% higher in NIS–4 than in NIS–3), especially the
specific category of emotional neglect (a 194% increase). The largest decrease for
children living with two parents occurred in the rate of Harm Standard sexual abuse,
which declined by 61% from its level at the time of the NIS–3.
12
Grandparents as caregivers. The NIS–4 could identify a grandparent as a
child’s caregiver under three conditions: when the grandparent was the child’s primary
caregiver, when the primary caregiver did not have a spouse or partner and the
grandparent was the secondary caregiver, and when the grandparent was a caregiver and
maltreated the child. Children whose grandparent cared for them had lower rates of
physical abuse compared to those with no identified grandparent caregiver: they had twothirds the rate of Harm Standard physical abuse and less than four-fifths the rate of
Endangerment Standard physical abuse.
Family size. The incidence of maltreatment was related to the number of
dependent children in the family, in Harm Standard categories of overall maltreatment
and all neglect and in Endangerment Standard maltreatment, abuse, neglect, and in
physical and emotional maltreatment, both abuse and neglect. The general pattern was
nonlinear: the incidence rates were highest for children in the largest families (those with
4 or more children), intermediate for “only” children and those in households with 3
children, and lowest for children in families with two children. The largest differences
occurred in the Endangerment Standard maltreatment rates, especially for the neglect
categories, where the incidence rates for children in the largest households were more
than twice the rates for children in households with 2 children.
County metropolitan status. Except for educational neglect, the incidence
of all categories of Endangerment Standard maltreatment was higher in rural counties
than in urban counties and similar patterns also emerged in rates of most categories of
Harm Standard maltreatment. Rural children had a nearly 2 times higher rate of overall
Harm Standard maltreatment and nearly 2 times higher rate of overall Endangerment
Standard maltreatment. Whether this reflects better coverage of maltreated children in
the rural counties or higher rates of actual maltreatment in rural communities is not clear.
Nor is it clear how differential distribution of other factors, such as socioeconomic status
and family size differences, may contribute to these metropolitan status differences.
13
6.
Distribution of Child Abuse and Neglect by Perpetrator
Characteristics
The NIS–4 classified children who experienced Harm Standard maltreatment
according to their perpetrator’s relationship to them. Analyses examined associated
differences in the distributions of the perpetrator’s sex and age, type of maltreatment,
severity of harm to the child, the child’s race, and the extent to which the perpetrators’
problems with alcohol use, drug use, or mental illness played a role in the maltreatment.
Perpetrator’s relationship to the child. The majority of all children
countable under the Harm Standard (81%) were maltreated by their biological parents.
This held true both for the abused children (64% were abused by biological parents) and
for those neglected (92% were neglected by biological parents).
Biological parents were the most closely related perpetrators for 71% of
physically abused children and for 73% of emotionally abused children. The pattern was
distinctly different for sexual abuse. More than two-fifths (42%) of the sexually abused
children were sexually abused by someone other than a parent (whether biological or
nonbiological) or a parent’s partner, whereas just over one-third (36%) were sexually
abused by a biological parent. In addition, severity of harm from physical abuse varied
by the perpetrator’s relationship to the child. A physically abused child was more likely
to sustain a serious injury when the abuser was not a parent.
Perpetrator’s sex. Children were somewhat more likely to be maltreated by
female perpetrators than by males: 68% of the maltreated children were maltreated by a
female, whereas 48% were maltreated by a male. (Some children were maltreated by
both.) Of children maltreated by biological parents, mothers maltreated the majority
(75%) whereas fathers maltreated a sizable minority (43%). In contrast, male
perpetrators were more common for children maltreated by nonbiological parents or
parents’ partners (64%) or by other persons (75%).
The predominant sex of perpetrators of abuse was different from that of
neglect. Female perpetrators were more often responsible for neglect (86% of children
neglected by females versus 38% by males). This finding is congruent with the fact that
mothers (biological or other) tend to be the primary caretakers and are the primary
persons held accountable for any omissions and/or failings in caretaking. In contrast,
14
males more often were abusers (62% of children were abused by males versus 41% by
females). The prevalence of male perpetrators was strongest in the category of sexual
abuse, where 87% of children were abused by a male compared to only 11% by a female.
Among all abused children, those abused by their biological parents were
about equally likely to have been abused by mothers as by fathers (51% and 54%,
respectively), but those abused by nonbiological parents or parents’ partners, or by other,
perpetrators were much more likely to be abused by males (74% or more by males versus
26% or less by females).
Perpetrator’s age. Among all maltreated children, only a small percentage
(11%) was maltreated by a perpetrator in the youngest age bracket (under 26 years of
age). However, younger perpetrators were much more predominant among children who
were maltreated by someone who was not a parent (34%).
Child’s race and relationship to the perpetrator. The NIS–4 explored
whether the children’s race was systematically related to the perpetrator’s relationship to
them, either overall or in specific maltreatment categories. Overall, and across most
maltreatment categories, the racial distribution of maltreated children did not vary with
their perpetrator’s relationship. The exceptions were in overall neglect and in the specific
category of physical neglect, which displayed the same pattern. The majority of children
physically neglected by a biological parent were White (58%), whereas children
neglected by a nonbiological parent or parent’s partner were predominantly Black (53%).
Perpetrator’s alcohol use, drug use, and mental illness. CPS investigators
and NIS–4 sentinels indicated whether they considered these issues to be factors in the
child’s maltreatment. Perpetrator’s alcohol use and drug use were approximately
equivalent factors in Harm Standard maltreatment, each applying to 11% of the countable
children, while mental illness was a factor in the maltreatment of 7% of the children.
Perpetrator’s alcohol use was slightly more often implicated in abuse situations than drug
use (13% versus 10%), largely because alcohol was more frequently involved in physical
abuse and emotional abuse. Alcohol use was most involved in emotional abuse (22% of
the children), while drug use was most involved in emotional neglect (21% of the
children). The perpetrator’s mental illness was most often cited as a factor in emotional
abuse (17% of the children). All three factors were more often involved in maltreatment
when the perpetrator was a biological parent.
15
7.
Sources of Recognition for Maltreated Children
School staff predominated as a source of recognition for maltreated children.
School sentinels recognized 52% of the children who suffered Harm Standard
maltreatment and 39% of the Endangerment Standard total. Other important sources of
abused and neglected children were hospitals (11% and 13%), police and sheriff
departments (12% and 19%), and the general public (6% and 10%). For maltreatment
defined under the Endangerment Standard, day care centers and mental health agencies
also joined the group of agency categories that recognized more than an estimated
100,000 abused and neglected children nationwide.
Since the NIS–3, recognition rates of Harm Standard maltreatment decreased
at three sources. They dropped by 70% at social service agencies (including
runaway/homeless youth and domestic violence shelters), by 36% at schools, and by 41%
among the general public. Recognition rates of Endangerment Standard maltreatment
increased by 86% in police and sheriff departments, by 55% in juvenile probation
departments, and by 81% in professional agencies not represented by NIS sentinels.
Endangerment Standard recognition rates decreased by 53% at social service agencies
(including runaway/homeless youth and domestic violence shelters) and by 33% at
schools. To the extent that these changes represent real changes in the rates at which
agency staff encounter and identify maltreated children, they may reflect changes in the
incidence of maltreatment itself or derive from changes in maltreated children’s contacts
with the agencies. To an unknown degree, these changes could also reflect shifts in
agencies’ standards for submitting data on maltreated children to the NIS.
8.
Child Protective Services (CPS) Investigation of Maltreated
Children
Throughout its history, the NIS has consistently found that child protective
services agencies (CPS) investigate maltreatment of only a minority of the children the
NIS identifies. The NIS–4 again verified that result, finding that CPS investigated the
maltreatment of only 32% of children who experienced Harm Standard maltreatment and
of 43% of those whose maltreatment fit the Endangerment Standard. Moreover, this was
not an artifact of the relatively short (3-month) NIS reference period. The NIS–4
examined an additional full month of CPS data to increase the opportunity for more
16
maltreated children to enter CPS investigations. This additional time made essentially no
difference to the percentages of children investigated.
Overall, the percentages of maltreated children who received CPS
investigation represented more than one-half of the children in only a few maltreatment
categories except fatalities. Under both definitional standards, the highest investigation
rates (50% or higher) occurred for physically abused (52% or more) and sexually abused
children (55% or more), and for those with maltreatment so severe that their harm could
be inferred (53% or more). Also, among children with Endangerment Standard
maltreatment, those who were deemed to be endangered, but not demonstrably harmed,
also had a high rate of CPS investigation (60%). Considering the sentinel sources that
recognized the children as maltreated, investigation rates were above 50% only among
children with Harm Standard maltreatment recognized in police or sheriff departments
(53%) or at public housing agencies (68%) and among children with Endangerment
Standard maltreatment recognized at juvenile probation departments (63%), police or
sheriff departments (64%), mental health agencies (53%), social services agencies (94%),
and public housing agencies (67%). The lowest rates of investigation occurred for
children recognized at schools (20% or less across the definitional standards), day care
(12% or less), or shelters (19% or less).
The overall percentage of children with Harm Standard maltreatment who
received CPS investigation did not statistically change since the NIS–3, but investigation
rates did increase since the NIS–3 for Harm Standard abuse (from 40% to 50%), sexual
abuse (from 42% to 55%), emotional abuse (from 21% to 36%), emotional neglect (from
18% to 30%), and in children recognized as maltreated by juvenile probation (from 17%
to 42%), public health (from 3% to 26%) or social services (from 25% to 91%). The
investigation rate for Endangerment Standard maltreatment increased significantly, from
33% in the NIS–3 to 43% in the NIS–4. Increased investigation rates were evident in all
abuse (from 39% to 49%), sexual abuse (from 44% to 56%), emotional abuse (from 28%
to 40%), all neglect (from 28% to 41%), emotional neglect (from 22% to 50%), and in
children recognized as maltreated at juvenile probation departments (from 23% to 63%),
public health departments (from 4% to 33%), day care centers (from 3% to 12%), or
social services (from 33% to 94%).
The NIS methodology generates information that speaks only to the end
result of several processes, indicating whether or not a given maltreated child was among
17
those children investigated by CPS. Children who do not receive a CPS investigation
represent an enigma to the study, in that it is not possible to say whether sentinels who
recognized their maltreatment did not report it to CPS or whether they did report it but
CPS screened their reports out without an investigation. These alternatives have quite
different implications for policy. The NIS–4 included several supplementary studies to
help understand the countable children who do not receive CPS investigation.
The CPS Screening Policies Study (SPS) obtained detailed information about
CPS screening criteria to determine what role they might play in screening out countable
children from CPS investigations. The NIS–4 reviewed the children identified in the
main study as maltreated but not investigated at CPS to determine whether CPS probably
would have investigated them, based on the screening criteria described in the SPS
interviews. This exercise indicated that CPS probably would have investigated nearly
three-fourths (72%) of the uninvestigated children who experienced Harm Standard
maltreatment and two-thirds (66%) of the uninvestigated children with Endangerment
Standard maltreatment. Therefore, if CPS agencies consistently apply the criteria they
described, and if sentinels had reported the uninvestigated children to CPS, then CPS
would have investigated the majority. The “presumptive investigation rates,” reflecting
the percentages of maltreated children CPS would have investigated if sentinels had
reported them to CPS, were 81% of all children with Harm Standard maltreatment and
80% of those with Endangerment Standard maltreatment.
Another NIS–4 supplementary study, the CPS Structures and Practices Mail
Survey (SPM), collected information about various agency characteristics, examining
whether these related to CPS investigation rates. Investigation rates were significantly
lower when a state or regional hotline screened incoming referrals for children with Harm
Standard physical abuse (48% versus 65%) or emotional neglect (25% versus 37%).
When CPS had no assistance in investigating certain categories of maltreatment,
investigation rates were lower: if the agency had sole responsibility for investigating nonsevere physical neglect, then the rate of CPS investigation was significantly lower for
children with Harm Standard physical neglect (26% versus 43%); sole responsibility for
investigating abandonment correlated with lower investigation rates for Endangerment
Standard physical neglect (37% versus 50%). When CPS could provide a response other
than an investigation (commonly termed an “alternative response”), then investigation
rates were lower across a range of maltreatment categories under both definitional
standards. Agencies with alternative responses investigated only 23% of the children
18
with Harm Standard maltreatment and 29% of those with Endangerment Standard
maltreatment, whereas agencies without any alternative response offering investigated
38% and 52% of these groups, respectively. CPS agencies that did not prioritize
recommended responses to referrals investigated more children who experienced Harm
Standard physical abuse than did agencies that did (75% versus 55%) as well as more
educationally neglected children (23% versus 8%).
NIS sentinels also participated in the Sentinel Definitions Survey (SDS),
which asked them about their training on mandated reporting, their specific agency’s
policies governing CPS reporting, their personal experiences in reporting to CPS, and
whether they would report a variety of maltreatment situations to CPS. One-fourth of the
sentinels (24%) had neither received written instructions nor attended a workshop about
their state’s reporting requirements while working in their current agencies. Training
mattered, since more sentinels who received some form of training said they had reported
suspected child maltreatment to CPS (67% versus 53%). More sentinels from health and
law enforcement (96% or more) said their agencies allowed them to report directly to
CPS (versus having to go through an agency representative or committee) than did
sentinels in schools (80%) or other agencies (83%). Moreover, when allowed to do so,
fewer sentinels in schools and other agencies said they had ever reported a case (54% and
50%, respectively) compared to 87% of law enforcement sentinels and 77% of sentinels
in health agencies. An average of nearly one-fourth (23%) of sentinels predicted they
would not report described situations of Harm Standard maltreatment to CPS, verifying
that sentinels recognize a substantial number of maltreated children whom they do not
report to CPS. Nevertheless, whereas the NIS–4 found that majorities of countable
children were not investigated, only minorities of sentinels said they would not report the
countable cases presented in the SDS. The contrast was strong across all maltreatment
categories. Thus, the SDS results cannot explain the large percentages of uninvestigated
children in the NIS–4.
9.
Conclusions and Implications
The NIS–4 revealed several important changes in the incidence of
maltreatment since the time of the NIS–3. These observed changes may reflect real
changes in the scope of the problem, or they may reflect changes in how sentinels and
other reporters respond to the maltreated children they encounter. The current
19
information suggests that both of these dynamics contributed to the observed changes,
each dynamic affecting a different sector of the abused and neglected population.
The NIS–4 documented declines in rates of all categories of abuse across
both definitional standards. The declines in sexual abuse and physical abuse are
consistent with trends in CPS data gathered by the National Child Abuse and Neglect
Data System (NCANDS, U.S. Department of Health and Human Services,
Administration on Children, Youth and Families, 2007) and they also parallel declines in
victim self-reports. However, since no independent information is currently available that
bears on the incidence of emotional abuse, it is not clear whether the NIS decline in this
category reflects a real decrease in its occurrence.
The increase in the rate of emotional neglect since 1993 could, in part, signify
a real increase in the occurrence of maltreatment, but it is fairly clear that it also reflects
some change in policy and focus. Since the NIS–3, a number of CPS systems have
undertaken initiatives to increase collaboration between CPS and agencies that serve
domestic violence and alcohol and drug problems (U.S. Department of Health and
Human Services, Administration for Children and Families/Children's Bureau and Office
of the Assistant Secretary for Planning and Evaluation, 2001, 2003). The increased
emotional neglect incidence may predominantly reflect the heightened CPS attention to
these problems, which are involved in certain types of emotional neglect. Further
analyses will clarify whether the increases in emotional neglect primarily occurred in
specific types of emotional neglect or for children recognized at specific types of
agencies.
Another area where further analyses can illuminate the implications of the
NIS–4 findings is in the interrelationships among the different factors associated with the
incidence of maltreatment. Factors such as parents’ labor force participation, household
socioeconomic status, family size, and family structure and living arrangement are not
only associated with the incidence of maltreatment but are also correlated with each
other. Further analyses could determine their independent relationships to maltreatment,
such as whether households with more children have higher incidence rates even when
household socioeconomic status is taken into account. Moreover, for the first time in
NIS, the NIS–4 found race differences in the incidence of maltreatment, with higher
incidence rates for Black children. Future analyses should examine whether these race
20
differences in maltreatment rates remain when the disadvantaging effects of these family
circumstances are taken into account.
The NIS–4 findings on the strong correlations between socioeconomic status
and all categories of maltreatment are consistent with earlier NIS findings on household
income. As with the previous results, the recent observations cannot be plausibly
explained by the claim that lower socioeconomic families are simply more visible to the
community professionals who provide most of the data. The NIS sentinels observe
substantial numbers of children and families at the middle- and upper-income levels.
Sentinels in schools alone recognized the majority of the maltreated children.
Despite some increases in CPS investigation of maltreated children, the NIS–
4 shows that investigation rates still remain fairly low. Similar to previous NIS findings,
the NIS–4 again determined that the majority of maltreated children do not receive CPS
investigation. The NIS–4 obtained information that shed additional light on this issue:
•
The NIS–4 determined that the finding is not an artifact of the relatively
short (3-month) NIS reference period, since adding a full month of CPS
data to increase the opportunity for more maltreated children to enter
CPS investigations made essentially no difference to the percentages of
children investigated.
•
Certain features of CPS structure and practice were associated with
percentages of maltreated children who received investigation.
Children were less likely to receive CPS investigation if they were in
the jurisdiction of CPS agencies that received their referrals about
suspected maltreatment through a centralized regional or state hotline,
that combined a new report into an ongoing open investigation on the
child or family, or that could offer an alternative response (other than
an investigation) to the children and families referred to them for
suspected maltreatment. Also, children who experienced physical
neglect were less likely to receive investigation if their CPS agency had
sole responsibility for investigating non-severe physical neglect.
•
The CPS Screening Policies Study found that if all maltreated children
were reported to CPS and CPS agencies followed their current
screening policies, then a large majority of the maltreated children
(80% or more) would receive CPS investigation. Assuming that
agencies follow their stated screening policies, the implication is that
mandated reporters do not report most of the uninvestigated children
(two-thirds or more).
21
•
In the Sentinel Definitions Survey, sentinels responded to descriptions
of maltreated children, indicating that they would not report some of
these to CPS. More sentinels who had received information or training
on their state’s reporting requirement while working in their current
agency had reported suspected child maltreatment.
Although schools predominated as a source of recognition for maltreated
children, 20% or less of the maltreated children recognized at schools received CPS
investigation. One factor that may contribute to the low investigation rate for schoolrecognized children is school policy barring staff from making direct reports to CPS. In
the Sentinel Definitions Survey, 20% of school sentinels indicated that their schools do
not permit them to report directly to CPS. However, other factors also contribute to low
investigation rates for the school-recognized children, because even when agencies
permitted direct reports, fewer sentinels in schools said they had reported a case (54%)
compared to staff in health agencies (77%) or law enforcement (87%). Similar patterns
emerged in the previous NIS cycles. To repeat the earlier recommendation: better
working relationships should be forged between CPS agencies and schools, capitalizing
on the unique role of school professionals as front-line observers.
22


© Copyright 2026