
Illegal ImmIgratIon
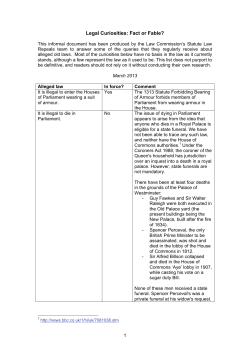
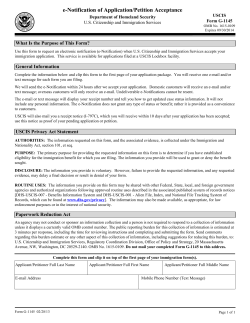
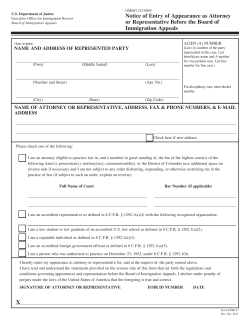
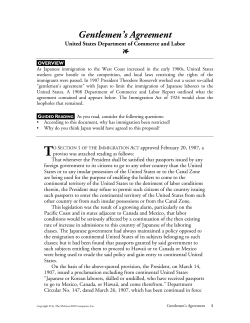
Illegal Immigration Hans Johnson and Laura Hill Despite a recent decline, the number of illegal immigrants in the United States remains high, and illegal immigration remains one of the most divisive issues in the nation. Illegal immigrants make up about 28 percent of all foreign-born U.S. residents and slightly less than 4 percent of the nation’s total population. The vast majority of immigrants in California are legal residents. But as the state with the most illegal immigrants, California has a critical stake in how well this issue is understood. The purpose of this At Issue is to provide basic information on illegal immigration and the debate surrounding it. Because illegal immigrants are not directly identified in censuses and national surveys, the information provided here is based on the best available estimates. These estimates are consistent across sources and are regarded by research experts as the most accurate available. at issu e : [ ill e g al i m m i g r ati o n ] PPI C 2 How many illegal immigrants are there? For the first time in decades, the number of illegal immigrants living in the United States has fallen. In 2009, there were about a million fewer illegal immigrants in the United States than in 2007.1 This decline is all the more remarkable because it follows a period of dramatic increases. From 1990 to 2007, the number of illegal immigrants increased by an average of 500,000 per year, and the population grew from a few million to about 12 million. By 2009 the population had shrunk to approximately 11 million, and 2010 estimates suggest little change from 2009. California has experienced a similar decline: the Department of Homeland Security estimates that 2.6 million illegal immigrants resided in California in 2010, a decline of 280,000 since 2008. The decline in the number of illegal immigrants can be attributed primarily to the Great Recession, but increased enforcement efforts almost certainly also play a role. The number of unauthorized immigrants coming to and leaving from the United States has long been known to fluctuate with the nation’s economy (Figure 1). Pre-recession unemployment rates were lower among illegal immigrants than other workers, but are now higher. This has weakened the jobs magnet that attracts most unauthorized immigrants to the United States.2 At the same time, stepped-up interior enforcement has led to dramatic increases in deportations. In 2009, a record 393,000 illegal immigrants were deported, compared to less than 200,000 annually in the early 2000s and less than 100,000 annually before 1997.3 Figure 1. Illegal immigration responds to U.S. economic conditions 1,000 Illegal immigrant population 10 Unemployment 9 800 8 7 400 6 5 200 0 4 91 92 93 94 95 96 97 98 99 00 01 02 03 04 05 06 07 08 09 19 19 19 19 19 19 19 19 19 20 20 20 20 20 20 20 20 20 20 3 Unemployment rate (percent) Net change (thousands) 600 (200) 2 (400) (600) 1 0 Sources: J. Passel and D. Cohn, Unauthorized Immigrant Population; Hoefer et al., Estimates of the Unauthorized Immigrant Population; R. Warren, Annual Estimates of the Unauthorized Immigrant Population in the United States, by State: 1990 to 2008; Bureau of Labor Statistics, International Comparisons of Hourly Compensation Costs. Notes: Estimates of net change are based on a two-year moving average of annual estimated changes by Warren (for 1990–2008), Passel and Cohn (for 2000–2009), and Hoefer et al. (for 2005–2009). at issue : [ ill e g al i m m i g r ati o n ] PPI C 3 Where do they come from and where do they settle? The vast majority of illegal immigrants in the United States are from Latin America (Figure 2). About 60 percent are from Mexico alone; another 20 percent are from other Latin American countries,4 most notably El Salvador, Guatemala, and Honduras. More than one million illegal immigrants also come from Asia and hundreds of thousands from Europe and Canada.5 California has a higher share than the rest of the nation of illegal immigrants from Mexico.6 It has more illegal immigrants overall than any other state—an estimated 2.6 million. But California is not the destination it once was. In the 1980s, almost half the nation’s illegal immigrants lived in California; today the state’s share is less than a quarter. The number of illegal immigrants in some Southeastern and Midwestern states has increased dramatically. Nevertheless, traditional destinations such as Texas, Florida, and New York still have large illegal immigrant populations (Figure 3). Figure 2. Most illegal immigrants are from L atin America Europe and Canada Africa and other 4% 4% Asia 11% Mexico Other Latin America 20% Source: J. Passel and D. Cohn, Unauthorized Immigrant Population. Note: Regions of birth for unauthorized immigrant population, 2009. 60% at issu e : [ ill e g al i m m i g r ati o n ] PPI C 4 Figure 3. California has more illegal immigrants than any other state 3,000 Pew Hispanic Center estimates Department of Homeland Security estimates 2,500 2,000 1,500 1,000 500 0 ia rn fo li Ca as x Te a rid Flo is no Illi na izo Ar k w Ne r Yo gia or na No rt a hC y rse li ro Ge N ew Je da va Ne Sources: J. Passel and D. Cohn, Unauthorized Immigrant Population; M. Hoefer et al., Estimates of the Unauthorized Immigrant Population Residing in the United States: January 2010. Note: 2010 estimates. Because of increased enforcement along the U.S.-Mexico border, many illegal immigrants have shifted crossing locations.7 Since the 1990s, when border patrol efforts were stepped up in California (especially the San Diego–Tijuana area), Arizona has become the primary crossing location. But not all illegal immigrants enter the United States by crossing the border without legal authorization. Large shares of illegal immigrants enter legally and overstay or violate the terms of their visas. Within California, illegal immigrants are found in all of the state’s large urban areas and in most rural areas. Unlike some states where immigrant populations are found only in a few large urban centers, immigrants—both legal and unauthorized—are found in many parts of California (Figure 4). New substate estimates for 2008 produced by PPIC show that Los Angeles County is home to more than one in three of the state’s illegal immigrants, and 12 of California’s counties have more than 50,000 illegal immigrants.8 Illegal immigrants make up more than 10 percent of the population of Los Angeles, Monterey/ San Benito, Imperial, and Napa Counties. at issu e : [ ill e g al i m m i g r ati o n ] PPI C 5 Who are they? There are no representative surveys on the national or state level that include questions about legal status—and even if there were, the responses could be suspect. This makes determining the characteristics of illegal immigrants very difficult. Some researchers have attempted to assign legal status to foreign-born noncitizens counted in population surveys by using a probability method based on nationality, year of entry, occupation, education, and some family characteristics.9 Their research suggests that most illegal immigrants are young adults. Although the vast majority (almost 90% nationwide) of illegal immigrants are adults, many live in families with their U.S.-born children. Among adults, a majority (60%) are men. Fewer than half of illegal immigrant men and only one of five illegal immigrant women are single and living apart from family. Illegal immigrants tend to be poorly educated. Almost half of 25- to 64-year-olds are not high school graduates. As a result—and despite very high labor force participation for men—wages and incomes are low. Nationwide, 21 percent of adult illegal immigrants and one-third of the children of illegal immigrants were living in poverty in 2007.10 Estimates suggest similar poverty rates in California. at issue : [ ill e g al i m m i g r ati o n ] PPI C 6 Figure 4. Unauthorized immigrants as a percent of the popul ation in California ZIP codes, 2008 Percent unauthorized immigrants 0% – 1% 1.1% – 5% 5.1% – 10% 10.1% – 15% 15.1% + Source: L. Hill and H. Johnson, “Unauthorized Immigrants in California: Estimates for Counties.” at issu e : [ ill e g al i m m i g r ati o n ] PPI C 7 Why do they come? Claims abound. Some argue that welfare is a draw. Others claim that their aim is to have babies who will be U.S. citizens. But research shows that illegal immigrants come to this country primarily for economic and personal reasons—jobs and family reunification.11 The economic pull Political controversies aside, when illegal immigrants come, many U.S. employers are ready to hire them. The vast majority work. Estimates suggest that at least 75 percent of adult illegal immigrants are in the workforce.12 Male illegal immigrants have particularly high labor force participation rates, with more than 90 percent in the workforce.13 Wage and employment levels here are much higher than in immigrants’ home countries. For example, the average U.S. wage for production workers in manufacturing is about nine times higher than in Mexico, a ratio that has changed very little in over two decades.14 Another economic incentive is the lack of well-developed access to credit and loans in home countries. For many families, the migration of some household members to the United States makes it possible to finance expensive purchases—including homes—in their countries of origin.15 The family pull Illegal immigrants also come to the United States to join family members already here. These family members can provide housing and information about jobs. They can also help pay for the costs of a coyote (a smuggler who charges to bring in illegal immigrants). Research finds that people who have U.S. family ties are much more likely to come than people who do not have these ties. For example, an earlier PPIC study showed that California experienced a substantial increase in family-based illegal immigration in the late 1980s.16 As a result of the Immigration Reform and Control Act of 1986, more than one million illegal immigrant workers in the state were allowed to apply for legal permanent residence. Many who became legal residents sent for family members to join them, and many of those family members were initially illegal immigrants. Because many illegal immigrants have children while they are in the United States17 or join family members who are here legally, a large percentage live in households with U.S. citizens. Many will eventually attain legal status through the family reunification provisions of U.S. immigration law. An analysis of immigrants granted legal permanent residency in 2003 shows that 44 percent lived in the U.S. as illegal immigrants. Slightly more than half overstayed their visas, and the remainder crossed the border without authorization.18 at issu e : [ ill e g al i m m i g r ati o n ] JUAN CARLOS ULATE/Reuters/Corbis Estimates suggest that at least 75 percent of adult illegal immigrants are in the workforce. PPI C 8 at issu e : [ ill e g al i m m i g r ati o n ] PPI C 9 How do they fit into the economy? Overall, about 1 in 20 workers in this country is an illegal immigrant,19 working in all sectors of the economy but mostly in low-skill occupations. About half of farm workers nationwide are illegal immigrants, but most illegal immigrants are not farm workers.20 They are also concentrated in construction, manufacturing (especially textiles and animal processing), retail trade (especially restaurants), and services (especially private household services). In California, where the concentration of illegal immigrants is almost twice as high as in the rest of the nation, about 9 percent of workers are illegal immigrants. According to one estimate, 14 percent of workers in Los Angeles County are in the informal economy and more than half (61%) of those workers are illegal immigrants.21 Whether illegal immigrants take jobs that U.S. natives will not do or displace U.S. workers has long been a bone of contention among advocates and a topic of study for researchers. Most studies indicate that immigrants (including illegal immigrants) have little effect on the wages and employment of U.S.-born workers. Some estimates suggest that more highly educated U.S.-born workers experience slight gains, as they are not in direct competition with most immigrants, and less-educated U.S.-born workers experience slight negative effects. But even these results are relatively small and debated.22 A recent PPIC report concludes that because legalizing formerly unauthorized low skilled workers did not increase their wages, a legalization program would most likely not increase competition between formerly unauthorized workers and U.S-born workers.23 Most economists agree that immigrants, including illegal immigrants, increase total economic output in the United States.24 Do they have a positive or negative fiscal impact? There are no reliable studies of illegal immigrants’ fiscal impact in California. In 2004, the Government Accountability Office concluded that there was not enough information to estimate state costs even of educating illegal immigrant children. Further, most studies of the fiscal effects of immigration do not separate illegal from legal immigrants.25 Illegal immigrants are not eligible for most public benefit programs, although their U.S.born children are eligible. Some parties to the debate claim that illegal immigrants and their children are a drain on public coffers. Others claim that they pay more in taxes than they receive in services. Sorting out the fiscal effects is a serious challenge, and the outcomes depend on the accounting methods used. Some would argue that the cost of educating the children of illegal immigrants is part of the equation. In that case, illegal immigrants almost certainly constitute a substantial drain on state and local public funds. But most children of illegal immigrants were born in the United States, are U.S. citizens, and are thus entitled to be educated in the public schools. Moreover, the U.S. Supreme Court has ruled that children who reside in the United States are entitled to attend public schools regardless of their immigration status. And, to put the issue in a larger context, most U.S. native families with children probably receive more in state and local services (primarily educational) than they pay in state and local taxes.26 at issu e : [ ill e g al i m m i g r ati o n ] PPI C 10 Many illegal immigrants pay Social Security and other taxes but do not collect benefits, and they are not eligible for many government services. However, they do use emergency and pregnancy-related health care, and their U.S.-born children may be eligible for social programs, including welfare (Temporary Assistance for Needy Families).27 Moreover, because most illegal immigrants work in low-wage occupations, they do not generate large tax revenues. According to one study—by an organization advocating reduced immigration—illegal immigrants are a net federal fiscal drain because of their low incomes and low tax payments, not because they are big consumers of public services.28 Another study, by the Brookings Institution, uses new data from the Current Population Survey to conclude that immigrants and their children contribute more in taxes than they receive in benefits.29 What does the public think about illegal immigrants and immigration? Californians tend to have more positive opinions than U.S. residents overall toward illegal immigrants. Various PPIC Statewide Surveys have found that even though illegal immigration is seen as a problem, it is not at the top of most Californians’ lists of concerns. In May 2010, responding to an open-ended question about the most important issue facing the state, only 9 percent pointed to immigration or illegal immigration. When asked directly about immigration policy in March 2010, however, 69 percent thought it needed “major changes,” 22 percent thought “minor changes,” and only 7 percent replied “fine the way it is.” Although opinions vary about what changes are necessary, a large majority of Californians (70%) think illegal immigrants who have lived and worked in the United States for at least two years should be given a chance to keep their jobs and eventually apply for legal status (Figure 5).30 Figure 5. Most Californians favor a pathway to legalization for illegal workers “If you had to choose, what do you think should happen to most illegal immigrants who have lived and worked in the United States for at least two years? They should be given a chance to keep their jobs and eventually apply for legal status, or they should be deported back to their native country.” Don’t know 5% Deported back to their native country 25% Chance to keep their jobs 70% SOURCE: Baldassare et al., Californians and Their Government, PPIC Statewide Survey, March 2010. at issu e : [ ill e g al i m m i g r ati o n ] PPI C 11 Californians’ attitudes toward illegal immigrants seem to have moderated since 1994, when voters passed Proposition 187 (which denied public services to illegal immigrants and was largely overturned by the courts). In response to a PPIC survey in 2002, 53 percent of Californians said that illegal immigrants should not be denied public services such as education and health care. And a majority (53%) of Californians said that illegal immigrants and their children should have access to public services. In March 2008, a large majority (66%) of Californians said that illegal immigrants should be allowed to apply for work permits. In contrast, only 49 percent of people in a 2006 nationwide CBS News Poll stated that illegal immigrants should be allowed to apply for work permits. How can public policy address illegal immigration? Most immigration policy is federal, but state and local governments are becoming more active in addressing immigration issues. Recent state and local initiatives have ranged from the establishment of sanctuary cities, legislation enacted to discourage the employment of illegal immigrants, and formalized relationships between police departments and Immigrations and Customs Enforcement (ICE). Most recent policies enacted by state and local officials are seen as a response to failed federal immigration policy, and many have focused on restricting employment of illegal workers. Twenty-one states have adopted requirements that state contractors or state employers use a federal electronic verification system (known as E-Verify) to determine each prospective employee’s legal status, and four states require all employers in the state to verify the status of their workers.31 In California, the city of Mission Viejo requires its contractors to use E-Verify, and the city of Lancaster requires E-Verify of all employers. But there are some concerns about E-Verify, including its accuracy, its timeliness, and whether its use would lead to discriminatory practices on the part of employers. A recent PPIC study found that Arizona’s E-Verify mandate led to a decline in the number of unauthorized workers, but also pushed more workers into informal employment.32 Federal efforts over the past 15 years have focused on border enforcement. But border enforcement alone is not adequate to solve the problems of illegal immigration. PPIC research has found that increased border enforcement, including tripling the number of agents along the Mexican border and building fences along some portions of it, has deterred some potential migrants.33 However, this level of deterrence is swamped by the economic pull of jobs and wages and the family ties that draw illegal immigrants to the United States. Ironically, because enforcement has heightened the danger and expense of crossing the border, many illegal immigrants now stay longer than they did before the buildup.34 And many who used to be cyclical crossers have now become long-term settlers. Moreover, border enforcement has no effect on the substantial share of illegal immigrants who enter this country legally, with a tourist visa for example, and then overstay or otherwise violate the terms of their visa. It remains to be seen whether continued increases in border enforcement coupled with increases in interior enforcement can lead to sustained reductions in the number of illegal immigrants. at issu e : [ ill e g al i m m i g r ati o n ] PPI C 12 Robert Essel, NYC/Corbis Most economists agree that immigrants, including illegal immigrants, increase total economic output. at issu e : [ ill e g al i m m i g r ati o n ] PPI C 13 Almost all observers and policymakers agree that our current federal immigration policies are in dire need of change. A number of proposals have been submitted in Congress to address illegal immigration. Some proposals concentrate primarily on enforcement— including the construction of a fence along the entire U.S.-Mexico border and the denial of citizenship to U.S.-born children of illegal immigrants. Others focus on legalization and guest worker programs. To be successful, policy reforms must address the root economic cause of illegal immigration: jobs. Internally, one option is to develop meaningful employer sanctions, which should be accompanied by an accurate means of determining an individual’s right to live and work in the United States. More broadly, economic development in sending countries will reduce the pressure to migrate. Policies that encourage investment (foreign aid or foreign direct investment) in their economies could foster such development. Successful policies must also address the logistical, economic, and humanitarian difficulties of attempting to identify and deport over 10 million illegal immigrants residing in the United States, many of whom are the parents of U.S.-born children and the spouses of U.S. citizens. Policies developed without an understanding of these factors will fail. For example, a guest worker program that does not include the option of attaining permanent legal status after a certain number of years will likely result in many becoming illegal residents when their tenure as a guest worker ends. At the moment, the prospects for comprehensive federal immigration reform do not seem good. The debate about illegal immigration continues to be shaped by a complicated set of priorities, interests, and agendas. In the absence of action by national policymakers to overhaul the system, illegal immigration will remain a key issue for many state and local governments. at issue : [ ill e g al i m m i g r ati o n ] PPI C 14 Notes 1 Estimates of the illegal immigrant population are derived using a residual technique in which independently derived estimates of legal immigrants are subtracted from survey-based estimates of the entire foreign-born population in the United States to give estimates of the number of illegal immigrants. In this report, we use estimates produced by Robert Warren (“Annual Estimates of the Unauthorized Immigrant Population in the United States, by State: 1990 to 2008” [Working Paper, San Francisco: Public Policy Institute of California, 2011]), the Office of Immigration Statistics at the Department of Homeland Security (Michael Hoefer, Nancy Rytina, and Bryan C. Baker, Estimates of the Unauthorized Immigrant Population Residing in the United States: January 2010, 2011) and the Pew Hispanic Center (Jeffrey S. Passel and D’Vera Cohn, Unauthorized Immigrant Population: National and State Trends, 2010, 2011; Passel and Cohn, U.S. Unauthorized Immigration Flows Are Down Sharply Since Mid-Decade, 2010). 2 Passel and Cohn, U.S. Unauthorized Immigration Flows Are Down. 3 By deportation, we mean the compulsory and confirmed movement out of the United States based on an order of removal. Note that deportations are not the same as apprehensions on the border. The vast majority of illegal border crossers who are apprehended agree to “voluntary return,” and do not have an order of removal. Most deportations occur in the interior of the United States through efforts to identify illegal workers and criminals who are illegal immigrants (see Table 36 in the 2009 Yearbook of Immigration Statistics, Office of Immigration Statistics, U.S. Department of Homeland Security, August 2010). 4 Passel and Cohn, U.S. Unauthorized Immigration Flows. 5 Passel and Cohn, U.S. Unauthorized Immigration Flows. 6 Based on an analysis of 2003 and 2004 Current Population Survey data. See Karina Fortuny, Randy Capps, and Jeffrey Passel, The Characteristics of Unauthorized Immigrants in California, Los Angeles County, and the United States (Washington DC: Urban Institute, 2007). 7 Belinda I. Reyes, Hans Johnson, and Richard Van Swearingen, Holding the Line? The Effect of the Recent Border Build-Up on Unauthorized Immigration (San Francisco: Public Policy Institute of California, 2002). 8 See Laura Hill and Hans Johnson, “Unauthorized Immigrants in California: Estimates for Counties” (San Francisco: Public Policy Institute of California, 2011). Available at www.ppic.org/main/publication.asp?i=986. 9 Because illegal immigrants make up a large share of noncitizens in the United States, and because the residual population estimates provide information about year of entry and country of origin, estimates of the characteristics of undocumented immigrants are reasonably reliable. The discussion of characteristics of illegal immigrants relies on Passel and Cohn, A Portrait of Unauthorized Immigrants in the United States (Washington DC: Pew Hispanic Center, 2009) and Steven A. Camarota, Immigrants at Mid-Decade: A Snapshot of America’s Foreign-Born Population in 2005 (Washington DC: Center for Immigration Studies, 2005). 10 Passel and Cohn, Portrait of Unauthorized Immigrants. 11 For example, see Jorge Durand and Douglas Massey, Crossing the Border: Research from the Mexican Migration Project (New York: Russell Sage Foundation, 2004). 12 B. Lindsay Lowell and Richard Fry, Estimating the Distribution of Undocumented Workers in the Urban Labor Force: Technical Memorandum (Washington DC: Pew Hispanic Center, 2002). 13 Passel and Cohn, U.S. Unauthorized Immigration Flows. 14 This information is based on Bureau of Labor Statistics, “International Comparisons of Hourly Compensation Costs for Production Workers in Manufacturing, Supplementary Tables,” www.bls.gov/fls/hcpwsupptabtoc .htm (accessed in September 2010). 15 Douglas S. Massey, “Five Myths about Immigration: Common Misconceptions Underlying U.S. BorderEnforcement Policy,” in Immigration Policy In Focus 4, no. 6 (August 2005). 16 Hans Johnson, Undocumented Immigration to California: 1980 –1993 (San Francisco: Public Policy Institute of California, 1996). 17 Passel and Cohn, Unauthorized Immigrant Population. 18 Joseph Hayes and Laura Hill, Immigrant Pathways to Legal Permanent Residence: Now and Under a MeritBased System (San Francisco: Public Policy Institute of California, 2008). 19 Passel and Cohn, U.S. Unauthorized Immigration Flows. 20 Daniel Carroll et al., Findings from the National Agricultural Workers Survey (NAWS) 2001–2002: A Demographic and Employment Profile of United States Farm Workers, Research Report No. 9 (Washington DC: U.S. Department of Labor, 2005); www.doleta.gov/agworker/report9/naws_rpt9.pdf. 21 Daniel Flaming, Brent Haydamack, and Pascale Joassart, Hopeful Workers, Marginal Jobs: LA’s Off-The-Books Labor Force (Los Angeles: Economic Roundtable, 2005). at issue : [ ill e g al i m m i g r ati o n ] PPI C 15 22 For an excellent short summary of the research literature on this topic, see “The Role of Immigrants in the U.S. Labor Market,” a Congressional Budget Office paper released in November 2005 (www.cbo.gov /ftpdocs/68xx/doc6853/11-10-Immigration.pdf). See also George J. Borjas, “The Labor Demand Curve Is Downward Sloping: Reexamining the Impact of Immigration on the Labor Market,” Quarterly Journal of Economics 18, no. 4 (2003); and Gianmarco Ottaviano and Giovanni Peri, “Immigration and National Wages: Clarifying the Theory and the Empirics,” NBER Working Paper No. 14188, 2008. 23 See Laura Hill, Magnus Lofstrom, and Joseph Hayes, Immigrant Legalization: Assessing the Labor Market Effects (San Francisco: Public Policy Institute of California, 2010). 24 See, for example, Giovanni Peri, “The Effect of Immigrants on U.S. Employment and Productivity,” FRBSF Economic Letter, August 30, 2010. Peri does not distinguish between illegal and legal immigrants. Gordon Hanson does consider illegal immigrants’ contributions, and concludes that the net effect on the U.S. economy is small, with most (but not all) economic gains going to the illegal workers themselves. See Hanson, The Economics and Policy of Illegal Immigration in the United States (Washington DC: Migration Policy Institute, 2009). 25 For a lengthy discussion of immigrants (both legal and illegal) and the state’s economy, see “The Impact of Immigration on the California Economy,” a report prepared by the Center for the Continuing Study of the California Economy (www.mexica.net/immigrat/impactimmcaecon.pdf). 26 This determination is made by combining estimates from a National Research Council (NRC) study of the net fiscal effects of U.S.-born households in California with average expenditures for K–12 students in California. The NRC estimated that in 1996 the average U.S.-born household in California contributed $1,946 more in state and local taxes than it received in state and local expenditures on ser vices, excluding education expenditures. In 1996, state and local expenditures per K–12 student were $4,702. Thus, an average U.S.-born household in California with one K–12 public school student received $2,756 more in state and local ser vices than it paid in taxes, and households with two students received $7,458. Even if we include federal taxes and expenditures, families with children are still a net burden. Those with one child receive $872 more in ser vices than they pay in taxes at all levels of government and those with two children receive $6,411 more. See National Research Council, “Do Immigrants Impose a Net Fiscal Burden? Annual Estimates,” in The New Americans: Economic, Demographic, and Fiscal Effects of Immigration, edited by James P. Smith and Barr y Edmonston ( Washington DC: National Academies Press, 1997). 27 The California Immigrant Welfare Collaborative lists health and welfare programs for which immigrants in California are eligible at www.nilc.org/ciwc. 28 Steven A. Camarota, The High Cost of Cheap Labor: Illegal Immigration and the Federal Budget (Washington DC: Center for Immigration Studies, 2004). 29 Michael Greenstone and Adam Looney, Ten Economic Facts about Immigration (Washington DC: The Hamilton Project, Brookings Institution, 2010). 30 Mark Baldassare, Dean Bonner, Sonja Petek, and Nicole Willcoxon, Californians and Their Government, PPIC Statewide Survey, March 2010. Available at www.ppic.org/main/publication.asp?i=927. 31 According to LawLogix at www.lawlogix.com/E-Verify_Federal_and_State_Legislation_Map.html. 32 Magnus Lofstrom, Sarah Bohn, and Steven Raphael, Lessons from the 2007 Legal Arizona Workers Act (San Francisco: Public Policy Institute of California, 2011). 33 Reyes et al., Holding the Line? 34 See Wayne A. Cornelius, “Death at the Border: The Efficacy and Unintended Consequences of U.S. Immigration Control Policy, 1993–2000” (Working Paper, Center for Comparative Immigration Studies, University of California, San Diego, 2000). at issu e : [ ill e g al i m m i g r ati o n ] PPI C 16 PPIC EXPERTS Hans Johnson Senior Policy Fellow 415-291-4460 [email protected] Expertise • • • • Education Immigration and migration Population issues and demographics – Census – Population growth – Population projections – Regional population – Fertility Housing Education projections and workforce skills Ph.D. (1997), demography, and M.A. (1989), biostatistics, University of California, Berkeley Laura Hill Policy Fellow 415-291-4424 [email protected] Expertise • • • • Education Immigration and immigrants Multiracial populations Fertility – Trends among immigrants – Trends among successive generations of immigrants California’s youth Ph.D. (1998), demography, and M.A. (1996), economics, University of California, Berkeley Sarah Bohn Policy Fellow 415-291-4413 [email protected] Expertise • Immigration and immigrants – Immigration and U.S. labor markets – Settlement patterns – Labor market assimilation – Historical economic progress Education Ph.D. (2007) and M.A. (2005), economics, University of Maryland, College Park at issu e : [ ill e g al i m m i g r ati o n ] PPI C 17 Joseph Hayes Policy Associate 415-291-4438 [email protected] Expertise • • • Immigration and immigrants – Immigration policy Population issues and demographics – Regional migration California’s prison population Education M.S. (1995), agricultural economics, University of Wisconsin-Madison Magnus Lofstrom Policy Fellow 415-291-4454 [email protected] Expertise • • • Education Immigration and immigrants – Labor market integration – Self-employment – Welfare reform and participation – Educational attainment Entrepreneurship – Minority self-employment Education – Ethnic differences in high school dropout rates – General Educational Development (GED) credential Ph.D. (1999) and M.A. (1998), economics, University of California, San Diego RELATED PPIC PUBLICATIONS Sarah Bohn, “New Patterns of Immigrant Settlement in California” (July 2009) Laura Hill, Magnus Lofstrom, and Joseph Hayes, Immigrant Legalization: Assessing the Labor Market Ef fects (April 2010) Magnus Lofstrom, Sarah Bohn, and Steven Raphael, “Lessons from the 2007 Legal Arizona Workers Act” (March 2011) “Illegal Immigrants” (Just the Facts, December 2010) at issu e : [ ill e g al i m m i g r ati o n ] PPIC BOARD OF DIRECTORS John E. Br yson, Chair Retired Chairman and CEO Edison International Mark Baldassare President and CEO Public Policy Institute of California Ruben Barrales President and CEO San Diego Regional Chamber of Commerce María Blanco Vice President, Civic Engagement California Community Foundation Gary K. Hart Former State Senator and Secretary of Education State of California Robert M. Hertzberg Partner Mayer Brown, LLP Walter B. Hewlett Director Center for Computer Assisted Research in the Humanities Donna Lucas Chief Executive Officer Lucas Public Affairs David Mas Masumoto Author and farmer Steven A. Merksamer Senior Partner Nielsen, Merksamer, Parrinello, Gross & Leoni, LLP Constance L. Rice Co-Director The Advancement Project Thomas C. Sutton Retired Chairman and CEO Pacific Life Insurance Company © 2011 Public Policy Institute of California. All rights reserved. San Francisco, CA The Public Policy Institute of California is dedicated to informing and improving public policy in California through independent, objective, nonpartisan research. PPIC is a private operating foundation. It does not take or suppor t positions on any ballot measure or on any local, state, or federal legislation, nor does it endorse, support, or oppose any political parties or candidates for public office. Research publications reflect the views of the authors and do not necessarily reflect the views of the staff, officers, or Board of Directors of the Public Policy Institute of California. Short sections of text, not to exceed three paragraphs, may be quoted without written permission provided that full attribution is given to the source and the above copyright notice is included. PPI C 18 Additional resources related to immigration are available at www.ppic.org P ublic P olicy I nstitute of C alifornia 500 W ashington S treet , S uite 600 • S an F rancisco , C A 94111 p 415.291.4400 • f 415.291.4401 • www.ppic.org P P I C sacramento center • senator office building 1121 L street , S uite 801 • S acramento , C A 95814 p 916.440.1120 • f 916.440.1121


© Copyright 2026