
3 Possible causes of overweight and obesity
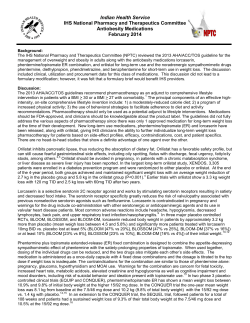
3
Possible causes of overweight and
obesity
The previous chapter examined obesity in an economic framework and the decision
making about eating and energy use that could lead to an individual becoming
overweight or obese. A range of individual, family-level and community-level
factors will influence these decisions about eating and energy use by influencing the
benefits and costs of each activity that are weighed up when making such decisions.
This chapter looks at some of the evidence on these possible causes of childhood
overweight and obesity. Understanding these possible causes is important for
understanding what causes are amenable to policy influence.
As mentioned earlier, obesity is caused by an imbalance between energy consumed
and energy expended, with excess energy stored as fat, and it has numerous health
consequences (box 1.1, chapter 1). The increase in childhood obesity in Australia
since the 1970s could be a result of an increase in energy intake, a decrease in
energy expenditure or, more likely, a combination of the two. It is likely that some
of the factors discussed in this chapter have changed over time, changing the value
(or perception of value) of the benefits and costs of eating and exercising, leading to
the increase in childhood obesity.
3.1
Framework for possible causes of overweight and
obesity
We base our discussion of some of the possible causes of, or factors associated
with, childhood overweight and obesity on the framework presented in Davison and
Birch (2001) (figure 3.1). The framework sets out three main categories:
•
‘Child characteristics and behaviours’, which includes genetics (child
characteristics) and behaviours such as dietary intake, physical activity and
sedentary behaviour.
•
‘Parenting styles and family characteristics’, which can affect a child’s
behaviour.
POSSIBLE CAUSES OF
OBESITY
35
•
‘Community, demographic and societal characteristics’, which can influence
both parents and families and children’s behaviours — advertising,
socioeconomic status (SES), education, ethnicity and the physical environment
are discussed here.
Figure 3.1
Framework for factors associated with obesity and overweighta
Community, demographic
and societal characteristics
Ethnicity
School lunch
programs
Work hours
Child feeding
practices
Types of food
available in home
Child characteristics and
behaviours
DIETARY
INTAKE
Parent
dietary intake
Leisure time
Peer and sibling
interactions
Gender
Nutritional
knowledge
Socioeconomic
status
Parenting styles and family
characteristics
Parent food
preferences
Accessibility of
recreational facilities
Age
Child
weight
status
Familial susceptibility
to weight gain
Parent weight
status
Family TV
viewing
SEDENTARY
BEHAVIOUR
PHYSICAL
ACTIVITY
Parent encouragement
of child activity
Crime rates and
neighbourhood
safety
Parent
monitoring of
child TV viewing
Parental preference
for activity
School physical
education
program
Parent activity
patterns
Family leisure
time activity
Accessibility of convenience foods
and restaurants
a Child behaviours (in upper case lettering) are associated with the development of overweight and obesity.
Characteristics of the child (in italics) interact with child behaviours and contextual factors to influence the
development of overweight and obesity.
Source: Davison and Birch (2001).
The factors in the outer layers affect those in the inner layers, culminating in the
child’s behaviour. For example, SES might influence the types of food available in
the home, which can influence dietary intake of children. Or crime rates and
neighbourhood safety might directly affect the preparedness of parents to allow
their children to partake in discretionary physical activity outdoors.
Much of the data and research presented in this section have limitations. Many
studies use self-reported (rather than measured) data to measure some factors (such
as dietary intake and physical activity) and rely on proxy measures, as many factors
are difficult to measure precisely. Much of the research presented in this section is
also cross-sectional in nature. While such research may suggest a correlation
between the factor and obesity, the scope to make causal inferences is limited.
36
CHILDHOOD OBESITY
Table 3.1 summarises the overall findings of the Australian and international
evidence in relation to each possible cause.
Table 3.1
Summary of evidence presented on factors associated with
overweight and obesity
Australian
Factor
Evidence
International
Studies
included
Studies
included
Evidence
no.
no.
Child characteristics and child behaviours
Genetics
None included
0
Association
Birth weight
1
Dietary intake
Inverse association with
central fat
Ambiguous
2
Inverse association with
central fat
Ambiguous
Unstateda,b
Soft drinks
Positive association
2
Positive association
Unstateda
Physical activity
Ambiguous
4
Inverse association
56a,b
Sedentary
behaviour
Ambiguous
3
Positive association
30a,b
Positive association
3
Positive association
Ambiguous
1
Ambiguous
U-shaped association
1
Positive association
1
Ambiguous
2
None included
0
14a,b
3
Parenting styles and family characteristics
Parental body
weight
Parenting style
and behaviour
Mothers working
hours
Family
environment
3
66a,b
Community, demographic and societal characteristics
Advertising
None included
0
Ambiguous
Unstateda,b
Socioeconomic
status
Ethnicity
Ambiguous
7
Ambiguous
35a,b
Associationc
Ambiguous
3
None included
6
Ambiguous
Physical
environment
0
Unstateda,b
a Included in sourced international reviews. b Includes Australian studies, some of which are discussed
separately. c Some ethnicities may predispose an individual to being relatively heavier and others relatively
lighter.
POSSIBLE CAUSES OF
OBESITY
37
3.2
Child characteristics and behaviours
Genetics
A strong genetic basis exists for the development of obesity. Numerous genes have
been linked with a predisposition to excess fat. At least six very rare mutations of
single-genes causing severe early-onset obesity have been identified. In addition,
there are also a number of rare syndromes that cause obesity, among other
conditions, such as Prader–Willi syndrome and Bardet–Biedl syndrome (Baur and
O’Connor 2004). In addition, an international review of twin and adoption studies
found that genetics had a strong effect on Body Mass Index (BMI) variation at all
ages, and the effect was stronger than that of environmental influences
(Silventoinen et al. 2010).
However, biological factors alone, including genetic composition, are unlikely to
account for the rise in obesity that has occurred since the 1970s, as it has occurred
too quickly to be explained in evolutionary terms (Crawford 2002; Philipson and
Posner 2008). It is more likely that the rise is due to changes in the social and
physical environment (Baur and O’Connor 2004).
Birth weight
A child’s birth weight appears to be associated with childhood weight outcomes. An
international review of the literature concluded that a consistent and positive
relationship exists between birth weight and BMI in childhood (Parsons et al. 1999).
Most of the studies included in this review used BMI as their indicator of body
weight, but as discussed earlier (chapter 1), BMI does not quantify body
composition and captures both fat and lean mass.
More recent studies have used measures of body weight that distinguish between fat
and lean mass and have found that birth weight was positively associated with lean
mass but not fat mass (Labayen et al. 2008; Wells et al. 2005). Other studies found
an inverse association between birth weight and central fat (Dolan, Sorkin and
Hoffman 2007; Garnett et al. 2001; Labayen et al. 2008; Oken and Gillman 2003).
Central fat is associated with risks of cardiovascular disease and may carry more
risk than total body fat (Oken and Gillman 2003). Other factors, such as SES, can
influence both birth weight and later body weight (Parsons et al. 1999).
38
CHILDHOOD OBESITY
Dietary intake
Dietary intake contributes directly to energy consumed. Dietary intake in children
may have changed over time, possibly contributing to the rise in childhood obesity
in Australia. A number of factors may have influenced the financial and time cost of
food consumption, leading to a change over time. First, agricultural and food
processing innovation may have lead to reductions in both the financial cost of
food, and the time cost for preparing food. Second, rising incomes increase the
opportunity cost of the time spent preparing food. Third, increasing working hours
also increases the time cost of preparing food (chapter 2).
The quantity of food consumed is not the only important consideration. The energy
density of food is also important as different macronutrients (such as fat, protein
and carbohydrates) contribute different amounts to energy intake. Also, fat, in
particular, is stored more readily as fat in the body than other macronutrients
(Davison and Birch 2001). Different macronutrients have different satiety effects
that will promote or suppress additional dietary intake:
•
energy density influences the palatability of food, which will influence
consumption
•
different macronutrients have different thermic effects, which will influence
energy expenditure
•
energy storage in the body will be influenced by food composition and the
metabolic efficiency of fat (Rodriguez and Moreno 2006).
The recent National Children’s Survey provides insights into dietary trends of
Australian children (CSIRO and University of South Australia 2008a). Overall
energy intake increased with age and the difference between males and females
became wider as they got older. Just under half of total energy consumed came from
carbohydrates for all age groups. Of this, sugars contributed more to energy intake
in younger children, while starch contributed more to energy intake in older
children. Dietary fat contributed just under a third to energy intake, with saturated
fat contributing more than monounsaturated and polyunsaturated fat. Protein
contributed about 17 per cent.
Cook, Rutishauser and Seelig (2001) found that 10–15 year olds in 1995 consumed
significantly more energy than 10–15 years olds in 1985. In particular, they
consumed significantly more protein, carbohydrates, starch, sugars, and dietary
fibre. There was no significant change in intake of fat and cholesterol.
Considering the relationship between different aspects of dietary intake and weight
in children in Australia, Magarey, Daniels, Boulton and Cockington (2001), in a
POSSIBLE CAUSES OF
OBESITY
39
longitudinal study, found that fat intake was directly related, and carbohydrate
intake inversely related, to subscapular (bottom point of shoulder blade) skinfolds.
However, they were not related to BMI or triceps skinfolds. The authors concluded
that macronutrient intake when young did not predict body fatness when older.
Another Australian study, Sanigorski, Bell and Swinburn (2007), found significant
positive relationships between daily servings of fruit juice/drinks and soft drinks
and the probability of being overweight/obese. Surprisingly, children who
consumed the highest amount of fruit and vegetables were also more likely to be
overweight/obese than children who had consumed no fruit and vegetables the
previous day. This result could be due to a number of factors, including
overweight/obese children eating a higher overall volume of food, overweight/obese
children positively changing their diet in response to their weight, or reporting bias
being stronger in parents of overweight/obese children. There was no significant
relationships between the proportion of overweight and obese and daily
consumption of fast foods and packaged snacks.
An international review (Newby 2007) found that, overall, there is no consistent
association between childhood obesity and most dietary factors. The evidence on
the relationship between total energy intake and obesity was the most inconsistent,
but there was some evidence to support positive relationships between fat intake,
and consumption of sugar-sweetened drinks and obesity. However, several
methodological weaknesses in the studies covered by the review could at least
partly explain the inconsistent findings, including interaction effects with other
factors not taken into accounted, underreporting of dietary intake, genetic
influences, different growth stages and generalisability of studies.
Soft drinks
Soft drink consumption is likely to influence obesity. Evidence suggests that people
do not compensate for the increase in energy consumed by drinking soft drink, and
that soft drinks may provide insufficient satiety signals when compared with solid
food (DiMeglio and Mattes 2000). In addition, soft drink consumption can stimulate
appetite, as consuming high glycaemic carbohydrates can cause glucose levels to
fall (Wolff and Dansinger 2008). Also, when processing soft drink the body may
use less energy than when processing other food (lower thermogenesis) (Olsen and
Heitmann 2009).
The most recent national Australian data (1995) on soft drink consumption are
presented by Gill, Rangan and Webb (2006). They found that about half of all
teenagers and 36 per cent of 2–3 year olds had consumed soft drink in the past
24 hours. More recent data for New South Wales for 2004 showed that almost
40
CHILDHOOD OBESITY
60 per cent of males and almost 40 per cent of females in years 6, 8 and 10 drank
more than 250ml of soft drink daily (Booth et al. 2006). In addition, between
7–12 per cent of males and a smaller proportion of females drank more than 1 litre
of soft drink daily (Booth et al. 2006). It appears that male children consume more
soft drink than female children (Abbott et al. 2007; Booth et al. 2006; Gill, Rangan
and Webb 2006), and soft drink consumption increases with age (Abbott et al. 2007;
Gill, Rangan and Webb 2006).
Between 1969 and 1999, soft drink consumption by Australian adults and children
more than doubled from an average of 47 litres per person per year to 113 litres per
person per year (ABS 2000). A number of factors could explain this increase. First,
increased availability of soft drinks, such as more vending machines, making it a
relatively more convenient purchase. Second, a reduction in the relative price of soft
drinks. Although Australian price data are not available, in the United States
relative soft drink prices have decreased and consumption has increased over the
past 20 years — soft drink consumption of 6–11 year olds roughly doubled between
1977–78 and 1998, and between 1982–1984 and 2000 the price of soft drinks
increased by only 26 per cent, much lower than the overall consumer price index
(80 per cent) and the price of fresh fruits and vegetables (158 per cent)
(Sturm 2005).
A study conducted in regional Victoria (Sanigorski, Bell and Swinburn 2007) found
that 4–12 year olds who consumed three or more servings of soft drink ‘yesterday’
were significantly more likely to be overweight/obese than those who consumed
0–2 servings. Another Australian study (Tam et al. 2006) examined the relationship
between soft drink/cordial consumption in mid-childhood (average age 7.7 years)
and BMI in early adolescence (average age 13.0 years). The results suggest that
increases in soft drink/cordial consumption may have contributed to the
development of adolescent obesity.
A large international meta-analysis (Vartanian, Schwartz and Brownell 2007) found
a significant correlation between soft drink consumption and energy consumed.
However, the average size of the effect was small for children. Evidence for an
association between soft drink consumption and body weight was mixed, and was
influenced by how body weight was measured. (The authors found that studies that
received funding from the food industry on average reported smaller results.)
Physical activity
Physical activity affects children’s weight status through increasing energy
expenditure. But it also links directly to children’s health outcomes — for example,
POSSIBLE CAUSES OF
OBESITY
41
low physical activity in children may be associated with a higher risk of developing
cardiovascular disease (Ruiz and Ortega 2009). In adults, physical inactivity and
obesity have similar health consequences (Blair and Church 2004). Further,
physically active, obese individuals have lower morbidity and mortality rates than
those who are normal weight and sedentary (Blair and Brodney 1999). Research
also indicates that moderate exercise can improve mental wellbeing (Fox 1999).
Deciding to undertake physical activity involves allocating scarce time and possibly
money. For children, undertaking physical activity could be at the expense of
studying, relaxing or other activities. How these activities are valued may have
changed over time, potentially increasing the costs of undertaking physical activity,
leading to reduced energy expended and increased obesity. In addition, concerns
about safety and changes to the physical environment (section 3.4) may have also
increased the costs of physical activity.
The National Physical Activity Guidelines recommend that children and adolescents
aged 5–18 years undertake at least 60 minutes of moderate to vigorous physical
activity every day (DoHA 2004a, 2004b). The recent National Children’s Survey
found that physical activity guidelines were met by the majority of 9–16 year olds
by most methods of measurement. Boys were more likely to meet the guidelines
than girls, and older children were less likely to meet the guidelines than younger
children (CSIRO and University of South Australia 2008a).
Many claim that physical activity in Australian children has decreased over time
(for example, Waters and Baur 2003). However, the evidence and data surrounding
physical activity in Australian children over time are sparse and patchy and overall
do not point to clear trends. A national study found that organised and informal
sport participation rose slightly from 59 per cent in 2000 to 62 per cent in 2006
(ABS 2006a). Further, Okely et al. (2008) found that both the prevalence and
minutes per week spent in self-reported moderate to vigorous physical activity in
NSW school children increased between 1985 and 2004 (by 12–20 percentage
points and 135–175 minutes per week, respectively). However, a NSW study found
that in 5–14 year olds the proportion that walked to school dropped substantially
and the proportion that were driven to school rose substantially between 1971 and
2003 (van der Ploeg et al. 2008). In addition, some smaller longitudinal studies have
observed declines. In a three year study, Cleland, Crawford et al. (2008) found that
average moderate to vigorous physical activity was significantly lower three years
later. Ball et al. (2009) also observed a decrease in physical activity over a three
year period.
Australian studies have examined the relationship between physical activity and
childhood obesity. Abbott and Davies (2004) found that physical activity levels
42
CHILDHOOD OBESITY
were significantly inversely associated with BMI and body fat. Another study, Ball
et al. (2001), found that physical activity level was inversely associated with body
fat in boys but not girls. However, Spinks et al. (2007) did not find a significant
relationship. A longitudinal study that examined the relationship between the level
of compulsory physical activity at school and overweight in childhood and 20 years
later, also found no significant relationship (Cleland, Dwyer et al. 2008).
However, an international review found that 12 of 14 longitudinal studies and 25 of
42 cross-sectional studies identified a significant inverse association between
physical activity and child and adolescent body weight (Trost 2005).
Sedentary behaviour
Sedentary behaviour includes activities that do not involve physical activity, and
could include activities such as watching TV and playing computer/video games
(also referred to as small screen recreation (SSR)), or other activities such as
reading or studying.
SSR can influence weight outcomes in a number of ways. First, SSR may substitute
for more physically demanding activities, reducing energy expended. Second,
higher exposure to advertising may result in children choosing more energy-dense
nutrient-poor foods (discussed later in this chapter). Finally, more energy-dense
nutrient-poor foods may be consumed while engaging in SSR than might have been
otherwise (eating as a secondary activity).
Sedentary behaviour may have increased over time due to technological change
increasing the variety of SSR activities available, and possibly reducing the relative
cost of undertaking SSR. Changes in SSR need to be considered in the
decision-making framework discussed in chapter 2. Presumably children are to
some extent making choices about the amount of time they spend on SSR after
considering the benefits they obtain from it and the tradeoffs they are making.
A recent national survey (CSIRO and University of South Australia 2008a) found
that the mean number of minutes 9–16 year olds spent on SSR was nearly double
the national guidelines (DoHA 2004a, 2004b). Using the most generous criteria for
meeting the guidelines, about a third of children met the guidelines on an average
day. The majority of SSR time was watching TV and the mean number of minutes
was lower for girls than boys. TV viewing peaked at age 12–14 years. The
relationship with age appeared to differ with gender and the type of SSR.
Marshall, Gorely and Biddle (2005) reviewed international trends in TV viewing in
youth between 1949 and 2004 and found that, while TV ownership increased
POSSIBLE CAUSES OF
OBESITY
43
dramatically, TV viewing by youth who had access to a TV remained relatively
constant.
Various Australian studies have attempted to estimate the relationship between SSR
and weight. Wake, Hesketh and Waters (2003) found a significant cross sectional
relationship between watching TV and BMI, but not for playing computer/video
games and BMI. However, only 1 per cent of total BMI variance could be explained
by watching TV. Bogaert et al. (2003) found no significant relationship between
hours of watching TV and weight change in a 12-month study. Hesketh et al. (2007)
found in a longitudinal study a significant relationship between SSR and BMI with
an extra hour of SSR increasing the odds of being overweight three years later by
3 per cent. The causal effects appeared to go in both directions: higher BMI leading
to higher SSR, and higher SSR leading to higher BMI.
Similar results have been found internationally. Marshall et al. (2004), in a
meta-analysis, found a significant, but very small, positive relationship between
different types of SSR and body fatness. They also found that TV viewing may
displace more physically demanding pursuits.
3.3
Parenting styles and family characteristics
Parents shape the family and home environment for their children. Parenting styles
and family characteristics can influence children’s dietary intake and activity levels.
Parental body weight is often described as a predictor of obesity in children, both in
their childhood and adulthood. This is not only due to the shared genetic
characteristics between parent and child, which may cause a predisposition to being
obese, but also shared attitudes and behaviours of parents with their children.
Australian literature indicates there is a relationship between parental BMI and their
children’s BMI in childhood and early adulthood. Magarey et al. (2003) found that
mother’s and father’s BMI were shown to be significantly but weakly correlated
with children’s BMI in some age groups. Another Australian study found that
children with overweight or obese fathers or mothers had consistently higher BMIs,
and BMI in 18 year olds was significantly predicted by father’s and mother’s BMI
(Burke, Beilin and Dunbar 2001). A study of preschoolers found that children with
an overweight mother were nearly twice as likely, and children with an obese
mother nearly three times as likely, to be in a heavier BMI category when compared
with a child with a non-overweight mother (Wake, Hardy et al. 2007). Other
international studies (Lake, Power and Cole 1997; Lee et al. 2006; Whitaker et al.
1997) have also found a relationship.
44
CHILDHOOD OBESITY
Parenting style and behaviour are also thought to influence their child’s weight
status. An Australian study using data on 4–5 year olds found no relationship
between mothers’ parenting behaviours and style and the odds of their child being
in a heavier BMI category, but they did for fathers. For example, children with more
controlling fathers had lower odds of being in a higher BMI category. A one point
increase in paternal control reduced the odds of the child being in a heavier BMI
category by 26 per cent (where control is measured as the frequency with which
fathers reported parenting behaviours that set and enforced clear expectations and
limits for their children’s behaviour, on a Likert scale from 1 (never/almost never)
to 5 (all the time)) (Wake, Nicholson et al. 2007).
In adults, education has often been linked to health outcomes, including adult
obesity. Higher levels of education might provide greater access to health-related
information and improved ability to handle such information, clearer perception of
the risks associated with lifestyle choices, and improved self-control and
consistency of preferences over time (Sassi et al. 2009). In Australia, an additional
year of education was found to be associated with a lower chance of being obese in
adulthood. There was no significant difference in the relationship between people of
different ethnicity (Sassi et al. 2009). To the extent that higher levels of education
provide parents with greater access to information and clearer perceptions of risks
of obesity, it might influence their child’s weight status as well. Education is also
used as an indicator of SES status (discussed below).
An international review found causal evidence that parenting affects children’s
eating patterns. However, there was insufficient evidence to determine whether or
not parenting affected childhood weight status via eating patterns (Ventura and
Birch 2008).
Other literature on the influence of parents on childhood obesity has looked at the
influence of maternal employment on overweight children. One study in the United
States found that children were more likely to be overweight the more hours their
mother worked per week. This study was conducted among higher SES families,
despite these children being least likely to have weight problems (Anderson,
Butcher and Levine 2003). The study found that if a mother in the top income
quartile worked an extra 10 hours per week, the child was between 1.4 and
3.8 percentage points more likely to be overweight. A recent study in Australia of
children at ages 4–5 years and 6–7 years found the children of mothers who worked
part-time watched less TV and were less likely to be overweight than children of
mothers who were not employed or who worked full-time (Brown et al. 2010).
An Australian study of 10–12 year olds (using data over three years) found family
physical activity and sedentary environments influenced weight status, but results
POSSIBLE CAUSES OF
OBESITY
45
differed by gender. Among boys, sedentary equipment in the home was associated
with greater increases in BMI-z score. (A BMI-z score indicates the relativity of a
particular BMI to the mean for that age and gender.) Among girls, sibling physical
activity and physical activity items in the home were associated with greater
decreases in BMI z-score (Timperio, Salmon et al. 2008).
Another Australian study of primary school students examined whether aspects of
the family food environment were associated with weight status. Few significant
associations were found. Nonetheless, among older children, more frequent dinner
consumption while watching TV was associated with a higher BMI z-score and less
frequent breakfast consumption and more frequent fast food consumption at home
was associated with higher likelihood of being overweight (Macfarlane et al. 2009).
3.4
Community, demographic and societal
characteristics
Advertising
Advertising on TV and other media is often cited as a potential cause of child
obesity. Some evidence suggests that Australian children have in the past been
exposed to more advertisements directed at them than in many other countries
(Dibb 1996). Advertising is thought to influence childhood obesity through
influencing children’s preference for energy-dense nutrient-poor foods. A recent
analysis of Australian TV advertising found that food advertisements made up 31
per cent of all advertisements. Of these, 81 per cent were for ‘unhealthy/non core
foods’. Overall, advertisements for ‘unhealthy/non core foods’ accounted for 25 per
cent of advertisements between 7am and 9pm on weekdays. The most concentrated
timeslot for ‘unhealthy/non core foods’ advertisements was the early morning
timeslot on Saturday (Chapman, Nicholas and Supramaniam 2006).
The development of children’s knowledge and understanding of advertising is
related to their cognitive development and social maturation. As they age, children
develop the ability to differentiate advertising and non-commercial content, and
understand and interpret the persuasive intent of advertising (John 1999; Kunkel
et al. 2004).
Although the ability to distinguish between TV shows and advertising starts to
develop in the pre-school years (ages 3–4 years), this does not necessarily reflect an
understanding of the intent and bias behind advertising, which does not usually
emerge until ages 7–8 years. However, even if a child understands the intent and
46
CHILDHOOD OBESITY
bias of advertising, some research suggests that this knowledge has little effect on a
child’s desire for advertised products (John 1999; Kunkel et al. 2004).
What is the effect of TV food advertisements on knowledge, preferences,
behaviours and obesity? According to Brand (2007), there appears to be evidence of
a correlation between advertising and knowledge and preferences. Also, as noted
earlier, a number of studies have found a link between TV viewing and obesity, but
the size is usually modest and causation has not been established. In addition, it is
difficult to isolate the effect of advertising from other factors that affect the TV
viewing and obesity relationship, such as the sedentary nature of TV viewing.
Carter (2006) has reached similar conclusions.
Socioeconomic status
Socioeconomic status (SES) is linked with obesity. SES is a measure of an
individual or group’s relative social and economic standing and ideally takes into
account income, education and occupation. In Australia, there is a higher prevalence
of obesity in low SES groups.
For example, if low energy-dense food were relatively more expensive than less
healthy energy-dense food, it may be that low SES groups could not literally afford
to be thin. In addition, as discussed in chapter 2, jobs in developed countries have
become increasingly sedentary and, as a result, more people are now having to give
up alternative pursuits to exercise.
Another explanation might be that being obese in adulthood results in less job
opportunities if it affects an individual’s ability to do their job, or if there is wage or
job discrimination, suggesting a causal relationship from adult obesity to SES.
However, there is evidence to suggest that, in Australia, the obese do not suffer a
wage penalty (Kortt and Leigh 2009).
Research suggests a link between parent SES and the SES of their child in
adulthood, and also a link between parent obesity and child obesity (Sobal and
Stunkard 1989). If social mobility is limited, the relationship between SES and
obesity may persist.
The recent National Health Survey found that children living in the area of greatest
relative disadvantage had higher overweight prevalence, and more than twice the
prevalence of obesity, than the least disadvantaged children (ABS 2009b). Many
other Australian studies also find this relationship (Booth et al. 2006; O’Dea 2008;
Salmon, Timperio et al. 2005; Wake, Hardy et al. 2007), although not all (Garnett
POSSIBLE CAUSES OF
OBESITY
47
et al. 2005). Some find a link for one gender but not the other (for example, Booth
et al. 2001).
An international review (Sobal and Stunkard 1989) found that in developed
societies, such as Australia, the relationship between SES and obesity for both male
and female children was weak and inconsistent. However, different measures of
SES (for example, income or occupation) make comparing the results across studies
difficult. A more recent review (Ball and Crawford 2005) studied the relationship
between SES and weight change in adults and found that when occupational-based
indices (for example, low versus high skilled occupations) were used as an indicator
of SES, there was evidence of an inverse relationship for both men and women. The
results were more inconsistent when education or income were used as an indicator
of SES.
Ethnicity
Ethnicity is also often associated with obesity. The influence on obesity could be
through cultural factors. For example, in many western cultures thinness is seen as
the ideal and overweight is seen as undesirable, but in many other cultures this is
not the case. The influence may also be genetic.
A recent national level survey found significant variation in obesity prevalence for
different ethnicities. Pacific Islander and Middle Eastern/Arabic adolescents were
most likely to be obese when compared with other adolescents. Anglo/Caucasian
and Asian children of all ages were the least likely to be obese (O’Dea 2008). In
addition, Wake, Hardy et al. (2007) found that Indigenous 4–5 year olds were
1.5 times more likely of being in a higher weight category than non-Indigenous
children. The difference between Indigenous and non-Indigenous weight outcomes
appears to be even more pronounced in adulthood (ABS 2006b). Other Australian
studies have also found a relationship between ethnicity and obesity (for example,
Booth et al. 2006).
These studies all used BMI as their measure of obesity. Evidence suggests that the
relationship between percentage body fat and BMI in adults differs among people of
different ethnicities, suggesting the general cut-off points for BMI might over or
underestimate obesity for people of different ethnicities (Deurenberg, Yap and van
Staveren 1998). If this is also true for children it may influence the interpretation of
the results of these studies.
O’Dea (2008) also examined weight perceptions and found that there appeared to be
a trend towards females of an ethnic background with higher prevalence of obesity
48
CHILDHOOD OBESITY
being less likely to perceive themselves as ‘too fat’ than other groups. This could
support the idea that overweight is seen as desirable in some cultures.
Physical environment
The physical environment is another potential factor affecting childhood obesity
through its influence on levels of physical activity. For example, it is argued that
areas with parks and bike paths may facilitate physical activity among residents,
whereas areas designed for motorised transport or with few facilities for physical
activity, would not. In addition, the urban environment may influence eating habits,
if the density and proximity of different food stores in an area affect relative costs
and hence dietary choices. The physical environment has changed over time, and
this has likely influenced changes in decision making related to dietary intake and
physical activity, potentially leading to increased obesity.
While there is a growing body of research in this area, there are some study
limitations. A lack of consensus exists on how to measure many environmental
variables and the size of the area that influences an individual (Dunton et al. 2009).
In addition, people will often spend time in multiple geographic areas, making it
difficult to identify the environmental factors that influence an individual. For
example, children will spend a lot of their time at home and at school. There is also
a wide array of potential physical environmental factors that can be studied. Often
the choice of variables is based on data available rather than any theoretical
underpinning (Ball, Timperio and Crawford 2006). In addition, due to the design of
many of the studies, the direction of the relationship cannot be determined. For
example, it may be that, rather than living near a park resulting in people being
more active, more active people choose to live near parks.
Australian studies have examined the prevalence of obesity in rural and urban areas.
Booth et al. (2001) included data from three surveys and found that, while the
prevalence of obese boys was greater in urban areas in two 1997 state surveys, there
was no difference for girls. In addition, no relationship was found in the National
Nutrition Survey data. However, in a different study, no relationship was found for
males, but for females BMI and skinfolds had increased by a significantly greater
amount in urban areas relative to their rural counterparts over a five-year period
(Dollman and Pilgrim 2005). Several other studies (Dollman, Norton and Tucker
2002; Cleland et al. 2010) found no significant relationship.
Some Australian studies have examined the relationship between specific aspects of
the physical environment and childhood obesity. Timperio et al. (2005) examined
the link between perception of the local environment and childhood overweight and
POSSIBLE CAUSES OF
OBESITY
49
obesity. They found that a parental view that there was heavy traffic in their area
and concern for road safety was associated with higher overweight and obesity in
older children; however, there was no relationship in younger children. Crawford
et al. (2008) examined the association between childhood obesity and
neighbourhood fast food outlets. This provided little support for the notion that
exposure to fast food outlets in the local neighbourhood increased obesity. They
found older children who had at least one fast food outlet within 2km of their home
actually had significantly lower BMI scores. There was no relationship for younger
children.
A recent international literature review found the association between the physical
environment and childhood obesity was mixed and differed with factors such as
age, gender, population density and SES (it also found that the association differed
according to whether reports were made by the child or parent). For adolescents,
obesity appeared to be related to urban sprawl, neighbourhood pattern and access to
equipment and facilities. There was not sufficient empirical evidence to determine if
a relationship existed between obesity and most of the environmental variables
considered (Dunton et al. 2009).
Another review found no clear link between urban environment and childhood
obesity. However, it did reveal that characteristics of the built environment have an
effect on other factors, that in turn are believed to influence overweight and obesity
— such as active recreation and ‘active transport’ (such as walking or cycling)
(Sallis and Glanz 2006).
While the literature examining the relationship between the physical environment
and obesity is quite small, the literature looking at the association between the
physical environment and obesity-related factors, such as physical activity and
healthy eating, is more expansive. Some Australian studies have looked at these
relationships. Timperio et al. (2009) examined the relationship between availability
of fast food close to home and on the route to school and children’s intake. They
found that only availability of fast food within 800m of home was associated with
intake, but it was an inverse relationship. Each additional outlet within 800m was
associated with lower odds (3 per cent) of consuming take away or fast foods at
least once weekly. This result is consistent with Crawford et al. (2008) (discussed
above).
Timperio, Giles-Corti et al. (2008) examined the associations between public open
spaces and children’s physical activity and found that overall, there were no clear
relationships between many aspects of the closest public open space to where
children live and their physical activity. Hume et al. (2009) conducted a
longitudinal examination of environmental predictors of children walking or cycling
50
CHILDHOOD OBESITY
to school and found that most of the individual preference, social and physical
environmental factors had no influence on active commuting over time. However,
children whose parents were satisfied with the number of pedestrian crossings were
more likely to increase their ‘active transport’, while this was more likely to
decrease if their parents perceived there to be insufficient traffic lights.
Davison and Lawson (2006) conducted a review of the relationship between the
physical environment and children’s physical activity and found that physical
activity appeared to be related to recreational infrastructure, transport infrastructure,
and local conditions. However, the findings were more mixed for recreational
infrastructure and local conditions compared to transport infrastructure.
3.5
Summary and conclusion
Much of the evidence of the relationships between different possible factors and
childhood obesity appears ambiguous. While it is easy to make a theoretical
argument for how and why each of these possible factors can affect body weight,
the evidence for many is at best limited, often mixed, and sometimes counter
intuitive. Methodological and data limitations are also issues with many studies of
childhood obesity.
The following broad conclusions are drawn from the literature.
•
Australian children’s energy intake appears to have risen since the 1980s, but in
most cases the link between diet and childhood obesity is inconsistent. A notable
exception is that soft drink consumption in Australia has increased dramatically
over the past few decades (possibly in response at least in part to declines in real
prices), and Australian studies have shown a link between soft drinks and
childhood obesity, making this potentially a promising area for policy attention.
However, the international literature is mixed and suggests the relationship is
small.
•
The relationship between physical activity and obesity may be stronger than for
many of the other factors. While organised physical activity in children may not
be decreasing, it appears that incidental exercise, such as walking to school, has
declined. Further, many Australian children undertake more SSR than
recommended by health authorities (potentially at the expense of physical
activity). However, the Australian and international evidence suggests that,
while there appear to be relationships between different types of SSR and
obesity, they appear to be small.
•
Parents with high BMIs tend to have children with high BMIs, but this does not
say much about causality. Genetics is important, but so are parenting styles and
POSSIBLE CAUSES OF
OBESITY
51
family characteristics. Eating patterns, such as eating in front of the TV, the
working status of mothers, and the degree of parental control may all be
important factors.
•
Australian children are exposed to a relatively high number of advertisements
for energy-dense nutrient-poor foods. But while international research indicates
that there is a link between advertising and knowledge and preferences, it is
difficult to discern a relationship between advertising and body weight.
•
There is a higher prevalence of obesity in Australian children from low
socioeconomic backgrounds. However, the international evidence on the link
between SES and childhood obesity is mixed. Ethnicity can also be an important
influence.
•
The physical environment is an area receiving increasing attention in the
literature, but it is difficult to disentangle this influence from other factors, such
as gender and SES. In addition, evidence on a relationship between the physical
environment and obesity-related behaviours, such as eating and physical activity,
is not strong. Of particular interest is the seemingly counter intuitive finding that
proximity to fast food outlets (which decreases the travel costs associated with
purchasing and consuming fast foods) appears not to be associated with obesity.
All the results of the studies looked at suggest that there is no single factor that
leaps out for attention. Some factors directly influence energy consumed or
expended, while others act indirectly on childhood obesity (figure 3.2). The poor
evidence, and the complex interactions between these many factors, warrants a
cautious approach to developing policy with an emphasis on experimentation and
rigorous evaluation. Keeping in mind the considerable uncertainty that exists about
many of these factors, the next chapter looks at policy levers that might be
considered.
52
CHILDHOOD OBESITY
Figure 3.2
Potential factors in the rise of childhood overweight and
obesity
Indirect influences
• Parents and families
− Income
− Parents’ work habits
• Advertising
• Physical environment
− Urban sprawl
− Access to
Energy intake
• Food consumption
(especially
energy-dense
nutrient-poor foods)
• Soft drink
consumption
Child weight
sport/recreation areas
− Fast food outlets
− Safety
• Knowledge
• School environment
• Peer behaviours and
preferences
Energy output
• Physical activity
− Sport participation
− Walking to school
• Sedentary activities
− TV
− Computer/video
games
POSSIBLE CAUSES OF
OBESITY
53


© Copyright 2026