
TEA-Ch: Assessing Children's Attention & ADHD Performance
J . Child P.y?r.hoi P.wchiat. Vol. 42. No. X, pp. 1065-1081, 2001
Cambridge University Press
G 2001 Associatlon for Child Psychology and Psychlatry
Printed m Great Brltaln. All rights reserved
OOZI-~~~O/OI$I~~+~OO
The Differential Assessment of Children’s Attention: The Test of
Everyday Attention for Children (TEA-Ch), Normative Sample and
ADHD Performance
Tom Manly
Vicki Anderson
Medical Research Council Cognition and Brain Sciences
Unit, Cambridge, U.K.
University of Melbourne, Australia
Ian Nimmo-Smith
Anna Turner
Medical Research Council Cognition and Brain Sciences
Unit, Cambridge, U.K.
The Radcliffe Infirmary, Oxford, U.K
Peter Watson
Ian H. Robertson
Medical Research Council Cognition and Brain Sciences
Unit, Cambridge, U.K.
Trinity College Dublin, Ireland
“Attention” is not a unitary brain process.Evidence from adult studies indicates that
distinct neuroanatomical networks perform specific attentional operations and that
these are
vulnerable to selective damage. Accordingly, characterising attentional disorders requires
the use of a variety of tasks that differentially challenge these systems. Here we describe a
novel battery, the Test of Everyday Attention for Children (TEA-Ch), comprising nine
subtests adapted from the adult literature. The performance of 293 healthy children between
the ages of 6 and 16 is described together with the relationships to IQ, existing measures of
attention, and scholastic attainment. This large normative sample also allows us to test the
fit of theadult model of functionally separable attention systems to the observed patterns of
variance in children’s performance. A Structural Equation Modelling approach supports
this view. A three-factor modelof sustained and selective attentionand higher-level
“executive” control formed a good fit to the data, even in the youngest children. A single
factor model was rejected.
There are behavioural and anatomical grounds to believe that Attention Deficit Disorder
(ADD) is particularly associated with poor self-sustained attention andbehavioural control.
The TEA-Ch performance of 24 boysdiagnosed with ADD presented here is consistent with
this view. When performance levels on WISC-I11 subtests were taken into account, specific
deficitsinsustained attention were apparent whileselective attention performance was
within the normal range.
Keywords; ADD/ADHD, assessment, attention, executive function, normal development.
Abbreviations; ADD: Attention Deficit Disorder; ADHD: Attention Deficit Hyperactivity
Disorder; SEM: StructuralEquation Modelling; TEA: TestofEveryday
TEA-Ch: Test of Everyday Attention for Children.
Introduction
Vast and increasing numbers of children are referred
clinical services with suspected attentional problems. In
some studies, referral rates for Attention Deficit Hyper6 % of all school
activity Disorder (ADHD) have reached
age boys and 1.5
% of girls(U.S. data: Swanson, Learner,
& Williams, 1995). Deficits in attention processes have
been attributed to many other developmental conditions
(Lang, Athanasopoulous, & Anderson, 1988) including
autism (Burack et al., 1997), Asperger syndrome (Klin,
Sparrow, Volkmar, Cicchetti, & Rourke, 1995) Tourette
syndrome (Georgiou, Bradshaw, Phillips,& Chiu, 1996),
Requests for reprints to: Tom Manly, MRC Cognition and
Brain Sciences Unit, 15 Chaucer Road, Cambridge CB2 2EF,
U.K. (E-mail: [email protected]).
Attention;
leukaemia (Brouwers, Riccardi, Fedio, & Poplak, 1985)
Turner syndrome (Skuse etal., 1997), and acquired brain
to injuries (Anderson & Pentland, 1998; Kaufmann, Fletcher, Levin, Miner, & Ewing Cobbs, 1993).
Although the ADHD construct has become increasingly cognitive in its emphasis (moving from the more
behaviourally descriptive “hyperkinetic” terminology),
the diagnosis continues to rest exclusively on reports of
behaviourandinferencesaboutunderlyingprocesses.
Although parents or teachers may
be asked whether a
child “has difficulty in sustaining attention”, no performance-basedmeasuresofsuchcapacitiesarerecommended in the latest DSM revision (American Psychiatric
Association, 1994).
Although clearly problematic, this reliance on report
and inferencereflects bothourapparentlyacute
sensitivity tothedirection,intensity,andlimitationsin
1065
1066
T. MANLY et al.
1990;Stametal.,1993;Tranel
& Hyman, 1990),
sustained attention (Brouwer & Van Wolffelaar, 1985;
Robertson, Manly, Andrade, Baddeley, & Yiend, 1997;
Rueckert & Grafman, 1996; Rueckert, Sorensen,& Levy,
1994; Wilkins, Shallice,& McCarthy, 1987), the capacity
toswitch(Owenetal.,1993)anddivideattention
(Baddeley, Bressi, Della Salla, Logie, & Spinnler, 1991)
and, of course,arangeofhigher-level“executive”
measures(Burgess
& Shallice,1996;Duncan,1986;
Shallice & Burgess, 1991 ; Wilson, Alderman, Burgess,
Emslie, & Evans, 1997).
In line with this premise of separability, Robertson and
colleagues
developedtheTestofEverydayAttention
Separation of Attentional Functions in Adults
(TEA; Robertson, Ward, Ridgeway, & Nimmo-Smith,
1994, 1996), asingle battery for adults with eight subtests
Experimentalpsychologyhaspredominantlyoperationalised attention as the systematic variation in perdesignedtomakedifferentialdemandsonsustained
formance of a single task under different “attentional
attention,selectiveattention,dividedattention,and
conditions”. For example,if people are asked to respond
attentional switching capacities.
to visual targets presented on a computer screen, then
Standardisingneuropsychologicalmeasuresrequires
theirresponsetimestoleft-orright-sidedtargetsare
that large numbers of the healthy population are assessed
broadly equivalent. If, however, they receive a useful hint in order that a given individual’s performance can
be
about where the targetis most likely to appear, then their meaningfully compared with the population mean. The
performance improves. The absence of eye movements
standardisation of theTEA also provided an opportunity
means that the visual stimulation under each condition
is
totestPosnerandPetersen’s(1990)postulationofa
identical,as
is thetaskinstructionandgoal.The
separationbetweenselectiveandsustainedattention,
difference in reaction times can therefore be interpreted as which had been developed on the basis of limited numbers
reflecting a hidden, “ top-down’’ process that modulates
of subjects in functional imaging and lesion studies, on a
detection efficiency in a particular location-attention
much larger sample of the neurologically healthy popu(Posner, 1980). In a similar way, controlling for reading
lation.Ifacommon,unitaryprocess
is thoughtto
speed and colour naming allows the conflict condition in contribute heavily to the performance on one group of
of
the colour-word Stroop task to be interpreted in terms
measures but not to another-and there are individual
selective processing and response suppression.
differences in the efficiency ofthat process-then
the
The application of such approaches to studies of adult variance in those measures should group together and
patients with acquired brain lesions, and more recently,
diverge from others.
within functional imaging studies, has enhanced underTheresultsofafactoranalysisconductedonthe
standing of the neural basis of attention and separations normalisation sample of the TEA indeed lent statistical
between different attentional systems. Reviewing across
support to Posner and Petersen’s proposal. For example,
these areas in 1990, Posner and Petersen argued for three twosustainedattentiontaskswithverydifferent
osbasiccharacteristicsofattentionfunctionswithinthe
tensible demands (one counting tones over relatively brief
brain. The first was that specific attention systems existed.periods and the other monitoring for rare targets within a
The second was that these were separable from more
10-minstream)loadedontoacommonfactorand
“basic” perceptual, cognitive, and output systems. The
divergedfromselectiveattentionmeasures.Similarly,
third was that within the attention system, specific regions
two visual search tasks had a common loading with the
and networks performed different types of operation. On Stroop colour-word task (Trenerry, Crosson, DeBoe, &
the basis of current evidence these distinct systems were
Leber, 1989), supporting the characterisation of a selecprovisionally characterised as: (a) a capacity to move
tive attention factor.
attention within space (spatial attention); (b) a capacity
to enhance the processing of particular target characterisChildren’s Attention
ticsregardlessofspatiallocation(selectiveattention);
and (c) a capacity to maintain a particular processing set
The main question that we pose in this article-and
over time (sustained attention).
whichunderpinnedthedevelopment
of theTest
of
TheseconclusionshaveimportantclinicalimplicaEveryday Attention for Children (TEA-Ch) battery-is
tions. The functional/anatomical separation
of attention
whetherthebroad
views of attentiondevelopedpresystemsfrombasicperceptionmeansthat-through
dominantlywithadultshavevalueinthinkingabout
acquired brain damage or developmental
difficulty-it is
attention and disorders of attention in childhood. Alpossible to have deficits that are exclusively or predomin- though it cannot be assumed that the processes of the
antly attentional in nature. The functional/anatomical
developingbraincorrespondcloselytothoseseenin
separation within the attention system means that-again maturity, there are potential advantages
if such links can
depending on the locus of any damage-quite different
be made.If adult models form reasonable approximation
profilesofattentionaldeficitscanbeseen,eachwith
(andpresumablyanincreasinglyreasonableapproxidifferent implications for problems in everyday life.
mation as children get older) then both assessment and
For cliniciansworkingwithadultsthishasledto
rehabilitation of attention disorders in children could
increasinglyspecific
and differentialassessments,for
benefit from the findings of adult studies.
example of spatial attention (Driver & Halligan, 1991 ;
IndevelopingtheTEA-Chouraimwastoadapt
Posner & Petersen, 1990; Wilson, Cockburn,& Halligan,
measures that had proven effective
in adult attention into
1987), selective or focused attention (Bench et al., 1993;
game-like assessment tools for use with children between
Duncan et al., in press; Pardo, Pardo, Janer, & Raichle,
the ages of 6 and 16. As with the TEA, in standardising
another’s attention, and the difficulties experienced
by
psychometristsincapturingthisconstructwithany
precision.
The fundamental problem in measuring attention
is
that,asapostulatedcentralprocess,it
is atonce
everywhereandnowhere.Theinfluenceofattention
cannot be measuredunlessaperson
is askedtodo
something. That something will inevitably involve many
other perceptual, cognitive and output systems that may
be as-or
more-influential
onperformancethanattention.
DIFFERENTIAL ASSESSMENT OF ATTENTION
1067
computerised tests of attention and general ability using
and collecting norms for a new battery we also had the
opportunity to statistically test the patterns of converSEM. In line with the predictions of this study, among
gence and divergenceinperformanceagainstabroad
106second-gradestudentstheyfoundthataunitary
model developed within the adult literature.
model of attention formed a poor
fit to the observed
However, as we can only measure attention indirectly
variance,whileathree-factormodel
of sustainedattention, selective attention, and“ central capacity” formthis is a somewhat ambitious aim. As children
will vary in
manyabilities(motorskill,taskcomprehension,laned a significant and parsimonious fit.
The final approach that we describe here is to examine
guage,and so on)thatmaybeshared
betweentests
theperformanceofaclinicalgroupontheTEA-Ch
hypothesised to make different attention demands, our
battery and other measures. Although the etiology and
postulated attention factors would have to be expressed
very stronglyto be seen amid this “noise”. Such problems unitary nature of ADHD remains controversial, there is
some convergence on frontal abnormalities that may be
of “task impurity” have been held to account for the
more pronounced within the right hemisphere (Barkley,
generally IOW correlations observed between executive
Grodzinsky, & DuPaul,1992b;Brumback
measures in adulthood (Burgess, 1997; Miyake et al., in
& Staton,
1982;Castellanosetal.,1996;Filipeketal.,1997;
press). As developing children may be expected to show
&
greater variability along these nonattentional dimensions, Heilman,Voller, & Nadeau, 1991; Lou, Henriksen,
Bruhn, 1984; Swanson, Castellanos, Murias, LaHoste,&
the challenge may be much greater than with adults.
& Heilman,1988).Inadults,
The first approach to meeting this challenge was in the Kennedy,1998;Voeller
rightprefrontalfunctionhasbeenassociatedwitha
design of the tests. We aimed
to minimise the demands on
number
of
functions
including
sustained
attention
memory’, reasoning, task comprehension, motor speed,
(Cohen & Semple, 1988; Cohen, Semple, Gross, King, &
verbal ability, and perceptual acuity while maintaining
Nordahl, 1992; Lewinet al., 1996; Pardo, Fox,
& Raichle,
the demands on the targeted attentional system. T o this
end, for example, we controlled for motor speed on a
1991; Rueckert & Grafman, 1996; Wilkins et al., 1987)
visual search task by comparing performance under high and response inhibition (Garavan, Ross, & Stein, 1999).
Consistentwiththis
view-and
withlinksbetween
andlowattentionaldemands
(see Methodssection).
children’s and adults’ attention-previous
A D H D stuWhere possible, language was avoided in the stimuli or
dieshaveemphasisedpoorperformanceintasksof
the required responses and the perceptual demands were
; Douglas, 1972 ;
reduced to detection rather than complex discrimination. sustainedattention(Barkley,1997
Hooks, Milich, & Lorch, 1994; Shue & Douglas, 1992)
Demonstrations and practice trials with correction were
and response inhibition (Barkley, 1997; Barkley, Grodused to reduce the impact of task comprehension differzinsky, & DuPaul, 1992a; Logan, Schachar,& Tannock,
ences andtotryandimprovethe
reliabilityofper1997; Swanson et al., 1998).
formance.
In the first study presented we
here
describe the patterns
Such attempts can only ever have limited success. The
ofperformanceseenin293healthychildrenonnine
secondapproachtominimisingtheimpactof“task
subtests of the novel TEA-Ch battery. We report the
impurity”wastouseStructuralEquationModelling
reliability of the assessments, the relationships between
(SEM) in our analysis. This technique
is related to the
the TEA-Ch and
existing tests ofattention (in addition to
more conventional exploratory factor analysis method
IQ and scholastic attainment tests), and the relative fits of
buthasimportant
differences. Inconventionalfactor
aunitary
vs. theoreticallyderivedthree-factorSEM
analysis,themodelisdeterminedina“bottom-up”
fashion from the data.SEM allows one to test an a priori model of separable attention processes. In the second
study we will examine the performance of
24 children
specified model against the observed variance.
with a diagnosis of A D H D .
If one takes results from three very different tests that
are theoretically designed to tap a common underlying
process, then that process should
be better represented by
the covariance between the tests than the variance in any Study l : Normative Data and Structural Equation
Model
specificmeasure-particularly
if the “peripheral” featuresofthetestsdiffer.Itisthereforepossibleto
Method
differentiate between the hypothesised “latent variables”
of the model and the “manifest variables” of each of the Participants. A total o f 293 children between the ages of 6
and 16wererecruited
fromstate
schools in Melbourne,
measures.ElegantSEMapproachestoexecutiveand
Australia. Equal numbers of boys and girls were tested ineach
attentionalprocessesinadultsaredescribedin,for
of six age-bands, band 1 = 6-7 years, 2 = 7-9 years, 3 = 9-1 1
example, Burgess, Veitch, Costello, and Shallice (2000)
years, 4 = 11-13 years, 5 = 13-15 years, and 6 = 15-16 years
and in Miyake et al. (in press). In a study that has only
(the second digit in each range reflecting higher cutoffpoint for
recentlybeen
drawntoourattention,Shapiroand
the band). Exclusion criteria were: previousheadinjury
or
colleagues (Shapiro, Morris, Morris, Flowers, & Jones,
neurologicalillness;developmentaldelay
or sensory loss;
referral forattentional or learning problems; assessment as
1998)examinedthepatternsofchildrenperforming
having special educational needs.
The sex and age distribution of the sample are presented in
Table 1 below. Socioeconomic status (SES) was determined for
By reducing memory demands we mean, for example, limiting
each child using the Daniel’s Scale of Occupational Prestige
the number of target items that need to be remembered, using
(Daniel, 1983) on which parental occupation is rated between 1
demonstrationand practice to make instructions easier to
and 7, with a score of1 reflecting highand a score of7 indicating
remember, and making minimal call on previous knowledge.
low SES. The mean SES coding for the group was 4.04 (SD =
There is,however, considerable blurring betweenprocesses
1.23; range = 1.7-6.6).
ascribed to “workingmemory”, particularly in the central
A subgroup of 160 children selected at random from the full
executive component,andattention
(Baddeley,1993).As
sample (meanage = 10.80, SD = 2.83, range = 6.14-15.96)
described below, a number of the TEA-Ch measures clearly
were also assessed on four subtests of the WISC-111 and the
make demands on this form o f on-line information processing
Wide Ranging Achievement Test (Revised) (Jastak & Wilkinand manipulation capacities.
1068
MANLY
Table 1
Distribution of Boys andGirls
byAgeBand
Normative Sample of the TEA-Ch Battery
Age band
Total
(1) 6-7”
20
(2) 7-9
29(3) 9-1 1
30(4) 11-13
25(5) 13-15
13(6) 15-16
147
Total
26
38
56
54
58
58
29
293
T.
et al.
in the
Girls
Boys
18
30
Upper cutoff of each band (e.g. only children under 7 years
would appear in band 1).
son, 1984). This group did not differ from theremainder of the
sample in terms of age (1 = 0.67.p = .51), sexdistribution ( x z =
1.51, p = .22) or SES ( 1 = 0.20, p = .84).
A subgroup of 96 children also completed the colour-word
Stroop, the Trails
Test, and the Matching Familiar Figures Test
(see measures below).The mean age ofthis subsample was 11.04
years ( S D = 2.92, range = 6.14-15.96). Again this group was
representativein terms ofage ( t = -0.06, p = .95) and sex
distribution (x’= 0.17, p = .68). Although the subsample
tended to be from slightly higher socioeconomic groups, the
difference did not reach statistical significance (mean SES for
subsample = 4.26, S D = 1.29; mean SES for remaining sample
= 3.94, S D = 1.20; 1 = - 1 . 8 2 , =
~ .07; see below for influence
of SES on TEA-Ch performance).
Measures
The Test of Everyday Attention.for Children (TEA-Ch):
Sustained attention subtests.
(1) Score! Sustained attentionrequires the active maintenance
ofa particular responseset underconditions oflow environmental support (e.g.when there are few triggers to the
relevant behaviour, when the task lacks interest or reward).
The Score! subtestis a 10-item tone-counting measure based
on a task originally described by Wilkins et al. (1987). In each
item, between 9 and 15 identical tones of 345 ms arepresented,
separated by silent interstimulus intervals of variable duration
(between 500 and 5000ms). Children were asked to silently
count the tones (without
assistance from fingers) and togive the
total at the end-as if they are “keeping the score by counting
the scoring sounds in a computer game”.
If a child wasunable to count to15 or was unable to pass two
practice trials (with relatively few tones) the test was not given.
The requirement to pass practice items as a way of ensuring
task
comprehension, checking on possiblesensoryproblems
and
improving the reliability of the measures, was a feature of each
of the tasks. The duration of the test was approximately 5 min
40 S (some variability occurring dueto the need to repeat
instructions and so forth).
In their 1987 study, Wilkins and colleagues reportedthe
sensitivity of an analagous task to focal right frontal lesions.
Subsequent work with adults using the clinical version in the
Test ofEveryday
Attention (Elevator Counting subtestRobertson et al., 1994) has shown that right-hemisphere strokes
disproportionatelyimpair performance (Robertson, Manly,
Beschin, et al., 1997).Similarmeasureshave
also produced
predominantly right frontal activation in healthy adult participants infunctional imaging studies (Lewin et al., 1996; Pardo et
al., 1990).
(2) Score D T . Stuss, Shallice, Alexander, and Picton (1995)
have argued that in sustained attention tests, the low level of
exogenous activation for the goalrelevant schema (listening to
the test, counting etc.) made it vulnerable to possible competitors forprocessing resources. In conventional tone-counting or
vigilance tasks, the natureof the competitorswill vary with the
individual andenvironment.The
Score DT measure was
designed to increase the sensitivity of the basic Score! task by
including a “built-in” distractor. The tone-counting aspect of
thetask is identical tothat ofScore!described
above.In
addition, meaningful, auditory speech-in the form ofnews
bulletins-was simultaneously presented.
Children were askedto keep acount of the toneswhilst at the
same time keeping “an ear out”for the mention of an animal
during the news broadcast. They were asked to “concentrate
most on the counting. Ifyotr concentrate toomuch on the news, the
counting i s very dificult”.
Two practice items were given beforethe I O items of thetest.
Test duration was approximately 5 min 40 S .
(3) Code Transmission. Vigilance tasks, in which people are
asked to monitor a stream of information for the occurrence of
a rare target, have been predominantly used
in the study of
sustained attentioninboth normal and clinical populations
(Koelega,1996; N. H. Mackworth, 1948: J. F. Mackworth,
1970; Parasuraman,Warm, & See,1998;Rosvold,Mirsky,
Sarason, Bransome, & Beck,1956;See,1995).
Although a
disproportionate decrement in performance over time is often
considered the hallmark ofasustained attention deficit, the
value of this measure in clinical
groups has beencalled into
question (Manly & Robertson, 1997;Stuss et al., 1989;Van
et al., 1987).In
Zomeren & Ven den Burg,1985;Wilkins
particular, ithas been argued that suchanalysis may miss
fluctuations in attention over much briefer time-scales (Stuss et
al., 1989), and that, as performance on simple detection tasks
becomes more routine orautomated with practice, the demands
on anterior attentional circuits can actually be reduced (Fisk &
Schneider, 1981 ; Paus et al., 1997; Robertson, Manly, Andrade,
et al., 1997). Findings of impaired “vigilance level” performance in adult brain-injured patients at any stage within such
tasks have. however, been ubiquitous (Brouwer & Van Wolffelaar, 1985; Godefroy, Cabaret, & Rousseaux, 1994; Loken,
Thornton, Otto, & Long, 1995;Ponsford & Kinsella,1992;
Rueckert & Grafman, 1996; Spikman, Van Zomeren, &
Deelman, 1996; Whyte, Polansky, Fleming, Branch-Coslett, &
Cavallucci, 1995).
The CodeTransmission subtest is an auditory vigilance-level
measure. The childrenwereasked
to monitor astreamof
monotonous digits (presented at a rate of one every 2 S) for the
occurrence of aparticular target sequence (e.g. 5 5)and then to
report the digit that occurred immediately before. The target
sequence was constant throughout the test.
Following a practice sequence to ensure comprehension, 40
targets were presented over the 12 min of the task.
(4) Walk Don’t Walk. This measure was adapted from the
Sustained Attention to ResponseTest (SART; Robertson,
Manly, Andrade, et al., 1997). The SARTwas designed to place
emphasis on maintaining attention over one’s own actions and
to avoid some of the problems of more automatic responding
described above. The SART has proved sensitive to traumatic
brain injury (Robertson, Manly, Andrade, et al., 1997) and to
predict the reports of everyday “ action lapses” in clinical and
normal populations (Manly, Robertson, Galloway, & Hawkins,
1999; Robertson, Manly, Andrade, et al., 1997). Although the
task requires the periodic and unpredictable withholding ofthe
routine response, behaviouraland electrophysiological evidence
suggest that theactive maintenance ofattention across the task
is a strong determinant of the success of response suppression
(Manly et al., 1999, 2000).
In the Walk Don’t Walk subtest, children are given an A4
sheet showing “paths” each made up of 14 squares. They are
asked to listen to a tape thatwill play one sound (go tone)if the
move to the next square should be made and another (no-go
tone) if not. The moves were made by “dotting” each square
witha marker pen, the penbeingheldapproximately2cm
above the page between each tone.
The go and no-go tones were identical for the first 208 ms
(329.6 Hz sine tone), the no-go tone being marked bya
concluding vocal exclamation (” D’oh ! ”). The task therefore
ideallyrequiredchildren to listen to the entire soundbefore
making their response. The go tones
were presented in aregular,
DIFFERENTIAL ASSESSMENT OF ATTENTION
1069
Figure I. Stimuli for the Sky Search and Sky Search
DTsubtests of the TEA-Ch with EWO targetscircled. Children are asked to search
for pairs where two spacecraft are the same.
rhythmic fashion with the no-go tone occurring unpredictably
within the sequence {between the 2nd and 12th steps). Intertone intervals began at 1500 ms for item 1. Although held
constant within each item, the intervals weresystematically
reduced with each new item, reaching a minimum of SO0 ms at
item 20.
Two demonstration trials and two practice trials were given
before the test items. The dependent variable wasthe numberof
items correct outof 20. The total durationof the test items was
approximately 6 min 16 S.
TEA-Ch:Selccliw arremtion measures.
The colour-word Stroop task has frequently been used as a
paradigmatic definition of (nonspatial) selective attention, for
example, in adult functional imaging studies (Bench
et al., 1993;
George et al., 1994; Pardo et al., 1990). In children as young as
6, where differenoes in readingability may be considerable, this
task may be less appropriate. Following the common loading
with the Stroop task intheadult TEA factor analysis, we
therefore adopted twononlinguisticvisualsearch
tasksto
represent this factor.
( I ) Sky Search. In this measure the children were given a
laminated A3 sheet depicting rowsof paired spacecraft (see Fig.
I). Four distinctive types of craFt were presented, with most
pairs being of mixed type. They were instructed to try and find
aIl of the target items, defined by a pair of identical craft, as
quickly as possible. Twenty targets were distributed among 108
distractors. Termination of the task was self-determined with
the child marking a box in the lower left corner when they had
finished. Both speed and accuracy were emphasised. Prior to
completing the main test,children first completed a practice A4
sheet to ensure Comprehension of target identity and the selfcompletion procedure.
In order to control for differences that are attributable to
motor speed ratherthan visual selection, the childrenthen
completed a motor controlversion of the task.The A3 stimulus
sheet was identical to that of the SkySearch test with the
exception that all ofthe distractor items were removed (see Fig.
2). The task therefore consisted of circling all 20 target items as
quickly as possible and then indicating completion.
Time taken to comptetion and accuracy were recorded for
each part of the test. A time-per-target score was calculated
of the "motor control" timeItimeJtargets found). Subtraction
per-target from the more attentionally demanding Sky Search
time-per-item produced an "attention score that was relatively
free from the influence of motor slowness or clumsiness. The
time required for this test clearly depends upon thespeed of an
individual child. The mean time spent on the test item for this
sample was 84.7 S (SO = 39.25) (see results For changes with
'I
W).
(2) Map Mission. A potential confound withinthe Sky Search
task is the influence of strategic differences due to the requirement to self-determinewhen the task is complete. A
further"timed-out"
visualsearchmeasure
was therefore
incorporated into thebattery. In the Map Mission, the children
weregiven a printed A3 laminated city map. Eighty targets
(small restaurant knife-and-fork symbols measuring 4 m m x
3 mm) were randomly distributed across the map. Distracting
symbok of a similar size (depicting Supermarkettrolleys, cups,
and cars)were also present. The children were instructed to
find and circle with a pen as many target symbols as possible
within 1 m i n u t e a period in which the detection/marking of
all 80 targets would be extremely unlikely. The score was the
nurnkr of targets correctly marked.
TEA-Ch: Attmtional confro/.
(1) Crearurc Counting. Switching from one task or mental set
to another is almost invariably associated with a temporary
a transitory loss of efficiency (Rogers
slowing, which may reflect
& Monsell, 1995). Clinically, the capacity to switch attention
has often been tested using complextasks such as the Wisconsin
Card Sorting Test (Heaton, Chelune, Talleg, Kay, & Curtiss,
T. MANLY et al.
I070
Figwe 2. Sky Search motor control stimulus sheet. The stimulus sheet is identical to the visual search version, save for the removal
of distracfors.
Figwe 3.
Item from the Creature Counting subtest.
1981, 1993), which require many other capacities. The Visual
Elevator subtestof the TEA simplified these demands by using
explicit cues as towhen to switch setand which set to switch to.
This was the model for the Creature Counting subtest in the
current battery.
On each page of the Creature Counting stimulusbooklet, a
variable number of “creatures” were depicted in their burrow
(see Fig. 3). Interspersedbetween the creatures were arrows
either pointing up or down. The children were asked to begin
counting the creatures from the top down butto use the arrows
as a cue to switch the direction of theircount. A correct
response to the item shown in Fig. 3 below would therefore be,
“ I , 2 (up arrow) 3,4,5,6(down arrow) 5 4 (up arrow) S 6 7 8”.
The children’s ability to count up to and down from E5 was
assessed prior to beginning the test.Followingtwopractice
items on whichfeedback was given, the childrencompleted
seven test items. The accuracy of the response and the time
taken to compbete the page were recorded.
If children scored 3
or more items correct, a timing score was calculated (seconds-
per-switch) by dividingthe time taken to complete correct items
by the number of switcheswithin those items.Again, the
duration orthis test varies with thespeed of the child, but would
usually be approximately S min.
(2) Opposite Worlds. Deficits in the inhibition of a verbal
disorders (Georgiou
response have been noted in developmental
et al., 1996) and in adults with acquired brain lesions (Burgess
& Shallice, 1996, 1997).
I n investigating verbal inhibition in children, Passler, Isaac,
and Hynd (1985) used a set of dark and light stimulus cards.
Children were asked to respond “night” to the light card and
DIFFERENTIAL ASSESSMENT OF ATTENTION
F!gur.c 4.
1071
Item from the Opposite Worlds subtest.
“day” to the dark card, this being viewed as a reversal of the
most automatic or congruent response. The incongruent condition indeed took longer to complete than a congruent version.
Using more explicit stimulus-verbalresponseassociations,
Gerstadt, Hong, and Diamond(19941, adapted this task using
pictures of the moon and the sun.In the Opposite Worlds task.
the aim was to make the association as explicit as possible by
using the digits 1 and 2 as the stimuli and the words “one” and
two” as the response options.
In the task the children were presented with a stimulus sheet
showing a mixed, quasi-random array of the digits 1 and 2 (see
Fig. 4). In the “Sameworld“ conditionthey were asked to read
out the digits aloud as quickly as possible in the conventional
manner. The purpose of theSameworld condition was to
reinforce the “prepotent” set of naming the numbers in the
conventional manner in the context of the test materials, and
also to identify any unexpecteddifficulties a child may experience with the task. In the “Oppositeworld” condition they
were asked to say the opposite foreach digit (“one” for 2 and
‘*two” for 1) as quickly as possible, inhibiting the prepotent
verbal response.
In the task, the examiner pointed to each digit in turn, only
moving onto the next when a correct response was given, thus
turning errors into a rime penalty. Following practice in each
condition, four test pages were run in the order; Sameworld.
Oppositeworld, Qppositeworld, Sameworld. The time taken to
completeeach condition was recorded. Total time for the
Oppositeworld condition was taken as the dependent variable.
The average time spent on the test items in this study was 24.2 S
(SD = 8.99) for the Sameworld and 30.67 (SD = 1 1.86) for the
Oppositeworld.
TEA-Ch:D u d task memure.
(1) Sky Search DT. Performance decrements under dual task
conditions tend toform sensitive measures o f neuroIogical
impairment (e.g. Baddeley et al., 1991; Stuss et al., 1989). The
TEA combined two of its subtests to form a dual task measure
and this model was adopted here.
En the Sky Search DT test children were asked to complete a
parallel version of the Sky Search Task (see Fig. l), which
differed only in the location of the targets. As they performed
the visual search they were asked
to simultaneously and silently
count the number of tones presented within each item of an
auditory counting task, giving the total at the conclusion of
each item. Although the countingtask used the same stimuli as
the Score! subtest, aregular pacing of one tone persecond was
used. Following practice, the task and ltiming were initiated by
a countdown played on the tape. The test was ended and timing
stopped when the child indicatedcompletion of the visual
search component.
As it is possible that a child could completely neglect one of
the tasks, scores from both measures were incorporated into a
total score. Specifically the time taken to find each visual target
was calculated (total tirne/correctly identified targetswa).
The proportion of the counting items with correct totals was
then calculated(total itemscorrect/total itemsattemptedj ( b ) .
Poor counting performance was then used to inflate the timeper-targetscores by dividing (a) by (b). Finally, in order to
assess the decrement from single task visual search performance,
the raw time-per-target score from the SkySearchtaskwas
subtracted from this value. To take an example, a child took
89 S to complete the task during which he found 19 targets, His
time-per-target score was therefore 89/19 = 4.68. During this
time he gave correct totals to threeof the six counting items he
wa5 exposed to. His proportion correct score was therefore 3 / 6
= 0.5. Dividing the time-per-target score by this proportion
inflates his time-per-targetscore to 4.68/0.5 = 9.36. In the
original Sky Search test, his time-per-target score was 3.2 S.
Subtracting this from the dual weighted time-per-target gives
the decrement value, 9.36 - 3.2 = 6.16.
The time taken to complete this measure varies according to
the child. I n this sample the mean timeto completion was 99.3 S
( S D = 59.453.
In the factor analysis of the TEA, the analogous measure
loaded onto the sustained attention Factor.Consequently, it
was predicted that a similar relationship would be observed in
the children.
E.risting nleasurcs.
( 1 ) The colour-word S/roop. (Trenerry et al., 1989). In this
paradigmatic measure of nonspatialselective attention,the
children were first asked to name the colour of simple colour
1072
MANLY
T.
et al.
Table 2
Raw Scores on Each Subtest by Age Group
Age band
Score! (accuracy)
Score DT (accuracy)
Code Transmission (accuracy)
Walk Don’t Walk (accuracy)
Sky Search (time-per-target)
Map Mission (total time)
Creature Counting (accuracy)
Creature Counting (time)
Opposite Worlds (time)
Sky Search DT (decrement)
1
( N = 38)
Mean ( S D )
6.05 (2.32)
11.03 (3.50)
25.39 (9.81)
12.47 (4.03)
6.73 (3.03)
20.1 1 (6.38)
3.03 (2.43)
5.36 (3.56)
50.62 (15.80)
14.71 (15.37)
2
( N = 56)
Mean (SO)
7.79 (2.02)
13.70 (3.05)
31.16 (9.82)
12.98 (5.10)
5.07 (4.21)
29.95 (9.65)
4.86 (136)
5.36 (2.02)
34.49 (10.37)
5.25 (6.40)
patches. They were then asked to read a list ofcolour words. In
the condition of interest they were asked to name the colour of
ink in which words are written, with the two always being in
conflict. The measurewas the number correct within a 40-S
period.
(2) Trails Test (Spreen & Strauss, 1991). This task is thought
totap selective attention/visual search and the capacity to
switch attention. This measure has two parts. In Trails A,
children were asked to draw linesbetweencirclesrandomly
arranged on a page. Each circle contained a number and the
connection of circles should follow a rule of ascending number
sequence. In partB of the test, children were asked to join circles
based on analternating rule ofascending numbers and letters in
alphabetical sequence. The time taken to complete each measure
and the number of errors made were recorded.
(3) Matching Fandiar Figures Test ( M F F T ) . (Arizmendi,
Paulsen, & Domino, 1981). In thistest, considered a measure of
impulsivity, the children were asked to match a single stimulus
with one of six similarlooking pictures. A speed-accuracy tradeoff is generally observed whereby fast, “impulsive” responding
tends to produce more errors.
(4) Wechsler Intelligence Scale f o r Children,3rdedition.
(WISC-111;Wechsler,1991).
Four subtests from thiswidely
used measure of general intellectual function were used; two
were measures ofverbal knowledge and reasoning (Vocabulary
and Similarities) and two were measures of speeded
visuospatial
and motor function (Block Design and Object Assembly).
( 5 ) WideRangeAchievementTest-Revised
(WRAT-R).
(Jastak & Wilkinson, 1984). A measure of
scholastic attainment
in the areas of reading, spelling, and arithmetic.
Procedure
The 293 children were seenfor onesession during which allof
the TEA-Ch subtests were completed. Tests were completed in
the fixed order; Sky Search, Score!, Creature Counting, Sky
Search DT,Map Mission, Score DT, Walk Don’t Walk,
Opposite Worlds, and Code Transmission. The total duration
of testing was approximately 1 hour, although this would vary
with the amount of demonstration and practice required by
each child. There were brief opportunities to rest between tasks
as the examiner set upthe next test. Those children who
completed further measures did so at a subsequent session.
Children from the TEA-Ch retest sample were seen between 5
and 20 days after their first session.
The aim in the testing sessions was to recreate the conditions
in which most clinical testing occurs. That is, the rooms were
protected from distracting noise and visual stimulation insofar
as was possible. The auditory materials were presented using
conventional portable taperecorders (without headphones) and
3
( N = 54)
Mean ( S D )
8.78 (1.24)
16.37 (2.29)
37.52 (2.70)
15.48 (4.55)
3.71 (1.57)
42.57 (9.92)
5.37 (1.53)
4.02 (1.30)
28.81 (6.87)
1.18 (2.27)
4
( N = 58)
Mean ( S D )
8.86 (1.34)
17.31 (1.98)
36.72 (5.88)
15.57 (4.43)
3.05 (1.17)
44.50 (10.33)
5.76 (1.13)
3.52 (0.88)
24.65 (6.44)
1.58 (3.90)
5
( N = 58)
Mean ( S D )
9.48 (0.82)
18.19 (1.86)
38.16 (2.45)
16.41 (4.44)
2.80 (0.94)
50.05 (1 0.78)
5.17 (1.44)
3.24 (0.80)
22.95 (3.92)
0.98 (1.93)
6
( N = 29)
Mean ( S D )
9.48 (1.02)
18.34 (1.61)
38.31 (2.29)
17.66 (1.88)
2.34 (0.69)
56.83 (8.92)
5.52 (1.55)
2.79 (0.79)
21.75 (5.89)
1.03 (2.01)
the level was set so as to be comfortable for the child given the
particular environment.
Results
Age and sex eflects within the TEA-Ch measures. The
influence of age on performance of each of the TEA-Ch
variables was initially analysed using correlation across
the group as a whole (boys and girls). Unsurprisingly, age
exerted a significant effect for each measure (Pearson’s r
in each case being; Sky Search .58, Score! .54, Creature
Counting (accuracy) .27, Creature Counting (timing) .63,
Sky SearchD T .39, Map Mission.75, Score D T .69, Walk
Don’t Walk .50, Opposite Worlds .73, and Code Transmission S S ) , t h e p value in each case being below < .001
needed for corrected statistical significance. As can
be
seen in Table 2, the absolute difference in performance
between each age band tends to diminish in the older
groups, suggestive of a developmental plateau
and/or,
for some measures, the emergence of ceiling effects (see
below).
The TEA-Ch was designed to be appropriate for both
6-year-olds and 16-year-olds. As can be seen in Table 2,
thefirstaim
of avoiding floor effects in the youngest
group was achieved to a considerable degree.
N o child
achieved a zero score
on the Score!, Score DT, Code
Transmission, or Walk Don’t Walk subtests. Similarly,
no child failed to find any of the targets in the Sky Search
that thedemorMapTasks.In
itself,thissuggests
onstration and practice items were successful in explaining the tasks and that the perceptual demands of the tasks
were relatively insensitive to normal variation in vision
and hearing. Only on the Creature Counting subtest
were
complete failures to score observed (seven children).
Whereas the time-based measures clearly show variationthroughouttheagerange,ceiling
levelsofperformance in older children were observed on some
of the
item-based measures. Of the adolescents over the age of
15, forexample, 72 scoredatceilingontheScore!
Subtest-a measure that similarly attracts ceiling performance in most neurologically healthy adults (Robertson et al., 1996). Ceiling levels of performance were less
frequently observed in adolescents over the age of 15 on
the Score DT, Code Transmission, Walk Don’t Walk,
Creature Counting, and Map Mission tests (24Y0,37 YO,
10 YO,34 %, and 0 % respectively).
The effects of sex for the entire sample were examined
for each measure (raw scores) using ANOVA. There was
no significant difference between the performance of the
DIFFERENTIAL ASSESSMENT OF ATTENTION
1073
Table 3
inTable3.Wherestrong
ceilingeffects
undermined
correlationalanalysis,percentageagreement
in raw
scores between time l and 2 are shown.
Validity. As discussed above, the first indication that
children were able to understand and to perform the basic
tasks of the TEA-Ch subtests comes from the accuracy
data. With the exception of the Creature Counting subtest
(where seven of the children
failed to score at all), the
children were able to perform a t least one item of all of
the measures correctly. Further confidence regarding the
insensitivity of the auditory material to subtle differences
in hearing emerges from the Score
D T subtest. In this
measure, the children were asked to count tones while
listening to a “news broadcast” for the mention of an
animal. Although, as expected, performancein the tonecounting aspect of the task varied widely, over 9 0 % of
the sample correctly identified at least8 of the 10 animal
0) on this,themost
names(andnochildscored
demanding auditory discrimination task in the battery.
Relationshipto IQ. One hundred and sixty children
completed four subtests of the WISC-111 in addition to
the nine subtests of the TEA-Ch. The mean pro-rated
IQ
* * p < ,001.
of the group was 107.78
( S D = 14.2). The correlations
between WISC-111 and TEA-Ch scaled scores are presentedin Table 4 (the use of scale scores partials out the
effects of age).
147 girls and the 146 boys on any task with the exception
Itmightbeexpectedthat“cognitivecongruence”
of the Creature Counting test (timing score), where the
would lead to significant positive correlations between
boys performed moderately better than the girls (boys
even two rather disparate measures
in such a large sample.
mean switch time = 3.95 S, S D = 1.78; girls mean switch
However,only4ofthe10TEA-Chscoresshowed
time = 4.48 S, S D = 1.89; F = 5.91, p
.OS).
significant relationships to pro-ratedIQ scores (Creature
To considerdifferencesbetweenboysand
girls at
Countingaccuracy,MapMission,WalkDon’tWalk,
different ages, raw scores were compared for each age
andCodeTransmission;
r = .31, .25, .21, and.l7
band separately. Only one task, the Sky Search visual
respectively)-values
that
lose
statistical
significance
searchmeasure,producedsignificantdifferences,with
when correction for multiple correlations
is performed
girls outperforming boys in the age bands
9-1 1 and 13-1 5
(only p values of < .001 would reach corrected
signifi( F = 6.8, p < .05 and F = 5.6, p < .05, respectively).
cance).
Reliability. Test-retestreliabilitywasassessed
ona
Theresultssuggest,therefore,thattheTEA-Ch
is
random subgroup of
55childrenfromacrosstheage
assessing abilities that are not well tapped by (at least
ranges, seen between 5 and 20 days following their first
these) measures of general ability-and that additional
assessment. Pearson’s correlations between raw performassessment with such measures is far from redundant.
ance scoresat test 1 and test 2 are shown
in Table 3 below.
Convergent validity: Relationship to other measures of
attention. Ninety-sixchildrenfromthesamplecomThe verywideagerangeoftheTEA-Chsample,of
course, contributes greatly to the very strong correlations pleted additional measures of attention. As standardised
shown. As a more conservative test, correlations with agescoresforchildrenwerenotavailableonallofthese
measures,comparisonwiththeTEA-Chsubtestswas
partialled out were performed. These are also presented
Test Reliability: Test-Retest Correlations between the
TEA-Ch Subtests Repeated at Between5 and 20 Days
(Raw Correlations, Correlations with Age Partialled
Out, and Percentage Agreement in Scoresfor Measures
with Ceiling Eflects are Shown)
Pearson’s
Correlation with
correlation
age partialled
Subtest
coefficient
out/% agreement
Score!
.64***
76.2 Yo
Score DT
.74***
71.4 yo
.82***
.78
Code Transmission
Walk Don’t Walk
.73***
71.0%
.7s
Sky Search
.go***
Map Mission
.M***
.65
Creature Counting
.69***
.7 1
Accuracy
Timing
.73***
.57
.92***
Opposite Worlds
.S5
Dual Task
.81***
.8 1
Decrement
Table 4
The Relationships Between TEA-Ch Subtest Performanceand Subtests of the WISC-111
(Age-scaled Scores)
TEA-Ch subtest
IQ
Vocabulary
Similarities
Block Design
Object
Assembly
Sky Search“
Score!
Sky Search DTb
Creature Counting
Accuracy
Speed
Map Mission
Score DT
Walk Don’t Walk
Opposite Worlds
Code Transmission
.l4
.l4
.05
.IO
.l4
.05
.l4
.l2
.07
.l5
.l2
.l2
.31**
.23**
.20*
.30**
.27**
.l2
.l5
.IO
.l4
.07
.o1
.16*
.l4
,002
.03
.08
.24**
.09
.24*
.09
.18*
- .01
.25**
.l5
.2 1*
.07
.17*
-
.16*
.os
.19*
.09
.16*
-.os
.27**
.l6
.24*
.09
.l 1
Controlled score.
Dual task decrement.
* p < .05; **p < .01 (uncorrected significance levels:p < ,001 required for statistical significance
when full correction for multiple comparisons is used).
a
T. MANLY et al.
1074
Table 5
Partial correlation CoefJients (Age Partialled Out) Between TEA-Ch Measures and
Other Measures of Attention’
Other attentionalmeasures
.29**
TEA-Ch measures
Stroop
Trails
Score!
Score DT
.40***
Code Transmission
.30**
Walk Don’t Walk
Sky Search DT .31**
Sky Search
Map Mission
Creature Counting
Accuracy
Time
Opposite Worlds
.08
.l7
.23*
.l1
- .05
.40***
.31**
.31**
.31**
-.l5
.24*
A (time)
.04
.09
- .O1
.l4
.l4
.l0
.69***
Trails B (time)
.30**
.l7
.45***
.37***
.O1
.l9
.26**
.l3
.21*
.l9
MFFT errors
.28**
.40***
.20*
.22*
-.l6
.35***
.08
.25*
”For ease of interpretation low (good) time scores are scaled positively to be consistent with
high (good) accuracy scores.
h Matching Familiar Figures Test.
* p < .05; **p < .01; ***p < ,001 uncorrected significance levels; all others nonsignificant.
combined with a linear transform. The ordered residuals
made using partial correlations (age partialled out) on
were then plotted against the corresponding quantile
of a
raw scores. The results are presented in Table 5.
standardnormaldistribution.The
besttransformfor
Although correction for multiple correlations means
that onlyp values
of lessthan .OO 1 should be strictly taken
each subtest was selected by the criterion of minimising
as statistically significant, a number of patterns emerge
thenonlinearityoftheregression.Theappropriate
quantileswerethenestimatedbyapplicationofthe
that nevertheless offer some support to our characterisationoftheprimaryattentionaldemandsofeach
inverse power transform to the corresponding normal
subtest.TheSkySearchandMapMissiontasks,for
distributions. This transformation therefore reflects the
example,werecharacterisedasprimarilyselectiveatrelationship of an individual’s raw score to the mean and
tention tests. Both correlated with the superficially very
distribution of their age band
(see Yandell, 1997, Chapter
different Stroop measure ( r = .40, p < .001 and r = .31,
13).
In terms of modelling the data, this transformation
p < .01 respectively)-often
takenasaparadigmatic
definition of selective attention processes. This relationoffers further advantages in normalising the scores and
ship is unlikely to be primarily mediated by speed alone,
effectively removing the influence of age.
as the speed component in the Sky Search score was
If the TEA-Ch measures make demands on attention,
greatly reduced by the motor control manipulation (see
and attention is best thought of as a unitary factor, then
Measures). In addition, the Stroop was not significantly
themostparsimoniousmodelinaccountingforthe
related to a number of other speeded measures in the
variancewould
be asinglelatentvariable.Thiswas
TEA-Ch (Sky Search DT, Creature Counting, Opposite
investigated and found not to provide an adequatefit to
Worlds) nor, indeed, to any sustained attention measure. the data, as indicated by the significant
x2 value, x2 (27) =
95.05, p < .001.
As might be predicted given the common requirement
for speeded visual search, both Trails A and B showed
We therefore investigated whether our broad model
based on the adult literature formed a useful
fit to the
significantcorrelationswiththeSkySearchandMap
patterns of test performance seen in the children. Each of
Mission tests. These relationships were somewhat weakthe variables from the TEA-Ch battery was ascribed to a
ened in the more cognitively complex Trails
B, where
relationships with other measures, including sustained
latentattentionalvariablebasedontheirtheoretical
attention, began to emerge.
origins (see Measures). Score! Score DT, Code TransIt is of note that the Matching Familiar Figures Test,
mission, and Walk Don’t Walk were ascribed to “susoften taken as a measure of behavioural inhibition, had
tained attention” (with the Dual Task Decrement mearather low relationships with the Walk Don’t Walk and
suresalsobeingassociatedwiththisfactorgiventhe
Opposite Worlds subtests, which feature
a requirement to
results of Robertson et al., 1996). Map Mission and Sky
withholdaprepotentmotororverbalresponse.The
Searchwereassociatedwiththe“selectiveattention”
relationships were certainly no greater than with other
factorandCreatureCountingandOppositeWorlds
measures without such an obvious requirement, such as
associatedwithabroad“executive”or“attentional
the Score! or Score DT tests.
control” factor.
Fit of the adult model of attentional separability to the
The scaledscores fromthevariablesandthethree
data: Structural Equation Models. In order to produce
“latent” factors were entered into the EQS structural
a clinical measure, the raw scores of the TEA-Ch subtests equationmodellingsoftwarepackage(Bentler
& Wu,
were transformed to age-scaled scores (following con1995). The patterns observed were consistent with this
vention, e.g. Wechsler measures), these were scaled to a
model as indicated by a nonsignificant
statistic, (224)
mean of 10 and a SD of 3; range1-19. This was achieved
= 33.431, p = .lo. In addition, and particularly for large
by first analysing each subtest using a one-way ANOVA
samples, Bentler recommends the use of three incremental
(forboysandgirlsseparately)withtheagebandsas
fit measures;theComparativeFitIndex(CFI),the
factorsafterapplyingaBox-Cox(power)transform
Normed Fit Index(NFI) and the Non-Normed Fit Index
x’
x‘
1076
MANLY
T.
et al.
Table 7
Relationship between TEA-Ch Age-scaled Scores and
Age-scaled Scores,fionz the Wide Ranging Achievement
Test ( N = 160)
WRAT
TEA-CH subset
.26*
Score!
Score DT
Transmission
Code
.18* .19*
Don’t
Walk
Walk
Sky Search DT
.17*
Sky Search”
Map Mission
Creature Counting
Accuracy.l6
.22*
Speed
Opposite Worlds
Reading
Spelling
Arithmetic
.18*
.17*
.17*
.19*
.26*
.22*
.09
.l3
.l4
.l6
.27*
.28*
.33**
.l0
.l9
.l4
.17*
.IO
.l3
.06
.40*
.l8
.l4
.08
Controlled score.
* p < .05; ** p < .01 uncorrected significance levels.
Table 8
Perfornzance of 24 Boys Diagnosed with A D H D Relative
to the Nornzative (male) Sanzpk
TEA-Ch subtest
F value
P
Score!
Raw score
Age-scaled score
Score DT
score
Raw
Age-scaled score
Walk Don’t Walk
158)(1,
score
Raw
Age-scaled score
Sky Search DT
Raw decrement score
Age-scaled
score
Sky Search
score
Raw
Age-scaled
score
Opposite Worlds
score
Raw
Age-scaled score
poor predictor of TEA-Ch performance.No relationship
reached a statistical significance corrected for multiple
correlations and only one (Creature Counting) reached
uncorrected significance ( r = - .16, p < 5.0).
The correlations between TEA-Ch measures and the
Wide Ranging Achievement Test-Revised Reading, Spelling and Arithmetic scales (Jastak
& Wilkinson, 1984)
are presented in Table 7. Again, no relationship meets
statistical significance once correction for multiple correof note, however, that the
lations is applied. It is perhaps
four measures of sustained attention show the strongest
relationships with the attainment scores.
Theresultsfromthisstudyarediscussedafterthe
clinical study described below.
Study 2 : The Performance of Boys with an
ADHD Diagnosis
Method
Participants. Twenty-four boysmeetingDSM-IV
criteria
for Attention Deficit Hyperactivity Disorder weretested on
subtests of the TEA-Ch and WISC-I11 measures. The mean age
of the sample was 9.95 ( S D = 2.23). The boys were recruited
from referrals made to anOutpatient Child and Family Centre.
Diagnoses, according to DSM-IV criteria, weremade by a
Consultant Psychiatrist and ClinicalPsychologistbased
on
Conners rating scales (Conners, Sitarenios, Parker, & Epstein,
1998) supplied by the schools and two 1.5-hour assessment
sessions. Exclusions from the current study were made if there
was (a) a diagnosis of comorbid clinical or psychiatric disorder;
(b) peripheral sensory loss, physical disability, epilepsy, or
unequivocal braindamage; (c)severe adversity and/or involvement with Child Protection Agencies. The children were
seen prior to the prescription of any medication.
All but one of the children attended mainstream school (the
exception attended a Special Needs School due to behavioural,
ratherthan cognitive, difficulties). None of the group was
identified as having specific learning needs, or indeed was seen
as warranting a Statement of Educational Needs.
Measures. The boyswere administered the Score! Score
DT, WalkDon’tWalk,
Sky Search, Sky Search DT, and
Opposite Worlds subtestsof the TEA-Ch (use of the remaining
measures Code Transmission, Map Mission, andCreature
Counting was not practicable within the time available). A twotest short-form of the WISC-I11 (Sattler, 1988; Wechsler, 1991),
comprising Vocabulary and BlockDesign subtests, was also
administered.
(1, 158) = 17.5
( I , 158) = 14.8
< ,001
( I , 157) = 88.0
(1, 157) = 45.9
< ,001
< ,001
= 66.0
( I , 158) = 50.3
< ,001
< .001
(1, 157) = 14.8
(1, 158) = 5.65
< .OO 1
< .05
(I. 158) = 0.39
( I , 158) =.907
1.68
(1, 158) = 23.7
(1, 158) = 21.8
< ,001
.983 ns.
< ,001
< ,001
p values < ,001 required to reach statistical significance with
correction for multiple comparisons.
Procedure. Neuropsychological assessmentwascompleted
2 weeksbeforeanymedical
treatment wascommenced.The
same experimenter saw each participant alone. Testing took
place at home or at the clinic, and was completed at one sitting.
Test administration was completed according to the standardised procedures described above.
Results
Basic comparison with t h e normative sample. Analyses
of covariance (ANCOVAs), comparing the
A D H D boys’
results with those of
boys from the normative sample
(with age covaried), were performed on raw scores and
the age-adjusted scaled scores. TheF statistics are shown
with the corresponding p-value in Table
8 below. The
results clearly show that the
A D H D boys were significantly poorer than control boys at performing all of the
TEA-Ch measures with the exception of the Sky Search
subtest (although if formal correction for multiple comparisons is adopted, the Sky Search D T measure would
also fail to meet corrected significance levels).
Although this comparison indicates that the
ADHD
boys performed the measures more poorly than controls,
us littleaboutwhetherattentionskillswere
ittells
particularly poor in this group. The boys, for example,
alsoperformedpoorlyonothermeasureswith
less
obvious demands on attention, such as the Vocabulary
subtest of the WISC-111. To examine whether attention
represents adisproportionate problem in ADHD, children
wereselectedfromtheTEA-Chsamplewhowere
matchedtotheADHDgrouponage
and level of
performance on the WISC-111 Vocabulary subtest. It is
important to note that only age and Vocabulary scores
were used in the selection of controls-indeed, given the
poor performance of the ADHD boys on this measure,
relatively few children from the sample met these conditions ( N = 15) (see Table 9).
As can be seen in Table
9, although the groups had
almost
identical
performance
on
the
Vocabulary
measure, the ADHD children continued to showsignificantly poorer attention skills on many
of the TEA-Ch
measures. The Sky SearchD T test, which had previously
reacheduncorrectedsignificance,nolongerhadthis
DIFFERENTIAL ASSESSMENT OF ATTENTION
Table 9
Conzparison of 24 ADHD-Diagnosed Boys with 15 Age and WISC-III Vocabulary
Matched Controls
Vocabulary controls
ADHD group
P
n.s.
Age
WISC-I11
n.s. Vocabulary
(2.78) score
5.42
(2.13)
5.53
.96
(2.80)
9.53 Design Block
TEA-Ch
Score
(3.66)
!
7.08
(3.09)
10.47
Score DT
(2.79)
4.9610.13 (3.68)
(2.86) 4.79 Walk
(3.31)Don’t
9.33 Walk
Search Sky
DT (3.85) 6.04 (5.36) 7.87
(3.22)
8.93
Search
Sky
Opposite Worlds
(3.65) 9.73
1.54)
1077
10.46
< .05
< .01
< ,001
< ,001
9.67 (4.00)
6.75 (4.21)
n.s.
n.s.
< .os
p values < ,001 requiredto reach statistical significance withcorrection for multiple comparisons.
Table 10
Performance of a Group of 24 ADHD Boys Compared with Control Children Matched
on WISC-III Block Design Subtest Scores and Age
Design
Block
controls
ADHD group
P
9.99
n.s.
Age
WISC-I11
7.09
Design
Block
(4.09)
9.41 Vocabulary
TEA-Ch
Score!
Score DT
Walk Don’t Walk
Sky Search DT
Sky Search
Opposite Worlds
(2.78)
5.42
< .001
9.05 (2.77)
.05
(3.66)
7.08
(2.79)
4.96
< ,001
9.36 (3.19)
< ,001
(2.86)
4.79
8.76 (3.35)
7.33 (3.45)
(4.27)
5.46
,116
10.09 (2.76)
.68
(4.00)
9.67
< ,027
(4.21)
6.75
9.19 (2.66)
p values < ,001 required to reach statistical significance withcorrection for multiple comparisons,
capacity.Thedifferencebetweenthegroupsofthe
Opposite Worlds measure would now also disappear if
full correction for multiple comparisons is adopted.
As a final, and more conservative test of the specificity
of attentional dysfunction within the group, the A D H D
boys were matched with controls on the basis of age and
WISC-111 BlockDesignscores.Thisisaconservative
comparison because, as with a numberof measures from
theTEA-Ch,the
BlockDesigntestrequires
a fast
performanceand,incommon
withsomeaspectsof
attention, is thought reflect
to
efficiency ofpredominantly
right hemisphere functioning (Lezak, 1995).
Twenty-two children from the normative sample met
the age and Block Design performancelevel criteria. The
comparisons on TEA-Ch subtests, presented in Table
10,
show significant and disproportionate deficits on three of
the sustained attention factor measures (Score!, Score
DT,andWalkDon’tWalk)andontheattentional
controlmeasure,OppositeWorlds.Ifcorrectedfor
multiple comparisons, however, only the Score DT and
WalkDon’tWalkmeasures,bothfromthesustained
attentionfactor,wouldcontinuetoreachstatistical
significance.
Discussion
ThesubtestsoftheTEA-Charenotmeasuresof
attention.Theyaremeasuresofauditoryandvisual
detection, of counting, of response speed, and so forth.
Separableattentionprocessesareinferredconstructs
believed to contribute significantly to differences in the
efficiency of performance on these tasks. By simplifying
instructions,usingpracticesessions,andreducingthe
contribution of perception, memory, and reasoning, our
aim was to minimise variability due to nonattentional
factors.
The results from293 children from the normal schoolage population give some grounds to believe that these
aims were met to a reasonable degree. For all but one of
the tasks, all of the children-even as young as 6-were
able to perform least
at
one item correctly. Taken together
with the mean levelsof performance (shown in Table
2), thisindicatesthatthebasiccomprehensionand
perceptual demands were met. In the case of the Score!
subtest, for example, the children’s task was to maintain
a count of the number of identical sounds that they heard
within the period of each item. Over 90% of the sample
gave correct totals for 5 or more of the 10 items. As a
basic capacity to count up to15 was assessed prior to the
task, and the sounds must have been detectable, errors
wouldseemtostemfromadifficultyinvoluntarily
maintaining“one’smind”onthis
verytediousactivity-in other words, sustained attention’ (cf. Wilkins
et al., 1987).
The nonsignificant relationships between the TEA-Ch
It is a difficult conceptual and clinical question to disambiguate
poor attention from poor motivation-perhaps most
particularly in dull sustained attention tasks. The reliabilityofthe
measures rather argues in favour of a “can’t do” account-in
that motivational (“won’t do”) factors may be more volatile
from one day to another. However, in practice a difficulty in
maintaining attention to an unrewarding task,from either
source, may have similar functional consequences.
1078
T. MANLY et al.
functions, the conceptual gulf between tests and the real
measures and conventional WISC-111 IQ tasks (at least
within the range we assessed) provide additional support
worldcan be substantial.Inthestandardassessment
for the relatively focused nature of the tasks and for the
setting, the examiner acts to focus the child’s attention on
the material, provides clear instructions as to what
is
value of separate assessment of attentive functions.
Tests of executive function in adults (particularly those expected, is suitably encouraging, and attempts to protect
that stress novelty) can be inherently unreliable (Burgess, theenvironmentfromexternaldistractors.Thesefeatures, together with the relative novelty of the materials,
1997; Wilson et al.,
1997)-indeed, it has been argued
are important in making a reasonable comparison bethat frontal/dysexecutive difficulties can themselves
be
tween different children. It is important to ask, however,
thought of as a deficitin the reliable application of
whether a child’s performance under these conditions has
strategy,attention,orbehaviouralcontrol(Rabbitt,
anybearingontheirbehaviourinacrowded,noisy
1997). In this sense, the poorest
level of performance seen
classroom,inthecacophonichome,orwhentheininachild-whether
ornotitcanberepeatedlyobserved-may be informative. However, given the influformation that is relevant and the nature of the goal are
ence of factors with day-to-day variation (noise, mood,
not clearly specified? Clearly the best way of assessing
other preoccupations and so forth), clinically it is useful
whether such difficulties occuris to ask teachers, parents,
to have a sense of the stability
of
a measure.
In this respect orthechildrenthemselves.In
accounfing forsuch
the predictive value of TEA-Ch scores from one session
problems, however, consideration of particular cognitive
toanotheraresurprisinglygoodalthough,giventhe
deficits,inconjunctionwithemotional,social,and
rapiddevelopmentofabilitiesseenintheyounger
environmentalfactors,may be crucial in selectingthe
most appropriate form of support.
children, such reliability can only provide a short-range
One group of children who,by definition, are reported
forecast.
to experience difficulties in these everyday situations are
Given that underlying attentional processes do conthose diagnosed with ADHD. In the second study, the
tribute to performance on the measures, itis possible to
performance of such children on the TEA-Ch measures
ask whether this looks like the footprint
a single
of system
under standard testing conditions was examined.
(say, efficiency of “top-down’’ control) or, as suggested
diagnosis ofA D H D
Twenty-four boys with DSM-IV
a
by Posner and Petersen (1990) among others, like the
(who were not yet prescribed medication) showed signifiinfluence of different systems performing different types
cant deficits across sustained attention and attentional
of attention process.
control subtests of the TEA-Ch but, notably, no deficit
Using the SEM approach, thesingle system model did
onthespeeded-visualsearchtask.Giventhepoor
not form a good fit to the data. Usinga broad three-way
division into sustained and selective attention and execuperformanceofthegrouponarangeofmeasures,
tive orattentionalcontrolbasedonadultmodels,
includingvocabulary,thiscomparisondoeslittleto
indicate the specificity of attentional dysfunction within
however, did.
The results showed that the fit of this model was not
the group. More conservative comparisons with children
significantlydifferent
fortheolderandtheyounger
who were matched on both age
andprrformance levels on
WISC-111 subtests revealed persistent deficits. The results
children. This suggests that despite the relative immaare consistent with previous findings that have emphaturity of these capacities, the differential nature of the
processesisstillsufficientlyexpressed
to be detected
sised both a sustained attention deficit and a difficulty in
across the tasks.
the suppression of prepotent responses (Barkley, 1997;
It remains important to see whether this fit emerged
Barkley et al., 1992b; Douglas, 1972; Hooks et al., 1994;
from “peripheral” aspects of the tasks that are of little
Logan et al., 1997; Shue & Douglas, 1992; Swanson et
relevance tothepostulatedattentionalfactors.It
is
also consistentwith
viewsof
a
al.,1998).Theyare
certainly true, for example, that the sustained attention
neurological basis to the ADHD disorder-which have
tests tended to be based on summed item correct scores
identifiedabnormalitiesincludingwithinrightfrontal
and (consequently) are more vulnerable to ceiling effects systems.
than the selective attention tasks. The use of the ageThere are important questions about the representascaling technique (on which the model is based), however,tiveness of our ADHD sample. In particular, although
considerably reduced the impact of this factor and the
comorbid diagnoses are very common
in A D H D , chilskew and kurtosis of the sustained attention scores
were
dren with comorbid diagnosis were excluded from our
study. Our aim, however, without wishing to over-reify
unremarkable.
thediagnosticcategory,wastoexaminethe“pure”
Otherfactorssuchastherequirementforspeeded
responses, or linguistic responses, can alsobe excluded to
effects of A D H D a s a basis for subsequent evaluation of
a degree. The use of the “motor control” task in the
Sky
the effect of comorbid and other factors. Whether such
Search test, for example, resulted in the speed contribuchildrenwouldshowsimilarprofilesontheTEA-Ch
tions to the two
selective attention tasks being rather
remains an open question. A second important issue in
different. Verbal responses were required in the sustained this respect concerns the rather poor performance of the
attentionandattentionalcontrolmeasures.Further
group on WISC-111 measures, compared with a number
supportive evidence emerges from the relationships beof other reported ADHD samples. Although our comtween the TEA-Ch and other measures of attention. As
parison indicates that specific deficits in attention still
are
with healthy adults (Robertson et al., 1996), the colourapparentwhen we control for WISC-111 performance
word Stroop showed the strongest relationship to mealevels, furtherwork is againrequiredtoexaminethe
sures of selective attention with very different “surface”
pattern in ADHD children who
enjoy higher levels of
characteristics-and relatively
poor relationships to susgeneral performance.
tained attention measures.
Anderson and colleagues (Anderson, Fenwick, Manly,
The central aim of clinical assessment is to predict and & Robertson, 1998)havepreviouslyreportedonthe
account for difficulties that may arise within everyday
TEA-Chperformance of childrenwhohadsustained
life. Perhaps most particularly for attention executive
and
closed head injuries an average of 6 years prior to the
DIFFERENTIAL ASSESSMENT OF ATTENTION
assessment.Althoughclosedheadinjuriesdisproportionately compromise frontal/temporaI functions, damage to a wide range of cortical and subcortical structures
is possible (Mattson & Levin, 1990). As a group, these
childrenshoweddeficitsacrosstherangeofTEA-Ch
measures including the selective attention factor relative
to a control group (matched on both age and WISC-111
BlockDesignsubtestperformance).Althoughfurther
work is clearly required to look at a range of disorders,
of differentially
theseearlystudiesindicatethevalue
assessingattentionalfunctions.Perhapsmostimportantly, in adults the assessments of separable attentional
function has led to improved targeting and effectiveness
inrehabilitativeinterventions(e.g.Robertson,Tegner,
Tham, Lo, &L Nimmo-Smith, 1995; Sturm, Willmes,
Orgass, & Hartje, 1997). It is tobehopedthatthe
extension of suchmeasuresforchildrencouldprove
similarly effective-both in rehabilitation and in assessing
the specific effectsof pharmacological interventions.
Acknowledgements-We are grateful to the Universityof
who
Melbourne andthe U.K. MedicalResearchCouncil
supported this research. Our thanks also to Mick Wilson,Sarah
Jones, and theThames Valley TestCompany fortheir assistance
in developingthe measure and forpermission to use examples of
stimuli from the test in Figures 1 4 . We are indebted to Rani
Jacobs, Tim Godber, and John Gora for their help with the
project, and toJulia Darling forher careful preparation of this
manuscript. Copiesof the TEA-Ch may be obtained from
www.tvtc.com
References
American Psychiatric Association. (1994). Diagnostic and statistical manualofnzental disorders (4th ed.). Washington, DC:
Author.
Anderson, V.,Fenwick, T., Manly, T., & Robertson, I. H.
(1998). Attentional skills following traumatic brain injury.
Brain Injury, 12, 937-949.
Anderson, V., & Pentland, L. (1998). Residualattention deficits
following childhood head injury: Implications for ongoing
development. Neuropsychological Rehabilitation, 8, 283-300.
Arizmendi, T., Paulsen, K., & Domino, G. (1981). The
Matching Familiar Figures Test-A primary, secondary and
tertiary evaluation. Journal of Clinical Ps-vchology, 37, 81 2818.
Baddeley, A.D. (1993). Working memory or working attention.
In A.D. Baddeley & L. Weiskrantz (Eds.), Attention:
Selection, awareness and control: A tribute to Donald Broadbent (pp. 152-1 70). Oxford: Oxford University Press.
Baddeley, A.D., Bressi, S., Della Salla, S., Logie, R., &
Spinnler, H. (1991). The decline of working memory in
Alzheimer’s Disease. Brain, 114, 2521-2542.
Barkley, R. A. (1997).Behavioral inhibition, sustained attention,and executive functions:Constructing a unifying
theory of ADHD. Psychological Bulletin. 121, 65-94.
Barkley, R. A., Grodzinsky, G., & DuPaul, G. J. (1992a). Are
tests of frontallobe functionusefulin
the diagnosisof
attention deficit disorders? The Clinical Neuropsychologist,8,
121-140.
Barkley, R. A., Grodzinsky, G., & DuPaul, G. J. (1992b).
Frontal lobe functions in attention deficit disorder with and
without hyperactivity: A review and research report. Journal
of Abnormal Child Psychology, 20, 163-188.
Bench, C . J., Frith, C. D., Grasby, P. M., Friston,K. J.,
Paulesu, E., Frackowiak, R. S. J.. & Dolan,R. J. (1993).
Investigations of the functional anatomy of attention using
the Stroop test. Neuropsychologia, 31, 907-922.
Bentler, P. M,, & Wu, E. J. C. (1995). E Q S j o r Windows;User’s
guide. Encino, CA : Multivariate Software.
1079
Brouwer, W. H., & Van Wolffelaar, P. C. (1985).Sustained
attentionand sustainedeffort after closedhead
injury:
Detection and 0.10 Hz heart rate variability in a low event
rate vigilance task. Cortex, 21, 11 1-1 19.
Brouwers, P,, Riccardi, R., Fedio, R., & Poplak, D. (1985).
Long-term neuropsychological
sequelae
childhood
of
leukemia:Correlation with CT brain scanabnormalities.
Journal of Paediatrics, 106, 723-728.
Brumback, R.A., & Staton,R. D. (1982).Anhypothesis
regarding the commonality of right hemisphere involvement
in learningdisability attentional disorder, andchildhood
major depressive disorder. Perceptual and Motor Skills, 55,
1091-1097.
Burack, J. A., Enns, J. T., Johannes, E. A., Stauder, E. A.,
Mottron, L., & Randolph, B. (1997). Attention and autism:
Behavioural and electrophysiological evidence. In D. Cohen
& F. Volkmar (Eds.) Handbook of autismandpervasive
developnzental disorders (2nd ed., pp. 226-247). New York:
Wilson & Sons.
Burgess, P. W. (1997). Theory and methodology in executive
function research. Jn P. Rabbitt (Ed.), Methodology offrontal
and executive function(pp. 81-1 11). Hove, U.K. : Psychology
Press.
Burgess, P. W., & Shallice, T. (1996).Bizarreresponses,rule
detection and frontal lobe lesions. Cortex, 32. 241-259.
Burgess, P. W., & Shallice, T. (1997). The Hayling and Brixton
tests. Bury St. Edmunds, U.K.: Thames Valley Test Company.
Burgess, P. W., Veitch, E., Costello, A. D., & Shallice, T.
(2000). The cognitive and neuroanatomical correlates of
multitasking. Neuropsychologia, 38, 848-863.
Castellanos, F. X., Giedd, J. N., Marsh, W. L., Hamburger,
S. D., Vaituzis, M. S. A., Dickstein, D. P., Sarfatti, S. E.,
Vauss. Y . C.,Snell, J. W., Rajapakse, J. C., & Rapoport,
J. L. (1996). Quantitative brain magnetic resonance imaging
in attention deficit hyperactivity disorder. Archives ofGeneral
Psychiatry, 53, 607-61 6.
Cohen, R.M,, & Semple, W. E. (1988). Functional localization
ofsustained attention. Neuropsychiatry,Neuropsvchology
and Behavioural Neurology, l , 3-20.
Cohen, R. M,, Semple, W. E., Gross, M,, King, A.C., &
Nordahl, T. E. (1992). Metabolic brain pattern of sustained
auditory discrimination. Experimental BrainResearch,92,
165-172.
Comers, C. K, Sitarenios, G, Parker, J. D., & Epstein, J. N.
(1998).Revision
andrestandardization of the Comers’
Teacher Rating Scale (CTRS-R) : factor structure reliability
and criterion validity. Journal ofAbnorma1 Child Psychology,
26, 279-291.
Daniel, A. (1983). Power, privilege andprestige: Occupationsin
Australia. Melbourne, Australia: Longman-Chesire.
Douglas, V. I. (1972). Stop, look and listen: The problem of
sustained attention and impulse control in hyperactive and
normal children. Canadian Journal ojBehavioura1 Science,4 ,
259-281.
Driver, J., & Halligan, P. W. (1991). Can visual neglect operate
in object-centred co-ordinates?An affirmativesingle-case
study. Cognitive Neuropsychology, 8 , 475496.
Duncan, J. (1986). Disorganisation of behaviour after frontal
lobe damage. Cognitive Neuropsychology, 3, 27 1-290.
Duncan, J.,Bundesen, C., Olson, A., Humphreys, G., Chavda,
S., & Shibuya, H. (in press). Systematic analysis of deficits in
visual attention. Journal of Experimental Psychology: General.
Filipek, P. A., Semrud-Clikeman, M,, Staingard, R. J., Renshaw, P. F., Kennedy, D. N., & Biederman, J. (1997).
Volumetric MRI analysis comparing subjects having attention-deficithyperactivity
disorder with normal controls.
Neurology, 48, 589-601.
Fisk, A. D., & Schneider, W.(1981). Control and automatic
processing during tasksrequiring sustained attention: A new
approach to vigilance. Human Factors, 23, 737-750.
Garavan, H., Ross, T. J., & Stein, A. (1999). Right hemispheric
1080
MANLY
T.
dominance of inhibitory control : An event-related functional
MRI study. Proceedings o f t h e National Academy of Science,
96, 8301-8306.
George, M. S., Ketter, T. A., Parekh, P.I., Rosinsky, N., Ring,
H., Casey, B. J., Trimble, M. R., Horwitz, B., Herscovitch,
P., & Post, R. M. (1994). Regional brain activitywhen
selecting response despite interference : An H2 150 PET study
Human Brain
of theStroopandanemotionalStroop.
Mapping, 1, 194-209.
Georgiou, N.,Bradshaw, J. L., Phillips, J. G., & Chiu,E.
(1996). The effect of Huntington’s disease and Gilles de la
Tourette’s syndrome on the ability to hold and shift attention.
Neuropsychologia, 34,843-851.
Gerstadt, C . L., Hong, Y. J., & Diamond, A. (1994). The
relationship between cognition and action : Performance of
children 2-7 yearsold
on a Stroop-like day-night test.
Cognition, 53, 129-153.
Godefroy, O., Cabaret, M.,& Rousseaux, M. (1994). Vigilance
and effects of fatigability practice and motivation on simple
reaction time tests in patients with lesion of the frontal lobe.
Neuropsychologia, 32, 938-990.
Hair, J. F., Anderson, R. E., Tatham, R. L., & Black, W. C .
(1995). Multivariate datuanalysis (4th ed.). Engelwood Cliffs,
NJ: Prentice-Hall.
Heaton, R. K., Chelune, G. J., Talley, J. L., Kay, G. G., &
Curtiss, G. (1 98 1,1993).Wisconsin Card SortingTest Manual.
Odessa, FL : Psychological Assessment Resources.
Heilman, K. M,, Voller, K. K., & Nadeau, S. E. (1991).A
possible pathophysiologic substrate of attention deficit
6 (Suppl),
hyperactivity disorder. Journal of Child Neurology,
S76-81.
Hooks, K., Milich, R., & Lorch, E. (1994). Sustained and
selective attention in boys with attention deficit hyperactivity
disorder. Journal o j Clinical Child Psychology, 23, 69-77.
Jastak, J. F., & Wilkinson, G. S. (1984). Wide Ranging
Achievement Test-Revised. Washington, DC: Jastak Assessment Systems.
Kaufmann, P. M,, Fletcher, J. M,, Levin, H. S., Miner, M. E.,
& Ewing Cobbs, L. (1993). Attentionaldisturbanceafter
pediatric closed head injury. Journal of Child Neurology, 8,
348-353.
Klin, A., Sparrow, S., Volkmar, F., Cicchetti, D., & Rourke,
B. P.(1995). Asperger syndrome. In B.P. Rourke (Ed.),
Syndrome o j non-verbal learning disabilities (pp. 93-1 18).
New York : Guilford Press.
Koelega, H. S. (1996). Sustained attention.In 0. Neumann
(Ed.), Handbook ofperception and action, Vol. 3. London:
Academic Press.
Lang, W., Athanasopoulous, O., & Anderson, V. (1988). Do
attentional profilesdiffer across developmental disorders?
Journal o j t h e International Neurological Society, 4,221,
Lewin, J. S., Friedman, L., Wu, D., Miller, D. A., Thompson,
L.A., Klein, S. K., Wise, A. L.,Hedera, P,, Buckley, P,,
Meltzer, H., Friedland, R.P,, & Duerk, J. L. (1996). Cortical
localization of human sustained attention: Detection with
functional MR using a visual vigilance paradigm. Journal of
Computer Assisted Tomography, 20, 695-701.
Lezak, M. D. (1995). Neuropsychological assessment (3rd ed.).
New York: Oxford University Press.
Logan, G. D.,Schachar,R. J., & Tannock, R. (1997). Impulsivity and inhibitory control. Psychological Science, 8,
60-64.
Loken, W. J., Thornton, A. E., Otto, R. L., & Long, C . J.
(1995). Sustained attention after severe closed head injury.
Neuropsychology, 9, 592-598.
Lou, H. C., Henriksen, L., & Bruhn, P. (1984). Focal cerebral
dysfunction in developmental learning disabilities. Lancet,
335, 8-1 1.
Mackworth, J. F. (1970). Vigilanceand attention:A signal
detection approach. Harmondsworth, U.K. : Penguin.
Mackworth, N. H. (1948). The breakdown of vigilance during
prolonged visual search. TheQuarterly Journal of’ Experimental Psychology, I , 6-21.
et al.
Manly, T., Datta, A., Heutink, J., Hawkins, K., Cusack, R.,
Rorden, C., & Robertson, I. H. (2000). Anelectrophyiological
predictor of imminent action error inhumans. Journal o f
Cognitive Neuroscience, 21E (Suppl), 111.
Manly, T., & Robertson, I. H. (1997). Sustained attention and
the frontal lobes. In P. Rabbitt (Ed.), Methodology qffiontal
and executivefunction (pp. 135-150). Hove, U.K.: Psychology Press.
Manly, T., Robertson, I. H., Galloway, M,, & Hawkins, K .
(1999). The absent mind: Further investigations of sustained
attention to response. Neuropsychologia, 37, 66 1-670.
Mattson, A. J., & Levin, H. S. (1990). Frontal lobe dysfunction
literature.
followingclosedhead
injury: A reviewofthe
Journal of Nervous and Mental Disease, 178, 282-29 1.
Miyake, A,, Friedman, N. P,, Emerson, M. J., Witzki, A. H.,
Howerter, A., & Wager, T.D. (inpress).Theunityand
diversityofexecutive functions and their contributions to
complex frontal lobes tasks: A latent variableanalysis.
Cognitive Psychology.
Owen, A. M,, Roberts, A. C., Hodges, J. R., Summers, B. A.,
Polkey, C. E., & Robbins, T. W. (1993). Contrasting mechanisms of impaired attentional set-shifting in patients with
frontal lobe damageor Parkinson’s disease. Bruin, 116,
1 159-1 175.
Parasuraman, R., Warm, J. S., & See, J. E. (1998).Brain
systems of vigilance. In R. Parasuraman (Ed.), The attentive
brain. Cambridge, MA: MIT Press.
Pardo, J. V., Fox, P. T., & Raichle, M. E. (1991). Localization
of a humansystem
for sustained attention by positron
emission tomography. Nature, 349, 61-64.
Pardo, J. V., Pardo, P., Janer, K., & Raichle. M. E. (1990). The
anterior cingulate cortex mediates processing selection in the
Stroopattentional conflict paradigm. Pvoccwlings of’ the
Nutional Acudemy of Science U S A , 87, 256-259.
Passler, M. A., Isaac, W., & Hynd, G. W. (1985). Neuropsychologicaldevelopmentof behaviour attributed to frontal
lobe functioning in children. Developmento1 Neuropsycholog.~,I , 349-370.
Paus, T., Zatorre, R. J., Hofle, N., Caramanos, Z., Gotman, J..
Petrides, M., & Evans, A. C. (1997). Time-related changes in
neural systems underlying attention and arousal during the
performance on an auditory vigilance task. Journal of’
Cognitive Neuroscience, 9, 392408.
Ponsford, J., & Kinsella, G. (1992). Attentional deficitsfollowingclosed-head injury. JournalofClinical and E.uperimental Neuropsychology, 14, 822-838.
Posner, M. I. (1980). Orientatingofattention. Quarterly Journal
of Experimental Psychology, 32, 3-25.
Posner, M. I., & Petersen, S. E. (1990). The attention system of
the human brain. Annual Review ofllieurosciencc, 13, 2542.
Rabbitt, P.(1997).Review
chapter. InP.
Rabbitt(Ed.),
Methodology oj:fiontal and executive function. Hove, U.K.:
Psychology Press.
Robertson, I. H., Manly, T., Andrade, J . , Baddeley, B. T., &
Yiend, J. (1997). “Oops!”: Performance correlates of everyday attentionalfailures intraumatic brain injured and normal
subjects. Neuropsychologia, 35,741-758.
Robertson, I . H., Manly, T., Beschin, N., Haeske-Dewick. H.,
Homberg, V., Jehkonen, M,, Pizzamiglio,L.,Shiel,A..
Weber, E., & Zimmerman, P.(1997). Auditory sustained
attention is a marker of unilateral spatial neglect. Neuropsychologia, 35, 1527-1532.
Robertson, I. H., Tegner, R., Tham, K., Lo, A., & NimmoSmith, I. (1995). Sustained attention training for unilateral
neglect: Theoretical and rehabilitation implications. Journal
of Clinical and Experimental Neuropsychology, 17, 4 16-430.
Robertson, 1. H., Ward, A., Ridgeway, V., & Nimmo-Smith, I.
(1994). Test of’Everyday Attention.Bury St Edmunds, U.K.:
Thames Valley Test Company.
Robertson, I. H., Ward, A., Ridgeway, V., & Nimmo-Smith, I.
(1996). Thestructure of normal human attention
: The Test of
Everyday Attention. Journal of the Internationnl Neuropsychological Society, 2, 523-534.
DIFFERENTIAL ASSESSMENT O F ATTENTION
Rogers, R. D., & Monsell, S. (1995). Costs of a predictable
switchbetweensimplecognitive
tasks. Journal of E.xperimental Psychology-General, 124, 207-231.
Rosvold, H. E., Mirsky, A. F., Samson, I., Bransome, E. D., &
Beck, L. H. (1956). A continuous performance test of brain
damage. Journal of Consulting Psychology, 20,343-350.
Rueckert, L., & Grafman, J. (1996). Sustained attention deficits
in patients with right frontal lesions. Neuropsychologia, 34,
953-963.
Rueckert, L., Sorensen, L., &Levy, J. (1994). Callosal efficiency
is
related
to sustained attention. Neuropsychologia, 32,
159-173.
Sattler, J. (1 988). Assessment of children’s intelligence andspecial
abilities. Boston, MA : Allyn & Bacon.
See, J. (1995). Meta-analysis ofthesensitivitydecrementin
vigilance. Psychological Bulletin, 117, 230-249.
Shallice, T., & Burgess, P. (1991). Deficit in strategy application
following frontal lobe damage in man. Brain, 114, 727-741.
Shapiro, M,, Morris, R., Morris, M,, Flowers, C., & Jones, R.
(1998). A neuropsychologically based assessment model
of
the structure of attention in children. Devc~lopmentalNeuropsychologJ1, 14, 657-677.
Shue, K. L., & Douglas, V. I. (1992). Attention deficit hyperactivity disorder and the frontal lobe syndrome. Brain and
Cognition, 20, 104-124.
Skuse, D. H., James, R. S., Bishop, D. V. M,, Coppin, B.,
Dalton, P,, Aamodt-Leeper, G., Bacarese-Hamilton, M.,
Creswell, C., McGurk, R., & Jacobs, P. A. (1997). Evidence
from Turner’s syndromeof an imprinted X-linkedlocus
affecting cognitive function. Nature, 387, 705-708.
Spikman, J. M., Van Zomeren,A. H., & Deelman, B. G. (1996).
Deficits of attention after closed head injury : Slowness only.
Journal o j Clinical and E-xperimentul Neuropsychology, 18,
1-13.
Spreen, O., & Straws, E. (1991). Acompendium of’neuropsychological tests. Oxford : Oxford University Press.
Stam, C. J., Visser, S. L., Op de Cod, A. A. W., De Sonneville,
L. M. J., Schellens, R. L. L. A., Brunia, C. H. M., De Smet,
J. S., & Gielen, G. (1993). Disturbed frontal regulation of
attention in Parkinson’s disease. Brain, 116, 1139-1 158.
Sturm, W., Willmes, K., Orgass, B., & Hartje, W. (1997). Do
specific attention deficitsneedspecific training? Neuropsychological Rehabilitation, 7, 81-103.
Stuss, D. T., Shallice, T., Alexander, M. P., & Picton, T. W.
(1995). A multidisciplinary approach to anterior attentional
1081
functions. Annals of the New York Academyof Sciences, 769,
191-209.
Stuss, D. T., Stethem, L. L., Hugenholtz, H., Picton, T. W.,
Pivik, J., & Richard, M. T. (1 989). Reaction time after head
injury:Fatigue, dividedandfocused
attentionandconsistency of performance. Journal of Neurology?Neurosurgery
and Psychiatry, 79, 81-90.
Swanson, J., Castellanos, F. X., Murias, M,, LaHoste, G., &
Kennedy, J. (1998).Cognitiveneuroscienceof
attention
deficithyperactivity
disorder andhyperkinetic
disorder.
Current Opinion in Neurobiology, 8, 236-271.
Swanson, J. M,, Learner, M., & Williams, L. (1995). More
frequent diagnosis of ADHD. New EnglandJournal
oj
Medicine, 333, 944.
Tranel, D., & Hyman, B. T. (1990). Neuropsychological correlates of bilateral amygdala damage. Archives of Neurology,
47, 349-355.
Trenerry, M.R., Crosson, B.,DeBoe, J., & Leber, W. R.
(1989). Stroop NeuropsychologicalScreening Test. Odessa,
FL: Psychological Assessment Resources.
Van Zomeren, A. H., & VandenBurg,W.(1985).Residual
complaints of patients twoyears after severeclosedhead
injury. Journal of Neurology, Neurosurgery and Psychiatry,
48, 21-28.
Voeller, K. K. S., & Heilman, K. M. (1988). Attention deficit
disorder in children: Aneglectsyndrome? Neurology,38,
806-808.
Wechsler, D. (1991). Wechsler Intelligence Scale for Children
(3rd ed.). San Antonio, TX: Psychological Corporation.
Whyte, J., Polansky, M,, Fleming, M,, Branch-Coslett, H., &
Cavallucci, C. (1995). Sustained arousal and attention after
traumatic brain injury. Neuropsychologia, 33, 797-8 13.
Wilkins, A. J., Shallice, T., & McCarthy, R. (1987). Frontal
lesions and sustained attention. Neuropsychologia, 25, 359365.
Wilson, B. A., Alderman, N., Burgess, P. W., Emslie, H., &
Evans, J. (1997). Behavioural Assessment of the Dysexecutive
Syndrome. BurySt Edmunds, U.K.: ThamesValleyTest
Company.
Wilson, B., Cockburn, J., & Halligan, P. (1987).The Behavioural
InattentionTest. BurySt Edmunds, U.K.: ThamesValley
Test Company.
,for designed
Yandell, B. S. (1997). Practicaldataanalysis
experiments. London: Chapman & Hall.
Manuscript accepted 7 August 2001

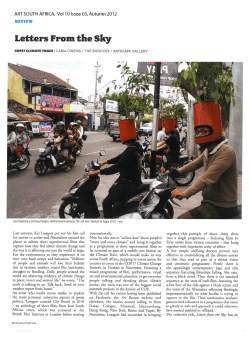


© Copyright 2026