
C Foster Care in California Achievements and Challenges
Foster Care in California
Achievements and Challenges
Caroline Danielson
●
Helen Lee
with contributions from Daniel Krimm and Jay Liao
Supported with funding from the Stuart Foundation
AP Photo/BeBeto MAtthews
Summary
C
alifornia’s foster care system, responsible for about 63,000 children and youth who
have been removed from their homes because of maltreatment or neglect, has made
some remarkable advances in the last decade. Foster care is an exceptionally sensitive
component of the state’s child welfare system because it can mean the removal of a child
from a family. So the goal of the foster care system is to safely reunite children with their
own families under improved conditions or to provide stable and beneficial home environments elsewhere. Data show that the state has made great progress in moving children
out of foster care. Since 2000, there has been a 45 percent drop in the share of California
children in the system, a reduction achieved largely through shortening the time that most
children spend in foster care. In 31 of California’s 58 counties, the number of children in
foster care declined by 10 percent or more between 2000 and 2009—even as the population of children in the state increased from 9.3 million to 10 million. The decline has been
most pronounced among black children, who have long been overrepresented in the child
welfare system. In 2000, 5.4 percent of California’s black children were in foster care, but
only 2.7 percent were in 2009. Furthermore, more foster children are remaining in their first
out-of-home placement, rather than going in and out of multiple placements, than at the
beginning of the decade; and more children who entered foster care later in the decade are
eventually placed with relatives.
w w w.ppic.org
2
Foster Care in California
These reductions, which far outpaced those across the rest of the country, may have
resulted at least in part from a more intense focus by local and state policymakers on the
problems of foster care, which in turn led to innovations in child welfare policies and practices.
The system still faces significant challenges. Payments to foster families and other out-ofhome care providers have not kept up with inflation. Despite the reduction in the proportion
of black children in the system, they are still substantially overrepresented. There has been
a worrisome increase in the share of children who enter foster care more than once during
their childhoods. And, despite the significant reductions, the number of children who age
out of the system—often facing uncertain futures with too little adult guidance—has actually risen since the beginning of the decade.
The changes we find and report here are measures of process, not of outcome. Confirmation that California children are in fact better off because they either entered foster care or
left it requires investigation into their circumstances. Toward that end, we recommend the
gathering of broader data, including measures of the well-being of all children who come
into contact with the child welfare system, but especially those who spend time in foster
care. Tracking children over time, as well as linking child welfare records with educational,
health, parental employment, and criminal records collected by other government agencies, would yield valuable information about children’s well-being. It would also pave the
way for policy and practice innovations that could extend the noteworthy changes that have
occurred in this decade.
Please visit the report’s publication page
http://www.ppic.org/main/publication.asp?i=905
to find related resources.
w w w.ppic.org
Foster Care in California
3
Introduction
The child welfare system in California is a fundamental
part of the state’s social safety net, charged with the task
of protecting children from harm and furthering their
well-being. Child welfare departments in the state’s 58
counties investigate hundreds of thousands of reports of
suspected abuse or neglect annually. Responses by county
caseworkers and courts to child maltreatment—defined as
the neglect or abuse of a person under age 18—are tailored
to the circumstances of the child and family and to the
requirements of the law.1 Most children whose maltreatment report has been substantiated remain in their homes
with their families, with support services provided to
them. But roughly one in three children with a substantiated report is placed in temporary, out-of-home foster care.
In the 2008–2009 fiscal year, close to 32,000 California
children were placed outside their homes because juvenile
dependency courts deemed that the child’s removal and
intervention services to the family were necessary before
the child could safely return home. The foster care caseload
thus encompasses the most severe and difficult cases of
maltreatment and neglect.
The goals of those who administer foster care are to
place children in the most family-like settings as possible, to keep their stays in foster care short, and, as much
as possible, to return children to their own families. If
children cannot safely reunify with their parents, the
emphasis shifts to creating a permanent placement with a
legal guardian or adoptive family. Foster care is a dynamic,
high-turnover system: Tens of thousands of children enter
in any given year, but the state also reunites about the same
number of children with their families or places them
with adoptive families or legal guardians. However, each
year, several thousand children also leave foster care only
because they age out of eligibility, an outcome that makes
them the focus of great concern. A wealth of evidence
indicates that young adults who age out of foster care are
at significant risk of poor outcomes in education, employment, health, homelessness, and crime.
istocK © MirosLAv GeorGiJevic
More than 30,000 children enter foster care in California each year,
but even more leave.
In this report, we focus specifically on describing and
discussing issues central to foster care in California and
on the significant advances that have occurred since 2000.
Foster care serves a relatively small share of children and
families who come into contact with the child welfare system in any given year, but the costs to support out-of-home
care for children are among the largest in the child welfare
system. Specifically, California and its counties (which
administer most of the direct services to children) spent
about $5.4 billion on child welfare services in 2008–2009.
Foster care support payments make up approximately onequarter of that; allocations for ongoing support payments
to adoptive parents and to guardians cost nearly an additional $1 billion (Mecca 2008, Reed and Karpilow 2009).
The foster care system has suffered from perennial
challenges (County Welfare Directors’ Association 2007,
Little Hoover Commission 2003). These included, in
previous decades, a higher share of children in foster care
in California than in the rest of the nation and persistent
racial and ethnic disparities, particularly for black children. Counties also have had to deal with a shortage of
foster family homes.
w w w.ppic.org
4
Foster Care in California
But since the beginning of the decade, there have been
notable changes in foster care policy, process, and practice.
Policymakers have intensified their focus on foster care
issues: Most recently, in 2009, the Blue Ribbon Commission
on Children in Foster Care released recommendations to
improve the courts’ role in foster care (California Blue Ribbon Commission on Children in Foster Care 2009). Earlier,
in 2006, the legislature created the Child Welfare Council,
a permanent advisory group developing recommendations
for improved collaboration and coordination across the
courts, agencies, and departments that serve children (Child
Welfare Council 2008). The introduction in 2000 of a state
assistance program, the Kinship Guardianship Assistance
Payment (Kin-GAP) program, was an initiative to increase
the share of foster care children permanently placed with
relatives. Another major change is the movement toward
outcomes-based reporting. This was motivated in part by
the Federal Adoption and Safe Families Act (1997), which
created outcome measures and required systematic data collection on child welfare services for all states. These federal
Since the beginning of the decade,
there have been notable changes in foster care
policy, process, and practice.
standards are by design challenging to meet. Although
California has shown steady progress, it has not yet met
federal standards in either its first or second review (California Department of Social Services 2004, 2009a; U.S. Department of Health and Human Services 2008).2
Despite this focused attention, policymakers and
practitioners continue to voice grave concerns. Given this
and current budget constraints, it is all the more critical
to reassess how foster care, the most intensive and one of
the most expensive components of child welfare services,
is faring. Doing so lays the groundwork for identifying
cost-effective ways to sustain and expand on progress in
upcoming years.
This report offers both a detailed examination of the
transformation that has occurred in the foster care system
since 2000 and its continuing challenges. We identify key
processes underlying the changes, so that stakeholders can
plan how best to sustain efforts that promote success and
policymakers can focus scarce resources on the system’s
most pressing problems.
System Overview
A child’s first point of contact with child welfare services
in a county is typically through the 24-hour emergency
response hotline that all counties maintain. Although most
referrals are made by mandated reporters such as medical
professionals, police officers, and teachers, ordinary citizens can use these hotlines to make reports of suspected
abuse or neglect, anonymously if necessary. If investigation by county caseworkers confirms evidence of abuse or
neglect, the report is said to be substantiated. Relatively
few children for whom reports are made, about one in five,
have a substantiated report in any one year.3
Substantiated allegations fall into nine official categories, ranging in severity from caretaker (parental) absence
or incapacity to sexual abuse; the category of general
neglect makes up about half of all substantiated allegations.4 All counties have implemented standardized assessment tools to guide them in appropriate levels of response.
For most children, family maintenance—that is, providing
services to families to help avoid a foster care entry—is a
primary goal. These services encompass substance abuse
treatment, emergency shelter, respite care, and parenting
education classes, among others. If a report is substantiated, and the county concludes that the child’s removal
from his or her family is required, a dependency petition
seeking that removal is filed with the juvenile dependency
court, where a judge hears both sides and decides whether
the petition is justified. (In emergency situations, removal
of a child from the home can occur without a court order
but the decision must be reviewed by a judge later.) If
removal is ordered, the child becomes a dependent of the
w w w.ppic.org
Foster Care in California
court and officially enters foster care.5 In cases where
the child is removed from the home, child welfare caseworkers strive to return the child to the birth parents
or to find a permanent placement with alternative
caregivers, most commonly through adoption or legal
guardianship.
In recent years, about one in three children with a
substantiated maltreatment report was placed in temporary out-of-home care because juvenile dependency courts
determined a need for intervention and support services
to the family before the child could safely return.6 In total,
about 32,000 children entered foster care in fiscal year
2008–2009, and approximately 63,000 children and youth
were in child-welfare–supervised foster care as of July 2009.
An additional 3,000 entered foster care in 2008–2009—
and 5,000 were in the system as of July 2009—because of
their involvement with the criminal justice system.7 (It is
also possible for a child who first enters foster care under
the supervision of county child welfare departments to
later become probation-supervised.)
In the context of the state’s entire population of children, foster care placement is relatively rare (Figure 1). In
any one year, just under 5 percent of the state’s children
come to the attention of child welfare services through a
Figure 1. Although the number of allegations of abuse or neglect
of children seems high, few cases actually result in foster care
intervention
5
Percentage
4
3
2
1
0
Allegations
Substantiations
Foster care entries
SOURCE: 2008–2009 data, authors’ calculations from Needell et al. 2010.
NOTES: The bars include children in child-welfare–supervised foster care. If a child is the subject of more
than one allegation or substantiation, or has multiple foster care entries within the year, only one is
counted.
5
maltreatment report and 1 percent are the subject of a substantiated report. However, only about 0.3 percent eventually enter foster care. Across ages, infants are much more
likely to be the subject of a maltreatment report, to have
their reports substantiated, and to enter foster care. Infants
are more likely than older children to come into contact
with mandated reporters such as doctors and nurses, and
they are more vulnerable.
By law, children who are removed from their homes
and enter temporary foster care must be placed in the most
In the context of the state’s entire
population of children, foster care placement
is relatively rare.
family-like, “least restrictive” setting, and, when possible,
kept in the same community and schools. In addition,
caseworkers try to place children in a setting that will
offer stability and that will most likely transition into a
permanent placement. For these reasons, foster care placements with relatives or adults with “an established familial
or mentoring relationship with the child,” as the statute
describes them, are a priority.
Although all foster care is licensed or certified by counties or the state, the types of foster care placements differ
considerably in their levels (less versus more formal treatment), structure (less versus more supervision), and setting
(more family-like versus more institutional) (Table 1). They
also vary in cost because maintenance payments by the
state and counties differ according to the needs of the child
and the types of services provided.8
On the less institutional and less costly end of the
spectrum, placements include licensed foster family homes
(including with relatives) and families identified and
certified through foster family agencies (FFAs). FFAs were
intended originally for children with special or behavioral
needs and to find alternatives to group homes. They have
long appeared to have a broader mission, serving both
w w w.ppic.org
6
Foster Care in California
Table 1. Out-of-home care settings range from family-like to institutional
Type
Description
Target population
Foster family home (includes relative care
and nonrelated extended family care)
Family residences that provide 24-hour care
for no more than six children (with the
exception of sibling groups)
Children without serious disabilities or
special needs
Families located through FFAs
Nonprofit agencies licensed to recruit, certify,
train, and support foster parents for hard-toplace children who would otherwise require
group home care
Children with emotional, behavioral, or other
special needs; children awaiting adoption;
children for whom a foster family placement
cannot be found
Group homes
Structured, residential facilities that have a
treatment component
Children with more serious special needs
CTFs
Secure residential treatment facilities
Children with severe mental health needs
but not severe enough for a psychiatric
hospital
SOURCE: Reed and Karpilow 2009.
children who could be placed with foster families as well
as children who would otherwise be placed in group homes
(Foster 2001). In terms of base payment rates, FFAs are
also more costly for the state on average than foster family
homes, even with additional clothing allowances and payments to the latter (Legislative Analyst’s Office 2008).
More structured (and thus more costly) temporary
placements include group homes with trained, 24-hour
staff support and which can include a mental and behavioral health treatment component. In size, they can range
from two to more than 100 children, although most are
licensed for six (California Department of Social Services
2010a). Older youth may be placed in independent living
Over half of children entering
foster care for the first time leave to be
reunified with their birth parents.
or transitional housing programs. The most institutional
and intensive setting is the community treatment facility
(CTF), for children with severe emotional problems who
cannot be treated in a group home setting.
Length of time in foster care varies depending on
the needs of the child and of birth parents, the resources
available within their families and communities, and the
resources that child welfare services departments and
dependency courts can muster. Just over half of children
first entering foster care will stay in foster care for a year or
less. However, about one in five of all children currently in
foster care started his or her current stay at least five years
ago. Moreover, most children who remain in state care
for any length of time change placements at least once, so
improving placement stability continues to be an important goal. Not surprisingly, the longer a child’s stay in
foster care, the more likely are multiple placements.
Over half of children entering foster care for the first
time leave to be reunified with their birth parents (57%).
If family reunification will not occur, the child welfare
services goal shifts to one of establishing permanent connections with caring adults. So that permanent homes
for children can be found as quickly as possible, policies
require concurrent planning for family reunification and
for possible alternative permanent placement. Counties
and courts also follow established time lines for terminating parental rights. About one in five children who leaves
foster care is adopted, although adoption patterns vary by
age; a smaller share (about 8%) leave foster care because
w w w.ppic.org
7
Foster Care in California
Achievements
The changes since 2000 in California’s foster care system
are unmistakable. Most notably, the share of children in
foster care has dropped substantially since the decade
began. Moreover, the drop was most pronounced for
black children, who have long been overrepresented in the
system. Our research indicates that the overall decline has
been driven by reductions in the time that most children
spend in foster care, rather than by reductions in the
number of children entering foster care. In addition, more
children remain in their first placement during their first
year in foster care than they did in the past, and more children who stay in foster care for any length of time now are
eventually placed with relatives or extended family.
Foster Care Caseload Decline
The foster care caseload in California has been steadily
dropping for a decade (Figure 2). In July 2009, 59,686
children under the age of 18 were living in foster care.10
Figure 2. More exits than entries resulted in falling caseloads
100,000
In foster care
Number of children
an adult—often a relative—has become the child’s legal
guardian.9
Several thousand children every year leave foster care
because they are age 18 or older and no longer eligible for
services. The goal is to help these youth transition successfully to independent adulthood. The main program to
provide this help is the state-funded Transitional Housing
Placement Plus Program. Although enrollment is voluntary, youth are eligible for its services up to age 25, so that
in any one year, roughly 25,000 to 30,000 former foster
youth could receive its services. However, the program has
a capped, yearly allotment and can serve only a portion of
this population—about 2,300 in 2008–2009 (John Burton
Foundation 2009).
It is not unusual for some children to cycle in and out
of foster care. For one in five children who entered foster
care in 2008–2009, for instance, that entry was not the first.
Older children in particular are more likely to enter foster
care for a second or subsequent time.
75,000
50,000
Exits
Entries
25,000
0
2000
2001
2002
2003
2004
2005
2006
2007
2008
2009
SOURCE: Authors’ calculations from Needell et al. 2010.
NOTES: The graph shows child-welfare–supervised children of all ages and shows entries and exits over
each state fiscal year (July–June); the caseload is as recorded at the start of the subsequent fiscal year.
The figure shows the number of children entering and exiting, not the total number of entries and exits.
A few children enter or exit foster care more than once a year.
With about 10 million children under age 18 in California,
this is equivalent to six of every 1,000 children in state
care, compared to 10.9 of every 1,000 children in July 2000.
Although caseload trends vary by county, 31 of the state’s
58 counties saw the number of children in foster care
decline by 10 percent or more between 2000 and 2009—
over a period when the population of children in the state
increased from 9.3 to 10.0 million. Los Angeles County
saw its foster care caseload drop by 57 percent between
2000 and 2009. Put another way, 43 percent of the state’s
foster children lived in Los Angeles County in 2000, but
by July 2009, less than a third did.11
These declines are a sharp reversal of historical trends.
Data for the 1980s and 1990s (although more limited) indicate that California’s foster care caseload grew from about
30,000 children in the early 1980s to a peak of over 100,000
in the late 1990s (Wulczyn, Hislop, and Goerge 2000).
We find one main factor behind these declines. Since
2000, the number of children leaving foster care each year
has consistently exceeded the number entering. Between
the 1999–2000 and 2008–2009 fiscal years, the number
of children entering foster care was between 32,000 and
38,000, whereas the number exiting, including those
who aged out of the system, exceeded 39,000 each year.12
w w w.ppic.org
8
Foster Care in California
not changed, but only 15 percent of the national caseload
lived here.14 The gap may now have closed, given the
continued decline in California’s caseload between 2007
and 2009.
istocK © NAthAN GLeAve
The majority of children who enter foster care leave within a year.
As long as exits continue to outpace entries, caseloads
will continue to drop. The number of children who entered
foster care each year remained nearly constant between
2000 and 2007. However, there were declines of 12 percent
in 2007–2008 and 6 percent in 2008–2009. This more recent
development, if it continues, will represent a new phase in
caseload reduction.
Even more noteworthy, the foster care caseload decline
in California has been much larger than in the rest of the
United States—California’s caseload dropped by 34 percent
from 2000 to 2007 whereas the rest of the nation saw a
decline of less than 5 percent (AFCARS 2007).13 In 2000,
California had 13 percent of the nation’s children but
21 percent of the nation’s foster care caseload. Seven years
later, the share of the nation’s children in California had
The foster care caseload decline
in California has been much larger than in
the rest of the United States.
Reduction in Long Stays
An alternative way to understand these reductions is to say
that children’s length of stay in foster care has shortened,
consistent with the system’s twin goals of keeping foster
care stays brief and of placing children permanently as
quickly as possible. The shift occurred noticeably among
new entrants to the system. Fifty-four percent of children
who first entered foster care in 2007 left within a year,
compared to 50 percent of those who first entered in 2000.
Viewed across age groups, these shortened stays were particularly notable for children who first entered foster care
when they were infants, younger than 1 year old. In 2007,
44 percent of infants left foster care within a year, compared to only 36 percent who entered in 2000. The shift to
shorter stays also occurred for children who remained in
foster care for several years (Needell et al. 2010).
In Table 2, we compare foster care stays in 2000 and
2007 among children exiting to the three most frequent
types of permanent placement: family reunification, adoption, and legal guardianship. Children who were reunited
with their parents (the most common outcome) saw a sixmonth average reduction in their stays. Even more encouraging, the reduction for this group was most pronounced
for children who had already been in foster care for long
durations. For the other two groups, the reductions were
even larger—and no less pronounced for children whose
stays were in the middle or high end of the distribution of
all durations. Moreover, reductions occurred across ages of
entry; that is, children who entered foster care at older and
younger ages both saw their time to reunification, adoption, or guardianship reduced by several months.
Even those children who did not exit the system in
2007 were experiencing shorter stays—on average, from
2000 to 2007, they shrank by four months. Still further,
other data (from the CWS/CMS) show that the same trend
of reduced time in foster care extended to children with
w w w.ppic.org
9
Foster Care in California
Table 2. Among children leaving the system, time spent in foster care has dropped
median stays
(50th percentile)
average
Long stays
(90th percentile)
2000
2007
2000
2007
2000
2007
Reunification
1.3
0.9*
0.8
0.6
3.2
1.8
Adoption
3.5
3.0*
3.1
2.5
5.9
5.0
Guardianship
3.9
3.0*
3.1
1.9
8.0
6.8
SOURCE: Authors’ calculations from AFCARS.
NOTES: These data are roughly, but not exactly, comparable to CWS/CMS data. See the online technical appendix for further description of the data sources. Length of time in foster care reflects only the most
recently completed stay.
* Average times spent in foster care in 2000 and 2007 are significantly different at the 5 percent level.
all durations of stay (Table 3). In mid-2000, 25 percent of
children had begun their stay in foster care less than a year
earlier. By mid-2009, this share had risen to 35 percent. At
the same time, the share of children in foster care for five
years or more dropped from 25 percent to 21 percent over
the decade.
Children who leave foster care quickly are likely to
have fewer special needs and more family and community
resources than those who stay for longer periods of time.
However, it does not appear that reductions in stays over
the decade have been limited to such children.
Even more encouraging, especially because the issue
has long been of concern for child welfare experts, is our
finding that the largest foster care caseload reduction
occurred among black children in the state—their share
Table 3. Among children in foster care, lengths of stay are
shrinking
2000
2009
Less than 1 year
25
35*
1–3 years
32
32
3–5 years
17
13*
5 years or more
25
21*
SOURCE: Authors’ calculations from Needell et al. 2010.
NOTES: Table entries show caseloads as of July of each year and include child-welfare–supervised
children of all ages. The length of time in foster care reflects only the current stay. Some children have
more than one stay in foster care.
*The change from 2000 to 2009 is significantly different at the 5 percent level.
dropped by half (Table 4). Specifically, 5.4 percent of
black children in the state were in foster care in 2000,
but only 2.7 percent were in 2009. This is not to say that
racial/ethnic gaps have been erased. In 2009, black children were still more than five times as likely as white
Children who entered foster care at
older and younger ages both saw their time
to reunification, adoption, or guardianship
reduced by several months.
children to be in foster care. But this 50 percent decline
for black children suggests that greater awareness and
efforts to address their overrepresentation in foster care
may be having an effect.
These declines for black children indicate shorter stays:
44 percent of black children who first entered foster care
in 2000 left within a year, compared to 52 percent doing so
in 2007 (Needell et al. 2010). Among black children exiting
to reunification, adoption, or legal guardianship, average
stays also dropped from 2.8 to 2.1 years between 2000 and
2007, although they continue to be longer than those of
Hispanic, white, and Asian or Pacific Islander children
(AFCARS 2000, 2007).
w w w.ppic.org
10
Foster Care in California
Table 4. Black children had the biggest percentage drop since 2000 but are still overrepresented in foster care
All
2000
2009
Percentage change
1.1
0.6
–45*
racial/ethnic group
Hispanic
0.9
0.6
–36*
White
0.8
0.5
–41*
Black
5.4
2.7
–50*
Asian or Pacific Islander
0.2
0.2
–30*
SOURCES: Authors’ calculations from Needell et al. 2010 and California Department of Finance 2007.
NOTES: The percentage of Asian or Pacific Islander children in foster care is rounded down from 0.22 in 2000 and up from 0.16 in 2008. Foster care caseloads and population estimates are as of July 2000 and July
2009 and include only children through age 17. Table entries include child-welfare–supervised foster care children. We do not report rates for Native American children because of the considerable uncertainty
that accompanies those estimates. See the online technical appendix for more detail on the calculation of estimates by a child’s race/ethnicity. Children identified as Native American or with no recorded race in
the CWS/CMS data are included in the overall total.
*The change from 2000 to 2009 is significantly different at the 5 percent level.
The Kinship Guardianship Assistance Payment Program
We cannot identify all the factors behind shorter stays in
foster care, but one major policy innovation that likely
contributed was the statewide adoption in 2000 of the KinGAP program.15 This voluntary program was designed to
encourage more permanent placements for foster children
who will not be reunified with their birth parents (Reed
and Karpilow 2009). The program provides financial
assistance to caregiver relatives who assume responsibility
for children within the foster care system and who then go
on to become their legal guardians. The Kin-GAP assistance amount is set at the maintenance payment the child
received when he or she left foster care.16
Thirty-six other states and the District of Columbia
had such a program in place in 2008. To date, California
has funded Kin-GAP through its California Work Opportunities and Responsibility to Kids (CalWORKs) program.
A change in federal law in October 2008, the Fostering Connections to Success and Increasing Adoptions Act, permits all
states to seek federal reimbursement for a portion of maintenance payments in programs similar to California’s Kin-GAP
program. In Assembly Bill 12, currently under consideration
by the legislature, California has incorporated language that
would qualify the state for these funds by July 2010.17
We answer the question of how much of the reduction
in the state’s foster care caseload can be attributed to the
launch of Kin-GAP by estimating how large the caseload
would have been without such a program.18 Close to 30,000
children entered the Kin-GAP program between 2000 and
2009; in 2008, the average monthly number in Kin-GAP
was about 14,000 (California Department of Social Services
n.d., Needell et al. 2010).19 An upper-limit scenario assumes
that children who entered Kin-GAP would have remained
in foster care until they emancipated. In this case, approximately 86,000 children would have been in foster care in
July 2009—far more than the actual caseload of 62,528. In
other words, the Kin-GAP program could have accounted
for roughly half of the actual drop in the number of children
in foster care. In reality, at least a few children who benefited from Kin-GAP would have left foster care before age
18 through other types of placements. In a more conservative scenario, we assume that those who entered Kin-GAP
would have been reunified or adopted at half the rate of
children of similar age who did actually reunify or find
adoptive homes. In this case, the Kin-GAP program would
have been responsible for only about 20 percent of the
decline in the overall caseload.
Therefore, although the introduction of Kin-GAP was
important, more than half of the caseload decline since
2000 is likely due to other factors. More intensive research
on these other factors—including promising county-based
initiatives—needs to be undertaken to understand not only
their effects on children in foster care but also their ability
to improve children’s well-being outside it.
w w w.ppic.org
11
Foster Care in California
overall placement stability, moving may be warranted if it
improves future placement stability or helps children leave
foster care more quickly.
Challenges
Although, as we noted above, many fewer black children
are in foster care now than were at the beginning of the
decade, black children are still overrepresented in the
foster care caseload. (There are also sizable racial and
ethnic disparities during earlier stages of child welfare
involvement, serious issues that practitioners are investigating and addressing.)22 The percentage of children with
a substantiated report of maltreatment who enter foster
care is higher for black children than it is for Hispanic,
white, and Asian or Pacific Islander children (Figure 3).
Similar proportions of Hispanic and white children—
about a third—entered foster care in 2008–2009, as did
27 percent of Asian or Pacific Islander children. The share
of black children who did so stood at 45 percent.23 In 2008,
of children with a substantiated maltreatment report, black
children had a foster care entry rate that was 43 percent
higher than the rates for Hispanic and white children.
Figure 3. Black children are more likely than others to enter foster
care after a substantiated report of maltreatment
50
40
Percentage
Improvements in Placement Stability
We noted above that children in foster care are moved
relatively often, but it is also worth noting that the frequency of these moves has generally fallen. In 2000,
18 percent of children who entered foster care for the first
time and stayed for at least a year remained in that first
placement for a year. In 2007, 26 percent did so, a considerable change. The share of children experiencing many
placements, three or more, in their first year in foster care
also dropped substantially, from 52 percent in 2000 to
40 percent in 2007 (Needell et al. 2010).
Children in foster care for at least one year in 2007 and
who were initially placed with relatives or extended family
also had much higher placement stability than did children
who were placed elsewhere—two-thirds (66%) were still in
that first placement a year later.20 Of those initially placed
with a foster family, in an FFA, or in a group home, only
14 percent who stayed for at least a year were still in their
first placement a year after entering. This divergence in
placement stability is striking, although part of the explanation is likely that children first placed with kin already
possess greater family resources and face fewer physical
and emotional challenges than children first placed elsewhere; these relative strengths contribute to stability.
Although county agencies do make placement with
relatives a priority, living with relatives or extended family
is fairly uncommon as a first placement, with only 18 percent of those who first entered foster care in 2008 doing
so. However, even if children cannot be so placed initially,
counties aim to do so eventually. Among children who
left foster care within a year, placement with kin had risen
by the time of their exit, growing from 20 percent of all
initial placements to 35 percent.21 Among all children who
exited foster care in 2008, three in ten were living with
relatives or extended family just before they left foster
care, whether to reunification, adoption, or emancipation.
(This estimate, in fact, undercounts the total number of
foster care children living with relatives because a number
of children in other placements—predominantly preadoptive and guardianship—were also living with relatives
at the time of exit.) Although moving children decreases
30
20
10
0
All children
Hispanic
White
Black
Asian or Pacific
Islander
SOURCE: 2008–2009, authors’ calculations from Needell et al. 2010.
NOTES: The bars show child-welfare–supervised children. We do not report rates for Native American
children because of the considerable uncertainty that accompanies those estimates. See the online
technical appendix for more detail. Children identified as Native American or with no recorded race in the
CWS/CMS data are included in the overall total.
w w w.ppic.org
12
Foster Care in California
In addition, black children and youth continue to have
longer stays in foster care than Hispanic, white, and Asian
or Pacific Islander children, and smaller shares of black
children and youth reunify with their birth families—
49 percent for black children and 57 percent of all children
(AFCARS 2007, Needell et al. 2010).
Frontline workers and policy officials in California
are concerned that black children are more likely to enter
foster care and to have difficulty finding permanent homes,
and they are investigating sources of these disparities and
strategies to combat them. Socioeconomic, historical, and
system-wide factors, including institutional and structural
biases, likely contribute. Poverty and disadvantaged neighborhood environments are correlates of foster care involvement, and low-income black families may have fewer
resources and social support services to avoid foster care
entry (Center for Juvenile Justice Reform 2009; Freisthler,
Merritt, and LaScala 2006; Hill 2006; U.S. Government
Accountability Office 2007; and Wulczyn and Lery 2007).
One of these strategies, the California Disproportionality Project, began in 2008 to address specifically the overrepresentation of some racial and ethnic minority children
in the state child welfare system, including foster care. The
group’s work has looked at involving family members in
case planning, searching for paternal kin to increase the
number of options for permanent placement, and providing more resources to better prevent children from being
removed in the first place (California Department of Social
Services 2009a, Reed and Karpilow 2009). A concerted
effort to investigate the effectiveness of these and other
initiatives would be highly informative.
Growth in Agency Placements
As noted above, placing foster care children with relatives
is a priority for county caseworkers and courts, although
this is not always feasible. In fact, of the children who
entered foster care for the first time in 2008, the most common initial placement was with a family certified by an
FFA (Table 5). Smaller proportions were first placed with
a foster family (22%), with relatives (17%), or in a group
home or shelter (15%).24
Looking more closely at initial placement patterns
by age and race/ethnicity, we find that older children are
placed with an FFA more often than infants. Hispanic and
black children are also more likely to be initially placed
with an FFA (49% and 45%, respectively). White children
are more likely to be initially placed with a foster family
than other groups (26%), whereas a higher percentage of
Table 5. Initial foster care placements are typically with kin or foster families
Kin
Licensed foster family
FFa-certified family
Group home or shelter
17
22
46
15
Hispanic
17
20
49
14
White
17
26
41
16
Black
20
23
45
13
Asian or Pacific Islander
18
23
38
21
Under 1
16
41
38
5
1–15
18
17
48
16
16–17
15
10
43
32
All
race/ethnicity
age at entry
SOURCE: Authors’ calculations from Needell et al. 2010.
NOTES: Table entries include child-welfare–supervised children. Other placement types are possible but made up less than one-half of 1 percent among all children and in each subgroup. We do not report rates
for Native American children because of the considerable uncertainty that accompanies those estimates. See the online technical appendix for more detail. Children identified as Native American or with no
recorded race in the CWS/CMS data are included in the overall total.
w w w.ppic.org
Foster Care in California
Asian or Pacific Islander children are initially placed in a
group home or shelter (21%). These placement patterns may
reflect differences in children’s needs as well as differences
in the availability of the various types of placements.
The change over time in placement patterns since
2000 is also worth noting (Figure 4). Similar shares of
children were initially placed with relatives in 2000 and
2009, but those placed with foster families or in a group
home shrank substantially over the same time frame.25 At
the same time, the proportion placed with an FFA grew
markedly, by 88 percent. In 2000, 23 percent were initially
placed with an FFA. By 2009, this proportion had risen
to 46 percent.26 The growth in the use of FFAs occurred
across racial/ethnic and age groups, although it was
smaller for infants than for other children.27
On average, an FFA placement costs the state and
counties more than placement in foster family or relatives’
homes, partly because they are intended to provide coordinated services for children with greater needs (Legislative Analyst’s Office 2008). Some have expressed concern
that the growth in FFA placements may simply be due to
a shortage of adequate numbers of licensed foster family
homes, as opposed to an increase in the number of children
in need of an FFA’s specialized services.28
Figure 4. Foster family agencies have become increasingly
important since 2000
100
Percentage
75
Group home
or shelter
25
FFA
23
15 *
46 *
50
25
0
Foster family
37
22 *
Kin
16
17
2000
2008
SOURCE: Authors’ calculations from Needell et al. 2010.
NOTES: The bars show all children entering child-welfare–supervised foster care for the first time between July
and December 2000 and July and December 2008. Other placement types are possible but made up less than
one half of 1 percent of placements. The 2000 column does not sum to 100 percent because of rounding.
*The change from 2000 to 2008 is significantly different at the 5 percent level.
13
In fact, the diminishing supply of foster family homes
in recent years, especially in some of California’s largest
counties, has also been highlighted as a serious problem
(Reed and Karpilow 2009). A continued lack of foster
family caregivers would not be unexpected if monthly
maintenance payments fall short of families’ needs. One
study of 21 California counties argues that the most
important reason for the decrease in the supply of foster
family homes is low board-and-care reimbursement rates,
The diminishing supply of foster family homes
in recent years, especially in some of
California’s largest counties, has also been
highlighted as a serious problem.
which have not kept up with inflation (County Welfare
Directors’ Association 2007). Rates remained unchanged
between 2001 and 2007 so that with inflation, they were
about 25 percent lower in 2007 than in 2000.29
Still, it is not clear that low and stagnant foster family
payments have entirely driven the increase in the share of
children placed with FFAs. After all, FFA payments have
also failed to keep pace with inflation. It may be the case
that children entering foster care in recent years have been
more likely to need the higher level of services that FFAs can
provide. It may also be the case that counties have offset high
social worker caseloads with increased use of FFAs because
FFAs employ social workers who may offer an additional
layer of oversight. Finally, counties that engage in special
efforts to find adoptive homes for children may be more
likely to use FFAs to certify adoptive homes. A comparative
examination of foster family and FFA placements over time,
along with better data on the population of children served,
placement provider supply, county priorities, services needed,
and permanency outcomes, could help policymakers understand tradeoffs in placement decisions. Such information
could also help shed light on whether the increased use of
w w w.ppic.org
14
Foster Care in California
Children leaving foster care more quickly
could mean a greater risk of return
if initial interventions are not sufficient.
FFAs has translated into better outcomes for children, making FFAs more cost-effective than otherwise would appear.
Reentering Foster Care
Although the foster care caseload has declined substantially, there has been some worsening over time in the rate
of children reentering. In fiscal year 1999–2000, 16 percent
of children entering foster care had already been in out-ofhome care at least once. In 2008–2009, the share was somewhat higher, 20 percent (Table 6).30 This trend should be
monitored: Children leaving foster care more quickly could
mean a greater risk of return if initial interventions are not
sufficient.
Here, again, racial/ethnic differences appear. Reentry
is more common for black children than for whites. One in
five white children entering foster care in 2008–2009 had
been in state care at least once before, compared to one in
four black children. Fewer than one in eight Asian or Pacific
Islander children who entered foster care in 2008–2009 had
been in foster care previously.
Table 6. Reentries to foster care have increased
2000
2009
16
20*
Hispanic
13
18*
White
18
20*
Black
20
25*
Asian or Pacific Islander
11
12
All
race/ethnicity
SOURCE: Authors’ calculations from Needell et al. 2010.
NOTES: Table entries include child-welfare–supervised children entering foster care between
July 1999–June 2000 and July 2008–June 2009. We do not report rates for Native American children
because of the considerable uncertainty that accompanies those estimates. See the online technical
appendix for more detail. Children identified as Native American or with no recorded race in the
CWS/CMS data are included in the overall total.
*The change from 2000 to 2009 is significantly different at the 5 percent level.
Aging Out of Foster Care
Youth who leave foster care because they age out, generally
at age 18, constitute a group of great concern to policymakers, even though they represent a relatively small share
of children exiting foster care (and a very small share of
children who ever enter foster care).31 Emancipated youth
fare poorly on educational and employment outcomes,
are at higher risk for becoming homeless, and quite often
become involved in the criminal justice system (Courtney
2009).32 This group has grown in California. In 2008–2009,
approximately 4,500 youth emancipated, representing
12 percent of all who left foster care. This was up from 9 percent, or about 4,000 children, in 1999–2000 (Needell et al.
2010).33 (There is some uncertainty in the absolute shift in
the size of this population because of increased accuracy in
reporting throughout the decade, but this would account
for only a small portion of the increase.)
One concern is that many children who emancipate
lack strong connections to a network of supportive adults.
For instance, well over half of children who emancipated
in 2008–2009 lived last with someone who was neither a
relative nor a guardian (64%). Only one in five (21%) was
last placed with a relative at exit. An additional 16 percent
were placed with a guardian not related to them (Needell
et al. 2010).
Another concern is that children who emancipate
tend to have had long stays in state care. Data from
AFCARS indicate that most foster care youth who became
legal adults in 2007 had been in state care for quite some
time. Half of them had been in out-of-home care continuously for four years or longer. Furthermore, nearly two in
five (38%) had been in and out of foster care at least once
before. Most troublingly, about 500, representing 9 percent
of all youth who emancipated in 2007, first entered state
care when less than a year old, meaning that they had
spent their entire lives in the system. Roughly an additional 1,000, or 19 percent of all who emancipated, first
entered between ages 1 and 5 (AFCARS 2007).
As noted above, children’s time in foster care has been
growing shorter and caseloads have been declining. However, looking at data on foster youth from AFCARS over
w w w.ppic.org
Foster Care in California
time, we find that lengths of stay among youth who exit to
emancipation have increased substantially since 2000. On
average, youth age 18 and older who exited to emancipation in 2007 had stays of about six years, whereas those
who did so in 2000 had stays of about five years.34 Moreover, one in ten youth who exited to emancipation in 2007
had been in foster care for 14.5 years or longer, whereas
one in ten in 2000 had been in foster care for 11.5 years
or more—a three-year increase (AFCARS 2000, 2007).
Thus, there has been a substantial lengthening of time in
foster care of the subgroup of youth with the longest stays.
Changes in practice and in policy that shortened stays
for most children appear to have been less successful in
addressing the needs of some children who were already
in foster care early in the decade, and these children have
been aging out of the system in growing numbers.
Furthermore, we find that black children are again
overrepresented among youth aging out of foster care
(Table 7). Although 12 percent of all children and youth
who left foster care in 2008–2009 aged out, 19 percent of
black children did.
Assembly Bill 12, currently under consideration in the
California Legislature, would give most children who turn
18 while in foster care the option of continuing to receive
services and maintenance payments until they turn 21. The
aim is to better assist these youth in making the transition
to independent adulthood. Although the needs of older
Table 7. Percentage of children emancipating from foster care
Emancipations
All
12
race/ethnicity
Hispanic
9
White
14
Black
19
Asian or Pacific Islander
10
SOURCE: Authors’ calculations from Needell et al. 2010.
NOTES: Table entries show child-welfare–supervised youth leaving foster care between July 2008
and June 2009. We do not report rates for Native American children because of the considerable
uncertainty that accompanies those estimates. See the online technical appendix for more detail.
Children identified as Native American or with no recorded race in the CWS/CMS data are included
in the overall total.
15
foster care youth deserve policymakers’ continued attention, it is likely that the number of youth who reach age 18
while in foster care will begin shrinking over the next
several years. This is because the group of children at highest risk of emancipating—those who are in foster care at
ages 15, 16, and 17—has been shrinking by an average of
4 percent annually (Needell et al. 2010).35 That said, efforts
to find permanent placements for this group have been—
by definition—unsuccessful. Arguably, they will continue
to be the most challenging group in foster care.
Conclusions
Over the past decade, local, state, and federal agencies have
given increased attention to the child welfare system and
to the foster care system in particular. High federal performance standards have been set, reflecting the seriousness
of the responsibility that courts and county child welfare
departments take on when they remove children from
their parents. In addition to being challenging, foster care
is expensive: About one-quarter of the total child welfare
services budget for 2008–2009 was dedicated to support
payments for children in foster care.
Currently, California and its 58 counties face serious fiscal difficulties. The state has not adjusted its share
of child welfare services payments for inflation since the
2001–2002 budget year, and in 2009–2010, maintenance
payments for certain categories of foster care placements
were slated to be cut.36 These difficulties make a clear
understanding of the foster care system’s challenges and
strengths all the more urgent. So, too, is a clear understanding of the progress that has been made. Most promisingly, the state and counties have made great strides in
reducing the number of children in foster care, and at least
part of the decline can be traced to the Kin-GAP program.
Furthermore, the foster care caseload reduction was largest for black children. That said, black children still have
higher foster care entry rates and are also somewhat more
likely to reenter the foster care system. They are also more
likely than other groups to leave foster care only because
w w w.ppic.org
16
Foster Care in California
Most federal monies are dedicated
to foster care maintenance payments;
relatively little is allocated to prevention
and early intervention initiatives.
they age out of eligibility for its services. Lengths of stay
for most children in out-of-home care have become shorter
and placement stability has improved over the decade, but
the number of children who emancipate from foster care
without ever finding permanent homes has not declined,
and these children stay in foster care longer.
New legislation allows the state to claim federal matching funds to support youth in foster care until age 21. Given
the often poor outcomes of youth who age out of foster care,
expanding or extending programs to assist these young
adults could make a significant difference in their lives. These
funds could also give counties an additional tool to address
the continued disproportionate representation of black children among youth aging out of foster care. Understanding
the best ways to invest in such programs must be a priority.
County programs absorbed cuts from the state in the
2009–2010 fiscal year, and they can expect more budget
challenges in the future. Given this, our finding of a dramatic increase in the use of more expensive foster family
agencies merits further investigation. Important questions
include whether FFA placements are warranted, how the
children fare in FFA placements, and how best to encourage a cost-efficient placement mix while maintaining the
integrity of care.
There is another longstanding fiscal hurdle: Most federal
monies are dedicated to foster care maintenance payments;
relatively little is allocated to prevention and early interven-
tion initiatives (Mecca 2008).37 Counties and the state have
been fortunate in their collaborations with philanthropic
organizations, which have provided support for some prevention programs. But these funds were intended to support pilot
innovations, not to substitute for ongoing state support. As
we have noted, a larger share of children are reentering foster
care now than at the beginning of the decade, suggesting that
addressing maltreatment recurrence remains a key issue.
Our findings, as we noted in the beginning, report
advances in process, but adequate information on child
well-being outcomes is lacking. We recommend that
additional monitoring and data collection be considered
for children in California who have been the subject of a
maltreatment report. One of four committees of the state’s
Child Welfare Council—the Data Linkage and Information
Sharing Committee—has made a similar recommendation and has laid out steps to begin doing so (Child Welfare
Council 2009). These data could be created by linking child
welfare services records with government-held data on
educational, health, parental employment, and criminal
records. Ideally, children should be followed over the course
of their childhoods, and data should be collected both about
children who enter foster care and about children who
have a substantiated maltreatment report but do not enter
foster care. This would lead to a better understanding of the
effects of foster care on abused and neglected children.
The state is fortunate in having supported the creation of accurate and timely reports about children who
come into contact with county child welfare departments
(Needell et al. 2010). These data can tell us that stays in
foster care have shortened over time but cannot shed light
on children’s long-term outcomes. If California’s goal is
to identify policies and practices that promote the largest
gains in its children’s well-being, we need better information to advance this goal, now and in the future. ●
A technical appendix to this report is available on the PPIC website:
http://www.ppic.org/content/pubs/other/510CDR_appendix.pdf
w w w.ppic.org
Foster Care in California
Notes
California’s Child Abuse and Neglect Reporting Act (Penal
Code Section 11164-11174.3) defines neglect as harm or threatened harm to the health or welfare of a child, or the failure to
protect a child from such harm, by a person responsible for the
child’s welfare. Abuse includes the endangering of the health of
a child, non-accidental physical injury or death, sexual assault
or exploitation, and unlawful corporal punishment or injury.
1
Although it has not yet met all federal standards, California
has shown steady progress. After its first review, the state met
all but one of its program improvement plan targets. It began
implementing its second program improvement plan in July
2009. The state also established its own review system at the
beginning of the decade. The California Child Welfare System
Improvement and Accountability Act (Assembly Bill 636, Chapter 638, Statutes of 2001) established these California Child and
Family Services Reviews. Needell et al. (2010) tracks the subset
of the state and federal outcomes that are measured with administrative data, updating all indicators quarterly.
2
All of the statistics presented in this section are authors’ calculations from Needell et al. 2010.
3
More than one type of abuse or neglect allegation can be made
on behalf of a child. In Needell et al. 2010, the most serious type
of maltreatment is counted when this occurs.
4
County caseworkers can also file a dependency petition when
formally supervised home-based services are deemed necessary;
children in such cases are also considered temporary dependents
of the court although they are not removed from their homes.
5
In the most serious cases of maltreatment, reunification services may not be offered.
6
We exclude probation-supervised children from most of the
tables and figures in this report because their paths through
the child welfare system tend to be quite different from childwelfare–supervised children. However, data limitations require
that we include them in several tables, and we note where this
is the case. Throughout, footnotes describe differences and
similarities between statistics for child-welfare–supervised and
probation-supervised youth.
7
Monthly maintenance payments in the various placement
types are set by state law and also vary by a child’s age. Counties
can choose to pay higher rates, but in most cases they must use
8
17
only county funds to pay the increment. Maintenance payments
are federally matched at California’s Federal Medical Assistance
Percentage (FMAP)—currently 56.20 percent—if the child’s
birth parents meet federal eligibility requirements. In 2007,
57 percent of children in foster care did (Adoption and Foster
Care Analysis and Reporting System [AFCARS] 2007).
A guardian’s legal role is more limited than an adoptive or
birth parent’s and ends when the child reaches age 18.
9
In July 2009, an additional 2,842 youths ages 18 to 21 were
in foster care. This was because courts do not always terminate
a dependency case on a child’s 18th birthday. There were also
5,193 probation-supervised children and youth recorded in
Child Welfare Services/Case Management System (CWS/CMS)
data. This is down 32 percent from 7,593 probation-supervised
children in July 2000 (Needell et al. 2010).
10
Readers interested in differences at the county level can consult Needell et al. 2010.
11
A few children enter or exit foster care more than once in a
given year. For example, the total number of entries to foster
care in 2008 (32,499) was slightly higher than the total number
of children entering (31,713).
12
We use AFCARS to examine populations and outcomes that
we cannot explore using publicly available CWS/CMS data. The
latest year of AFCARS data available covers federal fiscal year
2007. Although CWS/CMS and AFCARS draw from the same
underlying information that counties keep about children who
enter foster care in California, there are differences, which are
described in more detail in the online technical appendix (available at www.ppic.org/content/pubs/other/510CDR_appendix.pdf).
To mention one, we cannot distinguish probation-supervised
children from child-welfare–supervised children. However,
because the share of probation-supervised children is generally
less than 10 percent of child-welfare–supervised children, it is
very unlikely that their inclusion drives the trends we describe.
13
Differences in the number of children in foster care across
states must be interpreted cautiously because of variations in
state definitions of maltreatment and the inclusion of youth
placed with kin and of probation-supervised youth in the foster
care caseload. The constancy in the foster care caseload in the
nation outside California also masks substantial state-level
variation: Eight states, including Florida, Illinois, and New
York, saw caseload declines that exceeded 25 percent but 14,
including Texas, experienced caseload increases of greater than
25 percent.
14
w w w.ppic.org
18
Foster Care in California
Reed and Karpilow (2009) provide an overview of other major
initiatives to improve foster care and the child welfare system
in California. More detailed descriptions and assessments of
some can be found in Child and Family Policy Institute 2007;
Lorentzen et al. 2008; and Wright, Tickler, and Vernor 2008.
15
Since 2007, an enhancement to the Kin-GAP program,
Kin-GAP Plus, enables children permanently placed with kin
guardians to continue receiving clothing assistance payments and
any Specialized Care Increment (SCI), in addition to the monthly
maintenance payment (Assembly Bill 1808 2006). Children in
probation-supervised foster care are also eligible for the program.
16
The 2009–2010 state budget included $4.7 million in General
Fund spending to implement other portions of the federal Fostering Connections to Success Act (Legislative Analyst’s Office
2009). For further discussion of the federal act’s provisions, see
the resources at www.fosteringconnections.org/about_the_law.
17
The online technical appendix describes the methodology
used to conduct this assessment.
18
One issue is the use of the category “Other Guardianship” to
label some cases that should have been identified as Kin-GAP
exits. Compare Needell et al. 2010 and California Department
of Social Services n.d. The online technical appendix describes
our approach to adjusting the number of exits to correct for this
miscoding of Kin-GAP cases.
19
“Kin” is a term used to encompass relatives, nonrelated
extended family, and tribe-specified families who assume care
for foster children. We use the term this way in the report.
However, California’s Kin-GAP program is restricted to blood
relatives who become legal guardians of children in foster care
(California Welfare And Institutions Code, Section 360–370).
20
Children placed with relatives while in foster care can continue to live with the same relative or extended family member
in an adoptive or guardianship relationship after they leave.
However, many such children leave to reunify with their parents
and some emancipate from foster care.
21
See Center for Juvenile Justice Reform 2009; Freisthler, Merritt,
and LaScala 2006; Hill 2006; Reed and Karpilow 2009; U.S. Government Accountability Office 2007; and Wulczyn and Lery 2007.
22
Using data from 1999 and 2000, Needell, Brookhart, and
Lee 2003 find that black children with a substantiated maltreatment were more likely to enter foster care even after holding
neighborhood poverty and other demographic characteristics
constant. For an analysis of foster care entry that follows children
over the course of several years, see Magruder and Shaw 2008.
23
A total of 23 children were initially placed in pre-adoptive or
in court-specified homes.
24
Relative placements of all children in foster care dropped from
41 percent to 34 percent of the caseload between 2000 and 2009,
but a large part of this change is likely due to the introduction of
the Kin-GAP program.
25
Placement moves and other factors mean that there are fewer
FFA placements among all children in foster care than among
children newly entering foster care (29% of all child-welfare–
supervised children in foster care in July 2009). At the same
time, FFA placements have grown substantially among all
children in foster care. In July 2000, 18 percent of foster children
were placed with an FFA.
26
Among probation-supervised youth, a group home is the
predominant initial placement—a key difference between probation youth and others. Ninety percent of probation-supervised
youth were first placed in a group home in 2000. By 2009,
96 percent were.
27
In particular, see Foster 2001; Legislative Analyst’s Office
2002; and County Welfare Directors’ Association 2007.
28
For a discussion of foster care rates across the country, see
DePanfilis et al. 2007.
29
In contrast, over a third (34%) of probation youth who entered
foster care in 2008–2009 had already had at least one stay in
foster care.
30
These statistics include youth aging out of eligibility for childwelfare–supervised foster care. Children who have permanent
placements through the Kin-GAP program and the adoption
assistance program also currently lose eligibility for state maintenance payments at age 18.
31
See also Courtney, Dworsky, and Peters 2009; Macomber et al.
2008; and Needell et al. 2002.
32
Information about the types of foster care exit among probationsupervised foster care youth is much less complete than for
child-welfare–supervised youth. Of the 3,865 children and youth
who left probation-supervised foster care in 2008–2009, 1,137
had incomplete information about the type of exit. Although
reporting has improved over the past several years, it is difficult
to assess trends in emancipation for probation youth or even to
determine the true incidence of emancipation among probation
youth (Needell et al. 2010).
33
34
The change is statistically significant at the 5 percent level.
w w w.ppic.org
Foster Care in California
19
At least part of the reason for the decreasing number of
teenagers in foster care is that their numbers in the population
are declining.
References
State General Fund contributions to counties’ programs were
slated to be reduced from close to $800 million in 2008–2009
to just over $700 million in 2009–2010. However, a fall 2009
court order reversed a 10-percent cut to group home rates.
This cut alone was expected to make up about one-third of the
total reduction. Further, a more recent court ruling has led to
increases in group home payments (California Department of
Social Services 2010b).
AFCARS. 2000–2007. Adoption and Foster Care Analysis and
Reporting System. Data obtained from Family Life Development Center, Cornell University. Used with permission from the
National Data Archive on Child Abuse and Neglect (NDACAN).
35
36
However, a five-year federal waiver in place since 2007 gives
two counties, Alameda and Los Angeles, broad flexibility to use
federal funds as they decide (California Department of Social
Services 2009b). Scarcella et al. 2006 compare foster care and
child welfare financing strategies across states.
37
California Blue Ribbon Commission on Children in Foster Care.
2009. Fostering a New Future for California’s Children: Ensuring
Every Child a Safe, Secure, and Permanent Home. Final Report
and Action Plan. San Francisco: Center for Families, Children
and the Courts. Available at www.courtinfo.ca.gov/jc/tflists
/documents/brc-finalreport.pdf.
California Department of Finance. 2007. “Race/Ethnic Population
with Age and Sex Detail, 2000–2005.” Data retrieved October–
December 2009 from www.dof.ca.gov/HTML/DEMOGRAP
/Data/DRUdatafiles.php.
California Department of Social Services. 2004. California
Program Improvement Plan Matrix (Revised 11/2004). Available
at www.dss.cahwnet.gov/cfsweb/res/pdf/PIP/PIPRevised.pdf.
California Department of Social Services. 2009a. Children’s
Bureau Child and Family Services Reviews Program Improvement
Plan (October). Available at www.dss.cahwnet.gov/cfsweb/res
/pdf/ApprovedPIP.pdf.
California Department of Social Services. 2009b. “Title IV-E
Child Welfare Waiver Demonstration Capped Allocation Project.”
Annual progress report. Available at www.dss.cahwnet.gov
/cfsweb/res/pdf/2ndAnnualProgressReport.pdf.
California Department of Social Services. 2010a. “Foster Care
Rates Group Home Facility Listing.” Data retrieved February 16
from www.childsworld.ca.gov/res/pdf/GHList.pdf.
California Department of Social Services. 2010b. “California
Alliance of Child and Family Services v. Cliff Allenby, et al.” All
County Letter 10-15 (March 15). Available at www.dss.cahwnet
.gov/lettersnotices/entres/getinfo/acl/2010/10-15.pdf.
California Department of Social Services. n.d. “CA 237 KG–
Kinship Guardianship Assistance Payment Program (Kin-GAP)
Caseload Movement Report.” Data retrieved August–September
2009 from www.dss.cahwnet.gov/research/PG316.htm.
w w w.ppic.org
20
Foster Care in California
Center for Juvenile Justice Reform. 2009. Racial and Ethnic
Disparity and Disproportionality in Child Welfare and Juvenile
Justice: A Compendium. Washington, D.C.: Center for Juvenile
Justice Reform, Georgetown Public Policy Institute. Available
at cjjr.georgetown.edu/pdfs/cjjr_ch_final.pdf.
Child and Family Policy Institute. 2007. Planning for Success: An
Analysis of California Counties’ Child Welfare System Improvement Plans. Prepared on behalf of the California Department of
Social Services, Children and Family Services Division. Available at http://www.cfpic.org/pdfs/SIP_ImpApp_A.pdf.
Child Welfare Council. 2008. “California Child Welfare Council
(CWC) Vision, Mission, Guiding Principles and Challenge Criteria.” California Department of Health and Human Services.
Available at www.chhs.ca.gov/initiatives/CAChildWelfare
Council/Pages/IssuesandResources.aspx.
Child Welfare Council. 2009. “Data Linkage and Information
Sharing Committee Recommendations to the California Child
Welfare Council.” Executive Summary, California Department
of Health and Human Services. Available at www.chhs.ca.gov
/initiatives/Documents/Data%20Recommendations%209%
2008%2009.doc.
County Welfare Directors’ Association. 2007. “No Family, No
Future.” Policy report. Available at www.cwda.org/downloads
/FamCarePolicyRep.pdf.
Courtney, Mark E. 2009. “The Difficult Transition to Adulthood
for Foster Youth in the US: Implications for the State as Corporate Parent.” Social Policy Report 23 (1).
Courtney, Mark E., Amy Dworsky, and Clark M. Peters. 2009.
California’s Fostering Connections to Success Act and the Costs
and Benefits of Extending Foster Care to 21. Seattle: Partners for
Our Children.
Freisthler, B., D. Merritt, and E. A. LaScala. 2006. “Understanding the Ecology of Child Maltreatment: A Review of the Literature and Directions for Future Research.” Child Maltreatment 11
(3): 263−80.
Hill, Robert B. 2006. Synthesis of Research on Disproportionality in Child Welfare: An Update. Washington, D.C.: Casey-CSSP
Alliance for Racial Equity in the Child Welfare System (October).
Available at www.cssp.org/uploadFiles/Disproportionality_Paper
_Bob_Hill.pdf.
John Burton Foundation. 2009. “THP Plus Annual Report,
Fiscal Year 2008–09.” Available at www.thpplus.org/pdfs/THP
-Plus%20Annual%20Report%20FY%2008-09.pdf.
Legislative Analyst’s Office. 2002. “Analysis of the 2002–03
Budget Bill: Foster Care.” Available at www.lao.ca.gov/analysis
_2002/health_ss/healthss_17_Foster_care_anl02.htm#_
Toc1355796.
Legislative Analyst’s Office. 2008. “Analysis of the 2008–09
Budget Bill: Health and Social Services.” Available at www.lao
.ca.gov/analysis_2008/health_ss/hss_anl08010.aspx.
Legislative Analyst’s Office. 2009. “2009–10 Budget Analysis
Series: Social Services.” Available at www.lao.ca.gov/analysis
_2009/ss/ss_anl09.pdf.
Little Hoover Commission. 2003. Still in Our Hands: A Review of
Efforts to Reform Foster Care in California. Report. Available at
www.lhc.ca.gov/studies/168/report168.pdf.
Lorentzen, Brenda, Amy Lemley, Sara Kimberlin, and Michele
Byrnes. 2008. “Outcomes for Former Foster Youth in California’s
THP-Plus Program: Are Youth in THP-Plus Faring Better?”
Policy brief, John Burton Foundation. Available at thpplus.org
/pdfs/THPPlus%20Policy%20Brief.pdf.
DePanfilis, Diane, Clara Daining, Kevin D. Frick, Julie Farber,
and Lisa Levinthal. 2007. Hitting the M.A.R.C.: Establishing
Foster Care Minimum Adequate Rates for Children. New York:
Children’s Rights (October). Available at www.childrensrights.
org/wp-content/uploads/2008/06/hitting_the_marc_summary
_october_2007.pdf.
Macomber, Jennifer Ehrle, Stephanie Cuccaro-Alamin, Dean
Duncan, Daniel Kuehn, Marla McDaniel, Tracy Vericker, Mike
Pergamit, Barbara Needell, Hye-Chung Kum, Joy Stewart,
Chung-Kwon Lee, and Richard P. Barth. 2008. Coming of Age:
Employment Outcomes for Youth Who Age Out of Foster Care
Through Their Middle Twenties. Research report. Urban Institute. Available at www.urban.org/publications/1001174.html.
Foster, Lisa K. 2001. Foster Care Fundamentals: An Overview
of California’s Foster Care System. CRB-01-008, prepared at
the request of Assemblymember Darrell Steinberg. Available at
www.library.ca.gov/crb/01/08/01-008.pdf.
Magruder, Joseph, and Terry V. Shaw. 2008. “Children Ever
in Care: An Examination of Cumulative Disproportionality.”
Child Welfare 87 (2): 169–88.
w w w.ppic.org
Foster Care in California
21
Mecca, Frank J. 2008. “Funding Child Welfare Services in
California.” Presentation to the Child Welfare Council,
April 14. Available at www.cwda.org/downloads/publications
/cws/CWSPresentation041408.ppt.
U.S. Government Accountability Office. 2007. “African American
Children in Foster Care: Additional HHS Assistance Needed to
Help States Reduce Proportion in Care.” GAO 07-816. Available
at www.gao.gov/new.items/d07816.pdf.
National Data Archive on Child Abuse and Neglect. 2008. Adoption and Foster Care Analysis and Reporting System (AFCARS):
User’s Guide and Codebook for Fiscal Years 2000 to Present.
Ithaca: Family Life Development Center, Cornell University.
Vericker, Tracy, Jennifer Macomber, and Robert Geen. 2008.
“The Story Behind Kinship Care Caseload Dynamics: An Analysis of AFCARS Data, 2000–2003.” Children and Youth Services
Review 30: 437–51.
Needell, Barbara, M. Alan Brookhart, and Seon Lee. 2003.
“Black Children and Foster Care Placement in California.”
Children and Youth Services Review 25 (5/6): 393–408.
Waldfogel, Jane, and Christina Paxson. 2003. “Welfare Reforms,
Family Resources, and Child Maltreatment.” Journal of Policy
Analysis and Management 22 (1): 85–113.
Needell, Barbara, Stephanie Cuccaro-Alamin, Alan Brookhart,
William Jackman, and Aron Shlonsky. 2002. “Youth Emancipating from Foster Care in California: Findings Using Linked
Administrative Data.” Center for Social Services Research,
University of California, Berkeley. Available at cssr.berkeley.edu
/research_units/cwrc/publications_details.html#youth.
Wright, Michael, Sara Tickler, and Kara Vernor. 2008.
Eleven-County Pilot Project Evaluation Report. Santa Rosa:
Results Group. Available at www.childsworld.ca.gov/res/pdf
/11CountyPilot2008.pdf.
Needell, B., D. Webster, M. Armijo, S. Lee, W. Dawson,
J. Magruder, M. Exel, T. Glasser, D. Williams, K. Zimmerman,
V. Simon, E., Putnam-Hornstein, K. Frerer, S. Cuccaro-Alamin,
C. Lou, C. Peng, A. Holmes, and M. Moore. 2010. Child Welfare
Services Reports for California. Retrieved March 23, 2010,
from University of California at Berkeley Center for Social Services Research website. Available at cssr.berkeley.edu/ucb
_childwelfare.
Wulczyn, Fred H., and Bridgette Lery. 2007. Racial Disparity
in Foster Care Admissions. Chicago: Chapin Hall Center for
Children, University of Chicago.
Wulczyn, Fred H., Kristen Brunner Hislop, and Robert M. Goerge.
2000. Foster Care Dynamics 1983–1998: Alabama, California,
Illinois, Iowa, Maryland, Michigan, Missouri, New Jersey, New
York, North Carolina, Ohio, Wisconsin. Report. Chicago: Chapin
Hall Center for Children, University of Chicago.
Reed, Diane F., and Kate Karpilow. 2009. Understanding the
Child Welfare System in California: A Primer for Service Providers
and Policymakers. 2nd ed. Sacramento: California Center for
Research on Women and Families. Available at www.ccrwf.org
/wp-content/uploads/2009/03/final_web_pdf.pdf.
Scarcella, Cynthia Andrews, Roseana Bess, Erica Hecht
Zielewski, and Rob Geen. 2006. The Cost of Protecting Vulnerable Children V: Understanding State Variation in Child Welfare
Financing. Washington, D.C.: Urban Institute. Available at
www.urban.org/url.cfm?ID=311314.
U.S. Department of Health and Human Services. 2008. Final
Report: California Child and Family Services Review (July).
Available at www.dss.cahwnet.gov/cfsweb/res/pdf/CFSRFinal
Report2008.pdf.
U.S. Federal Register. 2008. “Adoption and Foster Care Analysis
and Reporting System; Proposed Rule.” Federal Register 73 (8):
2081–2142. Available at edocket.access.gpo.gov/2008/E7-24860
.htm.
w w w.ppic.org
22
Foster Care in California
About the Authors
Caroline Danielson is a research fellow at the Public Policy Institute of California. Her research interests include changes in social
safety net programs including welfare, child care subsidies, and
nutrition assistance, as well as practices of citizenship. Before
coming to PPIC she was a principal analyst at the University of
California’s Welfare Policy Research Project, a RAND graduate
fellow, and an assistant professor of politics at the State University of New York, Potsdam. She holds a Ph.D. in political science from the University of
Michigan.
Helen Lee is an associate director of research at the Public Policy
Institute of California. Her research interests include the social
determinants of health (with a particular emphasis on health
behaviors), racial/ethnic diversity, immigrant acculturation, and
child health and well-being. Before coming to PPIC, she was a
National Institutes of Health predoctoral fellow and worked as a
research assistant in the Population Studies Center at the University of Pennsylvania. She holds an M.A. in demography and a Ph.D. in sociology from
the University of Pennsylvania.
Acknowledgments
The Adoption and Foster Care Analysis and Reporting System (AFCARS) data used in
this report were made available by the National Data Archive on Child Abuse and Neglect
at Cornell University and have been used by permission. These data were originally
collected by Children’s Bureau of the U.S. Department of Health and Human Services.
Neither the collector of the original data, the funder, the Archive, Cornell University,
nor its agents or employees bear any responsibility for the analyses or interpretations
presented in this report.
The authors would like to thank Lisa Foster, Joseph Magruder, Barbara Needell and
staff at the California Child Welfare Performance Indicators Project, Peggy O’Brien-Strain,
and Deborah Reed for their valuable input at several stages of this project. However,
we bear entire responsibility for the ultimate analysis and interpretation of the data presented in the report.
We are grateful to Richard Greene, Ellen Hanak, and Lynette Ubois at PPIC for their
constructive feedback.
w w w.ppic.org
B o a r d o f D i r e c to r s
WA LT e R B . H e W L e T T, C H A I R
Director
Center for Computer Assisted Research
in the Humanities
D O N N A LU C A S
Chief executive Officer
Lucas Public Affairs
DAv I D M A S M A SU M OTO
M A R k BA L DA SSA R e
Author and farmer
President and CeO
Public Policy Institute of California
S T e v e N A . M e R k SA M e R
R U B e N BA R R A L e S
President and CeO
San Diego Chamber of Commerce
Senior Partner
Nielsen, Merksamer, Parrinello, Mueller &
Naylor, LLP
CO N S TA N C e L . R I C e
J O H N e . B RyS O N
Retired Chairman and CeO
edison International
Co-Director
The Advancement Project
T H O M A S C . SU T TO N
G A Ry k . H A R T
Former State Senator and
Secretary of education
State of California
ROBeRT M. HeRTzBeRG
Retired Chairman and CeO
Pacific Life Insurance Company
CAROL WHITeSIDe
President emeritus
Great valley Center
Partner
Mayer Brown LLP
PPIC is a private operating foundation. It does not take or support positions on any ballot measures or on any
local, state, or federal legislation, nor does it endorse, support, or oppose any political parties or candidates for
public office.
© 2010 Public Policy Institute of California. All rights reserved. San Francisco, CA
Short sections of text, not to exceed three paragraphs, may be quoted without written permission provided that
full attribution is given to the source and the above copyright notice is included.
Research publications reflect the views of the authors and do not necessarily reflect the views of the staff,
officers, or Board of Directors of the Public Policy Institute of California.
Library of Congress Cataloging-in-Publication Data are available for this publication.
ISBN 978-1-58213-139-9
w w w.ppic.org
The Public Policy Institute of California is dedicated to
informing and improving public policy in California through
independent, objective, nonpartisan research.
Additional resources related to social policy are available
at www.ppic.org.
PU B L I C P O L I C y I N S T I T U T e O F C A L I F O R N I A
500 Washington Street, Suite 600 San Francisco, California 94111
Telephone 415.291.4400 Fax 415.291.4401
●
●
PPI C SAC R A M e N TO C e N T e R
Senator Office Building 1121 L Street, Suite 801
Telephone 916.440.1120 Fax 916.440.1121
●
●
●
Sacramento, California 95814


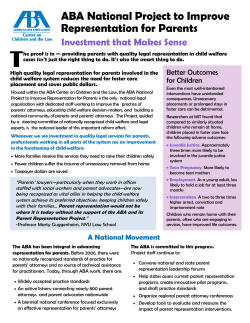


© Copyright 2026