
The Mathematics Enthusiast ISSN 1551-3440
The Mathematics Enthusiast ISSN 1551-3440 VOL. 11, No.3, December 2014, pp.461-754 Editor Bharath Sriraman, The University of Montana Associate Editors: Lyn D. English, Queensland University of Technology, Australia Simon Goodchild, University of Agder, Norway Brian Greer, Portland State University, USA Kyeonghwa Lee, Seoul National University Indexing Information Australian Education Index ; EBSCO Products (Academic Search Complete); EDNA; Directory of Open Access Journals (DOAJ); Psyc-INFO (the APA Index); MathDI/MathEDUC (FiZ Karlsruhe); Journals in Higher Education (JIHE); SCOPUS; Ulrich's Periodicals Directory; International Advisory Board Miriam Amit, Ben-Gurion University of the Negev, Israel Ziya Argun, Gazi University, Turkey Hyman Bass, University of Michigan Raymond Bjuland, University of Stavanger, Norway Morten Blomhøj, Roskilde University, Denmark Egan Chernoff, University of Saskatchewan, Canada Constantinos Christou, University of Cyprus, Cyprus Helen Doerr, Syracuse University, USA Paul Ernest, University of Exeter, UK Viktor Freiman, Université de Moncton, Canada Fulvia Furinghetti, Università di Genova, Italy Anne Birgitte Fyhn, Universitetet i Tromsø, Norway Marja van den Heuvel-Panhuizen, University of Utrecht, The Netherlands Laura Jacobsen, Radford University, USA Kristina Juter, Kristianstad University, Sweden Cyril Julie, University of the Western Cape, South Africa Gabriele Kaiser, University of Hamburg, Germany Yasemin Kýymaz, Ahi Evran Üniversitesi, Turkey Tinne Hoff Kjeldsen, Roskilde University, Denmark Stephen Lerman, London South Bank University, UK Frank Lester, Indiana University, USA Richard Lesh, Indiana University, USA Claus Michelsen, University of Southern Denmark, Odense Reidar Mosvold, University of Stavanger Nicholas Mousoulides, University of Cyprus, Cyprus Norma Presmeg, Tenessee, USA Gudbjorg Palsdottir,University of Iceland Linda Sheffield, Northern Kentucky University, USA Günter Törner, University of Duisburg-Essen, Germany Renuka Vithal, University of KwaZulu-Natal, South Africa Dirk Wessels, UNISA, South Africa Nurit Zehavi, The Weizmann Institute of Science, Rehovot, Israel AIMS AND SCOPE The Mathematics Enthusiast (TME) is an eclectic internationally circulated peer reviewed journal which focuses on mathematics content, mathematics education research, innovation, interdisciplinary issues and pedagogy. The journal exists as an independent entity. It is published on a print-on-demand basis by Information Age Publishing and the electronic version is hosted by the Department of Mathematical Sciences- University of Montana. The journal is not affiliated to nor subsidized by any professional organizations but supports PMENA [Psychology of Mathematics Education- North America] through special issues on various research topics. TME strives to promote equity internationally by adopting an open access policy, as well as allowing authors to retain full copyright of their scholarship contingent on the journals’ publication ethics guidelines: http://www.math.umt.edu/TMME/TME_Publication_Ethics.pdf Journal articles cover a wide spectrum of topics such as mathematics content (including advanced mathematics), educational studies related to mathematics, and reports of innovative pedagogical practices with the hope of stimulating dialogue between pre-service and practicing teachers, university educators and mathematicians. The journal is interested in research based articles as well as historical, philosophical, political, cross-cultural and systems perspectives on mathematics content, its teaching and learning. The journal also includes a monograph series on special topics of interest to the community of readers. The journal is accessed from 110+ countries and its readers include students of mathematics, future and practicing teachers, mathematicians, cognitive psychologists, critical theorists, mathematics/science educators, historians and philosophers of mathematics and science as well as those who pursue mathematics recreationally. The editorial board reflects this diversity. The journal exists to create a forum for argumentative and critical positions on mathematics education, and especially welcomes articles which challenge commonly held assumptions about the nature and purpose of mathematics and mathematics education. Reactions or commentaries on previously published articles are welcomed. Manuscripts are to be submitted in electronic format to the editor in APA style. The typical time period from submission to publication is 8-12 months. The journal is published tri-annually. Visit http://www.math.umt.edu/TMME/. Finnmark Coastline © 2014 Bharath Sriraman THE MATHEMATICS ENTHUSIAST ISSN 1551-3440 Vol. 11, No. 3, December 2014, pp. 461–754 “If you are feeling helpless, help someone”- Aung San Suu Kyi FEATURE ARTICLES 0. 1. 2. 3. 4. 5. 6. 7. 8. 9. 10. 11. Editorial: Is Every TME issue special? Bharath Sriraman (USA)…………………………………………………………….…………….pp.461-462 The Miracle of Applied Mathematics Frank Blume (USA)…………………………………………………………………….….…..….pp.463-474 Generalizing Cantor-Schroeder-Bernstein:Counterexamples in Standard Settings Tien Chih (USA)…………………………………...…………………………………………..….pp.475-484 Bhaskara’s approximation for the Sine Karel Stroethoff(USA)…………………………………………………………….………………pp.485-494 The development of Calculus in the Kerala School Phoebe Webb (USA)………………………………………………………………………………pp.495-512 Development of the Binary Number System and the Foundations of Computer Science Daniel R. Lande (USA)…………………………………………………..…………… …………pp.513-540 Pursuing Coherence Among Proportionality, Linearity, and Similarity: Two Pathways From Preservice Teachers’ Geometric Representations Hyung Sook Lee (USA) & Jaehoon Yim (Korea)……………………….……………… ………pp.541-554 Difficulties in solving context-based PISA mathematics tasks: An analysis of students’ errors Ariyadi Wijaya(Netherlands/Indonesia); Marja van den Heuvel-Panhuizen (Netherlands); Michiel Doorman(Netherlands); Alexander Robitzsch (Austria)…………………..……………..pp.555-584 A study on Malaysian Mathematicians’ Way of Knowing Lim Chap Sam (Malaysia)………… ………………………………………….…………….…..pp.585-642 Numerically Integrating Irregularly-spaced (x, y) Data B. Cameron Reed (USA)………………………………………………………….………………pp.643-648 Math as a tool of Anti-Semitism Jay Egenhoff (USA)………………………………………………………………………………pp.649-664 Reasoning-and-Proving Within Ireland’s Reform-Oriented National Syllabi Jon Davis (USA)……………………………………………………………………………..……pp.665-706 12. An Examination of Pre-service Secondary Mathematics Teachers’ Conceptions of Angles Melike Yilgit (Turkey)……………………………………………………………………….……pp.707-736 Discussion Forum: The Common Core Standards 13. Common Sense about the Common Core Alan H. Schoenfeld (USA)……………………………………………………………….………..pp.737-744 14. Scholastic Standards in the United States – The Discussion concerning the ‘Common Core Alan Schoenfeld & Guenter Toerner (Germany)……………………………………………….…pp.745-752 REVIEWS 15. Book Review of The Tower of Hanoi: Myths and Maths (Birkhäuser) Cory Palmer (USA)…………….…………………………………………………………………pp. 753-754 Rainbow over Gulfoss © 2014 Bharath Sriraman TME, vol. 11, no. 3, p. 461 Editorial: Is Every TME Issue Special? Bharath Sriraman1 University of Montana I am pleased to present the third issue of volume 11, which brings the 11th year of The Mathematics Enthusiast to a culmination. This issue is (mis)labeled as a special issue on the topic “Is every TME issue special?” The reader is undoubtedly curious as to the purposeful mischief indulged in by the journal. About 15 months ago, I started receiving e-mails from various members from the mathematics education community, as to whether the journal now only publishes special issues in mathematics education? In addition I started receiving e-mails from members in the mathematics community asking whether the journal is no longer interested in receiving math-oriented manuscripts. These e-mails were provoked by the fact that the last four issues going back to vol.10,nos.1 and 2 (January 2013) were on special topics such as international perspectives on problem solving; a survey of NSF MSP projects; the 2010 BIRS workshop on Teachers as Stakeholders in MeR; and McK of Elementary School Teachers from a PMENA focus group. Notice that the last sentence is heavy on the use of acronyms borrowed from the mathematics education community barring “BIRS” which is well known to the mathematics community. This does suggest that the journal has focused heavily on mathematics education issues for the last two years. However this does not mean that this pattern will continue indefinitely. The current issue breaks the pattern despite the mischievous (mis)labeling in that the focus is back on topics in mathematics. The current issue also highlights the roots of the journal, namely in Montana- in that many of the articles have been authored by faculty and students in the mathematical sciences department of the University of Montana. The math pieces examine myriad and provocative issues such as the beauty of applied mathematics; integrating irregularly spaced (x,y) data; the historical and mathematical significance of the development of trigonometric “functions” in India and its connection to the progress of Calculus; the counterexamples that result from trying to generalize the Cantor-Schröder-Bernstein theorem; and the mis(use) of mathematical problems as a tool for anti-Semitism!. The mathematically astute reader will find the more math oriented pieces interesting and easy to read. There is also a sampling of mathematics education oriented papers in contributions that address conceptions/misconceptions in the idea of angles and proportionality, in addition to context based problems in the PISA examinations. These articles come from an international cast of mathematics educators. Two other articles address reform in mathematics education and beliefs of mathematicians in Ireland and Malaysia respectively. Lastly the Common Core Standards have become a major point of discussion in the U.S, and spreading to other countries which have a federal governance structure (such as Germany). Two prominent mathematics “educators” Alan Schoenfeld (from Berkeley) and Günter Törner (from Duisburg-Essen) discuss the purpose and ramifications of these new Standards. The discussion forum is interesting for this particular journal because it is written by two mathematicians trained in pure mathematics, who 1 [email protected] The Mathematics Enthusiast, ISSN 1551-3440, vol. 11, no. 3, pp. 461-462 2014© The Author(s) & Dept. of Mathematical Sciences-The University of Montana Sriraman have pursued mathematics education as a domain of research. The issue also includes a review of a delightful Birkhäuser book on the Tower of Hanoi. Taken as a whole, it is hoped that the mathematical (and the Montana) roots of the journal become evident. To those that insist on hyphenating mathematics-education, there are mutually exclusive sections that cater to mathematics, and to education respectively. For those that view mathematics education as an unhyphenated whole, there is a critical mass of articles which reveal the content of mathematics as the driving force of the educational issues that arise from it. I will let the reader decide for themselves. As a reminder to the community, this journal exists as an independent entity. It is published on a printon-demand basis by Information Age Publishing and the electronic version is hosted by the Department of Mathematical Sciences- University of Montana. Authors retain full copyright of their work! The journal is not affiliated to nor subsidized by any professional organizations but supports PMENA [Psychology of Mathematics Education- North America] through special issues on various research topics. As a parting salvo, and speaking of patterns- the next two issues of the journal (all of 2015) are focused on special topics. I will not reveal what is coming in the first two issues of 2016- and if one assumes that they are also focused on special topics, then does the developing pattern make the current issue special? TME, vol. 11, no. 3, p. 463 The Miracle of Applied Mathematics Frank Blume John Brown University ABSTRACT: We provide an outline of a college-level lecture on systems of differential equations that is intended to offer an alternative, integrative view of the subject. Particular emphasis is placed on the fact that very elementary concepts and insights can be employed to gain access to a very wide range of important applications, including the Schr¨ odinger equation, the Klein-Gordon equation, the Laplace equation, and the Poisson equation. Keywords: applicability of mathematics, systems of differential equations, partial differential equations, approximate solutions The Mathematics Enthusiast, ISSN 1551-3440, vol. 11, no. 3, pp. 463–474 c 2014The Author(s) & Dept. of Mathematical Sciences-The University of Montana Blume, p. 464 1 Introduction In the teaching profession, as in many other professions, an initially bright aspiration is all too often overcome by chronic, nagging frustration. The original enthusiasm that once inspired a person’s choice of vocation will tend to dissipate as so-called real-world pressures take their toll, depleting mental energy and putting tight constraints on free creative acts. Ideally, a college classroom ought to be a place where genuine communication engages minds and changes lives by stimulating joyful curiosity and honest exploration. But in an academic environment in which the publish-or-perish mentality is prevalent and extreme over-specialization corrupts the educational mission, these worthy goals will often seem remote or even wholly out of reach. One way to counter such adversities is to be very intentional in setting aside some time for topical excursions that broaden the view and thereby re-energize the minds of students and teachers alike. This is not to say, of course, that large chunks of course content ought to be sacrificed to random pursuits of topical tangents. But it is to say that the cultivation of a certain versatility in subject matter selection may help to re-invigorate a teaching effort which, perhaps, has come to be burdened over time by a general loss of creative momentum. To give the reader a concrete example of how such versatility can be practiced without straying all too far from standard course material, I would like to provide an outline of a lecture that I have given in each of the past three years in my course on differential equations at John Brown University. The students taking this course are mostly engineering majors in their second year and have successfully completed Calculus I and II. They are used to placing mathematics in an application-oriented problem-solving context but have never been exposed to the full theoretical rigor that mathematics majors can be expected to practice. Consequently, some of the steps in the calculations that follow will be skipped over relatively lightly without providing concise analytical proofs. This lack of rigor, though, can easily be overcome, as any reader familiar with the fundamental principles of real analysis can simply look up the relevant arguments in standard analysis textbooks. In order not to cause any misunderstandings, it also needs to be emphasized that—at the time when the lecture is given—the students in attendance are already well familiar with the theory of linear systems of differential equations and have studied in particular the representation of solutions by means of exponential matrices. So the purpose here is not to communicate new mathematical content but rather to offer a hopefully interesting alternative view. TME, vol. 11, no. 3, p. 465 2 Outline of the Lecture One of the most important problems in the study of differential equations is the computation of solutions of linear systems of the form y0 (t) = Ay(t) + f (t), (1) where A is a constant n × n-matrix and f a continuous vector-valued function. The range of applications to which such systems are relevant is very wide indeed. From electric networks, multiple overflow systems, and mechanical linkages of masses pulled by springs, the spectrum readily extends to chemical bonds in solid-state matter, to the entire classical theory of quantum mechanics by way of the Schr¨ odinger equation, and even more generally, to just about any theory or field that is described by linear partial differential equations. Given this very broad applicability, it is truly amazing to realize that the problem of solving equation (1) can be reduced to the following three elementary tasks: Task 1: drawing tangents to a graph. Task 2: rearranging beads of two different colors. (2) Task 3: drawing balls at random from two bowls. How is it possible that these three basic tasks combine to give us access to such a vast array of physical phenomena? What is the link from beads to Schr¨ odinger’s equation, from random draws to circuits, or from tangents to a graph to masses pulled by springs? The most direct reply that we can give is to observe that in Task 1 we merely face the problem of computing a derivative: we take the limit of the secant slope f(x + ∆x) − f(x) ∆x and write, as usual, the following equation: d f(x + ∆x) − f(x) f(x) := f 0 (x) := lim . ∆x→0 dx ∆x (3) However, the fact that this equation is so solidly familiar need not per se diminish our sense of genuine astonishment. For absent our prior knowledge of the calculus we scarcely would suspect that such a simple formula for converting secant into tangent slopes might somehow enable us to understand, let’s say, how currents in a network oscillate or quantum waves disperse. That said, we now will turn to our second task of rearranging beads. To do so we suppose that we are given five colored beads—two blue ones and three yellow ones. Denoting these beads by two Blume, p. 466 different letters, say a and b, we proceed to inquire in how many ways these letters can be lined up in a row. How many patterns can these letters form when placed adjacent to each other? The answer is determined most efficiently by indexing the letters with numbers so as to render them pairwise distinct. This yields the following symbols: a1 , a2 , b 1 , b 2 , b 3 . Since the number of arrangements (or permutations) of these five distinct symbols is 5!, it follows that the number of patterns formed by two letters a and three letters b (without the indices) is 5 5! = = 10 2 2!3! because the product 2!3! in the denominator equals the number of ways in which the indices alone can be permuted without affecting the arrangement of the letters a and b. At this point in the presentation the students in the audience can be expected to infer (or recall) quite readily that, in general, the number of arrangements of k letters a and n − k letters b in a row of length n is n n! = . k k!(n − k)! However, in my experience at least, most students are very hard pressed when asked to remember or to deduce how the combinatorial argument just given relates to the binomial expression (a + b)n . To help them better see the link I commonly consider as an example the case where n = 3 or n = 4. In expanding the power (a + b)3 (or (a + b)4 ) into 23 (or 24 ) terms, it is not difficult to make the students realize that the number of summands in this expansion that are equal to ak bn−k is precisely the number of arrangements of k letters a and n − k letters b in a row of length n. Thus we find that n (a + b) = n X n k=0 k ak bn−k . (4) Having arrived at this binomial formula, we now apply it to the term (1 + x/n)n . This yields n n n X x n X n x k X n(n − 1) · · · (n − k + 1) xk 1 k − 1 xk 1+ = = = 1− ··· 1− , n k n nk k! n n k! k=0 k=0 k=0 and with a bit of faith (or analytical insight) we may therefore infer that ∞ ∞ X x n X 1 k − 1 xk xk lim 1 + = 1− ··· 1− = . n→∞ n ∞ ∞ k! k! k=0 k=0 With this result in place we pick an arbitrary a ∈ R and set ∞ g(x) := lim n→∞ 1+ ax n X ak xk = (= eax ). n k! k=0 TME, vol. 11, no. 3, p. 467 To proceed, we return to Task 1 and ask how the tangents to the graph of g are to be drawn. Using (3) together with some basic trust in the interchangeability of limits and sums, we find that ∞ g0 (x) = lim ∆x→0 g(x + ∆x) − g(x) X ak (x + ∆x)k − xk = lim . ∆x k! ∆x→0 ∆x k=0 Since ! k X (x + ∆x)k − xk 1 k i k−i k lim = lim (∆x) x −x (by (4)) ∆x→0 ∆x→0 ∆x ∆x i i=0 k k X 1 X k k k k−1 k!xk−1 (∆x)i xk−i = lim (∆x)i−1 xk−i = x = = kxk−1, = lim ∆x→0 ∆x→0 ∆x i i 1 (k − 1)! i=1 i=1 it follows that g0 (x) = ∞ X kak xk−1 k! k=0 =a ∞ X ak−1 xk−1 k=1 (k − 1)! =a ∞ X ak x k k=0 k! , and therefore, g0 (x) = ag(x). (5) At this point of our discussion we shift gears once again and direct our attention at Task 3. That is to say, we consider two bowls—one white and one black—that each contain five balls marked with either a zero or a one (see Figure 1). Whenever we draw a ball at random from one of these two 0 0 0 0 1 0 black bowl 0 1 1 1 white bowl Figure 1: a probability experiment. bowls, we record the number written on it and put it back into the bowl from which we took it. If the number recorded was a zero we will draw next a ball from the white bowl, and otherwise, if the number was a one, we will draw a ball from the black bowl. Given this rule and given the distribution of balls shown in Figure 1, we readily find the following array of transitional probabilities: p P := 00 p10 p01 p11 = 2/5 3/5 . 4/5 1/5 A natural problem that we may consider concerning this experiment is the computation of a longterm expectation: in what relative proportion do we expect to draw zeros and ones as the number of draws increases to infinity? The first step in approaching this problem is the calculation of higher-order Blume, p. 468 transitional probabilities. When we ask, for instance, how likely it is to draw a zero given that the next to last draw was a zero as well, we easily realize that the probability in question is p00 (2) = p00 p00 + p01 p10 . That is to say, the probability p00 (2) is the 00-element of the twofold matrix product of P with itself. More generally and by direct analogy, the n-step transitional probabilities pij (n) are the elements of the n-fold product of P with itself: p00 (n) p10 (n) p01 (n) = Pn . p11 (n) Furthermore, as we increase the number of bowls in synchrony with the number of digits written on the balls, we are led to introduce analogous computational schemes for probability arrays P of higher dimensions. So what we see happening here is the natural emergence of the operation of matrix multiplication for square-shaped m × m numerical arrays. To be sure, there are various other paths along which the notion of a matrix product can be plausibly encountered. But even so it is surprising to notice that a simple probability experiment involving nothing more than the drawing of balls of two different kinds from two different bowls has led us to define an algebraic operation that allows us to extend the concept of a power of a number to numerical arrays. By implication, if we further define the matrix sum and scalar product componentwise, we may in fact replace the parameter a in the definition of g by an n × n matrix: g(t) := ∞ X Ak tk k=0 k! (= eAt ), where A0 := Id. Moreover, as we now ask how the tangent lines to the component functions of g are to be drawn, we find—in much the same way as in the derivation of (5)—that g0 (t) = Ag(t). Multiplying both sides of this equation by a constant vector C (in the manner suggested by the multiplication of A with itself) and setting y(t) := g(t)C, (6) it follows that y is a solution of the homogeneous equation y0 (t) = Ay(t). (7) TME, vol. 11, no. 3, p. 469 By the standards of contemporary mathematics it seems fair to assert that the conceptual distance which we just traveled in demonstrating that (6) is a solution of (7) was very small indeed. Thus we rightly feel astonished as we now come to realize that we are given here the key to one of the most fundamental and most important theories in all of modern physics: the Schr¨ odinger description of quantum mechanics. According to Schr¨ odinger, physical entities such as electrons, atoms, molecules, or even larger-scale macroscopic systems are universally described by a wave-function ψ that mathematically encodes a given system’s total information content. For a particle of mass m with potential energy V (x) the Schr¨ odinger equation that ψ satisfies assumes the following form: − ~ ∂ψ ~2 ∂ 2 ψ =− + V (x)ψ. i ∂t 2m ∂x2 In order to solve this equation approximately (which is always sufficient from an empirical point of view), we replace the continuous variable x by discrete points . . . x−1 , x0 , x1 , x2 , . . . , xk , . . . , where the separation xk+1 − xk = ∆x is thought to be extremely small. Since particles are commonly localized within a certain finite space, we may assume that there exists an n ∈ N such that ψ(t, xk ) = 0 for all k ∈ Z r {1, . . . , n}. Setting yk (t) := ψ(t, xk ) and Vk := V (xk ) and observing that ∂ 2 ψ(t, xk ) ∂ ψ(t, xk+1 ) − ψ(t, xk ) ≈ ∂x2 ∂x ∆x (ψ(t, xk+2 ) − ψ(t, xk+1 ))/∆x − (ψ(t, xk+1 ) − ψ(t, xk ))/∆x ≈ ∆x yk+2 (t) − 2yk+1 (t) + yk (t) = , ∆x2 we may apply the Schr¨ odinger equation to infer that yk0 (t) ≈ i~(yk+2 (t) − 2yk+1 (t) + yk (t)) iVk yk (t) − . 2m∆x2 ~ Letting the index k vary from 1 to n and setting i~ iV1 − 2 2m∆x ~ A := 0 .. . −i~ m∆x2 i~ iV2 − 2m∆x2 ~ .. . i~ 2m∆x2 −i~ m∆x2 .. . 0 0 ... i~ 2m∆x2 .. . 0 .. . ... .. . 0 0 , .. . Blume, p. 470 we may write the corresponding system of differential equations in the following matrix form: 0 y1 (t) y1 (t) y0 (t) = ... ≈ A ... = Ay(t). yn0 (t) yn (t) As we saw, the general solution of this equation is y(t) = g(t)C. A similar approach can also also be applied to linear partial differential equations that are of a higher order in t. To see why this is so, we may consider for example the Klein-Gordon equation of elementary relativistic quantum physics: ∂2ψ ∂2ψ − + m2 ψ = 0. ∂t2 ∂x2 Setting again yk (t) := ψ(t, xk ), we readily find that yk00 (t) ≈ yk+2 (t) − 2yk+1 (t) + yk (t) − m2 yk (t). ∆x2 In order to reduce this system of equations to first order, we introduce the substitutions u1 (t) := y1 (t), u2 (t) := y10 (t), .. . (8) u2n−1 (t) := yn (t), u2n (t) := yn0 (t). This yields u01 (t) u1 (t) u0 (t) = ... ≈ A ... = Au(t), u02n (t) where 0 1 2 ∆x2 − m 0 A := 0 .. . 1 0 0 0 .. . 0 −2 ∆x2 0 1 − m2 ∆x2 .. . u2n(t) 0 0 1 0 .. . 0 1 ∆x2 0 −2 ∆x2 .. . 0 0 ... 0 0 0 ... 0 0 1 ∆x2 .. . ... 0 0 . 0 .. . 0 .. . ... .. . (9) Evidently, the methods employed in the preceding two examples can also be easily used to approximately solve numerous other partial differential equations such as the classical wave equation 2 ∂2ψ 2∂ ψ − v = 0, ∂t2 ∂x2 TME, vol. 11, no. 3, p. 471 the density preservation equation ∂ρ ∂ρ ∂v +v +ρ = 0, ∂t ∂x ∂x the heat equation ∂T ∂2T =k 2, ∂t ∂x or the Laplace equation ∂2ψ ∂ 2ψ + = 0. ∂x2 ∂y2 Having reached this conclusion, it only remains for us to discuss the problem of finding the general solution of the inhomogeneous equation (1). As it turns out, even in solving this more general equation we do not stray far from the conceptual context so far established. To see why this is so, we need to recall that the standard method for generating a solution of (1) is to vary the constant vector C in the definition of y. That is to say, we set y(t) := g(t)C(t) (10) and try to determine C(t) from the requirement that y be a solution of (1). This yields—by way of the product rule—the following vector equation: g(t)C0 (t) = f (t). In order to eliminate the factor g(t) on the left, we need to demonstrate first that g(s+t) = g(s)g(t) for all s, t ∈ R. To do so, we multiply term by term (with a bit of faith) the series that represents g(s) with the one that represents g(t). Using the binomial formula (i.e., the task of rearranging beads), we easily find that the product thus obtained is indeed equal to g(s + t). Setting s := −t and observing that g(0) = Id, it follows that C0 (t) = g(−t)f (t). At this point any student of the calculus is bound to recognize that C(t) can be obtained by means of antidifferentiation: C(t) = C(0) + Z t g(−τ )f (τ ) dτ. (11) 0 However, the fact that this deduction is so frequently performed does not at all imply that its essential nature is universally well understood. In other words, it usually takes quite a bit of reminding for students to recall that what is involved in this case is nothing more than a simple cancellation of Blume, p. 472 terms in a sum: Z t C0 (τ ) dτ ≈ 0 n−1 X C0 (τk )∆τ ≈ k=0 = n−1 X C(τk + ∆τ ) − C(τk ) ∆τ ∆τ k=0 n−1 X (C(τk+1 ) − C(τk )) = C(t) − C(0). k=0 Finally, with this explanation added, we may combine (10) and (11) to conclude that y(t) = g(t)C(0) + g(t) Z t g(−τ )f (τ ) dτ 0 is a solution of the inhomogeneous linear system given in (1). As is well known, this formula allows us to determine, for example, the solutions of multiple-spring mechanical systems that are subject to external forces and electric networks that are controlled by external voltages. But it also allows us to approximately solve inhomogeneous partial differential equations such as, for instance, the Poisson equation: ∂2ψ ∂2ψ + 2 = ρ(x, y). ∂x2 ∂y (12) For as we set 0 −1 ∆y2 A := 0 0 .. . 1 0 0 0 .. . 0 2 ∆y2 0 −1 ∆y2 .. . 0 0 1 0 .. . 0 −1 ∆y2 0 2 ∆y2 .. . 0 0 ... 0 0 0 ... 0 0 −1 ∆y2 .. . ... 0 0 0 .. . 0 .. . in direct analogy to (9), ... .. . ρk (x) := ρ(x, yk ), and 0 ρ1 (x) 0 f (x) := ρ2 (x) , .. . 0 ρn (x) we find that the 2n-dimensional first-order system that approximately represents equation (12) is u0 (x) = Au(x) + f (x) where the components of u, of course, are defined in a manner analogous to (8). TME, vol. 11, no. 3, p. 473 In the light of this concluding example, we may rightly assert that the potential range of applications of equation (1) is very extensive indeed. By implication, we may say that the three basic tasks, listed in (2), provide us access to a very vast array of physical phenomena—and that, no doubt, is truly astounding! Suggested Further Readings: • Davies, Paul, Why is the Universe Knowable?, in Mathematics and Science, Mickens, Ronald E. ed., World Scientific, Singapore, 1998. • Dewdney, A.K., A Mathematical Mystery Tour, John Wiley & Sons, New York, 1999. • Wigner, Eugene P., The Unreasonable Effectiveness of Mathematics, in Mathematics and Science, Mickens, Ronald E. ed., World Scientific, Singapore, 1998. Blume, p. 474 TME, vol. 11, no. 3, p. 475 Generalizing Cantor-Schroeder-Bernstein: Counterexamples in Standard Settings Tien Chih Newberry College ABSTRACT: The Cantor-Schroeder-Bernstein theorem [Can97][Sch98][Ber05] states that any two sets that have injections into each other have the same cardinality, i.e. there is a bijection between them. Another way to phrase this is if two sets A, B have monomorphisms from A to B and B to A, then they are isomorphic in the setting of sets. One naturally wonders if this may be extended to other commonly studied systems of sets with structure and functions which preserve that structure. Given two objects with injective structure preserving maps between them are the structures of these objects the same? In other words, would these two objects be isomorphic in their respective setting? We see that in vector spaces, which are determined completely by their bases sets, this is true. However, when the objects are graphs, groups, rings or topological spaces, one may find counterexamples to such an extension. This is interesting, as it contradicts the naive intuition that two objects which are “subobjects” of each other must be the same. In this paper we provide some of these counterexamples. Keywords: Cantor-Schroeder-Bernsetin Theorem, Counterexamples, Object Isomorphisms, Set Theory The Mathematics Enthusiast, ISSN 1551-3440, vol. 11, no. 3, pp. 463-474 201 c 2014The Author(s) & Dept. of Mathematical Sciences-The University of Montana Chih, p. 476 1 Introduction The Cantor-Shroeder-Bernstein theorem was first proposed by Cantor in 1895 [Can97]. It was proved erroneously by Schroeder in 1896 [Sch98]. Then finally proved by Bernstein in 1897 [Ber05]. It states that if there were two sets with injective functions into each other, then they were isomorphic as sets i.e. there was a bijection between them. This provides a convenient way to establish the existence of bijections between certain (non-countable) sets, in particular the real numbers R and the set of 0 and 1 valued sequences {0, 1}N , which demonstrates the uncountablity of R [Mun75]. Naturally, one wonders if this result could be extended to sets with structure, together with injective maps that preserve said structure. If such an extension held, this would provide an extremely powerful way to establish isomorphisms between different structures. However, we will see that this is generally not true. We begin with a proof of the Cantor-Schroeder-Bernstein Theorem. We then discuss why it may seem plausible to believe that this result may be extended. We then provide counterexamples to such an extension for Topological Spaces, Rings both with and without unity, Groups and Graphs. We use standard definitions and notation which may be found in [BM08], [DF04], [Mun75]. 2 Proof of the Cantor-Schroeder-Bernstein Theorem We first begin with the author’s proof of the Cantor-Schroeder-Bernstein Theorem: Theorem 2.1 (Cantor-Schroeder-Bernstein). Let A, B be sets, and let f : A ,→ B, g : B ,→ A, then A ∼ =B This proof is similar to the one found in [Hal60]. ¯ denote the complement of X). Proof. (Note: we let X ∞ [ Let S := (f g)i (f (A)) ⊆ B, where (f g)0 is the identity by convention. We then define i=0 h : A → B, x 7→ g −1 (x) if x ∈ g(S) f (x) otherwise and propose that h is a bijection. It is clear that g −1 |g(S) serves as a bijection from g(S) to S. It is also clear that since f is a injection, that it is a bijection onto whatever its image is. Thus it suffices to show that the image of g(S) under f is exactly the complement to the image of g −1 |g(S) , that is S¯ ¯ and showing this completes the proof. In other words, I claim: f (g(S)) = S, TME, vol. 11, no. 3, p. 477 ⊆. Suppose, that the left hand side is not contained in the right hand side, then ∃ x ∈ f (g(S)) ∩ S. Since x ∈ S, x = (f g)m (z), z ∈ f (A), m ∈ N. But if m > 0, then x ∈ f (g(S)), which is a contradiction to x ∈ (g(S)). Thus x = z ∈ f (A), but we see that f −1 (x) is defined, and x ∈ f (A) are precisely the elements where f −1 is not defined. Thus this is also a contradiction, and therefore no such x exists Note that this also says that h is injective, that the map defined as f does not overlap with the map defined as g −1 . ¯ and notice that S¯ = S∞ (f g)i (f (A)) = T∞ (f g)i (f (A)). Then since ⊇. Let x ∈ S, i=0 i=0 (f g)0 = idB , we may say that x ∈ f (A). Thus we may write x = f (a), a ∈ A, and we want to show that a ∈ g(S), but this must be true, otherwise a ∈ g(S) implies x = f (a) ∈ S, contradictory to our original choice of x. Note that this also says that h is surjective, that the map defined as f is onto the subset of B, that is not mapped to by g −1 . We can see here that it possible to construct a map via the two given injections. It also clear, that this map, defined in such a complicated and fractured way, would be very unlikely to preserve any structure A, B might have had, even if f, g originally were structure preserving maps of some sort. However, it does not rule out the possibility that there is some other bijection between A, B, such that the structure of the sets are preserved. Moreover, perhaps sets with particularly strong structures would require f, g to be defined in such a way that would only allow the existence of such embeddings if they were the same object. 3 Vector Spaces An extension of Cantor-Schroeder-Bernstein does in fact hold for vector spaces over a division ring D. In fact it does so via an application of the Cantor-Schroeder-Bernstein Theorem. Theorem 3.1 (Dimension Theorem [Axl97]). Given a division ring D and a D (left) vectorspaceV , then given any bases for V , B1 , B2 , then the cardinalities |B1 | = |B2 |. Thus dimension is an invariant. Proof. Suppose |B2 | > |B1 |. Notice that given any element v ∈ V , we may write v = P bi ∈Ej di · bi , where di ∈ D and Ej ⊆ B1 , |Ej | < ∞. Note that the collection of all Ej (all finite subsets of Bi ) Chih, p. 478 has the same cardinality as B1 . Thus there is a b ∈ B2 which is not the linear combination of any of the elements of B1 . Thus B1 ∪ {b} is a linearly independent set, contradicting B1 a basis. Then, by Cantor-Schroeder-Bernstein, we have the following result: Theorem 3.2. Let D be a division ring, and let V1 , V2 be (left) vector-spaces over D, such that there are linear monomorphisms ϕ1 : V1 → V2 and ϕ2 : V2 → V1 . Then V1 ∼ = V2 . Proof. Let Bi be a basis for Vi . Then consider that ϕ1 (B1 ) is a linearly independent set in V2 , and so extends to a basis C2 in V2 . Similarly, ϕ2 (B2 ) extends to a basis C1 of V1 . So by the dimension theorem, we have bijections: ψi : Bi → Ci . Then ψ2−1 ◦ ϕ1 : B1 → B2 is an injection. Similarly, ψ1−1 ◦ ϕ2 : B2 → B1 is also an injection. So by the Cantor-Schroeder-Bernstein Theorem, there is a bijection τ : B1 → B2 . This bijection between bases τ , extends uniquely to a linear isomorphism T , and thus V1 ∼ = V2 . 4 Topological Spaces When one considers extensions of the Cantor-Schroeder-Bernstein Theorem, a setting to consider would be topological spaces. However in the setting of topological spaces we find a very simple counterexample. Proposition 4.1. Let A := (−1, 1) with the subspace topology of R, and let B := [−1, 1] also with the subspace topology. Then there are embeddings from A to B and from B to A, but A and B are not homeomorphic. Proof. A clearly embeds into B via the inclusion ϕ : A ,→ B, x 7→ x, and ψ : B ,→ A, y 7→ y/2, since both maps are non-zero linear maps when extended to R, they are continuous and injective. To show that A and B are not homeomorphic, suppose that χ : A → B were a homeomorphism, then let z = χ−1 (−1). z would then be a limit point of the sets (−1, z), (z, 1), and thus −1 would be a limit point of the image of both sets under χ, and since they are non intersecting, so would their images. This is not possible and thus a contradiction. We notice that there are many ways to show that (−1, 1) and [−1, 1] are not homeomorphic. For example, one may consider that by the Heine-Borel Theorem [Mun75], [−1, 1] is compact while (−1, 1) is not. Most of these arguments are topological in nature, and do not extend to other settings. In the following sections, we will see an argument for non-isomorphism which extends nicely to other settings. TME, vol. 11, no. 3, p. 479 5 Rings In this section, we begin with a counterexample to an extension of Cantor-Schroeder-Bernstein for rings without unity. We then modify these rings to exhibit a counterexample for rings with unity. First, some preliminary facts are stated: Lemma 5.1 ([DF04]). If D is a division ring, then for n ∈ Z+ , the matrix ring Mn (D) is a simple ring. Proposition 5.2. Let R := ∞ M M2i (Z2 ), S := i=1 ∞ M M2i+1 (Z2 ), then there exist embeddings from R i=1 to S and from S to R, but these are non isomorphic rings. Proof. We first show that there exists injections from R ,→ S and S ,→ R. Notice that for a given ring T , there there is a very natural embedding ι : Mk (T ) ,→ Mk+1 (T ) for any value k, where ι(M )(a,b) = M(a,b) if 0 ≤ a, b ≤ k and ι(M )(a,b) = 0 otherwise. Thus there are natural embeddings ϕ, ψ: R: M2 (Z2 ) ⊕ M4 (Z2 ) ψ ϕ S: M3 (Z2 ) ⊕ M5 (Z2 ) ⊕ ϕ ⊕ ··· ψ ψ ϕ ⊕ M6 (Z2 ) M7 (Z2 ) ϕ ⊕ ··· Where ϕ|Mk (Z2 ) : Mk (Z2 ) ,→ Mk+1 (Z2 ) and similarly for ψ. However, these rings are not isomorphic, and to show this, we first need to state some facts: We then show that there are no onto homomorphisms, and thus no isomorphism, from S to R. Let χ : S → R be a ring homomorphism, and let ρ2n : R → M2n (Z2 ) be the projection homomorphism. Notice that χ|M2n+1 (Z2 ) is also a ring homomorphism for any n. Since M2n+1 (Z2 ) is simple, it’s image is either 0 or isomorphic to itself. Consider the composition ρ2 ◦ χ|M2n+1 (Z2 ) . Since each M2n+1 (Z2 ) has vector space dimension greater than four over Z2 , their image under ρ2 ◦ χ|M2n+1 (Z2 ) must be 0. Thus, no homomorphism from S → R is onto the first summand of R, and thus there are no onto homomorphisms, or isomorphisms from S to R. However, this example is limited, since we are taking the infinite direct sums of rings, neither ring contains a unity element. We have not shown that this extension would not hold when R, S Chih, p. 480 are unital rings. However, we may use a standard construction to construct two rings with unity from these rings. Theorem 5.3. Let S be a ring without unity, such that S is an T -algebra, and T is a ring with unity. Then define S 0 on the set T ⊕ S, with coordinate wise addition, and multiplication (a, B) ∗ (c, D) = (ac, aD + Bc + BD), where aD, Bc are algebra actions, and BD is product in S. Then S 0 is a ring with unity: (1T , 0), with S as a subring. This is often called the standard (universal) unitization of the algebra S. Proof. It is elementary, albeit tedious and unenlightening to check the axioms of associativity, distributivity, and closure. It is similarly simple to check that {0} ⊕ S is a subring isomorphic to S. Thus, here only the fact that (1T , 0) = 1S 0 is checked. Let (a, b) ∈ S 0 , (1T , 0)(a, B) = (1T a, 1T B + 0a + 0b) = (a, B + 0 + 0). The proof is the same for the product in reverse order. Corollary 5.4. Then R0 := (Z2 , R), S 0 := (Z2 , S) as defined above are unital rings. Proof. Since R, S are direct sums of matrix rings over Z2 , they are clearly Z2 vector spaces, and thus Z2 algebras. Again, there is a clear embedding from R0 into S 0 and vice versa, and again, these are not isomorphic rings. Proof. Let χ : S 0 → R0 be a ring homomorphism, and consider χ((a, B)) = χ((a, 0)) + χ((0, B)). Notice that a ∈ Z2 , thus (a, 0) is either the zero or the unity of S 0 . Ring homomorphisms clearly preserve the zero, and if χ does not preserve the unity, then it is not an isomorphism, and we are done. Thus, without loss of generality, we may assume χ((a, 0)) = (a, 0) ∈ R0 . We then consider χ|S , and we have already seen that this map is never onto M2 (Z2 ) ⊂ R0 , and thus not onto R0 , and so S 0 , R0 are unital rings that are non-isomorphic. 6 Groups The construction for groups is essentially a repurposing of the arguments for rings. By taking infinite direct sums of simple groups with natural injections into one another, the same arguments hold to show that they are non-isomorphic. Definition 6.1. Given a positive integer n, An denotes the group of even permutations on [n]. We call An the alternating group of degree n. Theorem 6.2 ([Sco87]). For positive integer n, n ≥ 5, An is a simple group. TME, vol. 11, no. 3, p. 481 Proposition 6.3. Let G := ∞ M A2n+3 , H := n=1 ∞ M A2n+4 , where Ai is the alternating group on n=1 i elements. Then there are injections from G into H and vice versa, but these groups are nonisomorphic. Proof. To see that these groups embed into one another, we observe that there is a natural embedding ι : Ai ,→ Ai+1 for any choice of i, since the even permutations on the an i + 1 element set include the even permutations that do not act on the i + 1st element. Thus we have embeddings ϕ : G → H and ψ : H → G: G: A5 A7 ⊕ ⊕ ψ A6 ⊕ ϕ ϕ A8 ⊕ ⊕ ··· ψ ψ ϕ H: A9 A10 ϕ ⊕ ··· where ϕ|Ak : Ak ,→ Ak+1 is the natural embedding, and similarly for ψ. However, to show that they are not isomorphic, let χ : H → G be a group homomorphism and let ρ5 : G → A5 be the projection homomorphism. Recall that each Ai is simple for i ≥ 5 and each A2n+4 , n ≥ 1 contains strictly greater than |A5 | elements. Because A2n+ 4 is simple, ρ5 ◦ χ|A2n+4 must be isomorphic to either A2n+4 or {e} and so ρ5 ◦ χ|A2n+4 must be the trivial map. Thus χ is not onto, and since this is true for any χ, G and H are not isomorphic groups. 7 Graphs The same idea may also be used for graphs. Although there is no equivalent concept to a non-trivial simple graph, we may use vertex degree arguments to show non-isomorphism instead. Definition 7.1. Let Kn denote the complete graph on n vertices, that is a graph with n vertices where each vertex is incident to each other distinct vertex. Proposition 7.2. Let G := n [ i=1 K2i , H := n [ K2j+1 , the disjoint union of non-trivial even and odd j=1 degree complete graphs, respectively. Then G, H embed into one another but are non-isomorphic graphs. Proof. We first show the existence of embeddings G ,→ H, and H ,→ G. Notice that given any positive integer n, there is a natural embedding ι : Kn → Kn+1 , by mapping the n vertices of Kn Chih, p. 482 to any n vertices of Kn+1 . Thus we may define ϕ, ψ: ∪ G: ∪ ··· ∪ ψ ψ ψ ϕ H: ∪ ϕ ϕ ϕ ∪ ∪ ··· where ϕ|Kn is the natural embedding Kn ,→ Kn+1 and similarly for ψ. However, every vertex of G has odd degree and every vertex of H has even degree. Thus G and H cannot be isomorphic. 8 Conclusions We find that there are in fact very few structures where mutual embeddings between objects implies isomorphism or equivalence between these objects. In particular the examples that we found for both unital and non-unital rings, groups and graphs are all variations of the same “graded-objects” theme: where we have some sort of structure indexed by n ∈ Z+ where the nth structure may be embedded into the n + 1st, but are fundamentally non-isomorphic. These examples are reminiscent of Hilbert’s hotel-type arguments. We conclude that although it is tempting to naively believe that two objects which are “sub-objects” of each other should be the same, that in reality this notion of “sub-object” is far to complex for any structure more robust than sets. Acknowledgements I would like to thank Eric Cheesebro and Demitri Plessas for introducing me to the CantorSchroeder-Bernstein Theorem and it’s implications. I would like to thank Jennifer Halfpap Kacmarcik and Rachael Chaphalkar for encouraging me to take these stray thoughts and collect them into a paper. I would like to thank my advisor George McRae for his input and advice. Finally, I would especially like to thank Nikolaus Vonnesson, for providing the key insight which allowed me to construct the appropriate counterexamples. TME, vol. 11, no. 3, p. 483 References [Axl97] Sheldon Axler. Linear algebra done right. Undergraduate Texts in Mathematics. SpringerVerlag, New York, second edition, 1997. [Ber05] Felix Bernstein. Untersuchungen aus der Mengenlehre. Math. Ann., 61(1):117–155, 1905. [BM08] J. A. Bondy and U. S. R. Murty. Graph theory, volume 244 of Graduate Texts in Mathematics. Springer, New York, 2008. [Can97] Georg Cantor. Beitr¨ age zur Begr¨ undung der transfiniten Mengenlehre. Math. Ann., 49(2):207–246, 1897. [DF04] David Steven Dummit and Richard M. Foote. Abstract algebra. John Wiley & sons, Hoboken, NJ, 2004. [Hal60] P.R. Halmos. Naive Set Theory. Undergraduate Texts in Mathematics. Springer, 1960. [Mun75] James R. Munkres. Topology: a first course. Prentice-Hall, Inc., Englewood Cliffs, N.J., 1975. [Sch98] E. Schr¨ oder. Ueber zwei Definitionen der Endlichkeit und G. Cantor’sche S¨ atze. Nova acta Academiae Caesareae Leopoldino-Carolinae Germanicae Naturae Curiosorum. 1898. [Sco87] W. R. Scott. Group theory. Dover Publications, Inc., New York, second edition, 1987. Chih, p. 484 TME, vol. 11, no. 3, p. 485 Bhaskara’s approximation for the sine Karel Stroethoff University of Montana The 7th century Indian mathematician Bhaskara (c.600 – c.680) obtained a remarkable approximation for the sine function. Many subsequent ancient authors have given versions of this rule, but none provided a proof or described how the result was obtained. Grover [1] provides a possible explanation, but I think the rule can be explained more clearly. Rather than give the rule first, we will derive it, and then discuss its accuracy, and explore some alternative approximations. Our derivation is simply an exercise in modeling. Approximating the Sine: A Possible Derivation of Bhaskara’s Approximation. Our goal is to approximate the sine function on the interval [0◦ , 180◦] (I have seen the rule formulated for radians, in conjunction with certain approximations of π; we will see that none of this is necessary when we simply work with degrees. I will be careful to use degrees in the notation, so that we can translate some of the formulas for use with radians without ambiguity). Graph of the function y = sin(θ◦ ) over the interval [0, 180]: y y = sin(θ◦ ) 1 1/2 θ 0 30 60 90 120 150 180 We will use that the above graph is symmetric with respect to θ = 90. It is not hard to find a polynomial with the same symmetry which takes values 0 for θ = 0 and θ = 180: p(θ) = θ(180 − θ). The value of p at θ = 90 is p(90) = 90(180 − 90) = 8100, so the polynomial p/8100 has the same symmetry about θ = 90, and the same values as sin(θ◦ ) at the points θ = 0, 90, 180. This is all as in Grover [1], who states that Bhaskara referred to the quantity θ(180 − θ) as ‘prathama’ (Grover does not provide the meaning of this word; it is Sanskrit for “first”), from which we can infer that this is also in Bhaskara’s work. The quadratic polynomial p(θ)/8100 = θ(180 − θ)/8100 can be viewed as a crude (first) approximation of sin(θ◦ ) on the interval [0, 180]. The following graph shows how the two functions compare: The Mathematics Enthusiast, ISSN 1551-3440, vol. 11, no. 3, pp. 485–492 c The Author(s) & Dept. of Mathematical Sciences – The University of Montana 2014 Stroethoff, p. 486 y y = sin(θ◦ ) 1 y= θ(180 − θ) 8100 1/2 θ 0 30 60 90 120 150 180 Note that p(30) = 30(180−30) = 59 . To get a better approximation, Bhaskara must have interpolated also the value 8100 ◦ sin(30 ) = 1/2. To do this, consider the following function a p(θ) , 1 + b p(θ) f (θ) = 0 6 θ 6 180. Clearly f has the same symmetry as p about θ = 90, and f (0) = f (180) = 0. To get value 1 at θ = 90 it is required a = 1, that is, a = 1 + b, so that 1+b (1 + b)p(θ) f (θ) = , 0 6 θ 6 180. 1 + b p(θ) To get value 1/2 at θ = 30 it is required that (1 + b) 49 (1 + b)p(30) 1 , = f (30) = = 2 1 + b p(30) 1 + b 94 which is easily solved to yield b = − 51 . It follows that 4 5 p(θ) = f (θ) = 1 − 51 p(θ) θ(180 − θ) 4θ(180 − θ) 8100 . = θ(180 − θ) 40500 − θ(180 − θ) 1 − 15 8100 4 5 This gives Bhaskara’s approximation formula for the sine function. Bhaskara’s Approximation Formula: sin(θ◦ ) ≈ 4θ(180 − θ) , 40500 − θ(180 − θ) for 0 6 θ 6 180. Alternative Derivation. There is an even simpler argument to obtain Bhaskara’s formula. I have no doubt now that Bhaskara must have reasoned as follows. The polynomial p(θ) = θ(180 − θ)/8100 is symmetric with respect to 90, and agrees with the values of the sine for 4500 = 59 . Now, it is easy 0, 90, and 180 degrees, but not for 30 degrees (and 150 degrees). In fact we have p(30) = 8100 10 1 to construct a polynomial q symmetric about θ = 90 which takes value 9 = 1 + 9 at 30 (the reason for this value will become clear momentarily) and value 1 at 90: the polynomial q(θ) = 1 + (θ − 90)2 (θ − 90)2 =1+ 2 9(30 − 90) 32400 TME, vol. 11, no. 3, p. 487 will do the job. Since p(90) = 1 and q(90) = 1, we have p(90) q(90) p(30) = q(30) 5 9 10 9 = 1. Note that = 1 . 2 Also p(0) q(0) = 0. So the following function is symmetric about 90 and has the same values as the sine at 0, 30, and 90 degrees (as well as 150 and 180 degrees by symmetry): θ(180 − θ) 4θ(180 − θ) 4θ(180 − θ) 8100 r(θ) = 2 = 32400 + (θ − 90)2 = 40500 − θ(180 − θ) , (θ − 90) 1+ 32400 which is Bhaskara’s rational function! The simplicity of this argument makes it likely that the formula was derived along these lines. Accuracy of Bhaskara’s Approximation. To see how good of an approximation this is we plot the above rational function in the same window as the sine function: y y = sin(θ◦ ) 1 y= 4θ(180 − θ) 40500 − θ(180 − θ) 1/2 θ 0 30 60 90 120 150 180 0.0013436967 Since the two graphs are not distinguishable, we plot the difference on a larger scale: y = sin(θ◦ ) − 4θ(180 − θ) 40500 − θ(180 − θ) θ 30 60 90 120 150 180 −0.001631765 0 y The error is bounded by 0.00165 over the entire interval (in the above graph the minimum of about −0.001631765 occurs near θ = 11.543848 and θ = 168.4561524, and the maximum of about 0.0013436967 occurs near θ = 51.34589377 and θ = 128.6541062) so this is a very good approximation. Stroethoff, p. 488 An Approximation Formula for the Cosine. It is fairly easy to see that we get the same result if we approximate 2 y = cos(θ◦ ) on the interval [−90, 90], starting with the quadratic polynomial q(θ) = 8100−θ 8100 . Of course this can also be seen using the identity cos(θ◦ ) = sin(θ◦ + 90◦ ). Either way, Bhaskara’s approximation for the sine has the following analog for the cosine: 4(90 + θ) (180 − (90 + θ)) 40500 − (90 + θ) (180 − (90 + θ)) 4(90 + θ)(90 − θ) = 40500 − (90 + θ)(90 − θ) 32400 − 4θ2 . = 32400 + θ2 cos(θ◦ ) ≈ We can rewrite the above rational function as 32400 − 4θ2 1 32400 + θ2 − 5θ2 5θ2 = =1− 2 2 32400 + θ 32400 + θ 32400 1 + θ2 /32400 2 1 θ =1−5 2 180 1 + (θ/180) 2 X 2n ∞ θ θ n =1−5 (−1) 180 n=0 180 2 4 6 θ θ θ =1−5 +5 −5 + ··· . 180 180 180 180 x , so the above analog of Bhaskara’s sine approximation Now, if − π2 6 x 6 π2 , then cos x = cos(θ◦ ), where θ = π for the cosine gives the approximation x 4 x 6 x 2 +5 −5 + ··· cos x ≈ 1 − 5 π π π 5 5 5 = 1 − 2 x2 + 4 x4 − 6 x6 + · · · . π π π 2 So Bhaskara’s approximation does √ not agree with even a second order approximation unless π = 10. This agrees with the approximation of π by 10 in use at Bhaskara’s time; although this was not the best approximation known at the time, this approximation was popular in India, perhaps because it fits so nicely with the above approximation rules for sines and cosines. Approximating the Sine using Polynomials. The above method is not the only way to improve the first order approximation of θ(180 − θ)/8100. If we put p = θ(180 − θ) as above, then we could also fit y = sin(θ◦ ) to the function ap + bp2 , a second order polynomial in p (thus a 4th order polymial in θ). We need the following values for p: θ 0 30 90 p 0 4500 8100 y 0 1/2 1 The following polynomial in p fits the above data points: p(p − 8100) 1 p(p − 4500) ·1+ · . 8100(8100 − 4500) 4500(4500 − 8100) 2 The above expression simplifies to 27900 p + p2 . 291600000 TME, vol. 11, no. 3, p. 489 Now substitute p = θ(180 − θ) into the above expression to get the function1 g(θ) = 27900 θ(180 − θ) + θ2 (180 − θ)2 . 291600000 To see how good of an approximation this is we plot the above polynomial in the same window as the sine function: y y = sin(θ◦ ) 1 y= 27900 θ(180 − θ) + θ2 (180 − θ)2 291600000 1/2 θ 0 30 60 90 120 150 180 0.0010902926 Since the two graphs are not distinguishable, we plot the difference on a larger scale: −0.0007600704 0 y y = sin(θ◦ ) − 27900 θ(180 − θ) + θ2 (180 − θ)2 291600000 θ 30 60 90 120 150 180 The error is bounded by 0.0011 over the entire interval (in the above graph the minimum of about −0.0007600704 occurs near θ = 50.64638193 and θ = 129.3536181, and the maximum of about 0.0010902926 occurs near θ = 11.063325 and θ = 168.936675) so the approximation sin(θ◦ ) ≈ 27900 θ(180 − θ) + θ2 (180 − θ)2 291600000 1 That the same result is obtained by substituting θ = 90 and θ = 30 into the function a θ(180 − θ) + b θ 2 (180 − θ)2 to obtain the system of equations 8100 a + 81002 b = 1, 4500 a + 45002 b = 1/2, is left as an exercise for the reader. Stroethoff, p. 490 is better than Bhaskara’s. The corresponding approximation for the cosine is 27900 (902 − θ2 ) + (902 − θ2 )2 291600000 1 49 θ2 + θ4 =1− 324000 291600000 2 4 θ 18 θ 49 + . =1− 10 180 5 180 cos(θ◦ ) = sin(90◦ + θ◦ ) ≈ This corresponds to the approximation cos x ≈ 1 − 49 2 18 x + 4 x4 , 10π 2 5π p √ for − π2 6 x 6 π2 . The above approximation is correct for order two if π is assumed to be 2(49/10) = 9.8 ≈ 3.1305, √ which is closer to the true value of π than 10. The 4th order Taylor approximation of the cosine (and the conversion from radians to degrees) gives cos(θ◦ ) = cos πθ 180 ≈1− 1 2 πθ 180 2 + 1 24 πθ 180 4 . Graph of the difference of the above 4th order Taylor polynomial and the cosine: y y =1− 1 2 πθ 2 180 + 1 24 πθ 4 180 − cos(θ◦ ) .02 .01 θ −90 −60 0 −30 30 60 90 Compare this with the above approximation: y .002 y =1− 49 10 θ 2 180 + 18 5 θ 4 180 − cos(θ◦ ) .001 θ −90 −60 −30 0 30 60 90 −.001 −.002 The absolute value of the maximum error over the entire interval is almost 20 times as large for the Taylor approximation. TME, vol. 11, no. 3, p. 491 In spite of the fact that the approximations to π associated with these sine and cosine approximations are lousy at best, it is amazing that the convergence of the functions over the appropriate intervals is so good. Obviously we can get a better approximation by interpolating more values. Noting that Bhaskara’s rational approximation and the above polynomial approximation have errors generally in opposite direction (see the graphs of the errors), a better approximation is obtained by taking the average of the two approximations. I will leave it as an exercise for the interested reader to plot the resulting error, which has absolute value less than 0.0003 (the difference between the sine and the approximating function2 has maximum less than 0.0002926893092 and minimum more than −0.000272872444). Approximating the Sine using More Special Values. We can√also obtain better approximation formulas by interpolating more values of the sine. For example, using sin(60◦ ) = 3/2, we need the following values for p: θ 0 30 60 90 p 0 4500 7200 8100 y 0 1/2 √ 3/2 1 The following polynomial in p fits the above data points: √ p(p − 4500)(p − 7200) p(p − 7200)(p − 8100) 1 p(p − 4500)(p − 8100) 3 ·1+ · + · , 8100(8100 − 4500)(8100 − 7200) 4500(4500 − 7200)(4500 − 8100) 2 7200(7200 − 4500)(7200 − 8100) 2 which simplifies to √ 2p(13p − 69300)(p − 7200) − 15p(p − 4500)(p − 8100) 3 . 524880000000 This gives the polynomial √ 2 θ(180 − θ) (13 θ(180 − θ) − 69300) (θ(180 − θ) − 7200) − 15 θ(180 − θ) (θ(180 − θ) − 4500) (θ(180 − θ) − 8100) 3 , h(θ) = 524880000000 which simplifies to √ √ √ √ 26 − 15 3 θ(180 − θ) 810000(1657 + 930 3) + 324000(19 + 15 3) θ − 1800(1 + 15 3) θ2 − 360 θ3 + θ4 h(θ) = 524880000000 Graph of this polynomial together with the sine over the interval [0, 180]: y y = sin(θ◦ ) 1 y = h(θ) 1/2 θ 0 2 The 30 60 90 120 approximating function is 2 θ (180 − θ) 31 θ (180 − θ) θ 2 (180 − θ)2 + + . 40500 − θ (180 − θ) 648000 583200000 150 180 Stroethoff, p. 492 Since the two graphs are not distinguishable, we plot the difference on a larger scale: y y = sin(θ◦ ) − h(θ) 0.00001 0 θ 30 60 90 120 150 180 −0.00001 −0.00002 −0.00003 −0.00004 The error in the approximation √ √ √ √ 26 − 15 3 θ(180 − θ) 810000(1657 + 930 3) + 324000(19 + 15 3) θ − 1800(1 + 15 3) θ2 − 360 θ3 + θ4 ◦ sin(θ ) ≈ 524880000000 is less than 0.000035 (in fact, the absolute value of the difference of the left-hand side and the right-hand side has absolute maximum of about 0.000033873 for x ≈ 8.859147374), for all 0 6 θ 6 180. Reference [1] S. Grover, History of Development of Mathematics in India, Atma Ram & Sons, Delhi and Lucknow, 1994. Department of Mathematical Sciences, University of Montana, Missoula, Montana 59812 E-mail address: [email protected] TME, vol. 11, no. 3, p. 495 The Development of Calculus in the Kerala School Phoebe Webb 1 University of Montana Abstract: The Kerala School of mathematics, founded by Madhava in Southern India, produced many great works in the area of trigonometry during the fifteenth through eighteenth centuries. This paper focuses on Madhava's derivation of the power series for sine and cosine, as well as a series similar to the well-known Taylor Series. The derivations use many calculus related concepts such as summation, rate of change, and interpolation, which suggests that Indian mathematicians had a solid understanding of the basics of calculus long before it was developed in Europe. Other evidence from Indian mathematics up to this point such as interest in infinite series and the use of a base ten decimal system also suggest that it was possible for calculus to have developed in India almost 300 years before its recognized birth in Europe. The issue of whether or not Indian calculus was transported to Europe and influenced European mathematics is not addressed. Keywords: Calculus; Madhava; Power series for sine and cosine; Trigonometric series; Kerala School of mathematics; History of mathematics It is undeniable that the Kerala school of mathematics in India produced some of the greatest mathematical advances not only in India but throughout the world during the fourteenth through seventeenth centuries. Yet many of the advances the scholars and teachers of this school made have been attributed to later European mathematicians who had the abilities to publish and circulate these 1 [email protected] The Mathematics Enthusiast, ISSN 1551-3440, vol. 11, no. 3, pp. 493-512 2014© The Author(s) & Dept. of Mathematical Sciences-The University of Montana Webb ideas to large audiences. Some of the greatest products of the Kerala school are the series approximations for sine and cosine. The power series of the sine function is sometimes referred to as Newton's Series, and explanations in modern calculus textbooks offer little to no attribution to Madhava. Another series Madhava derived for the sine and cosine functions is similar to the modern Taylor Series, but uses a slightly different approach to find divisor values. The similarities between the various Indian versions of infinite trigonometric series and the later European versions of series lead to the controversial discussion of whether or not the ideas of calculus were transmitted from India to Europe. This paper does not focus on this aspect of the Indian calculus issue. It instead focuses on the techniques Madhava used in developing his infinite series for sine and cosine, and explores how these processes do indeed hint at early versions of calculus. This examination of Keralese mathematics starts with a brief history of trigonometry, which provides context for many of the functions and ideas used throughout this paper. Then a short look at the mathematical culture of both India and Europe is necessary because it provides background evidence that suggests how calculus developed so much earlier in India. Finally, and most importantly, an exploration of Madhava's derivations for infinite series shows how his and his students' techniques relate to modern calculus concepts. The history and origins of trigonometry revolve around the science of astronomy; people thousands of years ago noticed the periodicity of the moon cycle and star cycle, and wanted to come up with a way to predict when certain astronomical events would happen. Trigonometry was developed in order to calculate times and positions, and what really established it as a science was the ability it gave people to switch back and forth between angle measures and lengths. Hipparchus is generally said to be the first person to really work with trigonometry as a science. Earlier peoples such as the Egyptians used early trigonometric ideas to calculate the slopes of pyramids, while the Babylonians developed a process of measuring angles based on the rotation of the stars and moon (Van Brummelen, 2009). TME, vol. 11, no. 3, p. 497 Clearly the solar system rotation and the development of a science to monitor this rotation was important to many different cultures. Similarly, there are also mathematical arguments and proofs that are context dependent or situated (Moreno-Armella & Sriraman, 2005). The work of Ptolemy and Hipparchus gave us the Chord function, which is similar to the modern sine function. It is related to the modern sine function by the equation Crd(2Ѳ)=2Rsin(Ѳ). Hipparchus established a method for finding the chord of any arc, and used this to create a table of chord values for every seven and a half degrees. Traditionally a radius of 60 was used since the Greeks used a base 60 number system. But another common way to determine a helpful radius was to divide the circumference into an equal number of parts. Knowing that the total number of degrees in a circle is 360, and that there are 60 minutes in each one of those degrees, there is a total of 360(60) = 21600minutes around the circle. Dividing this into parts of size 2𝜋produces about 3438 such parts, and the radius is thus 3438. This value of radius was highly used in Indian mathematics and astronomy because it allowed them to divide the circle into many small, whole number arcs. Indian mathematicians also use angle differences similar to those used by the Greeks in their sine and chord tables (Van Brummelen, 2009). The similarities between early Greek and Indian trigonometry causes one to think about possible transmissions or communication between the two cultures. Little evidence exists that documents the communication between the two cultures, and there is virtually no evidence that documents any mathematical ideas being transferred. Perhaps a logical explanation is that the cultures may have worked with similar ideas around the same time period (Van Brummelen, 2009). A lack of evidence is also present in the issue of whether calculus was transported from India to Europe, and that is why the problem is not heavily addressed in this paper. The first use of the Sine function, instead of the Chord function, is found in India. Almost all ancient Indian astronomical works either reference or contain tables of Sine values. The Sine function Webb was given the name jya-ardha (sometimes ardha-jya) in Sanskrit, meaning “half-chord” (Van Brummelen, 2009, p. 96). This sheds some light on how the function may have developed: “Some early Indian astronomer, repeatedly doubling arcs and halving the resulting chords, must have realized that he could save time simply by tabulating this” (p. 96). This function is still different from the modern sine in that it is greater than the modern sine by a factor of R, the radius of a circle. So jyaardha(θ)=Rsin(θ). It is now customary to write this jya-ardha as Sin(θ), the capital “S” denoting its difference from the modern function. This is how the Rsin(ϴ) will be referred to throughout the paper, while the modern sine function will be referred to as sine or sin(𝜃). The Kerala school of mathematics, also called the Madhava school, originated in Kerala along the south-west coast of India, and flourished from the 1400' s to the 1700's. This region had a fairly distinct culture because of its location—it was close enough to the coastal trading communities but far enough away so as not to be extremely bothered by political and social events. The main focus of many works from the Madhava school was on trigonometry and other circle properties. This focus stemmed from necessity; Indian astronomers relied heavily on sine tables and trigonometric values to compute the positions of stars and predict when astronomical events such as eclipses would happen. These events were important in scheduling Indian religious holidays, and so more accurate approximations were constantly looked for. Earlier Indian mathematicians had long been interested in ways of computing 𝜋and the circumference of a circle, and realized there was no way to produce numbers exactly equal to these values. In the Kerala school, many numerical approximations for 𝜋 and circumferences were found—some that were accurate up to 17 decimal places—and mathematicians began to realize that using algebraic expressions with a large amount of terms could be used to better approximate values. Thus the interest in series approximations arose, and it was not long before mathematicians began to extend these series into the unknown, that is, into infinity (Divakaran, 2010). Meanwhile in Europe, the mathematical world was in a period of little activity. Perhaps one of TME, vol. 11, no. 3, p. 499 the last major influential mathematicians before the 1600's was Fibonacci in the early 1200's. Then came the great mathematicians such as Fermat, Newton, and Leibniz, but not until the late 1600's and into the 1700's (Rosenthal, 1951). By this time the Kerala school had already produced almost all the major works it would ever produce, and was on the decline. Also during this time Europe had recently begun to use the base ten decimal system. This system had been in India since at least the third century, partly due to the culture's desire and need to express large numbers in an easy to read way (Plofker, 2009). This decimal place value system makes calculations much easier than with Roman numerals, which were prominent in Europe until the 1500's (Morales, n.d.). The fact that India had this easy to use enumeration system may have helped them advance father with calculations earlier than Europe. Our discussion on Madhava's ways of finding infinite trigonometric series begins with his derivation of the power series for Sine values. Sankara, one of the students from the Keralese lineage, wrote an explanation of Madhava's process. Since Madhava mainly spoke his teachings instead of writing them, his students would write down Madhava's work and provide explanations. So the derivation of the power series is actually in the words of Sankara, explaining Madhava's methods. To begin with, Sankara uses similar triangles and geometry to explain how the Sine and Cosine values are defined. Webb In the following figure, an arc of a circle with radius R is divided into n equal parts. Let the total angle of the arc be 𝜃, so the n equal divisions of this arc are called 𝛥𝛥. The Sine and Cosine of the ith arc are referred to as Sini and Cosi,. Let the difference between two consecutive Sine values be denoted ΔSini=Sini – Sini-1, and the difference between two consecutive Cosine values be denoted ΔCosi=Cosi-1 – Cosi. The Sine value of the ith half arc of Δϴ, or 𝑖𝑖𝑖 + (𝛥𝛥) 2 , is called Sini.5, and the Cosine value of 𝑖𝑖𝑖 + (𝛥𝛥) 2 is called Cosi.5. Then ΔSini.5= Sini.5 – Sini.5-1, and ΔCosi.5=Cosi.5-1 – Cosi.5. Reprinting the triangles labeled 1 and 2 from the figure above, we will explore their similarity. TME, vol. 11, no. 3, p. 501 In triangle 1, A is a point that corresponds to the (i+1)st arc and B is the ith arc..Then length AB is the Chord (denoted Crd) of Δϴ, and length AC is the difference between Sini+1 and Sini which by definition is ΔSini+1. Side BC is Cosi – Cosi+1= ΔCosi+1 (by definition), and angle BAC= Δϴ. In triangle DEF, side DF is Cosi.5 , side EF is Sini.5, and side DE is the radius of the full arc, R. Angle FDE = Δϴ, and therefore the two right triangles are similar. So we can set up proportions to write Sines in terms of 𝐴𝐴 𝐷𝐷 (𝛥Sin ) 𝑖+1 Cosines and vice versa. So 𝐴𝐴 = 𝐷𝐷 → (𝐶𝐶𝐶(𝛥𝛥)) = Cos𝑖.5 𝑅 Using the same similar triangle relationship, 𝐶𝐶 𝐸𝐸 = 𝐷𝐷 → 𝐴𝐴 (𝛥Cos𝑖+1 ) (𝐶𝐶𝐶𝐶𝐶) = Sin𝑖.5 𝑅 → 𝛥Cos𝑖+1 = Sin𝑖.5 → 𝛥Sin𝑖+1 = Cos𝑖.5 ( (𝐶𝐶𝐶𝐶𝐶) 𝑅 ). (𝐶𝐶𝐶𝐶𝐶) 𝑅 . To get expressions for the i.5th Sine and Cosine, the similar triangles used above need to be shifted on the arc. Let point A now denote the i.5th arc and B is the (i.5-1)st arc. Then length AB is still the Chord of ΔѲ, while AC is now 𝛥Sin𝑖.5 and CB is now 𝛥Cos𝑖.5 . In triangle DEF, length DF becomes Cos𝑖 , and EF becomes Sin𝑖 , while DE is still the radius R. So, using the above proportions, 𝛥Sin𝑖.5 = Cos𝑖 𝛥Cos𝑖.5 = Sin𝑖 (𝐶𝐶𝐶𝐶𝐶) , and (𝐶𝐶𝐶𝐶𝐶) . 𝑅 𝑅 Now Sankara defines the second difference of Sine as: 𝛥𝛥Sin𝑖 = 𝛥Sin𝑖 − 𝛥Sin𝑖+1 . Webb So, using the expressions from above, 𝛥𝛥Sin𝑖 = 𝛥Sin𝑖 − 𝛥Sin𝑖+1 = 𝛥Sin𝑖 − Cos𝑖.5 (𝐶𝐶𝐶𝐶𝐶) 𝑅 (𝐶𝐶𝐶𝐶𝐶) 𝑅 (𝐶𝐶𝐶𝐶𝐶) (𝐶𝐶𝐶𝐶𝐶) =Cos𝑖.5−1 − Cos𝑖.5 𝑅 𝑅 (𝐶𝐶𝐶𝐶𝐶) =𝛥Cos𝑖.5 𝑅 (𝐶𝐶𝐶𝐶𝐶)2 =Sin𝑖 𝑅2 =𝛥Sin𝑖+1−1 − Cos𝑖.5 Since Sankara has defined the second difference of some ith arc as the difference between two consecutive Sine differences, the difference of the (i+1)st Sine can be written as: 𝛥Sin𝑖+1 = 𝛥Sin𝑖 − 𝛥𝛥Sin𝑖 , the difference between the first order and second order differences of the ith Sine. By this recursive formula, we can write 𝛥Sin𝑖+1 =𝛥Sin𝑖−1 − 𝛥𝛥Sin𝑖−1 − 𝛥𝛥Sin𝑖 =𝛥Sin𝑖−2 − 𝛥𝛥Sin𝑖−2 − 𝛥𝛥Sin𝑖−1 − 𝛥𝛥Sin𝑖 =⋮ =𝛥Sin1 − 𝛥𝛥Sin1 − 𝛥𝛥Sin2 − 𝛥𝛥Sin3 − ⋯ − 𝛥𝛥Sin𝑖 (1) =𝛥Sin1 − ∑𝑖𝑘=1 𝛥𝛥Sin𝑘 =𝛥Sin1 − ∑𝑖𝑘=1 Sin𝑘 =𝛥Sin1 − (𝐶𝐶𝐶𝐶𝐶)2 𝑅2 (𝐶𝐶𝐶𝐶𝐶) 𝑖 ∑𝑘=1(𝛥Cos𝑘.5 ) 𝑅 Here is where the a function called the Versine or “reversed sine” (Van Brummelen,2009, p. 96) comes in. The Versine is defined as Vers(𝜃) = 𝑅 − Cos(𝜃), where R is the radius of the circle. So for our purposes of calculating Sine and Cosine values related to the ith arc, Vers𝑖 = 𝑅 − Cos𝑖 , and the difference in Versine values is 𝛥Vers𝑖 = Vers𝑖 − Vers𝑖−1 . Since Vers𝑖 = 𝑅 − Cos𝑖 , 𝛥Vers𝑖 = 𝛥Cos𝑖 . Now we will progress with the Sine approximation. Noting equation (1), we can write the difference of the ith Sine (as opposed to the (i+1)st Sine) as 𝑖−1 𝛥Sin𝑖 = 𝛥Sin1 − ∑𝑘=1 (𝛥Cos𝑘.5 (𝐶𝐶𝐶𝐶𝐶) 𝑅 )(2). TME, vol. 11, no. 3, p. 503 Now we will write an even more detailed expression for Sin𝑖 into which we can substitute previously found expressions and differences. Since 𝛥Sin𝑖 = Sin𝑖 − Sin𝑖−1 , 𝛥Sin1 = Sin1 − Sin0, 𝛥Sin2 = Sin2 − Sin1 , 𝛥Sin3 = Sin3 − Sin2 , …, 𝛥Sin𝑖 = Sin𝑖 − Sin𝑖−1 . Then adding the right hand sides of these identities gives us: (Sin1 − Sin0 ) + (Sin2 − Sin1 ) + (Sin3 − Sin2 ) + ⋯ + (Sin𝑖 − Sin𝑖−1 ) . The Sin0 = 0 , and the subsequent (i-1) terms cancel out, leaving only Sini. Then adding the values on the left hand side gives us 𝛥Sin1 + 𝛥Sin2 + 𝛥Sin3 + ⋯ + 𝛥Sin𝑖 . Thus Sin𝑖 = 𝛥Sin1 + 𝛥Sin2 + 𝛥Sin3 + ⋯ + 𝛥Sin𝑖 (3). Rewriting (3) produces Sin𝑖 = ∑𝑖𝑘=1 𝛥Sin𝑘 . So substituting equation (2) in for 𝛥Sin𝑘 gives: 𝑖 𝑖−1 (𝐶𝐶𝐶𝐶𝐶) ) 𝑅 Sin𝑖 = �(𝛥Sin1 − � 𝛥Cos𝑘.5 𝑘=1 𝑖 𝑖−1 𝑘=1 𝑘 (𝐶𝐶𝐶𝐶𝐶) ) 𝑅 = � 𝛥Sin1 − �(� 𝛥Cos𝑗.5 𝑘=1 𝑘=1 𝑗=1 Since 𝛥Sin1 is a value independent of the index k=1 to i, we can apply the constant rule of summations to get 𝑖𝑖Sin1. Then 𝑖−1 Sin𝑖 = 𝑖𝑖Sin1 − ∑𝑘=1 (∑𝑘𝑗=1 𝛥Cos𝑗.5 𝑖−1 =𝑖𝑖Sin1 − ∑𝑘=1 (∑𝑘𝑗=1 Sin𝑗 (𝐶𝐶𝐶𝐶𝐶) (𝐶𝐶𝐶𝐶𝐶)2 𝑅2 𝑅 ) ) (4). From here, 𝑖𝑖Sin1is taken as approximately equal to iΔϴ, and the arc Δϴ itself is approximated as the “unit arc”, making iΔϴ just i. Additionally, the (i-1) sums of the sum of Sines are approximately equal to the i sums of the sum of the arcs. This implies that the (i-1) sum of the sum of the Sines is approximately equal to the “i” sum of the sum of i. So (4) now becomes Sin𝑖 ≈ 𝑖𝑖𝑖 − ∑𝑖𝑘=1(∑𝑘𝑗=1 𝑗𝑗𝑗 ~𝑖 − ∑𝑖𝑘=1(∑𝑘𝑗=1 𝑗 (𝐶𝐶𝐶𝐶𝐶)2 (𝐶𝐶𝐶𝐶𝐶)2 𝑅2 𝑅2 ) ) (5). Here Sankara also approximates 𝐶𝐶𝐶𝐶𝐶 as 1, since 𝛥𝛥 ≈ 1 . He also substitutes the difference in Cosines back into (5) for j, and substitutes Versine differences for those Cosine differences, getting a Webb simplified expression for Sini. Here is a translation of his explanation for these steps: Therefore the sum of Sines is assumed from the sum of the numbers having one as their first term and common difference. That, multiplied by the Chord [between] the arc-junctures, is divided by the Radius. The quotient should be the sum of the differences of the Cosines drawn to the centers of those arcs. […] The other sum of Cosine differences, [those] produced to the arc-junctures, [is] the Versine. [But] the two are approximately equal, considering the minuteness of of the arc-division (Plofker, 2009, p. 242). Now (5) becomes: Sin𝑖 ≈ 𝑖 − ∑𝑖𝑘=1(∑𝑘𝑗=1 𝛥Cos𝑗 ~𝑖 − ∑𝑖𝑘=1(∑𝑘𝑗=1 𝛥Vers𝑗 (𝐶𝐶𝐶𝐶𝐶) 𝑅2 (𝐶𝐶𝐶𝐶𝐶) 1 =𝑖 − ∑𝑖𝑗=1 Vers𝑗 (𝑅) 𝑅2 ) ) (6) Sankara then states the rule for sums of powers of integers, and uses that to approximate 1 𝑖−1 ∑𝑘=1 (∑𝑘𝑗=1 𝑗(𝑅2 )). If we think about nested sums as products instead, and there are a of these products, and b is the last term (in the ath sum), then: ∑𝑏𝑐𝑎=1 𝑐𝑎 ∗ ∑𝑐𝑐𝑎𝑎−1 =1 𝑐𝑎−1 ∗ ⋯ ∗ ∑𝑐𝑐32 =1 𝑐2 ∗ ∑𝑐𝑐21 =1 𝑐1 = [𝑏(𝑏+1)(𝑏+2)⋯(𝑏+𝑎)] Using this, (1∗2∗⋯∗(𝑎+1)) ∑𝑖𝑗1 =1 𝑗1 = ∑𝑖𝑗2 =1 ∑𝑗𝑗21 =1 𝑗1 ((𝑎+𝑏)!) = ((𝑏−1)!(𝑎+1)!) (sum of powers of integers rule). (𝑖(𝑖+1)) = (1∗2) (𝑖(𝑖+1)(𝑖+2)) ∑𝑖𝑗3 =1 ∑𝑗𝑗32 =1 ∑𝑗𝑗21 =1 𝑗1 = (1∗2∗3) (𝑖(𝑖+1)(𝑖+2)(𝑖+3)) . (1∗2∗3∗4) These values are further approximated as Now, using (6) we can rewrite to get: 1 1 𝑖2 𝑖3 𝑖4 , ,and 24, respectively. 2 6 𝑖 − Sin𝑖 ≈ ∑𝑖𝑗=1 Vers𝑗 (𝑅) ≈ ∑𝑖𝑘=1 𝑗(𝑅) ≈ ∑𝑖𝑗=1 𝑗2 1 2 (𝑅 ) ≈ 𝑖3 6 1 (𝑅2 )(7). TME, vol. 11, no. 3, p. 505 Here Sankara notices the error in estimating the Versine values based on arcs, and formulates a way to account for the error: To remove the inaccuracy [resulting] from producing [the Sine and Versine expressions] from a sum of arcs [instead of Sines], in just this way one should determine the difference of the [other] Sine and [their] arcs, beginning with the next-to-last. And subtract that [difference each] from its arc: [those] are the Sines of each [arc]. Or else therefore, one should subtract the sum of the differences of the Sines and arcs from the sum of the arcs. Thence should be the sum of the Sines. From that, as before, determine the sum of the Versine-differences (Plofker, 2009, p. 245). So, 𝑗3 1 𝑗3 𝑗 𝑖2 𝑖4 Vers𝑖 ≈ ∑𝑖𝑗=1 𝑗 − (6R2 ) (𝑅) = ∑𝑖𝑗=1 𝑅 − ∑𝑖𝑗=1 (6R3 ) ≈ (2R) − (24R3 ). Putting this estimate in for Versi in equation (6) then gives us: 𝑗2 𝑗4 1 Sin𝑖 ≈ 𝑖 − ∑𝑖𝑗=1((2R) − (24R3 )) 𝑅 𝑗2 𝑗4 =𝑖 − ∑𝑖𝑗=1 2R2 + ∑𝑖𝑗=1 24R4 ≈ 𝑖 − 𝑖3 𝑖5 =𝑖 − (3!𝑅2 ) + (5!𝑅4 ) 𝑖3 6 𝑖5 + 120(8) 𝜃3 𝜃5 which is equivalent to the modern power series sin(𝜃) ≈ 𝜃 − (3!) + (5!) − + ⋯, noting that the modern 1 sin(𝜃)is equal to 𝑅 Sin(𝜃). Subsequent terms of the series are found by using (8) to find more accurate Versine values, which are then used to find more accurate Sine values. Madhava's ability to produce highly accurate and lengthy sine tables stemmed from his series approximation; once he had derived the first few terms of the series (as shown above), he could compute later terms fairly quickly. He recorded the values of 24 sines in a type of notation called katapayadi, in which numerical values are assigned to the Sanskrit letters. Significant numerical values were actually inscribed in Sanskrit words, but only the letters directly in front of vowels have Webb numerical meaning, and only the numbers 0 through 9 are used in various patterns. So while the phrases Madhava used in his katapayadi sine table may not make sense as a whole, each line contains two consecutive sine values accurate to about seven decimal places today (Van Brummelen, 2009; Plofker, 2009). The above derivation of the power series showcases some of the brilliant and clever work of the Kerala school, especially considering that similar work in Europe did not appear until at least 200 years later when Newton and Gregory began work on infinite series in the late 1600's (Rosenthal, 1951). Important steps to note take place in the beginning of the derivation when Madhava uses similar triangle relationships to express the changes in Sine and Cosine values using their counterparts. This process is equivalent to taking the derivative of the functions, because the derivative virtually measures the same rate of change as these expressions. Additionally, the repeated summation Madhava uses can be considered a precursor to integration. The integral takes some function, say B, and divides it into infinitely many sections of infinitely small width. These sections are then summed and used to find the value of function A, whose rate of change was expressed through function B. Madhava uses the summation of extremely small divisions of changes in Sine, Cosine, and arc values to get better estimates for the original functions, which is what the integral is designed to do. Now we turn to the derivation of another infinite series and examine the background of interpolation in India. The process of interpolation has been known in India since about the beginning of the seventh century when mathematician Brahmagupta wrote out his rules for estimating a function using given or known values of that function (Gupta, 1969). This is the process Madhava evidently used in his derivation of a series for Sine and Cosine around a fixed point, often times called the Taylor Series. The Kerala student Nilakantha quoted Madhava's rule for using second order interpolation to find such a series: Placing the [sine and cosine] chords nearest to the arc whose sine and cosine chords are TME, vol. 11, no. 3, p. 507 required get the arc difference to be subtracted or added. For making the correction 13751 should be divided by twice the arc difference in minutes and the quotient is to be placed as the divisor. Divide the one [say sine] by this [divisor] and add to or subtract from the other [cosine] according as the arc difference is to be added or subtracted. Double this [result] and do as before [i.e. divide by the divisor]. Add or subtract the result to or from the first sine or cosine to get the desired sine or cosine chords (Gupta, 1969, p. 93). Here, a radius of 3438 is used, and the “arc difference” referred to is the angle in between the known Sine (or Cosine) value and the desired value. To find the general version of this estimation rather than using specific known and desired values, call the arc difference 𝛥𝛥, so twice the arc difference is 2𝛥𝛥. The value 13751 used in the determination of the “divisor” is four times the radius (3438), making the divisor simply 2∗3438 (𝛥𝛥) 2R or (𝛥𝛥). After establishing the divisor, Madhava says to divide the desired function by this value—which is equivalent to multiplying by (𝛥𝛥) 2R --and add that to or subtract that from the other function. So, say we wanted to know the value of Sin(𝜃 + 𝛥𝛥)where 𝜃is the known value and 𝛥𝛥is the arc difference being added to the known value. First we would divide the known Sin(𝜃)by the divisor, which produces Sin(𝜃) (𝛥𝛥) 2R . This is then added to or subtracted from the corresponding Cosine value, Cos(𝜃) . In this case, Sin(𝜃) demonstrated with a diagram. (𝛥𝛥) 2R is subtracted from Cos(𝜃) . The reason for this is best Webb Here, Sin(𝜃 + 𝛥𝛥)is greater than Sin(𝜃), as indicated by the difference in lengths in the diagram. However, Cos(𝜃 + 𝛥𝛥)is less than Cos(𝜃), which is also visible in the differences in lengths in the diagram. The rules given by Madhava say to “add to or subtract from the other according as the arc difference is to be added or subtracted” (Gupta, 1969, p. 93), which means that we should subtract Sin(𝜃) (𝛥𝛥) 2R from Cos(𝜃)if Cos(𝜃 + 𝛥𝛥)is less than Cos(𝜃), and add Sin(𝜃) (𝛥𝛥) 2R if the opposite is true. Since in this case Cos(𝜃 + 𝛥𝛥)is less than Cos(𝜃), we subtract the stated Sine value. From there, Madhava says to double the expression we have just found, and multiply again by (𝛥𝛥) 2R . The last step is to add (or subtract, if a Cosine value is desired) the entire expression from the starting Sine or Cosine value. Following these steps produces the expressions Sin(𝜃 + 𝛥𝛥) = Sin(𝜃) + (𝛥𝛥) Cos(𝜃 + 𝛥𝛥) = Cos(𝜃) − 𝑅 Cos(𝜃) − (𝛥𝛥) 𝑅 Sin(𝜃) − (𝛥𝛥)2 2R2 Sin(𝜃) (1.1) and (𝛥𝛥)2 2R2 Cos(𝜃)(1.2) for Sine and Cosine values, respectively. Noting that 𝛥𝛥 is the point about which the series is being evaluated, and also that the appearance of the R in the denominator is due to the difference in definition of Sine and Cosine, it is easy to see that these expressions are the same as their modern Taylor Series approximations. However, as the order increases, the two expressions begin to differ. The third order Taylor Series approximation TME, vol. 11, no. 3, p. 509 for sine becomes sin(𝜃 + 𝛥𝛥) = sin(𝜃) + cos(𝜃)𝛥𝛥 − (sin𝜃) (2!) (𝛥𝛥)2 − series becomes Sin(𝜃 + 𝛥𝛥) = Sin(𝜃) + Cos(𝜃) (cos𝜃) (𝛥𝛥) 𝑅 (3!) (𝛥𝛥)3(1.3), − Sin(𝜃) (𝛥𝛥)2 2R2 while − Cos(𝜃) (𝛥𝛥)3 4R3 Madhava's (1.4). An extension of the above rules given by Madhava are found in works by a student named Paramesvara, and explain the process for computing later terms of the series: Now this [further] method is set forth. […] Subtract from the Cosine half the quotient from dividing by the divisor the Sine added to half the quotient from dividing the Cosine by the divisor. Divide that [difference] by the divisor; the quotient becomes the corrected Sine-portion (Plofker, 2001, p. 286). In these rules, the divisor is taken as (𝛥𝛥) 𝑅 , so half the divisor is simply (𝛥𝛥) 2R , as used in the above calculations. The Sine-portion also discussed here is the difference between the known Sine value and the desired Sine value, or Sin(𝜃 + 𝛥𝛥) − Sin(𝜃). Therefore little manipulation is needed to get an expression for solely the desired Sine value, Sin(𝜃 + 𝛥𝛥). In short, the above rules say to add the (𝛥𝛥) known Sine value, Sin(𝜃)to the known Cosine value multiplied by 2R . This produces the expression Sin(𝜃) + (𝛥𝛥) 2R Cos(𝜃) , which is then multiplied by expression is then multiplied by Sin(𝜃 + 𝛥𝛥) − Sin(𝜃) = (𝛥𝛥) reduces this expression to: 𝑅 (𝛥𝛥) , producing: 𝑅 [Cos(𝜃) − Sin(𝜃) Sin(𝜃 + 𝛥𝛥) = Sin(𝜃) + Cos(𝜃) (𝛥𝛥) 𝑅 − Sin(𝜃) (𝛥𝛥) 2R (𝛥𝛥)2 2R2 (𝛥𝛥) 2R and subtracted from Cos(𝜃) . The entire − Cos(𝜃) − Cos(𝜃) (𝛥𝛥)2 4R2 ]. Then rewriting and simplifying (𝛥𝛥)3 , the same as equation (1.4) above. 4R3 Again, conversion to the modern sine accounts for the R in the denominator, and one can see how Webb similar this expression is to the Taylor Series expression (1.3). The reason for the difference in denominator in the fourth term is due to the difference in computing the denominators, or correction terms. The Taylor Series relies on the general algorithm of differentiating each term and dividing by the factorialized order of derivative for that term. This is why the fourth term of the Taylor series of sin(𝜃)is a 3!, because the third derivative of sin(𝜃)is computed. Madhava's derivation of this series relies on the process of multiplying each term by the set correction value (𝛥𝛥) 2R . Therefore applying Madhava's correction term three times produces a denominator of 23=8, and the multiplication of this term by two produces four as the divisor. Although the processes used to find the denominators in the Taylor and Madhava series are different, the fundamental idea of defining a value using other known functional values is the same. The Taylor Series algorithm allows one to define a complex value or function using a series of successive derivatives, which express the rate of change of the function prior to it in the series. Although Madhava used similar triangle relationships to express the change in one trigonometric function in terms of the other, he still nonetheless used the idea of differentiation. The general goal of the derivative is to measure the instantaneous rate of change of some function, which is what Madhava was doing when he stated that 𝛥Sin𝑖+1 = Cos𝑖.5 (𝐶𝐶𝐶𝐶𝐶) 𝑅 from the previously demonstrated derivation of the power series. These similar triangle relationships and special properties of trigonometric functions allowed Madhava to define changes in Sine values in terms of known Cosine values, and vice versa. The above accounts of Madhava's techniques for approximating trigonometric functions expose two key ideas about the Kerala school. One is that the members had an exceptional understanding of trigonometry and circular geometry, and the second is that their works contain many of the fundamental aspects of calculus. The longstanding interest Indian mathematicians had in finding infinite representations of complicated values and in finding better approximations of trigonometric TME, vol. 11, no. 3, p. 511 functions helped set the stage for the major advancements Madhava and his followers made. Yet not only did this mathematical culture prime the Kerala school for progress in trigonometry, but it almost made it necessary for scholars and teachers to come up with new strategies to approximate the heavily used trigonometric functions. This promotes the idea that mathematical advancements are made based on what is needed at the time. In Europe, the need to create better navigation and calendar techniques prompted the invention of calculus in Europe, but not until the in the 1600's. But Indian astronomers needed new and more accurate ways to compute Sine tables in the 1400's, which explains why Indian calculus was developed so early. This also explains why it stays within trigonometry, because Indian mathematicians really had no use of generalizing the concepts of calculus for non-trigonometric functions. Perhaps this is why the Indian invention of calculus is rarely recognized even though it predates European calculus by 200-300 years. Whatever the reason for this lack of recognition, it is easy to see how the brilliant techniques used by Indian mathematicians are indeed the techniques of calculus applied to the very specific area of trigonometry. Acknowledgement This paper was written as part of the requirements for Math 429: History of Mathematics, taught by Professor Bharath Sriraman in Spring 2014. Webb References Divakaran, P.P. (2010). Calculus in India: The historical and mathematical context. Current Science, 99(3), 293-299. Gupta, R.C. (1969). Second order interpolation in Indian mathematics up to the fifteenth century. Indian Journal of History of Science, 4(1), 86-98. Mallayya, V. M. (2011). The Indian mathematical tradition with special reference to Kerala: Methodology and motivation. In B.S. Yadav Editor & M. Mohan Editor (Eds.), Ancient Indian leaps into mathematics (153-170). New York, NY: Springer. Morales, L. (n.d.). Historical counting systems. Retrieved from http://pierce.ctc.edu Moreno-Armella, L., & Sriraman, B. (2005). Structural stability and dynamic geometry: Some ideas on situated proofs. ZDM- The International Journal on Mathematics education, 37(3), 130-139. Pearce, I.G. (2002). Indian mathematics: Redressing the balance. Retreived from MacTutor History of Mathematics Archive. http://www.history.mcs.st-andrews.ac.uk/index.html Plofker, K. (2009). Mathematics in India. Princeton, NJ: Princeton University Press. Plofker, K. (2001). The “error” in the Indian “Taylor series approximation” to the sine. Historia Mathematica, 28, 283-295. Rosenthal, A. (1951). The history of calculus. American Mathematical Monthly, 58(2), 75-86. Van Brummelen, G. (2009). The mathematics of heaven and the earth: The early history of trigonometry. Princeton, NJ: Princeton University Press. TME, vol. 11, no. 3, p. 513 Development of the Binary Number System and the Foundations of Computer Science Daniel R. Lande 1 University of Montana ABSTRACT: This paper discusses the formalization of the binary number system and the groundwork that was laid for the future of digital circuitry, computers, and the field of computer science. The goal of this paper is to show how Gottfried Leibniz formalized the binary number system and solidified his thoughts through an analysis of the Chinese I Ching. In addition, Leibniz’s work in logic and with computing machines is presented. This work laid the foundation for Boolean algebra and digital circuitry which was continued by George Boole, Augustus De Morgan, and Claude Shannon in the centuries following. Some have coined Leibniz the world’s first computer scientist, and this paper will attempt to demonstrate a validation of this conjecture. Keywords: binary number system, Boolean logic, Gottfried Leibniz, I Ching, hexagram, trigram 1 [email protected] The Mathematics Enthusiast, ISSN 1551-3440, vol. 11, no. 3, pp. 513-540 2014© The Author(s) & Dept. of Mathematical Sciences-The University of Montana Lande, p. 514 1 Introduction The binary number system is one of the most influential developments in the history of technology. The formalization of the system and its additions and refinements over the course of 200+ years ultimately led to the creation of electronic circuitry constructed using logic gates. This creation ushered in the technological era and left the world forever changed. Important figures in the history of the binary number system and mathematical logic and less directly the history of computers and computer science include Gottfried Leibniz, George Boole, Augustus De Morgan and Claude Shannon. This paper focuses on Leibniz’s formalization of the binary system and his work in mathematical logic and computing machines. 2 Numeric Systems In the most general sense, a number is an object used to count, label, and measure (Nechaev, 2013). In turn, a numeral or number system is a system for expressing numbers in writing. In the history of mathematics, many different number systems have been developed and used in practice. The most common system currently in use is the Hindu-Arabic numeral system, which was developed between the 1st and 4th centuries and later spread to the western world during the Middle Ages (Smith & Karpinski, 1911). The Hindu-Arabic system is based on ten different symbols and is considered to be a base 10 system. Numeral systems with different bases have found use in applications where a different base provides certain advantages. Other numeral systems currently in use include the duodecimal system (base 12), hexadecimal system (base 16), and binary system (base 2). The duodecimal system uses the standard ten digits of the decimal system (0-9) and additionally represents ten as ‘A’ and eleven as ‘B’. The duodecimal system is useful because of its divisibility by 2, 3, 4, and 6. This allows the TME, vol. 11, no. 3, p. 515 common fractions 1�2 , 1�3 , 2�3 , 1�4 , 3�4 to be represented by the decimal equivalents of 0.6, 0.4, 0.8, 0.3 and 0.9 without repeating digits. Some have proposed the duodecimal system as superior to the base 10 decimal system (Dvorsky, 2013). The hexadecimal system adds the additional symbols of the letters A-F to the standard decimal system symbols. Hexadecimal numbers are often used in computer programming environments to represent things such as URIs and color references. Hexadecimal numbers are useful in computer contexts because of their easy conversion to binary numbers, while providing a shorter written representation. For example, the color red can be represented in hexadecimal as FF0000 with each pair of digits representing the amount of each primary color red, blue, and green (RGB). The equivalent numeral in decimal would be 16711680 and in binary 1111 1111 0000 0000 0000 0000. The binary number system is represented by only two symbols, 0 and 1. Nearly all computers use the binary numeral system which maps directly to the OFF and ON conditions of an electrical switch. 3 I Ching The I Ching, commonly known as The Classic of Changes or Book of Changes, is one of the oldest Chinese texts dating to the 3rd century BCE (Smith R. J., 2012). Many consider the origins of the I Ching to come from before the time of written history. Traditional Chinese belief was that the I Ching was supernaturally revealed to the mythical Chinese Emperor Fu Xi (Bi & Lynn, 1994). The I Ching incorporates the Chinese philosophy concept of Yin-Yang (Huang, 1987). The concept describes the interconnection between forces in our world and is central to many classical Chinese scientific and philosophical ideas (Osgood & Richards, 1973). In the simplest sense, Yin represents dark and Yang represents light. Yin and Yang are thought to be comple- Lande, p. 516 mentary to each other rather than opposing. Yin-Yang is often represented with the Taijitu symbol, portraying the accompanying contrast and interconnection between the two forces. Figure 1: Yin-Yang represented through the Taijitu symbol (Yin and Yang, 2007) Historically, the primary use of the I Ching has been as a divination text (Huang, 1987). Merriam-Webster dictionary describes divination as “the practice of using signs (such as an arrangement of tea leaves or cards) or special powers to predict the future” (Divination, 2014). By generating the symbols contained within the text, an attempt to interpret life and predict future events can be gleaned by the reader. Though its source is seeded in divination, the moral code present throughout the I Ching has been referenced and applied in a variety of ways throughout Chinese history (Huang, 1987). Trigrams and Hexagrams The I Ching represents Yin-Yang through the use of trigrams and in later versions of the text, hexagrams. In these representations, a solid line represents Yang and an open line represents Yin. The early version of the I Ching presents 23 = 8 trigrams, which is the possible combinations of three rows of lines representing Yin or Yang. Each one of these trigrams represents a sort of parable or concept. Figure 2 shows the eight trigrams with their accompanying interpretations and Chinese symbol. TME, vol. 11, no. 3, p. 517 Figure 2: I Ching Trigrams (Trigrams, 2007) In order to create a hexagram, two trigrams are stacked on top of each other creating six lines allowing for 26 = 64 possible combinations of hexagrams. The 64 hexagrams are created in 32 pairs of two, with each item in the pair being the reverse of the other. Hexagrams often ap- pear in circular representations, sometimes combining other concepts such as the five elements. In Figure 3, the outer ring represents the 365 days in a year. The next ring represents the 64 hexagrams followed by the 13, 28 day months in a year. Finally, two different representations of the eight trigrams are displayed. The inner part of the circle represents the five Chinese elements of Wood, Earth, Water, Fire, and Metal. Lande, p. 518 Figure 3: 64 Hexagrams of the I Ching (I Ching and the Year, 2012) The Chinese scholar and philosopher Shao Yung created the binary arrangement of hexagrams in the 11th century (Mungello, 1971). He displayed them both circularly and horizontally in the same order, so it was clear he understood the binary progression. There is, however, little evidence that the trigrams and hexagrams were ever used for counting (Mungello, 1971). Many other orderings of the hexagrams are present in Chinese history and these representations do not follow the binary progression. Despite the intent of the particular hexagram ordering, this binary progression proved to be influential later in history. Use of I Ching for Divination In their translation of the I Ching, Kerson and Rosemary Huang provide a detailed description of the use of the I Ching as a divination text (Huang, 1987). The basic idea is to cast a hexagram by generating the six lines using a system of rules. Several methods of casting the hexagrams exist TME, vol. 11, no. 3, p. 519 with varying probability distributions. Common methods include using yarrow stalks; combinations of two, three, or four coins; or dice. Though using yarrow stalks was the original method, the most common is the three coin method due to its simplicity. When casting a hexagram, each line is generated as Yin or Yang and as changing or unchanging. Two hexagrams are created; the original or present hexagram and the changed or future hexagram. There are sixty-four possible hexagrams (26 = 64). Each hexagram can then change into sixty-four changed hexagrams. A total of 64 × 64 = 4,096 combinations are possi- ble within the divination system. Additionally, the hexagrams will be interpreted uniquely by each individual they are presented to, so an infinite number of meanings are possible. To cast a hexagram using three coins, the coins are tossed and then the outcome is observed as a combination of three heads, two heads, two tails, or three tales. Old Yang is represented by the number 9 and Young Yang by the number 7. Additionally, Old Yin is represented by the number 6 and Young Yin by the number 8. Figure 4 shows the possible results and the corresponding line represented. The coins are tossed a total of six times, with the line resulting from each toss written above the previous line. The stacked lines when disregarding the young and old represent the original or present hexagram. A changed or future hexagram is created by changing all of the Old Yin and Old Yang values to their opposite representation (e.g. Old Yin becomes Yang and Old Yang becomes Yin). Figure 4: Three Coin Method for Casting Hexagrams (How to Consult the I Ching, 2014) Lande, p. 520 Once the hexagrams have been cast, the values they represent can be referenced within the text of the I Ching. The bottom three lines are the lower trigram and the top three lines the upper trigram. The I Ching contains a matrix in which the corresponding value of the hexagram can be looked up using the two trigrams. An example would be the upper trigram Wind and the lower trigram Water, known as Wind Over Water. When referenced in the matrix, this results in a hexagram value of fifty-nine which corresponds to the hexagram Flowing. This original hexagram can then be consulted, followed by the changed hexagram resulting from reversing the old values. A translation of The Wind Over Water hexagram reads as follows (Huang, 1987): The King goes to the temple. Auspicious to cross the great stream. Auspicious omen. In addition to the text of the hexagram as a whole, further interpretation is provided for each of the six lines of the hexagram. Further weight is given to the lines that result in the changed hexagram. It is also important to understand that the reading of the translations of these hexagrams by an English reader frequently neglects certain cultural aspects that were obvious and important to the ancient Chinese reader. Modern translations often provide a commentary to offer insight as to how the hexagrams would have been historically interpreted. In the example of the Wind Over Water hexagram, an understanding that “Flowing water, delightful when it is gentle, but menacing when it grows to a torrent, had a special meaning for the ancient Chinese” helps to explain the intent of the Flowing hexagram (Huang, 1987). TME, vol. 11, no. 3, p. 521 4 Leibniz Gottfried Wilhelm Leibniz (1646-1716) is an important figure in the history of mathematics and philosophy (Belaval, 2014). Gauss is often considered the last mathematician to know all of mathematics; Leibniz has been referred to as the last universalist or “universal genius” with interests and contributions in all areas of European knowledge (Perkins, 2010). Leibniz made contributions in the disciplines of mathematics, physics, philosophy, logic, psychology, theology, technology, applied science, economics, medicine, history, and other areas (Perkins, 2010). Much of Leibniz’s life was spent trying to align his views on religion and philosophy with his findings in math and science. Leibniz’s most recognized achievements were his contributions in the area of calculus. Leibniz was also a prominent inventor of mechanical calculators, creating the Leibniz wheel that was used in mechanical calculators until the invention of electronic calculators in the 1970s. Though relatively unacknowledged during his lifetime, Leibniz’s advances in logic and his description and formulation of the binary number system played an important role in the development of computers in the twentieth century. Some consider Leibniz to be one of the most important figures in the history of computers and the world’s first computer scientist (Dalakov, n.d.). Despite Leibniz’s many achievements, he had fallen out of favor by the time of his death and his grave remained unmarked for 50 years. Characteristica Universalis Leibniz was a voluminous writer across many disciplines. A complete collection of the writings of Leibniz has yet to be published, but it is projected to have over forty volumes (Perkins, 2010). Many of his writings were not published during his lifetime. Leibniz did not write a thorough explanation of his philosophical views, so information must be combined from amongst his writ- Lande, p. 522 ings. However, common within many of his works is the attempt to establish what he called a characteristica universalis or universal characteristic. When writing in French, Leibniz often referred to the spécieuse générale to represent the same concept. Leibniz intended for the universal characteristic to be a formal language that could represent ideas present in math, science, and other fields. He believed that all of human thought could be generalized with a few primitive thoughts and that if these thoughts could be represented as a set of characters, those using the characters for reasoning would never error (Peckhaus, 2004). The characters would be represented as pictographs and could be easily translated and understood by any individual regardless of language. The general characters representing simple thoughts could be combined together to form more complex thoughts. Early his career, Leibniz made some efforts in the formation of pictograms that could be applied to his characteristica universalis through a method of diagrammatic reasoning. Leibniz presented his first pictographs in his 1666 paper De Arte Combinatoria (On the Art of Combinations), which extended his doctoral dissertation in philosophy (Leibniz, Dissertation on the Art of Combinations, 1989). Figure 5 shows Leibniz’s representation of Aristotle’s four elements and Figure 6 shows his representation of the Aristotelian theory of all things being created from the four base elements. These writings came before Leibniz had formal training in math. He revisited this material throughout his career, but did not significantly expand his thoughts on these pictographs. Figure 5: Leibniz's pictographs of the elements of earth, water, air, and fire TME, vol. 11, no. 3, p. 523 Figure 6: Leibniz's representation of Aristotelian Theory of creation from base elements Leibniz felt that the development of the universal characteristic would be highly beneficial to society. In 1679, Leibniz wrote that: Once the characteristic numbers for most concepts have been set up, however, the human race will have a new kind of instrument which will increase the power of the mind much more than optical lenses strengthen the eyes and which will be as far superior to microscopes or telescopes as reason is superior to sight (Leibniz, On the General Characteristic, 1989). Leibniz also stated that the distractions of his work in other areas prevented him from completely working out the universal characteristic. However, he believed that there were individuals that could work out the system in five years’ time (Leibniz, On the General Characteristic, 1989). He also stated the task could be completed in two years if only the doctrines of mortality and metaphysics, which he considered the most useful for life, were worked out. In 1714, Leibniz discussed his ideas with Marquis de l'Hôpital and others and felt they “paid no more attention to it Lande, p. 524 than if I had told them about a dream of mine.” Leibniz acknowledged the difficulty in creating the universal characteristic especially “without the advantage of discussions with men who could stimulate and help me in work of this nature” (Leibniz, On the General Characteristic, 1989). Calculus Ratiocinator Important to the topic of this paper is Leibniz’s thoughts on what he called the calculus ratiocinator. The characteristica universalis has been interpreted in many ways and Leibniz’s true intent may never be fully understood. It has been speculated that Leibniz believed that the establishment of the characteristica universalis would allow the mechanical deduction of all truths from the thoughts represented within through what he called the calculus ratiocinator (Peckhaus, 2004). This kind of logical deduction would be a form of calculating machine that would make decisions based on inputs from the symbols of the characteristica universalis. It is not clear whether Leibniz was thinking of the calculus ratiocinator as a more of a software or hardware solution. The calculus ratiocinator is a prequel to mathematical logic or “the algebra of logic” as stated by Leibniz that would be developed in the subsequent centuries. Leibniz and the I Ching According to David Mungello’s article “Leibniz’s Interpretation of Neo-Confucianism,” Leibniz expressed an interest in China early in his life (Mungello, 1971). He read many Chinese texts including the Confucius Sinarum Philosophus, which was a translated collection of three of the four Confucian Four Books. Between the years of 1697 and 1707, Leibniz had a correspondence with Joachim Bouvet, a French Jesuit who worked in China. Bouvet was a member of the Figurists, a group who attempted to understand how ancient Chinese rites should be interpreted by Christianity. The Figurists believed Fu Xi, whom traditional Chinese beliefs stated that the I TME, vol. 11, no. 3, p. 525 Ching had been revealed to, was not Chinese but was rather the “original Lawgiver of all mankind” (Mungello, 1971). During his correspondence with Bouvet, Leibniz encountered the hexagrams of the I Ching previously discussed (Mungello, 1971). Leibniz had expressed in letters to Bouvet some of his ideas concerning his system of counting by twos. Bouvet recognized the patterns presented and sent images of the hexagrams he had encountered in China. After studying the hexagrams, in particular The Former Heaven ordering of the hexagrams, Leibniz felt confirmation that his work with binary numbers was important and valid. Fu Xi is thought to have created The Former Heaven order of hexagrams. Leibniz hoped that the binary system would aid him in the creation of the characteristica universalis, constructing a universal formal language for expressing math, science, and other concepts. The discovery of the hexagrams and their relation to his binary number system gave him encouragement in this area. Leibniz felt that the binary numeral system represented Christianity’s view of creation from nothing (Mungello, 1971). The numeral 1 represents God and the numeral 0 represents nothing. Leibniz’s interest in China led him to try to find ways to unite the philosophies of east and west. His assertion of the relationship between the Chinese hexagrams and his binary system was an attempt to forge that connection, despite the fact that the hexagrams served a different purpose to the Chinese than he had interpreted. Nonetheless, the connection he drew led him to further his studies in the area, continue his correspondences, and write his paper “Explanation of Binary Arithmetic.” Explanation of Binary Arithmetic In 1703, Leibniz published his paper “Explication de l'Arithmétique Binaire”, or “Explanation of Binary Arithmetic.” In this paper, Leibniz documents the basics of his binary number system in- Lande, p. 526 cluding counting and examples of addition, subtraction, multiplication, and division (Leibniz, Explanation of binary arithmetic, 1703). Leibniz also comments on where the binary number system is useful. He does not propose replacing the decimal system, but rather suggests some of the advantages it offers over the decimal system in use at that time. Leibniz finishes his paper by connecting his system with the Chinese hexagrams and explaining how the Chinese had lost the intended meaning. Leibniz makes the statement that it has been up to him, a European, to restore the lost meaning (even though his interpretation has been found to likely be incorrect) (Mungello, 1971). Counting In his paper, Leibniz discusses that he has used the progression of proceeding by two for many years (Leibniz, Explanation of binary arithmetic, 1703). He uses only the characters 0 and 1, and when he reaches two, he starts again. Figure 7 demonstrates Leibniz’s counting method from his published paper, with the far right column representing the decimal equivalent. Leibniz has boxed in the number of digits that must be present to represent a number. For example, in order to represent numbers 4-7, three digits must be present. He has also included leading zeroes on all of the numbers, which he later explains makes it easier to compare against the Chinese hexagrams. TME, vol. 11, no. 3, p. 527 Figure 7: Leibniz's Method of Counting in Binary (Leibniz, Explanation of binary arithmetic, 1703) Leibniz also comments on what he calls the “celebrated property of the geometric progression by twos” in whole numbers (Leibniz, Explanation of binary arithmetic, 1703). He demonstrates that if provided with a binary number from each degree, all of the numbers below double the highest degree can be composed from those numbers. In Table 1, this geometric progression is demonstrated. With the combination of the numbers 1, 2, and 4, all numbers up to one less than 2 ∗ 4 = 8 − 1 = 7 can be represented. So, 1, 2, 3, 4, 5, 6, and 7 can be represented by a binary number of three digits. Leibniz then mentions that this property would allow “assayers to weigh all sorts of masses with few weights and could serve in coinage to give several values with few coins” (Leibniz, Explanation of binary arithmetic, 1703). Lande, p. 528 1 0 0 4 1 0 2 1 1 1 1 1 7 Table 1: Geometric progression by twos Addition and Subtraction Leibniz next shows examples of how addition and subtraction can be performed using binary numbers (Leibniz, Explanation of binary arithmetic, 1703). He only discusses in passing these operations, stating that “all these operations are so easy that there would never be any need to guess or try out anything” (Leibniz, Explanation of binary arithmetic, 1703). When adding binary numbers, the following form holds: 0 + 0 → 0, 0 + 1 → 1, 1 + 0 → 1, and 1 + 1 → 0. In the case of 1 + 1 → 0, an additional 1 will have to be added or carried to the next column. Table 2 shows the binary addition table and Table 3 shows the truth table for the logical OR operator (∨). Notice the values are the same with the exception being when both inputs are 1. 0 1 0 0 1 1 1 10 Table 2: Binary Addition Table 0 1 0 0 1 1 1 1 TME, vol. 11, no. 3, p. 529 Table 3: Truth Table for Logical OR Operator (∨) Table 4 shows an example of Leibniz’s demonstration of addition. Addition with binary numbers is performed in much the same way as with decimal numbers using the carry method. Starting from the right column, 0 + 1 = 1. In the second column, 1 + 1 = 0 and 1 is carried to the next column. For the third column, 1 + 1 + 1 = 1 and 1 is carried to the next column. The result is 1101, with the decimal equivalent being 13. As an interesting aside, the representation of the binary equivalents of 7 and 6 were incorrect in the English translation of Leibniz’s paper, but were correct in his original manuscript. Table 5 demonstrates subtraction with binary numbers, which is again very similar to subtraction with the decimal system. In order to subtract 1 from 0, borrowing from the column to the left is performed. 1 1 1 7 1 1 0 6 0 1 13 . . 1 1 Table 4: Addition with Binary Numbers 1 1 0 1 13 1 1 1 7 1 1 0 6 Table 5: Subtraction with Binary Numbers Multiplication and Division Multiplication is again performed very similarly to multiplication with decimal numbers. Multiplication is performed digit-by-digit with the results being added together in the method Lande, p. 530 previously presented. Table 6 shows an example of binary multiplication as demonstrated by Leibniz. Table 7 shows the binary multiplication table. The binary multiplication table is identical to the truth table for the logical AND operator (∧). Much like the other operations, binary division is similar to decimal division. Table 8 shows Leibniz’s example of binary division, which is functionally similar to long division with decimal numbers, just notated in a slightly different manner. 1 1 1 3 1 1 3 1 1 1 . 1 0 0 1 9 Table 6: Multiplication with Binary Numbers 0 1 0 0 0 1 0 1 Table 7: Binary Multiplication Table and Truth Table for the Logical AND Operator (∧) 15 1 1 1 1 3 1 1 1 1 1 1 1 0 1 Table 8: Division with Binary Numbers 5 TME, vol. 11, no. 3, p. 531 Fu Xi and Chinese Trigrams At this point in his paper, Leibniz discusses what he calls the “mystery of the lines of an ancient King and philosopher named Fuxi” (Leibniz, Explanation of binary arithmetic, 1703). Leibniz displays an example of the I Ching trigram he calls the Figure of the Eight Cova (Figure 8) connected with his number system of counting by twos. Next, Leibniz makes some bold statements. He states that the Chinese have lost the meanings of these figures and that he has solved the mystery with the aide of Father Bouvet (Leibniz, Explanation of binary arithmetic, 1703). Leibniz further mentions that the 64 hexagrams align perfectly with his number system (Leibniz, Explanation of binary arithmetic, 1703). The paper is concluded with Leibniz’s discussion that there may be even more knowledge to be derived from the Chinese hexagrams if the origins of Chinese writing could be discovered. Figure 8: Figure of the Eight Cova, Binary Numbers, and Decimal Numbers (Leibniz, Explanation of binary arithmetic, 1703) Leibniz’s short paper (3-5 pages depending on publication) introducing his binary number system had a significant impact on the scientific community (Glaser, 1971), but had an even greater effect on his own personal thoughts in theology and philosophy. Though not discussed in this paper, in letters to Rudolph August, Duke of Brunswick, Leibniz expressed that his system of numbers were a suitable analogy to God’s omnipotence. Leibniz states: Lande, p. 532 It might be said that nothing is a better analogy to, or even demonstration of such creation than the origin of numbers as here represented, using only unity and zero or nothing. And it would be difficult to find a better illustration of this secret in nature or philosophy. As was the case with many of his mathematical and scientific studies, Leibniz was trying to tie the fields of theology and philosophy to his new discoveries. Formal Logic In addition to the binary number system, Leibniz made significant advances in the field of formal logic, even though his papers were not published during his lifetime. Some would say that he advanced the field in a way that had not been seen since Aristotle (Bertrand, 1945). In his unpublished papers, Leibniz articulated the modern day properties of conjunction, disjunction, negation, identity, inclusion, and the empty set. Many of Leibniz’s papers in this area were not published until the 20th century, and it is only then that the full extent of his advances was revealed. It was not until George Boole and Augustus De Morgan in the nineteenth century that many of the same developments were achieved (Bertrand, 1945). Though his discoveries in logic did not influence people of his era or those that followed in the subsequent 150 years, it is clear that Leibniz was ahead of his time with his thoughts on formal logic. Computation Leibniz invented a mechanical calculating machine known as the stepped reckoner in 1672, with a working model being built in 1694 (Martin, 1925). This machine was the first that could perform the operations of addition, subtraction, multiplication, and division. Though the machine was sound in design, the complicated and precise nature made it difficult to construct during that time in history. Only three of the machines were produced due to the difficulty of construction. TME, vol. 11, no. 3, p. 533 Though Leibniz did not use his binary number system in this machine, the systems still became influential in later designs of computing machines (Martin, 1925). Leibniz’s machine uses a mechanism that became known as the Leibniz wheel (Martin, 1925). The Leibniz wheel has nine teeth to represent each of the single digit decimal numbers 19. A second gear then meshes with the teeth of the wheel depending on position. The input is set using a series of eight knobs and then the operator is set using a dial. By turning a crank, the calculation is performed and the result is displayed on 16 windows on the rear of the machine. The design of the wheel inside this machine was later used by inventors of other calculating machines. Figure 9 shows a sketch of the Leibniz wheel and it functions. Figure 9: Leibniz Wheel (Dalokov, n.d.) Perhaps more important to the history of binary numbers and computers was Leibniz’s work on a concept to create a machine that represented binary numbers using marbles governed by punch cards. In his work “Progressione Dyadica” (as cited in Bauer, 2010), Leibniz describes his machine operating on the binary principle: This type of calculation could also be carried out using a machine. The following method would certainly be very easy and without effort: a container should be provided with Lande, p. 534 holes in such a way that they can be opened and closed. They are to be open at those positions that correspond to a 1 and closed at those positions that correspond to a 0. The open gates permit small cubes or marbles to fall through into a channel; the closed gates permit nothing to fall through. They are moved and displaced from column to column as called for by the multiplication. The channels should represent the columns, and no ball should be able to get from one channel to another except when the machine is put into motion. Then all the marbles run into the next channel, and whenever one falls into an open hole it is removed. Because it can be arranged that two always come out together, and otherwise they should not come out. Though this machine was never created by Leibniz, his description describes precisely how electronic computers function. Gravity and movement of marbles are replaced by electrical circuits, but the principle functions in the same way. Figure 10 shows a modern binary addition machine built in a manner similar to that described by Leibniz. To perform addition, the first number is loaded into the machine by placing marbles through the holes in the top for each place represented. For example, to load the number one, a marble would be placed through the 1 hole. This would place the rocker in that position to be toggled to the right, still holding the marble. When the rockers are rocked to the left, they represent zero and when they are rocked to the right they represent one. If another marble was dropped into the 1 hole, the rocker would be tipped to the left, releasing the first marble from the machine and transferring the second marble to the 2 position representing 1+1=2. Adding one more marble into the 1 hole would result in marbles in the 1 and 2 positions with those rockers to the right representing 1+1+1=3 or the binary representation 11 due to the 1 and 2 rockers being in the right position. More advanced addition can be performed by loading marbles and then TME, vol. 11, no. 3, p. 535 viewing the state of the machine at the end of the operation. A video demonstrating the use of this machine is available at https://www.youtube.com/watch?v=GcDshWmhF4A. Figure 10: Binary Addition Machine (Wandel) To perform the addition of 7 + 6, marbles would be initially loaded into the 1, 2, and 4 positions for the binary representation of 7 as111. Table 9 shows the state of the machine after loading the number 7. To add 6, marbles would be dropped through the 2 and 4 holes, corresponding to the binary representation 110. When the marbles are placed through these holes, the original marble in the 2 position will drop out of the machine, the new 2 marble will carry to the 4 position releasing the original 4 marble. This marble will then carry to the 8 position. The marble that was dropped into the 4 hole will remain in the 4 position resulting in marbles in the 8, 4, and 1 positions representing 13 in binary as 1101. Table 10 shows the state of the machine at this point. Further additions can be performed by dropping more marbles through the holes. Lande, p. 536 32 16 8 4 2 1 O O O Table 9: Binary Addition Machine Representing 7 32 16 8 4 2 1 O O O Table 10: Binary Addition Machine Representing 13 5 Later Developments in Mathematical Logic Few major advances in the area of the binary system and mathematical logic occurred in the 125 years following Leibniz’s death until the development of a system of symbolic logic by George Boole in the middle of the nineteenth century (Boole, 1854). Boole’s book, An Investigation of the Law of Thought introduced his form of algebraic logic, a system of algebra based on the truth values true and false (1 and 0) and the conjunction (AND), disjunction (OR), and negation (NOT) operators. This symbolic system was eventually given Boole’s name and is now referred to as Boolean algebra. Another important individual in the development of formal logic was Augustus De Morgan. He published his book Formal Logic: Or, The Calculus of Inference, Necessary and Probable in 1847 (De Morgan, 1847). This book introduced De Morgan’s early thoughts on logic. In later publications, De Morgan presented a series of transformation rules that later became known TME, vol. 11, no. 3, p. 537 as De Morgan’s Laws. Many of the ideas presented by Boole and De Morgan had been previously proposed by Leibniz but were not published until late in the nineteenth century. In the early twentieth century, Claude Shannon proved that binary arithmetic combined with Boolean algebra could be applied to electrical relays. His Master’s thesis in 1937 essentially founded digital circuitry design and ushered in the era of the modern-day computer (Shannon, 1936). As previously discussed, Leibniz proposed a mechanical calculator over 200 years earlier that functioned using the same basic ideas for calculation. Though many of these connections were not drawn until a later time, a clear path from Leibniz to Boole and De Morgan to Shannon is easily apparent in retrospect. 6 Conclusion It is clear to this author that Leibniz’s contributions of the formalization of the binary number system, his unpublished writings on formal logic, and his work on calculating machines justify giving him the title as the world’s first computer scientist. His work was clearly ahead of his time; many of his findings were not furthered or rediscovered for the next 150-230 years. The framework that Leibniz laid provided the impetus for the advances that eventually lead to the invention of the digital computer. Some of his work in this area may have gone unrecognized during his time, but as hindsight has shown, his place in the history of computer science is hard to discount. Lande, p. 538 References Bauer, F. (2010). Origins and Foundations of Computing. Springer Berlin Heidelberg. Belaval, Y. (2014, January 21). Gottfried Wilhelm Leibniz. Retrieved March 12, 2014, from Encylopedia Britannica: http://www.britannica.com/EBchecked/topic/335266/GottfriedWilhelm-Leibniz Bertrand, R. (1945). A History of Western Philosophy. New York: Simon & Schuster. Bi, W., & Lynn, R. J. (1994). The Classic of Changes: I Ching. New York: Columbia University Press. Boole, G. (1854). An Investigation of the Laws of Thought on Which are Founded the Mathematical Theories of Logic and Probabilities. Macmillan. Dalakov, G. (n.d.). Gottfried Leibniz. Retrieved February 25, 2014, from History of Computers: http://history-computer.com/Dreamers/Leibniz.html Dalokov, G. (n.d.). History of Computers. Retrieved March 14, 2014, from The Stepped Reckoner of Gottfried Leibniz: http://historycomputer.com/MechanicalCalculators/Pioneers/Lebniz.html De Morgan, A. (1847). Formal Logic: Or, The Calculus of Inference, Necessary and Probable. London: Taylor and Walton. Divination. (2014). Retrieved May 4, 2014, from Merriam-Webster: http://www.merriamwebster.com/dictionary/divination Dvorsky, G. (2013, January 18). Why We Should Switch To A Base-12 Counting System. Retrieved March 2, 2014, from http://io9.com/5977095/why-we-should-switch-to-a-base12-counting-system/all Glaser, A. (1971). History of Binary and Other Nondecimal Numeration. Tomash Publishers. How to Consult the I Ching. (2014). Retrieved May 2, 2014, from Divination Foundation: http://divination.com/resources/articles/iching-reading/ Huang, K. a. (1987). I Ching: A new translation restores the authentic spirit of the ancient text. New York: Workman Publishing. TME, vol. 11, no. 3, p. 539 I Ching and the Year. (2012, June 23). Retrieved March 17, 2014, from theAbysmal: http://theabysmal.wordpress.com/tag/hexagram/ Ifrah, G. (2000). The Universal History of Numbers: From Prehistory to the Invention of the Computer. New York: J. Wiley. Leibniz, G. W. (1703). Explanation of binary arithmetic. Leibniz, G. W. (1989). Dissertation on the Art of Combinations. In L. E. Loemker (Ed.), Philosophical Papers and Letters (Vol. 2, pp. 73-84). Dordrecht, Holland: Springer Netherlands. (Original work published 1666). Leibniz, G. W. (1989). On the General Characteristic. In L. E. Loemker (Ed.), Philosophical Papers and Letters (Vol. 2, pp. 221-228). Dordrecht, Holland: Springer Netherlands. (Original work published 1679). Martin, E. (1925). The Calculating Machines Their History and Development. The Charles Babbage Institute. Mungello, D. E. (1971, Jan.). Leibniz's Interpretation of Neo-Confucianism. Philosophy East and West, Vol. 21, No. 1, pp. 3-22. Nechaev, V. (2013). Number. Retrieved March 20, 2014, from Encyclopedia of Mathematics: http://www.encyclopediaofmath.org/index.php?title=Number&oldid=31090 Osgood, C. E., & Richards, M. M. (1973). From Yang and Yin to and or but. Language, Vol. 49, No. 2, 380-412. Peckhaus, V. (2004). Calculus Ratiocinator vs. Characteristica Universalis? The Two Traditions in Logic, Revisited. History and Philosophy of Logic, 25(1), 3-14. Perkins, F. (2010). Leibniz: A Guide for the Perplexed. London, GBR: Continuum International Publishing. Shannon, E. C. (1936). A Symbolic Analysis of Relay and Switching Circuits. Massachusetts Institue of Technology. Smith, D. E., & Karpinski, L. C. (1911). The Hindu-Arabic Numerals. Boston and London: Ginn and Company. Lande, p. 540 Smith, R. J. (2012). The I Ching: A Biography. Princeton, New Jersey: Princeton University Press. Strickland, L. (2010). Shorter Leibniz Texts: A Collection of New Translation. London, GBR: Continuum International Publishing. Trigrams. (2007, June 2). Retrieved March 19, 2014, from Wikimedia Commons: http://en.wikipedia.org/wiki/File:Trigrams2.svg Wandel, M. (n.d.). Binary marble adding machine. Retrieved June 27, 2014, from Woodgears.ca: https://woodgears.ca/marbleadd/index.html Yin and Yang. (2007, December 7). Retrieved March 17, 2014, from Wikimedia Commons: http://en.wikipedia.org/wiki/File:Yin_and_Yang.svg TME, vol. 11, no. 3, p. 541 Pursuing Coherence among Proportionality, Linearity, and Similarity: Two Pathways from Pre-service Teachers’ Geometric Representations * Hyung Sook Lee 1 Eastern Washington University, USA Jaehoon Yim Gyeongin National University of Education, Korea Abstract: The importance of using multiple representations of a mathematical concept and connecting the representations has been discussed in learning and teaching mathematics. The Common Core State Standards further the discussion with an emphasis on focus and coherence in teaching mathematical concepts across grades. Preservice teachers in our problem solving class were asked to use geometric representations to solve a problem that required proportional reasoning. They were also asked to sequence the works of their peers as well as their own from a developmental perspective. Sequencing geometric representations with various levels was challenging because it required showing a coherent understanding of proportionality, linearity, and similarity. In this article, we present two pathways of developing proportional reasoning and discuss how proportionality, linearity, and similarity can be developed coherently. We also discuss the significance of engaging preservice teachers in others’ thinking and having them sequence others’ works in the journey of pursuing focus and coherence in teaching. Keywords: coherence, proportional reasoning, geometric representations, developmental perspective. Introduction Arithmetic and geometry, which have their own code, means, and symbol system, are complementary (Otte, 1990). Mathematical objects disclose their essence in different forms. A single form of representation does not represent the essence of a mathematical object comprehensively. Multiple representations of a mathematical concept help students build a rich connection around the concept and develop insights into the concept (Even & Lappan, 1994). Thus instruction ought to be designed to allow students to create and use various representations and relate them (NCTM, 2000). For instance, students should be encouraged to present their understanding of a proportional relationship not only numerically (e.g. a/b=c/d) but also geometrically (e.g. a straight line passing through the origin or similar triangles). It is also important to help students recognize connections among mathematical ideas. Building a connection among different ideas and topics aids the development of mathematical maturity (Lester et al., 1994). Away from the traditional view of mathematics as a set of isolated facts and procedures that causes difficulties in learning mathematics (Carpenter & Lehrer, 1999; Hiebert, 2003), students should * We thank Diane Dowd for sharing the coffee problem used in this study with us and reading the drafts of the manuscript. 1 [email protected] The Mathematics Enthusiast, ISSN 1551-3440, vol. 11, no. 3, pp. 541-554 2014© The Author(s) & Dept. of Mathematical Sciences-The University of Montana Lee & Yim learn how various mathematical ideas interconnect and build on one another and thus develop a coherent understanding (Common Core State Standards Initiative (CCSSI), 2010). When it comes to proportion, it is imperative to help students understand proportionality, linearity, and similarity as a coherent whole. Isolating proportionality from other subjects and lacking the visualization of it prevent students from seeing proportionality as a concept that connects many topics they learn (Streefland, 1985). If preservice teachers do not see proportionality and its related geometric ideas as a coherent whole, they would have little chance to guide their future students toward a comprehensive understanding of proportion. With that in mind, we asked preservice teachers in our problem solving class to use geometric representations to solve a problem that requires proportional reasoning. The students’ representations varied in terms of the degree of sophistication of their thinking. We also asked them to sequence different representations of their peers’ as well as their own from a developmental perspective. In this article, we describe how our task helped preservice teachers be aware of (1) the importance of seeing proportionality and its related ideas as a whole and (2) the significance of sequencing the works of others and their own from a developmental perspective. Proportionality, Linearity, and Similarity Proportional reasoning includes comparing ratios or establishing an equivalent relationship between ratios (Tourniaire & Pulos, 1985). It has played an important role in the development of mathematics in history (Radford, 1996). In school mathematics, proportion is the capstone of the elementary school curriculum and the cornerstone of algebra and beyond (Lesh, Post, & Behr, 1988). It is also considered a unifying theme in a sense that it involves using numbers, graphs, and equations to think about quantities and their relationships (NCTM, 2000). Among the connections between algebraic and geometric aspects of proportional reasoning, linearity that presents a common ratio to make a line passing through the origin is particularly essential (Karplus, Pulos, & Stage, 1983; NCTM, 2000). Those who think proportionally have a sense of covariation so that they can analyze the quantities that vary together and determine the relationship that remains unchanged (Lamon, 1999). A proportional relationship between two quantities can be formalized using an equation y=kx, which is represented geometrically with a straight line through the origin (see Figure 1). Figure 1. Proportionality and linearity Proportionality and similarity have a deep connection in nature. In Book VI of Elements, Euclid defined similarity based on proportion (Heath, 1956). Similar triangles visualize a proportional relationship. In Figure 1, ∆OAP, ∆OCQ, and ∆PRQ are similar and constitute a line through the origin that represents the proportionality between x and y. As there is a straight line where a proportion is involved, there are similar triangles where a straight line is drawn. Formally, similarity is defined as a TME, vol. 11, no. 3, p. 543 conformal isometry, which is an isometry of a metric space with itself equipped with a rescaled metric (Givental, 2007). The ratio of the rescaled unit to the original unit determines all the proportional relationships in similar figures (Clairaut, 1741; Freudenthal, 1983). It has been reported that students hardly develop the comprehensive understanding of proportionality, linearity, and similarity (De Bock, Van Dooren, Janssens, & Verschaffel, 2002; De Bock, Verschaffel, & Janssens 1998; Hart, 1984; Van Dooren, De Bock , Depaepe , Janssens, & Verschaffel, 2003; Vollrath, 1977). In our problem solving class for preservice teachers, we noticed that their understanding of proportionality and its related geometric ideas is one-way or disconnected rather than comprehensive or unified. Given a proportion problem, they could set up an equation a/b=c/d and solve it by the cross-multiply rule. However, most students had difficulty using geometric representations to solve a proportion problem when asked to do so. If students are constrained by one way when solving proportion problems, they may have little chance to understand proportionality as a concept involving linearity or similarity. Task, Constraint, and Expectations Problem and Constraint The coffee problem below was posed to preservice teachers in our problem solving class. They were expected to demonstrate their solutions using dynamic features of Geometer's Sketchpad (GSP): [Coffee Problem] Ali bought 2lbs of her favorite mixture of French Vanilla and Columbian Supreme coffee. Amanda bought what she thought was 1lb of Ali’s favorite mixture and combined it with Ali’s 2lbs. It turns out Amanda’s mixture was not Ali’s favorite. Ali had to mix an additional 3/4 lb of French Vanilla with the entire mixture to make it perfect. What percentage or fraction of Ali’s favorite mixture is French Vanilla and Columbian Supreme, and what percentage or fraction of Amanda’s 1 lb mixture is each coffee type? The coffee problem could be solved by setting up a proportion x/2 = (y+¾) / 1¾ where x stands for the amount of French Vanilla in Ali’s 2lbs mixture and y the amount of French Vanilla in Amanda’s 1 lb mixture. Yet, the constraint of using geometric representations to solve the problem did not allow simply setting up an equation and using the cross-multiply rule. As they engaged in the coffee problem with the constraint, our preservice teachers experienced the process of learning through confusion or frustration. This kind of experience has been found to help teachers be better able to provide guidance to their students (Shifter & Szymaszek, 2003). Expectations of the Problem The coffee problem encouraged preservice teachers to think about a situation where a nonproportional relationship and a proportional relationship are related. It is crucial in the development of proportional reasoning to develop an ability to differentiate proportional situations from non- Lee & Yim proportional situations. Differentiating situations in terms of proportionality requires an ability to compare ratios. Recognizing two different ways to compare ratios, within ratios and between ratios, helps students identify what the ratios being compared represent. The within ratio is a ratio of two measures within a situation, whereas the between ratio is a ratio of corresponding measures between different situations (Van de Walle, Karp, & Bay-Williams, 2010). In the posed situation, CS2lb:FV2lb and CS1¾lb:FV1¾lb are within ratios, and FV2lb:FV1¾lb and CS2lb: CS1¾lb are between ratios, where FVxlb is the amount of French Vanilla in x lbs mixture and CSxlb the amount of Columbian Supreme in x lbs mixture. Our preservice teachers were expected to show flexibility in using within ratios and between ratios and interpret the ratios in a meaningful way in the problem context. They were also expected to demonstrate an understanding of linearity as they investigated relationships among the quantities using geometric representations. When asked to present their understanding of the coffee problem using geometric representations, our preservice teachers came up with various representations showing different levels of proportional reasoning. They were encouraged to enhance their understanding by building on others’ ideas and gaining insights into the task of selecting and sequencing the works of others as well as their own. Two Developmental Pathways of Proportional Reasoning We present two pathways of developing proportional reasoning using the geometric representations generated by preservice teachers in our problem solving class. Two fictitious students, Sue and Kara, are used to help readers envision a possible developmental pathway of individual students. Each stage includes a composite of one or multiple preservice teachers’ works. The pedagogical significance of sequencing the works of others is discussed in the next section. Sue’s Pathway of Proportional Reasoning [Stage 1] Stage 1 shows Sue’s early stage of developing a sense of covariation. Sue drew a line segment consisting of three parts: Ali’s 2lbs mixture, Amanda’s 1lb mixture, and ¾lb French Vanilla added to the compound of the 2lbs and 1lb mixtures to get Ali’s favorite mixture. She set a moving point on the part of Ali’s mixture and another point on the part of Amanda’s. Once the point on Ali’s part was set, she adjusted the point on Amanda’s part so that the ratio of the amount of French Vanilla in the 1¾lbs mixture (made up of Amanda’s 1lb mixture and ¾lb French Vanilla) to 1¾ is equal to the ratio of the amount of French Vanilla in Ali’s 2lbs mixture to 2. She attended to making the ratios generated by GSP equal as she adjusted the moving points. However, she was yet to find a relationship between the amounts of French Vanilla in Ali and Amanda’s mixtures. TME, vol. 11, no. 3, p. 545 [Stage 2] Stage 2 shows how Sue became explicit about the covariation between the amounts of French Vanilla in different mixtures. Sue split the entire 3¾lbs segment produced in Stage 1 into two segments, Ali’s 2lbs mixture and the 1¾lbs mixture. Each of the split segments was to represent Ali’s favorite mixture. She aligned the two segments so that she could easily compare the amounts of French Vanilla and the amounts of Columbian Supreme in the mixtures. She moved the moving points accordingly but independently as she tried to make equal the ratios of the amount of French Vanilla in each mixture to the amount of the mixture. Sue noticed the split segments have the ratio 8:7 in lbs and set up an equation FV2lb = 8/7 × FV1¾lb. She also noticed Ali’s mixture needs to include at least 6/7lb French Vanilla, which is 3/7 of 2lbs, from the information that ¾ lb is 3/7 of 1¾lbs. [Stage 3] Lee & Yim Stage 3 shows Sue’s attempt to find a relationship between the amounts of French Vanilla in Ali’s 2lbs mixture and the 1¾ lbs mixture. Instead of independently manipulating the ratios generated by GSP, Sue shifted her attention to drawing a graph to show a relationship between the amounts of French Vanilla in each mixture. She used the x-axis to represent the amount of French Vanilla in Ali’s 2lbs mixture and the y-axis the amount of French Vanilla in the 1¾lbs mixture. Keeping in mind that Ali’s mixture needs to include at least 6/7lb French Vanilla, she moved the moving point on the y-axis from ¾ to 1¾ while she moved the moving point on the x-axis from 6/7 to 2. She traced the moving point with a change of 1lb in y-coordinate and a change of 8/7 in x-coordinate, which creates a line segment with the slope of 7/8 (see the line segment in Stage 3). The fact that the extension of the line segment passes through the origin verifies the proportionality between the amounts of French Vanilla in the two mixtures. Kara’s Pathway of Proportional Reasoning [Stage 1] 4 3 3/4 3 Entire mixture 2 Columbia Supreme 1 Ali's 2lb -2 2 3 3/4 4 French Vanilla Stage 1 shows Kara’s attempt to represent her understanding of the coffee problem on a coordinate system. Kara labeled the x-axis and y-axis with French Vanilla and Columbia Supreme, respectively. She drew two line segments, one from (0, 2) to (2, 0) and the other from (0, 3¾) to (3¾, 0). Then she constructed moving points on each line segment independently. The line segment passing through 2 on each axis represents all possible pairs of the amounts of French Vanilla and Columbia Supreme in Ali’s 2lb mixture. That is, the sum of the x and y-coordinates on the line segment is 2. So, the line segment passing through 2 on each axis is called 2lbs-mixture segment. The same idea of labeling applies to all other line segments. [Stage 2] TME, vol. 11, no. 3, p. 547 ( ( 5 y moving point = 2.49 4 3 3/4 4 y Ali's 2lb. = 0.74 y moving point - y Ali's 2lb. = 1.75 Columbia Supreme 2 Entire mixture 1 ( ( Ali's 2lb. 3 yWrong mixture of 3lb 3 ) ) ⋅100 = 59.51 ⋅100 = 40.49 3 3/4 3 moving point xWrong mixture of 3lb y moving point 3+ 3 4 y Ali's 2lb. 2 ) ) 3 ⋅100 = 66.29 xWrong mixture of 3lb+0.75 = 2.54 <-- amount of FV in 3.75lb. yWrong mixture of 3lb = 1.21 <-- amount of CS in 3.75lb. Columbia Supreme 2 Entire mixture ⋅100 = 36.79 1 Wrong mixture of 3lb moving point -2 3 3/4 4 2 6 8 3 3/4 4 2 -2 French Vanilla 6 8 French Vanilla Stage 2 shows Kara’s early stage of developing a sense of covariation and linearity. Kara reset the moving points used in Stage 1. She constructed a moving point on the 3 ¾lbs-mixture segment and drew a vertical line through the moving point (See the left of Stage 2). Then she found the intersection of the vertical line and the 2lbs-mixture segment and checked to see if there is a relationship between the points on each line segment. She found that the percents of the amounts of Columbia Supreme in each mixture differ from each other when she moved the moving point on the 3¾lbs-mixture segment along the segment. This implies that the 3¾lbs mixture with Columbia Supreme as much as the y-coordinate of the moving point is not Ali’s favorite mixture. After a while, Kara erased the 2lbs-mixture segment and drew another line segment from (0, 3) to (3, 0), which represents the compound of Ali and Amanda’s mixtures (See the right of Stage 2). Note that none of the points on the 3lb-mixture segment is Ali’s favorite. She constructed a moving point on the x-axis instead of the 3lb-mixture segment and computed the percents of each type of coffee in the 3lbs compound. She illustrated that ¾lb French Vanilla was added to a specific 3lbs compound to make it Ali’s favorite mixture. [Stage 3_1] 4 3 3/4 3 Columbia Supreme ( ( xP xP+yP yP xP+yP ) ) ⋅100 = 29.05 ( ) ( ) x P +0.75 1.75 ⋅100 = 70.95 yP 1.75 ⋅100 = 59.46 ⋅100 = 40.54 ( ( xQ xQ+yQ yQ xQ+yQ ) ) ⋅100 = 59.46 ⋅100 = 40.54 2 1 -1 3/4lb of FV added Q P 1 2 French Vanilla 3 3 3/4 4 5 Lee & Yim Stage 3 shows how Kara advanced her sense of covariation and linearity between the amounts of each type of coffee in different mixtures. Stage 3_1 presents six different kinds of percent Kara found. Three numbers in the top row indicate the percent of the amount of French Vanilla in Amanda’s 1lb mixture, the 1¾lbs mixture, and Ali’s 2lbs mixture, respectively. The three numbers in the bottom row indicate the percent of the amount of Columbia Supreme in each mixture. In addition to the line segments used in Stage 2, Kara drew two other line segments, one from (0, 1) to (1, 0) and the other from (0, 2) to (2, 0) (see the graph in Stage 3_1). Then she constructed two moving points, P on the 1lbmixture segment and Q on the 2lbs-mixture segment, and computed the percents of each type of coffee in each mixture. The percents of each type of coffee in a particular 1¾lbs mixture were obtained by horizontally translating P by ¾ to the right. Once she has fixed P on the 1lb-mixture segment, she adjusted Q so that the percents of each type of coffee in the 1¾lbs mixture are equal to the percents in Ali’s 2 lbs mixture. As she moved P along the 1lb-mixture segment, Kara observed that while P can be located anywhere on the 1lb-mixture segment, Q cannot be on the 2-lbs mixture segment. [Stage 3_2] [Stage 3_3] 2 1.5 Columbia Supreme 1 Q P S 0.5 O 3/4 1 1 3/4 2 French Vanilla To be more specific about possible locations of Q in Stage 3_1, Kara imagined an extreme case in which Amanda purchased just Columbia Supreme. In the extreme case, the ratio of the amounts of Columbia Supreme to French Vanilla in the 1¾lbs mixture becomes 4/3. Taking 4/3 as a slope, she drew a line passing through the origin (Stage 3_2). She reasoned the ratio of the amounts of Columbia Supreme to French Vanilla in Ali’s favorite mixture should be less than 4/3 since “Ali’s mixture should be between the line with the slope of 4/3 and the x-axis.” Then she drew two line segments, Ali’s 2lbsmixture segment and the entire 3¾lbs-mixture segment, only in the region she just identified. Using the ideas shown in Stage 3_1 and 3_2, Kara established a relationship between the amounts of each type of coffee in Ali’s 2lbs mixture and Amanda’s 1lb mixture. Given P on the 1lbmixture segment, the slope of OP represents the ratio of the amounts of Columbia Supreme to French Vanilla in the mixture. Each coordinate of S, which is a horizontal translation of P by ¾ (see the arrow in Stage 3_3), represents the amount of each type of coffee in the 1¾lbs mixture, and so does each coordinate of Q in Ali’s 2lbs mixture. The line passing through the origin and (¾, 1) determines the ranges for S and Q. TME, vol. 11, no. 3, p. 549 Discussion This section consists of two parts. We first discuss how each of the pathways can be extended to better show a coherent progression of proportional reasoning. Then we discuss the significance of engaging preservice teachers in others’ thinking and sequencing the works of others in pursuing focus and coherence in teaching. Extension of Sue and Kara’s Pathways The pathways of proportional reasoning presented in the previous section could be extended with more explicit ideas of linearity and similarity. These extensions would help students recognize the connections among proportionality, linearity, and similarity. Sue’s progression and its extension. Over three stages, Sue gradually developed two conceptual aspects of proportional reasoning, covariation and linearity. The idea of covariation emerged when she realized the amount of French Vanilla in the 1¾lbs mixture changes as the amount of French Vanilla in Ali’s 2lbs mixture changes (Stage 1). This sense of covariation diverted her attention to the ratio of the amounts of the mixtures and thus to matching it with the ratio of the amounts of French Vanilla in the mixtures (Stage 2). However, it was not until Stage 3 that Sue began to notice a linear relationship between the amounts of French Vanilla in different mixtures. When she attempted to find all possible amounts of French Vanilla in the 2lbs mixture, Sue became aware that the 2lbs mixture must contain at least 6/7lb of French Vanilla, which is 3/7 of 2lbs. She then found all possible amounts of French Vanilla in Ali’s and the 1¾lbs mixtures. This awareness of possible values related in different mixtures led her to recognize a linear relationship between the amounts of French Vanilla in two Ali’s favorite mixtures. Sue’s pathway could be extended as it showed the use of similarities to solve the problem. Figure 2 is a schematized version of the diagram in Sue’s stage 2 for this very purpose. Starting with segments AB and CD that represent two mixtures of Ali’s favorite, Sue could construct a center of dilation P by finding the intersection of and . It would allow her to determine the amount of French Vanilla in the 1¾lbs mixture when given the amount of French Vanilla in the 2lbs mixture. Since ∆PCD is similar to ∆PAB and CD:AB=7:8, the ratio of PD to PB is 7:8. ND:MB and CN:AM also results in 7:8. Note that ND and MB stand for the amounts of French Vanilla in the 1¾lbs mixture and Ali’s 2lbs mixture, respectively. Using the scale factor 7/8 between similar figures generated from ∆PCD and ∆PAB, we could find the amount of French Vanilla in the 1lb mixture Amanda bought (NF) when given the amount of French Vanilla in the 2lbs mixture (MB). Lee & Yim A M C N E F 1 B 3/4 D 2lb 1 3/4lb P Figure 2. Extension of Sue’s reasoning about covariation and linearity Kara’s progression and its extension. Over three stages, Kara developed a conceptual understanding of proportional reasoning related to graphical representations. Kara illustrated all possible pairs of the amounts of each type of coffee in different mixtures using line segments on a coordinate system (Stage 1). She then attempted to find a relationship between the amounts of French Vanilla as well as Columbia Supreme in two Ali’s favorite mixtures. But she failed to do so due to a lack of sense of covariation (Stage 2_1) and linearity (Stage 2_2). During Stage 3, Kara began to compare ratios generated from different mixtures. Being aware of the fact that both the 1¾lbs mixture and the 2lbs mixture are Ali’s favorite, Kara manipulated the moving points on each mixture accordingly so that the ratio of the amount of French Vanilla in the 1¾ lbs mixture to 1¾ is equal to the ratio of the amount of French Vanilla in the 2lbs mixture to 2. Yet, she did not look further to find a relationship between the corresponding points (Stage 3_1). After spending time on computing part-to-whole ratios, Kara began to pay attention to a part-to-part ratio such as a ratio of the amounts of French Vanilla and Columbia Supreme in the 2lbs mixture (Stage 3_2). She drew a line with the slope 4/3, which is the ratio of the amounts of French Vanilla and Columbia Supreme in an extreme case where Amanda purchased only Columbia Supreme. Then she figured out a possible range of the ratio in the 2lbs mixture. Shifting her attention to a part-to-part ratio was crucial in that it enabled Kara to realize the ratio of the amounts of French Vanilla and Columbia Supreme should remain the same regardless of the amounts of Ali’s favorite mixture (Stage 3_3). Kara’s pathway also could be extended so that it involved the idea of similarity. Figure 3 illustrates two kinds of similarity. One similarity comes from two different amounts of Ali’s favorite mixture. Q and R in Figure 3 represent the 1¾lbs and 2lbs mixtures of Ali’s favorite, respectively. If we draw a line connecting Q and R, the line passes through the origin because the ratio of x-coordinate to ycoordinate of R is equal to the ratio of x-coordinate to y-coordinate of Q. The similarity between ∆OQT and ∆ORU represents a proportional relationship between two different amounts of Ali’s favorite mixture. Another, less explicit, similarity comes from Amanda’s 1lb mixture and Ali’s 2lbs mixture represented by P and R, respectively. If we make P movable along the 1lb-mixture segment and draw a line connecting P and the corresponding point R on the 2lbs-mixture segment, the varying line always passes through N(-6, 0), and ∆NPS and ∆NRU are similar. TME, vol. 11, no. 3, p. 551 2 1.5 Columbia Supreme R 1 P Q 0.5 N -6 U -4 -2 O S T 2 French Vanilla -0.5 Figure 3. Extension of Kara's reasoning about linearity Experiencing proportion and related ideas as a whole. Teachers are expected to have a profound understanding of fundamental mathematics (Ma, 1999) and teach mathematics with focus and coherence among mathematical ideas (CCSSI, 2010). If a teacher did not have his or her own experience of pursuing coherence among the ideas s/he has learned, s/he would be unaware of the importance of looking for a coherent whole in the learning of mathematics. As Even and Lappan (1994) argued, preservice teachers’ own experience as learners furnish the data they use to make sense of what mathematics is and how it should be taught. After completing the coffee problem with all the required activities, our preservice teachers had a chance to think over the implications of their experience for their future teaching. They discussed the issues of the importance of “drawing a diagram” as a problem solving strategy, the elements that constitute a mathematical diagram, a way to help students draw a mathematically meaningful diagram instead of an aesthetically pleasing picture, and a way to help students evaluate their strategy. One preservice teacher said that now that she realized a solution using a diagram or geometric representation can complement arithmetic or algebraic solutions, she would like to solve the problems which she originally solved numerically using diagrams. Another preservice teacher confessed that since she realized the difficulty of teaching the “drawing a diagram” strategy to kids in a meaningful way, she felt a definite need to study and think more about it. Taking the discussed issues and confessions into consideration, we suggest that preservice teachers be provided opportunities to contemplate their future teaching after they have personalized school mathematics through their own mathematical inquiry. Lee & Yim Significance of Engaging Preservice Teachers in Sequencing Others’ Works Analyzing mathematical tasks in the consideration of students' learning enhances teachers’ understanding of mathematics for teaching and their knowledge of students (Doyle, 1983; Stein, Grove, & Henningsen, 1996). Task analysis also helps teachers make a task worthwhile and create and maintain an appropriate level of cognitive demand for the task (Stein et al., 1996). As they make a transition in their perspective of a mathematical task from a curricular material being presented to a task being implemented by students in the classroom, teachers become aware of students and attend to the mathematical thinking the task demands of students in the process of solving the task. The consideration of students in problem solving calls teachers to increase their understanding of students’ way of thinking at various points of learning. It is desirable for teachers to develop knowledge of a mathematical task from both dimensions, a cognitive demand of the task and students’ developmental path of a mathematical concept involved in solving the task (Sztajn, Confrey, Wilson, & Edgington, 2012). In order to help increase the knowledge described above, we provided preservice teachers an opportunity to understand others’ ways of thinking and to think about a possible pathway that shows how their thoughts might grow. In particular, they were asked to sequence the works of their peers as well as their own as they discerned a progression of a mathematical concept they have been working on. Sequencing students’ works is a teacher’s purposeful choice about the order in which students’ works are to be shared. It has been considered an act of teachers to maximize the chances of achieving their mathematical goals (Stein, Engle, Smith, & Hughes, 2008). The practice of sequencing others’ works including their own appeared to be beneficial to our preservice teachers in that they would reflect on whether the depth of their own mathematical knowledge is sufficient to help others advance their current understanding to the next level. When first exposed to a variety of mathematical representations of their peers, our preservice teachers struggled to figure out which representation or approach they should take in order to advance their own representation. Limited in their thinking, they took others’ work as irrelevant to or to some extent away from the ideas that they could build on. It appeared daunting to extend their horizon to see a range of understanding involved in the problem that requires proportional reasoning. This seemingly daunting situation, however, created for preservice teachers an environment conducive to (1) building a rich web of connections among different approaches and various levels of understanding, (2) identifying potential conceptual challenges that their future students may encounter, and (3) learning to use the identified conceptual challenges to help develop proportional reasoning. The use of dynamic geometric representations helped make more explicit where a way of thinking could be located on the continuum of a developmental pathway of proportional reasoning. Over the course of solving the coffee problem, the focus was shifted from deepening preservice teachers’ understanding of a mathematical concept to helping them build up a didactical perspective collaboratively. This shift of the focus reflects the idea that teachers’ understanding of how their students are thinking should be incorporated with their knowledge of how students would or could progress their thinking (van den Kieboom & Magiera, 2012). To preservice teachers, sequencing the works of their peers as well as their own seems equally significant to sequencing children’s work. In method courses, they learn strategies to help children learn while they sequence children’s works. In content courses, they can develop awareness of the importance of seeing their own work from a developmental perspective as an inquirer. Engaging preservice teachers in the practice of sequencing as collaborative inquirers, we educated their awareness of the significance of a developmental perspective in teaching and learning mathematics. Our accomplishment may resonate with Gattegno (1987)’s argument that only awareness is educable. TME, vol. 11, no. 3, p. 553 References Carpenter, T., & Lehrer, R. (1999). Teaching and learning mathematics with understanding. In E. Fennema & T. A. Romberg (Eds.), Mathematics classrooms that promote understanding (pp. 19 - 32). Mahwah, NJ: Lawrence Erlbaum Associates. Clairaut, A. C. (1741/2006). Élements de Geometrie. Éditions Jacques Gabay. Common Core State Standards Initiative. (2010). Common core state standards for mathematics. Washington DC: National Governors Association Center for Best Practices and the Council of Chief State School Officers. http://www.corestandards.org/ De Bock, D., Van Dooren, W., Janssens, D., & Verschaffel, L. (2002). Improper use of linear reasoning: An in-depth study of the nature and the irresistibility of secondary school students’errors. Educational Studies in Mathematics, 50, 311–314. De Bock, D., Verschaffel, L., & Janssens, D. (1998). The predominance of the linear model in secondary school students’ solutions of word problems involving length and area of similar plane figures. Educational Studies in Mathematics, 35, 65–85. Doyle, W. (1983). Academic work. Review of Educational Research, 53, 159-199. Even, R., & Lappan, G. (1994). Constructing meaningful understanding of mathematics content. In D. B. Aichele & A. F. Coxford (Eds.), Professional development for teachers of mathematics (pp. 128143). Reston, VA: NCTM. Freudenthal, H. (1983). Didactical phenomenology of mathematical structures. Dordrecht: D. Reidel Publishing Company Gattegno, C. (1987). The science of education: Part 1: Theoretical considerations. New York: Educational Solutions. Givental, A. (2007). The Pythagorean theorem : What is it about? Retrieved from http://math.berkeley.edu/~giventh/papers/eu.pdf Hart, K. (1984). Ratio: Children's strategies and errors. Windsor: NFER-Nelson. Heath, T.L. (Ed.). (1956). The thirteen books of Euclid's elements. NY: Dover Publications. Hiebert, J. (2003). What research says about the NCTM Standards. In J. Kilpatrick, G. Martin, & D. Schifter (Eds.), A research companion to principles and standards for school mathematics (pp. 5–26). Reston, VA: NCTM. Karplus, R., Pulos, S., & Stage, E. K. (1983). Early adolescents’ proportional reasoning on ‘rate’ problems. Educational Studies in Mathematics, 14, 219-233. Lamon, S. J. (1999). Teaching fractions and ratios for understanding: Essential content knowledge and instructional strategies for teachers. Mahwah, New Jersey: Lawrence Erlbaum Associates. Lesh, R., Post, T., & Behr, M. (1988). Proportional reasoning. In J. Hiebert & M. Behr (Eds.), Number Concepts and operations in the middle grades (pp. 93-118). Reston, VA: NCTM. Lester, F. K., Masingila, J. O., Mau, S. T., Lambdin, D. V., dos Santos, V. M. P., & Raymend, A. M. (1994). Learning how to teach via problem solving. In D. B. Aichele & A. F. Coxford (Eds.), Professional development for teachers of mathematics: 1994 yearbook (pp. 152-166). Reston, VA: NCTM. Ma, L. (1999). Knowing and teaching elementary mathematics: Teachers' understanding of fundamental mathematics in China and the United States. Mahwah, NJ: Lawrence Erlbaum. Lee & Yim National Council of Teachers of Mathematics. (2000). Principles and Standards for School Mathematics. Reston, VA: NCTM. Otte, M. (1990). Arithmetic and geometry: Some remarks on the concept of complementarity. Studies in Philosophy and Education, 10, 37-62. Radford, L. (1996). The roles of geometry and arithmetic in the development of algebra: historical remarks from a didactic perspective. In N. Bendarz, C. Kieren, & L. Lee (Eds.), Approaches to algebra (pp. 39-54). Dordrecht: Kluwer Academic Publishers. Shifter, D., & Szymaszek, J. (2003). Structuring a rectangle: Teachers write to learn about their students’ thinking. In D. H. Clements (Ed.), Learning and teaching measurement: 2003 yearbook (pp. 143-156). Reston, VA: NCTM. Stein, M., Engle, R., Smith, M., & Hughes, E. (2008). Orchestrating productive mathematical discussions: Five practices for helping teachers move beyond show and tell. Mathematical Thinking and Learning, 10, 313-340. Stein, M., Grover, B., & Henningsen, M. (1996). Building students capacity for mathematical thinking and reasoning: An analysis of mathematical tasks used in reform classrooms. American Educational Research Journal, 33, 455-488. Streefland, L. (1985). Search for the roots of ratio: Some thoughts on the long term learning process, Part II-The outline of the long term learning process. Educational Studies in Mathematics, 16, 75- 94. Sztajn, P., Confrey, J., Wilson, P., & Edginton, C. (2012). Learning trajectory based instruction: Toward a theory of teaching. Educational Researcher, 41, 147-156. Tourniaire, F., & Pulos, S. (1985). Proportional reasoning: A review of the Literature. Educational Studies in Mathematics, 16, 181-204. Van de Walle, John A., Karp, K. S., & Bay-Williams, J. M. (2010). Elementary and middle school mathematics: Teaching developmentally (7th ed.). Boston, MA: Pearson. van den Kieboom, L., & Magiera, M. (2012). Cultivating Algebraic Representations. Mathematics Teaching in the Middle School, 17, 353-357. Van Dooren, W., De Bock, D., Depaepe, F., Janssens, D., & Verschaffel, L. (2003). The illusion of linearity: Expanding the evidence towards probabilistic reasoning. Educational Studies in Mathematics, 53.113–138. Vollrath, H. J. (1977). The understanding of similarity and shape in classifying tasks. Educational Studies in Mathematics, 8, 211-224. TME, vol. 11, no. 3, p. 555 Difficulties in solving context-based PISA mathematics tasks: An analysis of students’ errors Ariyadi Wijayaa, b1; Marja van den Heuvel-Panhuizena; Michiel Doormana; Alexander Robitzschc a Freudenthal Institute for Science and Mathematics Education, Utrecht University, The Netherlands b Mathematics Education Department, Universitas Negeri Yogyakarta, Indonesia c Federal Institute for Education Research, Innovation and Development of the Austrian School System, Austria Abstract: The intention of this study was to clarify students’ difficulties in solving context-based mathematics tasks as used in the Programme for International Student Assessment (PISA). The study was carried out with 362 Indonesian ninth- and tenth-grade students. In the study we used 34 released PISA mathematics tasks including three task types: reproduction, connection, and reflection. Students’ difficulties were identified by using Newman’s error categories, which were connected to the modeling process described by Blum and Leiss and to the PISA stages of mathematization, including (1) comprehending a task, (2) transforming the task into a mathematical problem, (3) processing mathematical procedures, and (4) interpreting or encoding the solution in terms of the real situation. Our data analysis revealed that students made most mistakes in the first two stages of the solution process. Out of the total amount of errors 38% of them has to do with understanding the meaning of the context-based tasks. These comprehension errors particularly include the selection of relevant information. In transforming a context-based task into a mathematical problem 42% of the errors were made. Less errors were made in mathematical processing and encoding the answers. These types of errors formed respectively 17% and 3% of the total amount of errors. Our study also revealed a significant relation between the error types and the task types. In reproduction tasks, mostly comprehension errors (37%) and transformation errors (34%) were made. Also in connection tasks 1 [email protected] The Mathematics Enthusiast, ISSN 1551-3440, vol. 11, no. 3, pp. 555-584 2014© The Author(s) & Dept. of Mathematical Sciences-The University of Montana Wijaya et al students made mostly comprehension errors (41%) and transformation errors (43%). However, in reflection tasks mostly transformation errors (66%) were made. Furthermore, we also found a relation between error types and student performance levels. Low performing students made a higher number of comprehension and transformation errors than high performing students. This finding indicates that low performing students might already get stuck in the early stages of the modeling process and are unable to arrive in the stage of carrying out mathematical procedures when solving a context-based task. Keywords: Context-based mathematics tasks; Mathematization; Modeling process; Newman error categories; Students’ difficulties. 1. Introduction Employer dissatisfaction with school graduates’ inability to apply mathematics stimulated a movement favoring both the use of mathematics in everyday situations (Boaler, 1993a) and a practice-orientated mathematics education (Graumann, 2011). The main objective of this movement is to develop students’ ability to apply mathematics in everyday life (Graumann, 2011) which is seen as a core goal of mathematics education (Biembengut, 2007; Greer, Verschaffel, & Mukhopadhyay, 2007). In addition, this innovation was also motivated by theoretical developments in educational psychology such as situated cognition theory (Henning, 2004; Nunez, Edwards, & Matos, 1999) and socio-cultural theory (Henning, 2004). Finally, this context-connected approach to mathematics education emerged from studies of mathematics in out-of-school settings such as supermarkets (Lave, 1988) and street markets (Nunes, Schliemann, & Carraher, 1993). In line with this emphasis on application in mathematics education, the utilitarian purpose of mathematics in everyday life has also become a concern of the Programme for International Student Assessment (PISA) which is organized by the Organisation for Economic Co-operation and Development (OECD). PISA is a large-scale assessment which aims to determine whether students can apply mathematics in a variety of situations. For this purpose, PISA uses real world problems which require quantitative reasoning, spatial reasoning or problem solving (OECD, 2003b). An analysis of PISA results showed that the competencies measured in PISA surveys are better predictors for 15 year-old students’ later success than the qualifications reflected in school marks (Schleicher, 2007). Therefore, the PISA survey has become an influential factor in TME, vol. 11, no. 3, p. 557 reforming educational practices (Liang, 2010) and making decisions about educational policy (Grek, 2009; Yore, Anderson, & Hung Chiu, 2010). Despite the importance of contexts for learning mathematics, several studies (Cummins, Kintsch, Reusser, & Weimer, 1988; Palm, 2008; Verschaffel, Greer, & De Corte, 2000) indicate that contexts can also be problematic for students when they are used in mathematics tasks. Students often miscomprehend the meaning of context-based tasks (Cummins et al., 1988) and give solutions that are not relevant to the situation described in the tasks (Palm, 2008). Considering these findings, the intention of this study was to clarify students’ obstacles or difficulties when solving context-based tasks. As a focus we chose the difficulties students in Indonesia have with context-based problems. The PISA 2009 study (OECD, 2010) showed that only one third of the Indonesian students could answer the types of mathematics tasks involving familiar contexts including all information necessary to solve the tasks and having clearly defined questions. Furthermore, less than one percent of the Indonesian students could work with tasks situated in complex situations which require mathematical modeling, and well-developed thinking and reasoning skills. These poor results ask for further research because the characteristics of PISA tasks are relevant to the mathematics learning goals mandated in the Indonesian Curriculum 2004. For example, one of the goals is that students are able to solve problems that require students to understand the problem, and design and complete a mathematical model of it, and interpret the solution (Pusat Kurikulum, 2003). Although the Indonesian Curriculum 2004 takes the application aspect of mathematical concepts in daily life into account (Pusat Kurikulum, 2003), the PISA results clearly showed that this curriculum did not yet raise Indonesian students’ achievement in solving context-based mathematics tasks. This finding was the main reason to set up the ‘Context-based Mathematics Tasks Indonesia’ project, or in short the CoMTI project. The general goal of this project is to contribute to the improvement of the Indonesian students’ performance on context-based mathematics tasks. The present study is the first part of this project and aimed at clarifying Indonesian students’ difficulties or obstacles when solving context-based mathematics tasks. Having insight in where students get stuck will provide us with a key to improve their achievement. Moreover, this insight can contribute to the theoretical knowledge about the teaching and learning of mathematics in context. Wijaya et al 2. Theoretical background 2.1. Learning mathematics in context Contexts are recognized as important levers for mathematics learning because they offer various opportunities for students to learn mathematics. The use of contexts reduces students’ perception of mathematics as a remote body of knowledge (Boaler, 1993b), and by means of contexts students can develop a better insight about the usefulness of mathematics for solving daily-life problems (De Lange, 1987). Another benefit of contexts is that they provide students with strategies to solve mathematical problems (Van den Heuvel-Panhuizen, 1996). When solving a context-based problem, students might connect the situation of the problem to their experiences. As a result, students might use not only formal mathematical procedures, but also informal strategies, such as using repeated subtraction instead of a formal digit-based long division. In the teaching and learning process, students’ daily experiences and informal strategies can also be used as a starting point to introduce mathematics concepts. For example, covering a floor with squared tiles can be used as the starting point to discuss the formula for the area of a rectangle. In this way, contexts support the development of students’ mathematical understanding (De Lange, 1987; Gravemeijer & Doorman, 1999; Van den Heuvel-Panhuizen, 1996). In mathematics education, the use of contexts can imply different types of contexts. According to Van den Heuvel-Panhuizen (2005) contexts may refer to real-world settings, fantasy situations or even to the formal world of mathematics. This is a wide interpretation of context in which contexts are not restricted to real-world settings. What important is that contexts create situations for students that are experienced as real and related to their commonsense understanding. In addition, a crucial characteristic of a context for learning mathematics is that there are possibilities for mathematization. A context should provide information that can be organized mathematically and should offer opportunities for students to work within the context by using their pre-existing knowledge and experiences (Van den Heuvel-Panhuizen, 2005). The PISA study also uses a broad interpretation of context, defining it as a specific setting within a ‘situation’ which includes all detailed elements used to formulate the problem (OECD, 2003b, p. 32). In this definition, ‘situation’ refers to the part of the students’ world in which the tasks are placed. This includes personal, educational/occupational, public, and scientific situation types. As well as Van den Heuvel-Panhuizen (2005), the PISA researchers also see that a formal mathematics setting can be seen as a context. Such context is called an ‘intra-mathematical TME, vol. 11, no. 3, p. 559 context’ (OECD, 2003b, p. 33) and refers only to mathematical objects, symbols, or structures without any reference to the real world. However, PISA only uses a limited number of such contexts in its surveys and places most value on real-world contexts, which are called ‘extramathematical contexts’ (OECD, 2003b, p. 33). To solve tasks which use extra-mathematical contexts, students need to translate the contexts into a mathematical form through the process of mathematization (OECD, 2003b). The extra-mathematical contexts defined by PISA are similar to Roth’s (1996) definition of contexts, which also focuses on the modeling perspective. Roth (1996, p. 491) defined context as “a real-world phenomenon that can be modeled by mathematical form.” In comparison to Van den Heuvel-Panhuizen and the PISA researchers, Roth takes a narrower perspective on contexts, because he restricts contexts only to real-world phenomena. However, despite this restriction, Roth’s focus on the mathematical modeling of the context is close to the idea of mathematization as used in PISA. Based on the aforementioned definitions of context, in our study we restricted contexts to situations which provide opportunities for mathematization and are connected to daily life. This restriction is in line with the aim of PISA to assess students’ abilities to apply mathematics in everyday life. In conclusion, we defined context-based mathematics tasks as tasks situated in realworld settings which provide elements or information that need to be organized and modeled mathematically. 2.2. Solving context-based mathematics tasks Solving context-based mathematics tasks requires an interplay between the real world and mathematics (Schwarzkopf, 2007), which is often described as a modeling process (Maass, 2010) or mathematization (OECD, 2003b). The process of modeling begins with a real-world problem, ends with a real-world solution (Maass, 2010) and is considered to be carried out in seven steps (Blum & Leiss, as cited in Maass, 2010). As the first step, a solver needs to establish a ‘situation model’ to understand the real-world problem. The situation model is then developed into a ‘real model’ through the process of simplifying and structuring. In the next step, the solver needs to construct a ‘mathematical model’ by mathematizing the real model. After the mathematical model is established, the solver can carry out mathematical procedures to get a mathematical solution of the problem. Then, the mathematical solution has to be interpreted and validated in terms of the real-world problem. As the final step, the real-world solution has to be presented in terms of the real-world situation of the problem. Wijaya et al In PISA, the process required to solve a real-world problem is called ‘mathematization’ (OECD, 2003b). This process involves: understanding the problem situated in reality; organizing the real-world problem according to mathematical concepts and identifying the relevant mathematics; transforming the real-world problem into a mathematical problem which represents the situation; solving the mathematical problem; and interpreting the mathematical solution in terms of the real situation (OECD, 2003b). In general, the stages of PISA’s mathematization are similar to those of the modeling process. To successfully perform mathematization, a student needs to possess mathematical competences which are related to the cognitive demands of context-based tasks (OECD, 2003b). Concerning the cognitive demands of a context-based task, PISA defines three types of tasks: a. Reproduction tasks These tasks require recalling mathematical objects and properties, performing routine procedures, applying standard algorithms, and applying technical skills. b. Connection tasks These tasks require the integration and connection from different mathematical curriculum strands, or the linking of different representations of a problem. The tasks are non-routine and ask for transformation between the context and the mathematical world. c. Reflection tasks These tasks include complex problem situations in which it is not obvious in advance which mathematical procedures have to be carried out. Regarding students’ performance on context-based tasks, PISA (OECD, 2009a) found that cognitive demands are crucial aspects of context-based tasks because they are – among other task characteristics, such as the length of text, the item format, the mathematical content, and the contexts – the most important factors influencing item difficulty. 2.3. Analyzing students’ errors in solving context-based mathematics tasks To analyze students’ difficulties when solving mathematical word problems, Newman (1977, 1983) developed a model which is known as Newman Error Analysis (see also Clarkson, 1991; Clements, 1980). Newman proposed five categories of errors based on the process of solving mathematical word problems, namely errors of reading, comprehension, transformation, process skills, and encoding. To figure out whether Newman’s error categories are also suitable for TME, vol. 11, no. 3, p. 561 analyzing students’ errors in solving context-based tasks which provide information that needs to be organized and modeled mathematically, we compared Newman’s error categories with the stages of Blum and Leiss’ modeling process (as cited in Maass, 2010) and the PISA’s mathematization stages (OECD, 2003b). Table 1. Newman’s error categories and stages in solving context-based mathematics tasks Stages in solving context-based mathematics tasks Newman’s error categories a Stages in Blum and Leiss’ Modelingb Stages in PISA’s Mathematizationc Reading: Error in simple recognition of words and symbols -- -- Comprehension: Error in understanding the meaning of a problem Understanding problem by establishing situational model Understanding problem situated in reality -- Establishing real model by simplifying situational model -- -- -- Organizing real-world problems according to mathematical concepts and identifying relevant mathematics Transformation: Error in transforming a word problem into an appropriate mathematical problem Constructing mathematical model by mathematizing real model Transforming realworld problem into mathematical problem which represents the problem situation Process skills: Error in performing mathematical procedures Working mathematically to get mathematical solution Solving mathematical problems Encoding: Error in representing the mathematical solution into acceptable written form Interpreting mathematical solution in relation to original problem situation Validating interpreted mathematical solution by checking whether this is appropriate and reasonable for its purpose Interpreting mathematical solution in terms of real situation -- Communicating the real-world solution -- a b c (Newman, 1977, 1983; Clarkson, 1991; Clements, 1980); (as cited in Maass, 2010); (OECD, 2003b) Table 1 shows that of Newman’s five error categories, only the first category that refers to the technical aspect of reading cannot be matched to a modeling or mathematization stage of the Wijaya et al solution process. The category comprehension errors, which focuses on students’ inability to understand a problem, corresponds to the first stage of the modeling process (“understanding problem by establishing situational model”) and to the first phase of the mathematization process (“understanding problem situated in reality”). The transformation errors refer to errors in constructing a mathematical problem or mathematical model of a real-world problem, which is also a stage in the modeling process and in mathematization. Newman’s category of errors in mathematical procedures relates to the modeling stage of working mathematically and the mathematization stage of solving mathematical problems. Lastly, Newman’s encoding errors correspond to the final stage of modeling process and mathematization at which the mathematical solution is interpreted in terms of the real-world problem situation. Considering these similarities, Newman’s error categories can be used to analyze students’ errors in solving context-based mathematics tasks. 2.4. Research questions The CoMTI project aims at improving Indonesian students’ performance in solving contextbased mathematics tasks. To find indications of how to improve this performance, the first CoMTI study looked for explanations for the low scores in the PISA surveys by investigating, on the basis of Newman’s error categories, the difficulties students have when solving context-based mathematics tasks such as used in the PISA surveys. Generally expressed our first research question was: 1. What errors do Indonesian students make when solving context-based mathematics tasks? A further goal of this study was to investigate the students’ errors in connection with the cognitive demands of the tasks and the student performance level. Therefore, our second research question was: 2. What is the relation between the types of errors, the types of context-based tasks (in the sense of cognitive demands), and the student performance level? 3. Method 3.1. Mathematics tasks A so-called ‘CoMTI test’ was administered to collect data about students’ errors when solving context-based mathematics tasks. The test was based on the released ‘mathematics units’1 from PISA (OECD, 2009b) and included only those units which were situated in extra-mathematical context. TME, vol. 11, no. 3, p. 563 Furthermore, to get a broad view of the kinds of difficulties Indonesian students encounter, units were selected in which Indonesian students in the PISA 2003 survey (OECD, 2009b) had either a notably low or high percentage of correct answer. In total we arrived at 19 mathematics units consisting of 34 questions. Hereafter, we will call these questions ‘tasks’, because they are not just additional questions to a main problem but complete problems on their own, which can be solved independently of each other. Based on the PISA qualification of the tasks we included 15 reproduction, 15 connection and 4 reflection tasks. The tasks were equally distributed over four different booklets according to their difficulty level, as reflected in the percentage correct answers found in the PISA 2003 survey (OECD, 2009b). Six of the tasks were used as anchor tasks and were included in all booklets. Every student took one booklet consisting of 12 to 14 tasks. The CoMTI test was administered in the period from 16 May to 2 July, 2011, which is in agreement with the testing period of PISA (which is generally between March 1 and August 31) (OECD, 2005). In the CoMTI test the students were asked to show how they solved each task, while in the PISA survey this was only asked for the open constructed-response tasks. Consequently, the time allocated for solving the tasks in the CoMTI test was longer (50 minutes for 12 to 14 tasks) than in the PISA surveys (35 minutes for 16 tasks) (OECD, 2005). 3.2. Participants The total sample in this CoMTI study included 362 students recruited from eleven schools located in rural and urban areas in the province of Yogyakarta, Indonesia. Although this selection might have as a consequence that the students in our sample were at a higher academic level than the national average2, we chose this province for carrying out our study for reasons of convenience (the first author originates from this province). To have the sample in our study close to the age range of 15 years and 3 months to 16 years and 2 months, which is taken in the PISA surveys as the operationalization of fifteen-year-olds (OECD, 2005), and which also applies to the Indonesian sample in the PISA surveys, we did our study with Grade 9 and Grade 10 students who generally are of this age. However, it turned out that in our sample the students were in the age range from 14 years and 2 months to 18 years and 6 months (see Table 2), which means that our sample had younger and older students than in the PISA sample. Wijaya et al Table 2. Composition of the sample Grade Boys Girls Total Min. age Max. age Mean age (SD) Grade 9 85 148 233 14 y; 2 m 16 y; 7 m 15 y; 3 m (5 m)a Grade 10 59 70 129 14 y; 10 m 18 y; 6 m 16 y; 4 m (7 m) Total 144 218 362 a y= year; m = month Before analyzing students’ errors, we also checked whether the ability level of the students in our sample was comparable to the level of the Indonesian students who participated in the PISA surveys. For this purpose, we compared the percentages of correct answers of 17 tasks included in the 2003 PISA survey (OECD, 2009b), with the scores we found in our sample. To obtain the percentages of correct answers in our sample, we scored the students’ responses according to the PISA marking scheme, which uses three categories: full credit, partial credit, and no credit (OECD, 2009b). The interrater reliability of this scoring was checked by conducting a second scoring by an external judge for approximately 15% of students’ responses to the open constructed-response tasks. The multiple-choice and closed constructed-response tasks were not included in the check of the interrater reliability, because the scoring for these tasks was straightforward. We obtained a Cohen’s Kappa of .76, which indicates that the scoring was reliable (Landis & Koch, 1977). The calculation of the Pearson correlation coefficient between the percentages correct answers of the 17 tasks in the PISA 2003 survey and in the CoMTI sample revealed a significant correlation, r (15) = .83, p < .05. This result indicates that the tasks which were difficult for Indonesian students in the PISA 2003 survey were also difficult for the students participating in the CoMTI study (see Figure 1). However, the students in the CoMTI study performed better than the Indonesian students in the PISA 2003 survey. The mean percentage of correct answers in our study was 61%, which is a remarkably higher result than the 29% correct answers of the Indonesian students in the PISA survey. We assume that this result was due to the higher academic performance of students in the province of Yogyakarta compared to the performance of Indonesian students in general (see Note 2). TME, vol. 11, no. 3, p. 565 Figure 1. Percentage correct answers in the CoMTI sample and the Indonesian PISA 2003 sample 3.3. Procedure of coding the errors To investigate the errors, only the students’ incorrect responses, i.e., the responses with no credit or partial credit, were coded. Missing responses which were also categorized as no credit, were not coded and were excluded from the analysis because students’ errors cannot be identified from a blank response. The scheme used to code the errors (see Table 3) was based on Newman’s error categories and in agreement with Blum and Leiss’ modeling process and PISA’s mathematization stages. However, we included in this coding scheme only four of Newman’s error categories, namely ‘comprehension’, ‘transformation’, ‘mathematical processing’, and ‘encoding’ errors. Instead of Newman’s error category of ‘process skills’, we used the term ‘mathematical processing’, because in this way it is more clear that errors in process skills concern errors in processing mathematical procedures. The technical error type of ‘reading’ was left out because this type of error does not refer to understanding the meaning of a task. Moreover, the code ‘unknown’ was added in the coding scheme because in about 8% of the incorrect responses, the written responses did not provide enough information for coding the errors. These responses with the code ‘unknown’ were not included in the analysis. Wijaya et al Table 3. Coding Scheme for error types when solving context-based mathematics tasks Error type Sub-type Explanation Comprehension Misunderstanding the instruction Student incorrectly interpreted what they were asked to do. Misunderstanding a keyword Error in selecting information Student misunderstood a keyword, which was usually a mathematical term. Student was unable to distinguish between relevant and irrelevant information (e.g. using all information provided in a task or neglecting relevant information) or was unable to gather required information which was not provided in the task. Student tended to use directly a mathematical procedure (such as formula, algorithm) without analyzing whether or not it was needed. Student’s answer only referred to the context/real world situation without taking the perspective of the mathematics. Student used mathematical procedure/concepts which are not relevant to the tasks. Transformation Procedural tendency Taking too much account of the context Wrong mathematical operation/concept Treating a graph as a picture Mathematical Processing Algebraic error Arithmetical error Error in mathematical interpretation of graph: - Point-interval confusion Student mistakenly focused on a single point rather than on an interval. - Slope-height confusion Measurement error Improper use of scale Unfinished answer Encoding Unknown Student treated a graph as a literal picture of a situation. Student interpreted and focused on the shape of the graph, instead of on the properties of the graph. Error in solving algebraic expression or function. Error in calculation. Student did not use the slope of the graph but only focused on the vertical distances. Student could not convert between standard units (from m/minute to km/h) or from non-standard units to standard units (from step/minute to m/minute). Student could not select and use the scale of a map properly. Student used a correct formula or procedure, but they did not finish it. Student was unable to correctly interpret and validate the mathematical solution in terms of the real world problem. This error was reflected by an impossible or not realistic answer. Type of error could not be identified due to limited information from student’s work. TME, vol. 11, no. 3, p. 567 To make the coding more fine-grained we specified the four error types into a number of subtypes (see Table 3), which were established on the basis of a first exploration of the data and a further literature review. For example, the study of Leinhardt, Zaslavsky, and Stein (1990) was used to establish sub-types related to the use of graphs, which resulted in three sub-types: ‘treating a graph as a picture’, ‘point-interval confusion’, and ‘slope-height confusion’. The last two sub-types belonged clearly to the error type of mathematical processing. The sub-type ‘treating a graph as a picture’ was classified under the error type of transformation because it indicates that the students do not think about the mathematical properties of a graph. Because students can make more than one error when solving a task, a multiple coding was applied in which a response could be coded with more than one code. The coding was carried out by the first author and afterwards the reliability of the coding was checked through an additional coding by an external coder. This extra coding was done on the basis of 22% of students’ incorrect responses which were randomly selected from all mathematics units. In agreement with the multiple coding procedure, we calculated the interrater reliability for each error type and the code unknown, which resulted in Cohen’s Kappa of .72 for comprehension errors, .73 for transformation errors, .79 for errors in mathematical processing, .89 for encoding errors, and .80 for unknown errors, which indicate that the coding was reliable (Landis & Koch, 1977). 3.4. Statistical analyses To investigate the relationship between error types and task types, a chi-square test of independence was conducted on the basis of the students’ responses. Because these responses are nested within students, a chi-square with a Rao-Scott adjustment for clustered data in the R survey package was used (Lumley, 2004, 2012). For studying the relationship of student performance and error type, we applied a Rasch analysis to obtain scale scores of the students’ performance. The reason for choosing this analysis is that it can take into account an incomplete test design (different students got different test booklets with a different set of tasks). A partial credit model was specified in ConQuest (Wu, Adams, Wilson, & Haldane, 2007). The scale scores were estimated within this item response model by weighted likelihood estimates (Warm, 1989) and were categorized into four almost equally distributed performance levels where Level 1 indicates the lowest performance and Level 4 the highest performance. To test whether the frequency of a specific error type differed between performance Wijaya et al levels, we applied an analysis of variance based on linear mixed models (Bates, Maechler, & Bolker, 2011). This analysis was based on all responses where an error could be coded and treated the nesting of task responses within students by specifying a random effect for students. 4. Results 4.1. Overview of the observed types of errors In total, we had 4707 possible responses (number of tasks done by all students in total) which included 2472 correct responses (53%), 1532 incorrect responses (33%), i.e., no credit or partial credit, and 703 missing responses (15%). The error analysis was carried out for the 1532 incorrect responses. The analysis of these responses, based on the multiple coding, revealed that 1718 errors were made of which 38% were comprehension errors and 42% were transformation errors. Mathematical processing errors were less frequently made (17%) and encoding errors only occurred a few times (3%) (see Table 4). Table 4. Frequencies of error types Type of error N % Comprehension (C) 653 38 Transformation (T) 723 42 Mathematical processing (M) 291 17 51 3 Encoding (E) Total of observed errors a 1718a 100 Because of multiple coding, the total of observed errors exceeds the number of incorrect responses (i.e. n = 1532). In total we had 13 coding categories (including combinations of error types); the six most frequently coded categories were C, CM, CT, M, ME, and T. 4.1.1. Observed comprehension errors When making comprehension errors, students had problems with understanding the meaning of a task. This was because they misunderstood the instruction or a particular keyword, or they had difficulties in using the correct information. Errors in selecting information included half of the 653 comprehension errors and indicate that students had difficulty in distinguishing between relevant and irrelevant information provided in the task or in gathering required information TME, vol. 11, no. 3, p. 569 which was not provided in the task (see Table 5). Table 5. Frequencies of sub-types of comprehension errors Sub-type of comprehension error n % Misunderstanding the instruction 227 35 Misunderstanding a keyword 100 15 Error in selecting information 326 50 Total of observed errors 653 100 Figure 2 shows an example of student work which contains an error in selecting information. The student had to solve the Staircase task, which was about finding the height of each step of a staircase consisting of 14 steps. Figure 2. Example of comprehension error Wijaya et al The student seemed to have deduced correctly that the height covered by the staircase had to be divided by the number of steps. However, he did not divide the total height 252 (cm) by 14. Instead, he took the 400 and subtracted 252 from it and then he divided the result of it, which is 148, by 14. So, the student made a calculation with the given total depth of the staircase, though this was irrelevant for solving the task. 4.1.2. Observed transformation errors Within the transformation errors, the most dominant sub-type was using a wrong mathematical operation or concept. Of the 723 transformation errors, two thirds belonged to this sub-type (see Table 6). Table 6. Frequencies of sub-types of transformation errors Sub-type of transformation error n % Procedural tendency 90 12 Taking too much account of the context 56 8 Wrong mathematical operation/concept 489 68 88 12 723 100 Treating a graph as a picture Total of observed errors Figure 3 shows the response of a student who made a transformation error. The task was about the concept of direct proportion situated in the context of money exchange. The student was asked to change 3900 ZAR to Singapore dollars with an exchange rate of 1 SGD = 4.0 ZAR and chose the wrong mathematical procedure for solving this task. Instead of dividing 3900 by 4.0, the student multiplied 3900 by 4.0. TME, vol. 11, no. 3, p. 571 Figure 3. Example of transformation error 4.1.3. Observed mathematical processing errors Mathematical processing errors correspond to students’ failure in carrying out mathematical procedures (for an overview of these errors, see Table 3). This type of errors is mostly dependent on the mathematical topic addressed in a task. For example, errors in interpreting a graph do not occur when there is no graph in the task. Consequently, we calculated the frequencies of the subtypes of mathematical processing errors only for the related tasks, i.e. tasks in which such errors may occur (see Table 7). Wijaya et al Table 7. Frequencies of sub-types of mathematical processing errors Sub-type of Related tasks mathematical processing error All errors in related tasks Mathematical processing errors in related tasks n n n % 8 243 33 14 20 956 94 10 Error in interpreting graph 6 155 43 28 Measurement error 1 74 15 20 Error related to improper use of scale 1 177 49 28 26 1125 79 7 Algebraic error Arithmetical error Unfinished answer An example of a mathematical processing error is shown in Figure 4. The task is about finding a man’s pace length (P) by using the formula n = 140 P in which n, the number of steps per minute, is given. The student correctly substituted the given information into the formula and came to 70 = 140 P . However, he took 140 and subtracted 70 instead of dividing 70 by 140. This response indicates that the student had difficulty to work with an equation in which the unknown value was the divisor and the dividend is smaller than the quotient. 4.1.4. Observed encoding errors Encoding errors were not divided in sub-types. They comprise all errors that have to do with the students’ inability to interpret a mathematical answer as a solution that fits to the real-world context of a task. As said only 3% of the total errors belonged to this category. The response of the student in Figure 4, discussed in the previous section, also contains an encoding error. His answer of 70 is, within the context of this task, an answer that does not make sense. A human’s pace length of 70 meter is a rather unrealistic answer. TME, vol. 11, no. 3, p. 573 Figure 4. Example of mathematical processing error and encoding error 4.2. The relation between the types of errors and the types of tasks In agreement with the PISA findings (OECD, 2009a), we found that the reproduction tasks were the easiest for the students, whereas the tasks with a higher cognitive demand, the connection and the reflection tasks, had a higher percentage of completely wrong answers (which means no credit) (see Figure 5). Wijaya et al Figure 5. Percentage of full credit, partial credit, no credit, and missing response per task type To investigate the relation between the error types and the tasks types we performed a chi-square test of independence based on the six most frequently coded error categories (see the note in Table 4). The test showed that there was a significant relation (χ2 (10, N = 1393) = 91.385, p < .001). Furthermore, we found a moderate association between the error types and the types of tasks (Phi coefficient = .256; Cramer’s V = .181). When examining the proportion of error types within every task type, we found that in the reproduction tasks, mostly comprehension errors (37%) and transformation errors (34%) were made (see Table 8). Also in the connection tasks students made mostly comprehension errors (41%) and transformation errors (43%). However, in the reflection tasks mostly transformation errors (66%) were made. Furthermore, the analysis revealed that out of the three types of tasks the connection tasks had the highest average number of errors per task. TME, vol. 11, no. 3, p. 575 Table 8. Error types within task type Type of task Tasks Incorrect responses n na Comprehension error Transformation error Mathem. Processing error Encoding error Total errors n % n % n % n % n average a number % of errors per task 99 38 Reproduction 15 518 211 37 194 34 136 24 23 4 564 Connection 15 852 404 41 424 43 140 14 28 3 996 101 66 Reflection 4 162 38 24 105 66 15 9 0 0 158 40 34 1532 653 Total a b 723 291 51 99 b 1718 Because of rounding off, the total percentages are not equal to 100% Because of multiple coding, the total errors exceeds the total number of incorrect responses 4.3. The relation between the types of errors, the types of tasks, and the students’ performance level When testing whether students on different performance levels differed with respect to the error types they made, we found, for all task types together, that the low performing students (Level 1 and Level 2) made more transformation errors than the high performing students (Level 3 and Level 4) (see Figure 6)3. For the mathematical processing errors the pattern was opposite. Here we found more errors in the high performing students than in the low performing students. With respect to the comprehension errors there was not such a difference. The low and high performing students made about the same amount of comprehension errors. Wijaya et al Figure 6. Types of error in all tasks for different performance levels A nearly similar pattern of error type and performance level was also observed when we zoomed in on the connection tasks (see Figure 7). Figure 7. Types of errors in connection tasks for different performance levels For the reproduction tasks (see Figure 8) the pattern was also quite comparable. The only difference was that the high performing students made less comprehension errors than the low performing students. TME, vol. 11, no. 3, p. 577 Figure 8. Types of errors in reproduction tasks for different performance levels For the reflection tasks we found that the high performing students made more mathematical processing errors than the low performing students (see Figure 9). For the other error types, we did not found remarkable differences across student performance levels. Figure 9. Types of errors in reflection tasks for different performance levels 5. Conclusions and discussion The present was study aimed at getting a better understanding of students’ errors when solving context-based mathematics tasks. Figure 10 summarizes our findings regarding the types of errors Indonesian nine- and ten-graders made when solving these tasks. Out of the four types of errors that were derived from Newman (1977, 1983), we found that comprehension and transformation errors were most dominant and that students made less errors in mathematical processing and in the interpretation of the mathematical solution in terms of the original real-world situation. This Wijaya et al implies that the students in our sample mostly experienced difficulties in the early stages of solving context-based mathematics tasks as described by Blum and Leiss (cited in Maass, 2010) and PISA (OECD, 2003b), i.e. comprehending a real-world problem and transforming it into a mathematical problem. Figure 10. Summary of research findings Furthermore, within the category of comprehension errors our analysis revealed that most students were unable to select relevant information. Students tended to use all numbers given in the text TME, vol. 11, no. 3, p. 579 without considering their relevance to solving the task. This finding provides a new perspective on students’ errors in understanding real-world tasks because previous studies (Bernardo, 1999; Cummins et al., 1988) mainly concerned students’ errors in relation to the language used in the presentation of the task. For example, they found that students had difficulties to understand the mathematical connotation of particular words. The above findings suggest that focusing on the early stages of modeling process or mathematization might be an important key to improve students’ performance on context-based tasks. In particular for comprehending a real-world problem, much attention should be given to tasks with lacking or superfluous information in which students have to use their daily-life knowledge or have to select the information that is relevant to solve a particular task. A further focus of our study was the relation between the type of tasks and the types of students’ errors. In agreement with the PISA findings (OECD, 2009a) we found that the cognitive demands of the tasks are an important factor influencing the difficulty level of contextbased tasks. Because we did not only look at the correctness of the answers but also to the errors made by the students, we could reveal that most errors were not made in the reflection tasks, i.e. the tasks with the highest cognitive demand, but in the connection tasks. It seems as if these tasks are most vulnerable for mistakes. Furthermore, our analysis revealed that in the reflections tasks students made less comprehension errors than in the connection tasks and the reproduction tasks. One possible reason might be that most reflection tasks used in our study did not provide either more or less information than needed to solve the task. Consequently, students in our study did hardly have to deal with selecting relevant information. Regarding the relation between the types of errors and the student performance level, we found that generally the low performing students made more comprehension errors and transformation errors than the high performing students. For the mathematical processing errors the opposite was found. The high performing students made more mathematical processing errors than the low performing students. A possible explanation for this is that low performing students, in contrast to high performing students, might get stuck in the first two stages of solving context-based mathematics tasks and therefore are not arriving at the stage of carrying out mathematical procedures. These findings confirm Newman’s (1977) argument that the error types might have a hierarchical structure: failures on a particular step of solving a task prevents a student from progressing to the next step. Wijaya et al In sum, our study gave a better insight into the errors students make when solving contextbased tasks and provided us with indications for improving their achievement. Our results signify that paying more attention to comprehending a task, in particular selecting relevant data, and to transforming a task, which means identifying an adequate mathematical procedure, both might improve low performing students’ ability to solve context-based tasks. For the high performing students, our results show that they may benefit from paying more attention to performing mathematical procedures. However, when making use of the findings of our study this should be done with prudence, because our study clearly has some limitations that need to be taken into account. What we found in this Indonesian sample does not necessarily apply to students in other countries with different educational practices. In addition, the classification of task types – reproduction, connection and reflection – as determined in the PISA study might not always be experienced by the students in a similar way. For example, whether a reproduction task is a reproduction task for the students also depends on their prior knowledge and experiences. For instance, as described by Kolovou, Van den Heuvel-Panhuizen, and Bakker (2009), students who have not learned algebra cannot use a routine algebraic procedure to split a number into several successive numbers (such as splitting 51 into 16, 17, and 18). Instead, they might use an informal reasoning strategy with trial-and-error to solve it. In this case, for these students the task is a connection task, whereas for students who have learned algebra it might be a reproduction task. Notwithstanding the aforementioned limitations, the results of our study provide a basis for further research into the possible causes of students’ difficulties in solving context-based mathematics tasks. For finding causes of the difficulties that students encounter, in addition to analyzing students’ errors, it is also essential to examine what opportunities-to-learn students are offered in solving these kinds of tasks. Investigating these learning opportunities will be our next step in the CoMTI project. Notes 1. In PISA (see OECD, 2003b, p. 52) a ‘mathematics unit’ consists of one or more questions which can be answered independently. These questions are based on the same context which is generally presented by a written description and a graphic or another representation. TME, vol. 11, no. 3, p. 581 2. For example, of the 33 provinces in Indonesia the province of Yogyakarta occupied the 6th place in the national examination in the academic year of 2007/2008 (Mardapi & Kartowagiran, 2009). 3. The diagram in Figure 6 (and similarly in Figure 7, Figure 8, and Figure 9) can be read as follows: the students at Level 1 gave in total 541 incorrect responses of which 45% contained comprehension errors, 47% transformation errors, 15% mathematical processing errors, and 5% encoding errors. Because of multiple coding, the total percentage exceeds 100%. Acknowledgement This research was supported by the Indonesian Ministry of National Education under the Better Education through Reformed Management and Universal Teacher Upgrading (BERMUTU) Project. References Bates, D., Maechler, M., & Bolker, B. (2011). lme4: Linear mixed-effects models using S4 classes. R package version 0.999375-42. Bernardo, A. B. I. (1999). Overcoming obstacles to understanding and solving word problems in mathematics. Educational Psychology, 19(2), 149-163. Biembengut, M. S. (2007). Modelling and applications in primary education. In W. Blum, P. L. Galbraith, H.-W. Henn, & M. Niss (Eds.), Modelling and applications in mathematics education (pp. 451-456). New York: Springer. Boaler, J. (1993a). Encouraging transfer of ‘school’ mathematics to the ‘real world’ through the integration of process and content, context and culture. Educational Studies in Mathematics, 25(4), 341-373. Boaler, J. (1993b). The role of contexts in the mathematics classroom: Do they make mathematics more real? For the Learning of Mathematics, 13(2), 12–17. Clarkson, P. C. (1991). Language comprehension errors: A further investigation. Mathematics Education Research Journal, 3(2), 24-33. Clements, M. A. (1980). Analyzing children’s errors on written mathematical task. Educational Studies in Mathematics, 11(1), 1-21. De Lange, J. (1987). Mathematics, insight and meaning. Utrecht: OW & OC, Rijksuniversiteit Utrecht. Wijaya et al Graumann, G. (2011). Mathematics for problem in the everyday world. In J. Maasz & J. O'Donoghue (Eds.), Real-world problems for secondary school mathematics students: case studies (pp. 113-122). Rotterdam: Sense Publishers. Gravemeijer, K.P.E. & Doorman, L.M. (1999). Context problems in realistic mathematics education: A calculus course as an example. Educational Studies in Mathematics, 39(1-3), pp. 111-129. Greer, B., Verschaffel, L., & Mukhopadhyay, S. (2007). Modelling for life: Mathematics and children’s experience. In W. Blum, P. L. Galbraith, H.-W. Henn & M. Niss (Eds.), Modelling and applications in mathematics education (pp. 89-98). New York: Springer. Grek, S. (2009). Governing by numbers: The PISA ‘effect’ in Europe. Journal of Education Policy, 24(1), 23-37. Henning, P. H. (2004). Everyday cognition and situated learning. In D. H. Jonassen (Ed.), Handbook of research for educational communications and technology : A project of the Association for Educational Communications and Technology (2nd) (pp. 143-168). New Jersey: Lawrence Erlbaum Associates, Inc. Kolovou, A., Van den Heuvel-Panhuizen, M., & Bakker, A. (2009). Non-routine problem solving tasks in primary school mathematics textbooks – A Needle in a Haystack. Mediterranean Journal for Research in Mathematics Education, 8(2), 31-68. Landis, J. R., & Koch, G. G. (1977). The measurement of observer agreement for categorical data. Biometrics, 33(1), 159-174. Lave, J. (1988). Cognition in practice: Mind, mathematics, and culture in everyday life. New York: Cambridge University Press. Leinhardt, G., Zaslavsky, O., & Stein, M. K. (1990). Functions, graphs, and graphing: Tasks, learning, and teaching. Review of Educational Research, 60(1), 1-64. Liang, X. (2010). Assessment use, self-efficacy and mathematics achievement: Comparative analysis of PISA 2003. Data of Finland, Canada and the USA. Evaluation & Research in Education, 23(3), 213-229. Lumley, T. (2004). Analysis of complex survey samples. Journal of Statistical Software, 9(1), 1-19. Lumley, T. (2012). Survey: Analysis of complex survey samples. R Package version 3.28-1. Maass, K. (2010). Classification scheme for modelling tasks. Journal für Mathematik-Didaktik, 31(2), 285-311. TME, vol. 11, no. 3, p. 583 Mardapi, D., & Kartowagiran, B. (2009). Dampak Ujian Nasional. Yogyakarta: Universitas Negeri Yogyakarta. Newman, M. A. (1977). An analysis of sixth-grade pupils’ errors on written mathematical tasks. Victorian Institute for Educational Research Bulletin, 39, 31-43. Newman, M. A. (1983). Strategies for diagnosis and remediation. Sydney: Harcourt Brace Jovanovich. Nunes, T., Schliemann, A. D., & Carraher, D. W. (1993). Street mathematics and school mathematics. New York: Cambridge University Press. Nunez, R. E., Edwards, L. D., & Matos, J. F. (1999). Embodied cognition as grounding for situatedness and context in mathematics education. Educational Studies in Mathematics, 39(1-3), 45-65. OECD. (2003a). Literacy skills for the world of tomorrow. Further results from PISA 2000. Paris: OECD. OECD. (2003b). The PISA 2003 assessment framework – Mathematics, reading, science, and problem solving knowledge and skills. Paris: OECD. OECD. (2004). Learning for tomorrow’s world. First results from PISA 2003. Paris: OECD. OECD. (2005). PISA 2003. Technical report. Paris: OECD. OECD. (2007). PISA 2006: Science competencies for tomorrow’s world. Paris: OECD. OECD. (2009a). Learning mathematics for life. A view perspective from PISA. Paris: OECD. OECD. (2009b). Take the test. Sample questions from OECD’s PISA assessments. Paris: OECD. OECD. (2010). PISA 2009 results: What students know and can do. Student performance in reading, mathematics, and science (Vol. I). Paris: OECD. Pusat Kurikulum. (2003). Kurikulum 2004. Standar Kompetensi mata pelajaran matematika Sekolah Menengah Pertama dan Madrasah Tsanawiyah. Jakarta: Departemen Pendidikan Nasional. Roth, W.-M. (1996). Where is the context in contextual word problems? Mathematical practices and products in grade 8 students’ answers to story problems. Cognition and Instruction, 14(4), 487-527. Schleicher, A. (2007). Can competencies assessed by PISA be considered the fundamental school knowledge 15-year-olds should possess? Educational Change, 8(4), 349-357. Schwarzkopf, R. (2007). Elementary modelling in mathematics lessons: The interplay between “real-world” knowledge and “mathematical structures”. In W. Blum, P. L. Galbraith, H.-W. Wijaya et al Henn, & M. Niss (Eds.), Modelling and applications in mathematics education (pp. 209216). New York: Springer. Van den Heuvel-Panhuizen, M. (1996). Assessment and Realistic Mathematics Education. Utrecht: CD-β Press, Center for Science and Mathematics Education. Van den Heuvel-Panhuizen, M. (2005). The role of context in assessment problems in mathematics. For the Learning of Mathematics, 25(2), 2-9, and 23. Warm, T. A. (1989). Weighted likelihood estimation of ability in item response theory. Psychometrika, 54(3), 427-450. Wu, M. L., Adams, R. J., Wilson, M. R., & Haldane, S. (2007). ACER conquest version 2.0. Mulgrave: ACER Press. Yore, L. D., Anderson, J. O., & Hung Chiu, M. (2010). Moving PISA results into the policy arena: Perspectives on knowledge transfer for future considerations and preparations. International Journal of Science and Mathematics Education, 8(3), 593-603. Yusuf, S. (2004). Analisis tes PISA. Literasi membaca, matematika, dan sains. Jakarta: Pusat Penelitian Pendidikan. Departemen Pendidikan Nasional. TME, vol. 11, no. 3, p. 586 A study on Malaysian Mathematicians’ Way of Knowing Lim Chap Sam 1 School of Educational Studies Universiti Sains Malaysia Introduction “Can you name me a mathematician?” “Einstein??” “Do you wish to become a mathematician one day?” If these questions were asked to the public or any school students, the most likely answer to both questions might be a big ‘No!’. Why is this so? The director of the Public Understanding of Mathematics Forum, Gene Kloz (1996) claims that the mathematics profession is the most misunderstood in all of academia. According to him, the public thinks that mathematicians contemplate ancient proofs and work as lonely recluses. Moreover, the most common public image of a mathematician has been furnished by a physicist (example, Einstein) rather than a mathematician. Why is there such a lack of appreciation of mathematicians' work by the public? Although generally most people agree that mathematics is important in our daily life and useful for many careers, yet many people shy away from doing mathematics. In Malaysia, Lee et al. (1996) found that “the science and non-science student ratios have deteriorated from 31:69 in 1986 to 20:80 in 1993, indicating a drop of 11% in the proportion of students taking science subjects” (p.i). The most common reason as quoted by 58% of 766 Form 4 students and 59% of 489 Form 6 students for not choosing science was ‘poor foundation in science and mathematics’. The other common reason was ‘no confidence in mathematics” as quoted by 42.8% of Form 4 students and 48.1% of Form 6 students. These findings thus raise concern over the falling enrolment of students in 1 [email protected] The Mathematics Enthusiast, ISSN 1551-3440, vol. 11, no. 3, pp. 586-642 2014© The Author(s) & Dept. of Mathematical Sciences-The University of Montana Lim science and mathematics. This is particularly so in the midst of preparing our youth for the era of information technology. These are some of the issues and problems that are of concern not only to mathematics educationists, but also to school administrators and parents. The related problems include students' mathematics performance in the SPM and STPM examinations which is still far from satisfactory, students' attitudes towards the learning of mathematics which is becoming more and more negative, the decline in the number of student choosing mathematics as a major subject in secondary schools and the small number of students majoring in mathematics in tertiary institutions. Indeed all of these problems and issues are closely related to one another. The negative attitudes towards mathematics or "mathematics phobia" and the perception that mathematics is a difficult subject certainly does not encourage a student to major mathematics in their tertiary education. Consequently, this shortage of mathematics graduates might result, as it has done in the UK (Hayes, 2002, Cassidy, 1998), in the shortage of mathematics teachers in schools as well as a shortage of mathematicians in Malaysia. As a result, mathematics might have to be taught by teachers who have not majored in mathematics. Ultimately, the problem of teaching and learning of mathematics in schools may become more serious. Various efforts have been made to improve the performance and attitudes towards mathematics of students. A number of studies have been carried out to find the causes of this negative attitude (for examples, Vanayan, et al., 1997; Elliott, et al., 1999; Gipps & Tunstall, 1998) and to research learning that is more effective and teaching strategies. However, most studies have concentrated on mathematics students who are weak in mathematics. Perhaps many researchers have forgotten that there exist a small number of students who are so interested in mathematics that they have taken up mathematics as their lifelong career. Who are these people? They include the mathematicians who teach and research in mathematics in universities. Why do they have such an intense interest in mathematics? What has attracted them to mathematical work? What are their experiences in learning mathematics that have motivated them to become mathematicians? TME, vol. 11, no. 3, p. 588 Thus, this study aims to explore how mathematicians come to know mathematics, learn mathematics and research in mathematics. This study has taken a different focus by looking at people who are interested in mathematics such as mathematicians, and not those who are weak at mathematics. It is hoped that findings from this study, with regard to the mathematicians’ experience of learning and researching might offer a new model for teaching and learning of mathematics in schools or support an already-existing model. Their struggles and enjoyment in mathematics might provide a source of motivation for school students to be more interested in mathematics. Following this, it is hoped that the findings of this research will provide recommendations and implications that are useful to encourage students in schools and universities to adopt a more positive attitude and interest in learning mathematics. Research Objectives More specifically, this study aims: 1. To find out how mathematicians come to know, learn and understand, and think of mathematics. 2. To explore mathematicians’ attitudes and beliefs about mathematics and its learning. 3. To explore the mathematicians’ learning experiences and their practices 4. To compare Malaysian mathematicians’ way of knowing with that of British mathematicians studied by Burton (1999a) Review of related literature Review of related literature shows that there are very few studies on mathematicians (except Lim, 1999; Wong, 1996; Burton 1999a). Most people do not have a clear picture about who mathematicians are and how they carry out their practice. In a related research by Lim (1999), when asked about the characteristics of a mathematician, 58% (out of a total of 548 participants in England) chose "intelligence" as the most important characteristic. More than 1/4 of the sample perceived a mathematician as a male who is intelligent, serious, confident and wears glasses. In the same research, a sample of 407 Malaysian students and teachers were asked the same question. Lim found that more than 75% of the Malaysian sample chose "intelligence" and "confidence" as the most Lim important characteristics of a mathematician. More than half of them held the same view of a mathematician as a male who is intelligent, serious, confident, strict and wears glasses. Thus, both samples seem to share a rather similar picture of a mathematician. Earlier, in 1996, Wong asked a group of Singapore secondary school students (137 boys and 144 girls) to draw a picture of a mathematician. He classified the students’ drawings depicting a mathematician into four main categories: 1. Type I: mature and intellectual (69%) who was characterised as a male of mature age, bald, with glasses and mustache, and wearing clothes covered with mathematics symbols. 2. Type II: the strange messy look (10%) who was characterised as a stern looking, weird male with unkempt hair working on mathematics. 3. Type III: feminine qualities (10%) characterised as a female mathematician who looks like a mathematics teacher, but is also kind looking and patient. 4. Type IV: The mechanical icon (10%) such as a calculator. These students perceived mathematicians as having non-human qualities such as being mechanical and unfeeling. In short, mathematicians were viewed as a group of special human beings, alienated, and seemingly non-human. These research findings (Lim, 1999; and Wong, 1996) may not be generalised due to the small sample size. Nevertheless, they indicate that many people know very little about mathematicians and their practice. Perhaps this view of a mathematician as someone who is mysterious and unpopular will deter many students from specialising in mathematics or becoming mathematicians. Thus, more studies on mathematicians and their work practices need to be done. Research carried out by Burton (1999a) with 70 mathematicians all over United Kingdom (UK) shows that mathematicians are also emotional and collaborative in their work practices. Her study shows that there is “a substantial cultural shift in mathematics from a discipline dominated by individualism to one where team work is highly valued” (p. 131). The majority of the mathematicians, whom she interviewed, spoke about the importance of collaboration or cooperation in their research as well as publication. This is a surprising result as it contrasts with the social stereotype of mathematicians being aloof, lonely, odd, locked away in an attic room, as portrayed in media and some literature (e.g. TME, vol. 11, no. 3, p. 590 Simon Singh, 1999). Moreover, when talking about ‘knowing ‘ mathematics, these mathematicians tended to give two metaphors: (a) the jigsaw puzzle and (b) the views or the map. These mathematicians’ experiences of coming to know mathematics were also represented by feelings, such as the powerful sense of Aha! In addition, it is this kind of aesthetic feeling and deep involvement in mathematical exploration that holds them in mathematics. However, her data are limited to UK mathematicians only. What are the experiences and practices of mathematicians in Malaysia? Are they similar? In fact, the school science and mathematics curricula of Malaysia are largely based on the western mathematics model, in particular because of the British colonial rule in the past. Nevertheless, Malaysia and UK are very different in terms of culture, language and religions. The question is, are our local mathematicians' experiences of mathematics learning and doing mathematics similar to those mathematicians studied by Burton (1999a). Do cultural differences make an impact in this aspect? It is hoped that these research findings will make an important and significant contribution to encouraging young students to major in mathematics. Mathematics is important for the development of our country and mathematicians can contribute significantly in various ways. Understanding how mathematicians do mathematics, more so how they develop a deep interest in mathematics may help us to encourage more positive attitudes among our students. In what ways do mathematicians appreciate the beauty of mathematics and enjoy its elegance [as revealed by some of the mathematician participants in Burton’s study (2001)]? How can this appreciation and enjoyment in mathematics learning be channelled to our young students so that they too could appreciate and enjoy mathematics? With the above goals in mind, this study is deemed both important and necessary. Methodology Participants Twenty five mathematics lecturers from three local universities were interviewed. These universities were chosen as they were among the oldest and have the most established mathematics faculties. Most of the academic staffs in these universities are not only involved in teaching mathematics but also in mathematical research. Thus, they are defined as mathematicians in this study. This definition of a mathematician is similar Lim to what was defined by Burton (1999a) in her study on mathematicians. Therefore, this allows the findings of the two studies to be compared. The detailed distribution of the participants is provided in Table 1. In total, there are five professors, eight associate professors and 12 lecturers; 16 are males and 9 are females. In terms of ethnic group, 17 are Malays and 8 are Chinese. Each university has about 30-40 academic staff members. Thus, I have interviewed about one quarter of the staff members from each university. TME, vol. 11, no. 3, p. 592 Table 1: Distribution of participants by profession, gender and university Professor Male University Female Ma Ch Ma M - 1 - S 1 - K 3 Subtotal 4 Subtotal Associate Professor Female Male Ma Ch Ma Ch Ma - 1 2 - 1 1 - - 1 1 - - - - - 1 - 1 1 - - 3 3 1 1 5 Total Ch Male Lecturer 0 6 5 Ma=Malay Female Ma Ch - 2 1 9 1 1 2 - 7 1 1 2 - 9 3 2 6 1 25 2 Ch Total 5 8 7 12 Ch = Chinese Research design This study is an interpretative study employing a qualitative method, mainly a single life-history interview, to collect data. The main aspects covered in the interview were: experience of learning mathematics in schools; experience of learning mathematics in university; experience of being supervised as post graduate students; experience of supervising students; images of mathematics; images of mathematicians; experience of working as a mathematician – research and publication; suggestions for improving mathematics education. A list of questions was prepared to be used as a guideline and prompt for the interviews (see Appendix A and B). Some of these questions were adapted from Burton (1999a). All questions were written in two languages, Malay and English. This allows the participants to choose whichever language in which they are fluent. The majority of the participants chose to speak in English. Only two of the 25 participants preferred to use Malay to English. In most cases, there was a mixture of languages as this is a typical way of communication for most Malaysians. The list of interview questions was shown to the participants before the interview started to give them the opportunity to prepare themselves and to allow them to delete any question that they may find sensitive or unsuitable. Each participant’s consent was 25 25 Lim sought before the conversation was tape-recorded. Of the 25 participants, only one refused to be tape-recorded. In this case, the main details of the conversation were noted during and immediately after the interview. All the interviews were conducted in the offices of the participants or in another private room suggested by the participants. All the interviews were face to face. The duration of the interviews ranged from half an hour to two hours, with an average of about an hour. Each interview was tape-recorded and transcribed for qualitative analysis using computer software, QSR N5 (Richards, 2000). Findings and Discussion This section reports and discusses the findings and results of the qualitative analysis of the interview data. Experience of learning mathematics in schools Of the 25 participants, nearly half of them (12) displayed great interest in learning mathematics since their primary school. Yet four of them admitted that they were very poor in mathematics when they were young, and the remainder (9) felt their mathematics learning experience at primary school was just routinised. Many of them could not recall, or did not have much memory about, any significant events. The following quotations display some typical answers: Q: Can you still remember any moment that you started to be very interested in mathematics? A: Interested in maths? I suppose I did well. Q: since primary school? A: Yes. (K5, 50’s, female associate professor) A: I love mathematics since primary school. (S3, 30’s, male lecturer) A: to me, it’s a normal routine learning process. (K2, 50’s, male professor) A: I did not have full experience of mathematics [learning] in primary school. I was not a good student in mathematics at that time. (S7, 40’s, male associate professor) TME, vol. 11, no. 3, p. 594 So, when did the first ‘spark’ of interest in mathematics begin? The ‘spark’ of interest seemed to occur for most of them when they entered upper secondary schools. The three main contributing factors cited by most of them were mathematics teachers, interesting teaching and successful experience of learning. Q: Could you please describe your experience of learning mathematics in primary school or secondary school? A: I got interested in mathematics during my secondary school. Q: Which form? A: Since Form Three. Q: Any special moment that you can remember? A: It is all due to a good teacher, ha, ha. I think a good teacher plays a good and important role. (S2, 40’s, female lecturer) A similar view was given by two other mathematicians that, I got interested when I was in secondary school. My primary school was not that good. I was just average. But when come to secondary school, I had one very good mathematics teacher. (M2, 50’s, male associate professor) Fortunately, I’ve a good teacher. I think Form 1, Form 2, Form 3, as usual-lah, not very…. When I got to Form 4, I’ve a very good teacher Mr. Ang. I started to really like mathematics especially Add Maths. (K8, 30’s, female lecturer) …jumpa pula Cikgu Chakra ini, cara dia kendali saya masa Form 5 level tu cukup seronok. Tapi malangnya dia ajar kita orang sampai dekat Form 5, and then dia pergi R&G. Kalau dia continue lagi, saya ingat result mungkin lebih baik lagi. (K6, 50’s, male lecturer) That some of them can still remember their teachers’ name even after ten or twenty years indicates that mathematics teachers have a considerable impact on the students’ experience of learning mathematics. Further analysis of the data has shown that mathematics teachers usually play a role as motivator or inspiration: Teachers also inspired me. They always considered me to do well in Mathematics. That gave me the encouragement, like a push offer that you can do Maths and you should do Maths. (M5, 30’s, female lecturer) Lim The encouragement and motivation of mathematics teachers have pushed many students to work harder. Even though mathematics may be viewed as a difficult subject, some students were willing to take up this challenge as inspired by the teachers. The following conversation illuminates this point: S: When did you start to get interested in mathematics? J: I think that come very much later, may be Form 5 or 6 when you find there is a necessity to really master mathematics. And of course, I think at that time the teachers also played a role. You see there are not many good teachers in mathematics. Mathematics is regarded as a very difficult subject. Even the teachers themselves think so, what do you expect from the students? But I think that I do meet some very good teachers in mathematics. I think that really interest me to learn why it is such a difficult subject. (M1, 50’s, male associate professor, italic my emphasis ) Besides being motivators, good mathematics teachers also provided innovative teaching and exciting learning experience that captured the interest of their students in mathematics. Well, the first part on…, I still remember the first chapter was on continued and discrete, you know, we started with that. And then come to significant figures and things, you know, But most interesting was when he drew out a diagram and asked us to point out which was the angle and so on. You have to go to the board and then show him, so everybody will see you doing that, you see….. Then we started to feel that our maths results were much better, you know. So with that I feel I slowly I start to like mathematics…. (M7, 50’s, male lecturer) Very similar experience of good teaching that led to interest in mathematics was also described by another younger mathematician: This tuition teacher was very good and he had his own way to teach Mathematics. His method of teaching was very good. Especially when came to memorizing sin, cos. He used our fingers to memorize angles especially 0o, 30o & 45o. All those kind of important angles, we used our fingers to memorize that, but now I can’t remember exactly how. That was the first moment when I started to realize, wow! What are the wonderful things about Mathematics? I think the most important thing is his way of teaching is very good. That is one thing and then I did it very well. Before that, when I was in form 1, 2 & 3, not to say I was not good but nothing that got me interested, I just manage to get through, just pass only. … TME, vol. 11, no. 3, p. 596 I attended the tuition and I was so interested and I did it very well from then. …The way he taught me, from that I did very well in my Mathematics so I can say that I get the excellence result that was Addition Mathematics. (S5, 30’s, female lecturer) Thus, one may notice that interesting teaching approaches lead to better interest in mathematics and consequently better results in mathematics. The latter subsequently enhance the students’ confidence and thus intensify their interest in mathematics learning. Hence, the vicious cycle of interest leading to better results and better result leading to deeper interest seems to perpetuate. However, the feeling or experience of success may not necessarily come from good teaching. As one of the mathematicians described his experience: When I started Form 1, 40 is the passing mark so I made it 41, 42 to pass. Well, I was still not doing well. I was just managed to pass. It wasn’t my favorite subject at all. I like history a lot. When I was in Form two the teacher was teaching the simultaneous equation like X+Y=5 or 2X-3Y=4 something like that. I was ill so I did not go to school on one particular day. So for some reasons. I decided to do well, of course, I couldn’t do it, and then I try to think logically and let me try to think rational how to do it. I try to do methodically as in the examples, [I check the answer] in the back [of the textbook] and it’s correct. When I did the next question with the same technique it worked too. Than suddenly every thing worked and from that point, my interest increased. I used the same kind of methodical method and my performance shoot-out. I reach 70 [marks] and then in Form 3, it was close to hundred in all tests. I got A1 in my LCE. So, it pushes out without any help from anybody. I am sure the teachers did their works but they were not very inspiring. (S7, 40’s, male associate professor) Again, one may argue that this type of successful experience perhaps is unique to certain people only. However, the pertinent question should be how to provide each and every student with this type of successful feeling or experience of success in mathematics learning? Other than mathematics teachers and experiences of success in mathematics, the data also show that the other important influential factors could be home environment, especially the moral support of parents as well as peers influence. One associate professor described how his father helped to cultivate his interest in mathematics from an early age: Lim A: It all started when, you know… when you’re young, when my father played a big role in this. Normally, I used to follow my father down in the evening to see a football match or something like that, we ride on a bicycle, my father will paddle the bicycle and I always sitting at the back. He always figures something interesting like a flock of birds fly up, example: “Berapa burung tu,” and I used to count up, you know I was little…count up the numbers of birds. “ada 13” okay “13” Q: How old were you then? A: 5, 6 or 7 years old. You know I always follow him. The next batch of birds, because we were not rich we ride on a bicycle, “ada 17” yang tadi ada berapa ? Ohh 13 so campur, so that helped a lot, you know, we add up he’s not properly educated…but he’s wise in his own way… (M4, 40’s, male associate professor) Likewise, the importance of peer support was recognised by a young female mathematician: I think ….okay, good examination results of course inspire me. I had a few friends, they always talked about who got the best in Maths. They always mentioned my name. Teachers also inspired me. They always considered me to do well in Mathematics. That gave me the encouragement, like a push offer that you can do Maths and you should do Maths. (M5, 30’s, female lecturer) The above example displays that even though some families may be poor, it is always the conducive environment that promotes mathematics learning that matters. This is also evidenced in literature (for e.g. Rabusicova, 1995) that parents’ educational background, parents’ occupation and parents’ interest in students’ performance in schools have great correlation with the students’ educational trajectory. Therefore, a family environment that promotes good reading habits from young will help to promote mathematics learning. Two mathematicians whom I interviewed believed that their early exposure to reading might have contributed to their interest in mathematics. The following conversation illustrate this: A: … Because I’ve been a good reader. My parents provided me books to read. While my friends they didn’t do that way… in my primary school level. Q: What kind of books do you read during primary school? A: some storybooks… I’ve the general knowledge, concerning science and maths. (K5, 50’s, female associate professor) When I was very young … at the primary level I used to visit the USIS library and the British Council a lot. There are a lot of very good TME, vol. 11, no. 3, p. 598 science books. Actually, my interest started not in mathematics but in science. I used to pester my mother to show me how to go down to USIS (United State Information Service) library near the riverside. I'm local. I took the old Tong Fong bus down to the riverside near Bukit Aman. It's still there. (M1, 50’s, male associate professor) In addition, the data also reveal an interesting finding. Not all mathematicians whom I interviewed experienced a wonderful and enjoyable mathematics learning during primary schools. In fact, at least three of them had negative experiences because they found themselves weak and disappointing in learning mathematics. Not all of them excelled or were interested in mathematics since young, but they managed to pick up later due to a mathematics teacher or a successful experience of problem solving. The following stories of a senior mathematician exemplify a typical case. A senior mathematician (S1, male associate professor) relates in the interview that, I was very weak in mathematics when I was in primary school because no one taught me mathematics. When he entered secondary school, he still faced problems in mathematics because, When I attended the secondary school, everything changed to English. Language problem again and I don't understand because of language. I don’t like mathematics at all. I almost failed my mathematics. I always got 50 or 40. In Chinese school, this was considered fail. But in Form 3 that year I've to sit for the LCE. …. Well, even if you do not know, you have to try your best. So luckily, I passed and I was admitted to Form 4. He managed to pass his Form 3 examination and was admitted to Form 4. Then his fate changed as he met a very special mathematics teacher: Then in Form four I was taught by an American teacher, Peace-corp teachers. ……I think, I was interested in some.. that is what I say, even a weaker student, when something struck him, let him understand certain thing, he can also be interested in mathematics. It’s my own experience that when this peace corp teacher taught me some modern mathematics. I think it was something different from the traditional way, we were no more just applying formula. Lim Now we have to use our brains to think. And then I'm so proud because I can understand it and I can answer the questions whereas my peers cannot. Something that made me feel I am so proud about myself. Suddenly I feel oh! I'm good at mathematics. I can do it. [italic my emphasis] Perhaps this type of story should be told to our students and to our prospective mathematics teachers. It clearly indicates the important role of mathematics teachers. Besides that, it reflects the hard work and successful experience of mathematics learning that can boost the interest and confidence of students towards learning mathematics. Experience of learning mathematics in university Of the participants interviewed, all except four did their postgraduate studies overseas. The majority of them went to further studies in mathematics or fields related to mathematics. Most of them went to either United Kingdom or United States. All of them were fully sponsored by their universities as part of an academic staff training programme. Of the seven Chinese Mathematicians, four of them did not have postgraduate experience overseas. All Malay Mathematicians have studied overseas, sponsored by the Public Service Department (JPA), Ministry of Education or a university staff training programme. The four who did not go overseas did their studies from undergraduate to PhD in the same local university. Some of them studied through tutorships where they gave tutorials while studying for postgraduate courses. Some of them did struggle to get through their postgraduate studies. Choosing the right field and a suitable university were some of the problems faced. At least two of them did not manage to finish their PhD study overseas. Therefore, it may be interesting to find out if: the experience of studying overseas affect their world view of mathematics? the experience of being supervised overseas influence their supervision of students later? TME, vol. 11, no. 3, p. 600 Experience of being supervised as postgraduate students As mentioned earlier, the majority of the mathematicians in this study went to do their postgraduate studies overseas, to some extent, these experiences seemed to have impact on their world view about mathematics, in particular with regard to the learning and doing research in mathematics. One female mathematician did her master degree locally but then went to Australia for her PhD degree. She compared both her experiences as follows: I think it’s a correct decision to go to Australia because you are exposed to a wider range of experience there. You can see the research there. They emphasized a lot about research there. The facility, the encouragement, the understanding of what you want to do research. In a way, you won’t face as many obstacles as I think one was facing here. I mean here [locally] if you want to find some good journals in the library, you don’t have that many journals. Some of the papers that you want might not be available. The length of time you take to take something [there] compare to here, it is much faster there. I think it is just the general environment and the understanding of when you do the research I think those that around you have to understand that you were not to be disturbed and try not to put too much of interruptions. (M5, 30’s, female lecturer) In comparison, she found the library facilities, and the culture of research were much more conducive in oversea universities than those provided by local universities. She recommended that local universities should strive to provide similar facilities and environment that will encourage this type of research culture. Another interesting observation was that all the four Malay professors seemed to have a very positive and encouraging learning experience while they were doing postgraduate studies overseas. They managed to collaborate with their supervisors in writing journal articles. One of them proudly presented a book written by his supervisor which gave credit to his work in mathematics. In addition, their supervisors also provided them with many academic opportunities. For example, one of them revealed that he was brought to attend the Annual Mathematics Conference by his British supervisor. He found attending conference like this not only open up another new avenue for learning, but also it was a very helpful way of networking. At the conference, he was introduced to his supervisor’s former PhD students, some of them were already established mathematicians. This gave him opportunities to ask for comments and suggestions about his own research. Besides Lim this, he also built up a very close relationship with his American supervisor whom he regarded as his “uncle”. He found meeting with his supervisors and other academic staffs during ‘coffee time’ every morning had provided him great opportunities for academic discussion. Indeed, all these cultural exchanges have influenced him to do the same thing with his students now. Similarly, another young female mathematician (S5) have learnt up “to be quite independent student in that time because my supervisor let me do my work on my own. I need to see him twice a week. So once I did something, I went to see him and asked for comments, and he will direct me to whatever things that I should do. Yes, regular meetings and I feel the meeting was always very helpful”. Consequently, she acknowledged that her experience is going to influence what she would like her future students to be. She has just completed her PhD study a year ago and yet to supervise any students. However, she has laid down her criteria as: “first of all, I need them to have a strong background in everything they want to do, and also working independently. A part from that, of course they will need my consultation”. “To be independent” seemed to be one of the dominant cultural qualities that these mathematicians have learnt from studying overseas. As a result, they would like to impose the same kind of training to their students. One of the professors also acknowledged that, his postgraduate experiences have influenced how he supervises his students now. Pengalaman saya masa buat PhD dulu itu mempengaruhi saya. Jadi, misalnya student has to be more independent. Dia kena cari tajuk sendiri. Dia kena cuba develop his own problem. Setengah pelajar mungkin suka dengan cara itu. Tapi saya rasa kebanyakan Malaysian memang tidak suka. [My experience while I was doing my PhD did influence me. For example, (I want my) students have to be more independent. He has to find his own topic. He has to develop his own problem. Some students may like this way, but I know most Malaysian (students) do not like this] (K1, 50’s, male professor) Even though he was aware that some of his students might not appreciate his way of emphasising “independent”, he would still enforced it because he believed that it was a good way of training them. TME, vol. 11, no. 3, p. 602 However, not all mathematicians whom I interviewed had positive experiences of being supervised. One of them (M8) described her experience: I had a problem because my basic was already in OR… by the time, I wanted to do PhD I was asked to do something else, in numerical analysis because you know. Internal politic or what so ever. From my department, they wanted me to do numerical analysis. I do not know what was the plan at that particular time but because I was about to go already so I felt it was not fair, so I went to... So I got everything ready, I got supervisor, I got the university everything ready for OR. Suddenly I was offered numerical analysis. I got to change university to find somebody who can bridge between numerical analysis and OR. I went to somebody. When you go to a supervisor who is not statistics. You know what sort of surprise you got. So basically, I was all on my own. That was not a very nice experience because before you go and do your PhD, you already have this idea in your mind, what PhD constitute with. How and what you expect what the supervisor should be, so it turns out that you had a very different experience. (M8, 40’s, female lecturer) She was ordered to change her area of study from her sponsor at the last minute and she was given a supervisor who was not an expert in her field. Nevertheless, she managed to obtain her PhD degree with much hardship. You just present your work, he will comment, because he is not in that field, his comment is more to on the surface. You have to be keen yourself, I have to inform him what I have done until I reach to this stage and this stage. (M8, 40’s, female lecturer) However, she still appreciated and was grateful to her supervisor for making an effort to invite experts in her area to come and help her: One thing good about my supervisor is he gives me all the opportunity. He invites visitors from other countries, just for me. To help me with my research. So that is something that I was thankful. (M8,40’s, female lecturer) Therefore, have the negative experiences of being supervised during PhD study influence her supervision of her students now? She replied, Sometimes people say that you have been treated badly by supervisor. Normally you become a lousy supervisor, but I find it in different way, I thought the lack of supervision from my supervisor which I yearn to have at that particular time, that's why I sometime, I write the programme for my student, believe it or not, I do the defrauding for them, I spend hours in front of the computers with them because Lim that's worry me if they cannot do. So, I do not know but I had gone through that extend where I get so involved with my students' work, so time consuming. I'm not the type, if you don't finish this you don't come and see me. (M8,40’s, female lecturer) It seems that the lack of proper supervision made her understand the needs of her students better, and she was trying to do everything for her students to compensate what she lacked. Experience of supervising students As most of the mathematicians in this study seemed to have postgraduate studies overseas, thus indirectly this reflected the lack of postgraduate students studying at local universities. Perhaps it is therefore not surprising to notice that the majority of the participants interviewed did not have much experience in supervising Masters or PhD students. Most of them only supervised the final year project mathematics students. Some senior mathematicians have supervised a handful of master students but relatively very few PhD students in mathematics. One of the professors suggested three possible reasons: A:Ya. Dia buat master sini, dia buat PHD oversea. Ini salah satu constraint. Kedua, because of the field. Siapa nak buat PHD in mathematicss? (laughter). As I said Buat undergraduate pun Difficult. So the source is not there. Yang buat undergraduate dalam matematik pun is the third class punya material. Unless they are, there are a few so called late developer, yang itulah ada potential. Memang dia just looking forward to finish it and forget mathematicss. Get something else, MBA tu (laughter). First, most students prefer to study master degree locally but PhD degree overseas. Second, mathematics is not considered as a popular field among students. Third, there is a lack of high mathematical ability students, even among the mathematics undergraduates. This shortage of postgraduate mathematics students could be a worrying trend as this might lead to a shortage of future mathematicians and mathematics teachers in the country. In terms of supervision, there seemed to have two styles. One is let the students explore the literature and come out with their own topic or problem to be researched on. TME, vol. 11, no. 3, p. 604 Another style is that the supervisor provides the topics or problems for the students to research. So, what is the best style? One experienced supervisor offered his view: A: Well, for me it is a question of whether they should be closely supervised or left to be more independent. It depends on the calibre of the students. Q: So far how do you find your 2 PhD students? J: Well, they are very hard-working, they are okay. Of course, certain time they need a bit of hand-holding. (laughter). (M1, 50’s, male associate professor) According to him, it depends on the ability of the students, whether they are independent or not. More often, their supervision included both ‘independent’ as well as ‘hand-holding’. This was echoed by another senior mathematician. A : Yes. Independent in certain way and also need guidancelah! Actually it is a mixture-lah, to be fair. (M2, 50’s, male associate professor) Others found supervising students as a mutual learning process. They found they were learning and maturing together with their students. For example, I did together with my students because it's a new area. So when he entangles a certain things, I give ideas. And then as I give the ideas, I also go back and find resources and try to solve the problem. So, at least both of us could be, we are maturing together with the topic. (M4, 50’s, male associate professor) Apparently this type of training was inherited from his experience of being supervised, as he explained further: We [start with] just blank ideas. We give a thought of the idea before we proceed and then I also try to find other resources. Maybe from that sources, I pass it to him. And then when he explains it to you, and then you understand the thing better because your experience to your own supervisor in the last time. You should apply it. And that helps, there should make the system fit and then the way you ask the question, is how they [your supervisor] treat you the last time. (M4, 50’s, male associate professor) Again, this shows that the experiences of being supervised overseas did influence their supervision of students later. Lim Images of mathematics When the mathematicians were posed with the question, “what is mathematics?” at least six out of the 25 interviewed stressed that: Maths is not just number. How you solve the real life problem actually. It is problem solving. Like in OR [operational research] how we solve real life complex. (K8, 30’s, female lecturer) Mathematics is a field of study. Not really with numbers. Numbers are only fundamental. (K3, 50’s, male professor) If mathematics is not just about numbers only, then what should mathematics include? To me, mathematics is thinking. A way of thinking. (K2, 50’s, male professor) Mathematics is just an art of or is a technique of understanding things [in the world?] in anything. Technique of understanding things... Technique tu apa ? is study-lah like you looking at pattern, looking at law. (K1, 50’s, male professor) Thus, mathematics seemed to be more than just manipulation of numbers and symbols, but a way of thinking, a way of understanding the world. Although, A: … to the layman, mathematics is number. But to me it could be more on formulae, sometimes some abstract thinking, we are trying to model something. Actually it is a system… Q: A system is a system of number, and formulae? A: Yes. We are using formulae and numbers to represent the real world. Actually, I would say, Mathematics is multi-disciplinary. Sorry, it is a language of science. So, in every field of science, we need mathematics. (K7, 30’s, male lecturer) Therefore, two of them regarded mathematics as ‘the king of science’ because: Ha! It's the king. Because other fields would depend on maths. Whereas, we don't need to depend on others. (K5, 50’s, female associate professor) TME, vol. 11, no. 3, p. 606 But then, a younger mathematician preferred mathematics to be the ‘queen of science’ as he explained, No, ‘queen’ refers more to mother. Like the mother figure is nurturing the others. While the king is more like power, or the one that governing the others. I think, in a way, it is lucky to use the word queen. Instead of if mathematics is a king, then mathematics is dying now. When you come to a university, in real world, mathematics become secondary in the university, they called it School of computing and mathematics. And some people just call it as School of Computing. (K7, 30’s, male lecturer) Most of the mathematicians agreed upon the importance of mathematics in real life and in providing the foundation for applied sciences. Perhaps the only difference in images of mathematics between the pure mathematicians and applied mathematicians was that for the pure mathematician, Mathematics is something either right or wrong. So everything we say it is right, think it is right under any condition, any situation. In Chinese, we call it as 真理 "Zhen Li" [nobel truth]. This is what we are pursuing in mathematics. It is quite different from mechanical engineering. They are constructing a bridge, they are doing something which they have no idea whether this bridge can last... how long it can last. They just do some estimation. If they say that there may be earthquake in that area, they will use more materials, stronger materials. But for mathematics, we want precision. We want everything to be exact. That is the difference. So, when we learn mathematics, we are learning it in a different way. In our mind, everything is so idealise, ...Whatever we think, we want precise, we want everything to be absolutely correct, in that sense as possible. So, mathematics is different from applied science. But mathematics is a guideline for applied science. So, you must have mathematics first before you have applied science. (S1, 50’s, male associate professor) So, a pure mathematician is very much concerned about the precision, the accuracy and the absolute idealistic model, rather than the usefulness or the value of practicality of their findings. Another pure mathematician agreed that, …We don't try to be ahead of thoughts. We just want to know the answer, that's all. It is not the intention of trying to be ahead or Lim trying to take the challenge. The most important thing is we just work more on the problem. (M5, 30’s, female lecturer) However, for the applied mathematician, they are also concerned about the empirical aspect. One of them explained that, Mathematics is the way of reaching or obtaining knowledge about the physical world, without resolve to experiment. …so that you are not deceived by your senses. I think there are two ways to obtain knowledge, one is to do experimental work, another one is from mathematics, where you develop a set of axioms then from the set of axiom, you made up your theorem and then develop into a theory. So, for me both are valid. But I think [pure] mathematicians, they don't really appreciate the experimental work. Having been trained in the civil engineering department, [I believe that] Experimental work is very important. When you do experiment, you get the real feeling for the subject matter. When you do mathematics, what does this mean? It is very theoretical. For example, for [pure] mathematicians certain terms will represent viscosity. It just a term but for the engineer they know, they feel the viscosity they know once you reduced the viscosity what will happen, they have feeling. They have physical sense which is important to help them. For [pure] mathematicians it is a certain term. You said this thing could take a certain value, for [pure] mathematicians is correct but for engineer that is impossible to reach certain value under certain circumstances. So what I am trying to say is that [pure] mathematicians sometimes they don't really appreciate the empirical work which is important. (S7, 40’s, male associate professor Another senior professor of pure mathematics also argued that the values of mathematics change as time changes. Historically, in Greek period, the scholars at that time were very engrossed with the motion of heavenly bodies, so they developed many theories concerning trigonometry and geometry. They were concerned with religious values, But Modern maths, is no longer religious values, it's of economy value, it's rationalistic value. …Like trigonometry, geometry is certainly [religious value]. Statistics is very recent it is not. Calculus is economy value, it is in the 8th century. TME, vol. 11, no. 3, p. 608 (K1, 50’s, male professor) Due to this change of values in mathematics, some mathematicians were worried that in the pursuit of values that are more utilitarian or more applications we may lose the support of the fundamental theory. Two of them voiced similar comments that, Because now the government and the universities, all towards applied which to me it’s ridiculous when you don't have the background, but it is important that you have a basic foundation, [then] the applied can come anytime. (M8, 40’s, female lecturer) This is something that Malaysians don't understand. What they want is applied, applied they never care about the fundamental design. But just applied, we spend a lot of money and get nothing. But you see, they do not have the support of a theory. They do not know what they will get there. (S1, 50’s, male associate professor) In brief, mathematicians viewed mathematics as more than just numbers and symbols, but a way of thinking, using symbols and equations to represent the real world problem in a mathematical model and then trying to analyse and solve it mathematically. This finding seemed to echo what Lim (1999) found in her study that among those who reported liking mathematics, in particular, the mathematics teachers and mathematicians, tended to hold a problem solving view. They tended to relate mathematics to solving problems and mental work. Moreover, a pure mathematician seemed to hold a different image of mathematics from an applied mathematician or a statistician. Similar to what was found by Burton (1999a), applied mathematicians stressed practicality and utilitarian values, while pure mathematicians looked for theoretical foundation. By and large, findings of this study concurred with Burton’s (1999a) study that mathematicians’ views of mathematics are personal and social cultural related. Besides viewing mathematics as more than numbers and symbols, there are two more aspects, which emerge and are worth mentioning in these mathematicians’ images of mathematics. These two aspects include the notion of difficulty in mathematics and the aesthetic aspect of mathematics. They are discussed as follows: Lim (i) Mathematics is difficult? To many laymen on the street, mathematics is considered one of the difficult subjects in schools. But we would expect that the mathematicians would not find mathematics difficult as they liked and excelled in mathematics. To my surprise, at least three of them described mathematics as Yes, it can be difficult. (M1, 50’s, male associate professor) Actually it is difficult. (M2, 50’s, male associate professor) A:No such thing as mathematics without tears…There is nothing like that. There is nothing like an easy way to ... if you look at those books written like comic or lighter to be read as mathematics, they cannot go too far. All are on elementary, made it interesting, a lot of examples, fun, ok. These are all elementary. When you go on for more advances, you need to be very serious. There is no alternative that you can ... Q: Do you think mathematics is difficult then? A: I don' think mathematics is difficult. University mathematics is different, because you are talking about structures, but high school mathematics, no, is concerned with everyday life. (S1, 50’s, male associate professor) Although most mathematicians did not find mathematics difficult, neither was it easy. One young mathematician felt that, A: Actually it is not the easiest. But if you compare with Sejarah [History] and what not, [which] you need a lot of facts to remember, biology, Chemistry. But maths if you can understand how to solve one sort of problem, then you can do anything. Because it is just deal with numbers, for school- [mathematics]. If you know how to deal with that, differentiation, operation, then you can do any type of questions or problems. Q: How about higher degree, let's say university maths? A: University maths. You need to have a very good basis in that. So in school, you need to know how to differentiate, basic concept...Because in university they don't really teach you those things. I think for school students, they need a lot of exercises, just to familiarise with that problem, I think I learnt like that, ya, a lot of drill and practice, and then after that it becomes easy. (K8, 30’s, female lecturer) According to her, a way to conquer the ‘difficulty’ in mathematics was to work hard, do a lot of “drill and practice”; or learn it step by step as suggested by another mathematician: TME, vol. 11, no. 3, p. 610 You go virtually in stages. Just like, you want to climb a high mountain. You cannot climb it overnight. One day one hour a few steps, and you do it slowly, then it's ok. You got to do it slowly and it's fun. (M2, 50’s, male associate professor) Perhaps this notion of ‘difficulty’ is relative. How one perceives what mathematics should be and how one is confident about it seem to determine the degree of difficulty. One of the mathematicians gave her opinion in the interview: Q: Do you find maths difficult? A: No. (laughter) Q: All the while you find maths easy? A: At school level, yes. Q: How about at higher level? Let's say the university level? A: Not that difficult. I don't know the school students are concerned, who put the idea that mathematics is difficult. Like my students here too, I think they have been like some other people, like their seniors who put the idea in their heads that mathematics is difficult. If these students are able to discover something by themselves, with ...I think it shouldn't be difficult. (K5, 50’s, female associate professor) Consequently, she suggested that it was important for students to keep an open mind so that this ‘self fulfilling prophecy’ did not take place: A: they should be more open- minded. When you start reading something, some topics in mathematics, you have to read with an open mind, and you have to think that you don't know anything about that, and you are trying to discover new thing and then you just go on with that. We shouldn't be stuck with a fixed mind that it is difficult. (K5, 50’s, female associate professor) However, the concept of difficulty had a totally different meaning for another male mathematician. He took the difficulty of mathematics as a challenge and was attracted to mathematics because of this. Mathematics is regarded as a very difficult subject. Even the teachers themselves think so, what do you expect from the students? But I think that I do meet some very good teachers in mathematics. I think that really interests me to learn why it is such a difficult subject. When you say the subject is hard, I take it as a challenge. Because I Lim think it is in my nature. Because of that, I ended up ...or sort of being hooked up in mathematics for quite some time. (M1, 50’s, male associate professor) It seems that the notion of ‘difficulty’ is relative. If one can do it or is interested in it, one may not find it difficult. On the other hand, if one cannot do it or is not interested in it, one tends to find it difficult. Since the notion of ‘mathematics is difficult’ is such a relative concept, should we then acknowledge its difficulty and transmit this notion to our students? But then we could encourage them to take this difficulty as a challenge. Alternatively, should we conceal or ignore this difficulty, but attempt to make it ‘easy and fun’ for our students? Is it possible to learn mathematics without tears? (ii) Mathematics is beautiful One of the female mathematicians gave her reason for interest in mathematics as, ‘How I got interested in mathematics? I suppose I found maths is beautiful’. (K5, 50’s, female associate professor) Her reason was echoed by another male mathematician that, Other than that [difficulty], mathematics by itself is also a very nice and beautiful subject. Because if it is just the difficulty alone I think it won't be that appealing (M1, 50’s, male associate professor) From the data, at least four mathematicians mentioned that they liked mathematics because they appreciated the beauty of mathematics. According to them, the beauty of mathematics lay on “to be in it and work in mathematics, then you know the beauty” (K1, 50’s, male professor). One needs to be able to appreciate the beauty by really immersing in it, even when people around you may not understand as fully as you are. One of them described her experience, For example like octagonal polynomial, it might be very messy and so on. But then later on… later on... you find that, to you now it is very beautiful, something very beautiful, but people can't understand that it is beautiful. You tend to be able to see that the beauty is there. (M6, 40’s, female lecturer) TME, vol. 11, no. 3, p. 612 However, these descriptions still sounded abstract and implicit. So I asked, Q: Can you quote some examples that you view mathematics as something enigmatic, something beautiful? A: Well I think you have a lot of symmetry, consistency. You can actually solve problems sometimes just by 'seeing', by intuition alone. It can be very interesting. (M1, 50’s, male associate professor) A: I think is the thinking. I mean the solving of problems. The thinking, the problem solving, manipulation of like property, when you reach the answer and it's very rewarding. (K5, 50’s, female associate professor) Thus, it seems that the beauty of mathematics is closely related to the process of working on mathematical problems, thinking and solving mathematical problems. Once you are able to see or find the solution to it, you will feel it to be so rewarding and beautiful! Again, this aesthetic feeling of mathematics was also revealed by Burton’s research participants (2001). The issue is how can we convey this beautiful feeling to our students who are doing mathematics in schools. As argued by Burton (2001) that, “People experience aesthetics differently and find values in different aspects of mathematical practice and outcomes, but they all express delight and motivation from the pleasure of touching perceived beauty” (p. 597). Thus, the more pertinent thing may be providing students with experiences of learning mathematics through explorations and discoveries of mathematical concepts, rather than presenting mathematics as an objective knowledge. However, this may mean a big change in the existing culture of mathematics learning in schools. Images of learning mathematics Many of the mathematicians whom I interviewed suggested that drill and practice is one of the best ways to learn mathematics. Instead of just doing the number of sums or questions that were selected by your teachers or lecturers, a male mathematician suggested a student who wanted to excel in mathematics needed to do all types of questions. He/she should attempt all the questions that are given in the textbooks. This is because, Lim Mathematics you got to solve the problems over and over again and then you find the satisfaction by knowing, then you gain mastery over the problem. Whatever form the problems come then you find it easy to solve so what I would suggest, you know, the old method of doing mathematics here. As he explained further that, When questions came in, when the chapters when the exercise for when the teacher said do all. So the first question 1 to question 10 are almost similar question but different.. What do you call that? The different variables or numbers there. Then you manipulate. The time when you solve the first problem you look at the formula. The second time you look at the formula. The third time you look at the formula, the fourth time you don't look at the formula anymore because it has stuck in your head already. By the time you reach number 10, you are solving the problem [without] memorizing the formula. Next, when you come to problem 11,12 and it's a real problem question, your mind is investigating more than simple direct problems, but application problems. Then you'll find that you have [reach certain] standard towards the topic. On that thinking, so I always believe that, when students are young, they need to do more exercise. (M4, 40’s, male associate professor) His suggestion of learning mathematics by a lot of drill and practice was echoed by another female mathematician: I think for school students, they need a lot of exercises, just to familiarise with that problem, I think I learnt like that, ya, a lot of drill and practice, and then after that it becomes easy. (K8, 30’s, female lecturer) This belief of learning mathematics with emphasis on ‘drill and practice’ is not to be understood as ‘rote learning’ which is not a true learning and may not bring about understanding. However, as argued by Marton (1997), this type of repetitive learning which is “continuous practice with increasing variation”, which can lead to deep understanding or mastery of the skills. The latter has also been identified as one of the features of East Asian culture of learning by Leung (2001). Perhaps this is not a surprise as Malaysia is part of East Asian, and thus it shares similar culture of mathematics learning. Many of my mathematician participants believed that one only needed pen and paper plus your brain to do mathematics, mathematics is clean and free from the use of doing practical work, such as in Chemistry or other sciences. Mathematics also does not need so TME, vol. 11, no. 3, p. 614 much memory work as studying biology. These are some of the reasons these mathematicians gave for choosing to major in mathematics rather than other sciences. It is very convenient, you see. [laughter] I don't know why. I don't like the practical work, you see, so I end up here. It is just the mind, just like when you walk, you don't have to bring anything, you see. When you are free, you can 'think' it anytime. (M2, 50’s, male associate professor) A: because It require less memory work, that is my main reason. Q: You think in mathematics you don't have to memorize? A: Just memorize the formula only (S3, 30’s, male lecturer) Even a female mathematician shared a similar view of mathematics as a clean and less memory work: A: Yes . challenging, maths is challenging as well-kan? I don’t like doing .. satulah lab… saya tak suka kotor-kotor tangan, lepas itu… Even chemistry , kena hafal itulah… saya tak suka . I jenis yang macam [yes, mathematics is challenging. I don’t like …one thing is laboratory work. I don’t like to dirty my hand. Even chemistry, have to memorise, I didn’t like this type of subject…] A: Masa matriculation kena ambil semua subjek: chemistry, biology… I masih remember ..Kena belah kataklah semua itu . Saya memang tak suka benda-benda macam tu kotor . [During matriculation, have to take all subjects: Chemisty, biology… I still remember..have to dissect frogs.. all that. I didn’t like these things, they are dirty…] (K9, 40’s, female lecturer) These Malaysian mathematicians seemed to hold the belief that mathematics is best learned through drill and practice. It does not required much memorization as compared to other sciences such as Biology and Chemistry. This belief is coherent with their images of mathematics (discussed earlier) as a way of thinking and not merely symbols and formulae to be remembered. This finding is important because it shows the difference in images of mathematics and mathematics learning between mathematicians and school students (as found in Lim, 1999; Kalsom & Lim, 2001). Most Malaysian students tended Lim to hold a symbolic view of mathematics and consequently they tended to learn mathematics by memorizing formulae and procedures. Intuition and insight in mathematics These terms, ‘intuition’ and ‘insight’ were not asked deliberately in the interviews. However, at least five of the mathematicians whom I interviewed brought out the importance of intuition in their conversation. There are explicit and implicit information there. So to do proof, it is not just looking at the surface, you have to have the insight of looking at things. The geometrical intuition of it...the algebraic intuition of it... (K2, 50’s, male professor) Well I think you have a lot of symmetry, consistency. You can actually solve problems sometimes just by 'seeing', by intuition alone. It can be very interesting. (M1, 50’s, male associate professor) How do mathematicians gain intuition? Although they did not seem to be able to explain it in explicit terms, they believed that it was something related to experiences: A: I think I can see there is something could be done there. Q: From your own experience? A: Yes, Intuition, in fact. You just feel that there is something there. Even though you might be in the dark, when you really… when you are settle down, you are able to.... Q: How do you get this kind of intuition? A: I just get it. (M6, 40’s, female lecturer) A : The intuition is also something like because of your experience. Somehow, someway but you don't know how you see. The only thing is you have that knowledge-based already. You think of something now and all these link to... they all help you to have that concept... So called intuition also have a base somewhere, you see. Q : It is not come out from nothinglah? A: No, no... It is not like this. Intuition has a base somewhere. (M2, 50’s, male associate professor) In fact, one of them suggested that an intuitive way of thinking is so important that we should inculcate this in teaching and learning of mathematics in schools: TME, vol. 11, no. 3, p. 616 A: To solve a problem you have to follow certain steps. I think, for most cases, you can do that if it's very routine. But usually it is not. Basically it shows with the application of insight you can actually get to the answer quickly rather than follow a certain number of steps. I'm not saying that it's no use to have to follow steps. That can be very useful. But that's not the way human being thinks. Nowadays we have what is known as an algorithm... there are certain fixed steps to get a certain answer. Definitely very good for implementation on a computer and for many other tasks. But when it comes to mathematical and perhaps other types of thinking it's not always like that. I think a lot of unconventional or fuzzy modes of thinking come in, . .. like making use of intuition etc. Q: Do you think mathematical research needs a lot of intuition too? A: Well exactly. Able to see, to visualize ... have to be creative. (M1, 50’s, male associate professor) Similar findings were observed by Burton (1999a) in her study to explore how research mathematicians come to know the mathematics they develop. She concludes that, ‘Intuition, insight, or instinct was seen by most of the seventy mathematicians whom I interviewed as a necessary component for developing knowinng. Yet none of them offered any comments on whether, and how, they themselves has had their intuitions nurtured as part of their learning processes’ (p.31). Perhaps this is something to be pursued or looked into by our teachers and students alike, in view of the importance of intuition and insight in mathematical practices. (for further discussion see ‘implications to mathematics education’). Images of mathematician When the participants were asked “who do you define as mathematicians”, they said mathematicians are those: ‘who are interested, keen on doing mathematics’ (K2, 50’s, male professor) ‘who work in mathematics and who do research in mathematics (K3, 50’s, male professor) ‘who study, who explore and who are expert in the field of mathematics’ (K5, 50’s, female associate professor) Lim ‘those with PhD degree, conducting some kind of research in mathematics’ (M1,50’s, male associate professor) ‘A Mathematician is someone who is actively working on maths problem, actively trying solve maths problems, trying to come out with something new, or contribute something to mathematics, not just taking what is known and sharing with others. I think some one have to contribute new things, or trying to help to increase knowledge.’ (M5, 30’s, female lecturer). Consequently, a female pure mathematician (M5) believed that, ‘Not necessary someone with a PhD in maths because I won't consider because someone with PhD in mathematics but latter on not really working on maths. He or she can be considered as an academician but not really doing research in mathematics. I will just call the person a teacher maybe, she is just teaching but not a mathematician.’ (M5, 30’s, female lecturer) But almost all of them agreed that mathematicians must be somebody who can contribute, although “not necessarily 100% new [knowledge/theories], you criticise the definitions, criticise the concepts, that’s the beginning of becoming a mathematician” (K1, aged 50, male professor). With this criteria in mind, most of them disagreed that ‘all mathematics lecturers in universities can be considered as mathematicians’. This is because not all of them do research and contribute to new theorems or new mathematical knowledge. Likewise, mathematics teachers in schools are certainly not mathematicians because they merely transmit mathematical knowledge to their students without making any new contribution in mathematics. However, at least four of them felt that the condition of making new contributions was too stringent. This was because, “if you want only to say those who discover new theory are mathematicians, then you don’t have any real mathematicians, I think”(K8). Instead, they gave a rather loose and general definition of mathematicians to include mathematics teachers in schools as long as “some of them are because they are writing articles for mathematics, you see. Some of them are very productive also, they are writing books, do research, I mean more on education side perhapslah! In that sense they are still mathematicians.” (M2, 50’s, male associate professor). Thus, some mathematics teachers could be considered as mathematicians because they have contributed in terms of writing TME, vol. 11, no. 3, p. 618 books and even those “who can come out with new way of teaching mathematics, okay, they can be [mathematicians]” (K8, 30’s, female lecturer). One male participant also included engineers as applied mathematicians because “they are user…of mathematics, …some discipline, the pillar of the subject is mathematics. For example, engineers, the pillar is still mathematics” (M4, 40’s, male associate professor) One of the participants differentiated pure mathematicians from applied mathematicians. According to him, “pure mathematicians are those type of people who are thinking in formula. They are excited about numerical problems, about numeric, just like Fermat’s last theorem. …whereas the applied mathematics is more like using. They are users, they are not really inventors. A pure mathematician is someone who invent some kind of formula to solve some problems”(K7, 30’s, male lecturer). Again, this kind of differentiating pure mathematicians from applied mathematicians was also espoused by the mathematicians participated in Burton’s (1999a) study. It is interesting to note that the pure mathematicians seemed to have stricter criteria for being a mathematician than the applied mathematicians. The former tended to believe that it was vital for a mathematician to contribute new knowledge or do pioneer work in mathematical research. Interestingly, they also did not consider themselves as mathematicians. The following conversation illustrated this point: Q: How do you become a mathematician? A: I'm not a mathematician (laughter). I am doing mathematics that's all. We have seen mathematicians. Mathematician ...does not mean who do mathematics or who teach mathematics is mathematician. No. We have seen some real mathematicians. But I do not consider myself as a mathematician. Q: In your opinion, what kind of people is a mathematician? A: A mathematician, I think, he must have some contributions to mathematics in terms of research, yes. In terms of some pioneer work in mathematics. Of course, certainly we have published paper , but depends on what kind of paper you are publishing. A lot of paper are computer garbage. For the sake of publication, we published paper. But, compared to those real mathematicians whose work influence mathematics, the development of mathematics. These are mathematicians. I mean, when you want to say mathematics , there is a field called group theory. If you want to study that field you must learn the theorem by certain people. Those people are mathematicians. (S1, 50’s, pure mathematician, male associate professor) Lim However, applied mathematicians especially the younger ones seemed to be more reliant and they held a broader definition for mathematicians. Experience of working as mathematician To which community do you belong? As the participants’ images of mathematicians were heterogeneous, they also seemed to equate themselves to different communities. When the participants were asked, ‘of which community do you claim membership?’, they seemed to divide themselves into three broad categories: pure mathematicians, applied mathematicians and statisticians. Perhaps this categorisation is not surprising because it was also practiced by their British counterparts (Burton, 1999a). As discussed earlier, the majority of the Malaysian mathematicians were trained in United Kingdom or United States of America, so the same kind of system could have easily brought back to Malaysia. Even though one or two of them disagreed with this division, the majority of them found this division necessary as it helped to identify oneself or to promote one’s expertise: A: I think it is more for convenience you want to classify yourself. I don't think we can... Q: So it is not that important? A: Yes, but it can be good, like you say, you're in certain area and people know if you want to do then they know what area you're in. (M1, 50’s, male associate professor) Even within the broad category of pure mathematics, they grouped themselves into very specific fields like topology, cohomology etc. Q:Do you think it is very important that you associate with 1 specific community like topology or Fuzzy mathematics? A:Yes. That's important. We also attend the general talk, general seminar. But we don't research in those fields, we concentrate in our field only. (K3, 50’s, male professor) Likewise, for the applied mathematicians, they have their own cliques such as operational research (OR), industrial computing or optimization. When they go to TME, vol. 11, no. 3, p. 620 conferences, they tend to meet only the members of their own cliques or communities. They have their reasons as illustrated in this conversation: Q: Of which mathematical community do you claim membership? A: In OR, operational research. Q: When you go to a conference, you are sure to go for this? A: I wouldn't go for mathematics [conferences], sometimes we do go for mathematics, but we do not get so much feedback as we go to OR. OR is a bridge between management, engineering, computer science and mathematics. Because it is inter disciplinary with many subjects, so when we go to OR conference, OR focused, we got all combinations of people from different fields. So the feedback is better compared to if I go to mathematics conference, I wouldn't get this varieties, so normally, I do not go for mathematics conference, I always go to OR conference or computer conference only. (M8, 40’s, female lecturer) Indirectly, this illustrated that each mathematical community is so specialised that any non-member may feel alienated even if they tried to join in. The 25 participants whom I interviewed seemed to place themselves into one of the three broad categories without overlapping. Table 2 displays the broad distribution in terms of membership claimed. Table 2: Distribution by membership and gender Pure Applied Statistician Total Mathematician mathematician Male 7 5 4 16 female 4 2 3 9 Total 11 7 7 25 The participants of this study were not selected deliberately by any criteria, but more by chance and voluntary. I identified them by going through the telephone directory of the staff members, and asking for their voluntary participation. Nevertheless, I did try to stratify them by their academic positions such as professor, associate professor and lecturer. Although the distribution in Table 2 may not be representable of all Malaysian Lim mathematicians in universities, to some extent, it reflected the much higher number of male mathematicians than female mathematicians. It also showed that there were more pure mathematicians than applied mathematician or statisticians. Mathematicians and Research In terms of research, I was interested to find out what kinds of research were these mathematicians engaged with. Do pure mathematicians or applied mathematicians have equal chances of being involved in research? The pure mathematicians whom I interviewed seemed to find themselves lonely and isolated as most of them tended to be very specialised in one or two particular areas. Moreover, their areas of interest or research were so specific that very few people were involved or engaged in the same area. For example, one of them specialised in cohomology and she found only about a handful of people in the world of mathematics research on this same area. Therefore, many pure mathematicians like she, tended to work alone, even though she appreciated the positive effect of collaboration: A: …Sometimes it’s quite nice-lah, you have some one to exchange and to interact. But, most of the time, a lot of people here are working on their own. Q: Is this typical for mathematicians? A: I think it’s quite typical for pure mathematicians. But I think applied mathematics and Statistics may be less, …unless they are doing the pure or theoretical part of statistics. Most statisticians that I know here work with the people in the Medical faculty, some of them in finance… So I think it is easier for them to find people to talk to. [M5, pure mathematician, female, 30’s] From the analysis, it is observed that the number of research projects being carried out by the majority of the mathematicians in this study is still limited. Perhaps this is due to three possible factors. First, there is generally a lack of research grants, especially for pure mathematics. One of the mathematicians complained that, No. For pure mathematics, we hardly can get a grant. You want to get the grant, you have to join those in applied mathematics. (S1, 50’s, male associate professor) But then some found that doing mathematical research did not need much funding, as one of them experienced that, TME, vol. 11, no. 3, p. 622 We don't really need a lot of grant. Ha! Ha! paper and pencil and computer. Last time I have a grant, I don't know what to do, I have a lot of money. About RM17, 000. I did not finish the grant. (S7, 40’s, male associate professor) Second, collaboration among colleagues seemed not to be encouraged due to differences in specialisation as discussed earlier. Last, as one of the mathematicians whom I interviewed who was also the former dean of a mathematics department observed that, A: I feel in this university, we have too many.... just a significant number of people who are just, I feel are, complacent. Q : Do you think, there is a lack of the collaboration spirit? A : No, I think these are people who are very comfortable in their positions. You know, when they have classes, they come a little earlier, otherwise, they don't have.. (S6, 40’s, male professor) Perhaps this kind of ‘complacent’ attitude of some academic staff may have partly explained the less active participation and involvement in mathematics research. On the whole, there seemed to be some observable cultural differences in mathematical communities or research atmosphere among the three different universities. University M which is the oldest, and with more established and senior mathematicians tended to engage more in individual research projects. University K with the most number of professors tended to lead big group research projects. Normally these projects were led by a senior professor and a group of collaborators. Lately university K seemed to have the tendency to engage more in educational research, such as ethno mathematics. However, university S seemed to still lack in a spirit of research collaboration among its staff members, as disclosed by its dean in the interviews. Collaboration or individual work? As noted earlier that pure mathematicians seemed to find it harder to have collaborative projects with the others than their applied counterparts. Of the 11 pure mathematicians whom I interviewed, six of them did not have or were yet to have any collaborative project with the others. As one of the female pure mathematician expressed that, Lim Q: Do you have any experience of like collaborating on a research project or not? A: No. Because I am in pure mathematics. So, most of these project, I mean, usually.. the one collaborated is mainly the one on applied mathematics such as statistics. (K5, 50’s, female associate professor) Likewise, another professor in pure mathematics also agreed that, “Normally it is difficult to team up with other people. So most of us do our work on our own.” (K3, , 50’s, male professor). However, this is not to say that these mathematicians do not value collaboration. Many of them did believe that collaboration could be helpful because Yes, I learn something from there. I think it is helpful. Just to see how your colleague sometimes work and how they think. (M5,30’s, female lecturer) because some thing relate a little bit of everything, you see, a little bit of pure-mathematics, a little bit of applied-mathematics, a little bit of statistics. At least, you team out the people of various fields, so it helps one another. (S3, 30’s, male lecturer) And yet, only very few of them managed to have collaborative projects with the others. Why was this so? One of the reasons could be that different colleagues, even within one instituition, tended to research on different areas. One mathematician agreed that, That's very true because sometimes the area that one mathematician do, we cannot even understand. It takes time for you to understand it. So far I think mathematics is different in the form.. if you are a pure mathematician, the area is so wide and then there are so little of you. In Malaysia itself, pure mathematicians here we have about only 13 or 12 people. The area in pure mathematician is so large but in the end. The master, the PhD students or the lecturers, who has mastery in that particular, he's alone there. How do he transmit his knowledge to other people so that they can understand in this, this, this alone. Like I'm doing this Bayscian statistic. So when I talk about this Bayscian thing, there's none, even in the country so now I heard about 2 or 3 is coming back, and That also they are doing different sets. Some people are doing Bayscion, some people are doing basic time series, and some people are doing some thing else. (M4, 40’s, male associate professor) TME, vol. 11, no. 3, p. 624 Thus, many mathematicians found the differences were so wide that some of them just could not understand each other. They felt that they were speaking different languages. Hence, most of them tended to collaborate mainly with their supervised students. A few of them collaborated with one or two colleagues overseas, including with their former supervisors. Nevertheless, applied mathematicians did find ways to collaborate in some research projects with their counterparts in other fields, in particular, with engineers, medical researchers and computer scientists. One statistician that I interviewed managed to have collaborative linkage with researchers in Canada and USA, even though he agreed that, Q: Most people tend to think that mathematicians used to do work on their own, without much collaboration with others. Do you agree with this? A: I would agree to a great extend. That is seriously the norm. Because I think in mathematics you do a lot of thinking. You tend to be alone most of the time. Q: Sort of you don't have to collaborate with your colleagues? A: Yes to a certain extend yes, you don't have to. But I think, thing has come to a stage where many things are connected. You cannot be in an island to yourself... I think that is where collaboration comes in. (M1, 50’s, male associate professor) Perhaps there was a slight reaslisation of this “cultural shift in mathematics from a discipline dominated by individualism to one where team work is highly valued” as pointed out by Burton (1999a, p.131). Nevertheless, the data showed that collaboration or team works among Malaysian mathematicians were relatively less significant as compared to their British counterparts. In short, the collaboration seemed to be in three categories: (a) in research project (b) with their supervised students and (c) with oversea colleagues. Due to specialisation, most mathematicians seemed not able to collaborate with their colleagues even within the same institution or in the same country. Lim Justification of new knowledge When the question of “how do you justify that what you have come to know is new?”, most mathematicians whom I interviewed agreed that the best way to justify is through peer review. But first of all, one needs to make a comprehensive literature review before one starts working on a problem. As I told you just now, I didn't look at the books initially when I started my phd. but I went through papers. So papers are very specific, you went to library and pick out Mathematical review and you go under number theory. So you just pick out any paper at random on number theory, and just look at that, so that's where you can be confidence and you will fill safe because you are in that area already. I am sure that I have cover all the review, from A-to Z. and you know that you are picking right papers. The lastest publications and what you need to improve. (S5, 30’s, female lecturer) After a thorough review of related literature, one’s work needed to be scrutinized by his/her peers. This was usually done by presenting at conferences or sending for publications in mathematical journals. Application of mathematical knowledge/theories It is interesting to notice that some mathematicians, especially the pure mathematicians seemed not to worry about the immediate application of the mathematical knowledge or theories that they found. As they believed that, A:My thesis is about generalisation of the Van Kampen Theorem, which we call union theorem. Q:What is the application? A:in mathematics ? Maybe in many years to come someone might find application in the real world, in the applied science, but now is still in mathematics. (K3, 50’s, male professor) A : Well, I am talking for myself because I have been doing pure Mathematics. for pure Math like me the application is very lack and of course in my area is purely theory so to made people realize the usage of it is quite difficult. You don't know the result will be consider important or interesting. That's one lecturer asking for what I have been doing in my PhD. I told him that, I am doing something very pure and theoretical, so he said he cannot apply the theory to the real world. I said, well, at this moment, I don't see the application yet. So he said, oh, is that so? I am not interested and I am not really sure. The most important things is I like what's I am doing. I have look into TME, vol. 11, no. 3, p. 626 the quite several Mathematicians work and from there I improve their work. Yes, for myself I am happy with what I am doing. I am very sure that but later on in future may be they may need my theory. I am happy by continuing the works have been done by the Mathematics sometimes ago. Even though some of the lecturers don't really interested with what I am doing because of that purpose, like no application and things like that, who cares? Ha! (S5, 30’s, female lecturer) They were not worried about the immediate application of what they found as that would be the responsibility of applied mathematicians or others users of mathematics such as engineers. Could this be the result of a conflict of interest between the present world view with its emphasis on materialism or instant application/utilitarianism causing pure mathematicians to live in their own world? Yet, this lack of immediate application of the mathematicians’ research should not be taken to imply that mathematicians do not care about the ‘connectivities’ (Burton, 2001) of mathematical knowledge with the real world problems. In fact, as one pure mathematician pointed out that, Mathematics is applicable, except that… when you have a problem here. We use mathematics to solve your problem. But after we solve the problem, the matematics is still alive. We still go on with the research and the research is so fast that we have reached a stage where we cannot apply the result yet. Mathematics goes faster than the practical world. That's why people think mathematics is useless. (S1, 50’s, male associate professor) Thus, it is believed that mathematical knowledge is advancing faster that what is needed in the practical world. Suggestions for improving mathematics education The mathematicians were asked to give some suggestions for improving the current mathematics education in Malaysia. Their suggestions can be grouped under the following aspects: a) School textbooks need to be revised At least three mathematicians whom I interviewed commented that the textbooks used currently in schools need to be revised. One of them voiced his opinion that, Kalau kita baca buku bidang lain, ia ada knowledge. Knowledge created by that katalah buka buku Fizik, buku Sejarah, you baca, ambil baca ada knowledge. Tapi kalau kita buka buku Matematik dari Darjah satu sampai Tingkatan 6, it just simbol and teknik. Dia don't Lim produce any knowledge. That's my impression about mathematics textbooks. (K1, 50’s, male professor) According to him, unlike textbooks in other fields, such as physics or history, where one gains knowledge, in mathematics textbooks from Primary one to 6th Form, one sees just number and techniques. One may not gain any knowledge from reading these textbooks. He also observed that many textbooks have been written with the aim of helping students to pass examinations rather than to gain knowledge in mathematics. Thus, he advocated that there is an urgent need to revise the mathematics textbooks in use now. b) Utilitarian view -- Relevance to real life Some suggested that learning of mathematics should relate to real life application. For example, I can give suggestion like try to make the application side, and make them realize the importance, especially those are more relevant to daily life. That part of mathematics should be taught first, so that they can see the relevance of what they are learning and what they need, for example counting their money. (K7, 30’s, male lecturer) Other echoed that, Relate to real life so that they can open their minds about maths, not just calculating, not number only. (K8, 30’s, female lecturer) This suggestion seems not new as many mathematics teachers and educators alike have advocated it. More importantly, finding the right application of mathematics in real life problems and relating it to the topic taught seem to pose a major challenge to our mathematics teachers today. c) Make it more fun – more colorful, using ICT, games and puzzles Others suggested that mathematics learning should be made more fun and colourful. Indirectly they agreed that mathematics can be dry and boring for many students. TME, vol. 11, no. 3, p. 628 So far when mathematics is concern, it is always black and white. Now there is a process of how to make it colorful. I mean to start it by using a lot of other medium and then the set of example that we give to the students, it cannot be anymore, it have to make a good blend of sea shell and also some computer animated thing, out of it then the blending of this will make it more interesting. Hands on in computing and what ever it is. (M4, 40’s, male associate professor) The idea of using multimedia in teaching mathematics was also supported by another mathematician: One way is by means of multimedia software because of the animation. Some of the things can be taught by multimedia. (M2, 50’s, male associate professor) This is because, as he explained that, Q : Do you think that the animation and all these things will improve their understanding in mathematics or their interest? A : Both their understanding and interest. Because this sort of thinglah can be repeated at any time and as many times as you like, you see. It is not like one to one teaching where teacher may have to explain a few rounds. Then it depends on how creative the software prices is. Eventually, there are good software coming out, to teach all levels not only, even the primary school and so on. I think the potential is tremendous now. Nowaday even the 3D graphic ..... These are used for teaching. (M2,50’s, male associate professor ) Besides the use of multimedia, others suggested adding quizzes and games in the teaching of mathematics. Q : What is your suggestion? A : may be we should put some... I am not sure it is practical or not. Put some graphic. Like we draw some graph, instead of data. At least we tell them from this formula, it can represented in a form of graph. So that they can visualise it. [More concrete form]. And also some quiz and games, so that they feel that mathematics is quite active, they can can take part actively in mathematics classroom. (S3, 30’s, male lecturer) S: Do you think we should promote some of these puzzles in school mathematics ? J: Yes. Some of these are very good puzzles that if you try to solve it, it actually helps to develop the base for problem solving. (M1,50’s, male associate professor) Lim Thus, by introducing mathematical games and puzzles in mathematics classroom, active participation may be promoted as well as developing students’ problem solving skills. d) Mathematics teachers A few of them suggested the need to upgrade the content knowledge and the teaching approaches of mathematics teachers. As they themselves experienced, A : Maybe one of the problems that we are facing today is not having many teachers who are capable in teaching. Q : Teaching at all levels? A : I mean it is not only teaching alone but also to make the students interested in the subject because I know I feel that is so because I also teach some education students who will eventually go to the schools to teach. I feel that their maths already so poor? Q: Their content knowledge? A: Yes. They do not have the ability to do mathematics also, sometimes. You expect them to have the ability to something which they are suppose to teach later, but you find that they can't. That is the worry-lah. So how are you going to teach students if youn yourself are not good. So I think one of the problem is getting good teacherslah! (M5, 30’s, female lecturer) Some had experienced good teaching during their school time, therefore they highly recommended that mathematics teachers needed to be good at mathematical content before they could make learning of mathematics interesting and meaningful for their students. As they believed mathematics might be a difficult subject for many students, thus they believed that it was important for mathematics teachers to help students to make learning easy. One of them recalled that, S: Any suggestions why do you love mathematics so much? J; Well, I did or met ...I think a lot of the teachers who are very good in mathematics. In fact, they have shown that in spite of the apparent difficult of that subject, it can become very easy. I think one in particular has make me curious, you know. (M1,50’s, male associate professor ) A similar suggestion was given by another female mathematician (S5), They should have a very good teacher. They should be able to attract attention of the students. They should be able to influence the students so that they can see the subjects very interesting. I think it is the way how you teach them, and that is the most important thing. As I have experienced that myself. Math teacher out there need to find out how to made the subject more interesting TME, vol. 11, no. 3, p. 630 because children like apply things, like myself, not just memorize the sin, put it in such way which easy to memorize and interesting. It is easier to say than done. (S5, 30’s, female lecturer) Again, these suggestions reflected the significant role of mathematics teachers in mathematics teaching and learning which was very much recognised and appreciated by these mathematicians. e) Hard work and practice The majority of the mathematicians in this study viewed mathematics as a difficult but challenging subject; perhaps it is therefore not surprising that they stressed the importance of drill and practice as well as the understanding of mathematical concepts. I mean mathematics is like ... exercising-lah, you must do a lot of practice constantly and consistently. No practice, not enough practice is like I mean going into the ring without any preparation. You need a lot of practice. First thing you must know the concepts, master the concepts first. After you give the concepts, some examples, we give some exercises, they don't know how to start. The first thing, we must understand the concept, what is a group? And then understand the examples and then do a lot of practice. And then there is no problem in mastering it. (K3, 50’s, male professor) Likewise, another mathematician also agreed that, Q: How about to excel? How to promote the student can be better achievement in maths? A: I think must be hardworking and understand the theory. And then, you must practice, you can't do anything without practice. If you can't practice much, at least you must read as many questions and start to think how to tackle the problem. Q: Is it must be quite flexible in thinking because you said manipulate. A: yes, How to play around with the facts given, the hypothesis, you know, but of course they must be foundation to what they do. (K5, 50’s, female associate professor) Mathematics is a doing subject, you need to work on it. (M10, 50’s, female associate professor) Lim In brief, to excel to mathematics means to strive a balance between concept understanding and ‘drill and practice’. A students needs to master the basic concepts and then a variety of practices to enhance the skills as well as the understanding. Conclusion and Implications Summary of findings This study aims to explore a sample of 25 Malaysian mathematicians’ way of knowing. It focuses on the following four aspects: a) their experiences of learning mathematics in schools and universities b) their images of mathematics, mathematics learning and mathematicians c) their experiences of working as mathematicians d) a comparison between Malaysian and British mathematicians’ way of knowing An analysis of the data shows that not every mathematician whom I interviewed had positive experiences of mathematics learning since young. In fact, at least three out of the 25 mathematicians had negative experiences because they found themselves weak and disappointing in learning mathematics. Not all of them excelled or were interested in mathematics since primary schools, but they managed to pick up, usually at upper secondary. It was often due to either an inspiring mathematics teacher or a successful experience of problem solving. In fact, some mathematicians can still recalled vividly their experiences of mathematics learning in schools. Some can still remember their teachers’ name though after ten or twenty years. This finding confirms the significant role of mathematics teachers in a student’ experience of mathematics learning as documented in literature (see Lim, 2001; Brown, 1992; Fennema, Peterson, Carpenter, & Lubinski, 1990). Besides mathematics teachers, many of them also acknowledged the important role of family support and peer influence. The majority of the mathematicians in this study have postgraduate experience overseas, either in United Kingdom, United States of America or Australia. This cross cultural experiences seemed to have influenced their worldview about the culture of learning and research in mathematics. In particular, their experiences of being supervised as ‘independent learners’ have, to some extent, influence the way they supervise their TME, vol. 11, no. 3, p. 632 students now. Many of them tried to adopt or adapt their experiences of being supervised to the supervision of their present students. However, some of them met with ‘cultural conflict’ as they found many local students are too dependence on supervisors or prefer to be ‘spoon feed’. Mathematics was viewed by the mathematicians in this study as not just manipulation of numbers and symbols, but a way of thinking and a way of understanding the world. Consequently, these mathematicians perceived the beauty of mathematics as closely related to the process of thinking and solving mathematical problems. They seemed to hold the belief that mathematics is best learnt through a lot of drill and practice with a variety of problems. For many of them, school mathematics is perceived as a subject that does not require much memorization as compared to other science subjects such as Biology and Chemistry. In fact, these mathematicians believed that solving mathematical problems needs intuitive thinking and gaining insight through deep involvement. This is an interesting finding because these mathematicians’ images of mathematics and mathematics learning are very much different from those espoused by the school students and prospective mathematics teachers (as found by Kalsom and Lim, 2001). Many Malaysian students and prospective mathematics teachers tended to hold an utilitarian view (41%) or a symbolic view (26%) of mathematics. Consequently they tended to learn mathematics by memorizing formulae and procedures. As a result, many students found mathematics learning boring and dislike the subject. Does this imply that there is a need to change our students’ images of mathematics and mathematics learning experience in schools? Although ‘intuition’ and ‘insight’ were not asked deliberately in the interviews, at least five of the mathematicians in this study brought out the importance of intuition in mathematicians’ work and research. They suggested that an intuitive way of thinking is very important and it should be inculcated in the teaching and learning of mathematics in schools. In this study, the participants’s images of mathematicians were heterogenous. The pure mathematicians seemed to set stricter criteria for being a mathematician than the applied mathematicians. The pure mathematicians tended to believe that it was vital for a mathematician to contribute new knowledge or to do pioneer work in mathematical Lim research. However, the applied mathematicians especially the younger ones seemed to be reliant and held a broader definition of mathematician. From the interviews, I noticed that the culture of research and publication was still not pervasive among most Malaysian mathematicians whom I interviewed. Perhaps this was due to three possible factors. First, there was generally a lack of research grant, especially for pure mathematics research. Second, due to the wide differences in specialisation, especially the pure mathematicians, tended to research individually or collaborate with their supervised students only. Third, some mathematicians seemed to be so “complacent” with their present positions that there was generally a lack of research culture and collaborative efforts among them. However, the applied mathematicians seemed to acquire research funding much easier than their pure mathematics colleagues. This is because the former could collaborate with their colleagues in applied sciences, such as medicine and technology. Thus, in comparison with what was reported by Burton (1999a, 1999b and 2001), there seemed to be more similarities than differences among the British and Malaysian mathematicians’ way of knowing. These similarities include: (i) mathematicians’s images of mathematics and mathematics learning; (ii) the perceived beauty of mathematics and the importance of intuition in solving mathematical problems; (iii) the categorisation of mathematicians into pure, applied and statisticians; and (iv) mathematicians’ justification of mathematical knowledge and its connectivities with real life applications. Nonetheless, one considerable difference was the relatively less collaborative project among the Malaysian mathematicians as compared to their British counterparts. This situation applied most to the pure mathematicians of Malaysian who tended to do individual research. However, with the recent increase in research funding and promotion of internationalisation policy for all universities, it is hope that there will also be a shift of this individualistic culture to a more collaborative culture of research and publication for Malaysian mathematicians. Perhaps these findings of similarities are not surprises as most Malaysian mathematicians had their postgraduate experiences in the United Kingdom, United States of America or Australia. Moreover, Malaysian education system has great resemblance with the British system due to the historical ties. It is very likely that there is a transfer of TME, vol. 11, no. 3, p. 634 culture from the west to the East. However, Since 1997, as a result of the economic downturn of Malaysia, the Malaysian Ministry of Education has limit the number of students sending to study overseas. This possibly mean that the next generation of Malaysian mathematicians may not have similar academic background as the present ones. Will the above scenerio change in the next decade then?Or is there a universal culture in mathematicians’ way of knowing? Implications to mathematics education From the data, it is apparent that there exist differences between mathematics learning in schools and mathematicians’ way of knowing. As noted by Burton (2001) that mathematicians “are engaged on a creative endeavour which demands a very different epistemological stance from the one which pervades the teaching and learning of mathematics”(p. 595) in schools. Therefore, if we are to encourage our students to learn mathematics and to be interested in mathematics, then perhaps we should adopt or adapt the model of learning and researching in mathematics of these mathematicians into our school model of mathematics teaching and learning. More specifically, some implications to pedagogical changes in schools are discussed in the following section. (a) the notion of ‘mathematics may be difficult but challenging’ Analysis of the data indicates that although the majority of mathematicians interviewed found mathematics not difficult for them, it is not too easy either. One needs to work hard, to do a lot of drill and practice, to learn it step by step. There is rarely ‘mathematics without tears’. According to some of them, the fun and beautiful part of mathematics comes from the experience of successful solving mathematical problems. The fun, easy and game-like mathematics only apply in elementary levels. When one comes to higher level mathematics, one needs to build up strong foundations and to keep an open mind. Thus, the most pertinent part is to take the difficulty as challenges and keep working on it, the reward and satisfaction will follow then. This finding is not unique as it coincides with a study by Lim (1999) on a sample of British public members about their images of mathematics. She found that among those who espoused liking mathematics, especially mathematics teachers and mathematicians, Lim most of them held a problem solving view of mathematics. They viewed the difficulty of mathematics as a challenge and they felt rewarded and satisfied when they managed to find solutions to mathematical problems. Therefore, the message to be conveyed to our school students is that the fun part of learning mathematics lies in the process of doing and exploring mathematics. Merely emphasising the procedural and utilitarian importance of mathematics may not be enough to sustain students’ interest in mathematics. This implies that students should be encouraged to investigate, analyse and solve mathematical problems and justify the solutions by themselves. Perhaps this can be done through activities such as open problem strategy (Nohda, 2000); investigation projects, daily life problems or mathematical quizes and games. In this way, students will not only learn to apply whatever mathematical concepts and skills that they have learnt, but also build up their self confidence and interest in mathematics. (b) inculcation of intuition and insight In view of the importance of intuition and insight in mathematicians’ practices, perhaps this is another thing to be pursued or looked into by our teachers and students alike. Yet, Burton (1999b) pointed out that very little mathematics education literature has accounted the nurture of intuition and insight in school mathematics teaching and learning. Why is this so? One possible reason is the expectation that mathematics is infallible (Hersh, 1998). Consequently, students are expected to learn from the basics and to acquire ‘absolute’ mathematical knowledge. This clearly does not encourage intuitive way of learning. However, Hersh (1998) argued that every one of us is capable of doing intuitive thinking “because we have mental representation of mathematical objects. We acquired these representations, not mainly by memorizing formulas, but by repeated experiences” (p. 65). For examples, on the elementary level, students can experience manipulating physical objects while on the advanced level; students can experience doing problems and discovering things for themselves. Therefore, one pedagogical implication is that if we aim at promoting intuitive and creative mathematics learning in school mathematics, then we must allow students to explore and discover mathematical solution by TME, vol. 11, no. 3, p. 636 themselves. School mathematics learning must be provided with activities that demand students to argue, to control and to justify by themselves. Moreover, the image of mathematical knowledge as infallible may have to be changed. (c) the significant role of mathematics teachers and teaching approaches The fact that some mathematicians in this study can still vividly remember their teachers’ name and their experiences of mathematics learning in schools implies the significant role of mathematics teachers in a student’s life. The story of how two mathematicians who were very weak at mathematics when they were students but they managed to become mathematicians later should be used as inspiring examples for our mathematics students and prospective mathematics teachers in schools. The first one was inspired by his mathematics teacher’s teaching approach which was ‘something different from the traditional way, we were no more just applying formula. Now we have to use our brains to think” (S1). This new approach has not only changed his image about mathematics but also gain him a lot of self confidence. As he acclaimed that ‘And then I'm so proud because I can understand it and I can answer the questions whereas my peers cannot. Something that made me feel I am so proud about myself. Suddenly I feel oh! I'm good at mathematics. I can do it”. (S1). This feeling of success was also experienced by the second mathematician and that inspired him to become a mathematician now. This finding reflects the crucial role of mathematics teacher, hard work and successful experience of mathematics learning that can boost the interest and confidence of students towards learning mathematics. Therefore, how can we, as mathematics teachers, strike to provide our students innovative teaching approaches that can boost up their interest in mathematics? More important, how can we provide students with the successful experience of learning mathematics that will sustain their interest and inspire them to go further? On the other hand, perhaps this finding could also boost up the morale of mathematics teachers today. In view of the declining in respect to teachers and heavy word load in schools, there seemed to have an increasing number of teachers losing their morale and interest in teaching. Indeed, a teacher who is disappointed with the negative attitudes of his/her pupils, may not strive to work hard and teach well. As a result, his/her Lim stundents may not show much respect towards the teacher and consequently less interest in his/her teaching. This is a vicious cycle of cause and effect. Therefore, findings of this study should be served as a motivator or stimulus for our mathematics teachers in schools that they are still being respected and well remembered by their inspired students. (d) the enculturation of collaboration and research culture In comparison with what was reported by Burton (1999a, 1999b and 2001), there seems a lack of collaboration and research culture among the Malaysian mathematicians. Apart from the constraint of specialisation and limited research funding, perhaps the crucial point is that there seems a lack of conducive environment that promote academic discussion, intellectual discourse or exchange of ideas among the local mathematicians in most universities. One plausible solution could be the setting up of the culture of ‘coffee break’which provides a common time and space for academic discourse. This was a common practice in many leading western universities, such as Princeton University (as described in the biography of the Nobel prize winner mathematician, John Nash by Nasar, 2001), as well as mentioned by one of the professor (K2) in this study. In view of the advantage of collaboration in advancement of knowledge and research, as pointed by mathematicians participants of Burton (1999), perhaps it is time for Malaysian mathematicians to strive a shift of individualistic culture to a culture of collaboration. Suggestion for further research Participants in this study only included experienced mathematicians, perhaps further research could focus on mathematics postgraduate students. Similar methodology can be used to find out how they are being encultured into the mathematician world. The experience of transition may provide practical hints and cue to upgrade the mathematics learning in schools. Conclusion This study is, albeit exploratory, gives a glimpse of how Malaysian mathematicians come to know, learn and think of mathematics. To the best of my knowledge, this study TME, vol. 11, no. 3, p. 638 contributes to be the first study about the work practice of Malaysian mathematicians. The findings have provided some pedagogical implications and recommendations as discussed above, which I hope will be helpful in improving the present mathematics learning in schools. On the whole, this study points to the importance of promoting a problem solving view of mathematics rather than a symbolic view among present mathematics students. This means changing the model of mathematics teaching approach to a more open, explorative and which encourages intuitive thinking and reasoning. Mathematical activities provided by schools should allow students to gain a better insight of mathematics as well as appreciate the beauty of mathematics. Moreover, students could be encouraged to acknowledge the notion of ‘difficulty’ of mathematics and take it as a challenge rather than as an obstacle to mathematics learning. Acknowledgement This study was made possible with the funding from the short term grant provided by Universiti Sains Malaysia, Penang, Malaysia. Lim References Brown, L. (1992). The influence of teachers on children’s images of mathematics. For the Learning of Mathematics, 12(2), 29-33. Burton, L. (1999a) The practices of mathematicians: What do they tell us about coming to know mathematics? Educational Studies in Mathematics, 37, 121-143. Burton, L. (1999b). Why is intuition so important to mathematicians but missing from mathematics education? For the learning of mathematics, 19(3), 27-32. Burton, L. (2001). Research mathematicians as learners – and what mathematics education can learn from them. British Educational Research Journal, 27(5), 589599. Cassidy, Sarah (2002). Teacher shortages linked to pass rate fall. Times Educational supplement (September 4. 1998). [taken from news and opinion]. http://www. tes.co.uk/ Elliott, J., Hufton, N., Hildreth, A., & Illushin, L. (1999). Factors influencing educational motivation: A study of attitudes, expectations and behaviour of children in Sunderland, Kentucky and St Petersburg. British Educational Research Journal, 25(1), 75-94. Fennema, E., Peterson, P. L., Carpenter, T. P., & Lubinski, C. A. (1990). Teachers' attributions and beliefs about girls, boys and mathematics. Educational Studies in Mathematics, 21(1), 55-69. Gipps, C., & Tunstall, P. (1998). Effort, ability and the teacher: young children's explanation for success and failure. Oxford Review of Education, 24, 149-165. Grigutsch, S. & Törner, G. (1998). World views of mathematics held by university teachers of mathematics science. Gesamthochschule, Duisburg: Gerhard Mercator Universitat. Gutbezahl, J. (1995). How Negative Expectancies and Attitudes Undermine Females' Math Confidence and Performance: A Review of the Literature. Abstract in ERIC documents. ED380279. <http://www.bids.ac.uk/ovidweb/ovidweb.cgi> Hayes, Dominic (2002). Teacher shortages hamper maths. Times Educational supplement (January 23, 2002). [taken from breaking news]. http://www.tes.co.uk/ Hersh, R. (1998). What is mathematics, really? London: Vintage. Kalsom Saidin & Lim Chap Sam (2001). Apa itu mathematik? Pandangan bakal guru matematik dan pelajar terhadap matematik. Paper presented at International Conference on Teacher Education, 16-17 July 2001, UiTM, Malaysia. Leung, F.K. S. (2001). In search of an East Asian identity in mathematics education. Educational Studies in Mathematics, 47, 35-51. Lim Chap Sam (1999). Public Images of mathematics. Unpublished PhD thesis. University of Exeter, United Kingdom. Lim Chap Sam (2001) Teachers' influence on adult's images of mathematics. Jurnal Pendidik dan Pendidikan, 17, 57-67. Pulau Pinang: PPIP, USM. Ma, X., & Kishor, N. (1997). Assessing the relationships between attitude toward mathematics and achievement in mathematics: A meta-analysis. Journal for Research in Mathematics Education, 28(1), 26-47. Nasar, S. (2001). A beautiful mind: A biography of John Forbes Nash, Jr. USA: Faber & Faber. TME, vol. 11, no. 3, p. 640 Nohda, N. (2000). Teaching by open-approach method in Japanese mathematics classroom. Dalam Proceedings of the 24th International Conference of Psychology of Mathematics Education (PME) 23-27 Julai 2000, Hiroshima, Jepun.(Volume 1, pp.39-51). Rabusicova, M. (1995). Influence of the family on educational achievement. Oxford Studies in Comparative Education, 5(1), 125-133. Richards, L. (2000). Using N5 in qualitative research. Australia:QSR International Pty Ltd. Vanayan, M., White, N., Yuen, P., & Teper, M. (1997). Beliefs and attitudes toward mathematics among third- and fifth-grade students: A descriptive study. School Science and Mathematics, 97(7), 345-351. Wong Khoon Yong (1996). Assessing Perceptions using student drawings. In M. Quigley, P. K. Veloo, & K. Y. Wong (Eds.), Assessment and Evaluation in Science and Mathematics Education: Innovative approaches. Proceedings of a seminar organized by the Department of Science and Mathematics Education, Universiti Brunei Darussalam. Lim Appendix A: interview questions (English language) The questions below are meant to give direction if we need it but not to be a requirement of how our conversation must develop. About you 1. Can we chart the historical trajectory of your becoming a mathematician? -- What’s your experience of learning mathematics in primary and secondary school? -- When did you start to get interested in mathematics? 2. Can you briefly describe your undergraduate or postgraduate experiences of coming to know mathematics? -- How do you come to your choice of PhD topic? -- Whose/what influences? 3. How would you describe your experiences of research supervision and yourself as a supervisor of research students? -- your experience of supervisors -- how these experiences influence (or not) your supervision of your students? 4. Of which mathematical community would you claim membership? Is that membership important and in what ways? -- If you go to a conference, which one do you normally go to? -- At the conference, which community do you associate yourself to? 5. Do you have experience of collaborating on any research projects? Will you describe that experience and say what you have learnt from it or explain why you think collaboration is helpful (or not helpful) to you? About how you come to know mathematics 1. What do you now believe mathematics is? -- how do you explain what is “mathematics”? 2. Who are the mathematicians? -- how do you define them? TME, vol. 11, no. 3, p. 642 3. When you are acting as a mathematician, can you explain what you do, what choices you have, what leads you to make one choice rather than another? -- Just think about a problem that you are working now, can you explain what you do? -- How many problems do you work at the same time? Where do you think about your problems – in the office, the bath, walking…? Are these problems all of the same style? -- Where do you find the problems on which you work and what makes them something which engages you? 4. Do you always know when you have come to know something new? How? Have you been justified/unjustified in this confidence? -- “I was told that mathematicians often think they have reached the resolution of a problem, but later they find out that they were wrong” What do you think? -- so, how do you know “when you know”? 5. Do you know whether a result will be considered important, interesting or rejected by your community? --When do you decide to send a paper for review or publication? --What is the criteria for publication? What makes a paper publishable? --Do you share their criteria? What are they? About mathematics education 1. What are your suggestions for getting our secondary students to be interested and excel in mathematics ? TME, vol. 11, no. 3, p. 643 Numerically Integrating Irregularly-spaced (x, y) Data B. Cameron Reed 1 Department of Physics Alma College Abstract: This article describes a computer program for numerically integrating under a y(x) curve of experimental data where the abscissa values are not equally-spaced. This technique is based on fitting parabolas to successive groups of three data points, and may be regarded as a generalization of Simpson’s rule. Keywords: integration; Simpson’s rule; numerical integration 1. Introduction A survey of basic techniques of numerical integration is a common element of college-level calculus classes. Virtually all such students can expect to be exposed to the Trapezoidal rule and the somewhat more accurate Simpson’s rule, both of which are specific cases of a broader class of techniques known as Newton-Cotes formulas (Press, et al., 1986) More advanced students may encounter more sophisticated techniques such as Gaussian quadrature. Most textbook examples of these techniques utilize data points that are equally-spaced in the abscissa coordinate. This is not a fundamental requirement, but has the advantage that very compact expressions can be developed for the integral in such cases; a paper previously published in this journal describes how to program such routines into a spreadsheet (El-Gebeily & Yushau, 2007). In many experimental circumstances, however, the (x,y) values are not equally 1 [email protected] The Mathematics Enthusiast, ISSN 1551-3440, vol. 11, no. 3, pp. 643-648 2014© The Author(s) & Dept. of Mathematical Sciences-The University of Montana Reed spaced in x. How then can you estimate the area under a “graphical” y(x) curve? Surprisingly, textbooks tend to be silent on this very practical issue. For readers familiar with more advanced numerical methods, one tactic might be to apply an interpolation scheme such as a cubic spline fit. Aside from the issue that such techniques are usually directed more at determining values of the dependent variable at specified values of the independent variable, they demand knowledge of the values of the derivatives of y(x) at the end points of the data - information unlikely to be known in an experimental circumstance. While the simplest approach to determining the desired integral would be a trapezoidal or “picket fence” - type summation, such a procedure would be aesthetically unsatisfying: physical phenomena are not normally discontinuous. Any sensible approach needs to incorporate some “smoothing,” presumably based on some sort of interpolation. The purpose of this article is to offer an easy-to-use scheme for dealing with such circumstances. The essence of the method, which is an extension of Simpson’s rule, is to fit a series of parabolic segments to groups of three successive data points and accumulate the areas under the segments. Before describing the details of the computation, there is a philosophical issue here that deserves some discussion. This is that if an N-th order polynomial can always be fit exactly through N points, why not build the method to fit higher-order polynomial segments to the data? The answer offered here is that “simplest is best.” If there is no model equation for the data, then there is no justification for using a polynomial of any specific order, or, for that matter, any particular function at all on which to base computing the integral. Quadratic segments are the lowest-order ones which allow one to build in some “curvature” to the run of y(x). Simpson’s TME, vol. 11, no. 3, p. 645 rule is based on fitting parabolic segments to the often presumed equally-spaced data points, so the method developed here can be considered an extension of this time-honored technique. 2. The Integration Method y (x1, y1) * (x2, y2) * * (x3, y3) x Figure 1. Sketch of a parabolic-segment curve fitted through three successive data points. The curve lies atop two vertically-oriented area segments. As sketched in Figure 1, consider three successive (x ,y) points in your data table; call them (x1, y1), (x2, y2), and (x3, y3). It is assumed that your data are ordered in terms of monotonically increasing or decreasing values of x, and do not include any “degenerate” points, that is, there can be no duplicate values of x. A unique interpolating parabola can always be fit through three non-vertical points in a plane: , (1) Reed where the coefficients are given by inverting a 3 by 3 matrix: . (2) The area under the three-point parabolic segment is then given by . (3) The basis of the present routine is to accumulate such parabolically-defined areas from one end of the data domain to the other. After processing the segment defined by points (x1, y1), (x2, y2), and (x3, y3), the program moves on to the next group of three points, (x3, y3), (x4, y4), and (x5, y5), and continues until the entire domain has been fit and integrated over. No model equation for the data is necessary, and the abscissa values of the data points do not need to be equally spaced. If the number of data points N is odd, the entire domain of the data can be fit with segments as in Figure 1 with no remaining unaccounted vertical slices. If on the other hand N is even, one last orphan vertical slice will always remain. In the case of N even, the program developed here fits a parabolic segment to the last three points in the data series and computes the area of the orphan slice using Eq. (3) with limits xN-1 and xN. A FORTRAN subroutine, AREA, has been developed to carry out this computation. This routine could easily be translated into another language and is available upon e-mail request to TME, vol. 11, no. 3, p. 647 the author; it is also publicly available at the author’s institutional website at <https://mail.alma.edu/home/[email protected]/Briefcase/AREA.f>. The call statement for AREA involves five arguments: AREA(X, Y, N, PAR, INTEG) The user supplies the column arrays X and Y, and the number of points N (maximum = 50,000). As a check, the routine returns the parity (PAR) of N (+1 if even, -1 if odd). The value of the integral is returned in INTEG. Be sure to declare X, Y, and INTEG as double-precision, and PAR and N as integers. Given the matrix inversions involved, this scheme not easily programmed with a spreadsheet. How well does AREA perform in practice? As an example, consider the integral . This function is shown in Figure 2. Figure 2. Exponential-sine function of Equation (4). (4) Reed This integral can be solved analytically, and evaluates to 0.230773. I used a random-number generator to produce N = 101 values of x between zero and five, sorted them to be in order of increasing x, computed corresponding y-values, and then ran the resulting data through AREA. The result was 0.229449, about 0.6% low. I have applied AREA to large data sets (N ~ 44,000) of nuclear-reaction cross-section values where y(x) can be extremely variable, and routinely obtain agreement within 1% values listed on research-level websites. AREA thus appears to be quite accurate even when rapidly-varying data are involved. I hope that students and researchers who occasionally need to compute such data-based integrals but who do not wish to become submerged in the minutiae of numerical analysis will find AREA a useful tool. As always, caveat emptor: no guarantee is offered as to how the routine will perform for extremely rapidly-varying or poorly-sampled data. But for routine cases of “well-behaved” data, it should prove entirely adequate. Acknowledgement I am grateful to Mel Nyman for comments on curve fitting. References El-Gebeily, M. & B. Yushau, (2007) Numerical Methods with MS Excel. TMME 4(1), 84-92 (2007) Press, W. H., Flannery, B. P., Teukolsky, S. A. & Vetterling, W. T. (1986). Numerical Recipes: The Art of Scientific Computing. Cambridge: Cambridge University Press. TME, vol. 11, no. 3, p. 649 Math as a Tool of Anti-Semitism Jay Egenhoff University of Montana ABSTRACT: At Moscow State University’s Department of Mathematics during the 1970’s and 1980’s, there was rampant discrimination against Jewish and other unwanted students. The professors at the math department made a strong effort to keep Jewish students out of the department. They designed "killer" or "coffin" problems and Jewish students had to answer them during an oral exam. These problems have simple solutions, but require a clever strategy to solve them. This paper explores some of the context of this episode and provides several problems with detailed solutions. Keywords: Education, Coffin Problems, Entrance Exam, Soviet, Discrimination The Mathematics Enthusiast, ISSN 1551-3440, vol. 11, no. 3, pp. 649-664 c 2014The Author(s) & Dept. of Mathematical Sciences-The University of Montana Egenhoff, p. 650 A Brief History of Anti-Semitism in The Soviet Union Antisemitism has a long history in Russia. Tensions over immigrating Jewish populations date back to the 11th and 12th centuries when Jews expelled from Western Europe settled in the area that is today’s Ukraine (Saul, 1999). Institutionalized discrimination dates back to the early czars of Imperial Russia, when the state encouraged anti-Semitic policies during a time of Eastern Orthodox zeal, attempting to impose the Russian national identity across the empire (Rambaud, 1898). In this time period, there were several brutal pogroms in what is now Ukraine. The state discrimination continued with more restrictive policies. This had the effect of radicalizing Jewish populations who joined the ranks of the revolutionaries. There was a brief period after the Bolshevik Revolution, when the situation seemed to have improved. Discriminatory laws were redacted and revolutionaries aimed for a society of equality. Lenin himself campaigned to try and discourage antisemitism (Vershik, 1994). These progressive ideals laid down by the leaders of the revolution have survived, and the current Russian government maintains that discrimination based on ethnicity is illegal. But just as racism remains here in America half a century after the civil rights movement, antisemitism is alive and well today in the former soviet republics. While I studied abroad in Kyrgyzstan and traveled through former Soviet Republics and Russia, the topic of Jews came up with regularity in conversations with people across generations and ethnicities. People often ask me if I am Jewish both at home and abroad. People say that I just “look Jewish” whatever that means. The difference is that in the former Soviet Republics the people inquiring would not try to hide their relief when I informed them that I am in fact not Jewish. Several different people I met in my travels have voiced their mistrust of Jews in general. The stereotype that I heard most often was that Jews are too clever, too smart, and control exclusive organizations. It is a kind of irony then, that the bigots in the math department of Moscow State University employed these clever and sneaky math problems to exclude the unwanted Jewish students from their math department. Entrance Exam Procedure The general procedure for admission to a Soviet university consisted of a written and oral test. The written portion of the entrance exam consisted of a few simple problems to test computational accuracy and one or two more challenging questions in order to test mathematical knowledge. Shen(1994) notes that only perfect papers were counted and allowed to advance and there is evidence of either discrimination or incompetence on the part of the examiners at the written level. For example, the answer to one particular question was "x = 1 or x = 2", a student wrote "x = 1; 2 and that answer was marked TME, vol. 11, no. 3, p. 651 wrong (Kanevskii, 1980). If a student passed the written exam, they then had to pass the oral exam. The concept of an oral exam is unfamiliar here in America, but it is a mainstay in the Russian education system. Students walk into the room and take a piece of paper from a pile at the front of the classroom. This piece of paper has two questions on it and is called the bilyet or ticket. The students are given some time to prepare their answers with only paper and pencil. When a student has an answer, they raise their had and an examiner comes by to check the solutions. Then the examiner asks one follow up question, evaluates the solutions, and dismisses the student(Frenkel, 2013). These exams, however, were different for a Jewish student. The oral exam could last as long as five and a half hours in one case (Kanevskii, 1980). Students were given follow up problems one after another until they failed one of them, at which point there were given a failing grade (Kanevskii, 1980). Sometimes they were dismissed on a minute technicality. There is an account of one student being asked by the examiner ”What is the definition of a circle?” The student’s answer was ”It is the set of points in a plane, equidistant from a fixed point” The student was informed that this was an incorrect answer, the correct answer is "the set of all points in a plane, equidistant from a fixed point" and the student failed the test (Saul, 1999). Now this is only one example, but there are many stories of similar instances of ridiculous, often times pedantic reasons for dismissal. These stories began to accumulate, and it became blatantly obvious that an effort was being made to make it difficult for some students in particular. Predominately it was Jewish students who received this inhumane treatment. The discrimination was not just a form of prejudice on the part of the examiners, it was well known in the university. Frenkel(2013) recalls trying to schedule the exam and being advised not to waste his time by a secretary. His mathematics credentials were impressive for a boy of 16 years, and yet before he even entered the examination room, he was encountering obstacles purely on the basis of his Jewish heritage. However, Frenkel calculated that he had nothing to lose by attempting the entrance exam, and so ignored the secretary’s warnings. Once in the examination room, Frenkel took his ticket and set to solving the problems. Upon completion he raised his hand, but was ignored by the examiners. After the examiners attended to several other students, Frenkel finally asked one directly why they were not reviewing his solutions. The examiner answered that he was not allowed to talk to Frenkel. Eventually, two older professors entered and began to cross-examine Frenkel’s solutions. Frenkel says that other the examiners had been pleasant and supportive, but these two professors were aggressive and pedantic. They looked for the smallest mistakes in Frenkel’s solutions. They demanded precise definitions of everything along the way, from the definition of the mentioned above, to the Egenhoff, p. 652 definition of a line. This lasted for an hour and a half. After this harsh treatment, they administered the follow up question. Frenkel does not relate the exact problem in his book, but he mentions that the solution required the Strum Principle which is not studied in high school, however, Frenkel knew of this through his extracurricular study of mathematics. When the examiner saw that Frenkel was approaching a solution to the problem, he was interrupted and given another problem which was harder still. After a while, Frenkel worked out a strategy for solving the problem. Once it became apparent that he could solve the problem, the examiners interrupted with yet another killer problem. Four hours into this hostile exam, Frenkel surrendered to the inevitable and withdrew his application. This particular example of the type of hostile atmosphere a Jewish student faced during entrance exams is not exceptional. "It should be noted that there is absolutely no controversy about whether this discrimination actually took place." (Vardi, 2000) Khovanova(2011) echoes this sentiment in the introduction to her paper. The work of Kanevskii(1980), Vershik(1994), Shen(1994), and Saul(1999) all corroborate that claim. Antisemitism at the math department "was accepted as a fact of life"(Vardi, 2000) which is supported by Frenkel’s account of being dissuaded by the secretary. The only controversy I was able to find was a letter in response to an article by Kolata(1978), which appeared in Science, entitled: Anti-Semitism Alleged in Soviet Mathematics . The article mentions some of the cases of antisemitism connected with oral exams, but the main focus is a man named Pontrygin and his connection to antisemitic plots. In the article, Pontrygin is mentioned several times as implementing antisemitic policies, and in particular, working to deny an exit visa to a Jewish Soviet Mathematician named Gregory Margoulis who had won a Fields metal. Pontryagin replies in a letter to Science in 1979. He denies, point by point, his alleged involvement in antisemitic policies and denies that he has the power to influence such policies. Ponyargin(1979) also denies that he himself is antisemitic. What speaks louder, though, is that he does not deny the existence of antisemitism in the Soviet system, just his own involvement. He does not even touch on the allegations of discrimination as part of the oral exams. In his article, Vershik(1994) calls out the people who actively participated in this discrimination as well as those who witnessed it but did nothing. It is important to note that this took place during a time of fear and control in the Soviet Union, so it is understandable for concerned witnesses to adhere to a doctrine of caution. That is not to say that nothing was done. Several students who were allowed to attend Moscow State University knew of the discrimination. They organized to bring some of the classes to the Jewish students in the form of lecture notes. This became known as "The Jewish University." The idea was admirable, but most students who were denied access to the Moscow State Math Department decided to attend The Institute for Petrochemical and Natural Gas Industry TME, vol. 11, no. 3, p. 653 or Kerosinka which offered higher mathematics classes.(Saul, 1999). These solutions to the problem do not satisfy Vershik. He believes that the story of injustice must be told and the perpetrators reproached so that we learn to recognize and prevent this kind of discrimination in the future. Selected Problems On top of the strategies mentioned above, the examiners also chose carefully designed problems to give to the undesirable students. These questions were generally chosen to be difficult, yet appear solvable. Over the intervening years since the height of the discrimination at Moscow State University, several people have worked to compile and solve a list of the "killer’ or "coffin" problems. In the following section are a number of "killer problems" which I have selected from the works of Khovanova and Radul (2011) and Vardi (2000). Between the two papers there are 44 enumerated problems with complete solutions. The solutions presented here have been abridged in order to make the paper more approachable. The purpose of these examples is to demonstrate the difficulty of these problems so that the reader can appreciate the unreasonable nature of these problems. For more complete and technical solutions, refer to the works of Khovanova and Radul (2011) and Vardi (2000). Notice the elementary solutions of these problems. This is by design, if an administrator, or outside party were to inquire about the fairness of the questions, the examiner could point to the simple answer as if to say: “The answer is 3/5, how hard could the question be?” This false logic is nonetheless convincing to someone who is not comfortable with mathematics and does not want to admit to their ignorance. These questions are difficult, and even someone with a solid foundation in mathematics would need some strokes of insight in order to solve them. These are not reasonable questions for an oral exam, and keep in mind that many times that examiners continued to give the students questions until they got one wrong (Khovanova, 2011). Question 1 (Khovanova, 2011) What is larger, log2 3 or log3 5? Notes It can be difficult to comprehend logarithms of different bases and this inequality is by no means apparent. So Khovanova and Radul came up with a strategy to rephrase these logarithms in simpler terms by comparing each in turn to 3/2. This is by no means an obvious or intuitive move. Solution Consider the base of the original logarithm to the power of the original logarithm and that quantity squared. (2log2 3 )2 = 32 = 9 > 8 = 23 = (23/2 )2 and Egenhoff, p. 654 (3log3 5 )2 = 52 = 25 < 27 = 33 = (33/2 )2 Then notice that: (2log2 3 )2 > (23/2 )2 and (3log3 5 )2 < (33/2 )2 Implies: log2 3 > 3/2 and log3 5 < 3/2 Therefore: log2 3 > log3 5 Question 2 (Khovanova, 2011) Solve the following inequality for all positive x √ √ √ √ x(8 1 − x + 1 + x) ≤ 11 1 + x − 16 1 − x Notes This question relies on a substitution which is perhaps more straight forward, but to reach the solution requires several stages in which one could easily make a mistake. Solution First, notice that x ≤ 1, otherwise the square roots become undefined. Now, multiply both sides of the inequality by √ √1+x 1+x √ √ √ √ x(8 1 − x + 1 + x) ≤ 11 1 + x − 16 1 − x √ √ x(8 √1−x + 1) ≤ 11 − 16 √1−x 1+x 1+x Then define: y= √ √1−x 1+x and x = 1−y 2 1+y 2 Notice that for our values of x, then 0 ≤ y ≤ 1. This yields the following: (1 − −8y 3 − 1−y 2 (8y + 1) ≤ 11 − 16y 1+y 2 2 y )(8y + 1) ≤ (1 + y 2 )(11 − y2 + 8y + 1 ≤ −16y 3 + 11y 2 16y) − 16y + 11 −8y 3 + 12y 2 − 24y + 10 ≤ 0 (2y − 1)(−4y 2 + 4y − 10) ≤ 0 TME, vol. 11, no. 3, p. 655 (−4y 2 + 4y − 10) is always negative for our values of y, so the inequality simplifies to: (2y − 1) ≤ 0 By the earlier definition y = √ √1−x , 1+x the left hand side of the inequality can be rewritten as: 1−(1/2)2 1+(1/2)2 And the final answer is simply: 3 5 = 3 5 ≤x≤1 Question 3 (Khovanova, 2011) Prove that sin 10◦ is irrational. Notes This problem involves some standard trigonometry, but the difficulty lies in recognizing that sin(10◦ + 20◦ ) = sin 30◦ = 1/2 and working backwards from there. Solution Employ the angle sum and double angle formulae for sine and cosine. 1/2 = sin(10◦ + 20◦ ) 1/2 = sin 10◦ cos 20◦ + sin 20◦ cos 10◦ 1/2 = sin 10◦ (1 − sin2 10◦ ) + (2 sin 10◦ cos 10◦ ) cos 10◦ 1/2 = sin 10◦ − sin3 10◦ + 2 sin 10◦ cos2 10◦ 1/2 = sin 10◦ − sin3 10◦ + 2 sin 10◦ (1 − sin2 10◦ ) 1/2 = 3 sin 10◦ − 4 sin3 10◦ 0 = 8 sin3 10◦ − 6 sin 10◦ + 1 Then substitute x = 2 sin 10◦ and reduce to: x3 − 3x + 1 = 0 All rational roots must be integers that divide the constant term which is 1 in this case. Since neither 1 nor -1 are solutions to our polynomial, x must be irrational and therefore 2 sin 10◦ must be irrational. Question 4 (Vardi, 2000) Show that (1/ sin2 x) ≤ (1/x2 ) + 1 − 4/π 2 for 0 < x < π/2 Notes This problem has tricky substitution, but the difficulty lies in demonstrating that the inequality is in the strict domain of 0 < x < π/2. Solution First rewrite the inequality as: 1 x2 and 1 + 1 − π42 ≥ 0 sin2 x 2x 2 then: xx2−sin + 1 − π42 sin2 x − for 0 < x < π/2 ≥ 0 for 0 < x < π/2 Egenhoff, p. 656 Then begin by showing that: lim ( x→ 0 1 x2 − sin2 x ) = 2 3 x2 sin x Observe that the function approaches an indeterminate form: x2 − sin2 x 0 → 2 0 x2 sin x Now employ L’Hopital’s rule until the limit exists. 0 2x − sin 2x → 2 0 2x sin x + x2 sin 2x , 0 1 − cos 2x → 2 2 0 sin x + 2x sin 2x + x cos x 2 , 2 sin 2x 0 → 2 3 sin 2x + 6x cos 2x + 2x sin 2x 0 , 2 cos 2x 1 → 2 6 cos 2x − 8x sin 2x − x cos 2x 3 Since 1/3 + 1 + 4/π 2 ≤ 0, this demonstrates that the inequality holds for the lower bound. Now to demonstrate the upper bound has a strict inequality, substitute an a = 1 − 4/π 2 which yields: √ sin x 1−a sin2 x ≥x Note that x = π/2 yields a solution, but to show that the inequality holds for values strictly less than π/2, one must take the second derivative of: f (x) = √ Which is found to be: sin x 1−a sin2 x TME, vol. 11, no. 3, p. 657 f 0 (x) = cos x , (1−a sin2 x)3/2 and f 00 (x) = (a−1+2a cos2 x)sinx (1−a sin2 x)5/2 Because a > 1/3, it follows that f 00 (x) > 0 for 0 < x < x0 , where x0 is the unique solution to f 00 (x0 ) = 0. So f 00 (x) is concave up on 0 < x < x0 and that f (x) > x on the same interval. Since f 00 (π/2) = −(π/2)3 , it shows that f 00 (x) is concave down on x0 < x < π/2. Since f (x0 ) > x0 and f (π/2) = π/2 the fact that it is concave down at the point x = π/2 implies f (x) > x for x0 < x < π/2. This shows the strict inequality of the interval. Question 5 (Vardi, 2000) Solve the system of equations: y(x+y)2 = 9, and y(x3 −y 3 ) = 7 Notes This problem is difficult because it requires some non-intuitive substitution, followed by some tricky algebra. Near the end of the solution is a trap where students must work with an eighth decree polynomial, which can leave students bogged down in calculation. Though, in the end, the only information needed from this polynomial are the signs of its coefficients. Solution Let x = ty which yields: y 3 (t + 1)2 = 9, and y 4 (t3 − 1) = 7 Take the first equation to the fourth power, the second equation to the third power and then divide. This results in: (t+1)8 (t3 −1)3 = 94 73 Which reduces to a polynomial: f (t) = 94 (t3 − 1) − 73 (t + 1)8 Any real positive root t0 of this polynomial will lead to solutions x0 , and y0 for the original system of equations. Where x0 = t0 y0 and y0 = ( 94 )1/12 (t + 1)8 It is fairly clear that 2 is a root of f (t), now one must demonstrate that f (t) has no other positive real roots. This can be done by expanding f (t) and performing long division. f (t) t−2 = 6561t8 + 12779t7 + 22814t5 + 13474t4 + 2938t3 + 6351t2 + 3098t + 3452 Egenhoff, p. 658 Notice that all coefficients are positive, so there are no positive real roots beside t = 2. So the final answer is found by employing the definitions above. y = 1 and x = 2 Question 6 (Vardi, 2000) Solve the equation: f (x) = x4 −14x3 +66x2 −115x+66.25 = 0 Notes This question also requires some tricky substitution, the ability to factor a quartic polynomial, a small system of equations, and imaginary numbers. On top of that, one must maintain computational accuracy and precision throughout this long exerciser. Solution Let x = y/2 which reduces f (x) = 0 to g(y) = 0 where: g(y) = y 4 − 28y 3 + 264y 2 − 920y + 1060 Similarly let y = z + 7 so that g(y) = 0 reduces to h(z) = 0 where: h(z) = z 4 − 30z 2 + 32z + 353 Now factor this quartic using the constants a, b, c, d as follows: √ √ √ √ z 4 − 30z 2 + 32z + 353 = (z 2 + a dz + b + c d)(z 2 − a dz + b − c d) By isolating the z n terms one gets the following equalities: (I) 2b − a2 = −30, (II) −2acd = 32, (III) b2 − c2 d = 353 From (II), one can say that d must be one of -2, 2, or -1, because any other factors of 32 contain a square root, and we know that d does not contain a square root by virtue of our factorization. Consider each possible value of d. First, if d = −2, then (III) gives b = ±15 and c = ±8. But then (I) implies that a is divisible by 15, which contradicts (II). Second, if d = 2, then (III) gives b = ±19 and c = ±2. But then a = ±4 which contradicts (I). Finally, if d = −1, then (III) gives b = ±17 and c = ±18, and (II) shows that a = ±2. After trying all of the possible combinations of the signs for these three numbers, one eventually finds that a = −2, b = −17,and c = −8 satisfies (I), (II), and (III). Now introduce these facts to the factorization: √ √ √ √ z 4 − 30z 2 + 32z + 353 = (z 2 − 2 −1z − 17 − 8 −1)(z 2 + 2 −1z − 17 + 8 −1) Consider i = √ −1 so that: z 4 − 30z 2 + 32z + 353 = (z 2 − 2iz − 17 − 8i)(z 2 + 2iz − 17 + 8i) Applying the quadratic formula yields: TME, vol. 11, no. 3, p. 659 √ √ z = i ± 2 4 + 2i and z = −i ± 2 4 − 2i For the left and right factors respectively. In order to get the final answer, one must go though the backwards substitutions of y = z + 7 and then x = y/2 which yields the roots of f (x), which are: x= 7+i 2 + √ 4 + 2i, 7+i 2 − √ 7−i 2 4 + 2i, + √ 4 + 2i, 7−i 2 − √ 4 + 2i Question 7 (Dodys, 2003) Four circles on a plane are such that each one is tangent to the three others. The centers of three of them lie on a line. The distance from the center of the fourth one to this line is x. Find x, if the radius of the fourth circle is r. The first step is to draw an accuate picture of the situation: Figure 1: Here the radii are in blue and the desired length x is in red. Notes The solution requires knowledge of Soddy’s Formula. This formula was first described by Descartes, but was popularized by Sir Fredrick Soddy in the form of a poem published in Nature, 1936 (Lagarious, 2002). The formula relates the radii of four tangent circles as follows: 1 1 1 1 + + + r12 r22 r32 r42 = 1 2 1 1 1 1 + + + r1 r2 r3 r4 2 The solution also relies on Heron’s formula for the semi-perimeter. Again, this is not an obvious move and would would have required some inspiration on the student’s part. Yet the final answer looks quite simple. Solution Assume the radius of the large circle is 1, and those of the two smaller circles are a and (1 − a), while the remaining circle has radius r. By Soddy’s formula: 1 1 1 1 + + +1= a2 (1 − a)2 r2 2 1 1 1 + + −1 a (1 − a) r 2 Egenhoff, p. 660 It should be noted here that the radius of the largest circle is considered to be negative one, because it is concave to the other three interior circles. Then substitute: z = a(1 − a), And the first equality can be rewritten as: 1 1 − 2z + 2 +1 z2 r This can be solved to give: z = r 1+r . = 2 1 1 + −1 z r Now, consider the triangle whose vertices are the centers of the circles, excluding the center of the outermost circle with a radius of one. The sides of the triangle are 1, a + r, (1 − a + r), and the height to the side with a length of one is the x we are seeking. The area of this triangle is one half base times height or x 12 = x2 . Heron’s formula states that the area of a triangle with side lengths p and edges a, b, c, p is equal to p(p − a)(p − b)(p − c). The semiperimeter p, is the sum of the side lengths divided by two, so our triangle has a semi-perimiter of 1+(a+r)+(1−a+r) , 2 or 1 + r. It follows that: A= Since a(1 − a) = z = p (1 + r)r(1 − a)a r 1+r , A= √ r2 = r From earlier it was shown that A = x/2 so x = 2r. Question 8 (Khovanova, 2011) Is it possible to put an equilateral triangle onto a square grid so that all the vertices of the triangle correspond to vertices of the grid? Notes This solution is not as tricky or difficult as some others, but the solution relies on considering the parity of a number and tracing this parity through some calculations. This strategy is not generally emphasized in high school math. Solution Set one of the triangles vertices at the point (0, 0). Consider the other two vertices to be (a, b) and (c, d). It can be assumed that at least one of the numbers is odd, because otherwise the triangle could be reduced. Let a be odd. The square of the length from the origin to (a, b) is a2 + b2 . Consider two separate cases. Fist consider b to be odd, then the square of the edge length takes on the form (2n + 1)2 + (2m + 1)2 which reduces to the form: 4k + 2. Since this triangle is equilateral, a2 + b2 = c2 + d2 . This shows that both c and d must be odd. But the square of the length of the third side equals (a − c)2 + (b − d)2 which is divisible by 4. So this side does not equal the other of the form 4k + 2 and the triangle is not equilateral. Next, consider b to be even, then the square of the edge length takes on the form (2n + 1)2 + (2m)2 which reduces to the form: 4k + 1. As before, a2 + b2 = c2 + d2 . TME, vol. 11, no. 3, p. 661 This shows that c and d must be one even and one odd. But the square of the length of the third side equals (a − c)2 + (b − d)2 which is even. This fact contradicts with the fact that the square of the first side length is of the form 4k + 1. So this case also fails. Question 9 (Vardi, 2000) Can a cube be inscribed in a cone so that 7 vertices of the cube lie on the cone? Notes This problem requires a good three dimensional imagination and then firm grasp of conic sections. Then, even if a student can convince themselves of the solution, the general proof of the situation requires some algebraic juggling. It is very easy to make simple mistakes along the way. Solution A cube has 8 vertices. So if a cube could be inscribed in a cone with 7 vertices on a cone, that means that there would be a face ABCD so that each corner touch the cone and an opposite face EF GH so that at least three of the vertices touched the cone. The face ABCD lives on a plane which cuts the cone into a conic section, either a hyperbola, parabola, ellipse or two intersecting lines. An ellipse is the only option which can circumscribe a square at all four vertices. Call this ellipse E1 . The opposite face EF GH is parallel to ABCD, therefore its conic section is also an ellipse. Call this ellipse E2 . It is defined that face ABCD touches E1 at four points and that the sides of ABCD are parallel to the major and minor axes of E1 . Since ABCD and EF GH are parallel and E1 and E2 are parallel, it is implied that the edges of face EF GH are parallel to the major and minor axes of E2 . This means that E2 can intersect the vertices of EF GH at 0, 2 or 4 points. If 4 is chosen, it implies that the ellipses are equal, which is impossible inside of a cone. The only other possibility is that ABCD is not parallel to the major and minor access, which also cannot be. 2 This can be proven without loss of generality as follows: Consider an ellipse x2 + ay2 = 1, a > 0, and a line y = mx + b, m 6= 0 If these intersect at (x, y), then by solving both the line and the ellipse for y 2 and setting the expression to zero, one finds: (a2 + m2 )x2 + 2mbx + b2 − a2 = 0. This is the in the form of a quadratic, so the quadratic formula can be employed: −2mb ± p (2mb)2 − 4(a2 + m2 )(b2 − a2 ) 2(a2 + b2 ) And simplified, −mb ± p (mb)2 − (a2 + m2 )(b2 − a2 ) (a2 + m2 ) Egenhoff, p. 662 −mb ± p m2 b2 − (a2 b2 + m2 b2 − a4 − a2 m2 ) (a2 + m2 ) √ −mb ± a a2 + m2 − b2 (a2 + m2 ) This gives the x values of the two points of intersection. A similar method can be employed to find the y values at the two points of intersection. So the points of intersection are: I= ! √ √ −mb − a a2 + m2 − b2 ba2 − am a2 + m2 − b2 , a2 + m2 a2 + m2 J= ! √ √ −mb + a a2 + m2 − b2 ba2 + am a2 + m2 − b2 , a2 + m2 a2 + m 2 And using the distance formula, the length of the segment IJ is found to be: 2a p (1 + m2 )(a2 + m2 − b2 ) a2 + m2 Investigating this result, it can be seen that the only way to get two equal chords is by using the lines y = mx + b and y = mx − b. The slope m must remain the same because the opposite edges of ABCD are parallel. The sign of a cannot be changed without changing the sign of the length of IJ. So this leaves b, whose sign can change without changing the length of IJ. The resulting two intersection points are: K= ! √ √ mb − a a2 + m2 − b2 −ba2 − am a2 + m2 − b2 , a2 + m2 a2 + m 2 L= ! √ √ mb + a a2 + m2 − b2 −ba2 + am a2 + m2 − b2 , a2 + m2 a2 + m2 If these 4 points lie on a square, then the slope LJ must be −1/m (the opposite reciprocal of the slope of KL). Since L−J = −2ba2 2mb , a2 + m 2 a2 + m 2 the slope is −a2 /m. This implies that a = 1, which implies that the ellipse is a circle. This contradicts the assumption that the ellipse circumscribes the square asymmetrically, and the situation is proved to be impossible. TME, vol. 11, no. 3, p. 663 Conclusion "Mathematical audiences (not only in the West) will find it interesting to learn some details and solve the little problems that a [high] school graduate was supposed to solve in a few minutes"(Vershik, 1994) The Questions above are just a small sample of many challenging questions. Each one just as unreasonable to ask a high school graduate in the setting of an oral exam. Beyond the difficulty of the content, the true story is the intent of the examiners. This particular story of discrimination has a happy albeit anti-climactic ending. Shen(1994) cites the 1988 policy of Perestroika as the impetus for reform at MGU. Before Perestroika, serious complaints against the math department could be deemed “anti-Soviet activity” and effectively silenced. Kanevskii and Senderov, two of people most active in trying to shed light on the discrimination at MGU, were arrested for such anti-Soviet agitation. After Perestroika, the issue was brought to the table and discussed openly. This led to the one student being allowed to retake the entrance exam, and general reform in the examination practices. Blatant discrimination by the entrance examiners ended and the controversy with it. Implicit in this story of bigoted examiners oppressing Jewish students, are the side actors who witnessed the injustice and did little to nothing to stop it. Shen admits to being one of these actors guilty of complacency. In his article he recognizes that his opinions and actions at the time were "largely from cowardice." Although he did take moderate action, it is implied that he wishes he had done more. This chapter in history should serve as a warning and a reminder for each of us to speak out against discrimination. References [1] . Dodys, A. Sahai, 2003, Solution to Problem 21, www.tanyakhovanova.com/Coffins/sol21 [2] E. Frenkel, (2013), "Love and Math, The Heart of Hidden Reality", Basic Books, pp.2839. [3] C. J. H. Hayes, P. T. Moon, J. W. Wayland, World History,The Macmillan Company, New York, 1932 pp. 721 [4] V.I. Lenin, (1919), «О погромной травле евреев» "On Anti-Jewish Pogroms", speech. [5] B.I. Kanevskii, V.A. Senderov, (1980), Intellectual Genocide, Moscow, Samizdat. [6] G. B. Kolata, 1978, Anti-Semitism Alleged in Soviet Mathematics, Science, New Series, Vol. 202, No. 4373, pp. 1167-1170 Egenhoff, p. 664 [7] T. Khovanova, A. Radul, (2011), Jewish Problems, arXiv:1110.1556v1. [8] L. S. Pontryagin, 1979, “Soviet Anti-Semitism: Reply by Pontryagin”, Science, New Series, Vol. 205, No. 4411, pp. 1083-1084 [9] A. Rambaud, E. Saltus, (1898),Russia, vol. 2, Peter Felelon Collier, New York, pp. 76-79. [10] M. Saul, (1999), Kerosinka: An Episode in the History of Soviet Mathematics, Notices of the AMS, vol. 11. [11] A. Shen, (1994), Entrance Examinations to the Mekh-mat, Mathematical Intelligencer, vol. 16, pp. 6-10 [12] I. Vardi, (2000), Mekh-Mat Entrance Examinations Problems, www.ihes.fr/ilan/mekhmat.ps. [13] A. Vershik, (1994), Admission to the Mathematics Faculty in Russia in the 1970’s and 1980’s, Mathematical Intelligencer, vol. 16, pp.4-5 [14] J. C. Lagarias, C. L. Mallows, A. R. Wilks, (2002), Beyond the Descartes Circle Theorem, The American Mathematical Monthly 109 (4): 338–361. TME, vol. 11, no. 3, p. 665 Reasoning-and-Proving Within Ireland’s Reform-Oriented National Syllabi Jon D. Davis 1 Western Michigan University Abstract As educational systems around the world attempt to reform their mathematics programs to increase students’ opportunities to engage in processes central to the practice of mathematics such as proof, it is important to understand how this mathematical act is portrayed in national curriculum documents that drive that change. This study examined the presence of reasoningand-proving (RP) in Ireland’s national reform-oriented secondary syllabi for junior cycle (ages 12-15) and senior cycle (ages 15-18) students. The analyses reveal that there were no differences among direct and indirect RP learning outcomes within each syllabus, but statistically significant differences did exist across syllabi in these categories. Students were provided with statistically different opportunities to engage in pattern identification, conjecture formulation, and argument construction in both syllabi. There were significantly fewer opportunities to engage in conjecture formulation for junior cycle students and significantly more opportunities to construct arguments for senior cycle students. There were no instances of proof as falsification across both syllabi, but students were given similar opportunities to experience proof as explanation, verification, and generation of new knowledge. Across both syllabi there were statistically significantly more RP learning outcomes that were divorced from content than those that were connected to content. The results as well as the implications of these results for the design of national curriculum documents are discussed. Keywords: pattern, conjecture, proof, standards, reform Introduction Mathematicians have argued that proof is the material with which mathematical structures are constructed (Schoenfeld, 2009). Proof is also becoming instantiated as an important component through which one learns school mathematics (Common Core State Standards Initiative [CCSSI], 2010; Epp, 1998; Hanna, 2000; Martin et al., 2009; National Council of Teachers of Mathematics [NCTM], 2000). Due to the acknowledgement of proof as 1 [email protected] The Mathematics Enthusiast, ISSN 1551-3440, vol. 11, no. 3, pp. 665-706 2014© The Author(s) & Dept. of Mathematical Sciences-The University of Montana Davis important in the practice and learning of mathematics researchers are beginning to analyze this practice (Hanna & de Bruyn, 1999) or practices related to it such as reasoning-andproving (RP) (Davis, Smith, Roy, & Bilgic, 2013; Stylianides, 2009) in textbooks. While analyses of standards at the state level in the United States for reasoning (Kim & Kasmer, 2006) or for conjecturing and proving (Porter, McMaken, Hwang, and Yang, 2011) have been conducted, we know little about the standards in other countries with regard to proof or its related actions of pattern identification or conjecture formulation. National standards play an important role in shaping classroom practices in the United States (Cogan, Schmidt, & Houang, 2013), Ireland (National Council for Curriculum and Assessment [NCCA], 2012), and other countries (Eurydice, 2011). The curriculum documents at the center of this study are two national syllabi designed to describe the learning expectations for students ages 1218 studying mathematics in Ireland. These frameworks have been recently developed to drive a nation-wide reform of the Irish secondary mathematics system. This study introduces readers to a framework and methodology for examining RP in national curriculum documents and addresses the dearth of research of this type by enumerating the nature of RP within these two documents. The analysis of these documents for RP expands our knowledge of the nature of this important process in national curriculum documents and adds to our understanding of the potential effectiveness of RP in this reform. More broadly, this paper makes suggestions for how RP can be more interwoven into curriculum frameworks. Background Centrality of Proof-Related Constructs in Mathematics and Mathematics Education Mathematicians have pointed out that the act of constructing proofs is essential to the practice of mathematics (Ross, 1998) or as Schoenfeld (2009) has stated, “If problem-solving TME, vol. 11, no. 3, p. 667 is the ‘heart of mathematics’, then proof is its soul (p. xii). National curriculum documents in the United States emphasize the centrality of proof in the learning of mathematics. Specifically, the Principles and Standards for School Mathematics (PSSM) (NCTM, 2000), which has driven reform in the United States for over a decade breaks down the instruction of mathematics into five content areas and five processes, one of which is reasoning and proof. The Common Core State Standards for Mathematics (CCSSM) (CCSSI, 2010) begins their document with eight standards for mathematical practice, which they argue should be present as students engage in the learning of mathematics. The third standard advocates for students’ construction of mathematical arguments or proof as well as the critiquing of arguments constructed by others. Other countries have also emphasized the importance of proof in the instruction of mathematics. For example, each of the syllabi documents produced by the NCCA in Ireland break mathematics content down into five different mathematics content strands. At the end of each of these content strands is a topic with the title: synthesis and problem solving skills. This topic includes the identification of patterns, formulation of conjectures, and explanation/justification of assertions. These three actions comprise the related processes of reasoning-and-proving as defined by Stylianides (2009). Ireland’s Secondary Educational System The secondary educational system in Ireland consists of three components. The first component is called the junior cycle and lasts three years. At the end of the junior cycle mathematics students are required to complete an examination in one of three different levels of difficulty. The lowest level is foundation. The next highest level is ordinary and the most difficult level is higher. After completion of the junior cycle many schools provide students with an optional transition year for students. After the optional transition year students begin Davis the two-year senior cycle. At the completion of the senior cycle, students can opt to take one of three different levels of mathematics examinations: foundation, ordinary, or higher. Mathematics at both the junior and senior levels consists of five different strands: Strand 1 – Statistics and Probability; Strand 2 – Geometry and Trigonometry; Strand 3 – Number; Strand 4 – Algebra; and Strand 5 – Functions. The NCCA developed the syllabus for Junior Cycle students and the syllabus for Senior Cycle students describing the content and methods of the Project Maths reform. Both the syllabus at the Junior Cycle and Senior Cycle level refer to individual standards using the words learning outcomes and this terminology is used to refer to them throughout the paper. The reform of the secondary mathematics program in Ireland, Project Maths, began with 24 pilot schools in September 2008. These schools not only implemented the Project Maths curriculum, but also helped to revise the syllabi. Project Maths was designed to address high failure rates in mathematics for ordinary level students, low participation rates in the higher level Leaving Certificate program, a lack of conceptual understanding, and the difficulty students encountered in trying to use mathematical concepts in real-world contexts (Department of Education and Skills, 2010). In September 2010 the program was gradually implemented across Ireland beginning with the statistics/probability content strand. The last content strand to be implemented will be functions and will occur at the junior and senior levels in September 2012. In the Junior Certificate Mathematics Syllabus: 2015 Examination (JC Syllabus) (NCCA, n.d.), students at the foundation level are expected to understand the same learning outcomes as ordinary level students. Higher level students are expected to understand all of the learning outcomes listed for ordinary and foundation level students as well as additional learning TME, vol. 11, no. 3, p. 669 outcomes identified in bold throughout the syllabus. In the Leaving Certificate Mathematics Syllabus: Foundation, Ordinary & Higher Level: 2014 Examination (hereafter referred to as the LC Syllabus) (NCCA, n.d.), learning outcomes are listed separately for foundation, ordinary, and higher level students. Foundation level students are expected to learn only those outcomes listed within this level. Ordinary level students are expected learn the outcomes for foundation and ordinary level. Higher level students are expected to learn the outcomes for foundation and ordinary as well as those listed within the higher level. Consequently, higher level students are expected to learn more content than foundation and ordinary level students. For example, within the LC Syllabus, students at the foundation level are expected to learn how to complete three geometric constructions. Students at the ordinary level are expected to learn the three geometric constructions at the foundation level as well as three more. Students at the higher level must learn the six constructions at the foundation and ordinary levels as well as sixteen more constructions. There are also differences across the levels in terms of the complexity of the learning outcomes that students are expected to learn. For instance, within the LC Syllabus students at the foundation level are expected to be able to apply the theorem of Pythagoras. Ordinary level students are expected to solve problems involving sine and cosine rules in two dimensions in addition to using the theorem of Pythagoras. Higher level students are asked to use trigonometry to solve problems in three dimensions in addition to the earlier described learning outcomes at the foundation and ordinary levels. After completing the LC Syllabus, 22.1% (11,131) of students opted to take the higher level examination, 67.2% (37,506) of students opted to take the ordinary level examination, and 12.4% (6,249) of students opted to take the foundation level examination (Reilly, 2012). Davis Importance of Syllabi Documents in Irish Mathematics Classrooms The State Examination Commission in Ireland creates and administers the examinations at both the junior certificate and leaving certificate levels. Students who elect to take the foundation level Junior Certificate Examination complete one assessment while students at the ordinary and higher levels each take two assessments. Students at the foundation, ordinary, and higher levels will each take two Leaving Certificate examinations. The junior certificate examination has all of the characteristics of a high stakes examination as students report an increase in homework demands during the third year of junior cycle focusing on the junior certificate examination, one-quarter of students enroll in private tutoring outside of school to prepare them for this exam, and students’ performance on the junior certificate examination influences the levels of courses (e.g., ordinary vs. higher) in which they enroll during the senior cycle (Smyth, 2009). At the end of the senior cycle, students receive points based upon the score and level of the leaving certificate test that they take. These points are used to determine students’ eligibility to enroll in different university programs. Universities in Ireland publish points associated with academic programs. These values represent the minimum number of points needed on leaving certificate exams in order to apply to these programs. In high demand programs students who achieve the minimum number of points may not be accepted into the program. Consequently, the leaving certificate examinations also hold high stakes for students. Both the junior certificate and leaving certificate examinations are based upon content as delineated within syllabi developed by the NCCA. While professional development is being conducted in Ireland to help teachers understand the content and teaching approach TME, vol. 11, no. 3, p. 671 associated with Project Maths and textbooks now exist which purport to contain Project Maths content, the high stakes exams that students take at the junior and senior cycles are based upon syllabi documents produced by the NCCA. Accordingly, this study examines these documents for the presence of RP as they have an important influence on the nature of instruction in secondary mathematics classrooms in Ireland. Proof-Related Constructs in Mathematics Textbooks A variety of studies have examined what I describe as proof-related constructs. These constructs include the following: development or discussion of arguments that mathematicians would consider valid proofs (Davis et al., 2013; Stacey & Vincent, 2009; Stylianides, 2005, 2009; Thompson, Senk, & Johnson, 2012); identification of patterns and development of conjectures (Davis et al., 2013; Stylianides, 2009); modes of reasoning (Stacey & Vincent, 2009); and proof-related reasoning consisting of making and testing conjectures, developing and evaluating deductive type arguments, locating counterexamples, correcting mistakes in arguments, creating specific and general arguments (Thompson et al.). Studies conducted on secondary mathematics textbooks in different countries suggest that students’ opportunities to engage in proof related constructs are limited. For instance, Stylianides (2009) found that only 5% of 4578 tasks appearing in a secondary mathematics program for students ages 11-14 in the United States asked students to construct valid arguments. Similar to homework exercises, students are provided with infrequent opportunities to read about valid mathematical arguments. By way of example, Thompson et al. assumed that mathematical properties needed to be justified and found that less than half of these mathematics building blocks appearing within the topics of exponents, logarithms and polynomials in 22 different high school mathematics texts were justified with valid Davis proofs. Reasoning and Proof in U.S. State and National Standards Kim and Kasmer (2006) examined reasoning in 35 state curriculum frameworks in the United States from kindergarten through eighth grade. They found that 22 states contained a reasoning section or specific statements that reasoning should appear across all content strands. They also found inconsistencies in messages addressing reasoning within state frameworks. For example, they found that reasoning appeared infrequently at the primary level and was not consistent across different mathematics content strands. Some curriculum frameworks contained reasoning in a general sense that was separated from specific mathematics content. They also found that state frameworks contained inappropriate examples. That is, examples designed to represent reasoning focused on mathematical procedures. Some state curriculum frameworks lacked alignment between benchmarks or what students were expected to know at a certain grade level and their corresponding performance indicators. Oftentimes one of these curriculum components contained reasoning while the other did not. Kim and Kasmer (2006) also examined the prevalence of different words associated with reasoning in the state curriculum frameworks. The word “prediction” was found in many state frameworks but was most prevalent in data analysis and probability. “Generalization” appeared most frequently in the algebra content strand. “Verification” appeared primarily in two mathematics content strands: Geometry and Number and Operations. More of these states reserved “verification” to the upper elementary grades. The word “conjecture” appeared in a little over half of the 35 states and primarily at grades 5-8. This action was primarily concentrated within Geometry and Data Analysis/Probability content strands. The TME, vol. 11, no. 3, p. 673 words “develop arguments” appeared in less than half of the state curriculum frameworks and predominantly in the Data Analysis and Probability strand. The U.S. has traditionally been a decentralized curricular system with a variety of curricular frameworks at the state level and textbooks selected by entities that consist of several K-12 schools or individual schools (Dossey, Halvorsen & McCrone, 2008). However, this may now change with the advent of the Common Core State Standards in English language arts and mathematics, which has been adopted by 45 states in the U.S. Porter et al. (2011) examined the alignment among 27 state frameworks, Principles and Standards for School Mathematics (PSSM) (National Council of Teachers of Mathematics [NCTM], 2000), and the Common Core State Standards for School Mathematics (CCSSM) (Common Core State Standards Initiative [CCSSI], 2010). This study connects with the research conducted here since one of the categories of cognitive demand is labeled “Conjecture, generalize, prove.” They found that 7.78% of the learning outcomes across the 27 state frameworks and 5.96% of the standards appearing in the Common Core State Standards for Mathematics involved conjecturing, generalizing, or proving. These percentages seem low given the centrality of these practices to mathematics. Research Questions In summary, previous research suggests that students are provided with infrequent opportunities to engage in tasks or read text involving proof-related constructs within school mathematics textbooks in the United States as well as other countries. This finding is echoed in state curriculum frameworks and in the current Common Core State Standards for Mathematics. In curriculum frameworks in the U.S., RP appears in a variety of different guises such as prediction, verification, generalization, etc. The majority of state curriculum Davis frameworks contain either a specific reasoning section or general statements that reasoning should appear throughout the documents. However, these state frameworks also contained the following negative features with regard to RP: differential attention to reasoning across mathematics content strands, inconsistent messages being sent to teachers in different components of the frameworks, and the separation of reasoning from content. The study described in this paper builds on these previous studies with regard to national curriculum documents by using similar methodology, but with a slightly different framework. A total of four research questions guided this study. First, are there statistically significant differences in the frequency of RP learning outcomes by different content strands within each syllabus or across syllabi by student learning level? Second, are there statistically significant differences in the frequencies of mathematical ideas categorized as pattern identification, conjecture formulation, or argument construction by student learning level within each syllabus? Third, are there statistically significant differences in the purposes of proof by learning level within each syllabus? Fourth, are there statistically significant differences in the frequency of content and non-content related RP by student learning level within each syllabus? Framework As Stylianides (2005) has pointed out, while different researchers have defined reasoning in a variety of ways, these definitions contain a common thread, proof. Indeed, a recent interpretation of a U.S. national standards document (Martin et al., 2009) defines reasoning as encompassing “proof in which conclusions are logically deduced from assumptions and definitions” (p. 4). Moreover, reasoning can consist of different levels of formality (NCTM, 2000, 2009) and be connected to different mathematics content areas such as algebra (Walkington, Petrosino, & Sherman, 2013) or mathematical ideas such as proportion TME, vol. 11, no. 3, p. 675 (Jitendra, Star, Dupuis, & Rodriguez, 2013). Stylianides (2005) defined the term reasoningand-proving to consist of four potentially interconnected actions: pattern identification; conjecture formulation; developing non-proof arguments; and creating proofs. Support for Stylianides’ decision to connect pattern identification and conjecture development to reasoning and proof come from national standards documents produced by NCTM (1989, 2000). The hyphens within this terminology denote two meanings. First, they signify that these actions can be integrated with one another. Second, they suggest that reasoning is connected to the development of proofs as opposed to other types of reasoning as described above. Stylianides developed an analytic framework for analyzing reasoning-and-proving opportunities in school mathematics textbooks. Several features associated with the learning outcomes appearing in standards documents suggest the need for changes to Stylianides’ analytic framework. First, learning outcomes associated with standards documents come in differing levels of specificity (McCallum, 2012). As a result, learning outcomes require interpretation on the part of users and the analyses presented in this paper indicate potential RP processes. In addition, this feature has been taken into account in the framework through the creation of direct and indirect RP processes. Direct RP processes are defined as actions involving pattern identification, conjecture formulation, and/or argument construction as indicated within learning outcomes by the appearance of words tightly connected to these processes (e.g., pattern) coupled with a context that an expert would recognize as indicating evidence of these processes within a mathematical community of practice. Direct RP processes were used for identifying one or more of the RP categories within fine grain or narrowly specified standards document learning outcomes. For example, in both the JC Syllabus and the LC Syllabus a learning Davis outcome states that students should be able to formulate conjectures. Due to the close connection of this learning outcome to the RP framework through the word conjecture as well as the fact that this phrase appears within mathematics content standards suggests the presence of direct RP processes. Indirect RP processes are defined as actions involving pattern identification, conjecture formulation, and/or argument construction as indicated within learning outcomes by the appearance of words loosely connected to one or more of these processes (e.g., investigate) coupled with a context that an expert would recognize as indicating evidence of these processes within a mathematical community of practice. Consider the following learning outcome appearing in the LC Syllabus: investigate theorems 7, 8, 11, 12, 13, 16, 17, 18, 20, 21 and corollary 6 (NCCA, n.d., p. 22). Readers of this document could interpret the word “investigate” in several different ways. That is, the investigation could consist of a tightly scripted set of steps that students are asked complete that does not include pattern identification, conjecture formulation, or argument construction. However, others could interpret “investigate” to include one or more of these RP processes. Thus learning outcomes that contained words such as investigate as well as a context as described above were coded as involving indirect RP processes. Additionally, the lack of specificity of some learning outcomes required the creation of methods for determining the frequencies associated with different components of the RP framework as described later within the methodology section. Second, as standards documents will not contain statements asking students to construct non-proof arguments this component of the Stylianides’ framework was removed for this study. Third, as standards documents do not typically contain specific examples of student problems, in contrast with school mathematics textbooks, it was not possible to TME, vol. 11, no. 3, p. 677 discern plausible from definite patterns or generic examples from demonstrations. In the case of the former plausible and definite patterns were collapsed into pattern identification and in the case of the latter generic examples and demonstrated were collapsed into argument construction. This lack of specific mathematical problems also necessitated the removal of pattern purposes and conjecture purposes from Stylianides’ framework. It was posited that words appearing in learning outcomes associated with the development of arguments could be used to determine the purposes associated with a proof. The analytic framework used in this study is shown in Figure 1. Students may engage in pattern identification, conjecture formulation, and argument construction separately or in conjunction with one another as noted by the dashed arrows in Figure 1. For instance, learning outcomes may expect students to identify a pattern without constructing a conjecture or developing an argument. Other learning outcomes may expect students to engage in two (e.g., identification of a pattern followed by the construction of a conjecture) or all three of the framework components. If only one of the three components of the framework appeared within the syllabi documents, this was still considered an instance of reasoning-and-proving. Figure 1. Framework for analyzing reasoning-and-proving in syllabi documents. Davis Identification of patterns was defined as the act of locating a key feature or key features in a set of data existing in a variety of different forms that one has not encountered before and for which a procedure has not been previously introduced. Conjecturing consists of the development of a reasoned hypothesis extending beyond a particular set of data existing in different representational forms and expressed with uncertainty as to its validity. Argument construction involved the creation of valid proofs, which consist of a set of accepted statements, modes of argumentation, and modes of argument representation (Stylianides, 2007). Learning outcomes that were coded as argument construction were later categorized in terms of the purposes that these proofs served. In analyzing the work of De Villiers (1990, 1999) and others (e.g., Hanna, 1990), Stylianides (2005) described four different purposes of proof that can be coded in curriculum materials: explanation; verification; falsification; and generation of new knowledge. Explanation denotes why a particular assertion is valid. Verification establishes the truth of a particular assertion. Falsification shows that a particular assertion is false. Generation of new knowledge occurs when a proof develops knowledge that was not previously known by a particular group of individuals. Methodology Units of Analysis Electronic copies of the JC Syllabus and the LC Syllabus were examined for instances of RP. These documents describe the Project Maths reform at the junior certificate and leaving certificate levels, respectively. The four research questions described above necessitated two phases of analysis. The first phase involved enumerating the number of learning outcomes TME, vol. 11, no. 3, p. 679 categorized as containing direct and indirect RP processes. The second phase involved identifying and categorizing learning outcomes as involving pattern identification, conjecture formulation, or argument construction. Electronic versions of the JC Syllabus and the LC Syllabus were the sources used for both phases of the analysis. Each document contains five different mathematics content strands with the learning outcomes in each strand appearing in a matrix format as seen in Figure 2. Figure 2. Excerpt from the LC Syllabus (NCCA, n.d., p. 17). The first column represents a general mathematics content area with the subsequent columns representing learning outcomes associated with the general mathematics content area differentiated by student learning level. A unit of analysis needed to be defined in order to enumerate the RP learning outcomes appearing in both documents. Since both documents contained the same structure shown in Figure 2, the phrase following a dash was defined as a learning outcome and hence became the unit of analysis for the first phase of the study. The second phase of the study involved distinguishing among different components of the RP framework (e.g., pattern identification) embedded within a specific learning outcome. Analyses of both the JC Syllabus and the LC Syllabus suggested that one or more mathematical ideas could appear within what was defined as a learning outcome. A mathematical idea was Davis identified as the set of words separated by commas, plural forms, or by conjunctions such as and. For instance, consider the following learning outcome appearing in the LC Syllabus: prove theorems 11, 12, 13 concerning ratios (NCCA, n.d., p. 22). While this was considered to be one learning outcome it was composed of three related mathematical ideas involving argument construction. Coding Kim and Kasmer (2006) employed a methodology whereby words associated with reasoning (e.g., predict) were located and used as evidence that students were expected to engage in reasoning. In this study, a similar process was used to locate learning outcomes that indicated the potential for students to engage in RP. Table 1 lists the words that suggested but did not determine direct and indirect RP processes. Recall that the context within which these words appeared also needed to be evaluated to finally categorize learning outcomes as either direct or indirect RP processes. TME, vol. 11, no. 3, p. 681 Table 1 Words Linking Potential Direct and Indirect RP Processes and RP Framework Components Word RP Framework Direct Pattern Pattern Identification Conjecture, Guess, Hypothesis, Predict Conjecture Formulation Explain, Argument, Prove, Proving, Proof, Justify, Show, Argument Construction Generalize, Generate Rules, Derive, Disprove, Counterexample Indirect Describe, Interpret Pattern Identification Evaluate, Verify, Analyze Argument Construction Explore Pattern Identification, Conjecture Formulation Investigate Pattern Identification, Conjecture Formulation, Argument Construction Draw Conclusions Argument Construction As can been seen from Table 1, direct RP processes consisted of words that either appeared in the RP framework (pattern, conjecture, argument) or were closely connected to these components (e.g., predict). Table 1 also lists the words associated with indirect RP Davis processes. These words were less tightly connected to the three main RP categories and hence could be interpreted in a variety of different ways by teachers and students. For instance, the word investigate is defined in the following manner: to examine, study, or inquire into systematically; search or examine into the particulars of; examine in detail (dictionary.reference.com). The words search or examine contain the potential for components of the RP framework such as looking at a set of data for a pattern or patterns to exist. Thus the appearance of words within the syllabi documents that suggested processes similar to the identification of patterns, formulation of conjectures, and development of arguments were also used as potential evidence of components of the RP framework. The word explore was used to potentially indicate pattern detection and conjecture formulation, but not argument as the word did not necessarily denote the location and solidification of mathematical ideas. Similar to direct instances of RP, the context in which words denoting indirect RP were used was taken into consider to determine if the learning outcome was indeed connected to RP. Consider the following learning outcome from the JC Syllabus: explore the properties of points, lines and line segments including the equation of a line (NCCA, n.d., p. 20). This instance of the word explore in this example would account for pattern identification and conjecture formulation. Moreover, since explore is used with respect to four different mathematical ideas (properties of points, lines, line segments, and the equation of a line) four instances of pattern detection and four instances of conjecture formulation would be enumerated for this single learning outcome. However, no argument construction instances would be coded here as explore was not considered to encompass this component of the RP framework. TME, vol. 11, no. 3, p. 683 Given the definition of the word investigate included above it held the potential to involve the identification of patterns and construction of conjectures. In addition, it was assumed that students engaged in an investigation would locate a mathematical idea. That is, there would be an endpoint at which the investigation would be completed. This suggested that students involved in an investigation would also be asked to construct a valid argument showing that the mathematical idea they located and conjectured actually existed. The words draw conclusions held the potential to indicate argument development, but not pattern identification or conjecture formulation. The location of other words in the syllabi documents potentially indicated the presence of pattern identification and argument construction. The words interpret and describe were used to potentially indicate identification of patterns. The following words were used as potential evidence of the construction of valid arguments: evaluate, verify, analyze, and develop. Both syllabi were examined for presence of the words appearing in Table 1. Once a word appearing in the table was identified, the rest of the learning outcome associated with this word was considered the context associated with this word. The word was potentially connected with one or more RP categories as indicated in Table 1. The context was examined to determine if there was agreement between it and the RP category definitions associated with that word. The learning outcome was categorized as RP-based if there was no aspect of the context that disagreed with the RP category definitions and the context could be interpreted as involving one or more of the RP categories as determined by the main coder. This process is illustrated in the following example. Students at the leaving certificate level are asked to: “use the following terms related to logic and deductive reasoning: theorem, proof, axiom, corollary, converse, implies” (p. 22). The presence of the word proof here Davis suggests the potential for a direct RP process and subsequently an RP-based learning outcome, yet the context involving the words use the following terms suggests that students are not required to develop a proof. Determining frequency of occurrences. Recall that in the first phase of the study the information after a dash in the learning outcomes indicated one instance. In the second phase of the study each learning outcome was broken down into mathematical ideas that were examined for one or more of the three RP categories. In some cases, the mathematical ideas were specifically listed within the learning outcome, resulting in a straightforward determination of the number of occurrences of that particular idea. For instance, in the JC Syllabus the following learning outcome appears: explore the properties of points, lines and line segments including the equation of the line (NCCA, n.d., p. 20). The word explore suggests the presence of indirect RP processes, but the language here illustrates that four different mathematical ideas are involved: points, lines, line segments, and the equation of the line. Other learning outcomes used plural forms. For example, the following learning outcome appears in the LC Syllabus: generate rules/formulae from those patterns (NCCA, n.d., p. 25). In this example, plural forms (rules/formulae) are used and since the exact number was not described in the syllabus it was counted as two instances of argument construction. Whenever plural forms were used in RP-based learning outcomes, these were counted as two mathematical ideas. Identifying proof purposes. Table 2 shows how words associated with argument construction in analyses of the syllabi documents were connected to the four proof purpose categories described in the framework. The word explain indicated the construction of an argument, the purpose of which was coded as explanation. One definition of the word TME, vol. 11, no. 3, p. 685 analyze is as follows: To examine carefully and in detail so as to identify causes, key factors, possible results, etc. (www.dictionary.com). This suggests that an analysis leads to a better understanding of a mathematical idea, which helps to explain why something is the case. Consequently, the word analyze was linked to an explanation proof purpose. Words that were more closely associated with the development of a valid argument (e.g., prove) were coded as verification as these words were often used in association with some mathematical idea such as in the following learning outcome from the LC Syllabus document: “prove that √2 is not rational” (NCCA, n.d., p. 25). Since the statement assumes that √2 is not rational, the development of an argument would verify that this is indeed the case and hence would constitute a verification proof purpose. The presence of words such as counterexample or disprove suggested that students were expected to show that some specific idea was not true in general leading to a falsification proof purpose. Likewise, if students were asked to determine the validity of some mathematical idea that was not true in general with words such as determine if ________ is true this was considered to be a falsification proof purpose. The proof purpose of generation of new knowledge was linked to the following words: generalize, generate rules, derive, investigate, and draw conclusions. The word, investigate, was considered to be involved in the generation of new knowledge as this word suggests that students working with a mathematical idea that they had not previously examined. In some cases there were generic descriptions of RP learning outcomes. For example, the learning outcome involving the words justify conclusions within the synthesis and problem-solving skills section in each mathematics content strand involved the development of an argument, but could not be coded for a purpose. Such instances were simply coded as unclear. In Stylianides’ work, each Davis argument could potentially be coded within multiple proof purpose categories, however, in this study each RP learning outcome was only placed into one category. Table 2 Words Used to Identify Proof Purposes Words Indicating Argument Construction Proof Purpose Explain, Analyze Explanation Argument, Prove, Proving, Proof, Justify, Show, Evaluate, Verification Verify Counterexample, Disprove, Determine if ________ is true Falsification Generalize, Generate Rules, Derive, Investigate, Draw Generation Conclusions, Develop Inter-rater Reliability The author was the primary coder of both syllabi documents. However, in order to determine the reliability of the framework and the coding system another individual possessing experience with the RP framework read through the framework and methodology descriptions and coded two content strands from the JC Syllabus and two strands from the LC Syllabus for RP-based learning outcomes. This individual coded the Probability and Statistics strand and the Number strand within the JC Syllabus as these two strands contain a range of RP-based learning outcomes. The inter-rater reliability using unweighted Cohen’s Kappa for this coding was 0.9276. Landis and Koch (1977) consider these values to represent almost perfect agreement. The Geometry and Trigonometry strand and the Algebra strand were coded within the LC Syllabus. These strands were chosen to provide information about TME, vol. 11, no. 3, p. 687 the reliability of coding RP-based learning outcomes within different mathematics content areas. The inter-rater reliability using unweighted Cohen’s Kappa for this strand was 0.7682. This lower value when compared to the JC Syllabus was due to the second coder identifying words associated with the framework without also attending to the context of the learning outcome within which the word was embedded. For instance, the second coder identified the word interpret in the algebra content strand to indicate the presence of RP, however, the context of the learning outcome is related to interpreting the results of solving equations considered as functions. Such an action does not indicate the pattern identification as it is described in the framework. While this is less than the inter-rater reliability for the strands coded within the JC Syllabus Landis and Koch still consider this value to denote substantial agreement. Analysis For the first phase of the study, learning outcomes coded as direct and indirect RP processes were enumerated. The total number of learning outcomes appearing in each mathematics content strand was then used with the aforementioned numbers to calculate the number of non-RP learning outcomes. The relationship between content strand and direct/indirect/non-RP learning outcomes by student learning level within each syllabi was examined using Pearson’s Chi Square and Fisher’s Exact Test (Field, 2009). In the analysis associated with the second phase of the study, direct and indirect processes were collapsed together as they both involved RP. The percentage of RP learning outcomes that contained pattern identification, conjecture formulation, and argument construction were calculated for each mathematics content strand across both syllabi in the following manner. First, the number of RP-based learning outcomes within each strand at Davis each student level was enumerated. For example, in the Statistics/Probability strand of the JC Syllabus there were a total of seven RP-based learning outcomes. Second, the number of learning outcomes associated with each RP category was counted. Using the example of the Statistics/Probability strand of the JC Syllabus, three of the seven RP-based learning outcomes involved pattern identification resulting in 3/7 * 100 or 42.9%. The total number of RP-based learning outcomes providing students with opportunities to identify patterns, formulate conjectures, and construct arguments were enumerated within each learning level across both syllabi. Because mathematical ideas can be coded as one or more of the three RP categories (pattern identification, conjecture formulation, or argument construction) a Cochran Q test, which takes interdependence across categories into account (Conover, 1999) was used to examine if the distribution of mathematical ideas across these three categories within a student learning level and syllabus were statistically significantly different from one another. It was not possible to conduct Chi Square tests on the relationship between student learning level and RP-based learning outcomes within either the JC Syllabus or LC syllabus as these learning outcomes were not independent because upper level learning outcomes subsumed learning outcomes at lower levels, but also included new learning outcomes specific to that level. Connectedness of RP learning outcomes to content. Each of the learning outcomes that had been coded as involving RP in the process described earlier were further examined to determine if they were content related or not. For instance, the following learning outcome from the Number strand of the JC Syllabus was considered to be content related: “investigate the nets of rectangular solids” (NCCA, n.d., p. 24). An RP learning outcome was judged to be unrelated to content if it did not mention any mathematical content or ideas as seen in the TME, vol. 11, no. 3, p. 689 following RP learning outcome from the Statistics/Probability strand of the LC Syllabus: “decide to what extent conclusions can be generalised [sic]” (NCCA, n.d., p. 18). The percentage of learning outcomes by level and strand that were content-related and not related to content were calculated and compared across strands and syllabi. Fisher’s Exact Test was used to determine if there were differences in the distribution of content and non-content related RP learning outcomes by strand for different student levels. An ∝= 0.05 level of significance was used for the Pearson’s Chi Square, Fisher Exact, and omnibus Cochran’s Q test. There were a total of three different RP levels resulting in three different comparisons for contrasts between two different RP levels. Contrasts using Cochran’s Q test were examined using an ∝= 0.0167 level of significance. This value comes from a Bonferroni correction to reduce type I error as there are three different comparisons to be made and .05/3 =.0167 (Field, 2009). Results Indirect, Direct, and Non-RP Learning Outcomes The relationship between direct/indirect/non-RP learning outcomes and content strand for foundation/ordinary level in the JC Syllabus were not statistically significant, 𝜒 2 (8) = 8.012, 𝑝 = .424. Similar results were found at the higher level in the JC Syllabus between content strand and direct/indirect/non-RP learning outcomes, 𝜒 2 (8) = 9.575, 𝑝 = .279. In the LC Syllabus the relationship between direct/indirect/non-RP learning outcomes and content strands for foundation level, (𝜒 2 [8] = 8.875, 𝑝 = .275), ordinary level, (𝜒 2 [8] = 5.801, 𝑝 = .667), and higher level, (𝜒 2 [8] = 11.113, 𝑝 = .164) were statistically nonsignificant. That is, the distribution of direct, indirect, and non-RP learning outcomes by student learning level was not statistically dissimilar across mathematics content strands for Davis either the JC or LC Syllabus. The frequency and percentage of learning outcomes that were categorized as involving direct, indirect, and non-RP across the foundation/ordinary and higher level for the JC Syllabus and for the LC Syllabus are shown in Table 3 and 4, respectively. In order to make comparisons in these categories across syllabi the learning outcomes at the foundation and ordinary levels in the LC Syllabus were combined. There was a statistically significant relationship between learning outcomes categorized as direct/indirect/non-RP and foundation/ordinary level students within the JC Syllabus and the LC Syllabus, 𝜒 2 (2) = 14.796, p = .001. A similar situation existed between these categories and higher level students in the JC and LC Syllabi, 𝜒 2 (2) = 20.637, p < .001. Table 3 Direct, Indirect, and Total Learning Outcomes in the JC Syllabus by Level Foundation/Ordinary Higher Ta Db Ic T D I 141 21 29 172 22 36 (14.9%) (20.6%) (12.8%) (20.9%) a T represents the total number of learning outcomes in this strand and level. b D represents the total number of direct RP-based learning outcomes in this strand and level. c I represents the total number of indirect RP-based learning outcomes in this strand and level. TME, vol. 11, no. 3, p. 691 Table 4 Direct and Indirect RP Learning Outcomes in the LC Syllabus by Strand and Level Foundation Ordinary Higher Ta Db Ic T D I T D I 97 19 9 183 21 13 240 29 15 (19.6%) (9.3%) (11.5%) (7.1%) (12.1%) (6.3%) a T represents the total number of learning outcomes in this strand and level. b D represents the total number of direct RP-based learning outcomes in this strand and level. c I represents the total number of indirect RP-based learning outcomes in this strand and level. Mathematical Ideas Categorized as Patterns, Conjectures, and Arguments Table 5 shows the breakdown in the three RP categories within the JC Syllabus when direct and indirect RP-based learning outcomes are combined. The differences across these three categories in the JC Syllabus for foundation/ordinary level students were statistically significant, Q(2) = 24.163, p < .001. There were statistically significant differences between pattern and conjecture, Q(1) = 15.000, p < .001, and between conjecture and argument, Q(1) = 19.282, p < .001. There were no statistically significant differences between pattern and argument, Q(1) = 5.628, p = .018. The differences across these three categories in the JC Syllabus for higher level students were statistically significant, Q(2) = 29.163, p < .001. There were statistically significant differences between pattern and conjecture, Q(1) = 15.000, p < .001, between conjecture and argument, Q(1) = 22.277, p < .001, and between pattern and argument Q(1) = 8.000, p = .005. Davis Table 5 Mathematical Ideas Categorized as RP by Student Level within the JC Syllabus Foundation/Ordinary Totalsd Higher Pa Cb Ac P C A 61 46 83 72 57 105 239 (50.0%) (34.0%) (70.0%) (50.0%) (34.5%) (70.7%) (100.0%) a P represents pattern identification. b C represents conjecture formulation. c A represents the construction of valid arguments. d Only the RP categories for the higher level have been added for this column as it contains all Appendix A shows the breakdown in the three RP categories within the LC Syllabus when direct and indirect RP-based learning outcomes are combined. The differences across these three categories in the LC Syllabus for foundation level students were statistically significant, Q(2) = 29.280, p < .001. The differences between pattern and conjecture were not statistically significantly different from one another, Q(1) = 2.000, p = .157. However, there were statistically significant differences between conjecture and argument, Q(1) = 15.000, p < .001, and between pattern and argument, Q(1) = 13.520, p < .001. The differences across these three categories in the LC Syllabus for ordinary level students were statistically significant Q(2) = 24.571, p < .001. The differences between pattern and conjecture were not statistically significantly different from one another, Q(1) = 4.000, p = .046. However, there were statistically significant differences between conjecture TME, vol. 11, no. 3, p. 693 and argument, Q(1) = 15.077, p < .001, and between pattern and argument, Q(1) = 10.286, p = .001. The differences across these three categories in the LC Syllabus for higher level students were statistically significant Q(2) = 54.320, p < .001. The differences between pattern and conjecture were not statistically significantly different from one another, Q(1) = 4.000, p = .046. However, there were statistically significant differences between conjecture and argument, Q(1) = 31.113, p < .001 and between pattern and argument Q(1) = 24.653, p = .001. Argument Purposes The most obvious pattern in the area of argument purposes is the omission of proof as falsification across both the JC and LC Syllabi as well as across different student learning levels. The differences for Foundation/Ordinary learning levels in proof purposes between the JC Syllabus and the LC Syllabus were statistically nonsignificant, 𝜒 2 (2) = 1.022, p = .600. A similar finding appeared in proof purposes at the higher level across both syllabi, 𝜒 2 (2) = .327, p = .849. Connectedness of RP Learning Outcomes to Content Tables 6 and 7 show the breakdown of content- and non-content related RP learning outcomes by strand within the JC Syllabus and LC Syllabus, respectively. The distribution of content and non-content RP-based learning outcomes by strand was statistically significant for foundation/ordinary level students as Fisher’s Exact test had a value of 13.615, p = .005. These differences were also statistically significant for higher level students as the value for Fisher’s Exact test was 16.844, p = .001. These differences also appeared at the foundation level (14.884, p = .001), ordinary (13.638, p = .004), and higher level within the LC Syllabus (14.679, p = Davis .003). Across both syllabi the majority of RP learning outcomes were divorced from specific mathematics content. The only strand within the JC Syllabus where this didn’t occur was in number. The ratio of non-content-related to content-related RP learning outcomes decreased as one moved from lower levels in both syllabi. For instance, in the JC Syllabus at the foundation/ordinary level this ratio was 2.2:1, while at the higher level this ratio had dropped to 1.6:1. Table 6 Frequency of Content and Non-Content Related RP Learning Outcomes by Content Strand and Level in JC Syllabus Strand Foundation/Ordinary Higher Ca NCb C NC Statistics/Probability 1 6 2 7 Geometry/Trigonometry 1 4 2 4 Number 8 7 12 7 Algebra 6 13 6 13 Functions 0 5 0 5 Total 16 35 22 36 a Content-related RP learning outcome. b Non-content-related RP learning outcome. TME, vol. 11, no. 3, p. 695 Table 7 Frequency of Content and Non-Content Related RP Learning Outcomes by Content Strand and Level in LC Syllabus Strand Foundation Ordinary Higher Ca NCb C NC C NC Statistics/Probability 1 5 2 5 2 6 Geometry/Trigonometry 2 4 2 5 4 5 Number 2 6 4 6 6 10 Algebra 0 4 0 4 1 4 Functions 0 4 1 4 2 4 Total 5 23 9 24 15 29 a Content-related RP learning outcome. b Non-content-related RP learning outcome Discussion As Hiebert (2003) has pointed out, mathematics standards are value judgments that are a composite of society-based values, best educational practices, research, and the visions of what professionals would like students to learn. While research cannot choose standards, this study represents an effort to investigate one country’s mathematics standards using an analytic framework generated for research into curriculum that is grounded in how mathematicians engage in the practice of mathematics and is aligned with descriptions of reasoning related to proof in school mathematics (NCTM, 2000). The placement of the Synthesis and Problem Solving skills section within each of the content strands in both the Irish JC and LC syllabus suggests that the authors of these documents believe that RP is essential for students’ learning of Davis mathematics. Consequently, this study was designed to examine the nature of RP within the learning outcomes in these syllabi. The two syllabi analyzed in this study are the main drivers of reform in Ireland’s centralized educational system as they set the learning outcomes from which students’ high stakes assessments at the Junior Certificate and Leaving Certificate levels are created. The designers of both syllabi did a good job of providing students with equitable opportunities to engage in direct and indirect RP learning outcomes as there were no statistically significant differences in these categories among different mathematics content strands in both syllabi. However, there were differences in the learning outcomes within these categories between the two syllabi. Thus, while each syllabus appeared to exhibit internal consistency in learning outcomes across these three categories there was less consistency across syllabi. When direct and indirect learning outcomes were combined and mathematical ideas were categorized as pattern identification, conjecture formulation, and argument construction statistically significant differences appeared within each syllabus by student learning level. In the JC Syllabus at the foundation/ordinary level, there were statistically significantly more conjecture opportunities than pattern identification or argument construction. In the JC Syllabus at the higher level students were given different opportunities to engage in all three categories. In the LC Syllabus students at all learning levels were given more opportunities to develop arguments than identify patterns or make conjectures. The falsification purpose of proof did not appear in either syllabus. In addition, there were no differences across syllabi by student learning level within argument proof purposes. In each syllabus by student learning level, there was a statistically higher prevalence of non-content than content related RP learning outcomes. In terms of the research community, this study developed and advanced the use of indirect TME, vol. 11, no. 3, p. 697 and direct reasoning-and-proving forms for the analysis of national curriculum documents. In addition, it supplied researchers with a set of keywords to be used to suggest the potential for indirect and direct RP forms. The lack of actual tasks appearing in curriculum documents necessitated an adapted RP framework based upon the work of Stylianides (2009). If national curriculum architects in other countries value RP, the framework presented in this paper can be used as a tool to construct documents integrating these processes into student learning outcomes. The results of this study provides researchers as well as educational stakeholders in other countries with a baseline set of data from which similar analyses of other national curriculum documents can be compared. Moreover, the location of RP elements within national curriculum documents can be followed up with the identification of these elements within textbooks, classroom lessons as well as the assessed curriculum to determine the alignment of these components vis-à-vis RP. Vocabulary Both direct and indirect instances of the framework were considered to be valid forms of RP in this study. However, indirect RP learning outcomes are more open to interpretation by readers and as the bandwidth of that interpretation increases there is a greater chance that interpretations by users of the curriculum documents may differ from those of the authors. For instance, within the number content strand the LC Syllabus expects ordinary and higher level students to “investigate the operations of addition, multiplication, subtraction and division with complex numbers C in rectangular for a + ib” (NCCA, n.d., p. 25). In this study, the verb investigate was coded as involving pattern identification, conjecture formulation, and argument construction. In an activity book for ordinary level leaving certificate students in Ireland (Keating, Mulvany, & O’Laughlin, 2012), students are asked to calculate (2 + 5i) + (3 + 4i) and later calculate (3 + 4i) Davis + (2 + 5i). Students are then asked to fill in the blank in the following sentence, This illustrates that addition is a c________________ operation on the set of complex numbers” (p. 62). Thus the textbook authors’ interpretations of the word investigation appearing in the syllabus in this instance focus on pattern identification only and the requirement that students make an assertion that is based only on two examples may promote an empirical proof scheme (Harel & Sowder, 1998). Vocabulary issues also arose in the section titled Synthesis and Problem-Solving Skills. That is, this section contained identification of patterns, development of conjectures, and the justification of conclusions yet from the title it is not obvious that this section pertains to reasoning-and-proving. As a result, national curriculum frameworks should carefully define mathematical processes such as synthesis, investigate, analyze, synthesis, etc. so that teachers, curriculum developers, and others interpret such words in similar ways that are aligned with the perspective of mathematics that policy statements are intended to promote. Another tact for national curriculum developers is to use direct RP forms to reduce the chances of misinterpretation if they wish to provide students with opportunities to engage in these mathematical processes. Presenting RP Apart from Content The appearance of RP in non-content-related learning outcomes in this study was similar to what Kim and Kasmer (2006) found with regard to reasoning in state curriculum frameworks in the United States. The decision of policy architects to embed mathematical processes such as RP apart from content may not lead to an increase in RP in mathematics classrooms for three reasons. First, teachers may choose not to read non-content-related RP learning outcomes thereby failing to implement them in the classroom because they are in pursuit of content that TME, vol. 11, no. 3, p. 699 students need to learn and that could be assessed on high stakes assessment. Second, for teachers who may have little experience learning about mathematical ideas through pattern identification, conjecture formulation, and argument construction, it may be difficult to decide how mathematical ideas that they may have learned in less meaningful ways could be reimagined to incorporate these processes when they are not directly connected to content in the syllabi documents. Third, as Bieda (2010) has noted, incorporating opportunities for students to engage in RP opportunities during classroom lessons takes time. If teachers feel rushed to prepare students for high stakes examinations they may feel that they do not have the time for such activities as they appear to be an addendum to the syllabus by their presence in locations other than where content is listed. Writers of national curriculum documents could seek to bridge the chasm between content and RP in two ways. First, they could weave the presence of RP as a central act of mathematics into individual learning outcomes. Take for example the learning outcome related to the fundamental principle of counting within the JC Syllabus. Currently, this learning outcome is stated in the following way: “apply the fundamental principle of counting” (NCCA, n.d., p. 15). As written, this learning outcome may focus teachers’ work on providing students with practice using this mathematical idea to solve problems and less emphasis may be placed on understanding why this principle is valid. This learning outcome could be rewritten in the following way to increase the possibility that teachers would more tightly integrate RP within student learning opportunities related to it: “develop and apply the fundamental principle of counting.” The word develop could be defined up front to involve the identification of patterns, development of conjectures, and/or construction of arguments. Second, a characteristic common to national standards documents is the listing of particular Davis learning outcomes or objectives. The words used to label this component could be altered to make RP a more central component of the process of learning mathematical ideas. For example, the column headings in the tables listing learning outcomes in the JC and LC syllabi are written as follows: “students should be able to” (p. 15). These headings could be changed to better emphasize the centrality of RP in learning outcomes through the alteration of these column headings to incorporate the following processes: pattern identification, conjecture formulation, and/or argument construction. Learning outcomes appearing in syllabi documents would then list mathematical ideas such as the fundamental principle of counting. Location of Mathematical Processes The Common Core State Standards for School Mathematics (CCSSM) (CCSSI, 2010), a set of national standards in the United States, contain a section titled, Standards for Mathematical Practice. These standards include a variety of mathematical processes some of which connect to RP such as: Construct viable arguments and critique the reasoning of others. This section appears at the beginning of the document apart from where content objectives are located. Both the Irish JC Syllabus and the LC Syllabus include a section titled Synthesis and Problem-Solving Skills containing components of the RP framework used here, but it appears at the end of each content strand. In both cases, mathematical processes that curriculum writers believe are central to the act of engaging in mathematics, appear apart from content objectives. This organization choice may cause teachers to underplay the role of RP in engaging in and learning mathematics (Cobb & Jackson, 2011). Proof Purposes The falsification purpose of proof was missing across all levels within both syllabi. Accordingly, students may not have an opportunity to learn about the fundamental role that TME, vol. 11, no. 3, p. 701 counterexamples play in showing the falseness of an assertion. The lack of falsification proof purposes in the Irish National Syllabi was also found in a set of U.S. reform-oriented mathematics textbooks for students ages 11-14 by Stylianides (2009). Policy statements as embedded within national syllabi should not only describe objectives in terms of specific mathematical ideas that students need to learn, but should also explicitly promote the development of counterexamples connected to content as specific learning outcomes. For example, students could be asked to show that matrix multiplication is not commutative. Conclusion Centralized educational systems can be thought of as an interconnected web of different components. National curriculum documents occupy the central position within this web and are connected to other components within this system via radials. Thus in understanding these systems, it is important to begin with the national curriculum documents that hold this system together. In a similar vein, mathematics can be considered a web, the center of which is held together via reasoning-and-proving. Components of the two national curriculum documents examined here as well as national standards in other countries (NCTM, 2000) value RP as a vehicle by which school students learn mathematics. This study represents an initial foray into the analysis of national curriculum documents through a research-based analytic framework designed to examine RP in curricula. This study provides methodological contributions to future national curriculum analyses through the development of indirect and direct RP categories and the creation of a set of keywords suggesting the potential for each of these processes. While the analyses described in this study focus on Irish national syllabi, the results suggest ways in which RP can be made more central within national curriculum frameworks in general. These suggestions include the careful definition of terminology, the connection of RP to mathematical Davis content, and the careful attendance to the different purposes that proof can play in school mathematics. References Bieda, K. N. (2010). Enacting proof-related tasks in middle school mathematics: Challenges and opportunities. Journal for Research in Mathematics Education, 41, 351-382. Cobb, P., & Jackson, K. (2011). Assessing the quality of the Common Core State Standards for Mathematics. Educational Researcher, 40, 183-185. Cogan, L., Schmidt, W., & Houang, R. (January, 2013). Implementing the Common Core State Standards for Mathematics: What we know about teachers of mathematics in 41 states: Working paper #33. East Lansing, MI: The Education Policy Center at Michigan State University. Common Core State Standards Initiative. (2010). Common Core State Standards for mathematics. Retrieved from http://www.corestandards.org/assets/CCSSI_Math%20Standards.pdf Conover, W. (1999). Practical nonparametric statistics (3rd ed.). New York: Wiley. Davis, J. D., Smith, D. O., Roy, A. R., & Bilgic, Y. K. (2013). Reasoning-and-proving in algebra: The case of two reform-oriented U.S. textbooks. International Journal of Educational Research, 64, 92-106. Department of Education and Skills. (2010). Report of the Project Maths Implementation Support Group. Accessed on May 10, 2013 at http://www.education.ie/en/Publications/Policy-Reports/Report-of-the-Project-MathsImplementation-Group.pdf De Villiers, M. (1990). The role and function of proof in mathematics. Pythagoras, 24, 17-24. TME, vol. 11, no. 3, p. 703 De Villiers, M. (1999). The role and function of proof. In M. De Villiers (Ed.), Rethinking proof with the Geometer’s Sketchpad (pp. 3-10). Key Curriculum Press. Dossey, J., Halvorsen, K., & McCrone, S. (2008). Mathematics education in the United States 2008: A capsule summary fact book. Reston, VA: National Council of Teachers of Mathematics. Epp, S. S. (1998). A unified framework for proof and disproof. Mathematics Teacher, 91, 708713. Eurydice. (2011). Mathematics education in Europe: Common challenges and national policies. Education, Audiovisual and Culture Executive Agency. Accessed on May 16, 2013 from http://eacea.ec.europa.eu/education/eurydice/documents/thematic_reports/132en.pdf Field, A. (2009). Discovering statistics using SPSS (3rd Ed.). London: Sage Publications. Hanna, G. (1990). Some pedagogical aspects of proof. Interchange, 21(1), 6-13. Hanna, G. (2000). A critical examination of three factors in the decline of proof. Interchange, 31, 21-33. Hanna, G, & de Bruyn, Y. (1999). Opportunity to learn proof in Ontario grade twelve mathematics texts. Ontario Mathematics Gazette, 37(4), 23-29. Harel, G., & Sowder, L. (1998). Students’ proof schemes: Results from exploratory studies. In A. Schoenfeld, J. Kaput, & E. Dubinsky (Eds.), Research in collegiate mathematics education, III (pp. 234-283). Washington, DC: Mathematical Association of America. Hiebert, J. (2003). What research says about the NCTM Standards. In J. Kilpatrick, W. G. Martin, & D. Schifter (Eds.), Research companion to Principles and Standards for School Mathematics (pp. 5-23). Reston, VA: National Council of Teachers of Mathematics. Davis Jitendra, A. K., Star, J. R., Dupuis, D. N., & Rodriguez, M. C. (2013). Effectiveness of schemabased instruction for improving seventh-grade students’ proportional reasoning: A randomized experiment. Journal of Research on Educational Effectiveness, 6(2), 114-136. Johnson, G. J., Thompson, D. R., & Senk, S. L. (2010). Proof-related reasoning in high school textbooks. Mathematics Teacher, 103(6), 410-418. Keating, M., Mulvany, D., & O’Loughlin, J. (2012). Active maths 3 activity book: Leaving certificate ordinary level. Dublin: Folens. Kim, O.K., & Kasmer, L. (2006). Analysis of emphasis on reasoning in state mathematics curriculum standards. In B. J. Reys (Eds.), The intended mathematics curriculum as represented in state-level curriculum standards: Consensus or confusion? (pp. 113-133). Charlotte, NC: Information Age Publishing. Landis, J. R., & Koch, G. G. (1977). The measurement of observer agreement for categorical data. Biometricks, 33, 159-174. Martin, G., Carter, J., Forster, S., Howe, R., Kader, G., Kepner, H., et al. (2009). Focus in high school mathematics: Reasoning and sense making. Reston, VA: National Council of Teachers of Mathematics. McCallum, W. (2012, July). The Common Core State Standards in Mathematics. Paper presented at the 12th Meeting of the International Congress of Mathematics Education, Seoul, South Korea. Retrieved from http://math.arizona.edu/~wmc/Research/2012_07_12_ICME_McCallum.pdf National Council for Curriculum and Assessment. (n.d.). Leaving certificate mathematics syllabus: Foundation, ordinary & higher Level: 2014 examination. Author. National Council for Curriculum and Assessment. (n.d.). Junior certificate mathematics syllabus: 2015 examination. Author. TME, vol. 11, no. 3, p. 705 National Council for Curriculum and Assessment. (2012). Project maths: Reviewing the project in the initial group of 24 schools – report on school visits. Author. National Council of Teachers of Mathematics. (2000). Principles and standards for school mathematics. Reston, VA: Author. Nordström, K., & Löfwall, C. (2005). Proof in Swedish upper secondary school mathematics textbooks – the issue of transparency. Proceedings of the 4th Congress of the European Society for Research in Mathematics Education (CERME4), pp. 448-457. Spain: ERME. Porter, A., McMaken, J., Hwang, J., & Yang, R. (2011). Common core standards: The new US intended curriculum. Educational Researcher, 40(3), 103-116. Reilly, G. (August 15, 2012). Almost 11,000 leaving cert students to benefit from bonus Maths points. Accessed on May 10, 2013 at http://www.thejournal.ie/leaving-cert-maths-bonuspoints-cao-559255-Aug2012/ Ross, K. (1998). Doing and proving: The place of algorithms and proof in school mathematics. American Mathematical Monthly, 3, 252-255. Schoenfeld, A. H. (2009). Series editor’s foreword: The soul of mathematics. In D. A. Stylianou, M. L. Blanton, & E. J. Knuth (Eds.), Teaching and learning proof across the grades: A K-16 perspective (pp. xii-xvi). New York, NY: Routledge. Skemp, R. R. (1976). Relational understanding and instrumental understanding. Mathematics Teaching, 77, 20-26. Smyth, E. (2009). Junior cycle education: Insights from a longitudinal study of students. ESRI Research Bulletin, 4(1), 1-5. Stacey, K., & Vincent, J. (2009). Modes of reasoning in explanations in Australian eighth-grade mathematics textbooks. Educational Studies in Mathematics, 72, 271-288. Davis Steen, L. (1999). Twenty questions about mathematical reasoning. In L. Stiff (Ed.), Developing mathematical reasoning in grades K-12: 1999 Yearbook (pp. 270-285). Reston, VA: National Council of Teachers of Mathematics. Stylianides, A. J. (2007). Proof and proving in school mathematics. Journal for Research in Mathematics Education, 38, 289-321. Stylianides, G. J. (2005). Investigating students’ opportunities to develop proficiency in reasoning and proving: A curricular perspective. Unpublished dissertation, University of Michigan. Stylianides, G. J. (2009). Reasoning-and-proving in school mathematics textbooks. Mathematical Thinking and Learning, 11(4), 258-288. Thompson, D. R., Senk, S. L., Johnson, G. J. (2012). Opportunities to learn reasoning and proof in high school mathematics textbooks. Journal for Research in Mathematics Education, 43, 253-295. Walkington, C., Petrosino, A., & Sherman, M. (2013). Supporting algebraic reasoning through personalized story scenarios: How situational understanding mediates performance. Mathematical Thinking and Learning, 15(2), 89-120. TME, vol. 11, no. 3, p. 705 Appendix A Mathematical Ideas Categorized as RP by Student Level within the LC Syllabus Foundation Ordinary Totalsd Higher Pa Cb Ac P C A P C A 19 17 45 30 26 54 34 30 77 152 (32.1%) (28.6%) (78.6%) (41.2%) (35.3%) (76.5%) (36.4%) (31.8%) (81.8%) (100%) a P denotes pattern detection. b C denotes conjecture formulation. c A denotes argument construction. d Only the RP categories for the higher level have been added for this column as it contains all learning outcomes at the foundation and ordinary levels. Davis TME, vol. 11, no. 3, p.707 An Examination of Pre-service Secondary Mathematics Teachers’ Conceptions of Angles Melike Yigit 1 Dokuz Eylul University, Turkey Abstract: The concept of angles is one of the foundational concepts to develop of geometric knowledge, but it remains a difficult concept for students and teachers to grasp. Exiting studies claimed that students’ difficulties in learning of the concept of angles are based on learning of the multiple definitions of an angle, describing angles measuring the size of angles, and conceiving different types of angles such as 0-line angles, 1- line angles, and 2-line angles. This study was designed to gain better insight into pre-service secondary mathematics teachers’ (PSMTs) mental constructions of the concept of angles from the perspective of Action-ProcessObject-Schema (APOS) learning theory. The study also explains what kind of mental constructions of angles is needed in the right triangle context. The four PSMTs were chosen from two courses at a large public university in the Midwest United States. Using Clements’ (2000) clinical interview methodology, this study utilized three explanatory interviews to gather evidence of PSMTs’ mental constructions of angles and angle measurement. All of the interview data was analyzed using the APOS framework. Consistent with the existing studies, it was found that all PSMTs had a schema for 2-line angles and angle measurement. PSMTs were also less flexible on constructions of 1-line and 0-line angles and angle measurement as it applied to these angles. Additionally, it was also found that although PSMTs do not have a full schema regarding 0-line and 1-line angles and angle measurement, their mental constructions of 1-line and 0-line angles and angle measurement were not required in right triangles, and the schema level for 2line angles was sufficient for constructions of right triangle context. Key Words: The Concept of Angles, APOS Learning Theory, Angles and Angle Measurement, Right Triangle, Pre-service Secondary Mathematics Teachers The concept of angles is a key factor within geometry, and learning the definition of an angle and relationships between an angle and its components is an important step to success in the discipline. Numerous researchers have pointed out that angles, angle measurements, and 1 [email protected] The Mathematics Enthusiast, ISSN 1551-3440, vol. 11, no. 3, pp. 707-736 2014© The Author(s) & Dept. of Mathematical Sciences-The University of Montana Yilgit angle rotation concepts are central to the development of geometric knowledge (Browning, Garza-Kling, & Sundling, 2008; Clements & Battista, 1989, 1990; Keiser, 2000, 2004; Mitchelmore & White, 1998, 2000; Moore, 2013, 2014). In addition, the National Council of Teachers of Mathematics (NCTM) Standards (1991, 2000) have stressed the importance of the concept of angles in mathematics curriculum, but it remains a difficult concept for students and teachers to grasp (Clements & Battista, 1989, 1990; Keiser, 2004; Mitchelmore & White, 1998). Students have a variety of difficulties in learning the concept of angles. Researchers claimed that difficulties are related to learning the multiple definitions of an angle, describing angles, measuring the size of angles, and conceiving different types of angles such as 0-line angles (an angle whose degree is 0 and 360 degrees), 1- line angles (an angle whose degree is 180 degrees), and 2-lines angles (an angle where both rays of the angle are visible) (Browning et al., 2008; Keiser, 2004; Mitchelmore & White, 1998). While there are studies that shed light on students’ difficulties with the concept of angles, there is limited research that explains how students learn the concept. Specifically, there is a lack of research that illuminates students’ mental constructions of the concept of angles and how their mental constructions are related to their learning of more advanced concepts such as right triangles. In other words, there is need to expand the research in mathematics education concerning PSMTs’ mental constructions of the concept of angles since angles are the fundamental concept to learn more advanced concepts. Therefore, this study was designed to describe and analyze pre-service secondary mathematics teachers’ (PSMTs) mental constructions of the concept of angles from the perspective of Action-Process-Object-Schema (APOS) learning theory (Arnon, Cottrill, Dubinsky, Oktac, Roa Fuentes, Trigueros, & Weller, 2014; Asiala, Brown, DeVries, Dubinsky, Mathews, & Thomas, 1996; Clark, Cordero, Cottrill, TME, vol. 11, no. 3, p. 709 Czarnocha, DeVries, John, Tolias, & Vidakovic, 1997; Dubinsky, 1991, 2010; Dubinsky & McDonald, 2001). The APOS framework was used to describe PSMTs’ non-observable mental constructions of the concept of angles. Study of the proposed research questions expands the limited literature on the learning of the concept of angles through the description of PSMTs’ mental constructions of angles. The study also describes what kind of mental constructions of angles is needed in the right triangle context. Particularly, the descriptions can help researchers better understand PSMTs’ levels of mental constructions—in terms of their mental actions, processes, objects, and schemas—of the concept of angles, which is foundational in the development of research-based curricula for the teaching and learning of angles. Research Literature on the Concept of Angles Existing studies on students’ understanding of the concept of angles have considered elementary students’ understanding of angle concept (Browning et al., 2008; Clements & Battista, 1989, 1990; Keiser, 2004; Mitchelmore & White, 1998). Although angle is a key concept within geometry, and learning the concept is a significant step to success in the discipline, all these studies indicated the limitations of those students’ knowledge of angles. They claimed that students’ difficulties in learning of the concept of angles are based on learning of the multiple definitions of an angle, describing angles, measuring the size of angles, and conceiving different types of angles such as 0-line angle, 1- line angle, and 2-line angle. Many researchers proposed that three common representations are used to define an angle in mathematics education: an amount of turning between two lines (rotation), a pair of rays with a common point (vertex), and the region formed by the intersection of two lines (wedge) (Browning et al., 2008; Keiser, 2004; Mitchelmore & White, 2000). Particularly, Keiser (2004) Yilgit compared sixth-grade students’ definitions of angles to historical definitions of an angle. According to Keiser (2004), the multiple definitions of an angle creates confusion for students as they try to learn the basic concepts of angles; she stated, “all definition put limitations on the concept by focusing more heavily on one facet more than any of the others” (p. 289). Keiser (2004) also found that those students thought of angles as a vertex, rays, a corner, and a point, and they were confused when they tried to identify what part of angles exactly was being measured when they measured an angle. Mitchelmore and White (2000) found that students in second to eighth grades struggled with identifying angles in physical situations. Their struggles stemmed from their need to identify both sides of angles. They claimed that the simplest angle concept was likely to be limited to situations where both sides of the angle were visible— 2-lines angles. However, when students were faced with a 1-line angle; they struggled to learn these situations as angles. Moreover, a 0-line angle is even more difficult for students to learn. Clements and Battista (1989, 1990) proposed using a computer-based instructional method to teach the concept of angles. They specifically investigated the effects of computer programming in Logo to help third and fourth grades students develop and improve their learning. In Logo programming, students learn geometrical concepts by understanding and directing a turtle’s movement, so based on the turtle’s movement, Clements and Battista (1990) claimed that the program might be helpful “to elaborate on, and become cognizant of, the mathematics and problem-solving processes implicit in certain kinds of intuitive thinking” (p. 356), and to improve their understanding of the definition of angle. Browning et al. (2008) also moved beyond paper-and-pencil task in teaching the concept of angles, and they developed activities that include hands-on activities, graphing calculator applications, and computer TME, vol. 11, no. 3, p. 711 software, Logo. Specifically, the researchers examined how technology-based activities helped sixth grade students to develop their knowledge of multiple representations of the concept of angles. In another study, Moore (2013, 2014) investigated pre-calculus students’ learning of angle measurement and trigonometry, and identified that quantitative and covariational reasoning are key factors to learn angle measurement and trigonometry in both unit circle and right triangle contexts. For Moore (2013), quantitative reasoning is involved in learning angle measurement. He proposed that an arc approach to angle measure can foster coherent experiences for students, and to improve their thinking in both unit circle and right triangle contexts. According to Moore (2013), students can be taught to connect angle measure to measuring arcs and conceive of the radius as a unit of measure. He concluded students needed to construct strong concepts of angles and angle measurement to conceptualize advanced concept such as unit circle and right triangle. All these existing studies have revealed students’ limited understanding of the concept of angles related to the multifaceted nature of the concept. In order to overcome students’ difficulties of the concept, the researchers suggested that students should be taught using multiple definitions of an angle so that they will acquire and develop more comprehensive knowledge of angles. It is also more productive to present an angle by integrating multiple representations into instructional activities rather than simply giving a static definition of an angle (Keiser, 2004; Mitchelmore & White, 2000). In addition, Clements and Battista (1989, 1990) and Browning et al.’s (2008) studies demonstrated that the well-designed technology activities greatly facilitate students’ development and exploration of angles and angle measurement. All these previous studies illustrated a need to gain better insight into adult learners’—PSMTs’—learning of the concept of angles as well as the relationships between these Yilgit learners’ levels of mental constructions of angles and more advanced concepts such as right triangles. Theoretical Perspective The APOS learning theory was used as a theoretical lens to determine PSMTs’ mental constructions of the concept of angles. Dubinsky and his colleagues (Arnon et al., 2014; Asiala et al., 1996; Clark et al., 1997; Dubinsky, 1991; Dubinsky & McDonald, 2001) extended Piaget’s theory of reflective abstraction, and applied it to advanced mathematical thinking to develop APOS learning theory. Their main goal in developing APOS theory was to create a model to investigate, analyze, and describe the level of students’ mental constructions of a mathematical concept (Asiala et al., 1996). Specifically, a model is a description of how a schema for a specific mathematical concept develops and how the mental constructions of actions, processes, and objects can be used to construct the schema, and it is a useful guide for researchers to follow when investigating the levels of students’ learning of a concept (Asiala et al., 1996). According to Dubinsky (1991), learning takes place in a student’s mind through the construction of certain cognitive mechanisms, which includes mental constructions of actions, processes, objects and organizing them into schemas (See Figure 1). According to Asiala et al. (1996): An individual’s mathematical knowledge is her or his tendency to respond to perceived mathematical situations by reflecting on problems and their solutions in a social context and by constructing or reconstructing mathematical actions, processes and objects and organizing these in schemas to use in dealing with situations. (p. 7) Specifically, students use their existing knowledge of a physical or mental object to attempt to learn a new action. In order to learn a new concept, students carry out transformations by reacting to external cues that give exact details of which steps to take to perform an operation. TME, vol. 11, no. 3, p. 713 Then, an action might be interiorized into a process when an action is repeated, reflected upon, and/or combined with other actions. At the process level, students perform the same sort of transformations that they did at the action level, but the process level is not triggered by an external stimuli; the process level is an internal construction. Once students are able to reflect upon actions in a way that allows them to think about the process as an entity, they realize that transformations can be acted upon, and they are able to construct such transformations. In this case, the process is encapsulated into a cognitive object (Asiala et al., 1996). Students then organize the actions, processes, and objects, as well as prior schemas, into a new schema that accurately accommodates the new knowledge discovered from the mathematical problem. Figure 1. Schemas and their constructions (Adapted from Asiala et al., 1996) Methodology Because it was difficult to identify and describe PSMTs’ non-observable mental constructions due to their highly internalized nature, this study utilized a series of controlled interviews, using the clinical interview methodology (Clements, 2000; Ericsson & Simon, 1993; Goldin, 2000; Newell & Simon, 1972) that is derived from Piaget’s (1975) work. The main purpose of using clinical interviews in this study was to gather evidence of PSMTs’ ways of reasoning and thinking and their level of mental constructions (Clements, 2000). Using the Yilgit clinical interview methodology, I was able to use questioning to expose hidden structures and processes in their thoughts, ideas, and levels on the APOS theoretical framework as the interviews progress (Clements, 2000). Participants and Settings Participants of this study were PSMTs from two courses—The Teaching of Mathematics in Secondary Schools and Geometry—at a large public university in the Midwestern United States. One initial interview and five explanatory interviews were conducted with the participants. This paper explains a part of this large study and describes the initial interview, the first and second explanatory interviews, and a part of the third explanatory interview. The initial interview session was used to select the required four to eight participants. The selection was based on the interested PSMTs’ willingness to explain and articulate their thought processes, their experience with learning and teaching with technology, and their computer abilities since the tasks that were used in this study were adopted and developed in dynamic geometry software (DGS), GeoGebra. The initial interview was conducted with all volunteered seven participants in order to select required participants. Four—out of seven—PSMTs’ (Linda, Kathy, Dana, and Jason) were selected to participate in the subsequent explanatory clinical interviews. Both the initial interview and explanatory interviews were conducted in one-on-one sessions. One-on-one interviews were used because I anticipated that they would provide me with more reliable data than small group interviewing. Two different video cameras were used to record the interviews. One of the cameras was focused on the PSMTs and the researcher to capture the interactions; the other camera was zoomed in on the computer screen to record the TME, vol. 11, no. 3, p. 715 PSMTs’ responses more closely. The recordings captured the PSMTs’ mathematical utterances, gestures, and characteristics of speech. Data Collection The data collection included two separate parts: initial interview and five explanatory interviews. In initial interview, each of volunteered PSMTs was interviewed for half an hour, and each of them was given the same interview questions and tasks. Four PSMTs were selected based on the interests and their willingness to explain and articulate their thought processes, their experience with learning and teaching with technology, and their abilities of using GeoGebra. The initial interviews were not used to give insight into PSMTs’ existing mental constructions. After four PSMTs were selected, the explanatory interview sessions began. I conducted 60-minute, one-on-one interviews with each PSMT. The goal of the explanatory interviews was to help me gather evidence of PSMTs’ ways of reasoning, thinking, and current knowledge of an angle, angle measurement, right triangles, relationship between angles and side lengths in a right triangle (RASR), and trigonometric ratios. The PSMTs’ actions in response to the tasks, and articulation of their thought process and reasoning were used as evidence to investigate the PSMTs’ mental actions, processes, objects, and schemas for the specific mathematical concept in each task. The main goal of the first and the second explanatory interviews was to gain evidence of PSMTs’ existing levels of mental constructions of the concept of angles and angle measurement. In order to explore evidence of PSMTs’ existing level of the mental constructions of angles, PSMTs were given tasks that were adopted from Clements and Battista (1989, 1990) and Moore’s (2010) studies and I built the tasks in GeoGebra. The goals of the third interview were to explore how PSMTs are connecting their mental constructions for the concepts of angles and Yilgit angle measurement to construct knowledge of right triangles and to gain evidence of PSMTs’ current levels of mental constructions in regards to RASR. The goal of the fourth and fifth interviews was to gain evidence of how PSMTs might reflect their knowledge of RASR to response the more advanced tasks, such as trigonometric ratios. This paper only focuses on the findings from the first and second interviews, and a part of the third interview. Data Analysis All of the data collected during the clinical interviews were analyzed using the APOS framework. This framework utilizes scripting, building a table that describes evidence points, transcribing the videos of the interview sessions, coding, describing PSMTs’ levels of mental constructions of the concept of angles (Arnon et al., 2014; Asiala et al., 1996). Once an explanatory interview session was completed, the video-recorded interviews were carefully transcribed; this was the preliminary level of the analysis. Once the transcription was completed, the video records were synced. The synced videotape data was vital for capturing moments of the PSMTs’ verbal and nonverbal behaviors, speech characteristics, mathematical utterances, gestures, and sketches that they drew on GeoGebra. After compiling the interpretive notes of the synced video records, the transcript was scripted to find evidence of PSMTs’ mental actions, processes, objects, or schemas for a particular concept. In this process, the researcher used a four-column table where the first column lists the code I assigned to an observed piece of evidence (as an action, a process, an object, or a schema), the second column contained my descriptions and reasons for my interpretations, the third column contained the original transcript of the event that leaded to my inferences, and the fourth column contained any extra notes. The combination, interactions, and coordination of the PSMTs’ mental actions, processes, objects and TME, vol. 11, no. 3, p. 717 schemas regarding the concept of angles and angle measurement were investigated and interpreted. Results The first and second explanatory interviews specifically were designed to investigate PSMTs’ mental constructions of the concept of angles and angle measurement, specifically 0line, 1-line and 2-line angles. In addition, in the third interview, one of the goals was to explain what kind of mental constructions of the concept of angles is needed in the context of right triangle. Following section describes PSMTs’ mental constructions of the concept of angles and how their mental constructions of angles are related to their mental constructions of right triangles. PSMTs’ APOS Levels on Angles and Angle Measurement PSMTs’ mental constructions of 2-line angles. The first interview was started with PSMTs’ drawings and definitions of an angle, and each PSMT defined an angle differently, but three representations were used to define an angle: angle as rotation, vertex, and wedge (See Table 1). Table 1 PSMTs’ definition of an angle Name Linda Kathy Jason Angle Definition “An angle is a distance between two intersecting rays, so this could be viewed as line segments that would continue past the points [she was drawing and pointing out the arrows] (See Figure 2).” “My own words, OK. The definition of an angle is the… [long pause] It is the relationship between some line connected to the base, and the base itself [she was drawing two lines to define the angle] (See Figure 4.1). That is… It’s like a distance, but not a distance of a straight line distance. It doesn’t imply… This is like further versus farther. You know what I mean. With the u versus a. It is kind of the spread, I guess. A spread between two lines is an angle.” “I defined it earlier, as the measure between two lines…um…but, I guess, it could… it’s the position, I guess, that the lines are drawn from a single point. Not necessarily…well, I Representations of an angle Interior region between the intersection of two lines Rotation Wedge and Interior region between the intersection of two lines Yilgit Dana guess that’s still kind of the measurement. I don’t know really how to explain it then…” “An angle in my mind would be a line or a vector in two different directions [indicating the different directions with the arrow] (See Figure 4.1).” Interior region between the intersection All PSMTs’ definitions of an angle were directly related to their mental constructions of 2-line angles (See Table 1). All PSMTs drew 2-line angles to illustrate and discuss their definitions of an angle (See Figure 2). Throughout the interviews, it was determined that when PSMTs saw two segments or rays in a given figure, they could easily identify where the angle was, as well as they measure the angle. Therefore, it was inferred that they needed to see two segments or rays with one common point as an object to identify and measure that angle. The PSMTs’ use of a physical object to act upon revealed the evidence of their action level for 2-line angles and angle measurement concepts. Figure 2. Linda, Kathy, Jason, and Dana’s drawings to define an angle To investigate whether they had reached the process level for 2-line angles, PSMTs were asked to draw an angle whose measure was greater than the angle that they previously drew. The PSMTs successfully drew a greater angle, and explained why the angle measure was greater. They generalized actions by explaining why the second angle they drew was greater than the first angle measure. In addition, when they were given a series of different figures (See Figure 3), they correctly identified all 2-line angles such as angle B, angle C, angle M. They also classified them as less than or greater than 90 degrees, 180 degrees, or 360 degrees. Their responses, TME, vol. 11, no. 3, p. 719 namely generalizing their mental constructions and applying them to every object, revealed evidence of PSMTs’ process level for 2-line angles and angle measurement. Figure 3. The task that includes 2-line angles To investigate whether PSMTs had reached the object level, they were asked to compare the angles in a pair and explain how one angle could be described as a transformation of another angle (See Figure 4) (The task was adapted from Clements and Battista (1989)). The PSMTs acted on the figures using their mental constructions regarding 2-line angles. All four PSMTs proposed that the position of the angle could be transformed by moving the second angle on top of the first angle, and checking which had a larger measure. They acted on angles they identified and explained how one angle might be described as a transformation of another angle. Since object level is characterized by acting on a dynamic figure and realizing that transformations can be acted upon (Arnon et al., 2014; Asiala et al., 1996), the PSMTs’ approaches were evidence that they were operating at the object level regarding 2-line angles and angle measurement. Yilgit Figure 4. The task to investigate PSMTs’ object level regarding 2-line angles To explore the relationships between this general view of 2-line angles as related objects, PSMTs were asked to describe angles that measure between 1 degree and 34 degrees, or 180 degrees, 360, or n degrees as well as describe the relationships between these angle measurements (The task was adapted from Moore (2010)). All the PSMTs described the relationships between 1 degree angle and any other angle by describing them in terms of 1 degree angle. Jason’s description was, “34 degrees is the one degree, 34 times. So, within the 34 degree angle, there’s 34 one degree measures”, and other participants’ descriptions were similar to Jason’s description. Particularly, all PSMTs described any angle’s measurement as a transformation of another angle when they used two lines to draw. Since the object level is characterized by seeing the transformations can be acted upon it (Arnon et al., 2014; Asiala et al., 1996), PSMTs showed evidence of the object level of angle measurement for 2-line angles. Evidence of schema for 2-line angles and angle measurement involves the use of action, process, and object levels in non-standard problem situation. All the PSMTs used their schemas and unpacked them, and reversed to the action, process, and objects levels as needed to solve non-routine tasks in the subsequent interviews. For instance, when they needed to use their 2-line TME, vol. 11, no. 3, p. 721 angles schema to solve the task regarding right triangle context as it is mentioned in the following sections, they unpacked their schema to the action, process, or object levels to operate on the tasks. It shows that all the PSMTs demonstrated the evidence of their constructed schema associated with 2-lines angles and angle measurement. PSMTs’ mental constructions of 1-line angles. Mitchelmore and White (2000) and Keiser (2004) claimed that when students are faced with 1-line angles, they struggle to identify them as angles. They specifically look for a vertex point where the two lines connect and, not finding a vertex, conclude there is no angle. In order to explore PSMTs mental constructions of 1-line angles, they were asked to find the angles in given figures (See Figure 5). All PSMTs’ responses were similar to those given by the students in Mitchelmore and White (2000) and Keiser’s (2004) studies. Figure 5. The task to investigate PSMTs’ mental constructions for 1-line angle When Linda was asked to find the angles in given figures (See Figure 5), she immediately identified all the 2-line angles in the figures. Then, she was asked whether there was an angle in any of the other figures. Pointing to the line segments such as AB, Linda proposed: Yilgit L: I am gonna say that these are simply line segments because [of] the way they were drawn, there are not multiple pieces intersecting. Linda’s reasoning was consistent with her definition of an angle as “a distance between two intersecting rays or line segments.” She reasoned that there were no angles in line segments since “the line segment stopped at two points.” Linda indicated that she needed to see two intersecting pieces—lines, rays, or line segments—to label the object as an angle. In other words, she needed to act on a physical object such as 2-line angles that provided specific details to determine whether there is an angle. Since the action level is characterized by using a physical object to act upon it, her approach showed evidence of the action level in terms of 1-line angles. Kathy and Dana asserted that they needed to see a vertex point or imagine a vertex point to classify the line segments as angles. When Kathy was asked to find the angles in given figures, she immediately said that the line segments “were flat angles”, and identified an imagined vertex point to define an angle. Dana also stated that line segments were just straight lines if you did not define the vertex point. Kathy and Dana’s approaches to 1-line angles demonstrated evidence of their action levels for 1-line angles. Jason’s response was similar to other PSMTs’ responses, but additionally he asserted that “a straight line includes an angle whose measure is 180 degrees.” Jason initially proposed that angles could be defined in a straight line or in a line segment. He suggested, “I mean, I can see two angles because of one side and the other one, but ideally it’s only one.” He was relying on the fact that “a line segment includes a 180o angle” and did not specifically show where the angle was even after prompting. His idea was a response to the presented physical objects in the figure based on the researcher’s prompting like other participants. His response is also evidence that Jason was at the action level in terms of 1-line angles. TME, vol. 11, no. 3, p. 723 To elicit evidence of the process level for 1-line angles, the PSMTs were given a set of figures in Figure 6. They were asked to find and measure any angles that they could be determined. Linda and Dana’s responses were similar while Kathy and Jason reasoned a bit differently. Both Linda and Dana indicated that they needed to see a vertex point or two intersecting line segments or rays to define a 1-line angle in a given figure. Both of them stated that they only determined and measured the angles on points A, B, I, and S (See Figure 6). Otherwise, there were no angles since they did not see a vertex point to define an angle. Both Linda and Dana’s generalizing the actions for every condition was evidence of their process levels for 1-line angles (Arnon et al., 2014). Figure 6. The task that includes 1-line angles On the contrary of his response to the previous task, Jason then stated that an angle could be defined as the measurement between two lines, which meant that a line or line segment did not represent an angle for him. Similar to Linda and Dana’s responses, Jason stated that there were angles on points A, B, I and S, because he could see the intersection of two lines at these points. As did the other PSMTs, he looked for a vertex point where the two lines connect to define a 1-line angle for every object, which provided evidence of the process level for 1-line angles and angle measurement. Yilgit Kathy immediately identified that a line or a line segment includes a 180o angle while Linda and Dana indicated that there was no angle on a line or a line segment. Kathy imagined that there was a vertex point on line AB to identify the angle. However, she indicated that if she did not imagine a vertex, there would not be an angle. Kathy’s generalization was evidence of her process level for 1-line angles and angle measurement. To sum up, all of the PSMTs demonstrated evidence of the process level of 1-line angles to see an imagined or observable vertex point to posit the existence a measured for an angle. All required either an imagined or observable vertex point to posit the existence of measurement for an angle, which was evidence of the process level regarding 1-line angles and angle measurement. However, they did not provide any evidence that they reached the object or schema level. So, it was inferred that they remained at the process level in terms of 1-line angles and angle measurement. PSMTs’ mental constructions of 0-line Angles. 0-line angles are even more difficult to identify since no visible points or rays are given (Keiser, 2004; Mitchelmore & White, 2000). To investigate PSMTs’ constructions of 0-line angles, they were asked to find angles (if there were any) in a set of figures which included a semi-circle, the letter B that was drawn using semicircles and line segments, the letter S, and a circle (See Figure 7). TME, vol. 11, no. 3, p. 725 Figure 7. The task to investigate PSMTs’ mental constructions for 0-line angle Linda, Kathy, and Jason immediately asserted that there was no angle in the semi-circle. Linda went further and explained that “the semi-circle does not have an angle” unless they clarified a point represented at the center of the semi-circle and drew radius from to center to the points on the semi-circle (See Figure 8). Linda created a drawing to illustrate the possible angles by creating the center of the semi-circle and drawing the radius (See Figure 8). Linda, Kathy, and Jason also explained that there was no angle in the letter S because it is a curve. Figure 8. Linda’s drawing to indicate whether there was an angle in semi-circle Dana reasoned that both a semi-circle and the letter S include angles. She could identify semi-circles as angles without a given center because a semi-circle represents an arc for her. Dana initially indicated that there was no angle in S because there were not any points on S to define an angle. She also added that if she was allowed to define 2 points on S, she could identify Yilgit an arc and an angle (See Figure 9). When Dana was asked to show those angles, she said there were many angles in S when she added the points on S as shown in Figure 9. Dana explained: D: Well, I mean as you draw, as you draw those [pointing out the arc lengths on S], then you would have some other points that you would define. So, I mean if you define some other points, then you would have some angle between those 2 points on that surface. And, again here, I determine the angle between those 2 points, and you could do the same thing on the outside. Figure 9. Redrawing of Dana’s response to show the angles on S In contrast to other PSMTs, a curve represented an angle for Dana if she was given or allowed to use two points on the curve. After investigating whether a curve and a figure represented an angle for the PSMTs, they were asked whether a circle includes an angle. As in the previous task, Linda, Kathy, and Jason’s responses were similar to each other. They all indicated that there was no angle in a circle since it is a curve and no two straight lines were visible. Kathy however suggested that if she added lines on the circle, she could determine the angle. Kathy stated: K: [pause] This is… It’s all dependent on what you add, because, like, you can say that there are degrees here, you can, like, move fully a whole circle inside there, then there are 360 degrees, but it’s… It’s… they’re no lines with which build an angle in this position. TME, vol. 11, no. 3, p. 727 Linda, Kathy, and Jason used a physical or mental object to reason about 0-line angles, which was evidence of the action level for 0-line angles. Dana initially suggested that “a circle has a continuous angle, never starts and never finishes.” When she was asked to show the angle in a given figure, she indicated, as did the other participants, that she needed points to create line segments to define an angle, which was also evidence of her action level for 0-line angles. The PSMTs were given a set of circles in Figure 10 to further investigate their levels of mental constructions regarding 0-line angles. All PSMTs indicated that there was no angle in the first and the second circles since there were no lines presented. For the circle G, they proposed that radius GI was not enough to define an angle in a circle. Particularly, Linda suggested that if there were two line segments or rays in a circle where one was placed on the top of the other, it could be assumed that there was an angle in a given shape. Figure 10. The task that includes 0-line angles For the circle J, referring to their original definitions, all PSMTs suggested that if they were allowed to draw line segments JL and JK, they could define the angle. For the circle N1, none determined an angle unless they were allowed to draw two line segments. Their responses are evidence that they always needed to draw or see two lines or line segments to interpret 0-line angles. This finding revealed that they internalized their actions and generalized their actions for every circle. In other words, they moved to having internal control over the objects. Their responses were evidence of the process level. However, their process level was limited because Yilgit to identify the 0-line angles in a given figure, they needed a specific physical object that included two intersecting line segments in a circle. Otherwise, they proposed that there was no angle in the figure. Their responses did not provide any evidence that they reached the object or schema level. So, it was inferred that they remained at the process level in terms of 0-line angles and angle measurement. Angles in Right Triangle Context Throughout the third interview, I aimed to investigate what relationships PSMTs had between angles and side lengths in a right triangle. Additionally, one of the goals was to investigate how PSMTs’ levels of mental constructions of angles were related to their mental constructions of right triangles. I anticipated that PSMTs’ mental constructions regarding right triangles were a special case of their mental constructions of any triangle since right triangles are a subset of all triangles. Therefore, to investigate how PSMTs’ mental constructions of angles were related to their knowledge of right triangles, I began by asking them to explain what relationships they knew about angles and side lengths in a triangle. All PSMTs’ responses were similar to each other, in that they immediately drew or imagined a triangle or right triangle to explain the relationships. For instance, when Dana was asked to explain relationships between angles and side lengths in any triangle, she immediately drew a right triangle and pointed out the Pythagorean Theorem (See Figure 11). She explained: D: Well, in a specific right triangle, then, if this were x and this is y, and this is z [referring to the right triangle she drew]. Then, not angles, but we know that x squared plus y squared is equal to z squared. TME, vol. 11, no. 3, p. 729 Figure 11. Dana’s drawing of a right triangle This approach to the task, namely physically drawing or imagining a triangle (or a right triangle) involving three angles comprised of rays to operate on and look for the relationships, was one the PSMTs used consistently in tasks throughout the interviews. Particularly, to draw or imagine the triangles—or right triangles, PSMTs recalled and applied their 2-line angle and angle measurement schema. For instance, Linda explained: L: Ok, so you have your triangle, you… It is composed of three angles, so each side on the triangle is actually a ray to two of the angles [meaning that two angles shared a common side in a triangle]. And so, the side length would be determined by how the angles are put together. Linda, particularly, applied her mental constructions regarding 2-line angles schema to draw a triangle. Even though Linda as well as other PSMTs began to explain the relationships as a general case, they applied the same reasoning to right triangles later in the interview. To further investigate how the PSMTs connected their mental constructions of angles, they were given a 300-600-900 triangle and asked to increase the 30o angle to 35o and identify the corresponding changes using paper and pencil (See Figure 12). All PSMTs increased the angle by acting on a physical object (on a right triangle) or imagining a right triangle even though they explained the changes differently . Yilgit Figure 12. The task to investigate the role of angles in a right triangle context For instance, Linda moved the point A horizontally to increase the angle to 350, and she preserved the right triangle and interpreted that other base angle decreased to 550. Additionally, Dana increased the angle to 350 by moving counterclockwise (See Figure 13). She first drew the given 300-600-900 right triangle using paper and pencil, and then she acted step by step on that triangle. She first preserved the right triangle and side length AC indicating “fixing this side” and increasing the angle CAB to 350 degrees by moving the side lengths AB towards counterclockwise. Then, Dana increased the side length BC (See Figure 13). On the other hand, presumably, Kathy identified the changes in the right triangle before drawing the transformed triangle. When she was asked to explain what she thought about the task, she drew a right triangle and started to act on the physical object (See Figure 13). Kathy, specifically, increased angle A to 350 towards counterclockwise, preserving the right triangle by decreasing angle B to550. She further explained that she increased the angle counterclockwise as this rotation made the angle larger. She unpacked her 2-line angle measurement schema that she revealed before by indicating “the rotation makes the angle larger”. Similar to Kathy, Jason initially used an imagined triangle to increase the angle to 350, and then he drew the triangle (See Figure 13). He indicated that he increased the angle to 350 towards counterclockwise, and he decreased the other base angle to 550. TME, vol. 11, no. 3, p. 731 Linda’s Drawing Kathy’s Drawing Jason’s Drawing Dana’s Drawing Figure 13. PSMTs’ drawings after they increased the 30o angle to 35o angle The PSMTs’ responses to the tasks reveal that their 2-line angles and angle measurement schema was enough to operate with right triangles. Like the participants in Keiser’s (2004) and Mitchelmore and White’s (1998) studies, the PSMTs did not struggle to act on angles where both sides were visible. In other words, although they remained at the process level and did not have full schema for 0-line and 1-line angles and angle measurement, their schema of 2-line angles and angle measurement was sufficient to reason about the tasks in right triangle context. Discussion and Conclusion Consistent with existing studies, all four PSMTs had limited knowledge of the concept of angles and angle measurement even though they were adult learners. Similar to the students in Mitchelmore and White (2000) and Keiser’s (2004) studies, all PSMTs had a schema for 2-line angles and angle measurement. PSMTs were also less flexible on constructions of 1-line and 0line angles and angle measurement as it applied to these angles. I inferred that their struggles Yilgit with 1-line and 0-line angles stemmed from their descriptions of an angle. All the PSMTs defined and described an angle using two lines intersecting in a point, and all PSMTs indicated that they could easily determine angles where two rays were visible. However, when they were asked to find an angle in a given line segment or circle, they did not imagine two rays, and responded that there was no angle. Although PSMTs do not have a full schema regarding 0-line and 1-line angles and angle measurement, it was found that their constructions of 1-line and 0line angles and angle measurement were not required in right triangles, and the schema level for 2-line angles was sufficient for constructions of right triangle context. In other words, object and schema level for 1-line and 0-line angles were not necessary to reason about right triangles since vertices or segment either were given or imagined in right triangles. As Clements and Battista (1989, 1990) and Browning et al.’s (2008) suggested welldesigned technology activities might enrich students’ thinking and exploration of 0-line and 1line angles. In order to help students reach higher levels of mental constructions regarding 1-line and 0-line angles and angle measurement, this study suggests that posing non-routine tasks about 0-line and 1-line angles and angle measurement in GeoGebra, would provide new opportunities to engage with different mathematical skills and levels of mental constructions. Particularly, dragging would be helpful for students to transform their mental constructions and determine the effects, differences, and properties of objects, and reach the schema level of 0-line and 1-line angles and angle measurement. Using the dragging aspect of GeoGebra and observing the relationships between 0-line, 1-line, and 2-line angles would have been helpful for students to reach higher levels of mental constructions regarding the concept of angles and angle measurement that can be applied to many different situations. Of course, the present study represents a step in this direction; it is essential to conduct further research to explore the roles of TME, vol. 11, no. 3, p. 733 novel tasks in GeoGebra in construction schema for 0-line and 1-line angles as well as more advanced concepts. In addition, Moore (2014) argued that that an arc approach to angle measure can foster coherent experiences for students in both unit circle and right triangle contexts. He suggested that to improve thinking in unit circle and right triangle contexts, students should be taught to relate angle arc measures and to consider the radius as a unit of measure of an arc. Moore (2014) further stated, “Developing meaning for angle measure and trigonometric functions that entail measuring arcs and lengths in a specified unit can also form important ways of reasoning for right triangle context” (p. 110). However, in this study, I investigated the characterization of PSMTs’ mental constructions regarding angle and angle measure constructions. This approach is different from Moore’s conclusions since findings from this study illustrate that a student can reason in the context of a right triangle without demonstrating mental constructions for arcs and arc lengths. All the PSMTs, for example, revealed evidence of 2-line angles and angle measurement schemas while they remained at the process level on 0-line and 1-line angles and angle measurement contexts. However, they were able to reason about right triangle tasks using their 2-line angles schema. Although the PSMTs did not reveal any evidence that they developed or applied meaning for angle measure that entail measuring arc and arc lengths as Moore (2014) suggested, their mental constructions of 2-line angles were enough to reason about the tasks which were designed in right triangle context. In particular, the level of constructions of 0-line angles may be the link between my findings and Moore’s (2014) conclusion. For instance, a level of mental constructions of 0-line angles that might lead to measuring arc and arc lengths could support important ways of reasoning in both right triangle and unit circle contexts, which remains an open question for future studies. In a larger context, the study is well situated within Yilgit the canon of literature that addresses the crucial role of mediation through technology in which representations are embedded and executable (Moreno-Armella & Sriraman, 2005). Acknowledgement Special thanks to my advisor Dr. Signe Kastberg for her help, guidance, and most of all the encouragement she has given me to complete my Ph.D. education and write this paper. References Arnon, I., Cottrill, J., Dubinsky, E., Oktac, A., Roa Fuentes, S., Trigueros, M., & Weller, K. (2014). APOS theory: A framework for research and curriculum development in mathematics education. New York, NY: Springer. Asiala, M., Brown, A., Devries, D., Dubinsky, E., Mathews, D., & Thomas, K. (1996). A framework for research and curriculum development in undergraduate mathematics education. In J. Kaput, A. Schoenfeld, & E. Dubinsky (Eds.), Research in Collegiate Mathematics Education II, CBMS Issues in Mathematics Education (Vol 2, pp. 1-32). American Mathematical Society, Providence, RI. Browning, C. A., Garza-Kling, G., & Sundling E. H. (2008). What’s your angle on angles? Teaching Children Mathematics, 14(5), 283-287. Clark, J. M., Cordero, F., Cottrill, J., Czarnocha, B., DeVries, D. J., St. John, D., Tolias, T., & Vidakovic, D. (1997). Constructing a schema: The case of the chain rule. Journal of Mathematical Behavior, 16, 345–364. Clements, D. H., & Battista, M. T. (1989). Learning of geometrical concepts in a Logo environment. Journal for Research in Mathematics Education, 20(5), 450-467. Clements, D. H., & Battista, M. T. (1990). The effects of Logo on children’s conceptualizations of angle and polygons. Journal for Research in Mathematics Education, 21(5), 356-371. TME, vol. 11, no. 3, p. 735 Clements, J. (2000). Analysis of clinical interviews: Foundations and model viability. In R. Lesh & A. Kelly (Eds.), Handbook of research design in mathematics and science education (pp. 547-589). Hillsdale, NJ: Erlbaum. Dubinsky, E. (1991). Reflective abstraction in advanced mathematical thinking. In D. Tall (Ed.), Advanced mathematical thinking (pp. 95-126). Boston, MA: Kluwer Academic Publishers. Dubinsky, E., & McDonald, M. (2001). APOS: A constructivist theory of learning. In D. Holton (Ed.), The teaching and learning of mathematics at university level: An ICMI study (pp. 275–282). Boston, MA: Kluwer Academic Publishers. Dubinsky, E. (2010). The APOS Theory of learning mathematics: Pedagogical applications and results. Proceedings of the 18th annual conference of the Southern African Association for Research in Mathematics, Science, and Technology Education (pp. 18-35). Durban, South Africa: SAARMSTE. Ericsson, K., & Simon, H. (1993). Protocol analysis: Verbal reports as data. Cambridge, MA: MIT Press. Goldin, G. (2000). A scientific perspective on structures, task-based interviews in mathematics education research. In A. E. Kelly & R. Lesh (Eds.), Handbook of research design in mathematics and science education (pp. 517–545). New Jersey: Lawrence Erlbaum. Keiser, J. M. (2000). The role of definition. Mathematics Teaching in the Middle School, 5(8), 506–11. Keiser, J. M. (2004). Struggles with developing the concept of angle: Comparing sixth-grade students’ discourse to the history of the angle concept. Mathematical Thinking and Learning, 6(3), 285-306. Yilgit Mitchelmore, M., & White, P. (1998). Development of angle concepts: A framework for research. Mathematics Education Research Journal, 10(3), 4-27. Mitchelmore, M., & White, P. (2000). Development of angle concepts by progressive abstraction and generalisation. Educational Studies in Mathematics, 41(3), 209–238. Moore, K. C. (2010). The role of quantitative reasoning in precalculus students learning central concept of trigonometry (Unpublished doctoral dissertation). Arizona State University, Tempe, AZ. Moore, K. C. (2013). Making sense by measuring arcs: A teaching experiment in angle measure. Educational Studies in Mathematics Education, 83(2), 225-245. Moore, K. C. (2014). Quantitative reasoning and the sine function: The case of Zac. Journal for Research in Mathematics Education, 45(1), 102-138. Moreno-Armella, L., & Sriraman, B. (2005). The articulation of symbol and mediation in mathematics education. ZDM-The International Journal on Mathematics Education, 37(6),476-486. National Council of Teachers of Mathematics (1991). Professional standards for teaching mathematics. Reston, VA: NCTM. National Council of Teachers of Mathematics (2000). Principles and standards for school mathematics. Reston, VA: NCTM. Newell, A., & Simon, H. (1972). Human problem solving. Englewood Cliffs, NJ: Prentice-Hall. Piaget, J. (1975). The child's conception of the world. Totowa, NJ: Littlefield, Adams. TME, vol. 11, no. 3, p.737 Common Sense About the Common Core Alan H. Schoenfeld 1 University of California, Berkeley Is the Common Core the best thing since sliced bread, or the work of the devil? Is it brand new, or a rehash of old ideas? Is it anything more than a brand name, or is there substance? Can it work, given the implementation challenges in our political and school systems? Opinions about the Common Core are everywhere, but the op-eds I’ve seen are often short on facts, and equally short on common sense. A mathematician by training, I’ve worked for nearly 40 years as an education researcher, curriculum materials developer, test developer, standards writer, and teacher. What follows is a Q&A based on that experience. I focus on the Common Core State Standards for Mathematics, known as CCSSM, but the issues apply to all standards (descriptions of what students should know and be able to do). What’s the CCSSM about? Take a look for yourself – the Common Core documents are available at <http://www.Corestandards.org/>. If you read the first 8 pages of CCSSM and then sample the rest, you’ll get a good sense of what’s intended. In brief, CCSSM focuses on two deeply intertwined aspects of mathematics: the content people need to know, and the knowhow that makes for its successful use, called mathematical practices. You can think of the content as a set of tools – the things you do mathematics with. The practices emphasize problem solving, reasoning mathematically, and applying mathematical knowledge to solve real world problems. Without the practices, the tools in the content part of the CCSSM don’t do much for you. It’s like being taught to use a saw, hammer, screwdriver, lathe, and other woodworking tools without having any sense of what it means to make furniture. At heart, the CCSSM are about thinking mathematically. Here are two visions of a third grade class, both taken from real classrooms. In one, students are practicing addition and subtraction, getting help where needed to make sure they get the right answers. In another, the students have noticed that every time they add two odd numbers, the sum is even. A student asks, “Will it always be true?” Another says “but the odd numbers go on forever, we can’t test them all.” Pretty smart for a third grader! But later, a student notices that every odd number is made up of a bunch of pairs, with one left over. When 1 http://gse.berkeley.edu/people/alan-h-schoenfeld The Mathematics Enthusiast, ISSN 1551-3440, vol. 11, no. 3, pp. 737-744 2014© The Author(s) & Dept. of Mathematical Sciences-The University of Montana Schoenfeld you put two odd numbers together, you have all the pairs you had before, and the two left-overs make another pair – so the sum is even. And this will always be the case, no matter which odd numbers you start with. Now that’s mathematical thinking – and it's what the core should be about. Of course, kids should do their sums correctly, and, they should be able to think with the mathematics. It’s important to understand what the Common Core is not. Most importantly, the Common Core is not a curriculum. CCSSM provides an outline of the mathematics that students should learn – an outline endorsed by 43 states. Equally important, the common core does not prescribe a particular teaching style: effective teachers can have very different styles. To date – and despite what you read or hear – the desired reality of the Common Core has not made its way into even a small minority of American classrooms. What happens in classrooms will depend on the curricula that are developed and adopted, on the high stakes tests that shape instruction (for better or worse), on the capacity of teachers to create classrooms that really teach “to the Core,” and on the coherence or incoherence of the whole effort. What do powerful classrooms look like? CCSSM describes what kids should be able to do mathematically, including problem solving, producing and critiquing mathematical arguments, and more. Students won't get good at these things unless they have an opportunity to practice them in the classroom, and get feedback on how they're doing. (Imagine a sports coach who lectured the team on how to play, and then told the team to practice a lot before the big match. You wouldn’t bet on that coach’s success.) So, classrooms that produce students who are powerful mathematical thinkers must provide meaningful opportunities for students to do mathematics. Just as there are many successful (and different) coaches and coaching styles, there are many ways to run a successful classroom. At the same time, there’s consistent evidence that classrooms that produce powerful mathematical thinkers have these five properties: i High quality content and practices. Students have the opportunity to grapple with powerful ideas in meaningful ways, developing and refining skills, understandings, perseverance and other productive “habits of mind” as they do. Meaningful, carefully structured challenge. Solving complex problems takes perseverance; students should neither be spoon-fed nor lost. In powerful classrooms students are supported in “productive struggle,” which helps them build their mathematical muscles. Equitable opportunity. We’ve all seen the classroom where the teacher moves things along by calling on the few kids who “get it,” leaving the rest in the dust. It shouldn’t be that way. In the kind of classroom that lives up to the standards, all students are productively engaged in the mathematics. Students as sense makers. In powerful classrooms students have the opportunity to “talk math,” to exchange ideas, to work collaboratively, and build on each other’s ideas (just as in productive workplaces). In contrast to classrooms where students TME, vol. 11, no. 3, p.739 come to learn that they’re not “math people,” students in these classes come to see themselves as mathematical sense makers. A focus on building and refining student thinking. In powerful classrooms the teachers know the mathematical terrain and how students come to understand that content so well that they can anticipate common difficulties, look for them, and challenge the students in ways that help them make progress, without simply spoonfeeding them. We call this kind of powerful teaching “Teaching for Robust Understanding”: see <http://ats.berkeley.edu/tools.html>. Our goal should be to provide such learning experiences for all students. It’s very hard to do this well – which is why the issue of supporting teachers’ professional growth is crucially important. There are no quick fixes. We should be thinking in terms of consistent, gradual improvement. What’s new in the CCSSM? The ideas behind CCSSM are not new. We’ve known for some time that students need a well rounded diet of skills, conceptual understanding, and problem solving – rich mathematics content and the opportunities to develop strong mathematical practices. ii The “standards movement” began in 1989, when the National Council of Teachers of Mathematics issued its Curriculum and Evaluation Standards. NCTM’s (2000) Principles and Standards for School Mathematics represented an updating of the 1989 standards, based on what had been learned, and the fact that technology had changed so much over the 1990s. CCSSM can be seen as the next step in a progression. So what’s different? First, the organization is new. CCSSM offers grade-by-grade standards for grades K through 8, rather than the “grade band” standards of its predecessors. It represents a particular set of “trajectories” through subject matter, being very specific about what content should be addressed. Second and critically important, the Common Core has been adopted by the vast majority of states. Prior to the Common Core, each of the 50 states had its own standards and tests. Some of these were world class, with a focus on thinking mathematically; some were focused on low-level skills and rote memorization. Some states compared favorably with the best countries in the world, and some scored near the bottom of the international heap. Mathematics education across the US was totally incoherent; where you lived determined whether you got a decent education or not. That’s no way to prepare students across the US for college and careers, or the nation’s work force for the challenges of the decades to come. And it’s inequitable when your zip code determines whether or not you have access to a good education. IF CCSSM are implemented with fidelity in the states that adopted them, we’ll have something like nationwide consistency and opportunity instead of the crazy quilt patchwork that we’ve had. What’s wrong with CCSSM? I can find lots of things to complain about – everyone can. Can you think of a class you took that was so perfect that you wouldn’t change a thing? With under 100 pages to Schoenfeld outline all of school mathematics, the authors made a series of choices. Those choices can be defended, but so could other choices. However, if schools and classrooms across the US make strides toward implementing the vision of the Common Core described above, we’d make real progress. What IS wrong is our political system, and the fact that teachers and schools are not being provided adequate preparation and resources to implement the Common Core. This lack of support can destroy the vision, because real change is needed. Teaching the same old way, called “demonstrate and practice,” just doesn’t cut it. (How much of the math that you memorized in school do you remember, and actually use as part of your tool kit?) The math we want kids to get their heads around is deeper and richer. Kids need to work hard to make sense of it; and in order to provide powerful learning environments teachers need to learn how to support students in grappling with much more challenging mathematics. This isn’t a matter of giving teachers a few days of “training” for teaching the Core; it’s a matter of taking teaching seriously, and providing teachers with the kinds of sustained help they need to be able to create classrooms that produce students who are powerful mathematical thinkers. The REAL reason some nations consistently score well on international tests (pick your favorite: Finland, Japan, Singapore…) is that those nations take teaching seriously, providing ongoing support and professional development for teachers. When teachers have a deep understanding of the mathematics, and are supported in building the kinds of rich classroom environments described above, the students who emerge from those classrooms are powerful mathematical thinkers. What do “Common Core Curricula” look like? I could say, “Who knows?” It bears repeating that the Common Core is not a curriculum. What might be called Common Core curricula – widely accessible curricula intended to be consistent with the common core – don’t really exist yet, although publishers are rushing to get them out. When those curricula do emerge, we’ll have to see how faithful they are to the vision of problem solving, reasoning, and sense making described here. One thing is for sure: the vast majority of materials currently labeled “Common Core” don’t come close to that standard. Here’s a case in point: A student recently brought home a homework assignment with “Common Core Mathematics” prominently stamped at the top of the page. The bottom of the page said, “Copyright 1998.” That’s more than a decade before the CCSSM were written. Remember when supermarkets plastered the word “natural” on everything, because it seemed to promise healthy food? That’s what’s being done today with phony “Common Core” labels. To find out whether something is consistent with the values of the Common Core you have to look at it closely, and ask: are kids being asked to use their brains? Are they learning solid mathematics, engaging in problem solving, asked to reason, using the math to model real world problems? In short, are they learning to become mathematical sense makers? If not, the “Common Core” label is just plain baloney. Now, there are materials that support real mathematical engagement. For one set of such materials, look at the Mathematics Assessment Project’s “Classroom Challenges,” at TME, vol. 11, no. 3, p.741 <http://map.mathshell.org/materials/index.php>. But, such materials do not a curriculum make – and again, materials without support are not enough. What really counts is how the mathematics comes alive (or doesn’t) in the classroom. What about testing? Do you know the phrase “What you test is what you get”? When the stakes are high, teachers will – for their and their students’ survival! – teach to the test. If the tests require thinking, problem solving and reasoning, then teaching to the test can be a good thing. But if a high stakes test doesn’t reflect the kinds of mathematical thinking you want kids to learn, you’re in for trouble. I worked on the specs for one of the big testing consortia, to some good effect – the exams will produce separate scores for content, reasoning, problem solving and modeling – but I’m not very hopeful at this point. To really test for mathematical sense making, we need to offer extended “essay questions” that provide opportunities for students to grapple with complex mathematical situations, demonstrating what they know in the process. Unfortunately, it appears that test makers’ desire for cheap, easy-to-grade, and legally bullet-proof tests may undermine the best of intentions. It takes time to grade essay questions, and time is money. The two main tests being developed to align with the CCSSM iii barely scratch the surface of what we can do. That’s an issue of political will (read: it costs money and will shake people up), and the people footing the bill for the tests don't seem to have it. The best use of testing is to reveal what individual students know, to help them learn more. That is, the most important consumers of high quality tests should be teachers and students, who can learn from them. It IS possible to build tests that are tied to standards and provide such information; there are plenty of examples at all grade levels. In addition, scores from such tests can be used to tell schools, districts, and states where they’re doing well and where they need to get better. It’s a misuse of testing when test scores are used primarily to penalize “under-performing” students and schools, rather than to help them to improve. (Moreover, high stakes testing leads to cheating. How many testing scandals do we need to make the point?) Finally, it’s just plain immoral to penalize students when they fail to meet standards they were never prepared for. Holding students accountable for test scores without providing meaningful opportunities to learn is abusive. What’s needed to fix things? There’s no shortage of “solutions.” To mention one suggestion that’s been bandied about, why not just adopt the curricular materials from high-performing countries? That would be nice, if it would work – but it won’t. If conditions were the same in different countries – that is, if teachers here were provided the same levels of preparation, support, and ongoing opportunities for learning as in high-performing countries, then this approach could make sense. But the US is not Singapore (or Finland, or Japan), and what works in those countries won’t work in the US, until teachers in the US are supported in the ways teachers in those countries are. Singaporean teachers are deeply versed in their curricula and have been prepared to get the most out of the problems in their texts. Japanese Schoenfeld teachers are expected to take a decade to evolve into full-fledged professionals, and their work week contains regularly scheduled opportunities for continuous on-the-job training with experienced colleagues. Finnish teachers are carefully selected, have extensive preparation, and are given significant amounts of classroom autonomy. In short, if importing good curricula would solve the problem, the problem would have been solved by now. It’s been tried, and it failed. Of course, good curricular materials make life better – IF they’re in a context where they can be well used. The same is true of any quick fix you can think of, for example the use of technology. Yes, the use of technology can make a big, positive difference – IF it’s used in thoughtful ways, to enhance students’ experience of the discipline. I started using computers for math instruction in 1981. With computers you can gather and analyze real data instead of using the “cooked” data in a textbook; you can play with and analyze graphs, because the computer can produce graphs easily; and so on. But in those cases, the technology is being used to in the service of mathematical reasoning and problem solving. You can get much deeper into the math if you use the technology well, but the presence of technology in the classroom doesn’t guarantee anything. In particular, putting a curriculum on tablets is like putting a book on an e-reader: it may be lighter to carry, but it’s the same words. The serious question is, how can the technology be used to deepen students’ sense making, problem solving, and reasoning? The best way to make effective use of technology is to make sure that the teachers who use it in their classrooms are well prepared to use it effectively. Fancy technology isn’t going to make much of a difference in a world where half of the new teacher force each year will drop out within the next 5 years (within 3 years in urban school districts) – a world in which there are more teachers in their first year of teaching than at any other level of experience. In professions with a stable professional core, the number of newcomers is a much smaller percentage of the total population: there are more established professionals to mentor the newcomers, and a much smaller drop-out rate. The best educational investment, as the highest performing nations make clear, is in the professionalization of teachers – so that they can make powerful instruction live in the classroom. In nations where teachers are given consistent growth opportunities, the teachers continue to develop over time. And, they stay in the profession. Living up to the vision of the Common Core requires focus and coherence. Curricula and technology need to be aligned with the vision, and implemented in ways true to the spirit of sense making described here – including equitable access to the mathematics for all students. Administrators need to understand what counts, and support it. Testing needs to focus on providing useful information to teachers and students. Most important, we need to provide steady support for the teaching profession, so that teachers can make that vision live in their classrooms. We owe this to our kids. TME, vol. 11, no. 3, p.743 i The quickest path to documentation is through the web site <ats.berkeley.edu>. The front page shows the big ideas; click on the “tools” page to see evidence about, and tools for, productive thinking. ii There’s a massive amount of research behind this statement. For one early summary, see Schoenfeld, A. H. (2002, January/February). Making mathematics work for all children: Issues of standards, testing, and equity. Educational Researcher, 31(1), 13-25. iii See the web sites of the Partnership for Assessment of Readiness for College and Careers, PARCC, at <http://www.parcconline.org/>, and the Smarter Balanced Assessment Consortium, SBAC, at <http://www.smarterbalanced.org/>. Schoenfeld TME, vol. 11, no. 3, p.745 Scholastic Standards in the United States – The Discussion concerning the ‘Common Core’ Alan Schoenfeld & Günter Törner 1 Preface: This article has been developed based on a personal discussion between the German author Günter Törner and Alan Schoenfeld, who is an expert in the field of mathematical didactics. Basically there are three reasons for us to share our insights with the public: (1) Readers, having subscribed to Jerry Becker’s e-mail information network, have received numerous messages over the past few months; what do we need to know about this fact in Germany? (2) Scholastic standards – a keyword that sounds very familiar to us in terms of educational policy… But it is also a hot topic in other countries. What can we conclude from these discussions? (3) Scholastic standards – if they are developed, people will be eager to test their implementation. A very complex problem in the United States and maybe even in Germany!? 1. American Education Federalism Before giving a more detailed report on the Common Core State Standards (CCSS)2, we need to recall a couple of facts on the American educational system. In fact, the United States are not so different from our federal republic: While we need to level off 16 federal states, on the other side of the Atlantic they need to cater for 60 states. This federalism can be explained historically; each state has the sovereignty over its educational policy. Until 2010/2011, when 43 states 3 implemented the CCSS, each of the 50 states had its own educational standards and specific performance test to go with these standards. A large number of states has agreed to implement the Common Core, while Washington rewarded this decision by granting national subsidies. For the federal government in Washington, this standardization is worth $ 500 million being distributed among the individual states. 1 [email protected] 2 http://corestandards.org/ The standards were for example not implemented in states like Texas, Alaska and Nebraska. 3 The Mathematics Enthusiast, ISSN 1551-3440, vol. 11, no. 3, pp. 745-752 2014© The Author(s) & Dept. of Mathematical Sciences-The University of Montana Schoenfeld & Törner Why has standardization become such a hot topic for debate on the other side of the Atlantic? Is the Common Core the best thing since sliced bread, or the work of the devil? Is it brand new, or a rehash of old ideas? Is it anything more than a brand name, or is there substance? Can it work, given the implementation challenges in our political and school systems? Opinions about the Common Core are everywhere, but the op-eds I’ve seen are often short on facts, and equally short on common sense. 2. What’s the Common Core State Standards Mathematics (CCSSM) about? Take a look for yourself – the Common Core documents are available at the URL given below 4. If you read the first pages of CCSSM and then sample the rest, you’ll get a good sense of what’s intended. In brief, CCSSM focuses on two deeply intertwined aspects of mathematics: the content people need to know, and the knowhow that makes for its successful use, called mathematical practices. At heart, the CCSSM are about thinking mathematically. Here are two visions of a third grade class, both taken from real classrooms, which underline our statement. In one, students are practicing addition and subtraction, getting help where needed to make sure they get the right answers. In another, the students have noticed that every time they add two odd numbers, the sum is even. A student asks, “Will it always be true?” Another says “but the odd numbers go on forever, we can’t test them all.” Pretty smart for a third grader! But later, a student notices that every odd number is made up of a bunch of pairs, with one left over. When you put two odd numbers together, you have all the pairs you had before, and the two left-overs make another pair – so the sum is even. And this will always be the case, no matter which odd numbers you start with. Now that’s mathematical thinking – and it's what the core should be about. Of course, kids should do their sums correctly, and, they should be able to think with the mathematics. CCSSM provides an outline of the mathematics that students should learn. It’s important to understand what the Common Core is not. Most importantly, the Common Core is not a curriculum – and this is equally the case for the scholastic standards in Germany. The step from the Common Core to a possible and compatible curriculum is by far not a trivial one and this is exactly the fact that is often neglected in the German discussion about the standardization movement. Equally important, the common core does not prescribe a particular teaching style: effective teachers can have very different styles. To date – and despite what you read or hear – the desired reality of the Common Core has not made its way into even a small minority of American classrooms. 4 http://www.corestandards.org/Math// TME, vol. 11, no. 3, p.747 What happens in classrooms will depend on the curricula that are developed and adopted, on the high stakes tests that shape instruction (for better or worse), on the capacity of teachers to create classrooms that really teach “to the Core,” and on the coherence or incoherence of the whole effort. 3. What do powerful classrooms look like? CCSSM describes what kids should be able to do mathematically, including problem solving, producing and critiquing mathematical arguments, and more. Students won't get good at these things unless they have an opportunity to practice them in the classroom, and get feedback on how they're doing. So, classrooms that produce students who are powerful mathematical thinkers must provide meaningful opportunities for students to do mathematics. Just as there are many successful (and different) coaches and coaching styles, there are many ways to run a successful classroom. At the same time, there’s consistent evidence that classrooms that produce powerful mathematical thinkers have these five properties: High quality content and practices. Students have the opportunity to grapple with powerful ideas in meaningful ways, developing and refining skills, understandings, perseverance and other productive “habits of mind” as they do. Meaningful, carefully structured challenge. Solving complex problems takes perseverance; students should neither be spoon-fed nor lost. In powerful classrooms students are supported in “productive struggle,” which helps them build their mathematical muscles. Equitable opportunity. We’ve all seen the classroom where the teacher moves things along by calling on the few kids who “get it” 5, leaving the rest in the dust. It shouldn’t be that way. In the kind of classroom that lives up to the standards, all students are productively engaged in the mathematics. Students as sense makers. In powerful classrooms students have the opportunity to “talk math,” to exchange ideas, to work collaboratively, and build on each other’s ideas (just as in productive workplaces). In contrast to classrooms where students come to learn that they’re not “math people,” students in these classes come to see themselves as mathematical sense makers. A focus on building and refining student thinking. In powerful classrooms the teachers know the mathematical terrain and how students come to understand that content so well that they can anticipate common difficulties, look for them, and challenge the students in ways that help them make progress, without simply spoon-feeding them. We call this kind of powerful teaching “Teaching for Robust Understanding” 6. Our goal should be to provide such learning experiences for all students. It’s very hard to do this well – which is why the issue of supporting teachers’ professional growth is crucially important. There are no quick fixes. We should be thinking in terms of consistent, gradual improvement. 5 Here’s what a student once told the second author while discussing videos taken from real classrooms (together!) with teachers: “See! That’s typical mathematics classes! The teacher keeps asking until he finally gets the right answer!”… How very alike classrooms can be across the borders! 6 http://ats.berkeley.edu/tools.html Schoenfeld & Törner 4. What’s new in the CCSSM? The ideas behind CCSSM are not new. We’ve known for some time that students need a well-rounded diet of skills, conceptual understanding, and problem solving – rich mathematics content and the opportunities to develop strong mathematical practices. The “standards movement” began in 1989, when the National Council of Teachers of Mathematics issued its Curriculum and Evaluation Standards. NCTM’s (2000) Principles and Standards for School Mathematics represented an updating of the 1989 standards, based on what had been learned, and the fact that technology had changed so much over the 1990s. CCSSM can be seen as the next step in a progression. So what’s different? First, the organization is new. CCSSM offers grade-by-grade standards for grades K through 8, rather than the “grade band” standards of its predecessors. It represents a particular set of “trajectories” through subject matter, being very specific about what content should be addressed. Second and critically important, the Common Core has been adopted by the vast majority of states. Prior to the Common Core, each of the 50 states had its own standards and tests. Some of these were world class, with a focus on thinking mathematically; some were focused on low-level skills and rote memorization. Some states compared favorably with the best countries in the world, and some scored near the bottom of the international heap. Mathematics education across the US was totally incoherent; where you lived determined whether you got a decent education or not. That’s no way to prepare students across the US for college and careers, or the nation’s work force for the challenges of the decades to come. And it’s inequitable when your zip code determines whether or not you have access to a good education. IF CCSSM are implemented with fidelity in the states that adopted them, we’ll have something like nationwide consistency and opportunity instead of the crazy quilt patchwork that we’ve had. 5. What’s wrong with CCSSM? We can sure find lots of things to complain about – everyone can when skimming the pages. We experience the very same when trying to determine whether a textbook is suitable for our own lectures. With about 100 pages to outline all of school mathematics, the authors made a series of choices. Those choices can be defended, but so could other choices. However, if schools and classrooms across the US make strides toward implementing the vision of the Common Core described above, we’d make real progress. What IS wrong is our political system, and the fact that teachers and schools are not being provided adequate preparation and resources to implement the Common Core. This lack of support can destroy the vision, because real change is needed. TME, vol. 11, no. 3, p.749 Teaching the same old way, called “demonstrate and practice,” just doesn’t cut it. The math we want kids to get their heads around is deeper and richer. Kids need to work hard to make sense of it; and in order to provide powerful learning environments teachers need to learn how to support students in grappling with much more challenging mathematics. This isn’t a matter of giving teachers a few days of “training” for teaching the Core; it’s a matter of taking teaching seriously, and providing teachers with the kinds of sustained help they need to be able to create classrooms that produce students who are powerful mathematical thinkers. The REAL reason some nations consistently score well on international tests (pick your favorite: Finland, Japan, Singapore…) is that those nations take teaching seriously, providing ongoing support and professional development for teachers. When teachers have a deep understanding of the mathematics, and are supported in building the kinds of rich classroom environments described above, the students who emerge from those classrooms are powerful mathematical thinkers. 6. Trouble Spot 1: What do “Common Core Curricula” look like? We could say, “Who knows?” It bears repeating that the Common Core is not a curriculum. What might be called Common Core curricula – widely accessible curricula intended to be consistent with the common core – don’t really exist yet, although publishers are rushing to get them out. When those curricula do emerge, we’ll have to see how faithful they are to the vision of problem solving, reasoning, and sense making described here. One thing is for sure: the vast majority of materials currently labeled “Common Core” don’t come close to that standard. Here’s a case in point: A student recently brought home a homework assignment with “Common Core Mathematics” prominently stamped at the top of the page. The bottom of the page said, “Copyright 1998.” That’s more than a decade before the CCSSM were written. Now, there are materials that support real mathematical engagement. For one set of such materials, look at the Mathematics Assessment Project’s “Classroom Challenges” 7. But, such materials do not a curriculum make – and again, materials without support are not enough. What really counts is how the mathematics comes alive (or doesn’t) in the classroom. 7. Trouble Spot 2: What about testing? Do you know the phrase “What you test is what you get”? When the stakes are high, teachers will – for their and their students’ survival! – teach to the test. If the tests require thinking, problem solving and reasoning, then teaching to the test can be a good thing. But if a high stakes test doesn’t reflect the kinds of mathematical thinking you want kids to learn, you’re in for trouble. 7 http://map.mathshell.org/materials/index.php Schoenfeld & Törner Author Alan Schoenfeld worked on the specs for one of the big testing consortia, to some good effect – the exams will produce separate scores for content, reasoning, problem solving and modeling – but he’s not very hopeful at this point. To really test for mathematical sense making, we need to offer extended “essay questions” that provide opportunities for students to grapple with complex mathematical situations, demonstrating what they know in the process. Unfortunately, it appears that test makers’ desire for cheap, easy-to-grade, and legally bullet-proof tests may undermine the best of intentions. It takes time to grade essay questions, and time is money. The two main tests being developed to align with the CCSSM barely scratch the surface of what we can do. That’s an issue of political will (read: it costs money and will shake people up), and the people footing the bill for the tests don't seem to have it. The best use of testing is to reveal what individual students know, to help them learn more. That is, the most important consumers of high quality tests should be teachers and students, who can learn from them. It IS possible to build tests that are tied to standards and provide such information; there are plenty of examples at all grade levels. In addition, scores from such tests can be used to tell schools, districts, and states where they’re doing well and where they need to get better. It’s a misuse of testing when test scores are used primarily to penalize “under-performing” students and schools, rather than to help them to improve. Finally, it’s just plain immoral to penalize students when they fail to meet standards they were never prepared for. Holding students accountable for test scores without providing meaningful opportunities to learn is abusive. 8. What’s needed to fix things? There’s no shortage of “solutions.” To mention one suggestion that’s been bandied about, why not just adopt the curricular materials from high-performing countries? That would be nice, if it would work – but it won’t. If conditions were the same in different countries – that is, if teachers here were provided the same levels of preparation, support, and ongoing opportunities for learning as in high-performing countries, then this approach could make sense. But the US is not Singapore (or Finland, or Japan), and what works in those countries won’t work in the US, until teachers in the US are supported in the ways teachers in those countries are. Singaporean teachers are deeply versed in their curricula and have been prepared to get the most out of the problems in their texts. Japanese teachers are expected to take a decade to evolve into full-fledged professionals, and their work week contains regularly scheduled opportunities for continuous on-the-job training with experienced colleagues. Finnish teachers are carefully selected, have extensive preparation, and are given significant amounts of classroom autonomy. In short, if importing good curricula would solve the problem, the problem would have been solved by now. It’s been tried, and it failed. Of course, good curricular materials make life better – IF they’re in a context where they can be well used. TME, vol. 11, no. 3, p.751 The same is true of any quick fix you can think of, for example the use of technology. Yes, the use of technology can make a big, positive difference – IF it’s used in thoughtful ways, to enhance students’ experience of the discipline. Alan Schoenfeld started using computers for math instruction in 1981. With computers you can gather and analyze real data instead of using the “cooked” data in a textbook; you can play with and analyze graphs, because the computer can produce graphs easily; and so on. But in those cases, the technology is being used to in the service of mathematical reasoning and problem solving. You can get much deeper into the math if you use the technology well, but the presence of technology in the classroom doesn’t guarantee anything. In particular, putting a curriculum on tablets is like putting a book on an e-reader: it may be lighter to carry, but it’s the same words. The serious question is, how can the technology be used to deepen students’ sense making, problem solving, and reasoning? The best way to make effective use of technology is to make sure that the teachers who use it in their classrooms are well prepared to use it effectively. Fancy technology isn’t going to make much of a difference in a world where half of the new teacher force each year will drop out within the next 5 years (within 3 years in urban school districts) – a world in which there are more teachers in their first year of teaching than at any other level of experience. In professions with a stable professional core, the number of newcomers is a much smaller percentage of the total population: there are more established professionals to mentor the newcomers, and a much smaller drop-out rate. The best educational investment, as the highest performing nations make clear, is in the professionalization of teachers – so that they can make powerful instruction live in the classroom. In nations where teachers are given consistent growth opportunities, the teachers continue to develop over time. And, they stay in the profession. Living up to the vision of the Common Core requires focus and coherence. Curricula and technology need to be aligned with the vision, and implemented in ways true to the spirit of sense making described here – including equitable access to the mathematics for all students. Administrators need to understand what counts, and support it. Testing needs to focus on providing useful information to teachers and students. Most important, we need to provide steady support for the teaching profession, so that teachers can make that vision live in their classrooms. We owe this to our kids. 9. Trouble Spot 3: ‘Professional Development’ The discussion above leads us to another important keyword in the context of teachers’ professionalization, namely that of ‘Professional Development’. As suggested at numerous points in the discussion, Professional Development is more than just offering random training measures for teachers at one’s own discretion. Schoenfeld & Törner What makes training initiatives sustainable? Research has suggested first satisfying starting points in order to answer this question 8; however, explaining this in further detail would require another article. Let us remember: Designing educational standards is not particularly difficult; however, linking these standards to a curriculum and actually making them live in the classroom, is an inevitable but separate step, which is anything but trivial. Enabling teachers to be educational guides is an indispensable but also a very expensive undertaking, which affects school development. The same is true for creating tests which are genuine and can compare well with the standards and mathematics in general. We can only fear that the educational bureaucrats in the United States call for minimalistic solutions due to financial reasons – and we do see the first signs of such a development, since the non-experts on the board of assessment are indeed very influential. Politicians who lack the professional understanding have been alerted, because they (rightly) fear the expected worse results of these new and unknown tests. This is a transnational experience. The opposition in congress quickly realizes the root of the problem: The new tests don’t change everything for the better and current politics in Washington are made into a scapegoat. So, what’s more likely than reclaiming the easily realized influence on the federal level and dissociating oneself from the Common Core, which brings our problem back to its initial state? 8 see e.g.: Zehetmeier, St. & Krainer, K. (2011). Ways of promoting the sustainability of mathematics teachers professional development. ZDM Mathematics Education, 43 (6), 875887. TME, vol. 11, no. 3, p. 753 Book review of The Tower of Hanoi – Myths and Maths (Birkh¨auser)∗ ISBN 978-3-0348-0236-9, $44.95 Cory Palmer† University of Montana As the title of the book suggests, the central topic of “The Tower of Hanoi – Myths and Maths” by Hinz, Klavˇzar, Milutinovi´c, and Petr is the famous puzzle of the same name. The classic Tower of Hanoi puzzle along with a number of its variations and related puzzles are examined in a rigorous mathematical framework. Chapter 0 of the book gives a detailed historical account of the Tower of Hanoi puzzle and its variants as well as an introduction to some of the mathematical results concerning them. The later chapters of the book tend to be dedicated to a particular puzzle or variant and a number of theorems and proofs concerning it. Despite its somewhat playful title, this book is not for a casual reader. It really should be thought of as a mathematical textbook. It is probably best suited for a graduate student or someone with a strong background in mathematics; particularly combinatorics. Throughout the book, the authors assume the reader has some familiarity with, for example, recurrence relations, graph theory, and group theory. In examining the Tower puzzle and its variants, the authors present many theorems and proofs. Despite the simplicity of these puzzles, many of the results in the book are difficult. I think the book would be ideal for a topics course for graduate students and advanced undergraduates. The book includes a nice selection of exercises of varying levels of difficulty (hints and complete solutions for most problems appear at the end). In addition, the text contains a number of interesting conjectures and open problems (Chapter 9 has a nice list). This book would also serve as a good base for thesis or dissertation topics for different levels of students of mathematics. One particularly unique and appealing part of the book is its dedication to telling the history of the Tower of Hanoi puzzle and related puzzles. Along the way they dispel several persistent myths in the history of mathematics. Most textbooks either have no historical perspective or include just a few footnotes. I believe that the approach taken by the authors should serve as a model for other textbooks. Even traditional topics such as algebra or analysis would be better served with some historical context. Overall the book is well-written and the authors make good decisions about how to present the material. There are a few issues a reader should be aware of. Chapter 0 contains a lot of interesting material, but at times it is too vague or informal. It can be ∗ † http://www.springer.com/birkhauser/mathematics/book/978-3-0348-0236-9 [email protected] © The Author(s) & Dept. of Mathematical Sciences – The University of Montana The Mathematics Enthusiast, ISSN 1551-3440, vol. 11, no. 3, pp. 753-754 2014 Palmer, p. 754 easy to get lost early on. To be fair, the authors admit to this and caution the reader. Chapter 1 concerns the Chinese Rings puzzle. I found it difficult to understand the exact rules of this puzzle without looking it up elsewhere. That was a bit unfortunate for a self-contained book, but not dire. Once we reach Chapter 2 the book really begins to shine. The Tower of Hanoi puzzle is explained in detail and some early algorithms are developed and theorems are proved. Later chapters continue this trend and introduce variations of the Tower puzzle and prove results. The highlight of the book is Chapter 4 which shows the connection between the Tower puzzle and Sierpi´ski triangle – the famous fractal. It turns out that if we build a graph of all of the possible states of a Tower of Hanoi with n discs, then this graph can essentially be represented as a step in the process of building the Sierpi´ nski triangle. This connection is detailed rigorously in the chapter and is truly remarkable. The fact that these two popularly-known mathematical objects are so closely connected is startling. The combination of the historical background and essentially graduate-level mathematics makes this book unique and a treat to read. As such, I would recommended it to anyone with interest in mathematical puzzles and some background in upper-division mathematics.


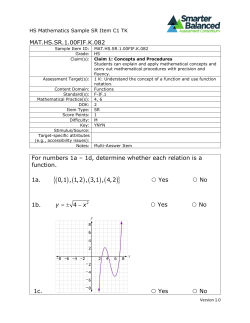


© Copyright 2026