
Measurements of net all-wave radiation at a
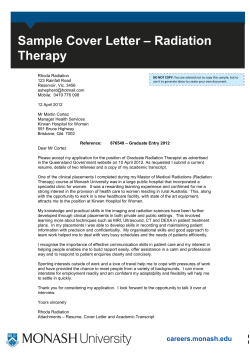
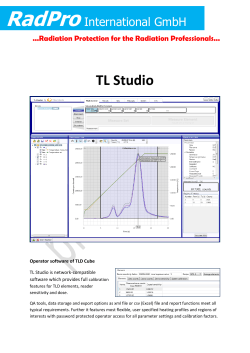
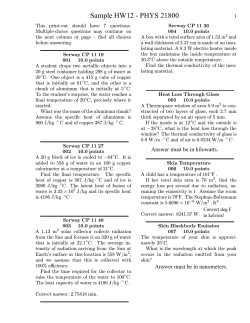
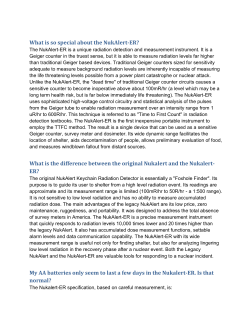
Atmósfera 27(3), 305-315 (2014)
Measurements of net all-wave radiation at a tropical location, Ile-Ife, Nigeria
MURITALA A. AYOOLA, LUKMAN A. SUNMONU, MUNIRU I. BASHIRU and
OLUWAGBEMIGA O. JEGEDE
Department of Physics, Obafemi Awolowo University, Ile-Ife, Nigeria
Corresponding author: O. O. Jegede; e-mail: [email protected]
Received November 28, 2013; accepted June 18, 2014
RESUMEN
Se presentan datos de radiación neta en todas las longitudes de onda promediados cada hora, registrados en una
estación meteorológica situada en el campus de la Universidad Obafemi Awolowo, Ile-Ife (7.52º N, 4.52º E),
Nigeria, durante un periodo completo de tres años (2010-2012), para estudiar sus variaciones diurnas y estacionales. Esta información, obtenida con un radiómetro neto de alta sensibilidad de cuatro componentes,
representa hasta hoy la información más consistente y detallada disponible para una localidad tropical de África
Occidental. De acuerdo con los datos obtenidos, la radiación neta máxima ocurrió a las 14:00 LT (GMT + 1),
y sus valores se incrementaron de manera considerable de 337.6 ± 146.4 Wm–2 en julio, que es el pico de la
estación lluviosa, a 441.7 ± 82.4 Wm–2 durante marzo, en el final de la estación seca. En los meses de abril
y octubre, que marcan el principio y fin de la estación lluviosa en Ile-Ife, se han registrado los valores más
altos de radiación neta: 584.7 y 612.2 Wm–2, respectivamente. Se observó una importante variación inter e
intraestacional en los valores medios mensuales de radiación neta, debida principalmente a fluctuaciones de
nubosidad y humedad. En el área de estudio, los datos revelaron la presencia de calentamiento radiativo neto
en la superficie, cuya tendencia anual sigue una distribución bimodal. Los datos de este estudio respaldan
los aportados por otros autores.
ABSTRACT
Hourly averaged net all-wave radiation data spanning a complete three-year period (2010-2012) at a meteorological station located inside the Obafemi Awolowo University campus in Ile-Ife (7.52º N, 4.52º E),
Nigeria is presented in this study to investigate its diurnal and seasonal variations. Using a high-sensitivity
four-component net radiometer, the data represents so far the most consistent and detailed information available for a tropical location in West Africa. From the dataset, hourly maxima of the net radiation occurred at
14:00 LT (GMT + 1), whose values increased considerably from 337.6 ± 146.4 Wm–2 in July, which is the
peak of the wet season, to 441.7 ± 82.4 Wm–2 in March, the end of the dry season. April and October, both
of which mark the beginning and end of the raining season at Ile-Ife have recorded the highest values of
584.7 and 612.2 Wm–2, respectively. There was strong intra/inter-seasonal variation observed in the monthly
mean values of the net radiation due mainly to the fluctuations in cloudiness and humidity. In the study area,
the data indicated a net radiative heating taking place at the surface, whose annual trend follows a bimodal
distribution. The present data supports the results published in earlier studies by other authors.
Keywords: Tropical wet and dry; Ile-Ife, Nigeria, net radiation; bare soil, intra/inter-seasonal variations,
radiative heating.
1. Introduction
The importance of reliable and continuous measurements of net all-wave radiation at the land surface
cannot be overemphasized for fundamental research
and applications in meteorology, as it determines the
total amount of energy available for physical and
biological processes such as evapotranspiration, air
and soil warming. Particularly, net radiation data is
306
M. A. Ayoola et al.
required for modeling mass and energy exchange
processes between the atmosphere and land surface
(Arya, 1988; Iziomon et al., 2000; Foken 2008a).
Net all-wave radiation at the surface can be determined as the algebraic sum of incoming and outgoing solar (shortwave, 0.15-4 mm) and atmospheric
(longwave, 3-100 mm) radiation, which is expressed
symbolically as:
RN = RS↓ + RS↑ + RL↑ + RL↓
(1)
where RN is the net (all-wave) radiation, RS↓ is
the in-coming shortwave (or solar) radiation, RS↑ is the
out- going (reflected) shortwave radiation, RL↑ is
the incoming long-wave (sky) radiation and RL↓ is the outgoing (terrestrial) longwave radiation. RS↓ is calculated from the sum of the horizontal beam and
diffuse solar radiation (termed global radiation). The
outgoing shortwave radiation RS↑ is determined as
the fraction of incoming radiation, which is reflected
by the surface, that is,
RS↑ = a RS↓
(2)
where a is the surface reflection coefficient, which is
termed albedo. Values of this parameter depend on
the surface cover type, color, textural characteristics
and wetness degree. Typically, for vegetative surfaces
the value is between 0.16 for long grass and 0.25 for
agricultural lands. Over bare soil surfaces, the range
is between 0.05 for wet fallow field and 0.45 for dry
sand (Arnfield, 1975; Arya, 1988).
The outgoing (terrestrial) longwave radiation,
RL↑ is given as a function of the fourth power of the
surface temperature (the Stefan-Boltzmann’s law).
As such, RL↑ shows a strong diurnal variation over
most natural surfaces. Of the incoming longwave
radiation, RL↓ is found to be dependent primarily on
temperature inhomogeneities in the boundary layer
because of the high concentrations of water vapor
and carbon dioxide, both of which are strong emitters
of infrared (thermal) radiation (Viudez-Mora, 2011).
Both longwave radiation components, RL↑ and RL↓,
are nearly of the same magnitude; hence the values of
longwave radiation balance at the surface are usually
small (Smith and Rutan, 2003).
Net all-wave radiation RN measured at the surface,
which is given by Eq. (1.), has distinctly contrasting
values for daytime and nighttime conditions due to
the absence/presence of solar radiation. In sub-tropical areas, due to the high intensity of incoming solar
radiation (which is about 1000 Wm–2 at the local
noon), the ratio of net longwave radiation (RL = RL↓
+ RL↑) to net shortwave radiation (RS = RS↓ + RS↑),
which depends on the degree of cloudiness, is roughly
about 0.05 to 0.2 (Jegede, 1997a; Alados et al., 2003;
Matuszko, 2012). At nighttime, due to the absence of
insolation, the terms representing shortwave radiation
are absent, so that RS = 0. Therefore,
{
RN =
{0.80 ~ 0.95} RS
RL
(Daytime)
(Nightime)
The measured net radiation is dependent on geographical location, time of the day, season, cloudiness, surface temperature, and type and conditions
of the surface as indicated by albedo and emissivity
(Augustine and Dutton, 2013; Matzinger et al., 2003).
Due to the fleeting nature of convective clouds and the
highly humid conditions commonly occurring in tropical areas, there is a preponderance of the short-period
(< 1 min) fluctuations superimposed on the mean net
radiation (Jegede et al., 2006; Kothe and Ahrens,
2010). There are several empirical relationships that
can be used to estimate net radiation from routinely
measured meteorological data including air temperature, insolation, cloudiness and relative humidity
(e.g. Nielsen et al., 1981; Amarakoon and Chen,
1999). A major disadvantage is that these empirical
relationships are not accurate enough for sensitivity
tests in the modeling of surface energy exchange
processes (Alados et al., 2003).
In the present study, continuous measurements of
hourly-averaged net radiation data for Ile-Ife (7.52º N
latitude, 4.52º E longitude), Nigeria by a four-component net radiometer (model NR01) recorded over a
period of three years (2010-2012) have been utilized
for investigating temporal variations at a particular
site located in a tropical area.
2. Net radiation at low latitudes in West Africa
In continental areas of West Africa below 15º N latitude, the sun is always high up in the sky at the local
noon. The seasonal weather pattern is determined
primarily by the latitudinal position of the inter-tropical discontinuity (ITD) line. The ITD line is where
the moist southwesterly current, which originates
307
Net radiation measurements in Ile-Ife, Nigeria
in the Atlantic Ocean, and the dusty northeasterly
winds coming from the Sahara desert (Adejokun,
1966) meet at the surface. The north-south (transverse) movement of the ITD line over West Africa is
associated with distinct weather seasons within the
sub-continent, namely the wet and dry seasons. Near
the 7º N latitude both seasons are almost of equal
duration throughout the year .
Despite relatively simple instrumentation for measuring net radiation at the land surface, the data is still
scarce for most parts of West Africa (Jegede, 1997a, b,
c, 2003). The few net radiation datasets available for
the region are collated from major field experiments
such as the HAPEX-Sahel conducted in the West
African Sahel (Goutourbe et al., 1994). Availability
of satellite derived net radiation data promises to
complement the paucity of these measurements, even
though such data does not have the spatial or temporal
resolution that in situ net radiation sensors provide.
The maintenance of net radiation measurements on a
continuous long-time basis is expensive, so it is usually
estimated (Nielsen et al., 1981).
Analysis of net radiation data over continental
West Africa by Ojo (1977) indicates a pattern of latitudinal variation such that there is an increase from
coastal to inland areas throughout the year. In coastal
areas —the latitudinal belt between 4º and 6º N— daily mean values of net radiation reported for January
are about 80 Wm–2, and they increase to 125 Wm–2 at
about 16º N latitude. Due to increased cloudiness in
July, the daily averages of the net radiation obtained
were considerably lower, but the spatial patterns were
similar. In a reanalysis by Hayward and Oguntoyinbo
(1987), spatial and temporal variations of the net
radiation over West Africa correlate strongly with
cloudiness and humidity. This observation supports
the fact that the combined effects of cloudiness and a
high mixing ratio are responsible for the lowering of
net radiation values during the wet (monsoon) season
(Kothe and Ahrens, 2010).
In West Africa, daily averages of hourly net radiation vary considerably between seasons. Hourly net
radiation data obtained for Osu (7.43º N, 4.58º E),
Nigeria in 1995 and published by Jegede (1997a, b,
c) indicated a period average during the wet season
(typically, April-October) of 382 ± 136.7 Wm–2,
whereas this average was of 480.3 ± 61.8 Wm–2
for the dry season (November-March). The peak
hourly data at 14:00 LT (GMT + 1) showed a bi-
modal pattern with values of 436.4 and 520.3 Wm–2
recorded in March and November, respectively. In
the same study, the lowest value for the hourly maxima of net radiation (307.7 Wm–2) was recorded in
July, which is the peak of the wet season at Osu. This
result was attributed to the frequent occurrences of
convective clouds during the month. This seasonal
pattern of net radiation values is in agreement with
earlier studies by Ojo (1977) and Hayward and
Oguntoyinbo (1987).
3. Methodology
Figure 1 shows the location of Ile-Ife (7.52º N, 4.52º E),
Nigeria in the “tropical wet and dry” zone of West
Africa according to the Köppen‘s classification
(Griffiths, 1974). Average annual precipitation ranges
from 1000 to 1500 mm, and surface wind typically
is weak, with a mean speed lower than 1.5 ms–1
(Hayward and Oguntoyinbo, 1987; Jegede, 1998).
Due to its proximity to the equator, the intensity of
solar radiation received at Ile-Ife’s surface is high
all year round. From the hourly global radiation data
at Ile-Ife, maxima is found at about 13:00 LT, with
values of 1100 and 800 Wm–2 for March and August,
respectively (Balogun et al., 2003).
N
14º
12º
10º
R. Niger
8º
R. Benue
ILE-IFE
6º
4º
20ºN
ATLANTIC OCEAN
0
20ºW
2º
4º
6º
8º
10º
0
12º
20ºE
14º E
Fig. 1. Outline map of Nigeria showing the location of IleIfe (7.52º N, 4.52º E), where the net radiation measurement
(2010-2012) was recorded. Insert is the sub-continent of
West Africa.
308
M. A. Ayoola et al.
A net radiometer was used to perform measurements of net radiation at the surface. Basically,
there are two designs for net radiometer sensors: a
double-dome radiometer that measures integrated
all-wave (0.25-60 μm) radiation or a four-component device that measures individual components
of the shortwave and longwave radiation (Duchon
and Wilk, 1994). An example of the first type is the
radiation energy balance systems (REBS). Improvements both in the design and the materials for such net
radiometers allow for a systematic error of less than
10% of absolute values (Halldin and Lindroth, 1992;
Foken, 2008b). Measurements by the four-component
net radiometers have better accuracy than REBS,
especially at nighttime, when the magnitude of RN is
low (< 20 Wm–2) (Foken, 2008b).
Net radiation data is presently being acquired at
a meteorological station in the Obafemi Awolowo
University campus (Fig. 2), Ile-Ife (7.52º N, 4.52º E),
Nigeria among many other meteorological variables, as part of the Nigeria Micrometeorological
Experiment (NIMEX). Time series of the basic
meteorological parameters are collected routinely
on a continual basis at the measurement site located
near the Department of Physics building. The surface
cover of the measurement site is bare soil (the top
soil is sandy clay) and the enclosure has an area of
11 × 11 m. In the surroundings of the measurement
surface there is a low vegetation cover and in the far
distance office buildings and tall trees obstruct the
free flow of air to the measurement area.
In the middle of the measurement area stands a 6 m
mast supported by guy-wires, with meteorological sensors hanging from booms, such as cup anemometers,
a wind-vane, a temperature and humidity sensor, and
a REBS net radiometer (NR-LITE, manufactured by
Kipp & Zonen B.V., Netherlands). Soil heat flux plates
and thermistor soil temperature probes are buried in the
ground at 5, 10, and 30 cm; and at 2, 5, 10, and 30 cm
depths, respectively. A tipping bucket-type rain gauge
was co-located at the station. All of these devices were
connected to a dedicated datalogger (model CR10X,
Campbell Scientific Instruments).
A four-component net radiometer (model NR01)
was placed on a separate mast 1.3 m above the
ground. This device consists of two pyranometers
(model SR01) and two pyrgeometers (model IR01),
both of which are back-facing, to measure the upwelling and downwelling shortwave and longwave
radiation, respectively. All sensors have individual
calibration factors. The sensitivities for the top and
bottom pyranometers were specified as 15.74 and
15.60 μV/Wm–2, respectively. For the IR01 pyrgeometers sensitivities were specified as 9.90 and
8.20 μV/Wm–2 for the top and bottom sensors, respectively. The response time of the radiation sensors was
less than 18 s. The NR01 sensor was bought in 2009
brand-new with the calibration certificate provided
by the manufacturer (Hukseflux Thermal Sensors
B.V., Netherlands). The instrument calibration
procedure in accordance to the World Radiometric
Reference (WRR) is traceable to ISO 9847. The NR01
Plan view
N
T (soil)
NR-LITE
6-m Mast
NR01
Rain gauge
0
2m
Scale
Fig. 2. Plan view of sensors at the meteorological station, Obafemi
Awolowo University (OAU), Ile-Ife, Nigeria. Shown in the insert is
the four-component net radiometer (model NR01).
309
Net radiation measurements in Ile-Ife, Nigeria
net radiometer was connected to a second CR10X
datalogger using differential input channels for the
voltage measurements to achieve better accuracy.
Data acquisition by the NR01 was programmed
using the LoggerNet® software supplied by Campbell
Scientific. The raw data were sampled at 10 s intervals
and the time series stored as 2-min averages. For data
consistency, net radiation acquired by NR01 was compared to the measurements made by the NR-LITE. All
the net radiation 2-min averages were carefully checked
for instrumental errors and out-range values. Stringent
QA/QC procedure was introduced to remove spurious
data and replace missing values. The net radiation measurements acquired for this study covered the period
from January 2010 to December 2012.
4. Discussion
The diurnal variation of net radiation at Ile-Ife,
Nigeria from January to December, for 2010, 2011
and 2012, is shown in Figure 3a, b, c, respectively.
Hourly averages of net radiation, together with the
corresponding values of the standard deviation (SD)
are plotted in this figure. In accordance with the
sign convention chosen, the positive values of RN
are indicative of radiative heating occurring at the
surface, while the converse holds true for negative
values (i.e. radiative cooling). At this location, from
midnight to about 07:00 LT (GMT + 1), values of
net radiation are negative and fairly constant. The
measured values are found to be within –50 and
–20 Wm–2, thus indicating radiative cooling at the
surface during this period. Beyond 07:00 LT the
net radiation is positive and the values increase
monotonically as the sun rises overhead until about
14:00 LT, when it reaches the local maxima. Later,
as the sun is setting, the magnitude of net radiation
drops steadily until about 19:00 LT, when its sign
changes again to negative values. At the studied
2010
Rn (Wm–2)
600 JANUARY
FEBRUARY
MARCH
MAY
JUNE
AUGUST
SEPTEMBER
NOVEMBER
DECEMBER
300
0
Rn (Wm–2)
600 APRIL
300
0
Rn (Wm–2)
600 JULY
300
0
Rn (Wm–2)
600 OCTOBER
300
0
0
6
8
12
Local Time (h)
0
6
8
Local Time (h)
12
0
6
8
Local Time (h)
12
Fig. 3. (a) Diurnal variation of net radiation at the OAU measurement site for the period January-December, 2010.
310
M. A. Ayoola et al.
2011
Rn (Wm–2)
600 JANUARY
FEBRUARY
MARCH
MAY
JUNE
AUGUST
SEPTEMBER
NOVEMBER
DECEMBER
300
0
Rn (Wm–2)
600 APRIL
300
0
Rn (Wm–2)
600 JULY
300
0
Rn (Wm–2)
600 OCTOBER
300
0
0
6
8
12
Local Time (h)
0
6
8
Local Time (h)
12
0
6
8
Local Time (h)
12
Fig. 3. (b) Same as (a), but for the period January-December, 2011.
location (7.52º N), sunrise and sunset times are
approximately 07:00 and 19:00 LT, respectively.
The magnitude of the maxima for the hourly averaged net radiation values (Figure 3) from January
to December (2010-2012) was observed to vary in
accordance with the change of dry to wet season
(November-March and April-October, respectively) at
Ile-Ife. For instance, in January, which is the peak of
the dry season in the area, highly turbid atmospheric
conditions (arising from dusty spells of wind-blown
aeolian aerosols of Saharan origin, known locally as
harmattan) result in low values of daytime net radiation. The net radiation value at 14:00 LT for January
was 331.6 ± 54.3 Wm–2, which evidently was the
lowest of the year. The following months, February
and March are transitional between dry and wet season,
with occasional showers leading to marked reduction
in turbidity. Consequently, net radiation maxima at
the location for both months increased considerably
to 417.1 ± 91.3 Wm–2 and 441.7 ± 82.4 Wm–2. In
April and May, when the wet (rainy) season was well
established at the location, the maximum daytime net
radiation values increased to 454.4 ± 122.3 Wm–2 and
460.7 ± 134.8 Wm–2, respectively. At the peak of the
wet season in July-August, due to frequent thunderstorm activities that accompany the formation of cumulonimbus clouds (Cbs), the lowest amounts reported were 337.6 ± 146.7 Wm–2 and 339.7 ± 118.2 Wm–2,
respectively. It is remarkable that the tendency and
range of values of net radiation in Ile-Ife are in good
agreement to the measurements reported earlier by
Jegede (1997b, c, 2003) at Osu, a nearby location.
Figure 4 shows hourly average values for net
radiation during the whole year and the wet and dry
seasons at the measurement site during the period of
observation (2010-2012). It can be observed from
Figure 4 that the fluctuation (SD) of net radiation is
up to 150 Wm–2 in the daytime during the wet season.
311
Net radiation measurements in Ile-Ife, Nigeria
2012
Rn (Wm–2)
600 JANUARY
FEBRUARY
MARCH
MAY
JUNE
AUGUST
SEPTEMBER
NOVEMBER
DECEMBER
300
0
Rn (Wm–2)
600 APRIL
300
0
Rn (Wm–2)
600 JULY
300
0
Rn (Wm–2)
600 OCTOBER
300
0
0
6
8
12
Local Time (h)
0
6
8
Local Time (h)
12
0
6
8
Local Time (h)
12
Fig. 3. (c) Same as (a), but for the period January-December, 2012.
In the dry season, shown also in Figure 4, fluctuation
is lower than 100 Wm–2. Though hourly averaged values of net radiation during the wet season are lower
than in the dry months, the larger fluctuations can be
attributed to frequently occurring cloudy conditions
(Jegede et al., 2006). In daytime periods, the difference between hourly-averaged values of net radiation
in the dry and wet seasons falls between 0 and 20
Wm–2. However, at sunrise and sunset, a difference
of up to 35 Wm–2 was observed. Generally, the hourly
averaged values of net radiation for the wet season are
higher except between 11:00 and 14:00 L.T., when a
reversal was observed. This feature is most probably
due to the increased cloudiness during these hours,
thereby resulting in reduced values of net radiation
in the wet season. From the annual average of net radiation (shown in Fig. 4c), daytime (08:00-18:00 LT)
values ranged between 45.8 ± 39.8 Wm –2 and
400.9 ± 104.4 Wm–2. For nighttime periods (20:00-
06:00 LT), the corresponding values ranged between
–40.9 ± 11.7 Wm–2 and –22.2 ± 10.0 Wm–2. Table I
shows the hourly averaged values of net radiation
(RN) at Ile-Ife for the period 2010-2012, which indicate that maximum net radiation occurs at about
13:00 LT (GMT + 1) and reaches peak values of about
400 Wm–2; the corresponding SD value is about 72
Wm–2 for the observation period (2010-2012).
Fluctuation of the diurnal trend of net radiation is
very pronounced during the wet (monsoon) season,
as shown in Figure 4. The intermittency of incoming
solar radiation is attributable mainly to the transient
nature of convective clouds, which arise due to intense surface heating from the late morning hours
(Adejokun, 1966). However, during the dry season,
the thermodynamic structure of lower troposphere
inhibits the development and growth of convective
clouds, hence a lower fluctuation of hourly averages
of net radiation is recorded.
312
M. A. Ayoola et al.
50
50
2 am
50
3 am
50
4 am
50
5 am
50
0
0
0
0
0
0
–50
–50
–50
–50
–50
–50
50
Rn (Wm–2)
1 am
7 am
50
8 am
200
9 am
400
10 am
600
0
0
100
200
300
–50
–50
0
0
0
600
1 pm
600
2 pm
600
3 pm
600
4 pm
600
300
300
300
300
300
0
0
0
0
0
50
7 pm
50
8 pm
50
9 pm
50
10 pm
50
11 am
600
0
5 pm
200
6 pm
100
0
11 pm
50
0
0
0
0
0
–50
–50
–50
–50
–50
–50
–100
–100
–100
–100
–100
–100
Dry season
12 pm
300
0
Wet season
6 am
12 am
Annual
Fig. 4. Hourly average values of net radiation at the OAU measurement site in Ile-Ife, Nigeria for the whole year
and for the wet and dry seasons, covering the period of observation 2010-2012.
“Box and whisker” plots of hourly averaged values of net radiation for January to December at the
study site are presented in Figure 5, whose statistical
distribution contains the following scores: quartiles
(25th and 75th percentiles), median (50th percentile),
mean, minimum and maximum values. From the box
plots for April and October, both of which mark the
beginning and end of the raining season at Ile-Ife, the
highest hourly averaged values of net radiation are
reported to be 584.7 and 612.2 Wm–2, respectively.
Similarly, the interquartile range (25th-75th) for April
and October was found to be the largest.
From the monthly means of net radiation, October
also recorded the highest value (112.4 Wm–2), while
the lowest value (50.7 Wm–2) was found in January.
At the peak of the rainy season (July-August) the
monthly mean values of net radiation were 82.3
and 78.4 Wm–2, respectively. The low value of net
radiation reported in July-August is due to cloudy
conditions during the daytime. The observed trend of
monthly mean values of net radiation in West Africa,
which is bimodal, is in agreement with findings by
Ojo (1977), Hayward and Oguntoyinbo (1987) and
Jegede (1997a, b, c).
The monthly mean values of net radiation have
been used to investigate whether there was a net radiative cooling or heating at the surface of the study
site. The monthly averaged values of net radiation
shown in Figure 6 indicate that throughout the year
there was cooling at the surface in nighttimes/early
mornings (19:00-07:00 LT), but there was a consistent heating of larger magnitude during daytime
(08:00-18:00 LT). In May and October the largest
recorded values of net radiative heating at the surface
313
Net radiation measurements in Ile-Ife, Nigeria
Table I. Diurnal variation of net radiation, RN (in Wm–2) at Ile-Ife (7.52º N,
4.52º E), Nigeria for the period 2010-2012.
Local time*
0
1
2
3
4
5
6
7
8
9
10
11
12
13
14
15
16
17
18
19
20
21
22
23
2010
RN
–28.6±10.7
–26.3± 9.9
–25.6 ±10.4
–21.4±9.1
–22.8±9.3
–22.1± 8.1
–19.7± 9.2
14.2 ±25.6
93.9 ±52.5
201.2 ±70.9
312.1 ±80.5
382.4 ±76.8
421.1 ±61.8
406.9 ±66.3
369.3 ±37.7
280.2 ±36.0
161.6 ±23.2
48.2 ±28.8
–29.5 ±20.4
–44.2 ±13.6
–39.6 ±13.3
–37.2 ±12.5
–34.3 ±12.0
–31.4±11.6
2011
RN
–30.9±13.3
–28.6 ±12.5
–26.6 ±12.6
–22.2 ±11.2
–24.4 ±11.7
–23.9 ±11.2
–22.5 ±12.6
11.5 ±23.9
94.6 ±39.7
202.5 ±54.5
305.8±64.1
388.7 ±68.2
427.5 ±74.1
420.4±69.3
366.3 ±49.4
283.1 ±41.4
166.1 ±38.6
45.4 ±28.6
–32.5 ±21.1
–45.4 ±15.7
–41.6 ±14.2
–39.3 ±14.3
–35.7 ±14.6
–33.2±14.0
were 120.7 and 123.1 Wm–2, respectively. The surface radiative cooling was dominant during the dry
months, November to March, with period average
–31.9±10.5
–29.6± 9.9
–28.6± 9.4
–25.9± 7.5
–26.0± 8.8
–25.4±8.2
–24.7± 8.5
–2.8±12.8
64.7±21.0
159.8±37.8
257.5±63.3
336.4±81.8
349.1±79.8
371.3±72.3
320.5±53.6
255.2±36.8
155.3±27.0
43.1±26.2
–30.5±19.9
–45.9±12.7
–42.3±11.6
–38.9±11.6
–36.2±11.1
–33.8±11.0
–30.5
–28.2
–26.9
–23.2
–24.4
–23.8
–22.3
7.6
84.4
187.8
291.8
369.2
399.2
399.6
352.1
272.8
161.0
45.6
–30.8
–45.2
–41.2
–38.5
–35.4
–32.8
200
Ile-Ife, Nigeria (2010-2012)
750
Cooling
Heating
Net
150
Radiative Flux (Wm–2)
Net Radiation (W/m2)
Period average
RN
values ranging between –13.5 and –17.0 Wm–2.
Therefore, radiative heating at the surface was far in
excess of the cooling for all months, which suggests
1000
500
250
0
–250
2012
RN
FEB
100
MAR
APR MAY
OCT NOV
JUN
SEP
JUL AUG
DEC
JAN
50
0
JAN FEB MAR APR MAY JUN JUL AUG SEP OCT NOV DEC
Fig. 5. Box and whisker plots of net radiation data at the
OAU measurement site in Ile-Ife, Nigeria covering the
observation period 2010-2012.
–50
Fig. 6. Monthly means of net radiation at the measurement
site in Ile-Ife, Nigeria (values indicate net radiative heating/cooling at the surface).
314
M. A. Ayoola et al.
an accumulation of radiative heat at the location.
This feature can be linked to the intense solar radiation input at the surface that is common for tropical/
sub-tropical areas (Holton and Hakim, 2012). In IleIfe, the hourly maximum value of global radiation,
RS↓ was higher than 1000 Wm–2 (Balogun et al.,
2003). In general, this study found a predominance
of radiative heating at the surface for the location,
with January showing the lowest value (50.7 Wm–2)
and May the highest (108.3 Wm–2).
5. Conclusions
This study has established that the short-period (< 1
hour) variability of hourly averaged values of net radiation is larger in the wet season than in the dry season,
which is attributable to increased cloudiness and humidity, as well as a dynamically unstable atmosphere.
The monthly mean values of net radiation showed
both strong intra and inter-seasonal variations, and
its annual trend follows a bimodal distribution. From
hourly averaged data, radiative heating at the surface
was found to be far in excess of radiative cooling, thus
suggesting accumulation of heat (the daily budget indicated a net gain of radiative energy). To date, the net
all-wave radiation data for Ile-Ife used in this study is
almost certainly the most consistent and detailed data
available for a tropical location in West Africa.
Acknowledgements
From 2004 to date, Nigeria Micrometeorological
Experiments (NIMEX) have been supported by the
following institutions: International Programmes in
the Physical Sciences (IPPS); Uppsala University,
Sweden; Alexander von Humboldt Foundation,
Germany; and the University of Bayreuth (Prof. Dr.
Thomas Foken, Department of Micrometeorology).
Efforts by Mr. Jide Afolabi and other technical staff
at the Department of Physics, Obafemi Awolowo
University, Ile-Ife, in setting up the automated meteorological station is very much appreciated.
References
Adejokun J. A., 1966. The three-dimensional structure of
the inter-tropical discontinuity over Nigeria. Nigerian
Meteorological Service, Lagos, 9 pp.
Alados I., I. Foyo-Moreno, F. J. Olmo and L. Alados-Arboledas, 2003. Relationship between net radiation and
solar radiation for semi-arid shrub-land. Agr. Forest
Meteorol. 116, 221-227.
Amarakoon D. and A. Chen, 1999. Estimating daytime net
radiation using routine meteorological data in Jamaica.
Caribb. J. Sci. 35, 132-141.
Arnfied A. J., 1975. A note on the diurnal, latitudinal and
seasonal variation of surface reflection coefficient. J.
Appl. Meteorol. 14, 1603-1608.
Arya S. P., 1988. An introduction to micrometeorology.
Academic Press, San Diego. 420 pp.
Augustine J. A. and E. G. Dutton, 2013. Variability of the
surface radiation budget over the United States from
1996 through 2011 from high-quality measurements.
J. Geophys. Res.-Atmos. 118, 43-53.
Balogun A. A., O. O. Jegede and J. O. Olaleye, 2003. Surface radiation budget over bare soil at Ile-Ife, Nigeria.
Nigerian Journal of Solar Energy 14, 6-13.
Duchon C. E. and G. E. Wilk, 1994. Field comparison of
direct and component measurements of net radiation
under clear skies. J. Appl. Meteorol. 33, 245-251.
Foken T., 2008a. The energy balance closure problem – An
overview. Ecol. Appl. 18, 1351-1367.
Foken T., 2008b. Micrometeorology. Springer-Verlag,
Berlin, 320 pp.
Goutourbe J. P., T. Lebel, A. Tinga, P. Bessemoulin, J.
Brouwer, A. J. Dolman, E. T. Engman, J. H. C. Gash, M.
Hoepffner, P. Kabat, Y. H. Kerry, B. Monteny, S. Prince,
F. Said, P. Sellers and J. S. Wallace, 1994. HAPEX-Sahel: A large-scale study of land-atmosphere interaction
in the semi-arid tropics. Ann. Geophys 12, 53-64.
Griffiths J. F. (Ed.), 1974. World Survey of Climatology,
vol. 10, Climates of Africa. Elsevier, Amsterdam, 620 pp.
Halldin S. and A. Lindroth, 1992. Errors in net radiometry:
Comparison and evaluation of six radiometer designs.
J. Atmos. Ocean. Technol. 9, 762-783.
Hayward D. F. and J. S. Oguntoyinbo, 1987. The climatology of West Africa. Rowan and Littlefield, New
York, 271 pp.
Holton J. R. and G. J. Hakim, 2012. An introduction to
dynamic meteorology, 5th ed. Academic Press, New
York, 552 pp.
Iziomon M. G., H. Mayer and A. Matzarakis, 2000.
Empirical models for estimating net radiative flux: A
case study for three mid-latitude sites with orographic
variability. Astrophys. Space Sci. 263, 313-330.
Jegede O. O., 1997a. Estimating net radiation from air
temperature for diffusion modelling applications in
a tropical area. Bound.-Lay. Meteorol. 85, 161-173.
Jegede O. O., 1997b. Diurnal variations of net radiation at
a tropical station – Osu, Nigeria. Theor. Appl. Climatol.
58, 161-168.
Net radiation measurements in Ile-Ife, Nigeria
Jegede O. O., 1997c. Daily averages of net radiation
measured at Osu, Nigeria. Int. J. Climatol. 17,
1357-1367.
Jegede O. O., 1998. A field study of the mean surface layer
structure in sub-Saharan West Africa: The pre-monsoon
(dry) season. Mausam 48, 361-370.
Jegede O. O., 2003. A note on net radiation at Osu, Nigeria.
Meteorol. Z. 12, 269-271.
Jegede O. O., E. O. Ogolo and T. O., Aregbesola, 2006.
Estimating net radiation using routine meteorological
data at a tropical location in Nigeria. Int. J. Sust. Energy
25, 107-115.
Kothe S. and B. Ahrens, 2010. On the radiation budget
in regional climate simulations for West Africa. J.
Geophy. Res.-Atmos. 115, 1984-2012.
Matuszko D., 2012. Influence of the extent and genera of
cloud cover on solar radiation intensity. Int. J. Climatol.
32, 2403-2414.
315
Matzinger N., M. Andretta, E. van Gorsel, R. Vogt, A.
Ohmura and M. W. Rotach, 2003. Surface radiation
budget in an Alpine valley. Q. J. Roy. Meteor. Soc.
129, 877-895.
Nielsen L. B., R. Berkowicz, K. Conradsen and L. P.
Prahm, 1981. Net incoming radiation estimated from
hourly global radiation and/or cloud observations. J.
Climatol. 1, 255-272.
Ojo O., 1977. The climates of West Africa. Heinemann,
London, 219 pp.
Smith G. L. and D. A. Rutan, 2003. The diurnal cycle
of outgoing longwave radiation from earth radiation
budget experiment measurements. J. Atmos. Sci. 60,
1529-1542.
Viudez-Mora A., 2011. Atmospheric downwelling longwave radiation at the surface during cloudless and
overcast conditions: Measurements and modeling.
Ph.D. thesis. Universitat de Girona, Spain.


© Copyright 2026