
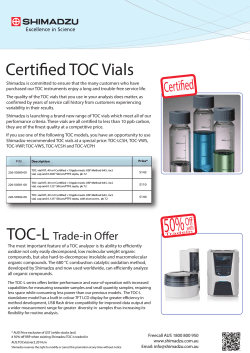
Comprehensive two-dimensional liquid chromatography for
Comprehensive two-dimensional liquid chromatography for determination of polyphenols in red wines LCxLC-PDA-MS/MS for polyphenol analysis in red wine Paola Dugo, Francesca Rigano, Francesco Cacciola, Paola Donato and Luigi Mondello University of Messin a, Italy University Campus Bio-Medico, Rome, Italy Chromaleont, a start-up of the University of Messina, Italy A comprehensive two-dimensional liquid chromatography method was developed and applied to to determination of polyphenols in red wines. To fulfil such a task, a micro cyano and a partially porous octodecylsilica columns were employed in the first and the second dimension, respectively in combination with photodiode array and mass spectrometry (LC×LC-PDA-MS) detection. To increase the peak capacity values by using RP modes in both dimensions, a comparison of a conventional full-in-fraction and shifted second gradient gradient was carried out. The separation capabilities of the comprehensive LC approaches tested allowed the analysis of such a complex natural sample without any pretreatment to effectively reduce the interferences coming from the matrix. Keywords: Comprehensive LC; Polyphenols; Red wines; mass spectrometry Introduction Phenolic compounds are secondary metabolites synthesized by plants during normal development and in response to stress conditions. They embrace a considerable range of substances possess ing an aromatic ring bearing one or more hydroxy substituents.It has been demonstrated the beneficial, physiological and anticarcinogenic properties of these compounds for the human health which has given rise to an increasing demand in their analysis. Produced and consumed world-wide, wine is an excellent natural source of various polyphenol families that go from phenolic acids (benzoic- or cinnamic-like derivatives) to different classes of flavonoids (flavones, flavan-3-ols, flavonols and anthocyanins). Sometimes, the polyphenol content in real world-samples can be so complex that they cannot be resolved in a one-dimensional HPLC analysis. In order to overcome this problem, columns with different selectivity in the two dimensions could be employed. In alternative, in order to improve the peak distribution, different gradient elution strategies could be investigated to enhance the orthogonality degree, by means of specific elution gradient approaches to be used in the second dimension. In this contribution, the benefits of comprehensive two-dimensional liquid chromatography are illustrated in the analysis of a red wine sample. Experimental Reagents and Materials LC-MS grade solvents for LC×LC analyses: water (H2O), acetonitrile (ACN); Acetic acid 99-100 %, puriss., (glacial). All the solvents and chemicals were purchased from Sigma-Aldrich (Milan, Italy). Chromatographic separations were carried out using columns provided by Supelco (Bellefonte, PA, USA): Ascentis Cyano (250×1 mm, 5 µm d.p.), and Ascentis Express C18 (30×4.6 mm, 2.7 µm d.p.). The red wine was purchased in a local market. The sample was filtered through a 0.45 mm Acrodisc nylon membrane (Pall Life Sciences, Ann Arbor, MI, USA) before injection. LC×LC instrumentation Shimadzu CBM-20A controller Shimadzu LC-30AD dual-plunger parallel-flow pumps (D1-LC) • Shimadzu DGU-20A5R degasser (D1-LC) • Shimadzu LC-30AD dual-plunger parallel-flow pumps (D2-LC) • Shimadzu DGU-20A3R degasser (D2-LC) • Shimadzu CTO-20AC column oven • Shimadzu SIL-30AC autosampler • Shimadzu SPD-M30A photo diode array detector (1.8 mL flow cell) • Shimadzu LCMS-8030 • • For connecting the two dimensions: two electronically-controlled 2position, 6-port high pressure switching valves FCV-32AH (with two 20 mL empty loops) Software Shimadzu LabSsolution (Version 5.60 SP2) • 2D Software LCxLC Assist (Figure 1) Chromsquare (Version 2.0) from Chromaleont, Messina, Italy LC×LC-MS conditions First dimension (1D) separations Column: Ascentis Cyano Flow rate: 20 µL.mL-1 Mobile phases: (A) 0.1% acetic acid in water (pH around 3); (B) acetonitrile 0.1% acetic acid. Gradient elution: 0.01 min, 2% B; 10 min, 2% B; 60 min, 50% B; 75 min, 100% B; 100 min, 100% B. Backpressure (at analysis start) = 40 bar Injection volume: 5 mL Second dimension (2D) separations Column: Ascentis Express C18 Flow rate: 2.5 mL.mL-1 Mobile phases: (A) 0.1% acetic acid in water (pH around 3); (B) acetonitrile 0.1% acetic acid. Gradient elution: FIF, full in fraction: 0.01 min, 0% B; 0.10 min, 0% B; 0.75 min, 50% B; 1.00 min, 0% B. SG, Shifted gradient: illustrated in Fig. 1 Backpressure (at analysis start) = 170 bar Modulation time of the switching valves: 2 min. MS conditions MS acquisition performed using the ESI interface operating in negative ionization mode: mass spectral range: 100-800 m/z; event time: 0.1 sec; scan speed: 7500 u/s; nebulizing gas (N2) flow: 2 L.min-1; drying gas (N2) flow: 15 L.min-1; Heat block temperature: 250oC; desolvation line (DL) temperature: 250oC; Interface voltage: 3.5 kV; detector voltage: 1.80 kV; The flow eluting from the second column was splitted before the MS instrument (approximately 0.4 mL.min-1 to the MS). Figure 1: Scheme of the LCxLC assist software Results and discussion In an LC×LC system, with two not orthogonal dimensions, an LC×LC separation most likely results in peaks concentrated around the main diagonal line of the separation area. A typical example is the LC×LC analysis of a red wine sample, illustrated in Figure 2A, by employing a Cyano column in the 1D and a C18 column in the 2D using the conventional full-in-fraction approach. As a matter of fact, a clear correlation of the 1D and 2D and a small peak-distribution area were observed because the separation mechanisms in the two dimensions were similar. The analytes eluted early in the 1D were only weakly retained in the 2D; the analytes eluted in the middle of the 1D were eluted in the middle of the 2D and the analytes eluted late in the 1D were strongly retained in the 2D. To overcome such a limitation, we used a narrower organic solvent span changing the gradient program according to the elution properties. The shifted gradient program, achieved by the LCxLC assist, illustrated in Figure 1, led to a greater coverage of the separation space (Figure 2B). The blue line is the program of the 1D run and the red line is that of the 2D run. The 2D gradient covered a narrow organic solvent range, which varied continuously during the LC×LC run. The gradient program started with 0 % acetonitrile and rase to 20 % ACN over 0.75 min; at the end of the analysis, the gradient program in the 2D starts at 10 % acetonitrile and rose to 50 % acetonitrile. At the end of the analysis, the higher percentage of organic solvent made possible the efficient elution of the strongly retained compounds. As can be seen from Figure 2B regarding the red wine sample analyzed with LC×LC with a shifted gradient in the 2D, a significant improvement in the retention space was attained (Figure 3). In fact, the use of a shifted gradient with a gradual increase of the proportion of organic solvent gave better separation in the 2D with a less typical diagonal-line distribution. In addition, because of the narrower solvent range, the backpressure was much smoother and steadier. A An evaluation of the performance, in terms of peak capacity (nC), of the two different set-up tested was carried out, considering both theoretical and practical peak capacity. The theoretical peak capacity values, multiplicative of the individual values obtained for the two dimensions (1nC ×2nC), yielded values as high as 690 and 570 for the full in fraction and for the shifted gradients, respectively. As expected, due to the partial correlation of the two dimensions, “practical” peak capacity values, corrected for both undersampling (number of fractions effectively transferred from the 1D to the 2D) and orthogonality (separation space effectively covered by sample compounds), were significantly lower viz. 75 and 216. The set-up attained with the use of the shifted second dimension gradients was the most efficient one since it less suffered from the correlation of the two dimensions tested (Table 1). B 1n C 2n C Theoretical 2D nC Practical 2D nC Full in fraction gradient 15 46 690 Shifted gradient 75 216 15 38 570 Table 1. Relative performances, in terms of peak capacity, nC, of the two set-up investigated 65.3 65.4 tR6=0.60 tR2=0.50 tR3=0.53 tR4=0.54 tR5=0.55 65.5 A 65.6 65.7 min tR6=0.58 B tR5=0.54 mAU 280nm,4nm 65.5 tR1=0.46 30 25 20 15 10 5 0 65.4 tR2=0.48 tR3=0.51 tR4=0.53 mAU 70 280nm,4nm 60 50 40 30 20 10 0 65.3 tR1=0.49 Figure 2: Separation of a red wine sample by using the FIF (A) and the Shifted gradient (B) approaches 65.6 65.7 min Fig. 3 Analysis of a red wine sample. A comparison of the second-dimension separation of the 65th fraction for both LCxLC plots shown in Figure 2A-B. The set-up with the use of the shifted gradient allowed to greatly improve the An evaluation of the performance, in terms of peak capacity (nC), of the two different set-up tested was carried out, considering both theoretical and practical peak capacity. The theoretical peak capacity values, multiplicative of the individual values obtained for the two dimensions (1nC ×2nC), yielded values as high as 690 and 570 for the full in fraction and for the shifted gradients, respectively. As expected, due to the partial correlation of the two dimensions, “practical” peak capacity values, corrected for both undersampling (number of fractions effectively transferred from the 1D to the 2D) and orthogonality (separation space effectively covered by sample compounds), were significantly lower viz. 75 and 216. The set-up attained with the use of the shifted second dimension gradients was the most efficient one since it less suffered from the correlation of the two dimensions tested (Table 1). 750000000 2:169.00(-) Inten.(x1,000,000) 169,1 2,0 500000000 1,5 Gallic acid 250000000 1,0 339,1 0,5 0 40.0 45.0 50.0 55.0 60.0 65.0 70.0 75.0 80.0 85.0 90.0 95.0 min 0,0 150 Procyanidin B1 300000000 450 550 650 750m/z 577,1 1,0 Procyanidin B2 0,5 141,1 100000000 0,0 0 750000000 350 Inten.(x1,000,000) 400000000 2:577.00(-) 200000000 250 150 443,2 212,1 295,1 250 350 450 550 650 750m/z Inten.(x1,000,000) 2:289.00(-) 2,5 289,1 2,0 500000000 250000000 Catechin 1,5 Epicatechin 0 1,0 0,5 0,0 349,1 150 350 250 579,1 450 550 650 750m/z 450 550 650 750 m/z Inten. (x100,000) 100000000 2:301.00(-) 277,2 7,5 141,1 75000000 50000000 141,1 212,1 Quercetin 25000000 0 5,0 212,1 301,1 2,5 0,0 150 250 350 Ion extracted chromatograms (on the left) along with relative mass spectra (on the right) of the main polyphenolic compounds identified in the red wine sample investigated. Conclusions A comprehensive two-dimensional liquid chromatography system, based on the use of a micro cyano column and a partially porous (C18) column in first and second dimension, respectively, in combination with photodiode array and mass spectrometry detection, is presented. Two second dimension gradient approaches, namely full in fraction and shifted were investigated and compared in terms of peak capacity. The shifted gradient method used allowed to increase the effective peak-distribution area in LC×LC analysis of a red wine sample. Therefore, the use of a shifted gradient in an LC×LC system brings about a significant improvement in separation power and is a great advantage in the analysis of such complex samples.


© Copyright 2026