
Package 'eha'
Package ‘eha’
December 17, 2014
Encoding UTF-8
Version 2.4-2
Date 2014-12-15
Title Event History Analysis
Description Sampling of risk sets in Cox regression, selections in
the Lexis diagram, bootstrapping. Parametric proportional
hazards fitting with left truncation and right censoring for
common families of distributions, piecewise constant hazards,
and discrete models. AFT regression for left truncated and
right censored data. Binary and Poisson regression for
clustered data, fixed and random effects with bootstrapping.
License GPL (>= 2)
LazyData Yes
ByteCompile Yes
Depends R (>= 3.0.0), survival (>= 2.37-6)
NeedsCompilation Yes
Author Göran Broström [aut, cre]
Maintainer Göran Broström <[email protected]>
Repository CRAN
Date/Publication 2014-12-17 23:28:47
R topics documented:
aftreg . . .
aftreg.fit . .
age.window
cal.window
check.dist .
check.surv .
coxreg . . .
coxreg.fit .
.
.
.
.
.
.
.
.
.
.
.
.
.
.
.
.
.
.
.
.
.
.
.
.
.
.
.
.
.
.
.
.
.
.
.
.
.
.
.
.
.
.
.
.
.
.
.
.
.
.
.
.
.
.
.
.
.
.
.
.
.
.
.
.
.
.
.
.
.
.
.
.
.
.
.
.
.
.
.
.
.
.
.
.
.
.
.
.
.
.
.
.
.
.
.
.
.
.
.
.
.
.
.
.
.
.
.
.
.
.
.
.
.
.
.
.
.
.
.
.
.
.
.
.
.
.
.
.
1
.
.
.
.
.
.
.
.
.
.
.
.
.
.
.
.
.
.
.
.
.
.
.
.
.
.
.
.
.
.
.
.
.
.
.
.
.
.
.
.
.
.
.
.
.
.
.
.
.
.
.
.
.
.
.
.
.
.
.
.
.
.
.
.
.
.
.
.
.
.
.
.
.
.
.
.
.
.
.
.
.
.
.
.
.
.
.
.
.
.
.
.
.
.
.
.
.
.
.
.
.
.
.
.
.
.
.
.
.
.
.
.
.
.
.
.
.
.
.
.
.
.
.
.
.
.
.
.
.
.
.
.
.
.
.
.
.
.
.
.
.
.
.
.
.
.
.
.
.
.
.
.
.
.
.
.
.
.
.
.
.
.
.
.
.
.
.
.
.
.
.
.
.
.
.
.
.
.
.
.
.
.
.
.
.
.
.
.
.
.
.
.
. 3
. 5
. 7
. 8
. 9
. 10
. 11
. 14
R topics documented:
2
cro . . . . . . . . .
EV . . . . . . . . .
fert . . . . . . . . .
geome.fit . . . . .
ghq . . . . . . . .
glmmboot . . . . .
glmmbootFit . . .
glmmML . . . . .
glmmML.fit . . . .
Gompertz . . . . .
hweibull . . . . . .
infants . . . . . . .
join.spells . . . . .
Loglogistic . . . .
Lognormal . . . . .
logrye . . . . . . .
ltx . . . . . . . . .
make.communal . .
Makeham . . . . .
male.mortality . . .
mlreg . . . . . . .
mort . . . . . . . .
oldmort . . . . . .
pch . . . . . . . . .
perstat . . . . . . .
phfunc . . . . . . .
phreg . . . . . . .
phreg.fit . . . . . .
piecewise . . . . .
plot.aftreg . . . . .
plot.coxreg . . . .
plot.hazdata . . . .
plot.phreg . . . . .
plot.Surv . . . . . .
plot.weibreg . . . .
print.aftreg . . . .
print.coxreg . . . .
print.glmmboot . .
print.glmmML . .
print.phreg . . . . .
print.weibreg . . .
risksets . . . . . .
scania . . . . . . .
summary.aftreg . .
summary.coxreg . .
summary.glmmboot
summary.glmmML
summary.phreg . .
.
.
.
.
.
.
.
.
.
.
.
.
.
.
.
.
.
.
.
.
.
.
.
.
.
.
.
.
.
.
.
.
.
.
.
.
.
.
.
.
.
.
.
.
.
.
.
.
.
.
.
.
.
.
.
.
.
.
.
.
.
.
.
.
.
.
.
.
.
.
.
.
.
.
.
.
.
.
.
.
.
.
.
.
.
.
.
.
.
.
.
.
.
.
.
.
.
.
.
.
.
.
.
.
.
.
.
.
.
.
.
.
.
.
.
.
.
.
.
.
.
.
.
.
.
.
.
.
.
.
.
.
.
.
.
.
.
.
.
.
.
.
.
.
.
.
.
.
.
.
.
.
.
.
.
.
.
.
.
.
.
.
.
.
.
.
.
.
.
.
.
.
.
.
.
.
.
.
.
.
.
.
.
.
.
.
.
.
.
.
.
.
.
.
.
.
.
.
.
.
.
.
.
.
.
.
.
.
.
.
.
.
.
.
.
.
.
.
.
.
.
.
.
.
.
.
.
.
.
.
.
.
.
.
.
.
.
.
.
.
.
.
.
.
.
.
.
.
.
.
.
.
.
.
.
.
.
.
.
.
.
.
.
.
.
.
.
.
.
.
.
.
.
.
.
.
.
.
.
.
.
.
.
.
.
.
.
.
.
.
.
.
.
.
.
.
.
.
.
.
.
.
.
.
.
.
.
.
.
.
.
.
.
.
.
.
.
.
.
.
.
.
.
.
.
.
.
.
.
.
.
.
.
.
.
.
.
.
.
.
.
.
.
.
.
.
.
.
.
.
.
.
.
.
.
.
.
.
.
.
.
.
.
.
.
.
.
.
.
.
.
.
.
.
.
.
.
.
.
.
.
.
.
.
.
.
.
.
.
.
.
.
.
.
.
.
.
.
.
.
.
.
.
.
.
.
.
.
.
.
.
.
.
.
.
.
.
.
.
.
.
.
.
.
.
.
.
.
.
.
.
.
.
.
.
.
.
.
.
.
.
.
.
.
.
.
.
.
.
.
.
.
.
.
.
.
.
.
.
.
.
.
.
.
.
.
.
.
.
.
.
.
.
.
.
.
.
.
.
.
.
.
.
.
.
.
.
.
.
.
.
.
.
.
.
.
.
.
.
.
.
.
.
.
.
.
.
.
.
.
.
.
.
.
.
.
.
.
.
.
.
.
.
.
.
.
.
.
.
.
.
.
.
.
.
.
.
.
.
.
.
.
.
.
.
.
.
.
.
.
.
.
.
.
.
.
.
.
.
.
.
.
.
.
.
.
.
.
.
.
.
.
.
.
.
.
.
.
.
.
.
.
.
.
.
.
.
.
.
.
.
.
.
.
.
.
.
.
.
.
.
.
.
.
.
.
.
.
.
.
.
.
.
.
.
.
.
.
.
.
.
.
.
.
.
.
.
.
.
.
.
.
.
.
.
.
.
.
.
.
.
.
.
.
.
.
.
.
.
.
.
.
.
.
.
.
.
.
.
.
.
.
.
.
.
.
.
.
.
.
.
.
.
.
.
.
.
.
.
.
.
.
.
.
.
.
.
.
.
.
.
.
.
.
.
.
.
.
.
.
.
.
.
.
.
.
.
.
.
.
.
.
.
.
.
.
.
.
.
.
.
.
.
.
.
.
.
.
.
.
.
.
.
.
.
.
.
.
.
.
.
.
.
.
.
.
.
.
.
.
.
.
.
.
.
.
.
.
.
.
.
.
.
.
.
.
.
.
.
.
.
.
.
.
.
.
.
.
.
.
.
.
.
.
.
.
.
.
.
.
.
.
.
.
.
.
.
.
.
.
.
.
.
.
.
.
.
.
.
.
.
.
.
.
.
.
.
.
.
.
.
.
.
.
.
.
.
.
.
.
.
.
.
.
.
.
.
.
.
.
.
.
.
.
.
.
.
.
.
.
.
.
.
.
.
.
.
.
.
.
.
.
.
.
.
.
.
.
.
.
.
.
.
.
.
.
.
.
.
.
.
.
.
.
.
.
.
.
.
.
.
.
.
.
.
.
.
.
.
.
.
.
.
.
.
.
.
.
.
.
.
.
.
.
.
.
.
.
.
.
.
.
.
.
.
.
.
.
.
.
.
.
.
.
.
.
.
.
.
.
.
.
.
.
.
.
.
.
.
.
.
.
.
.
.
.
.
.
.
.
.
.
.
.
.
.
.
.
.
.
.
.
.
.
.
.
.
.
.
.
.
.
.
.
.
.
.
.
.
.
.
.
.
.
.
.
.
.
.
.
.
.
.
.
.
.
.
.
.
.
.
.
.
.
.
.
.
.
.
.
.
.
.
.
.
.
.
.
.
.
.
.
.
.
.
.
.
.
.
.
.
.
.
.
.
.
.
.
.
.
.
.
.
.
.
.
.
.
.
.
.
.
.
.
.
.
.
.
.
.
.
.
.
.
.
.
.
.
.
.
.
.
.
.
.
.
.
.
.
.
.
.
.
.
.
.
.
.
.
.
.
.
.
.
.
.
.
.
.
.
.
.
.
.
.
.
.
.
.
.
.
.
.
.
.
.
.
.
.
.
.
.
.
.
.
.
.
.
.
.
.
.
.
.
.
.
.
.
.
.
.
.
.
.
.
.
.
.
.
.
.
.
.
.
.
.
.
.
.
.
.
.
.
.
.
.
.
.
.
.
.
.
.
.
.
.
.
.
.
.
.
.
.
.
.
.
.
.
.
.
.
.
.
.
.
.
.
.
.
.
.
.
.
.
.
.
.
.
.
.
.
.
.
.
.
.
.
.
.
.
.
.
.
.
.
.
.
.
.
.
.
.
.
.
.
.
.
.
.
.
.
.
.
.
.
.
.
.
.
.
.
.
.
.
.
.
.
.
.
.
.
.
.
.
.
.
.
.
.
.
.
.
.
.
.
.
.
.
.
.
.
.
.
.
.
.
.
.
.
.
.
.
.
.
.
.
.
.
.
.
.
.
.
.
.
.
.
.
.
.
.
.
.
.
.
.
.
.
.
.
.
.
.
.
.
.
.
.
.
.
.
.
.
.
.
.
.
.
.
.
.
.
.
.
.
.
.
.
.
.
.
.
.
.
.
.
.
.
.
.
.
.
.
.
.
.
.
.
.
.
.
.
.
.
.
.
.
.
.
.
.
.
.
.
.
.
.
.
.
.
.
.
.
.
.
.
.
.
.
.
.
.
.
.
.
.
.
.
.
.
.
.
.
.
.
.
.
.
.
.
.
.
.
.
.
.
.
.
.
.
.
.
.
.
.
.
.
.
.
.
.
.
.
.
.
.
.
.
.
.
.
.
.
.
.
.
.
.
.
.
.
.
.
.
.
.
.
.
.
.
.
.
.
.
.
.
.
.
.
.
.
.
.
.
.
.
.
.
.
.
.
.
.
.
.
.
.
.
.
.
.
.
.
.
.
.
.
.
.
.
.
.
.
.
.
.
.
.
.
.
.
.
.
.
.
.
.
.
.
.
.
.
.
.
.
.
.
.
.
.
.
.
.
.
.
.
.
.
.
.
.
.
.
.
.
.
.
.
.
.
.
.
.
.
.
.
.
.
.
.
.
.
.
.
.
.
.
.
.
.
.
.
.
.
.
.
.
.
.
.
.
.
.
.
.
.
.
.
.
.
.
.
.
.
.
.
.
.
.
.
.
.
.
.
.
.
.
.
.
.
.
.
.
.
.
.
.
.
.
.
.
.
.
.
.
.
.
.
.
.
.
.
.
.
.
.
.
.
.
.
.
.
.
.
.
.
.
.
.
.
.
.
.
.
.
.
.
.
.
.
.
.
.
.
.
.
.
.
.
.
.
.
.
.
.
.
.
.
.
.
.
.
.
.
.
.
.
.
.
.
.
.
.
.
.
.
.
.
.
.
.
.
.
.
.
.
.
.
.
.
.
.
.
.
.
.
.
.
.
.
.
.
.
.
.
.
.
.
.
.
.
.
.
.
.
.
.
.
.
.
.
.
.
.
.
.
.
.
.
.
.
.
.
.
.
.
16
17
18
19
20
21
23
24
27
28
29
30
31
32
33
34
35
36
37
38
39
42
43
44
45
46
47
50
51
52
53
54
55
56
58
59
60
60
61
62
63
64
65
66
67
67
68
69
aftreg
3
summary.weibreg
SurvSplit . . . .
swe07 . . . . . .
table.events . . .
toBinary . . . . .
toDate . . . . . .
toTime . . . . . .
weibreg . . . . .
weibreg.fit . . . .
wfunk . . . . . .
.
.
.
.
.
.
.
.
.
.
.
.
.
.
.
.
.
.
.
.
.
.
.
.
.
.
.
.
.
.
.
.
.
.
.
.
.
.
.
.
.
.
.
.
.
.
.
.
.
.
.
.
.
.
.
.
.
.
.
.
.
.
.
.
.
.
.
.
.
.
.
.
.
.
.
.
.
.
.
.
.
.
.
.
.
.
.
.
.
.
.
.
.
.
.
.
.
.
.
.
.
.
.
.
.
.
.
.
.
.
.
.
.
.
.
.
.
.
.
.
.
.
.
.
.
.
.
.
.
.
.
.
.
.
.
.
.
.
.
.
.
.
.
.
.
.
.
.
.
.
.
.
.
.
.
.
.
.
.
.
.
.
.
.
.
.
.
.
.
.
.
.
.
.
.
.
.
.
.
.
.
.
.
.
.
.
.
.
.
.
.
.
.
.
.
.
.
.
.
.
.
.
.
.
.
.
.
.
.
.
.
.
.
.
.
.
.
.
.
.
.
.
.
.
.
.
.
.
.
.
.
.
.
.
.
.
.
.
.
.
.
.
.
.
.
.
.
.
.
.
.
.
.
.
.
.
.
.
.
.
.
.
.
.
.
.
.
.
.
.
.
.
.
.
.
.
.
.
.
.
.
.
.
.
.
.
.
.
.
.
.
.
.
.
.
.
.
.
.
.
.
.
.
.
.
.
.
.
.
.
.
.
.
.
.
.
.
.
.
.
.
.
.
.
.
.
.
.
.
.
.
.
.
.
.
.
.
.
.
.
.
.
.
.
.
.
.
.
.
.
Index
aftreg
.
.
.
.
.
.
.
.
.
.
.
.
.
.
.
.
.
.
.
.
.
.
.
.
.
.
.
.
.
.
70
70
72
73
74
75
76
77
79
80
82
Accelerated Failure Time Regression
Description
The accelerated failure time model with parametric baseline hazard(s). Allows for stratification
with different scale and shape in each stratum, and left truncated and right censored data.
Usage
aftreg(formula = formula(data), data = parent.frame(),
na.action = getOption("na.action"), dist = "weibull", init, shape = 0,
id, param = c("lifeAcc", "lifeExp"),
control = list(eps = 1e-08, maxiter = 20, trace = FALSE),
singular.ok = TRUE, model = FALSE, x = FALSE, y = TRUE)
Arguments
formula
a formula object, with the response on the left of a ~ operator, and the terms
on the right. The response must be a survival object as returned by the Surv
function.
data
a data.frame in which to interpret the variables named in the formula.
na.action
a missing-data filter function, applied to the model.frame, after any subset argument has been used. Default is options()$na.action.
dist
Which distribution? Default is "weibull", with the alternatives "gompertz", "ev",
"loglogistic" and "lognormal". A special case like the exponential can be obtained by choosing "weibull" in combination with shape = 1.
init
vector of initial values of the iteration. Default initial value is zero for all variables.
shape
If positive, the shape parameter is fixed at that value. If zero or negative, the
shape parameter is estimated. Stratification is now regarded as a meaningful
option even if shape is fixed.
id
If there are more than one spell per individual, it is essential to keep spells
together by the id argument. This allows for time-varying covariates.
4
aftreg
param
Which parametrization should be used? The lifeAcc uses the parametrization
given in the vignette, while the lifeExp uses the same as in the survreg function.
control
a list with components eps (convergence criterion), maxiter (maximum number
of iterations), and trace (logical, debug output if TRUE). You can change any
component without mention the other(s).
singular.ok
Not used.
model
Not used.
x
Return the design matrix in the model object?
y
Return the response in the model object?
Details
The parameterization is different from the one used by survreg, when param =
The result is then true acceleration of time. Then the model is
"lifeAcc".
S(t; a, b, β, z) = S0 ((t/ exp(b − zβ))exp(a) )
where S0 is some standardized survivor function. The baseline parameters a and b are log shape and
log scale, respectively. This is for the default parametrization. With the lifeExp parametrization,
some signs are changed:
b − zbeta
is changed to
b + zbeta
. For the Gompertz distribution, the base parametrization is canonical, a necessity for consistency
with the shape/scale paradigm (this is new in 2.3).
Value
A list of class c("aftreg", "coxreg") with components
coefficients
Fitted parameter estimates.
var
Covariance matrix of the estimates.
loglik
Vector of length two; first component is the value at the initial parameter values,
the second componet is the maximized value.
score
The score test statistic (at the initial value).
linear.predictors
The estimated linear predictors.
means
Means of the columns of the design matrix.
w.means
Weighted (against exposure time) means of covariates; weighted relative frequencies of levels of factors.
n
Number of spells in indata (possibly after removal of cases with NA’s).
events
Number of events in data.
terms
Used by extractor functions.
aftreg.fit
5
assign
Used by extractor functions.
y
The Surv vector.
isF
Logical vector indicating the covariates that are factors.
covars
The covariates.
ttr
Total Time at Risk.
levels
List of levels of factors.
formula
The calling formula.
call
The call.
method
The method.
convergence
Did the optimization converge?
fail
Did the optimization fail? (Is NULL if not).
pfixed
TRUE if shape was fixed in the estimation.
param
The parametrization.
Author(s)
Göran Broström
See Also
coxreg, phreg, link[survival]{survreg}
Examples
data(mort)
aftreg(Surv(enter, exit, event) ~ ses, param = "lifeExp", data = mort)
aftreg.fit
Parametric proportional hazards regression
Description
This function is called by aftreg, but it can also be directly called by a user.
Usage
aftreg.fit(X, Y, dist, param, strata, offset, init, shape,
id, control, pfixed)
6
aftreg.fit
Arguments
X
The design (covariate) matrix.
Y
A survival object, the response.
dist
Which baseline distribution?
param
Which parametrization?
strata
A stratum variable.
offset
Offset.
init
Initial regression parameter values.
shape
If positive, a fixed value of the shape parameter in the distribution. Otherwise,
the shape is estimated.
id
See corresponding argument to aftreg.
control
Controls convergence and output.
pfixed
A logical indicating fixed shape parameter(s).
Details
See aftreg for more detail.
Value
coefficients
Estimated regression coefficients plus estimated scale and shape coefficients,
sorted by strata, if present.
df
Degrees of freedom; No. of regression parameters.
var
Variance-covariance matrix
loglik
Vector of length 2. The first component is the maximized loglihood with only
scale and shape in the model, the second the final maximum.
conver
TRUE if convergence
fail
TRUE if failure
iter
Number of Newton-Raphson iterates.
n.strata
The number of strata in the data.
Author(s)
Göran Broström
See Also
aftreg
age.window
age.window
7
Age cut of survival data
Description
For a given age interval, each spell is cut to fit into the given age interval.
Usage
age.window(dat, window, surv=c("enter", "exit", "event"))
Arguments
dat
Input data frame. Must contain survival data.
window
Vector of length two; the age interval.
surv
Vector of length three giving the names of the central variables in ’dat’.
Details
The window must be in the order (begin, end)
Value
A data frame of the same form as the input data frame, but ’cut’ as desired. Intervals exceeding
window[2] will be given event = 0
Author(s)
Göran Broström
See Also
cal.window, coxreg, aftreg
Examples
dat <- data.frame(enter = 0, exit = 5.731, event = 1, x = 2)
window <- c(2, 5.3)
dat.trim <- age.window(dat, window)
8
cal.window
cal.window
Calendar time cut of survival data
Description
For a given time interval, each spell is cut so that it fully lies in the given time interval
Usage
cal.window(dat, window, surv=c("enter", "exit", "event", "birthdate"))
Arguments
dat
Input data frame. Must contain survival data and a birth date.
window
Vector of length two; the time interval
surv
Vector of length four giving the names of the central variables in ’dat’.
Details
The window must be in the order (begin, end)
Value
A data frame of the same form as the input data frame, but ’cut’ as desired. Intervals exceeding
window[2] will be given event = 0
Author(s)
Göran Broström
See Also
age.window, coxreg, aftreg
Examples
dat <- data.frame(enter = 0, exit = 5.731, event = 1,
birthdate = 1962.505, x = 2)
window <- c(1963, 1965)
dat.trim <- cal.window(dat, window)
check.dist
check.dist
9
Graphical goodness-of-fit test
Description
Comparison of the cumulative hazards functions for a semi-parametric and a parametric model.
Usage
check.dist(sp, pp, main = NULL, col = NULL)
Arguments
sp
An object of type "coxreg", typically output from coxreg
pp
An object of type "phreg", typically output from phreg
main
Header for the plot. Default is distribution and "cumulative hazard function"
col
Line colors. should be NULL (black lines) or of length 2
Details
For the moment only a graphical comparison. The arguments sp and pp may be swapped.
Value
No return value.
Author(s)
Göran Broström
See Also
coxreg and phreg.
Examples
data(mort)
oldpar <- par(mfrow = c(2, 2))
fit.cr <- coxreg(Surv(enter, exit, event) ~ ses, data = mort)
fit.w <- phreg(Surv(enter, exit, event) ~ ses, data = mort)
fit.g <- phreg(Surv(enter, exit, event) ~ ses, data = mort,
dist = "gompertz")
fit.pch <- phreg(Surv(enter, exit, event) ~ ses, data = mort,
dist = "pch", cuts = c(5, 10, 15))
fit.ev <- phreg(Surv(enter, exit, event) ~ ses, data = mort,
dist = "ev")
check.dist(fit.cr, fit.w)
check.dist(fit.cr, fit.g)
10
check.surv
check.dist(fit.cr, fit.pch)
check.dist(fit.cr, fit.ev)
par(oldpar)
check.surv
Check the integrity of survival data.
Description
Check that exit occurs after enter, that spells from an individual do not overlap, and that each
individual experiences at most one event.
Usage
check.surv(enter, exit, event, id = NULL, eps = 1e-08)
Arguments
enter
Left truncation time.
exit
Time of exit.
event
Indicator of event. Zero means ’no event’.
id
Identification of individuals.
eps
The smallest allowed spell length or overlap.
Details
Interval lengths must be strictly positive.
Value
A vector of id’s for the insane individuals. Of zero length if no errors.
Author(s)
Göran Broström
See Also
join.spells, coxreg, aftreg
Examples
xx <- data.frame(enter = c(0, 1), exit = c(1.5, 3), event = c(0, 1), id =
c(1,1))
check.surv(xx$enter, xx$exit, xx$event, xx$id)
coxreg
coxreg
11
Cox regression
Description
Performs Cox regression with some special attractions, especially sampling of risksets and the weird
bootstrap.
Usage
coxreg(formula = formula(data), data = parent.frame(), weights, subset,
t.offset, na.action = getOption("na.action"), init = NULL,
method = c("efron", "breslow", "mppl", "ml"),
control = list(eps = 1e-08, maxiter = 25, trace = FALSE),
singular.ok = TRUE, model = FALSE,
center = TRUE,
x = FALSE, y = TRUE, hazards = FALSE, boot = FALSE, efrac = 0,
geometric = FALSE, rs = NULL,
frailty = NULL, max.survs = NULL)
Arguments
formula
a formula object, with the response on the left of a ~ operator, and the terms
on the right. The response must be a survival object as returned by the Surv
function.
data
a data.frame in which to interpret the variables named in the formula.
weights
Case weights; time-fixed or time-varying.
subset
An optional vector specifying a subset of observations to be used in the fitting
process.
t.offset
Case offsets; time-varying.
na.action
a missing-data filter function, applied to the model.frame, after any subset argument has been used. Default is options()$na.action.
init
vector of initial values of the iteration. Default initial value is zero for all variables.
method
Method of treating ties, "efron" (default), "breslow", "mppl" (maximum partial
partial likelihood), or "ml" (maximum likelihood).
control
a list with components eps (convergence criterion), maxiter (maximum number of iterations), and silent (logical, controlling amount of output). You can
change any component without mention the other(s).
singular.ok
Not used
model
Not used
center
Logical. If center = TRUE (default), the baseline hazards are calculated at the
means of the covariates and for the reference category for factors, otherwise at
the value zero. See Details.
12
coxreg
x
Return the design matrix in the model object?
y
return the response in the model object?
hazards
Calculate baseline hazards? Default is FALSE.
rs
Risk set?
boot
Number of boot replicates. Defaults to FALSE, no boot samples.
efrac
Upper limit of fraction failures in ’mppl’.
geometric
If TRUE, forces an ’ml’ model with constant riskset probability. Default is
FALSE.
frailty
Grouping variable for frailty analysis. Not in use yet.
max.survs
Sampling of risk sets? If given, it should be (the upper limit of) the number of
survivors in each risk set.
Details
The default method, efron, and the alternative, breslow, are both the same as in coxph in package
survival. The methods mppl and ml are maximum likelihood, discrete-model, based.
If center = TRUE (default), graphs show the "baseline" distribution at the means of (continuous)
covariates, and for the reference category in case of factors (avoiding representing "flying pigs"). If
center = FALSE the baseline distribution is at the value zero of all covariates. It is usually a good
idea to use center = FALSE in combination with "precentering" of covariates, that is, subtracting a
reference value, ideally close to the center of the covariate distribution. In that way, the "reference"
will be the same for all subsets of the data.
Value
A list of class c("coxreg", "coxph") with components
coefficients
Fitted parameter estimates.
var
Covariance matrix of the estimates.
loglik
Vector of length two; first component is the value at the initial parameter values,
the second componet is the maximized value.
score
The score test statistic (at the initial value).
linear.predictors
The estimated linear predictors.
residuals
The martingale residuals.
hazard
The estimated baseline hazard, calculated at the means of the covariates (rather,
columns of the design matrix). Is a list, with one component per stratum. Each
component is a matrix with two columns, the first contains risktimes, the second
the corresponding hazard atom.
means
Means of the columns of the design matrix corresponding to covariates, if center = TRUE.
Columns corresponding to factor levels gice a zero in the corresponding position
in means. If center = FALSE, means are all zero.
w.means
Weighted (against exposure time) means of covariates; weighted relative frequencies of levels of factors.
coxreg
13
n
Number of spells in indata (possibly after removal of cases with NA’s).
events
Number of events in data.
terms
Used by extractor functions.
assign
Used by extractor functions.
y
The Surv vector.
isF
Logical vector indicating the covariates that are factors.
covars
The covariates.
ttr
Total Time at Risk.
levels
List of levels of factors.
formula
The calling formula.
bootstrap
The (matrix of) bootstrap replicates, if requested on input. It is up to the user to
do whatever desirable with this sample.
boot.sd
The estimated standard errors of the bootstrap replicates.
call
The call.
method
The method.
convergence
Did the optimization converge?
fail
Did the optimization fail? (Is NULL if not).
Warning
The use of rs is dangerous, see note. It can however speed up computing time considerably for
huge data sets.
Note
This function starts by creating risksets, if no riskset is supplied via rs, with the aid of risksets.
Supplying output from risksets via rs fails if there are any NA’s in the data! Note also that
it depends on stratification, so rs contains information about stratification. Giving another strata
variable in the formula is an error. The same is ok, for instance to supply stratum interactions.
Author(s)
Göran Broström
References
Broström, G. and Lindkvist, M. (2008). Partial partial likelihood. Communications in Statistics:
Simulation and Computation 37:4, 679-686.
See Also
coxph, risksets
14
coxreg.fit
Examples
dat <- data.frame(time= c(4, 3,1,1,2,2,3),
status=c(1,1,1,0,1,1,0),
x=
c(0, 2,1,1,1,0,0),
sex=
c(0, 0,0,0,1,1,1))
coxreg( Surv(time, status) ~ x + strata(sex), data = dat) #stratified model
# Same as:
rs <- risksets(Surv(dat$time, dat$status), strata = dat$sex)
coxreg( Surv(time, status) ~ x, data = dat, rs = rs) #stratified model
coxreg.fit
Cox regression
Description
Called by coxreg, but a user can call it directly.
Usage
coxreg.fit(X, Y, rs, weights, t.offset = NULL,
strats, offset, init, max.survs,
method = "breslow", center = TRUE,
boot = FALSE, efrac = 0, calc.hazards = TRUE,
calc.martres = TRUE, control, verbose = TRUE)
Arguments
X
The design matrix.
Y
The survival object.
rs
The risk set composition. If absent, calculated.
weights
Case weights; time-fixed or time-varying.
t.offset
Case offset; time-varying.
strats
The stratum variable. Can be absent.
offset
Offset. Can be absent.
init
Start values. If absent, equal to zero.
max.survs
Sampling of risk sets? If so, gives the maximum number of survivors in each
risk set.
method
Either "efron" (default) or "breslow".
center
See coxreg.
boot
Number of bootstrap replicates. Defaults to FALSE, no bootstrapping.
efrac
Upper limit of fraction failures in ’mppl’.
coxreg.fit
15
calc.hazards
Should estimates of baseline hazards be calculated?
calc.martres
Should martingale residuals be calculated?
control
See coxreg
verbose
Should Warnings about convergence be printed?
Details
rs is dangerous to use when NA’s are present.
Value
A list with components
coefficients
Estimated regression parameters.
var
Covariance matrix of estimated coefficients.
loglik
First component is value at init, second at maximum.
score
Score test statistic, at initial value.
linear.predictors
Linear predictors.
residuals
Martingale residuals.
hazard
Estimated baseline hazard. At value zero of ’design’ variables.
means
Means of the columns of the design matrix.
bootstrap
The bootstrap replicates, if requested on input.
conver
TRUE if convergence.
f.conver
TRUE if variables converged.
fail
TRUE if failure.
iter
Number of performed iterations.
Note
It is the user’s responsibility to check that indata is sane.
Author(s)
Göran Broström
See Also
coxreg, risksets
16
cro
Examples
X <- as.matrix(data.frame(
x=
c(0, 2,1,4,1,0,3),
sex=
c(1, 0,0,0,1,1,1)))
time <- c(1,2,3,4,5,6,7)
status <- c(1,1,1,0,1,1,0)
stratum <- rep(1, length(time))
coxreg.fit(X, Surv(time, status), strats = stratum, max.survs = 6,
control = list(eps=1.e-4, maxiter = 10, trace = FALSE))
cro
Creates a minimal representation of a data frame.
Description
Given a data frame with a defined response variable, this function creates a unique representation
of the covariates in the data frame, vector (matrix) of responses, and a pointer vector, connecting
the responses with the corresponding covariates.
Usage
cro(dat, response=1)
Arguments
dat
A data frame
response
The column(s) where the response resides.
Details
The rows in the data frame are converted to text strings with paste and compared with match.
Value
A list with components
y
The response.
covar
A data frame with unique rows of covariates.
keys
Pointers from y to covar, connecting each response with its covariate vector.
Note
This function is based on suggestions by Anne York and Brian Ripley.
Author(s)
Göran Broström
EV
17
See Also
match, paste
Examples
dat <- data.frame(y = c(1.1, 2.3, 0.7), x1 = c(1, 0, 1), x2 = c(0, 1, 0))
cro(dat)
EV
The EV Distribution
Description
Density, distribution function, quantile function, hazard function, cumulative hazard function, and
random generation for the EV distribution with parameters shape and scale.
Usage
dEV(x,
pEV(q,
qEV(p,
hEV(x,
HEV(x,
rEV(n,
shape
shape
shape
shape
shape
shape
=
=
=
=
=
=
1,
1,
1,
1,
1,
1,
scale
scale
scale
scale
scale
scale
=
=
=
=
=
=
1,
1,
1,
1,
1,
1)
log = FALSE)
lower.tail = TRUE, log.p = FALSE)
lower.tail = TRUE, log.p = FALSE)
log = FALSE)
log.p = FALSE)
Arguments
x, q
p
n
shape, scale
log, log.p
lower.tail
vector of quantiles.
vector of probabilities.
number of observations. If length(n) > 1, the length is taken to be the number
required.
shape and scale parameters, both defaulting to 1.
logical; if TRUE, probabilities p are given as log(p).
logical; if TRUE (default), probabilities are P (X ≤ x), otherwise, P (X > x).
Details
The EV distribution with scale parameter a and shape parameter σ has hazard function given by
h(x) = (b/σ)(x/σ)( b − 1) exp((x/σ)b )
for x ≥ 0.
Value
dEV gives the density, pEV gives the distribution function, qEV gives the quantile function, hEV gives
the hazard function, HEV gives the cumulative hazard function, and rEV generates random deviates.
Invalid arguments will result in return value NaN, with a warning.
18
fert
fert
Marital fertility nineteenth century
Description
Birth intervals for married women with at least one birth, 19th northern Sweden
Usage
data(fert)
Format
A data frame with 12169 observations the lengths (in years) of birth intervals for 1859 married
women with at least one birth. The first interval (parity = 0) is the interval from marriage to first
birth.
id Personal identification number for mother.
parity Time order of birth interval for the present mother. The interval with parity = 0 is the
first, from marriage to first birth.
age The age of mother at start of interval.
year The calendar year at start of interval.
next.ivl The length of the coming time interval.
event An indicator for whether the next.ivl ends in a new birth (event = 1) or is right censored
(event = 0). Censoring occurs when the woman ends her fertility period within her first
marriage (marriage dissolution or reaching the age of 48).
prev.ivl The length of the previous time interval. May be used as explanatory variable in a Cox
regression of birth intervals.
ses Socio-economic status, a factor with levels lower, upper, farmer, and unknown.
parish The Skelleftea region consists of three parishes, Jorn, Norsjo, and Skelleftea.
Details
The data set contain clusters of dependent observations defined by mother’s id.
Source
Data is coming from The Demographic Data Base, Umea University, Umea, Sweden.
References
http://www.ddb.umu.se
geome.fit
19
Examples
data(fert)
fit <- coxreg(Surv(next.ivl, event) ~ ses + prev.ivl, data = fert, subset =
(parity == 1))
drop1(fit, test = "Chisq")
geome.fit
Constant intensity discrete time proportional hazards
Description
This function is called from coxreg. A user may call it directly.
Usage
geome.fit(X, Y, rs, strats, offset, init, max.survs, method = "ml",
boot = FALSE, control)
Arguments
X
The design matrix
Y
Survival object
rs
risk set produced by risksets
strats
Stratum indicator
offset
Offset
init
Initial values
max.survs
Maximal survivors
method
"ml", always, i.e., this argument is ignored.
boot
should we bootstrap?
control
See coxreg.
Value
See the code.
Note
Nothing special
Author(s)
Göran Broström
References
See coxreg.
20
ghq
See Also
coxreg
ghq
Gauss-Hermite
Description
Calculates the zeros and weights needed for Gauss-Hermite quadrature.
Usage
ghq(n.points = 1, modified = TRUE)
Arguments
n.points
modified
Number of points.
Multiply by exp(zeros**2)? Default is TRUE.
Details
Based on a Fortran 66 subroutine written by professor Jianming Jin.
Value
A list vith components
zeros
weights
The zeros (abscissas).
The weights
Note
The code is modified to suit the purpose of glmmML, with the permission of professor Jin.
Author(s)
Jianming Jin, Univ. of Illinois, Urbana-Campaign
References
Gauss-Hermite
See Also
glmmML
Examples
ghq(15, FALSE)
glmmboot
glmmboot
21
Generalized Linear Models with fixed effects grouping
Description
Fits grouped GLMs with fixed group effects. The significance of the grouping is tested by simulation, with a bootstrap approach.
Usage
glmmboot(formula, family = binomial, data, cluster, weights, subset, na.action,
offset, start.coef = NULL,
control = list(epsilon = 1e-08, maxit = 200, trace = FALSE), boot = 0)
Arguments
formula
a symbolic description of the model to be fit. The details of model specification
are given below.
family
Currently, the only valid values are binomial and poisson. The binomial family allows for the logit and cloglog links.
data
an optional data frame containing the variables in the model. By default the variables are taken from ‘environment(formula)’, typically the environment from
which ‘glmmML’ is called.
cluster
Factor indicating which items are correlated.
weights
Case weights.
subset
an optional vector specifying a subset of observations to be used in the fitting
process.
na.action
See glm.
offset
this can be used to specify an a priori known component to be included in the
linear predictor during fitting.
start.coef
starting values for the parameters in the linear predictor. Defaults to zero.
control
Controls the convergence criteria. See glm.control for details.
boot
number of bootstrap replicates. If equal to zero, no test of significance of the
grouping factor is performed.
Details
The simulation is performed by simulating new response vectors from the fitted probabilities without clustering, and comparing the maximized log likelihoods. The maximizations are performed by
profiling out the grouping factor. It is a very fast procedure, compared to glm, when the grouping
factor has many levels.
22
glmmboot
Value
The return value is a list, an object of class ’glmmboot’.
coefficients
Estimated regression coefficients
logLik
the max log likelihood
cluster.null.deviance
Deviance without the clustering
frail
The estimated cluster effects
bootLog
The logLik values from the bootstrap samples
bootP
Bootstrap p value
variance
Variance covariance matrix
sd
Standard error of regression parameters
boot_rep
No. of bootstrap replicates
mixed
Logical
deviance
Deviance
df.residual
Its degrees of freedom
aic
AIC
boot
Logical
call
The function call
Note
There is no overall intercept for this model; each cluster has its own intercept. See frail
Author(s)
Göran Broström
See Also
link{glmmML}, optim, lmer in the package lme4, and glmmPQL in the package MASS.
Examples
## Not run:
id <- factor(rep(1:20, rep(5, 20)))
y <- rbinom(100, prob = rep(runif(20), rep(5, 20)), size = 1)
x <- rnorm(100)
dat <- data.frame(y = y, x = x, id = id)
res <- glmmboot(y ~ x, cluster = id, data = dat, boot = 500)
## End(Not run)
##system.time(res.glm <- glm(y ~ x + id, family = binomial))
glmmbootFit
23
glmmbootFit
Generalized Linear Models with fixed effects grouping
Description
’glmmbootFit’ is the workhorse in the function glmmboot. It is suitable to call instead of ’glmmboot’, e.g. in simulations.
Usage
glmmbootFit(X, Y, weights = rep(1, NROW(Y)),
start.coef = NULL, cluster = rep(1, length(Y)),
offset = rep(0, length(Y)), family = binomial(),
control = list(epsilon = 1.e-8, maxit = 200, trace
= FALSE), boot = 0)
Arguments
X
Y
weights
start.coef
cluster
offset
family
control
boot
The design matrix (n * p).
The response vector of length n.
Case weights.
start values for the parameters in the linear predictor (except the intercept).
Factor indicating which items are correlated.
this can be used to specify an a priori known component to be included in the
linear predictor during fitting.
Currently, the only valid values are binomial and poisson. The binomial family allows for the logit and cloglog links.
A list. Controls the convergence criteria. See glm.control for details.
number of bootstrap replicates. If equal to zero, no test of significance of the
grouping factor is performed.
Value
A list with components
coefficients
Estimated regression coefficients (note: No intercept).
logLik
The maximised log likelihood.
cluster.null.deviance
deviance from a moddel without cluster.
frail
The estimated cluster effects.
bootLog
The maximised bootstrap log likelihood values. A vector of length boot.
bootP
The bootstrap p value.
variance
The variance-covariance matrix of the fixed effects (no intercept).
sd
The standard errors of the coefficients.
boot_rep
The number of bootstrap replicates.
24
glmmML
Note
A profiling approach is used to estimate the cluster effects.
Author(s)
Göran Broström
See Also
glmmboot
Examples
## Not run
x <- matrix(rnorm(1000), ncol = 1)
id <- rep(1:100, rep(10, 100))
y <- rbinom(1000, size = 1, prob = 0.4)
fit <- glmmbootFit(x, y, cluster = id, boot = 200)
summary(fit)
## End(Not run)
## Should show no effects.
glmmML
Generalized Linear Models with random intercept
Description
Fits GLMs with random intercept by Maximum Likelihood and numerical integration via GaussHermite quadrature.
Usage
glmmML(formula, family = binomial, data, cluster, weights,
cluster.weights, subset, na.action,
offset, prior = c("gaussian", "logistic", "cauchy", "gamma"),
start.coef = NULL, start.sigma = NULL, fix.sigma = FALSE, x = FALSE,
control = list(epsilon = 1e-08, maxit = 200, trace = FALSE),
method = c("Laplace", "ghq"), n.points = 8, boot = 0)
Arguments
formula
a symbolic description of the model to be fit. The details of model specification
are given below.
family
Currently, the only valid values are binomial and poisson. The binomial family allows for the logit and cloglog links.
data
an optional data frame containing the variables in the model. By default the variables are taken from ‘environment(formula)’, typically the environment from
which ‘glmmML’ is called.
glmmML
cluster
25
Factor indicating which items are correlated.
weights
Case weights. Defaults to one.
cluster.weights
Cluster weights. Defaults to one.
subset
an optional vector specifying a subset of observations to be used in the fitting
process.
na.action
See glm.
start.coef
starting values for the parameters in the linear predictor. Defaults to zero.
start.sigma
starting value for the mixing standard deviation. Defaults to 0.5.
fix.sigma
Should sigma be fixed at start.sigma?
x
If TRUE, the design matrix is returned (as x).
offset
this can be used to specify an a priori known component to be included in the
linear predictor during fitting.
prior
Which "prior" distribution (for the random effects)? Possible choices are "gaussian" (default), "logistic", and "cauchy". For the poisson family, it is possible to
use the conjugate "gamma" prior, which avoids numerical integration.
control
Controls the convergence criteria. See glm.control for details.
method
There are two choices "Laplace" (default) and "ghq" (Gauss-Hermite).
n.points
Number of points in the Gauss-Hermite quadrature. If n.points == 1, the GaussHermite is the same as Laplace approximation. If method is set to "Laplace",
this parameter is ignored.
boot
Do you want a bootstrap estimate of cluster effect? The default is No (boot = 0).
If you want to say yes, enter a positive integer here. It should be equal to the
number of bootstrap samples you want to draw. A recomended absolute minimum value is boot = 2000.
Details
The integrals in the log likelihood function are evaluated by the Laplace approximation (default) or
Gauss-Hermite quadrature. The latter is now fully adaptive; however, only approximate estimates
of variances are available for the Gauss-Hermite (n.points > 1) method.
For the binomial families, the response can be a two-column matrix, see the help page for glm for
details.
Value
The return value is a list, an object of class ’glmmML’. The components are:
boot
No. of boot replicates
converged
Logical
coefficients
Estimated regression coefficients
coef.sd
Their standard errors
sigma
The estimated random effects’ standard deviation
26
glmmML
sigma.sd
Its standard error
variance
The estimated variance-covariance matrix. The last column/row corresponds to
the standard deviation of the random effects (sigma)
aic
AIC
bootP
Bootstrap p value from testing the null hypothesis of no random effect (sigma =
0)
deviance
Deviance
mixed
Logical
df.residual
Degrees of freedom
cluster.null.deviance
Deviance from a glm with no clustering. Subtracting deviance gives a test
statistic for the null hypothesis of no clustering. Its asymptotic distribution is a
symmetric mixture a constant at zero and a chi-squared distribution with one df.
The printed p-value is based on this.
cluster.null.df
Its degrees of freedom
posterior.modes
Estimated posterior modes of the random effects
terms
The terms object
info
From hessian inversion. Should be 0. If not, no variances could be estimated.
You could try fixing sigma at the estimated value and rerun.
prior
Which prior was used?
call
The function call
x
The design matrix if asked for, otherwise not present
Note
The optimization may not converge with the default value of start.sigma. In that case, try different
start values for sigma. If still no convergence, consider the possibility to fix the value of sigma at
several values and study the profile likelihood.
Author(s)
Göran Broström
References
Broström (2003). Generalized linear models with random intercepts. http://www.stat.umu.se/
forskning/reports/glmmML.pdf
See Also
glmmboot, glm, optim, lmer in the package lme4 and glmmPQL in the package MASS.
glmmML.fit
27
Examples
id <- factor(rep(1:20, rep(5, 20)))
y <- rbinom(100, prob = rep(runif(20), rep(5, 20)), size = 1)
x <- rnorm(100)
dat <- data.frame(y = y, x = x, id = id)
glmmML(y ~ x, data = dat, cluster = id)
glmmML.fit
Generalized Linear Model with random intercept
Description
This function is called by glmmML, but it can also be called directly by the user.
Usage
glmmML.fit(X, Y, weights = rep(1, NROW(Y)), cluster.weights = rep(1, NROW(Y)),
start.coef = NULL, start.sigma = NULL,
fix.sigma = FALSE,
cluster = NULL, offset = rep(0, nobs), family = binomial(),
method = 1, n.points = 1,
control = list(epsilon = 1.e-8, maxit = 200, trace = FALSE),
intercept = TRUE, boot = 0, prior = 0)
Arguments
X
Design matrix of covariates.
Y
Response vector. Or two-column matrix.
weights
Case weights. Defaults to one.
cluster.weights
Cluster weights. Defaults to one.
start.coef
Starting values for the coefficients.
start.sigma
Starting value for the mixing standard deviation.
fix.sigma
Should sigma be fixed at start.sigma?
cluster
The clustering variable.
offset
The offset in the model.
family
Family of distributions. Defaults to binomial with logit link. Other possibilities
are binomial with cloglog link and poisson with log link.
method
Laplace (1) or Gauss-hermite (0)?
n.points
Number of points in the Gauss-Hermite quadrature. Default is n.points = 1,
which is equivalent to Laplace approximation.
control
Control of the iterations. See glm.control.
intercept
Logical. If TRUE, an intercept is fitted.
boot
Integer. If > 0, bootstrapping with boot replicates.
prior
Which prior distribution? 0 for "gaussian", 1 for "logistic", 2 for "cauchy".
28
Gompertz
Details
In the optimisation, "vmmin" (in C code) is used.
Value
A list. For details, see the code, and glmmML.
Author(s)
Göran Broström
References
Broström (2003)
See Also
glmmML, glmmPQL in the package MASS, and lmer in the package lme4.
Examples
x <- cbind(rep(1, 14), rnorm(14))
y <- rbinom(14, prob = 0.5, size = 1)
id <- rep(1:7, 2)
glmmML.fit(x, y, cluster = id)
Gompertz
The Gompertz Distribution
Description
Density, distribution function, quantile function, hazard function, cumulative hazard function, and
random generation for the Gompertz distribution with parameters shape and scale.
Usage
dgompertz(x, shape = 1, scale = 1, log = FALSE, param = c("default", "canonical"))
pgompertz(q, shape = 1, scale = 1, lower.tail = TRUE, log.p = FALSE,
param = c("default", "canonical"))
qgompertz(p, shape = 1, scale = 1, lower.tail = TRUE, log.p = FALSE,
param = c("default", "canonical"))
hgompertz(x, shape = 1, scale = 1, log = FALSE, param = c("default", "canonical"))
Hgompertz(x, shape = 1, scale = 1, log.p = FALSE, param = c("default", "canonical"))
rgompertz(n, shape = 1, scale = 1, param = c("default", "canonical"))
hweibull
29
Arguments
x, q
vector of quantiles.
p
vector of probabilities.
n
number of observations. If length(n) > 1, the length is taken to be the number
required.
shape, scale
Parameters: shape, defaulting to 1, and scale, defaulting to 1.
log, log.p
logical; if TRUE, probabilities p are given as log(p).
lower.tail
logical; if TRUE (default), probabilities are P (X ≤ x), otherwise, P (X > x).
param
See ’details’ below.
Details
The Gompertz distribution with shape parameter a and scale parameter σ has hazard given by
h(x) = a exp(x/σ)
for x ≥ 0. If param = "canonical", then then a –> a/b, so that b is a true scale parameter (for any
fixed a), and b is an ’AFT parameter’.
Value
dgompertz gives the density, pgompertz gives the distribution function, qgompertz gives the quantile function, hgompertz gives the hazard function, Hgompertz gives the cumulative hazard function, and rgompertz generates random deviates.
Invalid arguments will result in return value NaN, with a warning.
hweibull
The (Cumulative) Hazard Function of a Weibull Distribution
Description
hweibull calculates the hazard function of a Weibull distribution, and Hweibull calculates the
corresponding cumulative hazard function.
Usage
hweibull(x, shape, scale = 1, log = FALSE)
Hweibull(x, shape, scale = 1, log = FALSE)
Arguments
x
Vector of quantiles.
shape
The shape parameter.
scale
The scale parameter, defaults to 1.
log
logical; if TRUE, the log of the hazard function is given.
30
infants
Details
See dweibull.
Value
The (cumulative) hazard function, evaluated at x.
Author(s)
Göran Broström
See Also
pweibull
Examples
hweibull(3, 2, 1)
dweibull(3, 2, 1) / pweibull(3, 2, 1, lower.tail = FALSE)
Hweibull(3, 2, 1)
-pweibull(3, 2, 1, log.p = TRUE, lower.tail = FALSE)
infants
Infant mortality and maternal death, Sweeden 1821–1894.
Description
Matched data on infant mortality, from seven parishes in Sweden, 1821–1894.
Usage
data(infants)
Format
A data frame with 80 rows and five variables.
stratum Triplet No. Each triplet consist of one infant whose mother died (a case), and two controls,
i.e, infants whose mother did not die. Matched on covariates below.
enter Age (in days) of case when its mother died.
exit Age (in days) at death or right censoring (at age 365 days).
event Follow-up ends with death (1) or right censoring (0).
mother dead for cases, alive for controls.
age Mother’s age at infant’s birth.
sex The infant’s sex.
parish Birth parish, either Nedertornea or not Nedertornea.
join.spells
31
civst Civil status of mother, married or unmarried.
ses Socio-economic status of mother, either farmer or not farmer.
year Year of birth of the infant.
Details
From 5641 first-born in seven Swedish parishes 1820-1895, from Fleninge in the very south to
Nedertorneå in the very north, those whose mother died during their first year of life were selected,
in all 35 infants. To each of them, two cotrols were selected by matching on the given covariates.
Source
Data originate from The Demographic Data Base, Umeå University, Umeå, Sweden, http://www.
ddb.umu.se.
References
Broström, G. (1987). The influence of mother’s death on infant mortality: A case study in matched
data survival analysis. Scandinavian Journal of Statistics 14, 113-123.
Examples
data(infants)
fit <- coxreg(Surv(enter, exit, event) ~ strata(stratum) + mother, data
= infants)
fit
fit.w <- phreg(Surv(enter, exit, event) ~ mother + parish + ses, data =
infants)
fit.w ## Weibull proportional hazards model.
join.spells
Straighten up a survival data frame
Description
Unnecessary cut spells are glued together, overlapping spells are "polished", etc.
Usage
join.spells(dat, strict = FALSE, eps = 1.e-8)
Arguments
dat
A data frame with names enter, exit, event, id.
strict
If TRUE, nothing is changed if errors in spells (non-positive length, overlapping
intervals, etc.) are detected. Otherwise (the default), bad spells are removed,
with "earlier life" having higher priority.
eps
Tolerance for equality of two event times. Should be kept small.
32
Loglogistic
Details
In case of overlapping intervals (i.e., a data error), the appropriate id’s are returned if strict is
TRUE.
Value
A data frame with the same variables as the input, but individual spells are joined, if possible
(identical covariate values, and adjacent time intervals).
Author(s)
Göran Broström
References
Therneau, T.M. and Grambsch, P.M. (2000). Modeling Survival Data: Extending the Cox model.
Springer.
See Also
coxreg, aftreg, check.surv
Loglogistic
The Loglogistic Distribution
Description
Density, distribution function, quantile function, hazard function, cumulative hazard function, and
random generation for the Loglogistic distribution with parameters shape and scale.
Usage
dllogis(x,
pllogis(q,
qllogis(p,
hllogis(x,
Hllogis(x,
rllogis(n,
shape
shape
shape
shape
shape
shape
=
=
=
=
=
=
1,
1,
1,
1,
1,
1,
scale
scale
scale
scale
scale
scale
=
=
=
=
=
=
1,
1,
1,
1,
1,
1)
log = FALSE)
lower.tail = TRUE, log.p = FALSE)
lower.tail = TRUE, log.p = FALSE)
prop = 1, log = FALSE)
prop = 1, log.p = FALSE)
Arguments
x, q
vector of quantiles.
p
vector of probabilities.
n
number of observations. If length(n) > 1, the length is taken to be the number
required.
shape, scale
shape and scale parameters, both defaulting to 1.
Lognormal
33
prop
A ’proportional hazards’ parameter, for now only available for hllogis and
Hllogis. See Details.
log, log.p
logical; if TRUE, probabilities p are given as log(p).
lower.tail
logical; if TRUE (default), probabilities are P [X ≤ x], otherwise, P [X > x].
Details
The Loglogistic distribution with shape parameter a and scale parameter σ has density given by
f (x) = (a/σ)(x/σ)
a−1
a
/(1 + (x/σ) )2
a
for x ≥ 0. The cumulative distribution function is F (x) = 1 − 1/(1 + (x/σ) ) on x ≥ 0.
From eha version 2.3-0, the loglogistic distribution is extended to a three-parameter family of distributions. The third parameter, ’prop’, is a ’proportional hazards’ parameter, simply multiplying
the hazard function by its value. For now only implemented in the hazard and cumulative hazards
functions, but it will be introduced fully soon. Probably as a class of distributions with a new name.
See also phreg.
Value
dllogis gives the density, pllogis gives the distribution function, qllogis gives the quantile
function, hllogis gives the hazard function, Hllogis gives the cumulative hazard function, and
rllogis generates random deviates.
Invalid arguments will result in return value NaN, with a warning.
See Also
phreg, aftreg.
Lognormal
The Lognormal Distribution
Description
Hazard function and cumulative hazard function for the Lognormal distribution with parameters
shape and scale.
Usage
hlnorm(x,
shape = 1
Hlnorm(x,
shape = 1
meanlog = 0, sdlog = 1,
/ sdlog, scale = exp(meanlog), prop = 1, log = FALSE)
meanlog = 0, sdlog = 1,
/ sdlog, scale = exp(meanlog), prop = 1, log.p = FALSE)
34
logrye
Arguments
x
vector of quantiles.
meanlog, sdlog Mean and standard deviation in the distribution of the logarithm of a lognormal
random variable.
shape, scale
shape and scale parameters, both defaulting to 1.
prop
A ’proportional hazards’ parameter, see Details.
log, log.p
logical; if TRUE, probabilities p are given as log(p).
Details
This is a complement to the Lognormal distribution, see Lognormal for further details.
From eha version 2.3-0, the lognormal distribution is extended to a three-parameter family of distributions. The third parameter, ’prop’, is a ’proportional hazards’ parameter, simply multiplying
the hazard function by its value. For now only implemented in the hazard and cumulative hazards
functions, but it will be introduced fully soon. Probably as a class of distributions with a new name.
Value
hlnorm gives the hazard function, and Hlnorm gives the cumulative hazard function.
Invalid arguments will result in return value NaN, with a warning.
See Also
phreg, aftreg.
logrye
Rye prices, Scania, southern Sweden, 1801-1894.
Description
The data consists of yearly rye prices from 1801 to 1894. Logged and detrended, so the time series
is supposed to measure short term fluctuations in rye prices.
Usage
data(scania)
Format
A data frame with 94 observations in two columns on the following 2 variables.
year The year the price is recorded.
foodprices Detrended log rye prices.
ltx
35
Details
The Scanian area in southern Sweden was during the 19th century a mainly rural area.
Source
The Scanian Economic Demographic Database.
References
Jörberg, L. (1972). A History of Prices in Sweden 1732-1914, CWK Gleerup, Lund.
Examples
data(logrye)
summary(logrye)
ltx
LaTeX printing of coxreg results.
Description
This (generic) function prints the LaTeX code of the results of a fit from coxreg, phreg, or aftreg,
similar to what xtable does for fits from other functions.
Usage
ltx(x, caption = NULL, label = NULL, dr = NULL,
digits = max(options()$digits - 4, 3), ...)
Arguments
x
The output from a call to coxreg, coxreg, or aftreg
caption
A suitable caption for the table.
label
A label used in the LaTeX code.
dr
Output from a drop1 call.
digits
Number of digits to be printed.
...
Not used.
Details
The result is a printout which is (much) nicer than the standard printed output from glm and friends,
Value
LaTeX code version of the results from a run with coxreg, phreg, or aftreg.
36
make.communal
Note
There is no method in xtable for coxreg.
Author(s)
Göran Broström.
See Also
xtable, coxreg
Examples
data(oldmort)
fit <- coxreg(Surv(enter, exit, event) ~ civ + sex, data = oldmort)
dr <- drop1(fit, test = "Chisq")
ltx(fit, dr = dr, caption = "A test example.", label = "tab:test1")
make.communal
Put communals in "fixed" data frame
Description
Given an ordinary data frame suitable for survival analysis, and a data frame with "communal" time
series, this function includes the communal covariates as fixed, by the "cutting spells" method.
Usage
make.communal(dat, com.dat, communal = TRUE, start, period = 1, lag = 0,
surv=c("enter", "exit", "event", "birthdate"), tol=1e-04, fortran=TRUE)
Arguments
dat
A data frame containing interval specified survival data and covariates, of which
one must give a "birth date", the connection between duration and calendat time
com.dat
Data frame with communal covariates. They must have the same start year and
periodicity, given by com.ins
communal
Boolean; if TRUE, then it is a true communal (default), otherwise a fixed. The
first component is the first year (start date in decimal form), and the second
component is the period length. The third is lag and the fourth is scale.
start
Start date in decimal form.
period
Period length. Defaults to one.
lag
The lag of the effect. Defaults to zero.
surv
Character vector of length 4 giving the names of interval start, interval end,
event indicator, birth date, in that order. These names must correspond to names
in dat
Makeham
37
tol
Largest length of an interval considered to be of zero length. The cutting sometimes produces zero length intervals, which we want to discard.
fortran
If TRUE, then a Fortran implementation of the function is used. This is the default. This possibility is only for debugging purposes. You should of course get
identical results with the two methods.
Details
The main purpose of this function is to prepare a data file for use with coxreg, aftreg, and coxph.
Value
The return value is a data frame with the same variables as in the combination of dat and com.dat.
Therefore it is an error to have common name(s) in the two data frames.
Note
Not very vigorously tested.
Author(s)
Göran Broström
See Also
coxreg, aftreg, coxph, cal.window
Examples
dat <- data.frame(enter = 0, exit = 5.731, event = 1,
birthdate = 1962.505, x = 2)
## Birth date: July 2, 1962 (approximately).
com.dat <- data.frame(price = c(12, 3, -5, 6, -8, -9, 1, 7))
dat.com <- make.communal(dat, com.dat, start = 1962.000)
Makeham
The Gompertz-Makeham Distribution
Description
Density, distribution function, quantile function, hazard function, cumulative hazard function, and
random generation for the Gompertz-Makeham distribution with parameters shape1, shape2 and
scale.
38
male.mortality
Usage
dmakeham(x,
pmakeham(q,
qmakeham(p,
hmakeham(x,
Hmakeham(x,
rmakeham(n,
shape
shape
shape
shape
shape
shape
=
=
=
=
=
=
c(1,
c(1,
c(1,
c(1,
c(1,
c(1,
1),
1),
1),
1),
1),
1),
scale
scale
scale
scale
scale
scale
=
=
=
=
=
=
1,
1,
1,
1,
1,
1)
log = FALSE)
lower.tail = TRUE, log.p = FALSE)
lower.tail = TRUE, log.p = FALSE)
log = FALSE)
log.p = FALSE)
Arguments
x, q
vector of quantiles.
p
vector of probabilities.
n
number of observations. If length(n) > 1, the length is taken to be the number
required.
shape, scale
Parameters: shape, a vector of length 2, defaulting to c(1, 1), and scale, defaulting to 1.
log, log.p
logical; if TRUE, probabilities p are given as log(p).
lower.tail
logical; if TRUE (default), probabilities are P (X ≤ x), otherwise, P (X > x).
Details
The Gompertz-Makeham distribution with shape parameters a1 and a2 and scale parameter σ has
hazard function given by
h(x) = a2 + a1 exp(x/σ)
for x ≥ 0.
Value
dmakeham gives the density, pmakeham gives the distribution function, qmakeham gives the quantile
function, but is not yet implemented, hmakeham gives the hazard function, Hmakeham gives the
cumulative hazard function, and rmakeham generates random deviates.
Invalid arguments will result in return value NaN, with a warning.
male.mortality
Male mortality in ages 40-60, nineteenth century
Description
Males born in the years 1800-1820 and surving at least 40 years in the parish Skellefteå in northern
Sweden are followed from their fortieth birthday until death or the sixtieth birthday, whichever
comes first.
Usage
data(male.mortality)
mlreg
39
Format
A data frame with 2058 observations on the following 6 variables.
id Personal identification number.
enter Start of duration. Measured in years since the fortieth birthday.
exit End of duration. Measured in years since the fortieth birthday.
event a logical vector indicating death at end of interval.
birthdate The birthdate in decimal form.
ses Socio-economic status, a factor with levels lower, upper
Details
The interesting explanatory covariate is ses (socioeconomic status), which is a time-varying covariate. This explains why several individuals are representated by more than one record each. Left
trucation and right censoring are introduced this way.
Note
This data set is also known, and accessible, as mort.
Source
Data is coming from The Demographic Data Base, Umea University, Umeå, Sweden.
References
http://www.ddb.umu.se
Examples
data(male.mortality)
coxreg(Surv(enter, exit, event) ~ ses, data = male.mortality)
mlreg
ML proportional hazards regression
Description
Maximum Likelihood estimation of proportional hazards models. Is deprecated, use coxreg instead.
Usage
mlreg(formula = formula(data), data = parent.frame(),
na.action = getOption("na.action"), init=NULL, method = c("ML", "MPPL"),
control = list(eps = 1e-08, maxiter = 10, n.points = 12, trace = FALSE),
singular.ok = TRUE, model = FALSE, center = TRUE,
x = FALSE, y = TRUE, boot = FALSE, geometric = FALSE,
rs=NULL, frailty = NULL, max.survs=NULL)
40
mlreg
Arguments
formula
a formula object, with the response on the left of a ~ operator, and the terms
on the right. The response must be a survival object as returned by the Surv
function.
data
a data.frame in which to interpret the variables named in the formula.
na.action
a missing-data filter function, applied to the model.frame, after any subset argument has been used. Default is options()$na.action.
init
vector of initial values of the iteration. Default initial value is zero for all variables.
method
Method of treating ties, "ML", the default, means pure maximum likelihood, i.e,
data are treated as discrete. The choice "MPPL" implies that risk sets with no
tied events are treated as in ordinary Cox regression. This is a cameleont that
adapts to data, part discrete and part continuous.
control
a list with components eps (convergence criterion), maxiter (maximum number of iterations), and silent (logical, controlling amount of output). You can
change any component without mention the other(s).
singular.ok
Not used.
model
Not used.
center
Should covariates be centered? Default is TRUE
x
Return the design matrix in the model object?
y
return the response in the model object?
boot
No. of bootstrap replicates. Defaults to FALSE, i.e., no bootstrapping.
geometric
If TRUE, the intensity is assumed constant within strata.
rs
Risk set? If present, speeds up calculations considerably.
frailty
A grouping variable for frailty analysis. Full name is needed.
max.survs
Sampling of risk sets?
Details
Method ML performs a true discrete analysis, i.e., one parameter per observed event time. Method
MPPL is a compromize between the discrete and continuous time approaches; one parameter per
observed event time with multiple events. With no ties in data, an ordinary Cox regression (as with
coxreg) is performed.
Value
A list of class c("mlreg", "coxreg", "coxph") with components
coefficients
Fitted parameter estimates.
var
Covariance matrix of the estimates.
loglik
Vector of length two; first component is the value at the initial parameter values,
the second componet is the maximized value.
score
The score test statistic (at the initial value).
mlreg
41
linear.predictors
The estimated linear predictors.
residuals
The martingale residuals.
hazard
The estimated baseline hazard.
means
Means of the columns of the design matrix.
w.means
Weighted (against exposure time) means of covariates; weighted relative frequencies of levels of factors.
n
Number of spells in indata (possibly after removal of cases with NA’s).
events
Number of events in data.
terms
Used by extractor functions.
assign
Used by extractor functions.
wald.test
The Walt test statistic (at the initial value).
y
The Surv vector.
isF
Logical vector indicating the covariates that are factors.
covars
The covariates.
ttr
Total Time at Risk.
levels
List of levels of factors.
formula
The calling formula.
call
The call.
bootstrap
The bootstrap sample, if requested on input.
sigma
Present if a frailty model is fitted. Equals the estimated frailty standard deviation.
sigma.sd
The standard error of the estimated frailty standard deviation.
method
The method.
convergence
Did the optimization converge?
fail
Did the optimization fail? (Is NULL if not).
Warning
The use of rs is dangerous, see note above. It can however speed up computing time.
Note
This function starts by creating risksets, if no riskset is supplied via rs, with the aid of risksets.
This latter mechanism fails if there are any NA’s in the data! Note also that it depends on stratification, so rs contains information about stratification. Giving another strata variable in the formula is
an error. The same is ok, for instance to supply stratum interactions.
Note futher that mlreg is deprecated. coxreg should be used instead.
Author(s)
Göran Broström
42
mort
References
Broström, G. (2002). Cox regression; Ties without tears. Communications in Statistics: Theory and
Methods 31, 285–297.
See Also
coxreg, risksets
Examples
dat <- data.frame(time= c(4, 3,1,1,2,2,3),
status=c(1,1,1,0,1,1,0),
x=
c(0, 2,1,1,1,0,0),
sex=
c(0, 0,0,0,1,1,1))
mlreg( Surv(time, status) ~ x + strata(sex), data = dat) #stratified model
# Same as:
rs <- risksets(Surv(dat$time, dat$status), strata = dat$sex)
mlreg( Surv(time, status) ~ x, data = dat, rs = rs) #stratified model
mort
Male mortality in ages 40-60, nineteenth century
Description
Males born in the years 1800-1820 and surving at least 40 years in the parish Skellefteå in northern
Sweden are followed from their fortieth birthday until death or the sixtieth birthday, whichever
comes first.
Usage
data(mort)
Format
A data frame with 2058 observations on the following 6 variables.
id Personal identification number.
enter Start of duration. Measured in years since the fortieth birthday.
exit End of duration. Measured in years since the fortieth birthday.
event a logical vector indicating death at end of interval.
birthdate The birthdate in decimal form.
ses Socio-economic status, a factor with levels lower, upper
oldmort
43
Details
The interesting explanatory covariate is ses (socioeconomic status), which is a time-varying covariate. This explains why several individuals are representated by more than one record each. Left
trucation and right censoring are introduced this way.
Note
This data set is also known, and accessible, as male.mortality
Source
Data is coming from The Demographic Data Base, Umea University, Umeå, Sweden.
References
http://www.ddb.umu.se
Examples
data(mort)
coxreg(Surv(enter, exit, event) ~ ses, data = mort)
oldmort
Old age mortality, Sundsvall, Sweden, 1860-1880.
Description
The data consists of old age life histories from 1 January 1860 to 31 december 1880, 21 years. Only
(parts of) life histories above age 60 is considered.
Usage
data(oldmort)
Format
A data frame with 6508 observations from 4603 persons on the following 13 variables.
id Identification number.
enter Start age for the interval.
exit Stop age for the interval.
event Indicator of death; equals TRUE if the person died at the end of the interval, FALSE otherwise.
birthdate Birthdate as a real number (i.e., "1765-06-27" is 1765.490).
m.id Mother’s identification number.
f.id Father’s identification number.
sex Gender, a factor with levels male female
44
pch
civ Civil status, a factor with levels unmarried married widow
ses.50 Socio-economic status at age 50, a factor with levels middle unknown upper farmer lower
birthplace a factor with levels parish region remote
imr.birth Infant mortality rate at birth in the region of birth
region Subregion of Sundsvall, a factor with levels town industry rural
Details
The Sundsvall area in mid-Sweden was during the 19th century a fast growing forest industry. At
the end of the century, it was one of the largest sawmill area in Europe. The town Sundsvall is fast
growing part of the region and center for the commerse.
Source
The Demographic Data Base, Umeå University, Sweden.
References
Edvinsson, S. (2000). The Demographic Data Base at Umeå University: A resource for historical
studies. In Hall, McKaa, and Thorvaldsen (eds), "Handbook of International Historical Microdata
for Population Research", Minnesota Population Center, Minneapolis.
Examples
data(oldmort)
summary(oldmort)
## maybe str(oldmort) ; plot(oldmort) ...
pch
The Piecewise constant hazards (Pch) distribution
Description
Density, distribution function, quantile function, hazard function, cumulative hazard function, and
random generation for the pch distribution with parameters cuts and levels.
Usage
dpch(x,
ppch(q,
qpch(p,
hpch(x,
Hpch(x,
rpch(n,
cuts,
cuts,
cuts,
cuts,
cuts,
cuts,
levels,
levels,
levels,
levels,
levels,
levels)
log = FALSE)
lower.tail = TRUE, log.p = FALSE)
lower.tail = TRUE, log.p = FALSE)
log = FALSE)
log.p = FALSE)
perstat
45
Arguments
x, q
p
n
cuts, levels
log, log.p
lower.tail
vector of quantiles.
vector of probabilities.
number of observations. If length(n) > 1, the length is taken to be the number
required.
cuts devine the intervals where the hazard function is constant. The cuts must
be strictly positive and finite. levels are the interval-constant values, one more
than the cuts.
logical; if TRUE, probabilities p are given as log(p).
logical; if TRUE (default), probabilities are P (X ≤ x), otherwise, P (X > x).
Details
The Pch distribution is defined by the cuts and the levels so that the hazard function is constant on
intervals.
Value
dpch gives the density, ppch gives the distribution function, qpch gives the quantile function, hpch
gives the hazard function, Hpch gives the cumulative hazard function, and rpch generates random
deviates.
Invalid arguments will result in return value NaN, with a warning.
perstat
Period statistics
Description
Calculates occurrence / exposure rates for time periods given by period and for ages given by age.
Usage
perstat(surv, period, age = c(0, 200))
Arguments
surv
period
age
An (extended) surv object (4 columns with enter, exit, event, birthdate)
A vector of dates (in decimal form)
A vector of length 2; lowest and highest age
Value
A list with components
events
exposure
intensity
No. of events in eavh time period.
Exposure times in each period.
events / exposure
46
phfunc
Author(s)
Göran Broström
See Also
piecewise
phfunc
Loglihood function of a proportional hazards regression
Description
Calculates minus the log likelihood function and its first and second order derivatives for data from
a Weibull regression model.
Usage
phfunc(beta = NULL, lambda, p, X = NULL, Y, offset = rep(0, length(Y)),
ord = 2, pfixed = FALSE, dist = "weibull")
Arguments
beta
lambda
p
X
Y
offset
ord
pfixed
dist
Regression parameters
The scale paramater
The shape parameter
The design (covariate) matrix.
The response, a survival object.
Offset.
ord = 0 means only loglihood, 1 means score vector as well, 2 loglihood, score
and hessian.
Logical, if TRUE the shape parameter is regarded as a known constant in the
calculations, meaning that it is not cosidered in the partial derivatives.
Which distribtion? The default is "weibull", with the alternatives "loglogistic"
and "lognormal".
Details
Note that the function returns log likelihood, score vector and minus hessian, i.e. the observed
information. The model is
Value
A list with components
f
fp
fpp
The log likelihood. Present if ord >= 0
The score vector. Present if ord >= 1
The negative of the hessian. Present if ord >= 2
phreg
47
Author(s)
Göran Broström
See Also
phreg
phreg
Parametric Proportional Hazards Regression
Description
Proportional hazards model with parametric baseline hazard(s). Allows for stratification with different scale and shape in each stratum, and left truncated and right censored data.
Usage
phreg(formula = formula(data), data = parent.frame(),
na.action = getOption("na.action"), dist = "weibull", cuts = NULL,
init, shape = 0, param = c("canonical", "rate"),
control = list(eps = 1e-08, maxiter = 20, trace = FALSE),
singular.ok = TRUE, model = FALSE, x = FALSE, y = TRUE, center = TRUE)
Arguments
formula
a formula object, with the response on the left of a ~ operator, and the terms
on the right. The response must be a survival object as returned by the Surv
function.
data
a data.frame in which to interpret the variables named in the formula.
na.action
a missing-data filter function, applied to the model.frame, after any subset argument has been used. Default is options()$na.action.
dist
Which distribution? Default is "weibull", with the alternatives "ev" (Extreme
value), "gompertz", "pch" (piecewise constant hazards function), "loglogistic"
and "lognormal". A special case like the exponential can be obtained by
choosing "weibull" in combination with shape = 1, or "pch" without cuts.
cuts
Only used with dist = "pch". Specifies the points in time where the hazard
function jumps. If omitted, an exponential model is fitted.
init
vector of initial values of the iteration. Default initial value is zero for all variables.
shape
If positive, the shape parameter is fixed at that value (in each stratum). If zero or
negative, the shape parameter is estimated. If more than one stratum is present
in data, each stratum gets its own estimate.
48
phreg
param
Applies only to the Gompertz distribution: "canonical" is defined in the description of the Gompertz distribution; "rate" transforms scale to 1/log(scale),
giving the same parametrization as in Stata and SAS. The latter thus allows for
a negative rate, or a "cure" (Gompertz) model. The default is "canonical"; if this
results in extremely large scale and/or shape estimates, consider trying "rate".
control
a list with components eps (convergence criterion), maxiter (maximum number of iterations), and silent (logical, controlling amount of output). You can
change any component without mention the other(s).
singular.ok
Not used.
model
Not used.
x
Return the design matrix in the model object?
y
Return the response in the model object?
center
Logical, only affects plotting. Results are reported as is, without centering. See
Details.
Details
The parameterization is the same as in coxreg and coxph, but different from the one used by
survreg (which is not a proportional hazards modelling function). The model is
S(t; a, b, β, z) = S0 ((t/b)a )exp((z−mean(z))β)
where S0 is some standardized survivor function.
If center = TRUE (default), graphs show the "baseline" distribution at the means of (continuous)
covariates, and for the reference category in case of factors (avoiding representing "flying pigs"). If
center = FALSE the baseline distribution is at the value zero of all covariates. It is usually a good
idea to use center = FALSE in combination with "precentering" of covariates, that is, subtracting a
reference value, ideally close to the center of the covariate distribution. In that way, the "reference"
will be the same for all subsets of the data.
Value
A list of class c("phreg", "coxreg") with components
coefficients
Fitted parameter estimates.
cuts
Cut points for the "pch" distribution. NULL otherwise.
hazards
The estimated constant levels in the case of the "pch" distribution. NULL otherwise.
var
Covariance matrix of the estimates.
loglik
Vector of length two; first component is the value at the initial parameter values,
the second componet is the maximized value.
score
The score test statistic (at the initial value).
linear.predictors
The estimated linear predictors.
means
Means of the columns of the design matrix, except those columns corresponding
to a factor level, if center =
TRUE. Otherwise all zero.
phreg
49
w.means
Weighted (against exposure time) means of covariates; weighted relative frequencies of levels of factors.
n
Number of spells in indata (possibly after removal of cases with NA’s).
events
Number of events in data.
terms
Used by extractor functions.
assign
Used by extractor functions.
y
The Surv vector.
isF
Logical vector indicating the covariates that are factors.
covars
The covariates.
ttr
Total Time at Risk.
levels
List of levels of factors.
formula
The calling formula.
call
The call.
method
The method.
convergence
Did the optimization converge?
fail
Did the optimization fail? (Is NULL if not).
pfixed
TRUE if shape was fixed in the estimation.
Warning
The lognormal and loglogistic distributions are included on an experimental basis for the moment.
Use with care, results may be unreliable!
The gompertz distribution has an exponentially increasing hazard function under the canonical
parametrization. This may cause instability in the convergence of the fitting algorithm in the case
of near-exponential data. It may be resolved by using param =
"rate".
Note
The lognormal and loglogistic baseline distributions are extended to a three-parameter family by
adding a "proportionality" parameter (multiplying the baseline hazard function). The log of the
estimated parameter turns up as ’(Intercept)’ in the printed output. The reason for this extension is
that the standard lognormal and loglogistic distributions are not closed under proportional hazards.
Author(s)
Göran Broström
See Also
coxreg, check.dist, link{aftreg}.
50
phreg.fit
Examples
data(mort)
fit <- phreg(Surv(enter, exit, event) ~ ses, data = mort)
fit
plot(fit)
fit.cr <- coxreg(Surv(enter, exit, event) ~ ses, data = mort)
check.dist(fit.cr, fit)
phreg.fit
Parametric proportional hazards regression
Description
This function is called by phreg, but it can also be directly called by a user.
Usage
phreg.fit(X, Y, dist, strata, offset, init, shape, control, center = NULL)
Arguments
X
The design (covariate) matrix.
Y
A survival object, the response.
dist
Which baseline distribution?
strata
A stratum variable.
offset
Offset.
init
Initial regression parameter values.
shape
If positive, a fixed value of the shape parameter in the distribution. Otherwise,
the shape is estimated.
control
Controls convergence and output.
center
Deprecated (not used). Kept for backward copability. Results are reported as is,
no centering.
Details
See phreg for more detail.
Value
coefficients
Estimated regression coefficients plus estimated scale and shape coefficients,
sorted by strata, if present.
var
Variance-covariance matrix
loglik
Vector of length 2. The first component is the maximized loglihood with only
scale and shape in the model, the second the final maximum.
piecewise
51
score
Score test statistic at initial values
linear.predictors
Linear predictors for each interval.
means
Means of the covariates
conver
TRUE if convergence
fail
TRUE if failure
iter
Number of Newton-Raphson iterates.
n.strata
The number of strata in the data.
Author(s)
Göran Broström
See Also
phreg
piecewise
Piecewise hazards
Description
Calculate piecewise hazards, no. of events, and exposure times in each interval indicated by cutpoints.
Usage
piecewise(enter, exit, event, cutpoints)
Arguments
enter
exit
event
cutpoints
Left interval endpoint
Right interval endpoint
Indicator of event
Vector of cutpoints
Details
Exact calculation.
Value
A list with components
events
exposure
intensity
Vector of number of events
Vector of total exposure time
Vector of hazards, intensity == events / exposure
52
plot.aftreg
Author(s)
Göran Broström
See Also
perstat
plot.aftreg
Plots output from an AFT regression
Description
Just a simple plot of the hazard (cumulative hazard, density, survival) functions for each stratum.
Usage
## S3 method for class 'aftreg'
plot(x, fn = c("haz", "cum", "den", "sur"), main = NULL,
xlim = NULL, ylim = NULL, xlab = "Duration", ylab = "", col, lty,
printLegend = TRUE, new.data = x$means, ...)
Arguments
x
A aftreg object
fn
Which functions shoud be plotted! Default is all. They will scroll by, so
you have to take care explicitely what you want to be produced. See, eg,
par(mfrow = ...)
main
Header for the plot
xlim
x limits
ylim
y limits
xlab
x label
ylab
y label
col
Colors?
lty
Line types?
printLegend
Should legend be printed? Default is yes.
new.data
At which covariate values?
...
Extra parameters passed to ’plot’
Details
The plot is drawn at the mean values of the covariates, by default.
Value
No return value.
plot.coxreg
53
Author(s)
Göran Broström
See Also
aftreg
Examples
y <- rllogis(40, shape = 1, scale = 1)
x <- rep(c(1,1,2,2), 10)
fit <- aftreg(Surv(y, rep(1, 40)) ~ x, dist = "loglogistic")
plot(fit)
plot.coxreg
Plot method for coxreg objects
Description
A plot of a baseline function of a coxreg fit is produced, one curve for each stratum. This function
is a wrapper for survfit in combination with plot.survfit.
Usage
## S3 method for class 'coxreg'
plot(x, fn = c("cum", "surv", "log", "loglog"), fig = TRUE,
xlim = NULL, ylim = NULL, main = NULL, xlab = "Duration", ylab = "",
col, lty, printLegend = TRUE, newdata = NULL, ...)
Arguments
x
A coxreg object
fn
What should be plotted? Default is "cumhaz", and the other choices are "surv",
"log", and "loglog".
fig
logical. If TRUE the plot is actually drawn, otherwise the coordinates of the
curve(s).
xlim
Start and end of the x axis.
ylim
Start and end of the y axis.
main
A headline for the plot
xlab
Label on the x axis.
ylab
Label on the y axis.
col
Color of the curves. Defaults to ’black’.
lty
Line type(s).
54
plot.hazdata
printLegend
Either a logical or a text string; if TRUE, a legend is printed at a default place,
if FALSE, no legend is printed. Otherwise, if a text string, it should be one of
"bottomleft", "bottomright", "topleft", etc., see legend for all possibe choices.
newdata
Not used
...
Other parameters to pass to plot.survfit
Value
An object of class hazdata containing the coordinates of one or more
plot.hazdata
Plots of survivor functions.
Description
Baseline hazards estimates.
Usage
## S3 method for class 'hazdata'
plot(x, strata = NULL,
fn = c("cum", "surv", "log", "loglog"), fig = TRUE,
xlim=NULL, ylim=NULL, main=NULL, xlab=NULL, ylab=NULL, col = "black",
lty = 1, printLegend = TRUE, where = NULL, ...)
Arguments
x
A hazdata object, typically the ’hazards’ element in the output from link{coxreg}.
strata
Stratum names if there are strata present.
fn
Which type of plot?
fig
Should a plot actually be produced? Default is TRUE.
xlim
Horizontal plot limits. If NULL, calculated by the function.
ylim
Vertical plot limits. If NULL, set to c(0, 1)
main
A heading for the plot.
xlab
Label on the x axis.
ylab
Label on the y-axis.
col
Color of the lines. May be a vector of length equal to No. of strata.
lty
Line type(s). May be a vector of length equal to No. of strata.
printLegend
Logical; should a legend be produced? Defaults to TRUE.
where
Where should the legend be placed (if(printLegend))? If NULL, "bottomleft" for
fn = "surv", otherwise "bottomright".
...
Anything that plot.default likes...
plot.phreg
55
Details
It is also possible to have as first argument an object of type "coxreg", given that it contains a
component of type "hazdata".
Value
A list where the elements are two-column matrices, one for each stratum in the model. The first
column contains risktimes, and the second the y coordinates for the requested curve(s).
Author(s)
Göran Broström
Examples
time0 <- numeric(50)
group <- c(rep(0, 25), rep(1, 25))
time1 <- rexp( 50, exp(group) )
event <- rep(1, 50)
fit <- coxreg(Surv(time0, time1, event) ~ strata(group))
plot(fit$hazards)
plot.phreg
Plots output from a Weibull regression
Description
Just a simple plot of the hazard functions for each stratum.
Usage
## S3 method for class 'phreg'
plot(x, fn = c("haz", "cum", "den", "sur"), main = NULL,
xlim = NULL, ylim = NULL, xlab = "Duration", ylab = "", col, lty,
printLegend = TRUE, new.data = NULL, ...)
Arguments
x
A phreg object
fn
Which functions shoud be plotted! Default is all. They will scroll by, so
you have to take care explicitely what you want to be produced. See, eg,
par(mfrow = ...)
main
Header for the plot
xlim
x limits
ylim
y limits
xlab
x label
56
plot.Surv
ylab
y label
col
Color(s) for the curves. Defaults to black.
lty
Line type for the curve(s). Defaults to 1:(No. of strata).
printLegend
Logical; if TRUE, a legend is added to the plot if the number of strata is two or
more.
new.data
Now deprecated; reference hazard is given by the fit; either zero or the means
all covariates, and (always) the reference category for factors.
...
Extra parameters passed to ’plot’
Value
No return value.
Author(s)
Göran Broström
See Also
phreg
Examples
y <- rllogis(40, shape = 1, scale = 1)
x <- rep(c(1,1,2,2), 10)
fit <- phreg(Surv(y, rep(1, 40)) ~ x, dist = "loglogistic")
plot(fit)
plot.Surv
Plots of survivor functions.
Description
Kaplan-Meier estimates. If only one curve, confidence limits according to Greenwood’s formula
are drawn.
Usage
## S3 method for class 'Surv'
plot(x, strata=NULL, fn = c("cum", "surv", "log", "loglog"),
limits=TRUE, conf=0.95, main=NULL, xlab=NULL, ylab=NULL,
xlim=NULL, ylim=NULL, lty = NULL, col = NULL,
lty.con=NULL, col.con = NULL, x.axis = TRUE, printLegend, ...)
plot.Surv
57
Arguments
x
A Surv object.
strata
Defines a partition of the data. One survivor function for each level of strata
is drawn.
fn
Which type of plot?
limits
If TRUE, and if the number of curves is one, confidence limits are drawn.
conf
The confidence level for the confidence limits.
main
A heading for the plot.
xlab
Label on the x axis.
ylab
Label on the y-axis.
xlim
Horizontal plot limits. If NULL, calculated by the function.
ylim
Vertical plot limits. If NULL, set to c(0, 1)
lty
Line type of curves.
col
Color of curves.
lty.con
Line type of confidence bands.
col.con
Color of confidence bands.
x.axis
Should abline(h=0) be drawn?
printLegend
Logical, defaults to TRUE. If FALSE, no legend is printed, but can be added after
plotting. To be used if the default place for the legend fits badly.
...
Anything that plot likes...
Details
Left truncation is allowed. Note, though, that this fact may result in strange estimated curves due to
lack of data in certain (low) ages.
Value
No value is returned.
Author(s)
Göran Broström
Examples
time0 <- numeric(50)
group <- c(rep(0, 25), rep(1, 25))
time1 <- rexp( 50, exp(group) )
event <- rep(1, 50)
plot.Surv(Surv(time0, time1, event), strata = group)
58
plot.weibreg
plot.weibreg
Plots output from a Weibull regression
Description
Just a simple plot of the hazard functions for each stratum.
Usage
## S3 method for class 'weibreg'
plot(x, fn = c("haz", "cum", "den", "sur"), main = NULL,
xlim = NULL, ylim = NULL, xlab = NULL, ylab = NULL,
new.data = x$means, ...)
Arguments
x
A weibreg object
fn
Which functions shoud be plotted! Default is all. They will scroll by, so
you have to take care explicitely what you want to be produced. See, eg,
par(mfrow = ...)
main
Header for the plot
xlim
x limits
ylim
y limits
xlab
x label
ylab
y label
new.data
At which covariate values?
...
Extra parameters passed to ’plot’
Details
The plot is drawn at the mean values of the covariates.
Value
No return value
Author(s)
Göran Broström
See Also
weibreg
print.aftreg
59
Examples
y <- rweibull(4, shape = 1, scale = 1)
x <- c(1,1,2,2)
fit <- weibreg(Surv(y, c(1,1,1,1)) ~ x)
plot(fit)
print.aftreg
Prints aftreg objects
Description
The hazard, the cumulative hazard, the density, and the survivor baseline functions are plotted.
Usage
## S3 method for class 'aftreg'
print(x, digits = max(options()$digits - 4, 3), ...)
Arguments
x
A aftreg object
digits
Precision in printing
...
Not used.
Value
No value is returned.
Note
Doesn’t work for threeway or higher order interactions. Use print.coxph in that case.
Author(s)
Göran Broström
See Also
phreg, print.coxph
60
print.glmmboot
print.coxreg
Prints coxreg objects
Description
More "pretty-printing" than print.coxph, which is a fall-back for ’difficult’ objects.
Usage
## S3 method for class 'coxreg'
print(x, digits = max(options()$digits - 4, 3), ...)
Arguments
x
A coxreg object, typically the result of running coxreg
digits
Output format.
...
Other arguments.
Details
Doesn’t work with three-way and higher interactions, in which case print.coxph is used. Prints
also output from mlreg.
Value
No value is returned.
Author(s)
Göran Broström
See Also
coxreg, print.coxph
print.glmmboot
Prints a ’glmmML’ object.
Description
A glmmboot object is the output of glmmboot.
Usage
## S3 method for class 'glmmboot'
print(x, digits = max(3, getOption("digits") - 3), na.print = "", ...)
print.glmmML
61
Arguments
x
The glmmboot object
digits
Number of printed digits.
na.print
How to print NAs
...
Additional parameters, which are ignored.
Details
Nothing in particular.
Value
A short summary of the object is printed.
Note
This is the only summary method available for the moment.
Author(s)
Göran Broström
See Also
glmmboot
print.glmmML
Prints a ’glmmML’ object.
Description
A glmmML object is the output of glmmML.
Usage
## S3 method for class 'glmmML'
print(x, digits = max(3, getOption("digits") - 3), na.print = "", ...)
Arguments
x
The glmmML object
digits
Number of printed digits.
na.print
How to print NAs
...
Additional parameters, which are ignored.
62
print.phreg
Details
Nothing in particular.
Value
A short summary of the object is printed.
Note
This is the only summary method available for the moment.
Author(s)
Göran Broström
See Also
glmmML
print.phreg
Prints phreg objects
Description
The hazard, the cumulative hazard, the density, and the survivor baseline functions are plotted.
Usage
## S3 method for class 'phreg'
print(x, digits = max(options()$digits - 4, 3), ...)
Arguments
x
A phreg object
digits
Precision in printing
...
Not used.
Value
No value is returned.
Note
Doesn’t work for threeway or higher order interactions. Use print.coxph in that case.
Author(s)
Göran Broström
print.weibreg
63
See Also
phreg, print.coxph
print.weibreg
Prints weibreg objects
Description
The hazard, the cumulative hazard, the density, and the survivor baseline functions are plotted.
Usage
## S3 method for class 'weibreg'
print(x, digits = max(options()$digits - 4, 3), ...)
Arguments
x
A weibreg object
digits
Precision in printing
...
Not used.
Value
No value is returned.
Note
Doesn’t work for threeway or higher order interactions. Use print.coxph in that case.
Author(s)
Göran Broström
See Also
weibreg, print.coxph
64
risksets
risksets
Finds the compositions and sizes of risk sets
Description
Focus is on the risk set composition just prior to a failure.
Usage
risksets(x, strata, max.survs, members = TRUE)
Arguments
x
A Surv object.
strata
Stratum indicator.
max.survs
Maximum number of survivors in each risk set. If smaller than the ’natural
number’, survivors are sampled from the present ones.
members
If TRUE, all members of all risk sets are listed in the resulting list, see below.
Details
If the input argument max.survs is left alone, all survivors are accounted for in all risk sets.
Value
A list with components
antrs
No. of risk sets in each stratum. The number of strata is given by length(antrs).
risktimes
Ordered distinct failure time points.
eventset
If ’members’ is TRUE, a vector of pointers to events in each risk set, else NULL.
riskset
If ’members’ is TRUE, a vector of pointers to the members of the risk sets, in
order. The ’n.events’ first are the events. If ’members’ is FALSE, ’riskset’ is
NULL.
size
The sizes of the risk sets.
n.events
The number of events in each risk set.
Note
can be used to "sample the risk sets".
Author(s)
Göran Broström
scania
65
See Also
table.events, coxreg.
Examples
enter <- c(0, 1, 0, 0)
exit <- c(1, 2, 3, 4)
event <- c(1, 1, 1, 0)
risksets(Surv(enter, exit, event))
scania
Old age mortality, Scania, southern Sweden, 1813-1894.
Description
The data consists of old age life histories from 1 January 1813 to 31 december 1894. Only (parts
of) life histories above age 50 is considered.
Usage
data(scania)
Format
A data frame with 1931 observations from 1931 persons on the following 9 variables.
id Identification number (enumeration).
enter Start age for the interval.
exit Stop age for the interval.
event Indicator of death; equals TRUE if the person died at the end of the interval, FALSE otherwise.
birthdate Birthdate as a real number (i.e., "1765-06-27" is 1765.490).
sex Gender, a factor with levels male female.
parish One of five parishes in Scania, coded 1, 2, 3, 4, 5. Factor.
ses Socio-economic status at age 50, a factor with levels upper and lower.
immigrant a factor with levels no region and yes.
Details
The Scanian area in southern Sweden was during the 19th century a mainly rural area.
Source
The Scanian Economic Demographic Database, Lund University, Sweden.
66
summary.aftreg
References
http://www.ed.lu.se/EN/databases/sdd.asp
Examples
data(scania)
summary(scania)
summary.aftreg
Prints aftreg objects
Description
This is the same as print.aftreg
Usage
## S3 method for class 'aftreg'
summary(object, ...)
Arguments
object
A aftreg object
...
Additional ...
Author(s)
Göran Broström
See Also
print.coxreg
Examples
## The function is currently defined as
function (object, ...)
print(object)
summary.coxreg
summary.coxreg
67
Prints coxreg objects
Description
This is the same as print.coxreg
Usage
## S3 method for class 'coxreg'
summary(object, ...)
Arguments
object
A coxreg object
...
Additional ...
Author(s)
Göran Broström
See Also
print.coxreg
Examples
## The function is currently defined as
function (object, ...)
print(object)
summary.glmmboot
Summary of a glmmboot object
Description
It simply calls print.glmmboot
Usage
## S3 method for class 'glmmboot'
summary(object, ...)
Arguments
object
A glmmboot object
...
Additional arguments
68
summary.glmmML
Details
A summary method will be written soon.
Value
Nothing is returned.
Note
Preliminary
Author(s)
Göran Broström
See Also
print.glmmboot
summary.glmmML
Summary of a glmmML object
Description
It simply calls print.glmmML
Usage
## S3 method for class 'glmmML'
summary(object, ...)
Arguments
object
A glmmML object
...
Additional arguments
Value
Nothing is returned.
Note
Preliminary
Author(s)
Göran Broström
summary.phreg
69
See Also
print.glmmML
summary.phreg
Prints phreg objects
Description
This is the same as print.phreg
Usage
## S3 method for class 'phreg'
summary(object, ...)
Arguments
object
A phreg object
...
Additional ...
Author(s)
Göran Broström
See Also
print.coxreg
Examples
## The function is currently defined as
function (object, ...)
print(object)
70
SurvSplit
summary.weibreg
Prints a weibreg object
Description
This is the same as print.weibreg
Usage
## S3 method for class 'weibreg'
summary(object, ...)
Arguments
object
A weibreg object
...
Additional ...
Author(s)
Göran Broström
See Also
print.weibreg
Examples
## The function is currently defined as
function (object, ...)
print(object)
SurvSplit
Split a survival object at specified durations.
Description
Given a survival object, (a matrix with two or three columns) and a set of specified cut times, split
each record into multiple subrecords at each cut time. The new survival object will be in ‘counting
process’ format, with an enter time, exit time, and event status for each record.
Usage
SurvSplit(Y, cuts)
SurvSplit
71
Arguments
Y
A survival object, a matrix with two or three columns.
cuts
The cut points, must be strictly positive and distinct.
Value
A list with components
Y
The new survival object with three columns, i.e., in ’counting process’ form.
ivl
Interval No., starting from leftmost, (0, cuts[1]) or similar.
idx
Row number for original Y row.
Note
This function is used in phreg for the piecewise constant hazards model. It uses age.window for
each interval.
Author(s)
Göran Broström
See Also
survSplit, age.window.
Examples
##---- Should be DIRECTLY executable !! ---##-- ==> Define data, use random,
##--or do help(data=index) for the standard data sets.
## The function is currently defined as
function(Y, cuts){
if (NCOL(Y) == 2) Y <- cbind(rep(0, NROW(Y)), Y)
indat <- cbind(Y, 1:NROW(Y), rep(-1, NROW(Y)))
colnames(indat) <- c("enter", "exit", "event", "idx", "ivl")
n <- length(cuts)
cuts <- sort(cuts)
if ((cuts[1] <= 0) || (cuts[n] == Inf))
stop("'cuts' must be positive and finite.")
cuts <- c(0, cuts, Inf)
n <- n + 1
out <- list()
indat <- as.data.frame(indat)
for (i in 1:n){
out[[i]] <- age.window(indat, cuts[i:(i+1)])
out[[i]]$ivl <- i
out[[i]] <- t(out[[i]])
}
Y <- matrix(unlist(out), ncol = 5, byrow = TRUE)
72
swe07
}
colnames(Y) <- colnames(indat)
list(Y = Y[, 1:3],
ivl = Y[, 5],
idx = Y[, 4]
)
swe07
Swedish population and deaths in ages 61–80, 2007.
Description
The Swedish population and No. of deaths by age and sex in the ages 61–80. Data from the year
2007.
Usage
data(swe07)
Format
A data frame with 80 rows and five variables.
pop Average population size during the year 2007 by age and sex.
deaths Number of deaths by age and sex during the year 2007.
sex Sex.
age Age.
log.pop The logarithm of the first variable, pop. Included for convenience, may be used as an
offset in a Poisson regression.
Details
The average population is calculated as the mean of the population 1 January 2007 and 1 January
2008.
Source
Data is taken from Statistics Sweden.
References
http://www.scb.se
Examples
data(swe07)
fit <- glm(deaths ~ offset(log.pop) + sex * as.factor(age), family = poisson, data = swe07)
drop1(fit, test = "Chisq") ## Proportional hazards?
table.events
73
table.events
Calculating failure times, risk set sizes and No. of events in each risk
set
Description
From input data of the ’interval’ type, with an event indicator, summary statistics for each risk set
(at an event time point) are calculated.
Usage
table.events(enter=rep(0, length(exit)), exit, event, strict=TRUE )
Arguments
enter
Left truncation time point.
exit
End time point, an event or a right censoring.
event
Event indicator.
strict
If TRUE, then tabulating is not done after a time point where all individuals in
a riskset failed.
Value
A list with components
times
Ordered distinct event time points.
events
Number of events at each event time point.
riskset.sizes
Number at risk at each event time point.
Author(s)
Göran Broström
See Also
risksets
Examples
exit = c(1,2,3,4,5)
event = c(1,1,0,1,1)
table.events(exit = exit, event = event)
74
toBinary
toBinary
Transforms a "survival" data frame into a data frame suitable for binary (logistic) regression
Description
The result of the transformation can be used to do survival analysis via logistic regression. If the
cloglog link is used, this corresponds to a discrete time analogue to Cox’s proportional hazards
model.
Usage
toBinary(dat, surv = c("enter", "exit", "event"),
strats, max.survs = NROW(dat))
Arguments
dat
A data frame with three variables representing the survival response. The default
is that they are named enter, exit, and event
surv
A character string with the names of the three variables representing survival.
strats
An eventual stratification variable.
max.survs
Maximal numger of survivors per risk set. If set to a (small) number, survivors
are sampled from the risk sets.
Details
toBinary calls risksets in the eha package.
Value
Returns a data frame expanded risk set by risk set. The three "survival variables" are replaced by a
variable named event (which overwrites an eventual variable by that name in the input). Two more
variables are created, riskset and orig.row.
event
Indicates an event in the corresponding risk set.
riskset
Factor (with levels 1, 2, . . . ) indicating risk set.
risktime
The ’risktime’ (age) in the corresponding riskset.
orig.row
The row number for this item in the original data frame.
Note
The survival variables must be three. If you only have exit and event, create a third containing all
zeros.
Author(s)
Göran Broström
toDate
75
References
~put references to the literature/web site here ~
See Also
coxreg, glm.
Examples
enter <- rep(0, 4)
exit <- 1:4
event <- rep(1, 4)
z <- rep(c(-1, 1), 2)
dat <- data.frame(enter, exit, event, z)
binDat <- toBinary(dat)
dat
binDat
coxreg(Surv(enter, exit, event) ~ z, method = "ml", data = dat)
## Same as:
summary(glm(event ~ z + riskset, data = binDat, family = binomial(link = cloglog)))
toDate
Convert time in years since "0000-01-01" to a date.
Description
This function uses as.Date and a simple linear transformation.
Usage
toDate(times)
Arguments
times
a vector of durations
Value
A vector of dates as character strings of the type "1897-05-21".
Author(s)
Göran Broström
See Also
toTime
76
toTime
Examples
##---- Should be DIRECTLY executable !! ---##-- ==> Define data, use random,
##--or do help(data=index) for the standard data sets.
toDate(1897.357)
toTime
Calculate duration in years from "0000-01-01" to a given date
Description
Given a vector of dates, the output is a vector of durations in years since "0000-01-01".
Usage
toTime(dates)
Arguments
dates
A vector of dates in character form or of class Date
Value
A vector of durations, as decribed above.
Author(s)
Göran Broström
See Also
toDate
Examples
##---- Should be DIRECTLY executable !! ---##-- ==> Define data, use random,
##--or do help(data=index) for the standard data sets.
## The function is currently defined as
toTime(c("1897-05-16", "1901-11-21"))
weibreg
weibreg
77
Weibull Regression
Description
Proportional hazards model with baseline hazard(s) from the Weibull family of distributions. Allows for stratification with different scale and shape in each stratum, and left truncated and right
censored data.
Usage
weibreg(formula = formula(data), data = parent.frame(),
na.action = getOption("na.action"), init, shape = 0,
control = list(eps = 1e-04, maxiter = 10, trace = FALSE),
singular.ok = TRUE, model = FALSE, x = FALSE, y = TRUE, center = TRUE)
Arguments
formula
a formula object, with the response on the left of a ~ operator, and the terms
on the right. The response must be a survival object as returned by the Surv
function.
data
a data.frame in which to interpret the variables named in the formula.
na.action
a missing-data filter function, applied to the model.frame, after any subset argument has been used. Default is options()$na.action.
init
vector of initial values of the iteration. Default initial value is zero for all variables.
shape
If positive, the shape parameter is fixed at that value (in each stratum). If zero or
negative, the shape parameter is estimated. If more than one stratum is present
in data, each stratum gets its own estimate.
control
a list with components eps (convergence criterion), maxiter (maximum number of iterations), and silent (logical, controlling amount of output). You can
change any component without mention the other(s).
singular.ok
Not used.
model
Not used.
x
Return the design matrix in the model object?
y
Return the response in the model object?
center
Deprecated, and not used. Will be removed in the future.
Details
The parameterization is the same as in coxreg and coxph, but different from the one used by
survreg. The model is
h(t; a, b, β, z) = (a/b)(t/b)a−1 exp(zβ)
78
weibreg
This is in correspondence with Weibull. To compare regression coefficients with those from
survreg you need to divide by estimated shape (ˆ
a) and change sign. The p-values and test statistics
are however the same, with one exception; the score test is done at maximized scale and shape in
weibreg.
This model is a Weibull distribution with shape parameter a and scale parameter b exp(−zβ/a)
Value
A list of class c("weibreg", "coxreg") with components
coefficients
Fitted parameter estimates.
var
Covariance matrix of the estimates.
loglik
Vector of length two; first component is the value at the initial parameter values,
the second componet is the maximized value.
score
The score test statistic (at the initial value).
linear.predictors
The estimated linear predictors.
means
Means of the columns of the design matrix.
w.means
Weighted (against exposure time) means of covariates; weighted relative frequencies of levels of factors.
n
Number of spells in indata (possibly after removal of cases with NA’s).
events
Number of events in data.
terms
Used by extractor functions.
assign
Used by extractor functions.
y
The Surv vector.
isF
Logical vector indicating the covariates that are factors.
covars
The covariates.
ttr
Total Time at Risk.
levels
List of levels of factors.
formula
The calling formula.
call
The call.
method
The method.
convergence
Did the optimization converge?
fail
Did the optimization fail? (Is NULL if not).
pfixed
TRUE if shape was fixed in the estimation.
Warning
The print method print.weibreg doesn’t work if threeway or higher order interactions are present.
Use print.coxph in that case.
Note further that covariates are internally centered, if center =
TRUE, by this function, and this
is not corrected for in the output. This affects the estimate of log(scale), but nothing else. If you
don’t like this, set center = FALSE.
weibreg.fit
79
Author(s)
Göran Broström
See Also
coxreg, mlreg, print.weibreg
Examples
dat <- data.frame(time = c(4, 3, 1, 1, 2, 2, 3),
status = c(1, 1, 1, 0, 1, 1, 0),
x = c(0, 2, 1, 1, 1, 0, 0),
sex = c(0, 0, 0, 0, 1, 1, 1))
weibreg( Surv(time, status) ~ x + strata(sex), data = dat) #stratified model
weibreg.fit
Weibull regression
Description
This function is called by weibreg, but it can also be directly called by a user.
Usage
weibreg.fit(X, Y, strata, offset, init, shape, control, center = TRUE)
Arguments
X
The design (covariate) matrix.
Y
A survival object, the response.
strata
A stratum variable.
offset
Offset.
init
Initial regression parameter values.
shape
If positive, a fixed value of the shape parameter in the Weibull distribution. Otherwise, the shape is estimated.
control
Controls convergence and output.
center
Should covariates be centered?
Details
See weibreg for more detail.
80
wfunk
Value
coefficients
Estimated regression coefficients plus estimated scale and shape coefficients,
sorted by strata, if present.
var
loglik
Vector of length 2. The first component is the maximized loglihood with only
scale and shape in the model, the second the final maximum.
score
Score test statistic at initial values
linear.predictors
Linear predictors for each interval.
means
Means of the covariates
conver
TRUE if convergence
fail
TRUE if failure
iter
Number of Newton-Raphson iterates.
n.strata
The number of strata in the data.
Author(s)
Göran Broström
See Also
weibreg
wfunk
Loglihood function of a Weibull regression
Description
Calculates minus the log likelihood function and its first and second order derivatives for data from
a Weibull regression model. Is called by weibreg.
Usage
wfunk(beta = NULL, lambda, p, X = NULL, Y, offset = rep(0, length(Y)),
ord = 2, pfixed = FALSE)
Arguments
beta
Regression parameters
lambda
The scale paramater
p
The shape parameter
X
The design (covariate) matrix.
Y
The response, a survival object.
wfunk
81
offset
Offset.
ord
ord = 0 means only loglihood, 1 means score vector as well, 2 loglihood, score
and hessian.
pfixed
Logical, if TRUE the shape parameter is regarded as a known constant in the
calculations, meaning that it is not cosidered in the partial derivatives.
Details
Note that the function returns log likelihood, score vector and minus hessian, i.e. the observed
information. The model is
h(t; p, λ, β, z) = p/λ(t/λ)(p−1) exp (−(t/λ)p ) exp(zβ)
This is in correspondence with dweibull.
Value
A list with components
f
The log likelihood. Present if ord >= 0
fp
The score vector. Present if ord >= 1
fpp
The negative of the hessian. Present if ord >= 2
Author(s)
Göran Broström
See Also
weibreg
Index
ltx, 35
∗Topic print
print.glmmboot, 60
print.glmmML, 61
summary.aftreg, 66
summary.coxreg, 67
summary.glmmboot, 67
summary.glmmML, 68
summary.phreg, 69
summary.weibreg, 70
∗Topic regression
aftreg, 3
aftreg.fit, 5
coxreg, 11
coxreg.fit, 14
glmmboot, 21
glmmbootFit, 23
glmmML, 24
glmmML.fit, 27
mlreg, 39
phreg, 47
phreg.fit, 50
print.aftreg, 59
print.phreg, 62
print.weibreg, 63
weibreg, 77
weibreg.fit, 79
∗Topic survival
aftreg, 3
aftreg.fit, 5
age.window, 7
cal.window, 8
check.surv, 10
coxreg, 11
coxreg.fit, 14
geome.fit, 19
hweibull, 29
join.spells, 31
make.communal, 36
∗Topic cluster
toBinary, 74
∗Topic datasets
fert, 18
infants, 30
logrye, 34
male.mortality, 38
mort, 42
oldmort, 43
scania, 65
swe07, 72
∗Topic distribution
check.dist, 9
EV, 17
Gompertz, 28
Loglogistic, 32
Lognormal, 33
Makeham, 37
pch, 44
phfunc, 46
wfunk, 80
∗Topic dplot
plot.aftreg, 52
plot.phreg, 55
plot.weibreg, 58
∗Topic manip
check.surv, 10
cro, 16
join.spells, 31
SurvSplit, 70
∗Topic math
ghq, 20
∗Topic nonlinear
glmmboot, 21
glmmbootFit, 23
∗Topic nonparametric
perstat, 45
piecewise, 51
∗Topic printing
82
INDEX
mlreg, 39
perstat, 45
phfunc, 46
phreg, 47
phreg.fit, 50
piecewise, 51
plot.aftreg, 52
plot.hazdata, 54
plot.phreg, 55
plot.Surv, 56
plot.weibreg, 58
print.aftreg, 59
print.coxreg, 60
print.phreg, 62
print.weibreg, 63
risksets, 64
summary.aftreg, 66
summary.coxreg, 67
summary.phreg, 69
summary.weibreg, 70
table.events, 73
toBinary, 74
toDate, 75
toTime, 76
weibreg, 77
weibreg.fit, 79
wfunk, 80
aftreg, 3, 5–8, 10, 32–35, 37, 53
aftreg.fit, 5
age.window, 7, 8, 71
cal.window, 7, 8, 37
check.dist, 9, 49
check.surv, 10, 32
coxph, 12, 13, 37, 48, 77
coxreg, 5, 7–10, 11, 14, 15, 19, 20, 32, 35–37,
40–42, 48, 49, 60, 65, 75, 77, 79
coxreg.fit, 14
cro, 16
dEV (EV), 17
dgompertz (Gompertz), 28
dllogis (Loglogistic), 32
dmakeham (Makeham), 37
dpch (pch), 44
dweibull, 30, 81
EV, 17
83
fert, 18
geome.fit, 19
ghq, 20
glm, 21, 26, 75
glm.control, 21, 23, 25, 27
glmmboot, 21, 24, 26, 61
glmmbootFit, 23
glmmML, 20, 24, 28, 62
glmmML.fit, 27
Gompertz, 28, 48
HEV (EV), 17
hEV (EV), 17
Hgompertz (Gompertz), 28
hgompertz (Gompertz), 28
Hllogis (Loglogistic), 32
hllogis (Loglogistic), 32
Hlnorm (Lognormal), 33
hlnorm (Lognormal), 33
Hmakeham (Makeham), 37
hmakeham (Makeham), 37
Hpch (pch), 44
hpch (pch), 44
Hweibull (hweibull), 29
hweibull, 29
infants, 30
join.spells, 10, 31
legend, 54
Llogis (Loglogistic), 32
Lnorm (Lognormal), 33
Loglogistic, 32
Lognormal, 33, 34
logrye, 34
ltx, 35
make.communal, 36
Makeham, 37
male.mortality, 38
match, 17
mlreg, 39, 60, 79
mort, 42
oldmort, 43
optim, 22, 26
paste, 17
84
pch, 44
perstat, 45, 52
pEV (EV), 17
pgompertz (Gompertz), 28
phfunc, 46
phreg, 5, 9, 33–35, 47, 47, 50, 51, 56, 59, 63,
71
phreg.fit, 50
piecewise, 46, 51
pllogis (Loglogistic), 32
plot.aftreg, 52
plot.coxreg, 53
plot.default, 54
plot.hazdata, 54
plot.phreg, 55
plot.Surv, 56
plot.survfit, 53
plot.weibreg, 58
pmakeham (Makeham), 37
ppch (pch), 44
print.aftreg, 59, 66
print.coxph, 59, 60, 62, 63, 78
print.coxreg, 60, 66, 67, 69
print.glmmboot, 60, 68
print.glmmML, 61, 69
print.phreg, 62, 69
print.weibreg, 63, 70, 78, 79
pweibull, 30
qEV (EV), 17
qgompertz (Gompertz), 28
qllogis (Loglogistic), 32
qmakeham (Makeham), 37
qpch (pch), 44
rEV (EV), 17
rgompertz (Gompertz), 28
risksets, 13, 15, 41, 42, 64, 73
rllogis (Loglogistic), 32
rmakeham (Makeham), 37
rpch (pch), 44
scania, 65
summary.aftreg, 66
summary.coxreg, 67
summary.glmmboot, 67
summary.glmmML, 68
summary.phreg, 69
summary.weibreg, 70
INDEX
survfit, 53
survreg, 4, 48, 77
SurvSplit, 70
survSplit, 71
swe07, 72
table.events, 65, 73
toBinary, 74
toDate, 75, 76
toTime, 75, 76
weibreg, 58, 63, 77, 79–81
weibreg.fit, 79
Weibull, 78
wfunk, 80
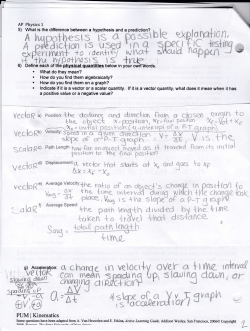
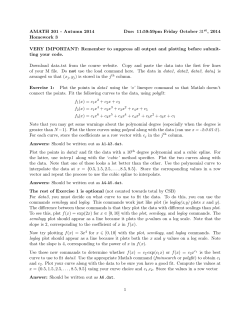


© Copyright 2026