
File
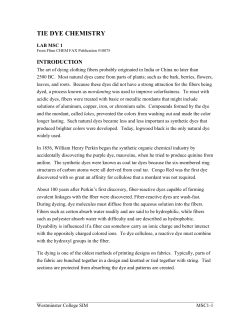
Measurement of multiple biomarkers using a novel fluorescence immunohistochemistry multiplexing technique Sean Dinn, Sudeshna Adak, Musodiq Bello, Anriban Bhaduri, Ali Can, Robert Filkins, Michael Gerdes, Fiona Ginty, Qing Li, Zhengyu Pang, Christopher Sevinsky, Anup Sood, Maximilian Seel and Jun Xie Molecular Imaging and Diagnostics Advanced Technology Program, General Electric Global Research Center, Niskayuna, NY Technology Summary Standard Approach Dye Cycling Stain A B C C Y B Y Stain Inactivate dye Digital Image-2 Inactivate dye Y A Digital Image-1 Y Stain Standard detection of biomarkers in IHC involves incubating tissue with an unlabeled primary antibody followed by visualization with a labeled secondary antibody (i.e. horseradish peroxidase+DAB (“brown stain”), fluorescent dye) The ability to measure multiple biomarkers in a single tissue section is limited by the number of available species that can be used without having problems with cross-reactivity The use of fluorescently labeled secondary antibodies is limited by the number of resolvable color channels Our technology overcomes these shortcomings by the use of a combination of fluorescently labeled primary antibodies and a dye cycling strategy Tissue is stained with a directly conjugated antibody, then the dye signal is inactivated and the tissue is ready for probing with another antibody This procedure can be repeated many times and combined with the use of several resolvable dyes per round creates a powerful multiplexing technique Y Semi-quantitative detection and repeated tissue sampling for multiple markers limit current diagnostics that use chromogenic immunohistochemistry. We have developed a fluorescence multiplexing process for single sections to be analyzed repeatedly for molecular markers. Multiplexing was achieved by staining and imaging of 2 markers, followed by fluorescence inactivation. These channels can be reused for additional rounds of staining and imaging, repeatable to a minimum of 10 cycles without loss of tissue morphology or antigenicity. Combining tissue markers with cell and molecular markers allows localization and quantification of diagnostic markers in defined tissue structures (epithelium, stroma, nuclei, membranes, cytoplasm, blood vessels, etc.). This technique is applicable to multiple applications including biomarker discovery, proof-of-concept evaluation, patient therapy selection and toxicological profiling. Multiplexing greater then 10 channels on a single tissue represents a major step toward understanding complex biological pathways in tissue. Digital Image-3… etc Inactivate dye Y Y Y Use a single dye over and over. Co-register and pseudocolor. Limited by “resolvable” color channels- 3-4. Her2/neu breast carcinoma H&E b-Catenin P53 a-actin Pan cytokeratin DAPI Overlay Overlay with H&E P53 breast carcinoma Progesterone Receptor Androgen Receptor Estrogen Receptor Her2 Monochromatic single channel images are then pseudo-colored and registered Integrated Integrated Multidisciplinary Workflow Multiplexing Method Image Acquisition Fluidics System Compendium Validated Antibodies Antibody Work-up Primary Secondary Signal/Background = 4.1 Direct Conjugate (7.6 D/ P) Signal/Background = 4.2 AR Effect of Dye Inactivation on Markers 120 ER p53 100 Image Analysis Overview Compartmental Images Clinical Hypothesis Comparable staining achieved with Cy3 anti-p53 direct conjugate Pixel Intensity Abstract 0x 80 No inactivation 10x inactivation 60 40 10x 20 0 AR ER p53 Multiplexing Results on Breast Cancer Tissue Target Images Background Detector Optimization Image Pre-processing Cy3 Androgen Receptor Multiplexing Cy3 Inactivation Cy3 pan cadherin Reproducibility Segmentation 1°2° 1° Specificity Dapi Image Analysis Algorithms Software Solutions for Tissue Microarray Analysis Cy3 Androgen Receptor Cy5 Her2 Cy3 Pan Cadherin Cytoplasm Detector Autofluoresence removal Image Analysis Epithelial Nuclei Detector 0.05 Registration Biomarker Discovery Tools Disease Prognosis Prediction 0.035 Segmentation Scores Novel Score Algorithms Goal is to develop a robust process that can start with a clinical hypothesis andproduce high content analysis Multidisciplinary team of biologists, chemists, engineers and computer scientists Process being implemented with multiple collaborators For Research Use Only 0.04 © 2014 General Electric Company ― All rights reserved. GE and the GE Monogram are trademarks of General Electric Company. December 2014 JB26538US Probability Clinical Data Analysis Protein Co-localization Outcome prediction Pathway analysis Epithelial Nuclei Stromal Nuclei Membrane Cytoplasm Tissue 0.045 Cy5 Estrogen Receptor Cy5 p53 (negative) Cy3 pan cytokeratin Cy3 a-actin Distribution Score Generator 0.03 0.025 0.02 0.015 0.01 Statistical Analysis Toolbox 0.005 0 0 50 100 150 200 cMet Intensity 250 Cy3 b-catenin Cy3 g-tubulin Cy3 Vimentin Cy3 cmyc 300 Conclusions A novel platform has been developed to analyze multiple biomarkers on a single tissue section Method used to inactivate fluorescent dyes does not effect antigenicity or specificity over a wide range of targets Image analysis algorithms are used to segment markers into subcellular components to facilitate quantitative analysis of protein levels and localization Data analysis is used to predict important metrics such as patient stratification, survival analysis, disease recurrence and toxicity effects


© Copyright 2026