
Redacted for Privacy
AN ABSTRACT OF THE THESIS OF
Marilyn L. Walsh for the degree of Doctor of Philosophy in Biochemistry and
Biophysics presented on May 3..2001. Title: Protocols. Pathways. Peptides and
Redacted for Privacy
Wilbert Gamble
The vascular system transports components essential to the survival of the
individual and acts as a bamer to substances that may injure the organism.
Atherosclerosis is a dynamic, lesion producing disease of the arterial system that
compromises the functioning of the organ by occlusive and thrombogenic
processes. This investigation was undertaken to elucidate some of the normal
biochemical processes related to the development of atherosclerosis. A significant
part of the investigation was directed toward developing and combining methods
and protocols to obtain the data in a concerted manner.
A postmitochondnal supernatant of bovine aorta, using mevalonate-2-14C as
the substrate, was employed in the investigation. Methods included paper, thin
layer, and silica gel chromatography; gel filtration, high performance liquid
chromatography (HPLC), and mass spectrometry.
This current research demonstrated direct incorporation of mevalonate-214C
into the trans-methyiglutaconic shunt intermediates. The aorta also contains
alcohol dehydrogenase activity, which converts dimethylallyl alcohol and
isopentenol to dimethylacrylic acid, a constituent of the trans-methylgiutaconate
Small, radioactive peptides, named Nketewa as a group, were biosynthesized
using mevalonate-2-'4C as the substrate. They were shown to pass through a 1000 D
membrane. Acid hydrolysis and dabsyl-HPLC analysis defined the composition of the
Nketewa peptides. One such peptide, Nketewa 1, had a molecular weight of 1038 and a
sequence of his-gly-val-cys-phe-ala-ser-met (HGVCFASM), with a farnesyl group linked
via thioether linkage to the cysteine residue.
Methods were developed for the concerted investigation of the transmethylglutaconate shunt, the isolation of mevalonate-2-'4C labeled peptides, and
characteristics of neutral and acidic metabolites of mevalonate. The question as to
whether or not mevalonate was the direct precursor was answered in the affirmative.
These results contribute to the understanding of the biochemistry of the vessel wall and
the associated atherogenic processes. Mevalonate-derived volatile and acidic compounds
may represent an alternate metabolic pathway. The prenylated Nicetewa peptide may be,
as are other prenylated peptides, participants in the intracellular signaling process, release
of cytokines, expansion of extracellular matrix, and calcium release.
Protocols, Pathways, Peptides and the Aorta:
Relationship to Atherosclerosis
by
Marilyn L. Walsh
A THESIS
submitted to
Oregon State University
in partial fulfillment of
the requirements for the
degree of
Doctor of Philosophy
Presented May 3, 2001
Commencement June 2001
Doctor of Philosophy thesis of Marilyn L. Walsh presented May 3. 2001.
APPROVED:
Redacted for Privacy
Major Professor, representing Biochemistry and Biophysics
Redacted for Privacy
Chair of Department of Biochemistry and Biophysics
Redacted for Privacy
Dean of thGraduate School
I understand that my thesis will become part of the permanent collection of Oregon
State University libraries. My signature below authorizes release of my thesis to any
reader upon request.
Redacted for Privacy
Marilyn L. Walsh, Author
Acknowledgments
This project would not have been possible without the support,
guidance and encouragement of many individuals. I would like to
acknowledge my mentor and guide though this process, Wil Gamble. He
has taught me to love science, to "let the data speak to me", and to find the
right questions to ask. His enthusiasm for research is an inspiration to me
and to the many students who find their way to his office and laboratory for
advice and support.
I would like to acknowledge my graduate committee: Dr. Robert
Becker, Dr. Sonia Anderson, Dr. Daniel Arp and Dr. Thomas Savage. Dr.
Savage, in particular, for guiding me through several editions of this work.
His patience and standards are to be commended. I wish to thank both Dr.
Becker and Dr. Anderson for introducing me into the study of proteins; and
to Dr. Arp for helping me appreciate the intricacies of the plant and
bacterial world.
Undergraduate students in the Gamble laboratory have also
contributed to this work and I wish to thank them. The Department of
Biochemistry and Biophysics has provided ongoing financial and moral
support, and I wish to thank in particular Dr. Christopher Mathews for his
role in providing me the opportunities as a graduate teaching assistant. The
Oregon Heart Association and the National Institutes of Health provided
financial and technical help. Kate McGaughey and Priscilla Dombek have
been good friends and fellow graduate students. Karen Guzman and the
Wise Women at Luther House have shared the joys and stress as this work
progressed. Barbara Hansen helped immensely in manuscript prepartion,
I wish to thank Priscilla Dombek and Kate McGaughey for their
friendship and advice through this process as well as Karen Guzman and
others in the community.
TABLE OF CONTENTS
INTRODUCTION
Atherosclerosis
Structure of the vessel wall
Atherosclerosis development
Mevalonic Acid
The mevalonate pathway
Isoprenoid biosynthesis
Cellular functions of mevalonate-derived products
Protein prenylation
Mevalonate and vascular biochemistry
Research Goals
Use of the bovine model
Research focus
Research goals
MATERIALS AND METhODS
2
3
6
6
8
14
17
19
22
22
22
23
24
Introduction
24
Preparation of the crude homogenate of bovine aorta
25
Preparation of the postmitochondrial fraction of the crude homogenate
25
Preparation of mevalonic acid-2-'4C
26
Methods of detecting radioactivity in metabolites
26
The concerted protocol
27
Method of incubation of the postmitochondrial supernatant with
mevalonic acid-2-14C
27
Extraction of neutral lipids from the incubation mixture
32
Extraction of the acid lipid fraction from the incubation mixture
32
TABLE OF CONTENTS (Continued)
Precipitation of protein from the incubation mixture
33
Preparation of the aqueous extract and the soluble proteins
34
Determination of protein concentration
35
Gel filtration chromatography
36
Bio-Gel P100 chromatography
Bio-Gel P6 chromatography
Bio-Gel P2 chromatography
Ion exchange chromatography
Anion exchange chromatography
Cation exchange chromatography
37
37
38
38
38
39
Membrane filtration
39
Thin layer chromatography
40
Thin layer chromatography of carboxylic acids
Thin layer chromatography of amino acids and peptides
Preparative thin layer chromatography
Paper chromatography
General procedures
Paper chromatography of organic acids
Paper chromatography of amino acids and peptides
Preparative isolation of peptides
41
46
46
47
47
48
49
56
Performic acid oxidation of peptides
56
Acid hydrolysis of peptides
57
High performance liquid chromatography
58
Preparation of Dabsyl derivatives of amino acids
59
Mass spectroscopy of soluble peptides
60
TABLE OF CONTENTS (Continued)
EXPERIMENTAL RESULTS
63
Incubation of the postmitochondrial supematant
63
Characterization of the neutral lipid fraction
65
The acid petroleum ether extract
67
Thin layer chromatography of the acid petroleum ether extract
Paper chromatography of the acid petroleum ether extract
The trans-methylglutaconate shunt
Silica gel column chromatography
Paper chromatography of silica gel chromatography fractions
Thin layer chromatography of the trans-methyiglutaconate shunt
intermediates
Determination of alcohol dehydrogenase activity
in the postmitochondrial supernatant
Isolation and characterization of proteins and peptides
Identification of the peptide fraction
Paper and thin layer chromatography to identify the peptide fraction
67
73
75
76
79
80
80
84
85
86
Isolation and characterization of the aqueous extract peptides
86
Characterization of peptides from thin layer chromatography
Membrane filtration of the aqueous extract
Paper chromatography of Band I from preparative thin layer
chromatography
Amino acid analysis by dabsylation
Characterization of the Soluble Protein Fraction
86
88
96
Gel filtration of the soluble peptide fraction
Ion exchange chromatography of the soluble fraction
HPLC of the soluble peptides
Mass spectrometry of the soluble peptides
100
103
104
104
109
112
TABLE OF CONTENTS (Continued)
DISCUSSION AND CONCLUSIONS
The neutral and acid petroleum ether extracts
120
121
The trans-methylgiutaconatic acid shunt intermediates
124
Mevalonate derived radioactivity in peptides
127
Summary statement
130
BIBLIOGRAPHY
133
LIST OF FIGURES
Figure
1.
A. Isoprene
2.
Biosynthesis of farnesyl pyrophosphate, squalene, and lanosterol
from mevalonic acid
10
3.
Biosynthesis of cholesterol from lanosterol
11
4.
The trans-methylgiutaconate shunt
17
5.
Isolation of various fractions from the postmitochondrial
supernatant
28
6.
Protocols for the isolation and characterization of lipid and acid
components in the incubation mixture
29
7.
Protocols for the characterization of peptides in both the
soluble and aqueous extract fractions
30
8.
Thin layer chromatography of the trans-methyiglutaconate shunt
intermediates in an acid solvent
42
9.
Thin layer chromatography of the trans-methyiglutaconate shunt
intermediates in a basic solvent
44
10.
Paper chromatography of the trans-methylglutaconate shunt
intermediates in an acid solvent
50
11.
Paper chromatography of the trans-methylgiutaconate shunt
intermediates in a basic solvent
52
12.
Two dimensional chromatography of amino acid standards
54
13.
Radiochromatographic scan of thin layer chromatography of
of the acid petroleum ether extract in an acid solvent
68
14.
Radiochromatographic scan of thin layer chromatography of
of the acid petroleum ether extract in a basic solvent
69
15.
Radiochromatographic scan of thin layer chromatography of
standard mevalonic acid-2-14 C in an acid solvent
70
B. The pathway for the biosynthesis of mevalonic acid
7
7
LIST OF FIGURES (Continued)
Figure
16.
Radiochromatographic scan of thin layer chromatography of
standard mevalonic acid-2-14 C in a basic solvent
72
17.
Radiochromatographic scan of a thin layer chromatograph with no
radioactivity in the sample lane (background scan).
72
18.
Silica gel column chromatography of mevalonic acid-2-14C
77
19.
Silica gel column chromatography of the aqueous extract
78
20.
Thin layer chromatography of shunt acids
81
21.
Distribution of radioactivity with paper chromatography of Band I
89
22.
Thin layer chromatography of membrane filtration fractions
92
23.
Preparative thin layer chromatography of the YCO5 residue
93
24.
Biogel-P-100 chromatography of the soluble peptide fraction
105
25.
Biogel-P-6 chromatography of the labeled fractions
106
26.
Cellex-E anion exchange chromatography of the labeled fractions
107
27
Biorex-70 cation exchange chromatography of the labeled fractions
108
28.
HPLC of the soluble peptide fraction
110
29.
MALDI mass spectrum of a-melanocyte stimulating hormone
114
30.
MALDI mass spectrum of the Nketwa peptides
115
31.
Tandem mass spectrum of the 1038 Dalton Nketewa 1 peptide
116
LIST OF TABLES
Table
1.
Distribution of radioactivity from mevalonate-2-'4C
64
2.
Volatility of radioactively labeled components in the neutral extract
66
3.
RI values for medium chain acids and the acid petroleum
ether extract with paper chromatography
74
4.
Thin layer chromatography of the trans-methylgiutaconate shunt acids
82
5.
Alcohol dehydrogenase activity in the post mitochondrial
supematant
83
6.
Thin layer chromatography of citric cycle intermediates
85
7.
Paper chromatography of amino acids and the aqueous extract
87
8.
Thin layer chromatography of the aqueous extract and
amino acids
87
9.
Membrane Filtration of the aqueous extract
90
10.
Preparative thin layer chromatography of the YCO5 residue
95
11.
A. Summary of location of incoporated label from mevalonate-2-14C
by paper chromatography
B. Summary of amino acid analysis of peptides described in
Table 11 A
98
11.
99
12.
Results of dabsyl amino acid analysis
102
13.
Dabsyl amino analysis of the soluble peptide
111
14.
Deduction of the sequence of the 1038 Dalton Nketewa peptide from
tandem mass spectrometry
119
Dedication
This work is dedicated to my parents, two truly good people; to my
husband, whose patience and love through this long process have been tried, but
have survived intact; and to Wil, who has taught me the importance of angels in
life.
PROTOCOLS, PATHWAYS, PEFFIDES AND THE AORTA:
RELATIONSHIP TO ATHEROSCLEROSIS
INTRODUCTION
Atherosclerosis
The term arteriosclerosis entered the scientific lexicon when J.F. Lobstein (1)
first used the term to describe the brittle and fragile appearance of portions of the
vascular system observed during post mortem examinations. In 1904, Felix
Marchand used the term atherosclerosis to describe the pathology of this complex,
multi-faceted disease (for a historical review, see 2,3, and references therein). Other
researchers provided descriptions of the disease as early as 1700 (2). The reservoir
of information accumulated by the amount of cardiovascular research reflects the
elaborate, multi-step description required to define atherosclerosis. This research has
encompassed both genetic and environmental factors in an attempt to define the
etiology and the course of the disease. The intense interest in atherosclerosis, quite
obviously, comes from its widespread occurrence: atherosclerosis remains the
principal cause of myocardial and cerebral infarctions and their related conditions,
giving it the dubious first place as cause of death in the United States, Europe, and
Japan (4). This standing has been in place over some time, and is reflected in the
emphasis on research directed to both defining the causes of atherosclerosis and to
finding treatments to ameliorate or cure the disease.
2
Structure of the Vessel Wall
The arterial wall is a complex organ, consisting of layers of specialized cells
and extracellular structures suited for the function of transporting blood to smaller
vessels and, ultimately, cells. The ultrastructure of arteries will vary according to
size of the vessel itself (5). Those vessels with large diameterssuch as the aorta
and the carotid artery are elastic arteries; smaller vessels are designated muscular
arteries.
The arterial wall consists of three defined layers or tunica: intima, media and
adventitia. The intima is formed by a single layer of endothial cells supported by thin
layer of elastic tissue, the basal lamina. In some species the endothelium and basal
lamina are accompanied by a third component of the intima, a subendothial layer
composed of collagen, elastic fibers, and smooth muscle cells. The bovine aorta, the
tissue used in this study, lacks such subendothial layer. Endothelial cells in the
intimal layer are metabolically active and form a non-thrombogenic barrier between
circulating blood and underlying tissue. The endothelium is also a source of
components necessary for the normal functioning of the cardiovascular system ( a
review of endothial cell function can be found in 6, 7).
Below the intima layer is the tunica mediaa middle layer composed of smooth
muscle cells, elastic sheets (lamina) and networks of elastic fibrils. The highly
structured arrangement of the elastic sheets (40-60 layers) gives the large vessels
(aorta) their great resilience. Within this framework are found smooth muscle cells,
oriented at angles to the elastic sheets (8). The principal function of the smooth
muscle cells is contraction (9), but such cells will proliferate during angiogenesis and
synthesize the matrix components (collagen, proteoglycans) of the vessel wall.
3
Atherosclerosis Development
Atherosclerosis is better viewed as a progressive condition rather than a discrete
state [among the many comprehensive reviews available, see (3, 10-14)]. Changes
in the functioning of the components of the arterial wall as well as changes in the
circulatory blood elements result in the development of lesions within the vessel wall.
The etiology of the disease is not known, even though an extraordinary amount of
research has been directed toward treating and understanding the condition. The
events that participate in atheromatous lesion development have been well
characterized and a brief overview of those events is given below.
Lesion development in the arterial wall begins with the appearance of a fatty
streak which can occur in childhood or adolescence. These early deposits of lipid
contain free cholesterol, cholesterol esters, and triglycerides. Foam cells, which are
lipid-laden macrophages, are also observed in this early lesion and are characteristic
components of the atherosclerotic lesion. Plasma lipids are engulfed by
monocyte/macrophages which then become the foam cells; monocytes from the
blood enter the subendothelial layer and there differentiate into macrophages. Such
recruitment of monocytes to the intimal layer is a pivotal point in disease progression,
since monocytes may be induced to infiltrate the vessel wall in response to several
postulated circumstances (see below). Subsequent factors which stimulate
monocyte infiltration are the appearance of adhesion molecules on the surface of
endothelial cells, the expression of cytokines, growth factors, and leucocyte
attachment to the endothelial layer.
Smooth muscle cells, in response to intercellular signals generated by the
developing lesion, proliferate in the next stage of atherogenesis and in turn, generate
the fibrous components of the extracellular matrix. Growth factors and cytokines
expressed and released by foam cells, smooth muscle cells, and the endothelium
itself promote lesion development to a more advanced state, the atheroma. Foam
cells and lipids continue to accumulate in the core of the atheroma. Cell death within
the lesion releases more lipids and thrombogenic factors.
The development of the plaque progresses through the formation of a fibrotic
cap, composed of smooth muscle cells and collagen. Overlaying the lipid core, the
cap varies in thickness and composition while the core is characterized by a
predominance of extracellular lipids. Other mechanisms now intervene including
thrombosis, plaque rupture, calcification, and occlusion of the vessel wall, along
with continuing necrosis of the plaque itself. These events lead to the clinical signs
of the disease: heart attack, gangrene, stroke and other disorders associated with
diminished blood flow.
The etiology of atherosclerosis is not known, but at least two general
hypotheses exist. The injury hypothesis (10) postulates that a destructive event or
state (stress or turbulence, disease, xenobiotics, risk and genetic factors) may
compromise the endothelial lining of the vessel wall with accompanying
inflammation. The response to the injury then leads to recruitment of platelets and
monocytes to the arterial wall site with subsequent lesion development. The lipid
hypothesis (15) postulates that elevated levels of plasma lipids [low density
lipoproteins (LDL), very low density lipoproteins (VLDL) and chlylomicrons]
increase the rate of lipid uptake by cells found in the vessel wall: endothelial cells,
smooth muscle cells, macrophages. The LDL receptor protein on the surface of
macrophages and other cells regulates the uptake of cholesterol into the cell. Excess
cholesterol and lipids accumulate outside the cell when intracellular levels are
5
adequate. This excess of lipid is viewed as an inflammatory event and subsequent
recruitment of monocytes takes place.
While the etiology of atherosclerosis is not known, the explanation for the
initiation of the disease has been integrated into a single, multifactorial approach (11).
An excess of circulating lipids, leading to their deposition, especially oxidized lowdensity lipoprotein (OX-LDL), and subsequent organization into the arterial wall may
be viewed as either an injury or a response to excess lipids Once injured, the
endothelium will recruit platelets and monocytes to the arterial wall as well as lipid
deposits; either or both events will result in the formation of the initial lesion (12,
13). Injury to the endothelium also results in thrombosis (15) which, in
atherosclerosis, may lead to occlusion in vessels. Platelets involved in the process
are also a source of growth factors which promote smooth muscle proliferation
(16,17).
The uptake of modified LDL (OX-LDL) is a part of the atherogenic process
jreviewed in (15)]. The production of a second receptor protein, the scavenger LDL
receptor, is not regulated and thus cells with this receptor will take up uncontrolled
amounts of OX-LDL. Oxidative modification to LDL is induced by smooth muscle
cells, endothelial cells, and macrophages as well as extracellular components such as
xenobiotics or disease states. OX-LDL also stimulates the release of the monocyte
chemoattractant protein-i from endothelial cells (19).
Research in this laboratory has focused on selected aspects of the normal
metabolism of the aortic wall to gain knowledge of its functioning within the
cardiovascular system, with the possibility that this information will contribute to the
understanding of the atherogenic process. The present research is an investigation of
the metabolic fate of mevalonic acid in the aorta.
Mevalonic Acid
The Mevalonate Pathway
Mevalonic acid (MVA) biosynthesis (Figure 1B) begins with the
condensation of three molecules of acetyl coenzyme A (acetyl C0A) to yield
decarboxylation and reduction, a branched 5-carbon hydroxy acid. This compound
was first isolated by Lemuel Wright and others as a carbon source for Lactobacillus
acidophilus (23). Members of this research group tested mevalonic acid as a
precursor to cholesterol (24) and found it to be quantitatively converted to
cholesterol. Earlier studies (25) had shown that acetate was the carbon source for
cholesterol. A second report (26) describing the conversion of the C30
polyisoprenoid compound, squalene, to cholesterol suggested that mevalonate was
the source of the biological isoprene unit (reviewed in 27).
The structure of squalene was known and followed the so called "isoprene
rule"a concept over a century old (reviewed in 27). The isoprene rule states that
terpenes were constructed by the assembly of branched, five carbon units related to
isoprene (Figure 1A). Given these relationships, the search for a small, branched
precursor began.
Since cholesterol biosynthesis required a branched chain intermediate,
investigators looked for compounds that were composed of 2-carbon units that could
be assembled into mevalonic acid. Studies with acetoacetyl coenzyme A and acetyl
coenzyme A were shown to be intermediates in the formation of HMG-CoA (28).
The conversion of HMG-CoA to mevalonic acid required NADPH and a microsomal
fraction containing the enzyme, HMG-CoA reductase. This step is a regulatory point
in isoprene biosynthesis (29, 30).
7
A.
H3C
CH3
Isoprene
H3
0
0
H3CC0A
H3CSCOA
B
Acetyl
CoASH
H3
0
H3C
SCoA
SCoA
Acetoacetyl Coenzyme A
CoASH
OH
0
TII
Hydroxymethylgiutaryl Coenzyme A
H3C'h'''SCOA
COOH
Hydroxyrnethyiglutaryl Coenzyme A Reductase
CoASH
OH
CH3T'
3R-MevalonicAcid
COOH
Figure 1. A. Isoprene. B. The pathway for the biosynthesis of mevalonic acid.
r]
The reduction of HMG-CoA to form mevalonate is irreversible in
biosynthetic pathways. The catalytic domain (carboxy terminus) of HMG-CoA
reductase (30) is located in the cytosol and is highly conserved across species. The
amino terminal region varies with different sources and resides in the endoplastic
reticulum. It has also been shown that the catalytic domain can function without
membrane attachment (31, 32), but the membrane-bound domain is required for
enzyme degradation (30). Tn archaebacteria, HMG-CoA reductase functions without
membrane attachment (32)
The mevalonate pathway has been shown to function in archebacteria (31) and
plants (34), as well eukaryotes. A review of sterol biosynthesis in various kingdoms
is available (35). In eukaryotes, the enzymes for the pathway converting acetyl CoA
to HMG-CoA are found in the cytoplasm, and as noted, reduction of HMG-CoA to
mevalonate occurs on the endoplastic reticulum. A HMG-CoA reductase has also
been isolated from peroxisomes (36).
Tsoprenoid Biosynthesis
The steps leading to the synthesis of farnesyl pyrophosphate and squalene
from mevalonate are shown in Figure 2. ATP and Mg participate in the first step,
the formation of mevalonate-5-phosphate, which is catalyzed by mevalonate kinase.
A second phosphorylation step, catalyzed by phosphomevalonate kinase, produces
mevalonate-5-pyrophosphate. The simultaneous dehydration and decarboxylation of
mevalonate-5 pyrophosphate produces isopentenyl pyrophosphate, a reaction carried
out by the enzyme phoshosphomevalonate decarboxylase; ATP and a divalent cation
are required. Isopentenyl pyrophosphate isomerase, in a reversible manner,
catalyzes the isomerization of the substrate, isopentenyl pyrophosphate to
dimethylallyl pyrophosphate and requires a divalent cation for activity.
The last step, leading to the formation of farnesyl pyrophosphate, is catalyzed
by famesol synthase. The enzyme catalyzes sequential head-to-tail condensations of
isopentenyl pyrophosphate and dimethylallyl diphosphate to produce first, a 10-
carbon terpenoid pyrophosphate, geranyl pyrophosphate. Addition of a second
molecule of isopentenyl pyrophosphate forms farnesyl pyrophosphate.
Other enzymes of the mevalonate pathway leading to the synthesis of farnesyl
pyrophosphate are located in the cytosol. Evidence leading to the synthesis of
farnesol pyrophosphate in peroxisomes has been reviewed (37). Utilization of this
molecule, via a number of different pathways, results in the synthesis of cholesterol,
prenylated proteins, ubiquinone (coenzyme Q), and dolichols. Isopentenyl
pyrophosphate is also used in the synthesis of a modified purine base, isopentenyl
adenine, found in some transfer ribonucleic acids. A 20-carbon isoprenoid,
geranylgeranyl pyrophosphate is also used to modify proteins. Enzymes catalyzing
the conversion of farnesol pyrophosphate to squalene are located in the endoplastic
reticulum. Two molecules of farnesol pyrophosphate are condensed, head to head,
to form this 30-carbon intermediate. Squalene synthase facilitates this reaction,
and the cyclization of squalene in the presence of oxygen forms the first sterol
intermediate, lanosterol. Nineteen further reactions are required to produce
cholesterol, briefly summarized in Figure 3.
The capacity of isopentenyl pyrophosphate and dimethylallyl pyrophosphate
to condense into repeated 5-carbon branched chain molecules open to further
modification and cyclization leads to the large number of 'isoprenoid" compounds.
Some of these compounds act as signaling moleculeseither in an intracellular
mode to transmit information within the cell or to control the activity of enzymes
I'll
CH3 OH
3R-Mevalonate
2ATP, Mg2
O CH3 OH
H OO P P
Mevalonate pyrophosphate
H70, CO2
OPP
-
Isopentenyl Pyrophosphate
Diinethylallyl Pyrophosphate
Isopentenyl Pyrophosphate
2 PP1
Farnesyl Pyrophosphate
OPP
2 PPi
Head to head condensation
Oxidation to 2,3 epoxide,
Cyclization
.
Lanosterol
Figure 2. Biosynthesis of farnesyl pyrophosphate, squalene, and lanosterol from
mevalonic acid
11
Lanosterol
I
Double bond shift
Cholesterol
Figure 3. Biosynthesis of cholesterol from lanosterol.
12
along the mevalonate pathway itself. The varied functions of isoprenoid compounds
and modifications are of particular relevance to the processes observed in the
development of atherosclerosis: lipid biosynthesis, cell proliferation, cell cycle
progression, lipoprotein uptake, DNA replication and cell cycle progression.
Cellular functions of mevalonate derived products
Cholesterol, beyond its historical importance in the elucidation of the
mevalonate pathway, is also the most studied and most abundant of the mevalonate
derived lipids in animals (38, 39). Dietary intake also supplies the cellular needs for
cholesterol. Maintaining the appropriate balance between synthetic and dietary
sources to achieve healthy cholesterol levels inside and outside the cell is a subject of
extensive research, since cholesterol deposition is characteristic in atherosclerotic
lesions (40-42).
Prior research in this laboratory (43-45) has shown that little synthesis of
cholesterol takes place by the arterial wall, yet cholesterol accumulates in
atherosclerotic lesions both within cells and in the extracellular space. The presence
of cholesterol (free and esterified) in the core of advanced lesions arises from the
death of foam cells within the core, but cholesterol (and cholesterol esters) may also
be deposited independently outside of the lipid accumulating cells (46). First
observed by Windaus (47) in 1910 as a significant component of atherosclerotic
plaques, the presence of cholesterol in the vessel wall as well as the dynamics of
deposited cholesterol has also been the subject of extensive research (48). The
amount of total cholesterol in the lesion appears to arise from sources other than
biosynthesis by the vessel wall.
13
Other biosynthetic products formed from mevalonate include dolichols,
ubiquinone (coenzyme Q) and heme A. Dolichols are long chain isoprenoid alcohols
that are also synthesized (49, 50) from mevalonate. These molecules may contain
up to 24 isoprene units, the length depending on the biosynthetic source. Dolichol,
as dolichyl phosphate, functions in the endoplasmic reticulum 's biosynthesis of
glycoproteins in eukaryotes. Bacteria synthesize dolichols in conjunction with the
synthesis of cell wall polysaccharides. Dolichol, in contrast to dolichyl phosphate, is
present in a variety of tissues, while the amount of dolichyl phosphate is rate limiting
in glycosylation reactions (52) where the polyprenol phosphate functions as a
glycosyl carrier. The role of free dolichol itself is not known but may be involved
with regulation of membrane stability, fluidity and permeability (52).
Ubiquinones contain a long isoprenoid-derived side chain and participate in a
wide variety of metabolic functions; in eukaryotes, the ubiquinone coenzyme Q acts
as a diffusable carrier in electron transport. Ubiquinone is required for normal
functioning in the inner mitochondrial membrane, where respiration takes place.
Ubiquinol is an antioxidant in biological membranes (32, 53), protecting lipids,
proteins, and DNA from oxidative damage induced by free radicals. Ubiquinone
may be significant in protecting lipoproteins against oxidative damage; oxidized
lipoproteins are known to be atherogenic(54, 55). Ubiquinol may be more efficient
in inhibiting LDL oxidation, in particular, than other endogenous antioxidants such
as a-tocopherol (56).
There are yet other molecules derived from mevalonate: heme A is a
component of fetal hemoglobin and contains a famesyl side chain (57), and
isopentenyl adenine, a modified nucleoside, contains an N-6 isoprenoid moiety.
This substituted base is found in some forms of transfer RNA (ribonucleic acid) (58)
and evidence for an isopentenyladenine-modified protein has been reported (59).
14
This nucleoside also acts as a plant growth regulator (60). Lining the inner nuclear
membrane is a polymeric protein structure called the nuclear lamina, composed of
three major proteins, lamins A, B, C. Prelamin A, precursor to the mature lamin A,
contains a carboxy terminal farnesyl group; this group is required for the proteolytic
removal of an 1 8-amino acid peptide, along with the isoprenoid moiety, to form the
mature protein (61, 62).
Protein Prenylation
The nuclear lamins comprise a small sector of a large group of proteins that are
post-translationally modified by a prenyl group after protein synthesis (63-65).
These modifications affect the function of the proteins as well as their localization.
Three enzymes that transfer a prenyl group (15 or 20 carbons) to a target protein have
been identified: farnesyl transferase, geranylgeranyl transferase I and geranylgeranyl
transferase II. Target proteins have a distinct C-terminal sequence, CAAX, where C
is cysteine, A is any aliphatic amino acid, and X is the signal amino acid for the
specific prenyl group added. For farnesyl transferase, X is methionine, serine, or
alanine. For geranylgeranyl transferase I, X is leucine or phenylalanine.
Geranylgeranyl transferase II will add one or two geranylgeranyl groups to proteins
that terminate in a sequence CXCX or XXCC, where C represents cysteine and X,
any amino acid. Farnesyl transferase and geranylgeranyl transferase I will modify
substrates as short as four amino acids, while the third transferase requires other
recognition signal yet to be identified.
Prenylation of "CAAX proteins" is followed by further modifications to the
target protein. These include the proteolytic removal of the terminal AAX residues
and subsequent methylation of the new carboxy terminal cysteine. Methylation
15
requires S-adenosyl methione; and substrate recognition requires that the cysteine
residue be modified with a farnesyl or geranylgeranyl group. The addition of the
methyl group to the prenylated protein, removing the carboxy terminal negative
charge, enhances the membrane association of such proteins. Proteins with two
geranylgeranyl groups, as in the case of CC or CXC terminal substrates, are also
modified in some instances by a fatty acyl group. A stretch of basic residues
upstream of the CAAX sequence also positively influences interaction with the lipid
bilayer. Proteins modified by geranylgeranyl transferase II that exhibit the Cterminal CXC sequence are methylated after prenylation; those with the CC motif are
not methylated.
The significance of prenylation of proteins comes partially from the observation
that Ras and Ras-related GTP binding proteins are prenylated. Subsequent research
has demonstrated that subunits of trimeric G proteins are also prenylated. These
proteins are important participants in signal transduction. Such signaling events may
be important in atherogenesis where cell proliferation, lipid deposition, and
synthesis and secretion of extracellular matrix material are influenced by such signals
(66). It has been estimated (67) that 0.2 to 4% of intracellular proteins may be
prenylated.
Mevalonate products are also critically involved with cell growth and
proliferation (68), a connection observed when mevalonate-deprived cells did not
enter the S-phase (DNA synthesis) of the cell cycle (for reviews, see 68-69). The
relationship between cell division and mevalonate availability was observed using
highly specific inhibitors of HMG CoA reductase (68), since prior research noted
that increased HMG CoA reductase activity correlated closely with DNA synthesis.
The effect of HMG-CoA reductase inhibition on S-phase DNA synthesis, moreover,
could be relieved by the addition of mevalonate to inhibitor-treated cells. This
16
observation has stimulated research to identify the mevalonate-related component(s)
responsible for cell cycle entry into S-phase. Addition of cholesterol was
ineffective in removing the block to DNA synthesis in the S-phase cycle, and
inhibition of mevalonate production did not affect DNA synthesis in the G2, M, and
G1
phases. Mevalonate thus appears to have a dual role in the cell cycle: (1)
providing adequate amounts of cholesterol for membrane integrity, and facilitating
either directly or via a mevalonate derived productactivation of S-phase DNA
synthesis. Subsequent research investigating this relationship has to date not
identified the mevalonate derived product(s). Furthermore, the H-ras protein, which
requires farnesylation for activity, is transcribed from a protooncogene (71); thus, the
mevalonate pathway could be a potential target for drugs which are designed to limit
cell proliferation (72-74).
Mevalonic acid is utilized in the trans-methylglutaconate shunt, in which
mevalonate is converted in a series of reactions to acetoacetyl coenzyme A(75-82).
This product is then available for fatty acid synthesis. The proposed pathway is
illustrated in Figure 4, with mevalonic acid first converted to dimethylallyl alcohol
and then to dimethylacrylic acid. In steps common with the pathway for leucine
catabolism, dimethylacrylic acid is converted to HMG-CoA, which is then cleaved to
acetyl CoA and acetoacetate by HIMG-CoA lyase. Studies with 'C labeled
mevalonate in rats (83) demonstrated a labeling pattern consistent with the proposed
shunt. However, direct evidence for the intermediates has not been reported.
Investigations in this laboratory (78) demonstrated that mevalonate-2-'4C was
incorporated into diacyiglycerols by bovine aorta, with the greatest amount of label
present in medium-chain n-fatty acids.
An alternate pathway for mevalonate-independent biosynthesis of isoprenoids
exists in bacteria, algae, and plants (84-88). These organisms synthesize 1 -deoxy-D-
6
CH,30H
o2CN2Vc4,SH2 0+4
-
02
MEVAL0TE
CH
(3NCH,0+4('5... SCoA
,PH
OP,0
ISOPENTENYL-PP
1..GERANYLPP
I
I
I
0'0N CH('bHf'
OH
3,3-0IMETHYLAUYI.-PP
SP*4ATASE
ACETYL COA
jFATIY ACID SYNTHASE
' S.00A
FATTY ACIDS
.H20
C++,
OH,
MALONYL CoA
HMG-CoA
FARNESYL-PP
STEI0LS
]SQU#ILENE
ACETYL CoA
CAROXYLASE
0
OH
C++,
OH,
AOETYLCOA
ACETOACETATE
OH,
OH,
02CN2
2
2
o
NCH'kCH ''
SCo
TRANS-3-MED4YLGLUTAOOIIYL-CoA
HOP,0
OH,
CH('CH'
OH
3,3. DIMEThYL*LLYL ALCOHOL
01+,
0
3.3.OIMETHYLAORYLYL-CoA
ALCOHOL
4,DEHYDROGENAS
2H3
34flfYLCROT0+LaLDEIWt
ALCOHOL
DEHYDROCEN
OH,
CH('CH
,co;
3,3-OIMETtACRYLATE
Figure 4. The trans-methylglutaconate shunt.
EL
xylulose-5-phosphate from glyceraldehyde-3-phosphate and pyruvate. This
intermediate is converted to isopentenyl pyrophosphate for incorporation into
isoprenoids. A recent report (89) describes the incorporation of the intact skeleton of
the amino acid leucine into sterols by trypanosomatid protozoa. In this study the
carbons from leucine were observed in the sterol backbone in a manner consistent
with a pathway which utilized dimethylacrylic acid as a precursor to dimethylallyl
alcohol.
Cholesterol itself is utilized for the stabilization of cell membranes and is
further modified for synthesis of steroid hormones. Recent research in
developmental biology has revealed a new role for cholesterol and thus mevalonate.
The correct morphogenesis of multicellular organisms depends on the careful and
timely signaling so that the organism will develop and grow properly. Signaling
often depends on proteins with post translational modifications. One such group of
signaling protein molecules are those encoded by the hedgehog gene family. The
Hedgehog family of tissue patterning factors are protein(s) covalently modified with
cholesterol (90, 91). These signals function in the development in a diverse group of
organisms, from embryonic segmentation in insects to neural tube development in
vertebrates. The cholesterol-Hedgehog connection arises when the immature
Hedgehog protein cleaves itself, acting as an autoprotease. Cholesterol is then
covalently linked to the carboxy terminus of the new amino terminal fragment (92-
94). The new amino terminal fragment (signaling domain) remains associated with
the cell surface, and the Hedgehog-carboxy terminal fragment (the processing
domain) then diffuses from the originating cell. This latter domain has no known
additional function.
19
Mevalonate and vascular biochemistry
Mevalonate, because of the biosynthetic products for which it is a precursor, is
important in a variety of cellular functions. Research directed toward understanding
the utilization of mevalonate in vascular tissue is important, not just because we want
to learn more about mevalonate biochemistry in the aorta, but vascular pathobiology
enlists those processes in which mevalonate is a critical component: cholesterol
biosynthesis, cellular proliferation, signal transduction, and cell metabolism.
Since a clear connection exists between plaque development and accumulation
of cholesterol in the vascular wall, a number of attempts have been made to
demonstrate the biosynthesis of cholesterol by arterial tissue (reviewed in 45).
However, vascular synthesis of cholesterol is low compared to hepatic tissue. Prior
studies in this laboratory have demonstrated the low cholesterol-synthesizing ability
of the arterial wall (43) from acetate and mevalonate. The bovine aorta has been
shown to synthesize mevalonate-5-phosphate and mevalonate-5-pyrophosphate (43)
from mevalonate. A cell-free preparation of bovine aorta was used in these studies,
as well as in a more recent study in which labeled mevalonate was incorporated into
medium
(C8
and C10) n-chain diacylglycerols; this result verified trans-
methylglutaconate shunt activity in the artery.
Other evidence for mevalonate utilization in arterial tissue has come from the
use of inhibitors of HMG-CoA reductase, collectively called statins (96, 97). The
inhibition of this enzyme by these compounds reduce the availability of mevalonate
to the cell. In clinical settings, statins have been generally shown to lower LDL
cholesterol and to have antithrombogenic and anti-inflammatory effects. However,
their effects on vascular health are not entirely explained by lowered LDL. Statins
appear to exert direct inhibitory effects on cells primarily involved in atherogenesis.
Treatment of cells in culture with these inhibitors (98-100) has shown the
importance of mevalonate in normal cell functioning as well as in atheroslerosis.
In in vitro investigations (101-102), statins inhibited cell cycle proliferation.
Further research with vascular smooth muscle cells treated with statins (103-104)
showed that muscle cell migration and proliferation were diminished in the presence
of these compounds. Plaque stability was increased with the compounds, and
macrophages accumulated less cholesterol in the presence of statins.
Inhibitors of the mevalonate pathway have been tested to investigate their effect
on cultured and proliferating arterial smooth muscle cells (103). Both compactin (a
HMG-CoA reductase inhibitor) and 6-fluoromevalonate, an inhibitor of mevalonic
acid pyrophosphate decarboxylase, prevented vascular smooth muscle cell
proliferation. Inhibition of squalene synthase and squalene epoxidase blocked
cholesterol synthesis but not smooth muscle proliferation. The results of this study
also pointed to protein isoprenylation as a probable controlling event in cell
proliferation. Similar effects on human and porcine vascular cells (104) were all
observed using fluvastatin. Collectively, inhibitors of the mevalonate pathway have
generated much interest directed toward both direct atherogenic processes
(cholesterol accumulation, cell proliferation), and the development of potential
therapeutics in the treatment of proliferative diseases (102).
When vascular smooth muscle cells are deprived of mevalonate using HMG-
CoA reductase inhibitors, an impairment of insulin growth factor-insulin signaling is
observed, with the secondary impairment of cell proliferation pathways (105).
Roullet et al. (106) studied mevalonate availability in isolated whole aortas and
observed that exposure to mevalonate decreased blood vessel resistance functions; in
a similar study (107) this group tested the level of mevalonate availability on the
effects of vasoconstrictors. It was concluded from their results that deprivation of
21
mevalonate directly contributed to increased vessel resistance function caused by
vasoconstrictors.
This effect may be related to those observed by Finder et al.
(108) relating the expression of nitric oxide synthase-2 (NOS-2) in vascular smooth
muscle cells.
Treatment with inhibitors of either geranylgeranyl transferase or
HMG-CoA reductase caused a 5-10 fold induction of NOS-2 stimulated by the
cytokine interleukin- 113, while inhibitors of protein famesylation blocked this
induction of NOS-2 by interleukin-113. These results suggested a tight control of
interleukin- 1 B induction, and hence production of nitrous oxide, a molecule with has
extensive physiological effects. These effects include vasodilation and
antithrombogenic action (109), and suggest that the NOS-2 synthase protein
participates in the control of several atherogenic processes. These results indicated
that induction of the NOS-2 synthase depends upon protein isoprenylation.
The effect of cholesterol enrichment in arterial smooth muscle cells was
investigated by Pomerantz et al. (111). Cultured smooth muscle cells were induced to
take up cholesterol by exposure to modified LDL. This cholesterol enrichment
reduced the cell membrane content of proteins known to be modified by
isoprenylation: low molecular weight G-proteins and heterotrimeric G-protein
complexes. This suggested that high cellular cholesterol reduced both G-protein
expression and therefore signaling; these effects occurred by inhibition of protein
prenylation and consequently, membrane targeting of signaling proteins in vascular
cells.
22
Resarch Goals
Use of the bovine model
The bovine has been shown to be an excellent model for the study of human
atherogenesis (112-114). Prior research in this laboratory has established the ability
of post-mitochondrial supematant prepared from bovine aorta to convert mevalonate
to cholesterol (43, 95) and medium chain fatty acids (78).
Research Focus
This research aims to obtain information about vascular wall metabolism
using mevalonic acid as a means to gain the information. Mevalonate is a key
intermediate in several metabolic processes: biosynthesis of isoprenoids and sterols,
prenylation of proteins, the trans-methylglutaconate shunt, and control of the cell
cycle. A review of metabolic processes related to mevalonate utilization has shown a
clear connection between mevalonate metabolism and processes that are directly or
indirectly involved in atherogenesis: cholesterol synthesis, cell proliferation, cell
migration, and monocyte adhesion. Since it has been shown that mevalonate is
utilized at low levels for cholesterol biosynthesis by the aorta, other pathways may be
of significance in normal arterial metabolism and in atherosclerotic lesion
development. For these reasons, it is appropriate that mevalonate metabolism by
vascular tissue be studied.
In particular, the postulated intermediates of the trans-
methylglutaconate shunt have not been directly demonstrated in this or any other
tissue. The fate of mevalonate with respect to protein and peptide modification has
also not been directly studied in vascular tissue.
23
Research goals
In this research three questions were to be addressed, relative to the metabolic
fate of mevalonate in arterial tissue.
(1) Can one demonstrate the direct conversion
of mevalonate to the constituents of the trans-methylglutaconate shunt? (2) Can one
characterize the previously observed radioactive compounds , neutral and acid lipids,
which were biosynthesized using mevalonate-2-14C as a substrate? (3) Does the
aorta utilize mevalonate to covalently modify peptides and proteins? To answer these
questions the first objective was to develop a series of protocols which would
permit the investigations in a concerted manner. The combination of the protocols
will allow for the identification of mevalonate metabolites.
The research will use a
previously employed postmitochondrial supernatant of bovine aorta.
24
MATERTALS AND METHODS
Introduction
This investigation required the use of defined methods as well as the
development of procedures needed for the unique requirements of the research.
Protocols existed for preparation of bovine aorta and for end analysis of amino acids,
among others. However no protocols existed for isolation of the transmethyiglutoconate shunt intermediates. Therefore, method development was
involved in a significant portion of this project. A combination of techniques
(described in this section) was involved to analyze for the intermediate shunt acids,
including silica gel column chromatography, thin layer chromatography, and mass
spectrometry.
Likewise, a series of methods, was used to isolate and characterize the small
peptides, which are too small to be detected by the usual electrophoretic techniques.
The peptides also were not significantly bound by ion exchange columns.
Therefore, gel exclusion chromatography, membrane filtration, thin layer
chromatography, and paper chromatography were used to separate the peptides
found in this work. Some protocols, however, remained essentially as described in
earlier research from this laboratory (78).
Chemicals, unless specified otherwise, were of reagent grade. Vendors of
specific reagents and supplies are noted in the text, or were purchased from Fisher
Scientific Company, Santa Clara, CA.
25
Preparation of the crude homogenate of bovine aorta
Abdominal aortas, from cattle two to three years old, were obtained
immediately after sacrifice and stored on ice. Animals brought to the Carlton Packing
Company in Carlton, Oregon were the source of this tissue. During the preparation
of the crude homogenate the aortas were kept cold and protective gloves were worn
to prevent contamination of the tissue. The vessel length was typically 12-14 inches,
measured from just above the point where the aorta bifurcates into the femoral
arteries.
Exterior fat and adventitia were removed with scissors and the trimmed vessels
were then cut into small pieces approximately 0.25 cm2. The minced tissue was
stored in large beakers on ice prior to the homogenization step. A Waring blender at
high speed was used to grind the tissue: 100 grams of tissue were combined with
100 ml cold 100 mM potassium phosphate buffer, pH 7.0, containing 6 mM MgC12.
The homogenized tissue was filtered through two layers of cheesecloth; the combined
filtrate was stored, at -20°C , in approximately 150 ml aliquots. This filtrate, referred
to as the crude homogenate, could be stored frozen for three to four months without
loss of activity (95).
Preparation of the postmitochondrial fraction of the crude homogenate
The crude homogenate was centrifuged in a Beckman Model L-65
ultracentrifuge using a 30S rotor at 60,000 x g for 120 minutes. The resulting clear
red supernatant was pooled and stored on ice until further use. This cell-free
preparation is referred to as the postmitochondrial supernatant, and was used in
experiments within several hours after the centrifugation step.
26
Preparation of mevalonic acid-2-14C
DL-mevalonic acid-2-14C (MVA-2-'4C) was obtained as a solution of the N-
N-dibenzylethylenediamine salt, from Dupont New England Nuclear Laboratories
(Boston, MA). It was necessary to remove the amine and to obtain mevalonate as the
free acid for use in the incubation experiments with the postmitochondrial
supernatant. An aliquot of the ethanol stock solution (5-10 iCi, 50.4 mCi/mmole)
was evaporated under nitrogen gas and then redissolved in three mis of water. The
aqueous solution was adjusted to pH 11 with 1 N KOH and allowed to stand at room
temperature overnight, then extracted four times with one ml of diethyl ether each
time to remove the liberated amine. The aqueous layer was adjusted to pH 7 with 1
N HCJ, then diluted with water to a final activity of 0.5-1.0 pCi per ml, and stored
-20 °C. The purity of this preparation was monitored throughout this study by thin
layer or paper chromatographic techniques.
Methods of detecting radioactivity in metabolites
Radioactivity in dissolved samples was detected by scintillation counting; for
thin layer and paper chromatograms, Geiger counter technology (Bioscan System
200 Imaging Scanner, Bioscan Inc., Washington, DC) was employed. Scintillation
fluid for toluene-soluble samples contained four grams of 2,5-diphenyloxazole)
(PPO) and 30 mg of p-bis-[2-(5-phenyloxazolyl)-benzene (POPOP)]per liter of
scintillation grade toluene. Aqueous samples were counted in Aquasol, a
commercially available aqueous fluor, obtained from New England Nuclear (Boston,
MA). Samples were mixed with ten ml scintillation fluid in glass vials for counting.
27
The concerted protocol
The sections below and Figures 5, 6 and 7 diagram the concerted protocols
Throughout this project both incubated (for 2 hours, 55 minutes) and initial time(0 to
15
minutes) incubation mixtures were separated into various fractions to investigate
the incorporation of mevalonate-2-14C into separate fractions. Figure
5
illustrates the
first steps in obtaining the two main fractions, the soluble peptides and the aqueous
fraction.
Figure 6 shows how the aqueous fraction and extracted lipids were obtained
and analyzed.
Figure 7 diagrams the protocols used to characterize the peptide
components isolated in both the soluble peptide fraction and the aqueous extract.
The use of the concerted protocol allowed for observation of components of a
fraction by using different systems and comparison of that behavior with known
standards. This allowed for deduction of the identity of the component. This strategy
was particularly useful in the identification of the trans--methlylglutaconate shunt
intermediates. The concerted protocols shown in Figures
5,
6, and 7 give a general
approach to the research and do no necessarily reflect the absolute order of protocols
used in all the experiments.
Method of incubation of the postmitochondrial supernatant with
mevalonic acid-2-14C
The postmitochondrial supematant was kept on ice until the incubation period was
initiated (Figure 5). Incubations were carried out in Erlenmeyer flasks and
contained, per five ml of supernatant, 16.9 moles of adenosine triphosphate (ATP),
0.05-0.1 jiCi
mevalonate-2-14C, and additional phosphate buffer to obtain a final
Bovine Aorta (from slaughterhouse)
Trim, cut, homogenize in Waring
blender with 0.1 M K PO4 buffer,pH7.0
2. Filter through cheesecloth
1.
I
V
Crude homogenate
Centrifuge 60,000 x g two hours
Postmitochondrial supernatant
'V
Incubate or initial time exposure
with MVA-2-14C
Incubation Mixture
1. Extract neutral lipids with 30-60° C
petroleum ether
2. Acidify extracted mixture
3. Extract again with 30-60°C petroleum
her
Neutral and acid lipid extracts
Extracted Incubation Mixture
Treat with cold 80% ethanol overnight
2. Centrifuge
1.
Pellet: precipitated proteins
Soluble peptides
Supernatant containing small acids and peptides
Aqueous fraction
Figure 5. Isolation of various fractions from postmitochondrial supernatant. The
figure diagrams the steps leading to the isolation of the supernatant (aqueous fraction)
and protein pellet remaining after the precipitation of proteins. The pellet was the
source of the soluble peptide fraction.
29
Incubation Mixture
1 .Extract neutral lipids
2.Acidify, extract again
Neutral Lipids
Acid Lipids
Extracted Incubation Mixture
3. Precipitate Proteins
Pellet
4. Dry pellet
5. Solubilize
Soluble Peptide Fraction
Supernatant (the aqueous extract)
6. Reduce volume
7. Paper Chromatography
8. Thin Layer Chromatography
9. Silica Gel Chromatography
Isolated Fractions
110. Thin layer chromatography
11. Paper Chromagraphy
112. Gas Chromatography/Mass
Spectrometry
+
Identify acids
Figure 6. Protocols for the isolation and characterization of lipid and acid
components in the incubation mixture.
30
Incubation Mixture
1. Extract Lipids (Figure 6)
2. Precipitate Proteins
Supernatant
Pellet (Precipitated Protein Fraction)
3. Dry pellet
4. Solubilize
5. Reduce volume
Aqueous Extract with Peptides
Soluble Peptide Fraction
6. Dialysis
4,
7. Gel Filtration
8. Ion Exchange
4,
9. HPLC
11. Paper and thin layer
chromatography
10. Membrane Filtration
10. Membrane Filtration
YCO5 Residue
YCO5 Residue
13. Thin layer chromatography
17. Thin layer chromatography
14. Paper chromatography
18. Acid Hydrolysis
15. Acid hydrolysis
19. Dabsyl-HPLC analysis
V 16. Dabsyl HPLC Analysis
20. Mass Spectrometry
(
V
Amino Acid Composition
Sequence Analysis
Amino acid composition
Figure 7. Protocols for characterization of peptides in both the soluble and
aqueous extract fractions.
31
volume of 10.5 ml. In larger incubations additional buffer was omitted. The
Erlenmeyer flasks were sealed with rubber stoppers; small incubations (10.5 ml total
volume) used 125 ml Erlenmeyer flasks while large incubations (60-120 ml total
volume) used 500 ml Erlenmeyer flasks. The amount of ATP in the incubation
mixtures was kept at the ratio of 16.7 imoles/5 ml supernatant. The flasks were
incubated for two hours and fifty minutes in a 37°C oscillating water bath. These
conditions had been established for optimal incorporation of mevalonate-2-14C into a
neutral lipid fraction. At the end of the incubation period, 50 ml of petroleum ether
(distilled at 30-60°C) was added and the incubation mixture was kept at -20°C until
further analysis. Initial time samples were obtained by rapidly freezing (0 to 15
minutes) the incubation mixture in a dry ice/acetone bath immediately after the
addition of mevalonate-2-14C, then adding petroleum ether and storing as before.
Large incubation mixtures for isolation of labeled fractions utilized the same
protocols, with amounts of label and ATP adjusted according to the volume of
supernatant used. Typically, 50 ml of the postmitochondrial fraction was used in a
preparative incubation. Two hundred mis of distilled petroleum ether were added to
preparative incubations containing 50 ml postmitochondrial supematant at the end of
the incubation period, or to frozen initial time samples as soon as freezing was
complete. The incubation mixtures were stored at -20°C immediately after addition
of the petroleum ether. Control samples contained no postmitochondrial
supernantant but contained equivalent amounts of 0.M phosphate buffer,
ATP, and mevalonic acid-2-14C, and were subjected to the same incubation,
extraction, and isolation procedures. The specific procedures for the isolation of
labeled fractions are explained in the following sections. An inactivated protein
control sample showed all added mevalonic acid-2-14C remained unchanged (data not
shown) throughout the incubation and isolation procedures.
32
Extraction of neutral lipids from the incubation mixture
Incubation mixtures were thawed and extracted with distilled (30-60°C)
petroleum ether (Figure 6, step 1). For analytical incubations, utilizing 5 ml of
postmitochondrial supernatant, a total of 200 ml petroleum ether was used; 50 ml
petroleum ether was added to the incubation mixture and the flask gently swirled for
10-20 seconds. The extract was decanted to a second flask containing 30 gms of
anhydrous sodium sulfate, and the extraction procedure repeated three more times,
combining the extracts from each flask. For preparative experiments, a total of 800
ml distilled petroleum ether was used for each incubation mixture and dried over 120
gm anhydrous sodium sulfate. The extracts were filtered through Whatman No.1
paper to a second flask along with petroleum ether washes of the sodium sulfate.
The petroleum ether was carefully evaporated on a steam bath for 45 minutes leaving
the neutral lipid fraction. The activity of each aorta preparation (crude homogenate)
was assessed by noting the amount of mevalonate-2-14C derived label in this fraction
by scintillation counting, using the toluene fluor. Different aorta preparations were
compared in this manner. The volume of the petroleum ether extract could also be
reduced by careful distillation below 55°C and the reduced volume extract stored at
200 C
until used for further analysis.
Extraction of the acid lipid fraction from the incubation mixture
The incubation mixture, after extraction of the neutral lipids, was acidified by
addition of the protein precipitant trichoroacetic acid or by adjusting the pH to 2 with
6 N HC1 (Figure 6, step 2). The acidified incubatjon mixture was then extracted with
distilled petroleum ether. The same protocol for extraction of the neutral lipids was
33
used for the extraction of the acid lipid fraction. After careful removal of the
petroleum ether on a steam bath, the residue remaining in the flask was taken up in
two ml of petroleum ether and stored at -20°C until used for further analysis.
Precipitation of protein from the incubation mixture
The protein fraction of the incubation mixture was isolated (Figure 7, step 2)
by adding cold 95 percent ethanol to a final concentration of 80 percent ethanol, then
allowing the mixture to stand at -20°C overnight. The mixture was centrifuged at
1500 x g in a GSA rotor in a Sorvall centrifuge with the chamber kept at 5°C. The
supernatant was carefully decanted and saved for the preparation of the aqueous
extract. The protein pellet was washed first with 95 percent ethanol and then 100
percent ethanol, centrifuging in Cortex tubes using a SS34 rotor at 5000 x g for 10
minutes with each wash The supernatants from these ethanol washes were saved
and combined with the original supernatant. The protein pellets were carefully dried,
weighed, and stored at -20°C. For the purposes of this study this protein is referred
to as precipitated protein fraction (Figure 7, steps 3,4).
In the initial stages of this study, proteins were precipitated by the addition of
10 percent (w/v) trichloroacetic acid (TCA) to a final concentration of 4.3 percent and
the protein pellet isolated by centrifugation as above. The TCA-precipitated pellets
were washed with water and 95 percent ethanol; the supernatants were combined
with the original supernatant. The protein pellet was dried, weighed and stored
frozen as above. Ethanol was chosen as the preferred precipitant over TCA because
the presence of TCA complicated subsequent analyses of the protein supernatant.
Ethanol, in contrast, can be easily removed by evaporation.
34
Preparation of the aqueous extract and the soluble proteins
The steps in the preparation and characterization of the aqueous extract are
shown in Figure 6 (steps 1, 3, 6-12). The aqueous fraction remaining after
precipitation of proteins is the combined supematant and ethanol washes of the
protein pellet. This combined fraction is taken to dryness under vacuum using a
rotary evaporator, and contains unreacted mevalonic acid as well as the soluble
components of the postmitochondrial fraction. This fraction is the dried aqueous
extract.
Several solvents were used to bring the dried aqueous extract into solution to
further characterized the labeled components: ethanol, ethyl acetate, water, and
glacial acetic acid. Glacial acetic acid proved to be the best solvent and was used on a
routine basis. For column chromatography, distilled, deionized water was used to
dissolve the sample. Once the material was in solution, it was referred to as the
aqueous extract.
For preparative experiments, employing 50 ml of postmitochondrial
supernatant, 10 ml of solvent was used to transfer the aqueous extract to test tubes
for freezer storage. Resolubilizing as well as freezing and thawing the aqueous
extract would occasionally result in some insoluble materials. Such material was
removed by brief centrifugation in a clinical centrifuge at room temperature as a
general protocol. These insoluble materials were not radioactively labeled as assayed
by scintillation counting.
The protocol for the isolation of the soluble peptides is included in Figure 7.
The protein precipitate from the incubation mixture was air dried, crushed to a fine
powder, and stored -20°C until used. The dried protein was solubilized in water
and any insoluble material was removed by centrifugation for 15 minutes at 5000 x g
in a Sorvall centrifuge. The temperature of the chamber was kept at 5°C.
Subsequent investigations of the precipitated proteins utilized only the supernatant
fraction from this step. This fraction is referred to as the soluble peptide fraction.
Typically, the dried, precipitated protein from a 50 ml of the postmitochondrial
supernatant was solubilized in 10 ml water.
The soluble peptide fraction was first dialyzed against water (Figure 7, step 6).
Spectrapor 6 dialysis tubing (Spectrum Medical Industries, Los Angeles, CA) with a
molecular weight cutoff of 2000 was used. The soluble protein fraction from a 50 ml
post mitochondrial supernatant incubation was dialyzed against one liter of water for
48 hours at 5°C. The dialysate was transferred and stored frozen. The dialysant,
outside the membrane, was reduced in volume on a rotary evaporator. The water
bath temperature for large aqueous samples was kept at 45-50°C during evaporation.
The material remaining after evaporation of the dialysant of the soluble protein
fraction is referred to as the soluble peptide fraction. In later experiments, sequential
filtration was employed using Amicon membranes (Amicon Corporation, Danvers,
MA) in place of the dialysis step for the soluble peptide fraction.
Determination of protein concentration
A modified Lowry method (115, 116) was routinely used to estimate the
amount of protein in samples. Bovine serum albumin (BSA) was used as the protein
standard, at a concentration of 0.5 mg/ml in water. The protein sample, standard (5
to 100 gm protein) or blank volume was 1.0 ml. One ml of reagent containing one
part of copper tartrate solution (0.1% copper sulfate, 0.2% potassium sodium
tartrate, and 10% sodium carbonate), one part 0.8 N sodium hydroxide, and two
parts water were added to the protein or blank sample. The samples were allowed to
36
stand at room temperature for ten minutes, then 0.5 ml of diluted (one part to five
parts water) Folin-Ciocalteau reagent (from Sigma Chemical Co., St. Louis, MO) is
added with rapid vortexing. The absorbance at 750 nm was read 30 minutes later.
The Bradford method of protein determination was also used (117) using
commercially available Bradford reagent (BioRad Laboratories, Inc., Richmond,
CA), and bovine serum albumin (stock solution (0.5 mg/mi in water) as a standard.
This method was used with the soluble proteins. The total volume of the protein
sample and the standard sample was 0.8 ml; water was used, if necessary, to bring
the final volume to 0.8 ml. The standard solutions contained 2 to 20 igm of protein,
and BSA was again used as the standard. The sample volume, containing either
standard (2 to 20 .tgm protein) or protein from arterial sources, was made up a final
volume of 0.8 ml with water; samples are then vortexed with 0.2 ml of the dye
reagent. The samples are read at 595 nm within one hour after addition of the dye.
The dye reagent is used without dilution and potentially interfering substances are
included in standard and blank solutions if they are present in the protein sample.
The ultraviolet absorbance at 260 and 280 nm of samples was determined with
the Hewlett Packard diode array spectrophotometer. This information was used to
monitor the spectral characteristics of fractions from colunm chromatography and
was not used to determine the quantity of protein.
Gel filtration chromatography
Bio-Gel P gels (BioRad Laboratories, Richmond, CA) were used as column
supports in liquid chromatography. This support consists of crosslinked
polyacrylamide beads which are defined in their ability to resolve particular
molecules within a specific molecular weight range or exclusion limit. In this study,
37
Bio-Gel P columns were used, as described below, to characterize the soluble
peptide fraction from the precipitated protein (Figure 7, step 7). Fractions from the
column were collected with a Pharmacia Model Frac- 100 fraction collector and were
approximately 6.5 ml in volume for all procedures. All glass columns were used in
the chromatographic steps, and chromatographic procedures were carried out at room
temperature. The column solid support was washed, prior to sample application,
with eluting buffer or water until there was no absorbance reading at 260 and 280 nm
in the eluant. Water used throughout this study was deionized and glass distilled
before use.
Bio-Gel P100 chromatography
A column bed of 28 cm x 2.5 cm was prepared with Bio-Gel beads using 0.1
M potassium phosphate buffer, pH 7.0, containing 0.006 M MgCl2. The protein
sample was dissolved in a small volume (two to three ml) of water and applied to the
column, followed by an equal volume of water. Elution was carried out with the
same phosphate buffer at a flow rate of 1.5 ml per minute. The absorbance at 260
and 280 nm was measured for each fraction, and aliquots of each fractions were
counted in Aquasol to measure the radioactivity present.
Bio-Gel P6 chromatography
The dimensions of the Bio-Gel P-6 column were 25.0 cm x 1.0 cm and the
beads were packed in 0.1 M potassium phosphate buffer, pH 7.0, containing 0.006
M MgCl2. The protein sample was dissolved in water and applied to the column
followed by an equal volume of water. The flow rate was 1.3 ml per minute. The
absorbance at 260 and 280 nm was determined for each fraction and aliquots were
taken from fractions to measure radioactivity by liquid scintillation counting in
Aquasol.
Bio-Gel P2 chromatography
A 33 cm x 1.5 cm Bio-Gel P-2 colunm was packed in water, and washed
with water until there was no absorbance at 260 and 280 nm in the eluent. Protein
samples were dissolved in two ml water for application to the column; this was
followed another two ml of water applied to the column. Elution continued with
water and the flow rate was set at 0.8 ml per minute. Radioactivity and ultraviolet
absorbance of each fraction were determined as described above.
Ion Exchange Chromatography
Anion exchange chromatography
Cellex E (Bio-Rad Laboratories) was used as the exchange media, packed
into 1 cm x 20 cm column (Figure 7, step 8). The column was washed with 1 M
LiC1 to remove contaminants, as monitored by ultraviolet absorbance at 260 and 280
nm, then with water to remove any residual LiC1. The sample, dissolved in two ml
water, was applied to the column followed with two ml water; the sample was at pH
7.0. The column was eluted using a linear gradient of 0 to 1 M LiC1, in a total
volume of 800 ml. A flow rate of one ml per minute was maintained. Aliquots of
fractions were counted in Aquasol to measure the radioactivity by means of liquid
scintillation counting; the absorbance at 280, 260, and 250 nm of each fraction was
determined.
39
Cation exchange chromatography
Bio-Rex-70 (Bio Rad Laboratories) was used as the cation exchange media in
a 1.3 cm x 20 cm column (Figure 7, step 8). LiC1 (1 M) was used to wash the
column until all ultraviolet absorbing materials were removed; water was then used to
remove residual LiCI. Proteins were dissolved in water and the sample (3.1 ml, at
pH 7.0) was applied to the column, followed by two mls water. A linear salt
gradient of 0 to 1 M LiC1, in a total volume of 800 mis, was used to elute the
column. Fractions (6.5 ml volume) were scanned for absorbance at 280, 260 and
250 nm and aliquots of each fraction were counted in Aquasol to measure
radioactivity by a liquid scintillation counter.
Membrane Filtration
Both the soluble protein fraction and the aqueous extract residues from the
preparative incubation mixtures were dissolved in 20 ml water for membrane
filtration purposes (Figure 7, steps 10, 12). This process was carried out stepwise
with each sample using an Amicon stirred cell apparatus (Model 543-70) and
nitrogen gas pressure at 60 psi.
The sample was first filtered through an Amicon YM1 membrane (Millipore
American Corporation, Bevelry, MA) with a molecular weight cutoff (MWCO) of
1000 daltons. After passage of the solution through the filter, the material remaining
on the filter (YM 1 residue) was saved by addition of small amounts (1-2 ml) of
water. Several washes were combined to remove all of the YM 1 residue. The
solution passing through the filter is referred to as the YM 1 filtrate. This filtrate was
subsequently passed through an Amicon YCO5 (500 MWCO) membrane to produce
the YCO5 residue and the YCO5 filtrate. The YCO5 residue was also transferred
with several ml of water. This solution was stored at -20°C when not in use. The
filtrate samples were reduced in volume as necessary with a rotary evaporator and
stored -20°C for subsequent investigations. Membrane filtration gave the same
separation results as prior experiments with column chromatography and dialysis,
and was used directly with either the soluble fraction or the aqueous extract.
Thin layer chromatography
Thin layer chromatography was used as both an analytical and preparative
procedure to separate components in both peptide and aqueous extracts (see Figures
6 and 7). Silica gel G ("Adsorbosil Plus 1"), containing a CaSO4 binder, were
obtained from Alltech Corporation (Deerfield, IL). Cellulose plates (Avicel, a
microcrystalline cellulose) were obtained from Analtech Corporation (Newark, DE).
All plates were 20 x 20 cm unless otherwise indicated. Samples were applied to the
plate using a glass syringe or disposable glass capillary tubes. The origin was set at
2.5 cm from the bottom of the plate. Sample solvent was removed during application
with a stream of warm air from a hair dryer.
Development of the thin layer plates was carried out in glass chambers lined
with Whatman #1 or #3 paper, sealed with plastic wrap, and covered with weighted
glass lids. Plates were supported during development by metal frames.
Development was allowed to continue until the solvent front reached a point 2.0 cm
below the top of the plate. The solvent was removed from the thin layer plates, after
development, in the air draft of the laboratory hood.
II
Thin layer chromatography of carboxvlic acids
The aqueous extract (Figure 6, steps 8, 10) was used as a source of water
soluble carboxylic acids. This extract was obtained from incubated or initial time
samples of postmitochondrial supernatant incubated with mevalonate-2-14C.
Silica
Gel G plates were used and plates were developed in an acid solvent, nbutanol/chlorofomi/acetic acid/water, 100/100/4/30 using the organic phase; or a
basic solvent, ethanol/concentrated ammonia/water, 160/20/20. Acids were detected
on the plate by spraying with a solution of 0.4% bromocresol green in ethanol at pH
7.0. Under these conditions acids appear as yellow spots on a blue background.
The sensitivity of this method of detection is one p.gm of sample. The thin layer
chromatography of standards is shown in Figures 8 in an acid solvent and in Figure
9 in a basic solvent.
Thin layer chromatography of amino acids and peptides
Silica Gel G plates were used in the separation of amino acids and peptides
(Figure 7, steps 13, 17). Plates were developed in n-butanol/acetic acid/water, 4/1/5,
using the upper, organic layer as the developing solvent. Amino acids and peptides
were detected by spraying the plate with a ninhydrin-cadmium reagent. This reagent
contains 0.2 percent ninhydrin dissolved in a solution containing 0.5 gm cadmium
chloride, 40 ml acetic acid, 50 mis water in a final volume of 500 ml acetone (118).
Colored spots appear after heating the plate in a 110°C oven for 10 minutes.
Ninhydrin sensitive materials appear as predominantly pink spots on a white
background. The sensitivity of this method is also one .tgm of material.
42
Figure 8. Thin layer chromatography of trans-methyiglutaconate shunt intermediates
in an acid solvent. The organic phase of the mixture of n-butanol/chloroform/acetic
acid/water (100/100/4/30) was used. Detection was with bromocresol green. Fifty
j.gms of each sample was applied: (A) B-hydroxy-B-methylglutaric acid, (B) fmethylgiutaconic acid, (C) p-hydroxybutyric acid, (D) acetoacetic acid, (E)
dimethylacrylic acid and (F) mixture of standards
Figure 9. Thin layer chromatography of the trans-methylgiutaconate shunt acids in a
basic solvent. The solvent used was ethanol/water/ammonia, 160/20/20 Fifty gms
of each acid was applied and detection was with bromocresol green: (A) B-hydroxyB-methylglutaric acid, (B) -methylglutaconic acid, (C) 3-hydroxybutyric acid, (D)
acetoacetic acid.
A
Figure 9
45
Thin layer chromatography of amino acids and peptides
Silica Gel G plates were used in the separation of amino acids and peptides
(Figure 7, steps 13, 17). Plates were developed in n-butanol/acetic acid/water, 4/1/5,
using the upper, organic layer as the developing solvent. Amino acids and peptides
were detected by spraying the plate with a ninhydrin-cadmium reagent. This reagent
contains 0.2 percent ninhydrin dissolved in a solution containing 0.5 gm cadmium
chloride, 40 ml acetic acid, 50 mIs water in a final volume of 500 ml acetone (118).
Colored spots appear after heating the plate in a 110°C oven for 10 minutes.
Ninhydrin sensitive materials appear as predominantly pink spots on a white
background. The sensitivity of this method is also one .tgm of material.
Preparative thin layer chromatography
Preparative thin layer chromatography (Figure 7, step 13) was used to
separate the peptide components of the aqueous extract that were obtained by
membrane filtration, so that quantities of peptide sufficient for further analysis could
be obtained.
The YCO5 residue was used as the sample. Samples for preparative
separation by thin layer chromatography are applied as a 0.5 cm wide, 15 cm streak
at the origin. The origin band was located 2.5 cm from the bottom of the plate. Up
to 1.2 mg of protein were applied to a single plate; development was the same as
described for analytical procedures. An aliquot of the preparative sample was run on
the same plate for detection purposes so that the material in this lane could be sprayed
with ninhydrin and the resultant color development could be used as a guide in
selecting the preparative band. Bands of interest were removed by scraping the silica
from the plate into glass funnels lined with Whatman #1 fluted filter paper. The
elution solvent was then added dropwise to the silica to remove the target sample.
47
The eluting solvent was removed either by evaporation (rotary evaporator) or under a
stream of nitrogen gas. Several solvents or a combination of solvents were
employed in the elution of material from silica but experience with these solvents
demonstrated that glacial acetic acid was the solvent of choice for the first elution of
chromatographed components. The silica was then eluted with a mixture of tertiary
amyl alcohol and 12 N HCI in a ratio of 15:1. The amount of each solvent used was
4.0 ml for the each band removed from the preparative plate.
Paper chromatography
General procedures
Paper chromatography was utilized to isolate components of various fractions
and to separate and identify amino acids, carboxylic acids, and nucleotides(Figure 6,
steps 7, 10; Figure 7, steps 11, 13). Whatman No. 1 paper was routinely used in
analytical separations and Whatman No. 3 paper was used in preparative
experiments. In procedures using descending solvent migration, the mobile phase
was then placed in the glass trough which was mounted at the top of a
chromatography chamber. The trough was held in place by a glass ledge in the
chamber itself or by an apparatus within the chamber. The paper chromatogram was
weighted in the glass trough with a glass rod before the addition of the mobile phase.
After sealing the jar with plastic wrap and a weighted glass cover, development
proceeded until the solvent migrated to a point within 2.5 cm below the top edge of
the paper. In ascending solvent techniques the mobile phase was placed directly in
the bottom of glass jars or in a glass tray, and chromatograms paced upright in the
solvent. Sewing the vertical edges together with cotton thread or stapling the edges
together (in non-acid solvents) allowed construction of cylinders that provided for
solvent migration without the need for support apparatus. Analytical and preparative
samples were applied as described for thin layer chromatography. The mobile phase
on paper chromatograms was removed by placing the chromatograms in the air draft
of the laboratory hood; this would generally remove all the developing solvent.
Amino acids and carboxylic acids were detected by spraying with ninhydrin or
bromocresol green, respectively, as described for thin layer chromatography (page
36).
Components in both paper and thin layer chromatography could be
characterized and compared by computing their Rf value on a particular
chromatogram. The Rf value is the ratio of the distance (measured from the origin to
the center of the particular spot) a component has migrated compared to the distance
(also measured from the origin) to which solvent has migrated (the solvent front).
The use of Rf values from several different systems and techniques allowed for the
deduction of the identity of the component of interest.
Paper chromatography of organic acids
Sheets of Whatman No. 1, 21 x50 cm, were used in a descending technique,
with n-butanollisobutanollwater/90 percent formic acid, 30/60/90/30 (organic layer)
as the solvent. Bromocresol green (0.04 per cent in ethanol) was used as the
detection agent for these chromatograms. A second solvent system (119), n-butanol
saturated with 1.5 N NH4OH, was used in ascending chromatography. Papers run
in this second solvent system were sprayed with 0.04 percent bromocresol purple
after exposure to an atmosphere saturated with a 3 percent solution of ammonia.
Chromatograms of standard acids are shown in Figures 10 in the acid solvent and in
Figure 11 in a basic solvent.
Paper chromatography of amino acids and peptides
For separation and identification of component amino acids in peptides, two
dimensional protocols were used. In one approach (120) a sample of hydrolyzed
peptide was applied to one corner of a 23x50 cm sheet of Whatman No. 1 paper.
Development (descending) in the first direction was done with water-saturated phenol
in the presence of 0.3 percent ammonia. The chromatogram is prepared on
Whatman No. 1 paper. Development (descending) in the first direction was done
with water-saturated phenol in the presence of 0.3 percent ammonia. The
chromatogram is then rotated 9Ø0 so that the chromatogram can be developed in the
second direction in the ascending mode. The solvent used in the second direction
was n-butanol/acetic acid/water, 4/1/5, using the organic phase. In later
experiments, a second two-dimensional solvent system was used.
The second method for two dimensional separation of amino acids is that of
Redfield (121),. Both directions were done in the ascending mode. For the first
dimension, a mixture of methanol/water/pyridine, 60/20/20 was used and
development was continued for 14 hours. After drying, the chromatogram is again
rotated 90° and developed in n-propanollwater/diethylamine, 85/15/3 for 14 hours.
The chromatograms were dried thoroughly before spraying. Figure 12 shows the
chromatography of amino acid standards by this method.
\O
.t.s
0c'
c'
c1
'.
.-'
0'
C
TI
52
Figure 11. Paper chromatography of trans-methylglutaconic standard acids in a basic
solvent. The solvent was n-butanol saturated with 1.5 N NH4OH. Left to right, the
samples are: (A) B-hydroxy-B-methylglutaric acid, (B) B-methylglutaconic acid, (C)
13-hydroxybutryic acid, (D) sodium acetoacetate, (E) dimethylacrylic acid.
uJ
p
bO
54
Figure 12. Two dimensional paper chromatography of amino acid standards.
Identity of each standard is noted on the figure. The order and direction of each
solvent is also noted in the figure by arrows. Solvent I was methanol/water/pyridine,
60/20/20, and Solvent II was n-propanol/water/diethylamine, 85/15/3. Arrow
denotes origin
Methionine sult'oxide
Alanine
Gycine
Serine
I utarnate
Aspartate
Cysteic acid
.41 )rigin
Solvent II
Figure 12
56
Preparative isolation of peptides
Paper chromatography was used to separate the radioactively labeled peptides
on a preparative basis. The fraction from membrane filtration was streaked as a thin
band 7 cm from the bottom edge of a 23x50 cm sheet of Whatman No. 3 paper. A
small aliquot of the preparative sample was also applied as marker sample, and
development by descending technique with water saturated phenol as the mobile
phase continued for 18 hours. The marker band was sprayed with ninhydrin as
previously described and the position of radioactivity labeled components was
determined with the Bioscan imaging scanner.
Bands of interest on preparative paper chromatograms were cut out of the
paper using the ninhydrin response or location of radioactivity as a guide. These
bands were further cut into 5 mm squares and placed in a 250 ml Erlenmeyer flask.
The component(s) of the band were eluted with water or glacial acetic acid. This
extraction procedure was epeated four times to insure removal of desired material.
repeated four times to insure removal of desired material. The combined extracts for
each band were reduced in volume on a rotary evaporator and stored at -20°C when
not in use.
Performic Acid Oxidation of Peptides
Acid hydrolysis (see below) is a conventional method to hydrolyze peptides
into the component amino acids of the selected peptide. Since cysteine and cystine
are destroyed during acid hydrolysis procedures, it is necessary to convert these
amino acids to a stable residue before hydrolysis. Treatment with performic acid will
convert cysteine and any disulfide bonds to cysteic acid residues prior to acid
57
hydrolysis procedures. In this research a vapor phase method (122) was used to
oxidize any cysteine or cystine residues to cysteic acid residues. The target peptide
was dissolved in water or glacial acetic acid if not already in solution. The peptide
solution was transferred to a 10 x 75 mm test tube which had been previously rinsed
with concentrated nitric acid and pyrolyzed to remove any residual materials. The
solvent in the tube was then removed using a stream of nitrogen gas.
The tube was
then stabilized in an upright position in a small beaker and the beaker placed in a
glass or plastic dessicator. A mixture of 20 ml 98 percent formic acid and one ml 50
percent hydrogen peroxide was prepared and immediately transferred to a clean glass
petri dish in a glass desiccator along with the dry sample tubes. The desiccator was
sealed by vacuum and peroxidation continued overnight at room temperature. The
petri dish was then removed from the desicator and the sample tubes placed under
vacuum for 30 mm to remove any residual vapors, and to remove any condensation
in the tubes. The peptide sample was then ready for any further investigation.
Acid hydrolysis of peptides
Peptides that were isolated from both the soluble peptide fraction (Figure 7)
and the aqueous extract (Figure 6) were analyzed by vapor phase hydrolysis with 6
N HCI (123). This procedure will provide information about the component amino
acids of the peptide in question. If necessary, the peptide was first dissolved in
water or glacial acetic acid and a suitable aliquot transferred to a clean 10 x 75 mm
test tube and brought to dryness under a stream of nitrogen gas. As a general rule,
at least 10 J.tgms of protein, as assayed by the Lowry method, was transferred for
analysis. The tube containing the dried peptide sample was placed in an all glass
vacuum desicator along with a separate beaker containing 5.0 ml of 6 N HC1. The
desicator is evacuated for 15 minutes prior to placing in a 110°C oven overnight (12
to 14 hours). At the end of this time period the desicator is removed from the oven
and the tubes transferred to a second desicator to be dried for approximately 30
minutes under vacuum. The dried tubes containing the hydrolyzed peptide sample
are covered with parafilm and stored at -20°C until further use. The hydrolyzed
peptide was then ready for analysis by paper chromatography or dabsyl HPLC
methods (see below).
High Performance Liquid Chromatography
High performance liquid chromatography (HPLC) was used to purify peptides
from the soluble protein fraction and to identify amino acid derivatives. An Isco
Model 2360 gradient programmer and an LKB 2150 HPLC pump system were used
in conjunction with an Isco V4 variable wavelength detector and a Beckman 163
variable wavelength detector. For purification of the peptide(s) by HPLC, the
sample was injected and the detector response used as a guide to switch the flow of
effluent to collection tubes. For peptide purification purposes, one detector was set
at 280 nm and the second detector at 214 nm. Dabsyl derivatives were monitored at
460 nm. Solvents and gradients used are described in the results section.
For purification of peptides a Vydac reversed phase (modified with C 18
groups, octadecylsilane) column of dimensions 4 x 250 mm was used. For dabsyl
amino acids a Phenomenex Ultracarb 5 ODS (octadecylsilane) colunm (4.6 x 250
mm) was employed. Quantitation of amino acids was done by comparison of
chromatograms of amino acid standards run the same day. Areas under the standard
peaks were compared to peaks identified in samples according to their retention time
and appearance on the chromatogram.
59
Preparation of Dabsyl derivatives of amino acids
Dabsyl amino acid derivatives were prepared according to Malencik (124) as
described below. For compansion with results of analyzed peptides, an amino acid
standard mixture (Sigma Chemical Company, number AA-S-18) was used. This
procedure allowed for identification and quantitation of amino acids in the peptide
being analyzed. When peptides were hydrolyzed, an amino acid standard was also
hydrolyzed under identical performic acid or vapor phase HC1 hydrolysis
conditions; as before, glass tubes for hydrolysis were prewashed with concentrated
nitric acid and pyrolyzed in a glass cleaning oven for 3 hours before use. Amino
acid standards were prepared so that 20
.tl
of the final solution contained 400
picomoles of each dabsylated amino acid.
Derivatives of amino acids were prepared using 4-dimethylaminoazobenzene-
4-sulfonyl chloride (Dabsyl-Ci, from Sigma Chemical Co., St. Louis, MO) as the
derivatizing agent. The strong absorbance of Dabsyl-derivatized amino acids at 460
nm allow for the sensitivity of this method to be in the nanogram (of protein) range
(125). For this work, at least 10 j.igm of peptide to be analyzed was hydrolyzed
first. In some cases the peptide was also treated with performic oxidation (see
above) before acid hydrolysis. The hydrolyzed peptide samples were dried under
vacuum after vapor phase HC1 hydrolysis.
A blank tube was included in the
hydrolysis experiment for background detenninations. To each sample tube was
added 50 il of buffer containing two parts 20% sodium carbonate and seven parts
200 mM boric acid (v/v). Next, 100 pi of freshly prepared Dabsyl-Cl solution (5.2
mg/4m1 acetonitrile) was added with vortexing. Tubes were then covered with
parafilm and placed in a 60°C heating block for 10 minutes. A solution of equal
parts ethanol and 0.1 M sodium phosphate buffer (pH 7.0) was then prepared and
350 .t1 of this mixture was added to each tube with more vortexing. The derivatized
amino acids were then ready for HPLC analysis. Dabsylated amino acids were
covered and stored at -20°C when not in use.
Mass spectrometry of soluble peptides
The development of mass spectroscopy (MS) application in biochemistry has
resulted in the introduction of various techniques for use in characterizing
biomolecules, especially proteins and peptides. The soluble protein fraction was
used as a source of peptides for analysis in this study. A brief overview of the
methods used in this work follows. For a more complete discussion of methods and
theory see (129).
Matrix assisted laser desorption ionization mass spectrometry (MALDI-MS)
utilized a laser beam directed onto a sample that is suspended or dissolved in a
matrix. In mass spectrometry the analyte or sample must be volatilized.
In this
work, the sample is a peptide or group of peptides isolated from the soluble peptide
fraction (see Figure 7). The matrix is selected on the basis of its ability to absorb the
laser radiation energy. Ionization and volatilization occurs by absorption of the laser
radiation by the matrix. When this happens, both sample and matrix with are
volatilized. The now volatilized and ionized sample is directed to a time-of-flight
(TOF) mass spectrometer for analysis.
Matrices used in this study were 2-5-dihydroxybenzoic acid (DHA) or a-
cyano-4-hydroxycinnamic acid (CCA). The peptide sample used for analysis was
dissolved in 0.1 percent trifluoracetic acid. A solution of the sample was then
61
overlaid on the matrix sample prior to laser irradiation. Mass spectra were produced
by irradiating the sample with a 337 nm laser; the ion source was set at 21 kv.
Electrospray ionization (ESI) was used both alone and in conjunction with
liquid chromatography (LC). This technique uses methodology to produce analyte
ions from a solution of the analyte. The sample solution is introduced into a heated
vacuum chamber from an ion spray needle maintained at high voltage. The resulting
charged droplets are introduced to a nebulizer gas and heated to strip solvent ions
from the analyte ions. These analyte ions are then directed to a mass analyzer (by
TOF) by electrostatic forces. With ESI used alone, without chromatography, the
analyte solution is injected directly into the sample chamber and subjected to TOF
analysis and subsequent tandem mass spectrometry.
With liquid chromatography mass spectrometry (LCMS) the sample solution is
chromatographed on a 5
reversed phase column (C 18, octadecyl silane), 1 mm x
100 mm. The liquid chromatography (LC) instrumentation consisted of a PerkinElmer ABI 140B pump system, Rheodyne 8125 injector and a 5 jii sample ioop.
Flow rate was set at 40 pilminute; a 15-minute gradient program running from 5 to
95 percent acetonitrile in water was used to elute the peptides. The effluent from the
column, containing the sample of interest, became the sample for electrospray
ionization. Tandem mass spectrometry was used to take the selected peak and
subject it to secondary fragmentation, from which a sequence of the peptide could be
deduced.
The potential of the ion spray needle was placed at 5000 +4700 V to produce
positive ions and -4500 volts for negative ions. The potential of the orifice to
introduce ions to the mass analyzer was set to 80 volts. The nebulizer gas (air) was
set at 42 psi, and a nitrogen curtain gas over the opening to the mass spectrometer
was set at 0.6 liters/minute.
62
The samples were run on a Perkin Elmer Sciex API ifi plus triple quadropole
Ionspray mass spectrometer (Ontario, Canada). The vacuum in the quadropole
sector is maintained at a lO ton vacuum with no sample and lO vacuum with a
150 ns/1.8 kv delay.
molecules/cm2
In these experiments the collision gas was set to 230 x
and the collision energy was adjusted to 25 volts.
1012
63
EXPERIMENTAL RESULTS
In this section, experiments are described, which were carried out in a
concerted fashion, exploring the pathways of mevalonate metabolism in a post
mitochondrial preparation of normal bovine aorta.
These processes impact the
development of the atherosclerotic plaque, and except for exploration of the
biosynthesis of cholesterol, have received little attention in the search for the
etiological patterns of atherosclerosis in normal vascular tissue.
Incubation of the postmitochondrial supernatant
Mevalonate-2-'4C (0.5 p.ci) was incubated with 50 ml of the postmitochondrial
supernatant. The amount of radioactivity in the neutral, soluble protein, acid
petroleum ether, and aqueous extract fractions was determined. The results are
summarized in Table 1. Control experiments when postmitochondrial supernatant
was omitted demonstrated that no label is incorporated into the petroleum ether
extract. All mevalonic acid-2-14C remained, unchanged, with the aqueous extract in
the control samples.
While both ethanol and trichloroacetic acid were used as protein precipitants, no
differences in the subsequent results were observed. In a separate experiment, when
inactive postmitochondrial supematant was incubated with adenosine triphosphate
(ATP) and mevalonate-2-'4C, there was no incorporation of radioactive label into
the subsequently isolated components of various fractions. The added mevalonate-2was recovered completely in the aqueous extract and thin layer chromatography
established that the labeled material was not changed(results not shown). This result
was consistent throughout the experimental work, so that only exposure of
Table 1. Distribution of radioactivity from mevalonate-2-'4C. The fractions were
obtained from initial time (0 to 15 minutes) or incubated (two hours and fifty-five
minutes) postmitochondrial supematant incubated with 0.5 ici (1.11x 10⁶ dpm)
mevalonate-2- 14C
Counts per minute
Sample
Neutral Fraction
Soluble Protein
Initial time
--
1.27x10⁴
Incubated'
6.3x10⁴± 771
1.74x10⁴± 513
Buffer control2
I
2
n=3 samples, standard deviation
n=2, both values listed
Acid Ext.
Aqueous
6.3x10⁵
1497±20
6.93x10⁵
± 1.8x10⁶
7.1x10⁵,
8. 3x 1 05
65
mevalonate-2-14C to the viable postmitochondrial supernatant resulted in changes in
the starting material.
Characterization of the neutral lipid fraction
The neutral fraction has been shown (78) to contain acyl glycerols (primarily
diacyiglycerols) with the greatest radioactivity incorporated into the medium chain n-
fatty acids containing eight (caprylic acid) or ten (capric acid) carbons.
During the initial studies on the incorporation of radiolabel into the neutral lipid
fractions, it was observed that considerable variability occurred in the amount of
radioactivity incorporated into the neutral fraction for identical incubation mixtures.
The variability was caused by the loss of volatile unidentified components in the
neutral lipid fraction. Standardizing the conditions of evaporation removed the
variability of amount of incorporated label observed in the neutral fraction. The
volatility of the labeled material is observed when aliquots of a neutral lipid petroleum
ether extract were counted under several conditions: (1) without removal of the
petroleum ether (2) evaporation of the petroleum ether from an aliquot and counted
immediately and (3) evaporation of the extract and allowing the residue to stand open
at room temperature overnight. The incubation mixture in this experiment contained
five ml of postmitochondrial supernatant and 0.5 pci of mevalonate-2-'4C. The
results are summarized in Table 2. It appears that approximately 17 percent of the
label is lost when open to the air.
Table 2. Volatility of the radioactively labeled components in the neutral extract.
Aliquots of the neutral extract were either dried on steam bath or allowed to air dry
overnight. Amounts were corrected to express total sample radioactivity. Values
were compared to the petroleum ether extract that was not dried.
Counts perminute
Sample
Petroleum Ether Extract*
Steam Bath
Air dry overnight
Initial time (n=2)
377±117
384±118
292±127
Incubated (n=4)
6202±137
6072±178
5074±509
Control
-0-
*petroleum ether counted without evaporation of solvent.
-0-
67
The acid petroleum ether extract
A second petroleum extract, the acidified petroleum ether extract, was also
characterized. The postmitochondrial supematant, after incubation with mevalonate-
2-'C, was acidified with trichloroacetic acid used to precipitate the protein. When
ethanol was used to precipitate the protein, 6 N HC1 was used to adjust the pH to 2.
Petroleum ether was used to extract the acidified layer and treated in the same manner
as the neutral lipid extract to assess for incorporated radioactivity. Table 1 shows
the results of the acid extraction procedure. In the control and initial time samples
there was no radioactivity observed in the acid petroleum ether extract.
Thin layer chromatography of the acid petroleum ether extract
The nature of the labeled component in the acid petroleum ether fraction was
studied using both thin layer and paper chromatography. The sample for thin layer
chromatography was dissolved in ethanol and chromatographed in an acid nbutanollchloroform/acetic acid/water, 100/100/4/30, using the organic layer) solvent.
The radiochromatogram is shown in Figure
13,
with the label migrating near the
solvent front with Rf of 0.95. The labeled area on the plate was removed, extracted
and re-chromatographed in a basic (ethanol/ammonia/water, 60/20/20) solvent, and
the radiochromatogram of the thin layer plate is shown in Figure 14. In the basic
solvent, the radioactive material now appears as a sharp band at the origin and a
second, more diffuse band, Rf of 0.45. For comparison, mevalonic acid-2-'4C
standard is shown in Figures 15 (acid solvent) and 16 (basic solvent). Figure 17
shows a blank scan to illustrate background noise. The detector response in all the
radiochromatograms shown in this report is dependent upon the total amount of label
detected by the instrument. Therefore, with more highly labeled samples, little
___________
-.
--
-
Pt
Ill
Cl,
0
?)
2
Cl,
0
1
Ii
t
C.)
-
I'll
'Ill
"I
I
-
U
-F--- -L
Centimeters
Figure 13. Radiochromatographic scan of thin layer chromatography of the acid
petroleum extract in an acid solvent. Origin and solvent front are marked with
arrows. The bottom scale represents centimeters along the edge of the plate.
The data presented show the location of the radioactivity after thin layer
chromatography of the sample. The solvent is water saturated nbutanol/chloroform/acetic acid, 100/100/4.
0
Cl)
0
enumeters
Figure 14. Radiochromatographic scan of thin layer chromatography of the acid
petroleum extract in a basic solvent. Origin and solvent front are marked with
arrows. The bottom scale represents centimeters along the edge of the plate.
The data presented show the location of the radioactivity after thin layer
chromatography of the sample. The solvent is ethanollammonialwater/
60/20/20.
a)
CO
0
C,)
0
0
a)
-a
a)
1
Centimeters
Figure 15. Radiochromatographic scan of thin layer chromatography of standard
mevalonic acid-2-'4C in an acid solvent. Arrows mark the origin and the solvent front.
The bottom scale represents centimeters along the edge of the plate. The data show the
location of radioactivity on the thin layer plate in the sample lane. The solvent is
butanol/chioroform/acetic acid/water, 100/100/4/30.
zIJ
1"l
0
a)
CO
0
0
L
t.
-
-
II
CO
Ii
I
0
U
a)
I..
0
1
-I
4-a
a)
r
0
Centimeters
Figure 16. Racliochromatographic scan of thin layer chromatography of standard
mevalonic acid-2-14C in a basic solvent. Arrows mark the origin and the solvent front.
The bottom scale represents centimeters along the edge of the plate. The data show the
location of radioactivity on the thin layer plate in the sample lane. The solvent is
ethanol/ammonia/water, 60/20/20
2
I
Centimeters
Figure 17. Radiochromatographic scan of a thin layer chromatograph with no
radioactivity in the sample lane (background scan). The arrows mark the origin and the
solvent front, while the bottom scale is measured in centimeters. The data represent the
scan observed when no radioactive label is present on the thin layer plate.
73
background noise is detected on these chromatograms. The acid petroleum ether
extract changes chromatographic behavior, depending on the acidity of the solvent.
The mobility of the label in an acid solvent (Figure 13) suggests a protonated, less
polar form of an acid compound. The behavior in basic solvent suggests more than
one component.
Paper chromatography of the acid petroleum ether extract
Paper chromatography of the acid petroleum ether extract was carried out in
three chromatograms. In the first, the extract was chromatographed in a system that
separates short and medium chain carboxylic acids. The solvent was n-butanol
saturated with 3 N ammonia; and the paper was run in the ascending mode.
Detection was with bromocresol green and the RI values of the standards and the acid
extract are summarized in Table 3.
The same solvent was used in the second chromatographic analysis and the
migration of the labeled acid petroleum ether extract was compared to longer chain
acids;
C12
(lauric),
C14
(myristic),
C16
(palmitic), C181 (oleic) and C18.2 (linoleic).
All of these acids migrated to a distance with Rf of 0.75 while the radioactivity
migrated to a distance of Rf of 0.87.
A third paper chromatogram, also run in n-butanol saturated with 3N ammonia,
used dimethylacrylic acid as the sample in amounts of 1 .tgm to 1 mg. This acid was
selected because of its participation in the trans-methylglutaconic shunt and its
migration behavior on both thin layer and paper chromatograms. The Rf of
dimethylacrylic acid is 0.40 in amounts to 250 j.tgm; larger quantities migrate more
slowly and exhibit excessive tailing. The radiochromatographic scan of this sample
on the paper chromatogram (not shown) indicated a single radioactive spot with an Rf
74
Table 3. RI values for medium chain acids and the acid petroleum ether extract with
paper chromatography. The solvent was n-butanol saturated with 3N ammonia. 50
pgm of each standard was used and standards were run separately. Rf was
calculated as noted for each detection method. For mevalonate-2-'4C standard, 2000
cpm were applied. For the acid petroleum ether extract, 500 cpm were applied.
Sample
Rf
(bromocresol green)
RI (radioactivity)
Butyric acid (C4)
0.29
Caproic acid (C6)
0.53
--
Caprylic acid (C8)
0.64
--
Capric acid (C10)
0.67
Mevalonic acid
--
0.17
Acid petroleum ether extract
--
0.83
75
of 0.83, which was also coincident the acid component detected with bromocresol
green. Thus the component(s) of the acid lipid extract was not dimethylacyrlic acid
or an n-chain monocarboxylic acid containing from two to 18 carbons; it also did not
appear to be a hydrocarbon-like compound. The acid component(s) were not further
characterized.
The trans-methyiglutaconate shunt
As part of the concerted effort to identify the mevalonate-related pathways in
arterial tissue, investigations were directed toward developing methods which would
permit the isolation of intermediates of the trans-methylglutaconate shunt, and
subsequent identification of any label incorporated from mevalonate-2-'4C.
Isolation
of a fraction containing small soluble componentsas the shunt intermediateswas
achieved with the precipitation of proteins from the postmitochondrial supernatant
after petioleum ether extraction of both neutral and acid lipids. The supernatant and
pellet washes remaining after centrifugation were combined and reduced in volume
to obtain the aqueous extract.
Isolation of a fraction containing small soluble componentsas the shunt
intermediateswas achieved with the precipitation of proteins from the
postmitochondnal supematant after petroleum ether extraction of both neutral and
acid lipids. The supernatant and pellet washes remaining after centrifugation were
combined and reduced in volume to obtain remove any remaining mevalonate-2-
C. The isolation protocols are diagrammed in Figure 6.
76
Silica gel column chromatography
The aqueous extract was subjected to silica gel column chromatography to
analyze for the presence of intermediates of the trans-methyl glutaconate shunt. The
sample for chromatography was a portion of the incubated aqueous extract of post
mitochondrial supernatant; chromatography was carried out as described in the
methods section. The elution of known acids of the trans-methylglutaconic shunt
was determined by chromatography of standards on the column, prior to running the
aqueous extract. The location of fractions containing the standard acids was
determined by titration with standardized base, according to the method of Gamble et
al. (133). Selected fractions were pooled, dried, and the residues used as samples in
paper chromatography. Fractions 3-5 contained dimethylacrylic acid; fractions 6-9
contained 3-methyl-13-glutaconic acid; fractions 31-34 contained -hydroxybutyric
acid; and fractions 35-39 contained both mevalonic acid and B-hydroxy-B-
methylglutaric acid. These findings were confirmed by mass spectrometry (not
shown). It was necessary to run the standards on the column so that components
from subsequent samples could be identified by a combination of chromatographic
techniques and mass spectrometry.
The silica gel elution profile for standard mevalonic acid is shown in Figure
18. It can be seen that the mevalonate appears starting at fraction 33 and that the bulk
of the radioactivity is eluted in this peak. A sample of aqueous extract was applied to
a second silica gel column and chromatographed under standard conditions. The
column profile is shown in Figure 19. The bulk of the radioactivity eluted between
fractions 24 and 48. Two peaks were resolved at the beginning of the elution profile,
6001
500(
400(
,2000
2000
1000
0
0 2 4 6 8 10121416182022242628303234363840424446485Q5254565860
FRACTION NUMBER
Figure 18. Silica gel column chromatography of mevalonic acid-2-14C. The column
profile compares fraction number and radioactivity in each fraction. The column was
eluted with a gradient of t-amyl alcohol in chloroform.
3000-i
200(
10CC
Soc
3CC
0
2CC
175
150
125
100
75
50
25
0
0 2 4 6 8 1012141618202224262830323436384042444548505254565560
FRACTION NUMBER
Figure 19. Silica gel column chromatography of the aqueous extract. The column profile
compares fraction number and radioactivity in each fraction. The column was eluted
with a gradient of t-amyl alcohol in chloroform.
79
coincident with the elution of dimethylacrylic acid and -methy1-13-g1utaconic acid,
respectively.
Fractions 3 1-33 contained hydroxybutyric acid and fractions 34-35
contained B-hydroxy-B-methylglutaric acid, as confirmed by mass spectrometry,
giving evidence that these acids are intermediates in the trans-methyiglutaconate
shunt, and that the shunt is active in vascular tissue. The fractions corresponding to
the known standards from the column chromatogram shown in Figure 19 were also
identified by paper chromatography (see below). These findings again confirmed
the earlier identification of these acids in the trans-methylgiutaconate shunt. This is
the first observation, to our knowledge, in any tissue, of the existence of these acids
as shunt intermediates.
Paper chromatography of silica gel chromatography fractions
The identification of the labeled components in the aqueous extract that were
separated by silica gel column chromatography was pursued by combining the
column fractions of interest and subjecting them to paper chromatography. The
fractions were combined on the basis of the column chromatographic behavior of the
known shunt acids, and excess solvent removed by evaporation. The residue from
each set of combined fractions was subjected to paper chromatography in ethanoll7.5
N-ammonium hydroxide/water, 80/10/10. The results of chromatography of the
trans-methylglutaconic shunt standards was used as a guide (Methods section, Figure
9) for removal of bands on the paper. The bands were cut out and counted. While
the majority of radioactivity eluted with the bands was associated with mevalonic
acid and B-hydroxybutyric acid, there was label present in the dimethylacrylic acid,
and 13-methylgiutaconic acid, confirming the results observed from Figure 19 and
mass spectrometry.
1i
Thin layer chromatography of the trans-methylglutaconate intermediates
The separation of trans methylgiutoconate shunt acid standards by thin layer
chromatography is shown in Figures 6 and 7 in the Methods section. Since these
thin layer chromatography protocols had been developed to separate the shunt
intermediates, this method was used to characterize the acid components of aqueous
extract. The radiochromatogram is shown in Figure 20. There is radioactivity
observed in components with Rf values equal to 3-hydroxy-B-methyIg1utaric acid,
dimethylacrylic acid, and 3-methylglutaconic acid in addition to mevalonic acid. In a
second experiment, the bands on the thin layer plate were selected according to the
mobility of the trans-methylglutaconic standard acids in acid solvent. The silica
bands were removed and counted and the results are summarized in Table 4. The
results indicate that radioactivity from mevalonate-2-14C appears in 13-hydroxy-fi-
methylglutaric acid, dimethylacrylic acid, and 3-methylglutaconic acid, while any
radioactivity in B-hydroxybutryic acid remained associated with mevalonic acid.
Determination of alcohol dehydrogenase activity in the postmitochondrial supernatant
Dimethylallyl alcohol is oxidized to dimethylacrylic acid in the proposed trans-
methylgiutoconate shunt, implying alcohol dehydrogenase participation. In this
proposed pathway (Figure 4) dimethylallyl pyrophosphate is first hydrolyzed to
dimethylallyl alcohol. Two oxidative steps convert this substrate first to
dimethylallyl aldehyde (shown as 3-methylcrotonaldehyde in Figure 4) and next to
dimethylacrylic acid. Therefore, alcohol dehydrogenase activity in the
postmitochondrial supernatant was assayed using dimethylallyl alcohol, isopentenol
and ethanol as substrates. For this assay, 0.1 ml of postmitochondrial supernatant
was used, containing 0.7 mg protein. The results, summarized in Table 5, show that
a)
rI,
0
C,,
r''
2
0
d
4-..
C-.)
a)
a)
I)
'1
1 l
I
i\t
'I
S#AILi.tJ.J.#L¼IJ. .
Figure 20. Radiochromatographic scan showing separation of the transmethylgiutaconate shunt intermediates in the aqueous extract by thin layer
chromatography. The data show the location of radioactivity in the sample lane of the
plate. Unlabeled arrows indicate, from left to right, the migration of 13-hydroxy-3methylgiutaric acid, f3-hydroxymethylglutaconic acid, 3-hydroxybutyric acid, mevalonic
acid, and dimethylacrylic acid. The solvent was the organic phase of nbutanol/chloroform/acetic acid/water, 100/100/4/30.
00
Table 4. Thin layer chromatography of the trans-methylglutaconate shunt acids.
Bands were removed according to RI values and counted by scintillation counting.
The solvent wasn-butanol/chloroform/acetic acid, 100/100/4
Compound
CPM ± Std. Dev.
Unidentified
0.0
900 ± 132
3-hydroxy -methy1 glutaric acid
0.11
905 ± 34
Unidentified
0.29
3305 ± 228
3-methy1glutaconic acid
0.48
247 ± 14
f3-hydroxy butyric acid, mevalonic lactone
0.60
2528 ± 160
Unidentified
0.74
447 ± 89
Dimethyl acrylic acid
0.85
315 ± 95
Unidentified
0.95
159±57
Table 5. Alcohol dehydrogenase activity in the postmitochondrial supernatant.
Alcohols were assayed for alcohol dehydrogenase activity in two concentrations.
Substrate
Isopentenol
Dimethylallyl alcohol
Ethanol
1
p.moles formed/minute, n=3.
Concentration iM
NADH'
198
18.3 ± 1.6
36.3 ± 1.8
396
198
23.4 ± 1.5
30.4 ± 1.4
198
10.0 ± 3.7
396
396
9.5±1.4
the least activity was exhibited with ethanol. The control, run with no substrate,
exhibited no acitivity.
Isolation and characterization protein and peptides
Identification of the peptide fraction
Thin layer chromatography of the aqueous extract (Figure 20) showed a
substantial amount of radioactivity at the origin. This material did not correspond to
any of the trans-methylglutaconate shunt intermediates in terms of chromatographic
behavior. Therefore this aqueous extract was then subjected to thin layer
chromatography using conditions that would separate phospholipids, to investigate
the possibility of incorporation into this lipid class. The solvent was
chloroform/methanollpetroleum ether (distilled at 30°-60°C)/acetic acid/boric acid,
40/20/30/10/1.8. The radioactivity in the aqueous extract was separated into a peak
at the origin and a residual mevalonic acid peak. The incorporated label remained at
the origin.
In a second thin layer chromatogram, conditions for separation of the citric
acid cycle intermediates were used (126). Cellulose thin layer plates (Avicel
microcrystalline cellulose from Analtech, New Jersey) were used in a solvent
composed of diethyl ether/formic acid/water, 140/40/20. The results are summarized
in Table 6. Both of the thin layer chromatography techniques showed no
incorporation into known standards run at the same time; however, the results did
indicate the label may be present in amino acids or similar component(s).
Ninhydrin, a usual indicator for free amino groups, gave a positive response to the
Table 6. Thin layer chromatography of citric acid cycle intennediates. The acids
were run for comparison with the aqueous extract. Standards were applied at 50
pgm each. The aqueous extract sample contained 1000 cpm while mevalonate-2-'4C
contained 2000 cpm.
Sample
Rf
Succinic acid
Mumaric acid
Malate acid
a-Ketoglutaric acid
Citric acid
Dimethylacrylic acid
3-Hydroxymethyl glutaric acid
Aqueous extract (label)
Mevalonate-2-14C (standard)
Aqueous extract (control)
0.17
0.86
0.49
0.69
0.40
0.90
0.0
0.02, 0.77
0.77
0.77
Detection'
BG
BG
BG
BG
BG
BG
BG
Bioscan
Bioscan
Bioscan
'Detection was with bromocresol green (BG) or with the Bioscan radioactivity
scanner.
label-containing bands (excluding mevalonate-2-14C), a result which led to
experiments characterizing the labeled material as peptide in nature. The buffer
control appeared to contain only mevalonic acid-2-'4C
Paper and thin layer chromatography to identify the peptide fraction
The labeled material in the aqueous extract, migrating near the origin, gave a
positive response to ninhydrin and but did not migrate like any of the standard acids
tested on the chromatogram (summarized in Table 6). Therefore, paper
chromatography with known amino acid standards was run along with a portion of
the aqueous extract obtained from the incubated postmitochondrial supernatant. A
solvent system of n-butanol/acetic acid/water, 5/1/1, provided for the separation of
amino acids, mevalonic acid-2-14C, and the labeled portion of the aqueous extract.
This data is summarized in Table 7. Thin layer chromatography in the same solvent
system gave similar results and these results are summarized in Table 8. Ninhydrin
was again used as the detection agent in these chromatograms. It can be seen that the
ninhydrin response and the incorporated label in the aqueous extract appeared
coincident in both paper and thin layer chromatography systems.
Isolation and characterization of the aqueous extract peptides
Characterization of peptides from thin layer chromatography
Preparative thin layer chromatography of the aqueous extract was then used to
obtain larger amounts of the peptide fraction. The aqueous extract from 100 ml of
incubated postmitochondrial supernatant was applied to a thin layer plate, and
chromatographed in n-butanol/acetic acid/water 120/30/150, using the organic layer.
87
Table 7. Paper chromatography of amino acids and the aqueous extract. Samples
(50 J.Lgm of standards) in ascending manner. The solvent is butanol/acetic acid/water,
5/1/1. The Rf values were determined with detection with ninhydrin or scanning for
radioactivity. The buffer control contains mevalonic acid-2-'4C (2000 cpm)
mevalonic 214C standard contained 1000 cpm. The aqueous extract contained 500
cpm.
Sample
(radioactivity)
Rf (ninhydrin response)
Rf
--
0.29
0.20
0.09
0.65
0.57
0.27
Alanine
Aspartate
Cysteine
Leucine
Phenylalanine
Threonine
Mevalonic acid-2-14C
Aqueousextract
Buffer control
0.75
0.19
0.76
0.21
Table 8. Thin layer chromatography of the aqueous extract and amino acids.
Standards and the aqueous extract were chromatographed in n-butanol/acetic
acid/water, 4/1/1. The buffer control contains mevalonic acid-2-'4C (2000 cpm);
mevalonic acid-2-14C, 1000 cpm; aqueous extract, 500 cpm.
Sample
Alanine
Aspartic acid
Cysteine
Leucine
Phenylalanine
Threonine
Buffer control
Aqueous extract
Mevalonic acid 214C
Rf (ninhydrin)
0.49
0.30
0.21
0.70
0.66
0.41
0.29
RF (radioactivity)
--
0.85
0.29, 0.85
0.85
The preparative plate was divided into five areas, or bands, for extraction. The result
of radioactivity scanning with the Bioscan instrument and the ninhydrin response
was used as a guide. The silica was removed from the plate, extracted and the
residue, after removal of solvent, was used for further analysis. Band I, the band
nearest the origin, contained the ninhydrin positive label starting at the origin to
about 2 cm above the origin and was the only section that contained incorporated
label. Therefore, Band I was selected for further investigation.
The results of paper chromatography of Band I from thin layer chromatography
and standard amino acids in a basic solvent (n-butanol/ethanol/ammonia, 1/1/1) is
summarized in Figure 21. Ninydrin detected the position of each amino acid and
any amino acid/peptide components of Band I. Radioactivity was assayed by
counting strips cut from the chromatography lane. The ninhyrin positive material
from Band I remained near the origin, while any mevalonic acid 214C migrated to a
Rf of 0.67.
Membrane filtration of the aqueous extract
Further purification of the aqueous extract was accomplished by filtration of
the aqueous extract through membranes with defined pore sizes. This step removed
residual starting material(s) and salts. Two step filtration was used, employing a
Nucleopore stirred cell pressurized with nitrogen gas. The extract was filtered first
through an Amicon YM1 membrane (MWCO of 1000 Daltons)to obtain the YM1
residue. The filtrate was used on a YCO5 (500 D MWCO) membrane to obtain the
YCO5 residue and the final filtrate. Residue remaining on both the YM1 membrane
and the YCO5 membrane were taken up in several washes of water. The results of
membrane filtration, in terms of protein and radioactivity, is summarized in Table 9.
uI
25
20C
0
C
150
ILL
11
100
50
0
123456789101112131415161718192021222324252627
Centimeters from origin
Figure 21. Distribution of radioactivity with paper chromatography of Band, I. The
sample was Band I obtained from thin layer chromatography. The solvent was nbutanol/ethanolfammonia, 1/1/1. The sample lane was cut into 0.5 cm widths and the
strips counted in the scintillation counter. Arrows indicate migration of standards, which
were detected with ninhydrin,
Table 9. Membrane filtration of the aqueous extract. Two step filtration through
1000 MWCO (YM1 membrane) and 500 MWCO (YCO5 membrane) is summarized
in terms of separation of protein and radioactivity. The YM 1 filtrate served as the
sample for the YCO5 filtration. The original sample is the combined aqueous
extracts representing two liters of post mitochondrial supematant incubated with a
total of 2.0 pci of mevalonate-2-'4C. Protein is expressed in milligrams (mg).
Sample
Aqueous extracts
YM1 residue
YM1 filtrate
YCO5 residue
YCO5 filtrate
Protein (total mg)
cpm (total)
53.9
3.6 x 10⁶
50.3
17.2
31.7
2.6 x 10⁶
3.1
3.1 x 10
3.4 x 10
2.9 x 10⁶
91
The majority of the radioactivity passed through both membranes, while most of the
protein remained on the YCO5 membrane.
The membrane samples were compared by thin layer chromatography in the
acid solvent, as shown in Figure 22. The radioactivity in both the YM1 filtrate and
YCO5 filtrate appeared in band migrating identically to mevalonate-2-'4C. The YM1
filtrate and the YCO5 residue contained a labeled band at the origin as well as some
residual mevalonate. The peptide bands were detected with ninhydrin reagent; the
spots usually appear pink to purple in color.
The results of the sequential membrane filtration and the location of the labeled
material by thin layer chromatography led to preparative thin layer chromatography of
the YCO5 residue. The residue, in a concentrated solution, was applied to a thin
layer plate and developed in the same solvent. The results are shown in Figure 23.
Four areas, or bands, were selected on the basis of the location of radioactivity (Band
1, at origin), and ninhydrin reactivity (Bands 2, 3, 4). The bands were scraped off
the plate and extracted with acetic acid. Figure 23 shows how bands were selected.
A summary of the recovery of protein (Lowry) and radioactivity in each band is
shown in Table 10. While mevalonate-2-'4C is presumed to pass through the YCO5
filter, the control experiment with filtration of the aqueous extract demonstrated that
some mevalonate remains on the filter with the residue sample. This mevalonate can
be separated from the bands of interest during the preparative thin layer
chromatography step, since mevalonate migrates faster than the band of interest. The
results show that Band 1 contained the most protein and label and was subjected for
further study. Bands 2, 3, and 4 were not characterized any further. For this study,
the subsequent experiments dealt with a sample that had been incubated for two
hours and fifty-five minutes only. The control sample had no label or ninhydrin
response.
92
is
Figure 22. I'hin layer chromatography of membrane filtration
fractions. Left to right: the aqueous extract, the YM I filtrate, the
YCOS residue. and the YCO5 filtrate. Arrow designates the
origin: the solvent front is not shown. The solvent is nbutanol/acetic acidlwater, 5/1/1.
93
Figure 23. Preparative thin layer chromatography of the YCO5 residue. Numbers
on the figure refer to bands removed from the plate and the bands are delineated with
lines. The right lane is an analytical sample and the left lane is the preparative band.
The line below Band 1 is at the origin; the solvent front is not shown. The solvent is
n-butanollacetic acid/warier, 5/1/1. The arrows designate the origin.
94
4
3
Figure 23
95
Table 10. Preparative thin layer chromatography of the YCO5 residue. The YCO5
residue was chromatographed in butanol/acetic acid/water 4/1/5 on silica plates, and
the bands removed and extracted as described in Methods. Protein was determined
by the Lowry (116) method.
Sample
YCO5 Residue
Band 1
Band2
Band 3
Band 4
Rf
Protein (total)
% (Protein)
Radioactivity
0.04
0.15
0.28
0.40
2.3 mg
0.900
0.310
0.075
0.180
100
39
4.4 x 10
1.Ox 105
13
3.3
7.8
i;i
Paper chromatography of band 1 from preparative thin layer chromatography
Water saturated phenol (120) was selected as the mobile phase to separate the
components of Band 1 obtained from preparative thin layer chromatography. Again,
the sample to be separated was applied as a narrow band and solvent was allowed to
migrate, in a descending manner, to within 3 cm of the far edge. The paper was
thoroughly dried; a marker band (5 .tl of sample band) was run at the same time.
This band was cut off and sprayed with ninhydrin, and radioactivity was located on
this same strip with counting with the Bioscan instrument.
Five bands (I-V. I at
origin) were selected on the basis of the presence of label and/or ninhydrin response.
Bands I, II, and ifi were ninhydrin positive. Bands I, IV and V were labeled and
their location on the chromatogram are summarized in Table 11 B. The radioactive
material was not mevalonate-2-14C based on the migration of mevalonate on paper
with water-saturated phenol as the solvent. In addition, on a separate paper
chromatogram using two-dimensional paper chromatography of the preparative
material, Band I label stayed coincident with the ninhydrin response, and the label in
Bands IV and V remained as a single spot on the chromatogram, and coincident with
the ninhydrin response. Finally, no other ninhydrin bands or radioactivity were
detected by two dimensional chromatography.
At this point in the research project, the components of Band I obtained from
preparative thin layer chromatography were likely to be of low molecular weight,
between 500 and 1000 daltons, based on the prior separation on the Amicon YCO5
membrane. Therefore the bands obtained from phenol paper chromatography of
Band I (from preparative thin layer chromatography) were expected to be of low
molecular weight as well.
The bands from phenol paper chromatography were cut out and numbered
Phenol Band I (at origin) to Phenol Band V (at solvent front). Phenol Bands II and
UI were not radioactive and were detected with ninhydrin only. Phenol Bands IV
and V were radioactive, but were not detected with ninhydrin. The substance in
each band was eluted with water, the solutions dried under vacuum and used in
perfomic acid and vapor phase HC1 acid hydrolysis experiments. The buffer control
sample contained no ninhydrin positive material or label throughout these
experiments. Performic acid oxidation was introduced to detect the presence of
cysteine in any of the bands. Methionine is converted to methionine sulfoxide and
cysteine to cysteic acid, after exposure to performic acid.
Cysteine is destroyed in acid hydrolysis as are tryptophan, and to some extent,
tyrosine. The lack of absorbance at 280 nm and some preliminary results with
fluorescence detection with HPLC experiments excluded tyrosine and tryptophan as
constituents.
The presence of cysteine in the isolated bands was determined by first treating a
portion of the isolated band (from phenol paper chromatography) with performic
acid vapor overnight. Part of this performic-acid treated sample was then subjected
to vapor phase HC1 hydrolysis overnight. The control, performic acid treated, and
performic acid plus HC1 vapor phase hydrolysis were then chromatographed on
paper in two dimensions. The first dimension was with liquefied phenol, while the
second dimension was in butanol/acetic acid/water, 4/1/1. The constituent amino
acids were identified by comparison with chromatograms of standard amino acids
run at the same time.
The radioactive label detection (as determined by radiochromatographic scan)
results are shown in Table 1 1A. The amino acid composition results, as determined
by two-dimensional chromatography are summarized in Table 1 lB. Phenol Band II
Table 1 1A. Summary of location of incorporated label from mevalonate-2-'4C by
paper chromatography. The sample for each section below was a band selected from
phenol paper chromatography. Each band was treated with perforrnic acid or
performic acid plus HCI hydrolysis. Control samples received no treatment. Bands
II and Ill were not labeled. The samples were then analyzed by two dimensional
paper chromatography. The Rf values below show the location of the label after each
development in the first solvent (Solvent I, water-saturated phenol) and second
solvent (Solvent II, n-butanol/acetic acid/water, 5/1/1).
Rf Values of Label in Each Sample from Radiochromatographic Scan
Sample
Control
Solvent
I
Phenol Band I
0.19
Phenol Band II
--
Phenol Band III
--
Performic Acid
II
I
II
0.25
0.19
0.26
Performic AcidIHCl
I
II
---
PhenolBandlV
0.65
0.34
Phenol Band V
0.94
0.34
--
0.92
0.47
0.97
0.35
Table 1 lB. Summary of results of amino acid analysis of peptides described in
Table 11 A Amino acids were detected with ninhydrin and identified by comparison
with known standards. Control samples were not treated. The other samples were
treated with performic acid or performic acid and vapor phase hydrolysis with HC1.
Value
Control
Performic Acid
PerformicAcidlHCl
glu
asp
glu
asp
glu
asp
ala
cysteic
lys
glu
glu
glu
glu
glu
glu
ala
cysteic
his
tyr
met
A. Phenol Band I
Amino Acids
B. Phenol Band II
Amino Acids
C. Phenol Band III
Amino Acids
D. Phenol Band IV
Amino Acids
Amino Acids
gly
cysteic
asp
glu
ser
gly
ala
glu
asp
ala
val
lys
ser
gly
met
contained only glutamic acid. The buffer control sample did not contain any
ninhydrin-positive material when carried through the same procedures. Phenol
Bands I, III, IV, and V released amino acids under HCI vapor phase hydrolysis
conditions, but not performic acid conditions. Phenol Bands II and Ill contained no
radioactive label. The radioactivity in Phenol Band I was released only after both
performic acid and HC1 treatment, while the label in Phenol Band IV was released
alter treatment with performic acid only. The label in Phenol Band V did not appear
to be affected by the acid treatments.
Amino Acid Analysis by Dabsylation
Two of the peptides obtained from phenol paper chromatography (Table 1 1A and
1 1B), Phenol Bands II and IV, were also subjected to both performic acid and vapor
phase HC1 hydrolysis and derivation with dabsyl chloride, a reagent that
chromatographic step (93). For estimation of molar ratios of amino acids present in
samples, a standard mixture of amino acids was treated identically to the samples and
chromatographed under the same set of conditions on the same day. Peak identities
and areas were obtained by comparison of chromatograms. Samples were prepared
for analysis by performic acid treatment and a combination of performic acid
treatment and vapor phase HC1 hydrolysis. Dabsyl derivatives, frozen when not in
use, remained stable for at least several months. Final volume of the dabsylated
sample was 500 p1 and 20-40 p1 were taken for analysis. The amino acid content on
a molar ratio basis was calculated by using the j.tvolt response/pmole ratio of the
amino acid standards.
The peptides obtained from the phenol paper chromatography were given a
group name, the Nketewa peptides. Nketewa means small in the Twi language of
Ghana, and the term was chosen because of its appropriate descriptive nature of the
101
peptides and the advisor's Fuibright experiences of Ghana. Nketewa I refers to
phenol band I and so on.
Nketewa peptides H and IV were subjected to dabsylation after preliminary
treatment with perfomic acid or performic acid plus vapor phase HC1 hydrolysis.
This approach resulted in three dabsylated samples for each Nketewa peptide: one,
control (no treatment); two, treated with performic acid; and three, performic acid
plus vapor phase HC1 hydrolysis. Amino acids are observed when HCI and
performic acid are used to treat a blank tube (125). Therefore, these control values
obtained from blank tubes treated at the same time the Nketewa peptides were treated
are used to correct for background values on the vapor phase HC1 values. The
perfomic acid values were used to correct the HC1 vapor phase hydrolysis values.
The results are summarized in Table 12.
The molar ratios of the amino acids observed can be calculated from this
data. Nketewa II was expected to have only glutamic acid, and the dabsyl results
confirm that expectation. The Nketewa IV values, by setting the cysteic acid value to
one and normalizing the other molar amounts to this value resulted in an amino acid
molar ratio of cys/glu/ser/gly/ala/val, 1/3/2/1/1/1, rounded to the nearest integer.
102
Table 12. Results of dabsyl amino acid analysis. Nketewa peptides 11 and IV were
analyzed. Results are expressed in picomoles observed after correction of
background values. Samples were either treated with performic acid only (Column
2) or performic acid and vapor phase acid hydryolysis (HC1)(column 3).
A. Nketewa Band II
Observed
Amino Acid
glu
Performic Acid
Performic/HCI
200
rD
Performic Acid
Performic/HC1
7
157
124
B. Nketewa Band IV
Amino Acid
cys
glu
ser
gly
ala
val
8
33
57
79
79
59
103
This result agrees favorably with the results shown in Figure 1 lB where the amino
acid composition of Nketewa IV was found to contain, by two-dimensional paper
chromatography after similar hydrolysis treatments, five of the acids observed by
hydrolysis followed by dabsylation: cys, glu, ser, gly, and ala. The two results
differed in that the dabsyl analysis suggested the presence of valine in peptide while
the paper chromatographic analysis (Figure 1 1B) did not.
Characterization of the soluble peptide fraction
The results of the studies on the lipid extracts and the aqueous extracts clearly
demonstrated that mevalonate was being utilized by the postmitochondrial
supernatant. Label derived from the starting material appeared in the two lipid
extracts, as well as several peptides. Further studies then were directed toward
characterizing the components of the soluble protein fraction.
The precipitated protein was free of the original mevalonate-2-' 4C. This
result occurred in initial time, incubated, and inactive post-mitochondrial supernatant
experiments. Buffer control samples (no supematant) were treated along with
incubated and initial time samples in order to correct for any background interference
in subsequent experiments.
After precipitation and washing with water and ethanol, the protein pellet was
air dried and homogenized to a coarse powder to assure complete drying. The
soluble peptides were taken up in 10 ml water and particulate material removed by
low speed centrifugation, and are referred to as the soluble protein fraction. The
postmitochondrial supernatant contained from 7.2 to 7.5 mg protein/ml (Lowry).
Approximately 350 mg dry protein could be obtained from ethanol precipitation of 50
ml of supematant.
104
Gel filtration of the soluble peptide fraction
Biogel P-100 column chromatography of the soluble protein fraction is shown
in Figure 24. This gel has an exclusion limit of 100,000 D The sample for the
chromatogram was 3 ml of solubilized protein obtained from 50 ml of postmitochondrial supernatant. A total of 300 ml water was used to elute the column.
The fractions were analyzed for protein by the Bradford method. The separation of
several protein peaks were observed. The labeled material, however, eluted as a
single peak. Using the chromatogram as a guide, fractions 14-22 (containing '4C
label) were pooled, dialyzed and the dialysant reduced in volume and
chromatographed on a Biogel P-6 column. Biogel P-6 has an exclusion limit of
6,000 D. This chromatogram is shown in Figure 25. Labeled fractions were pooled
and used for analysis by ion exchange chromatography.
Ion exchange chromatography of the soluble fraction
Anion exchange chromatography of the pooled, concentrated fractions
obtained from gel filtration was performed on a Cellex-E resin (BioRad
Laboratories) column. A gradient of 0 to 1 M LiCI in water was used as the as the
eluent. The chromatogram is shown in Figure 26. Since the protein fraction did not
appear to bind to the column, the labeled protein fractions were again pooled,
concentrated and used as sample for cation exchange chromatography on BioRex-70
resin (BioRad Laboratories). The results are shown in Figure 27. The radioactivity
and protein appeared in fractions two through four, as shown. The overall results of
the ion exchange chromatography indicate that this protein fraction was not tightly
bound to anion or cation exchange columns. The labeled protein fraction was again
pooled and taken down to a small volume.
o=596nM CPM
1000
1.2
col.0
A=CPM
C)
U)
Wf
ov.
z
mO.6
0
900
800
700
600
500
400
0.4
300
200
0.2
100
o
2
4
6
8
10
12 14
16 18 20 22 24 26 28 30
FRACTION NUMBER
Figure 24. BioGel P-100 chromatography of the soluble peptide fraction. The
chromatogram illustrates the elution of protein [as analyzed for protein by the
Bradford (117) method] and radioactivity (cpm). Water was used as the eluent.
1.6
-2800
-
-2600
1.2
-2400
LI = 28OnM
-
A=CPM
1.0-
0.8 -
-2200
-2000
-1800
-1600
-14000
-
m 0.6-
-1200
-
-1000
0.4-
- 800
1JFT TTT
123456789101112131415
FRACTION NUMBER
i
I
Figure 25. BioGel P-6 chromatography of labeled fractions. The pooled labeled
fractions obtained from BioGel P-100 (Figure 24) were applied to the column.
Fractions were analyzed for protein (absorbance at 280 nm) and for radioactivity
(cpm). The column was eluted with water.
0\
CPM
01.2c1.0
co
1000
4
-
W
(_)
z
0
O
800
J.0
-
0.6-
600
04-
400
02-
200
0
0
2
4
6
8 10 12 14 16 18 20 22 24 26 28 30 32 34 36 38
FRACTION NUMBER
Figure 26. CeIlexE anion exchange chromatography of the labeled fractions.
The combined fractions from BioGel P-6 chromatography (Figure 25) were
applied to the column and eluted using a LiCI gradient in water. Samples were
analyzed for protein (absorbance at 280 nm) and for radioactivity (cpm).
40
N
300
0.1
co
c.'j
0.1c
UI
C)
200a..
0
0.08
o 0.06
C')
100
0.04
0.02
Is]
0
2
4
6
8
10
12
14
FRACTION NUMBER
16
18
20
Figure 27. BioRex-70 cation exchange chromatography of the soluble peptide
fraction. The combined fractions from anion exchange chromatography (Figure
26) were applied to the column and eluted with a LiCI gradient in water.
Fractions were analyzed for protein (absorbance at 280 nm) and for radioactivity
(cpm).
22
24
109
HPLC of the soluble peptides
The material isolated by gel filtration and ion exchange chromatography was
subjected to HPLC on a C18 Vydac column ( modified with octadecyl silane, C18
groups). The column was eluted with a nonlinear gradient of 10% trifluoroacetic
acid in water and 0.067% trifluoracetic acid in acetonitrile. The 8.3 minute peak
eluted at approximately 30% acetonitrile. The HPLC trace is shown in Figure 28.
Each peak from HPLC was collected and taken to dryness. The first two
peaks that eluted contained nucleotides and an amount of peptide too small to be
useful for further analysis. The peak eluting at 8.3 minutes was selected for further
analysis as it appeared that sufficient protein was present. The material in this peak
was subjected to vapor phase HCI hydrolysis and subsequent dabsylation, and
analysis by HPLC.
The results of this analysis are summarized in Table 13.
Thus the material in
this peak appeared to contain peptide(s) which released amino acids upon hydrolysis.
The term Nketewa was also applied to this material, and is referred to as Nketewa A.
No amino acids were found in a control sample (no hydrolysis) or reagent blank (no
peptide).
C
r
0
V
0
t
B
Minutes
Figure 28. HPLC of the soluble peptide fraction. The soluble peptide fraction was
chromatographed on a reversed phase column. The microvolt response is based on the
absorbance at 280 nm. The sample was eluted in a gradient of acetonitrile in 0.1%
triflouroacetic acid. The sample at 8.3 minutes was used in subsequent analyses.
C
111
Table 13. Dabsyl amino analysis of the soluble peptide. The sample, Nketewa A,
for analysis was the peptide obtained by HPLC. Amino acid content is expressed as
a percent of total amino acid content.
Amino Acid
Aspartic
Glutamic
Serine
Threonine
Glycine
Alanine
Proline
Valine
Arginine
Methionine
Isoleucine
Leucine
Phenylalanine
Lysine
Histidine
Tyrosine
Mole %
21.28
15.67
3.78
3.32
16.01
9.12
4.24
3.75
1.95
2.49
2.87
3.86
2.77
5.91
1.29
1.69
112
Mass spectrometrv of the soluble peptides
The soluble fraction, like the aqueous fraction could be purified by membrane
filtration, using the same protocol. The soluble extract was filtered first through the
YM1 membrane to give a YM1 residue and a YMI filtrate. This filtrate was used
with a YCO5 membrane to obtain the samples YCO5 residue and the YCO5 filtrate.
The YCO5 residue was next subjected to preparative thin layer
chromatography, to give three ninhydrin bands, termed Nketewa 1 (at origin),
Nketewa 2 and Nketewa 3.
Nketewa 1 was removed from the plate, extracted, and characterized further by
mass spectrometry and sequencing experiments. The sequencing was performed by
the Central Services Lab, at the Gene Research Center at Oregon State University.
For sequencing purposes, the peptide N-myristolated protein kinase C inhibitor
(Sigma Chemical Company, St. Louis, MO) was used as a negative control. This
peptide has a myristoyl group covalently attached to the N-terminal amino group.
The Edman degradation (127) is the basis for sequencing protocols and requires a
free amino end terminus of the peptide. The control peptide, with a sequence of Nmyristoyl-phe-ala-arg-lys-gly-ala-leu-arg-gln-NH2
gave negative results, as
expected. Bradykinin, as a positive control, gave a sequence of arg-pro-pro-gly-phe-
ser-pro-phe-arg, which is reported by the supplier (Sigma Chemical Co., St. Louis,
MO). The Nketewa 1 peptide could not be sequenced could not be sequenced.
Similar results were obtained when cyanogen bromide cleavage (128) was attempted
on the Nketewa 1 peptide. Cyanogen bromide cleaves peptides on the carboxy side
of methione residues (128). The result is a new N-terminal amino acid residue
which was on the carboxy side of the original methionine residue. This new peptide
113
is now available for sequencing. The original peptide is bound to a membrane so
does not interfere with this sequencing process, and has a new carboxy terminal
residue, homocysteine. The positive control was a-melanocyte stimulating hormone
(N-acetyl-ser-tyr-met -glu-his-phe-arg-trp-gly-1ys-pro-val-NH). The Nketewa
peptides of the aorta, both from the aqueous extract and the soluble protein fraction
did not give product(s) when subjected to cyanogen bromide cleavage or Edman
degradation.
Positive controls were also used in the mass spectrometry experiments. The
mass spectrum (MALDI) of a-melanocyte stimulating hormone is shown in Figure
29, indicating the correct molecular weight of this peptide.
The Nketewa 1 peptides(from Band 1 of thin layer chromatography) were
analyzed by MALDI mass spectrometry, shown in Figure 30, to give information
about the mass(es) of the peptide(s). The Nketewa 1 sample was then used in
liquid chromatography and one peak was selected for further analysis for sequence
information.
The LCIMS (tandem mass spectrometry) of the selected peptide,
mass 1038.1, is shown in Figure 31. There was insufficient data to obtain
information about the other peptides observed in the liquid chromatography of the
Nketewa 1 sample.
The protocol for determining the sequence of a peptide from tandem mass
spectrometry is not always straightforward, because of the variable fragmentation
pattern that occur when peptides are treated in this manner (for a review, see 129).
The amino acid residue may fragment from the main peptide from either the amino
terminus or the carboxy terminus. In addition, the residue may fragment at different
points in the amino residue
40
z
Cl)
z
'-4
600
n'z
Figure 29. MALDI mass spectrum of cx-melanocyte stimulating hormone.
4-
4-
18
U)
C)
800
mlz
Figure 30. The MALDI mass spectrum of the Nketewa peptides. The sample for the
analysis was band 1 obtained from thin layer chromatography of an HPLC sample.
2000
123.2
I
200
400
800
600
1000
1200
mlz
Figure 31. Tandem mass spectrum of the 1038 Dalton Nketewa peptide. The peptide
was selected first from liquid chromatography mass spectrometry and then analyzed by
tandem mass spectrometry.
117
itself, giving rise to the potential of various masses for the same amino acid residue.
Since the study is done in an acidified matrix, protonation of the residue takes place.
In this study, the amino acid composition had been determined for this peptide by
vapor phase HC1 hydrolysis followed by two dimensional paper chromatography.
This gave (at least) an amino acid composition of ser, gly, ala, val, met, phe and
cys.
The data from Yates et. al (134) was used as a guide in assigning the identity
and composition of each fragment from the tandem mass spectrum. Table 14 shows
the deduced peptide sequence. The information about the amino acid composition of
the peptide strengthened the decision making when assigning residue position in the
peptide. The data also indicated the presence of a fragment with the mass of a
cysteine residue with a farnesyl moiety attached. The deduced sequence was hisgly-val-cysteine(farnesyl)phe-ala-ser-met, or with one letter codes for the amino
acids, HGVCFASM.
A search was made to identify this Nketewa peptides using the BLAST and
SWIS SPORT databases, but no significant match was found; a search of the EMBL-
Heidelberg data base indicated the sequence was present on chromosome 9, HRPK-
295 D22. The data from the database searches is summarized below. A similarity of
genetic sequences in the EMBL-Heidelberg data gave three potential matches (note
one letter codes are used for amino acid residues):
(1)
1
48
HGVCFASM 8
I
1111111
H G E C F A S M 41
Percent similarity:
87.5
(residue number in similar sequence)
Found in human genomic sperm library
118
15312 (residue number in similar sequence)
[-lomo Sapiens clone DJ0865F17; HGTS Phase
119
Table 14. Deduction of the sequence of the 1038 Dalton Nketewa peptide from
tandem mass spectrometry. The amino acid composition data was also used. The
sequence was deduced from the amino terminal end of the peptide.
Proposed Sequence
Notes
His
His-gly
Peak in Spectrum (Daltons)
His-gly (+H20)
His-gly-val
His-gly-val-cys (famesyl)
His-gly-val-cys (farnesyl)phe-ala
His-gly-val-cys (farnesyl)phe-ala-ser-met
138.1
166.4
185.0
342.4
630.4
818.8'
1038
(phe-ala = 188)
'Peak of mass 578 corresponds to loss of a fragment from the peptide from the
carboxy terminal end. This lost fragment corresponds to phe-ala-ser-met.
120
DISCUSSION AND CONCLUSIONS
Atherosclerosis is a dynamic, progressive disease of the large
arterial vessels characterized by the development of thrombogenic and occlusive
lesions (plaques) in the vessel wall. Plaque formation is the result of accumulation
of lipids into macrophages ("foam cells") in the subendothial layer and the
migration of smooth muscle cells into the intimal layer and their subsequent
proliferation. Calcification, the formation of a fibrous and often fragile cap, the
accumulation of extracellular matrix materials, and the deposition of lipids
including free and esterified cholesterol contribute to the complexity of the lesion.
These concurrent processes are not only the result of external environmental
conditions but also the involvement of the components of the vessel wall itself.
Understanding the biochemistry of the vessel wall is integral to the
elucidation of the etiology of atherosclerosis. Cholesterol, because of its
recognition as a characteristic early component of lesion composition, and because
of the regulation of cholesterol uptake into cells (46,48) has been central to
atherosclerosis research.
Cholesterol is supplied from external resources and is
also synthesized by the cell from a remarkable six-carbon precursor, mevalonic
acid. This molecule is also the precursor of a variety of other molecules, including
heme A, ubiquinone, dolichols, isopentenyl adenine (a modified nucleoside) and
the isoprenoid modifications of proteins; mevalonate is also required for cell
proliferation.
121
Mevalonate-related processes are directly related to atherogenesis as well as
normal functioning of the arterial wall. This investigation has addressed three
topics that are related to mevalonate metabolism, using a cell-free,
postmitochondrial supernatant prepared from bovine aorta. Central to the research
process described here was the design of protocols and the combination of
protocols to collect the experimental results.
The first question addressed by this research asks if neutral lipid and acidic
lipid components, which have been biosynthesized from mevalonate, can be further
characterized. This question is an extension of earlier research (78, 95) performed
in this laboratory. The second question asks if the intermediates of the transmethylgiutaconate shunt can be isolated from this preparation, as it is known (78)
that the postmitochondrial supernatant is capable of incorporating the radioactivity
in mevalonate-2-C14 into C8 and C10 acids in diacyiglycerols.
The third question
asks if mevalonate can be incorporated into isoprenoid modifications of peptides
and proteins.
The Neutral and Acidic Petroleum Ether Extracts
As noted above, the neutral and acid lipid petroleum ether extracts of the
incubated postmitochondnal supernatant contained radioactivity derived from
mevalonate-2-'4C. Incorporation of mevalonate-2-C14 into both neutral lipid and
acidic lipid extracts required adenosine triphosphate but no other cofactors. The
volatility of some of this incorporated material in the neutral lipid fraction was
122
observed when at least 10 percent of the radioactivity is lost from this fraction
when left open to the atmosphere. Dimethylallyl alcohol is a required intermediate
in both the trans-methylgiutaconate shunt and the isoprenoid biosynthetic pathway.
This branched chain alcohol and its isomer, isopentenol are both volatile and, as
pyrophosphorylated esters, are intermediates in the isoprenoid pathway. The
formation of isopentenyl pyrophosphate by arterial tissue has been demonstrated
(43). Hydrolysis of these intermediates to the free alcohol is possible with
pyrophosphatases and phosphatases, which are present in arterial tissue (95). Thus
the appearance of these short chain alcohols in the neutral lipid extract would not
be unexpected. In addition, prenylation of proteins requires the prenols farnesol
and geranylgeraniol, also in pyrophosphorylated forms, again possible substrates
for ester hydrolysis. This prenyl protein modification is required for a variety of
cellular functions and the control of other cellular functions. Attempts to identify
this material by mass spectrometry methods were not successful due to the amount
of extraction solvents employed and the similarity of the extraction solvents used
to the neutral lipid extract.
Incubation of the mevalonate-2-'4C demonstrated that about 6 percent of the
added label appears in this neutral lipid fraction. Since only the R form of
mevalonate is used in metabolic processes, and the commercially available labeled
mevalonate-2-14C is in the RS form, incorporation may be as high as 12 percent.
The significance of these products in normal or atherosclerotic tissue cannot be
123
determined until they are identified, but these products may be important in
biosynthetic pathways or catabolism of isoprenoid(s).
It is known (95) that the neutral fraction contains diacylglycerols as well as
the above unidentified component(s). Diacylglycerols can act as detergents for the
transport of cholesterol (136) and have been shown to participate in intracellular
signaling pathways (137). Diacyiglycerols are associated with the activation of
protein kinase C (137), a process that leads to increased production of extracellular
matrix and cytokines. The de
novo
synthesis of diacylglyerols and subsequent
signaling events is also associated (138) with enhanced vascular contractility,
permeability, and cell proliferation.
All these diacylglycerol- associated
processes are present in normal functioning tissue. Cholesterol accumulation
occurs in atherogenesis. Accumulation of extracellular matrix impacts the disease
process by enhancing fibrotic cap formation. Cytokines contribute to the chronic
inflammatory state of lesions. Calcification of arterial tissue results in the
formation of insoluble deposits in the arterial wall.
The extracted products were not limited to the volatile components and the
diacyiglycerols. A second radioactive component was extracted from an acidified,
incubated postmitochondrial supernatant. This component displayed different
chromatographic behavior in two solvents (acidic and basic) on thin layer plates.
The radioactive component moved with the solvent front in an acidic solvent and
stayed at the origin with a basic solvent, as detected by radiochromatographic
scanning of the plates. The fact that this product was extracted only from an
124
acidified mixture implies a protonated molecule, while the extraction and
chromatographic behavior describe the hydrophobic nature of the component.
Acidification of the mixture may also have released this component from a second
molecule, but there is no other information to suggest this. The results obtained by
paper chromatography demonstrated that this component was not one of the
straight chain (2-18 carbons) carboxylic acids tested, nor was it the transmethylglutaconate intermediate, dimethylacrylic acid. Attempts to identify this
component by mass spectrometry also were not successful, again due to the nature
of the extraction solvents and the relative quantity used.
This component
represents a product of mevalonate metabolism yet to be identified. The production
of acids from mevalonate-derived molecules is not unexpected (for example, the
trans-methylgiutaconate shunt). Other researchers have observed that famesol is
converted to a number of dicarboxylic acids as a degradative strategy when farnesol
accumulates in the cell (138). The acid lipid extract may represent the removal of
unwanted isoprenoid products in the cell, or may be an unesterified product
released on treatment with acid. The results from studying the transmethylglutaconate shunt intermediates showed that the acid petroleum ether extract
product(s) were not from this pathway.
The Trans-methyiglutaconate Shunt Intermediates
The trans-methylglutaconate shunt is a series of reactions (Figure 4 in the
Introduction, page 16) that convert mevalonate to acetyl CoA. It has been
125
indirectly shown to operate in other tissues (13 1-133) and '4C obtained from
mevalonate 2-14C appears both in expired CO2 (75) and fatty acids (76). The
trans-methylgiutaconate shunt intermediates have never been directly observed, to
our knowledge. To demonstrate the presence of the shunt intermediates in arterial
tissue, it was necessary to employ two systems of thin layer chromatography and
two systems of paper chromatography, so that a range of chromatographic behavior
could be used to identify the intermediates. Likewise, silica gel chromatography to
separate small carboxylic acids, after the method of Gamble et al .(133), was used
to isolate and identify the postulated shunt intermediates found in the post
mitochondrial supernatant. The silica gel column for this protocol could be
standardized with known intermediates so their location on the column
chromatogram was established. Utilizing the fractions containing the postulated
intermediates allowed for characterization by thin layer chromatography and paper
chromatography. Mass spectrometry analysis confirmed the elution of standards
in the standard column profile, and GC/MS showed the presence of several
intermediates. The use of the combined protocols demonstrated that radioactivity
from mevalonate-2-14C was recovered in trans-methylgiutaconic acid,
1E-
hydroxybutryic acid, 3-hydroxy-3-methylglutaric acid, and dimethylacrylic acid.
The amount of incorporated label in the intermediates, compared to that found in
the neutral lipids, is approximately five percent. However, the functioning of this
pathway may be significant in its synthesis of diacylglycerols, as discussed above.
The low synthesis of cholesterol in vascular tissue (78) may indicate that other
126
metabolites of mevalonate are more important, such as the biosynthesis of
diacyiglycerols and other isoprenoids. Over 90 per cent of the radioactivity from
mevalonate-2-14C found in the neutral lipid fraction appears in the diacyglycerol
fraction. Atherogenic processes would also be affected by limiting the
de
novo
biosynthesis of cholesterol and therefore its accumulation in the vessel wall.
The trans-methyiglutaconate shunt also contains two oxidative steps
catalyzed by alcohol dehydrogenase: the conversion of dimethylallyl alcohol first
to dimethylacrylaldehyde and a second oxidative step to dimethylacrylic acid. The
presence of alcohol dehydrogenase activity was successfully demonstrated in this
report. Dimethylallyl alcohol and isopentenyl alcohol both were more active than
ethanol in an alcohol dehydrogenase assays. This enzymatic step is necessary for
the conversion of the early isoprenoid pathway intermediates to dimethyacrylic
acid. This additional evidence supports the presence of the transmethylgiutaconate shunt in the postmitochondrial supematant. It should be noted
that dimethylacrylic acid is also an established intermediate for the catabolism of
leucine, but such degradation occurs in mitochondria. No labeled leucine was
observed in this research.
Therefore, definitive results showing the participation of the shunt
intermediates dimethylacrylic acid, trans-methylgiutaconic acid, and 3-hydroxy-3methylglutaric acid, were described. To our knowledge, this is the first time this
has been reported. The trans-methylglutaconic shunt provides a means of
127
transferring carbons from mevalonate acid to biomolecules which impact both
normal and diseased states of arterial tissue, as noted above.
Mevalonate Derived Radioactivity in Peptides
Other biomolecules affected by mevalonate are peptides, which are
covalently modified with isoprenoid side chains. This postranslational
modification was first reported their isolation from yeast (64). Since this
discovery in 1979, prenylated proteins include the y subunit of tnmeric G proteins,
(small G proteins in the rab, rac, and rho families), nuclear lamins A and B and
rhodopsin kinase and other numerous examples (141). The role of prenylated
proteins in intracellular signaling may impact those processes implicated in
atheroslerosis such as cell proliferation, migration, thrombosis, and the secretion of
extracellular matrix material. The research presented in this study demonstrated
the incorporation of mevalonate-2-'4C label into peptides found in both the aqueous
extract and the soluble peptide fraction. The peptides in both fractions were
composed of small molecules, and so were collectively called the Nketewa
peptides.
The peptides in the aqueous extract could be separated into five fractions
(Nketewa Ito V) by phenol paper chromatography. One of the isolated
components, Nketewa II, was found to contain free glutamic acid. No other free
amino acids were observed in these experiments Since previous research also has
shown that C8 and
C10
carboxylic acid are synthesized by this preparation from
128
mevalonate, acyl modification of peptides also might occur. N-acylation is not an
uncommon occurrence in proteins (127), and small acids (containing 2, 4, 6, and 8
carbons) have been shown to modify proteins (128) by N-acylation.
This
modification represents a protective as well as membrane association process. Nacylation may account for the inability to sequence the peptides by conventional
Edman degradation (127). Peptides are also modified by acyl groups on internal
cysteine residues (14 1-142). However, peptides can be modified by either or both
processes of acylation and prenylation with mevalonate derived products.
Other experiments in this laboratory (143) demonstrated that the peptide
associated label was not totally stable to acid or base hydrolysis, further
strengthening the argument that the label is present in an acyl moiety on the
peptide. Treatment with acid or base would release such a modification, while
isoprenylation would be stable to either treatment. The label could also be partially
released by treatment with methyl iodide (144), a procedure known to release
prenyl substituents from proteins. The significance of prenyl labeled proteins in
normal tissue and atherosclerosis has been discussed above. Acylation of proteins
is another posttranslational modification which affects membrane association of
proteins, again reflecting the importance of the modification in cellular activities
such as intracellular signaling.
Perhaps the most convincing arguments for the importance of mevalonate
derived biosynthetic products comes from research using inhibitors of HJVIG-CoA
reductase. Results from these studies show that depriving cells of mevalonate by
129
this method demonstrated that a post-mevalonate biosynthetic product is
responsible for promoting cell division (145), enhancing thrombosis (146),
controlling calcium release (147) and activation of cell signaling pathways (148149).
We have observed small, radioactively labeled peptides in this research
using mevalonate-2-14C as a precursor. A fraction was obtained by HPLC that
could be further separated into peptides by thin layer chromatography. One band
from this separation was radioactively labeled and shown by MALDI mass
spectrometry to contain five separate components. One of these components, with
a MW of 1038.1 D was further characterized by LC/MS and tandem MS. A
fragmentation pattern was obtained, which along with the amino acid
compositional data provided information to deduce a sequence for this peptide:
his-gly-val-cys (farnesyl)-phe-ala-ser-met [HGVC(famesyl)FASM]. This sequence
by tandem mass spectrometry also allowed for the farnesyl moiety as a mevalonate
derived modification on a cysteine residue.
This is the first report of the isolation
of a small, prenylated peptide from arterial tissue and demonstrates the ability of
this system to synthesize such product(s).
A search of protein sequence databases (SWISSPORT, BLAST, and
EMBL-Heidelberg) showed some similar sequences in the human genomic library.
The closest match was found in chromosome 9 HRPK-295 D-22, but there was no
apparent atherogenic characteristic at this location.
130
Summary Statement
This research addressed three questions to investigate aspects of arterial
wall metabolism. All three investigations used mevalonate-2-14C as precursor to
study the questions posed. In each investigation mevalonate was the precursor to
(1) neutral and acid lipids, (2) intermediates of the trans-methylgiutaconic shunt,
and (3) radioactivity incorporated into peptides. This acid is a precursor to a variety
of biomolecules, which participate in both the participation and control of cell
functioning. A review of the literature related to mevalonic acid metabolism of
shows that mevalonate-derived biomolecules participate in processes linked with
atherogenesis. Important to this research were the design and combination of
protocols to answer the questions. Each of these questions related vascular
metabolism, using mevalonic acid as the substrate, to processes which may be
atherogenic. The summary answers to the questions are listed below.
(1)
The neutral lipid extract contained not only diacylglyerols
[described previously in 78)] but volatile components. It is
suggested these volatile components may be the short chain
alcohols, dimethylallyl alcohol and/or isopentenol. The
observation that a significant part of the substrate (approximately
12 percent of the correct isomer) is converted to neutral lipids
substantiates the conclusion that mevalonate is incorporated into
biomolecules other than cholesterol. These biomolecules in
131
diseased tissue may alter intracellular signaling, cell
proliferation, thrombosis, and lesion formation.
(2)
The intermediates of the trans-methylglutaconate shunt were
identified and shown to be radioactive. This is the first report (in
any tissue), to our knowledge, of this observation. The activity
of this pathway indicates that alternate pathways of mevalonate
metabolism are significantly more active than cholesterol
biosynthesis when incorporation into the end products
(diacylglyerols and cholesterol) are compared. In addition, the
function of diacylglycerols include transport of cholesterol,
thromobogenesis, and vasodilation. In diseased states, these
processes may exacerbate lesion formation.
(3)
Isolation of mevalonate labeled peptides demonstrated the
ability of this tissue to modify peptides with acyl or prenyl
groups. This research also demonstrated for the first time (to our
knowledge) the isolation of small (<2000D) peptides with at
least one prenyl modification. In normal or diseased states,
prenylated proteins are part of the intracellular signaling process,
release of cytokines, expression of an extracellular matrix, and
the release of calcium.
(4)
Other research has shown that a mevalonate derived product is
required for cell division to take place; atherogenic plaque
132
growth is a combination of these processes, but at a diseased
state level.
This research provided methods to obtain results in providing information about the
neutral and acid lipid extracts; the isolation and identification of the transmethyiglutaconic shunt intermediates; and the isolation and characterization of
radioactive peptide, all from a preparation of bovine aorta. The results presented
here add to the understanding of arterial wall metabolism in normal tissue and to
understanding the etiology of atherosclerosis, in the context of the metabolism of
mevalonic acid. In the long run, the answers to the disease question may be as
diverse as the development and the manifestations of the disease itself.
133
1:11:) p
(IItIt1'
1.
Lobstein, J.F. (1833) des arteres ou de L'arteriosclerose. Trait
d'anatomic pathologique. Tome II, 550.
2.
McMillan, G.C. (1995) Adv. Expi. Med. Biol. 374, 1-6.
3.
Keaney, J.F. (2000) Atherosclerosis: From Lesion formation to plaque
activation and endothelial dysfunction. Mol. Asp. Med. 21, 91-166.
4.
World Health Organization (1998) WHO Technical Reports Service 158,
1-20.
5.
Wright, L.D., Cresson, E.L. Skeggs, H.R., MacRae, G.D., Hoffman,
C.H., Wolf, D.E., Falker, K. (1956) Isolation of a new acetate replacing
factor. J. Am. Chem. Soc. 78, 5273-5275.
6.
Ross, Russell (1993) The pathogenesis of atherosclerosis: A perspective
7.
Badimon, J.J., Foster, V., Chesebro, J.H. and Badimon, L. (1993)
Coronary atherosclerosis: a multifactorial disease. Circulation 87 (Suppl
II), 3-16.
8.
Collins, T. (1996) Elements of Vascular Pathobiology in Cellular and
Molecular Patho genesis, A.E. Sinica, ed. (Lippincott-Raven Publishers:
Philadelphia), 125-155.
9.
Bassom, J.B. and Sowers, J.R. (1995) Atherosclerosis: An update.
American Heart Journal 131, 1192-1202.
for the 1990s. Nature 362, 801-809.
10.
Libby, P. (1996) Atheroma: more than just mush. The Lancet 348 (Supp
I), 54-57.
11.
Chishoim, G.M. and Steinberg, D. (2000) The oxidative modification
hypothesis of atherogenesis: an overview. Free Radic. Biol. Med. 28,
18 15-1826.
12.
Gimbrone, M.A., Cybulsky, M.I., Kume, M., Collins, 1. and Resnick,
N. (1995) Vascular Endothelium, An Integrator of Pathophysiological
Stimuli in Atherogenesis. Ann. NYAcad. Sci. 748, 122-133.
13.
Busse, R. and Fleming, I. (1996) Endothelial dysfunction in
Atherosclerosis. J. Vas. Res. 33, 181-194.
14.
Gorias, S.L. (1996) Pathophysiology of Thrombosis and Blood Clotting
Disorders, in Cellular and Molecular Patho genesis, A.E. Sorica, ed.
(Lippincott-Raven Publishers: Philadelphia), 109-143.
134
15.
16.
Rhodin, J.A.G. (1985) Architecture of the Vessel Wall, in the Handbook
of Physiology II. The Cardiovascular System, D.F. Bohr, A.P. Somlyo
and H.V. Sparks, Jr., eds. (American Physiological Society: Bethesda,
MD), 1-31.
Numano, F. and Ross, R. (1997) Endothelial Function and
Atherosclerosis. Ann. NY Acad. Sci 811, 1-60.
17.
Jaffe, Eric A. (1985) Physiologic Functions of Normal Endothelial Cells.
Annals of the N.Y. Acad. Science 454, 279-291.
18.
Somlyo, A.V. (1980) Ultrastructure of vascular smooth muscle.
19.
Owens, G.T. (1996) Regulation of Differentiation Vascular Smooth Muscle
20.
Taromina, P.A., Gibbs, M.H. and Huff, J.W. (1956) The utilization of lhydroxyl--methyl-valerolactone in cholesterol biosynthesis. J. Am.
Chem. Soc. 78, 4498-4499.
21.
Block, K., Rittenberg, D. (1992) On the utilization of acetic acid for
cholesterol formation. J. Biol. Chem. 145, 625-636.
22.
Woodward, R.D. and Bloch, K. (1953) The cyclization of squalene in
cholesterol synthesis. J. Am. Chem. Soc. 75, 2023-2024.
23.
Folkers, K., Shunk, C.H., Linn, B.O., Robinson, F.M., Wittreich, P.E.,
Huff, J.W., Silfillian, J.L. and Skeggs, H.K. (1959) Discovery and
Handbook of Physiology II The Cardiovascular System. D.F. Bohr,
A.P. Somylo and H.V. Sparks Jr., eds. (Americal Physiological Society:
Bethesda, MD), 33-67.
Cells. Physiol. Rev. 75 (3), 487-5 17.
Elucidation of Mevalonic Acid in Biosynthesis of Terpenes and Sterols.
G.E.W. Wolstenholme and M. O'Connor, eds. (J.A. Churchill Ltd:
London) 20-45.
24.
Spurgeon, S.L. and Porter, J.W. (1981) Introduction in the Biosynthesis
of Isoprenoid Compounds, Volume 1, J.W. Porter and S.L. Spurgeon,
eds. (John Wiley and Sons:New York) 1-46.
25.
Tavormina, P.A., Gibbs, M.H. and Huff, J.W. (1956) The utilization of 3hydroxyl--methyl-valero1actone in cholesterol biosynthesis. J. Am.
Chem. Soc. 78, 4498-4499.
26.
Brady, R.O. and Gurin, S. (1951) J. Biol. Chem. 191, 371-375.
27.
Curran, G.L. (1951) J. Biol. Chem. 191, 775-781.
28.
Rudney, H. (1959) The biosynthesis of 3-hydroxy--methylglutaric
coenzyme A and its conversion to mevalonic acid, in CIBA Foundation
Symposium on the Biosynthesis of Terpenes and Sterols.
(Churchill:London) 75-90.
135
29.
Brown, M. and Goldstein, J. (1990) Regulation of the mevalonate
30.
Hampton, R., Dimster-Denk, D. and Rine, J. (1976) The biology of
HMG-CoA reductase: the pros of contra-regulation. TIBS 21(4), 140-
pathway. Nature 343, 425-430.
145.
31.
Woese, C.R., Kandler, 0. and Wheelis, M.L. (1990) Towards a natural
selection of organisms. Proposal for the domains Archaea, Bacteria, and
Eucarya. Proc. Nati. Acad. Sci. USA 87, 4576-4579.
31.
Lam, W.L. and Dolittle, W.F. (1992) Mevinolin-resistant mutations
identify the promotor and the gene for eukaryote-like 3-hydroxy-3methylglutaryl-coenzyme A reductase in the archaebacterium Haloferax
volcania. J. Biol. Chem. 267, 5829-5834.
32.
Gil, G., Faust, J.R., Chin, D.J., Goldstein, J.L. and Brown, M.S. (1985)
Membrane bound domain of 11MG CoA reductase is required for sterol-
enhanced degradation of the enzyme. Cell 41, 249-258.
33.
Sagami, H., Kikuchi, A., Ogura, K., Fushihara, K., Nishino, T. (1994)
Novel isoprenoid proteins in Halobacteria. Biochem. Biophys. Res.
Comm. 203, 972-978.
34.
Dewick, P.M. (1995) The biosynthesis of C5-C20 terpenoid compounds.
Nat. Prod. Rep. 12, 507-534.
35.
Block, Konrad (1994) Evolutionary perfection of a small molecule.
Blondes in Venetian Paintings. (Vail PalIou Press, Binghamton:New
York) 14-36.
36.
37.
Keller, G.A., Bartona, M.C., Shapiro, D.J. and Singer, S.J. (1986) 3-
hydroxy-methylglutaryl-coenzyme A reductase is present in peroxisomes in
normal liver cells. Proc. Nati. A cad. Sci. USA 82, 770-774.
Krisans, S.K. (1996) Cell Compartmentalization of Cholesterol
Biosynthesis in Peroxisomes, Biology ad Role in Toxicology and Disease.
Ann. NYAcad. Sci. 804, 142-161.
38.
Ericsson, J. and Dallner, G. (1993) Distribution, Biosynthesis and
Function of Mevalonic Pathway Lipids. Subcellular Biochem. 21, 229272.
39.
Bittman, R. ed. (1997) Cholesterol: Its Functions and Metabolism in
Biology and Medicine. Subcellular Biochemistry 28.
40.
Sato, R. and Takano, T. (1995) Regulation of Intracellular Cholesterol
Metabolism. Cell Structure and Function 20, 42 1-427.
136
41.
Libby, P., Aikawa, M. and Schönbeck, U. (2000) Cholesterol and
Atherosclerosis, Biochim. Biophys. Acta 1529, 299-309.
42.
Johnson, W., Phillips, M. and Rothblat, G. (1997) Subcellular
Biochemistry 28, 235-276.
43.
Walsh, M., Teals, S. and Gamble, W. (1969) Biosynthesis of cholesterol
by the bovine aorta and the mechanism of action of parachlorophenoxyisobutyric acid. Arch. Biochem.Biophys. 130, 7-18.
44.
Endo, A., Tsujita, Y., Kuroda, M., Tanzawa, K. (1979) Biochim. Biphys.
Acta 575, 266-276.
45.
Hashimoto, S. and Dayton, S. (1980) Lipid metabolism of arterial smooth
muscle in the cardiovascular system. Handbook of PhysiologyThe
Cardiovascular System.. D. Bohr, A. Somlyo and H. Sparks, eds.
(American Physiological Society, Bethesda, MD), 576-615.
46.
Kruth, H.S. (1997) The fate of lipoprotein cholesterol entering the arterial
wall. Curr. Opin. Lipid. 8, 246-252.
47.
Windaus, A. (1910) Ubu den gehalt normaler und atheromatöser aorten an
cholesterin und cholesterin und cholesterinestern. Hoppe-Seyler. 2. 67,
174-192.
48.
Kruth, H.S. (1997) Cholesterol deposition in atherosclerotic lesions.
Subcellular Biochem. 28, 3 19-362.
49.
Hemming, F. (1980) Biosynthesis of Dolichols and Related Compounds in
Biosynthesis of Isoprenoid Compounds, Porter, J. and Spurgeon, S., eds.
(New York: John Wiley and Sons), 305-369.
50.
Ekström, T., Chojnacki, T. and Dailner, G. (1984) Metabolic Labeling of
Dolichol and Dolichyl Phosphate in Isolated Hepatocytes. J. Biol. Chem.
259, 10460-10468.
51.
Grunler, J., Ericsson, J. and Dallner, G. (1994) Branched point reactions
in the biosynthesis of cholesterol, dolichol, ubiquinone, and prenylated
proteins. Biochim. Biophys. Acta 1212, 259-277.
52.
Low, P., Peterson, E., Edlund, C., Brunk, U. and Appelkvist, E. (1992)
Non-membrane Associated Dolichol in Rat Liver. Lipids 27, 1-9.
53.
Jakobsson-Borin, A., Aberg, F. and Dallner, G. (1994) Lipid peroxidation
and mitochondrial membranes extracted with n-pentane and reconstituted
with ubiquinol, dolichol, and cholesterol. Biochim. Biophys. Acta 1213,
159- 166.
54.
Jialal, I. and Devaraj, 5. (1996) The role of oxidized low density
lipoprotein in atherogenesis. J. Nutrition 126, 10535-10575.
137
55.
Hirose, N., Arai, Y., Kawamura, M. and Shigernatu, H. (1996) Beyond
oxidized LDL: The initiation and progression of Atherosclerosis. Keiko
Med. Journal. 45, 90-94.
56.
Stocker, R., Bowry, V.W. and Frei, B. (1991) Ubiquinol-lO protects
against human low density lipoprotein more effectively against lipid
peroxidation than does alpha-toccpherol. Proc. Nati. Acad. Sci. USA 88,
1646-1650.
57.
Weinstein, J.D., Branchaud, R., Beale, S.I., Bement, W.J. and Sinclair,
P.R. (1986) Biosynthesis of the farnesyl moiety of heme a from exogenous
mevalonic acid by cultured chick liver cells. Arch. Bioch. Biophys. 245,
44-50.
58.
Senapathy, P. and Jacob, M.T. (1981) Identification and purification of
tRNAs containing N-6 (delta-2-isopentenyl)-adenosine using antibodies
specific for N-6 (delta-2-isopentenyl)-adenosine. J. Biol. Chem. 256,
11580-11584.
59.
Faust, J. and Dice, J. (1991) Evidence for isopentenyladenine modification
on a cell cycle regulated protein. J. Biol. Chem. 266, 996 1-9970.
60.
Kasten, B., Buck, F., Nuske, J. and Reski, R. (1997) Cytokinin affects
nuclear- and plastome-encoded energy-converting plastid enzymes. Planta
201, 261-72.
61.
Sinensky, M.
62.
Sasseville, A.M. and Raymond, Y. (1995) Lamin A precursor is localized
to intranuclear foci. J. Cell Sci. 108, 273-285.
63.
Zhang, F. and Casey, P. (1996) Protein prenylation: molecular
mechanisms and functional consequences. Ann. Rev. Biochem. 65, 241269.
64.
Sinensky, M. (2000) Functional aspects of polyisoprenoid substituents:
roles in protein-protein interaction and trafficking. Biochim. Biophys. Acta
1529, 203-209.
65.
Harris, C.M. and Poulter, C.D. (2000) Recent studies on the mechanism of
protein prenylation. Nat. Prod. Rep. 17, 137-144.
66.
Cohen, L.H., Pieterman, E., van Leeuwon, R.E., Overland, M., Burm,
B.E., van der Marel, G.A. and van Boom, J.H. (2000) Inhibitors of
prenylation of ras and other G-proteins and their application as therapeutics.
Biochem. Pharmacol. 60, 1061-1068.
138
67.
Epstein, W.W., Lever, D., Leining, M. (1991) Quantitation of
prenylcysteine by a selective cleavage reaction. Proc. Nat!. Acad. Sci.
USA 88, 9668-9670.
68.
Qesney-Huneeus, V., Wiley, M. and Siperotein, M. (1979) Essential role
for mevalonate synthesis in DNA replication. Proc. Nat!. Acad. Sci. USA
76, 5056-5060.
69.
Siperstein, M. (1991) Cholesterol, cholesterogenesis, and cancer in
Nutrition and Biotechnology in Heart Disease and Cancer, ed. J.B.
Longenecker. (Plenum Press: New York) 155-166.
70.
Coleman, P., Chen, L.C. and Sepp-Lorenzino, L. (1997) Cholesterol,
metabolism and tumor cell proliferation. Subcellular Biochemistry 28,
363-435.
71.
Lowry, D.R. and Williamson, B.H. (1993) Function and regulate of RAS.
Ann. Rev. Biochem. 62, 851-891.
72.
Coleman, P., Chen, L.C. and Supp-Lorenzino, L. (1997) Cholesterol
metabolism and tumor cell proliferation. Subcellular Biochemistry 28,
363-435.
73.
Cohen, L.H., Pieterman, E., van Leewen, P.E., Overhand, M., Burm,
B.E., van der Mavel, G.F. and van Boom, J.H. (2000) Inhibitors of
prenylation of ras and other G-proteins and their application as therapeutics.
Biochemical Pharmacol. 60, 1061-1068.
74.
Kellott, G.J. (2000) Perspectives on cancer chemoprevention research and
drug development methods. Adv. Cancer. Res. 78, 199-334.
75.
Linder, J.R. and Betz, D.C. (1978) Sterol synthesis and CO2 production
from mevalonate in calves. J. Lipid Research 19, 836-840.
76.
Edmond, J. and Popjak, G. (1974) Transfer of carbon atoms from
mevalonate to n-fatty acids. J. Biol. Chem. 249, 66-71.
77.
Weinstock, S.B., Kopito, R. R., Endeman, G., Tomera, J.F., Marinier,
E., Murray, D.M. and Brunegraber, H. (1984) The shunt pathway of
mevalonate metabolism in the isolated perfused rat kidney. J. Biol. Chem.
259, 8934-8944.
78.
Schwabauer, R.A., Li, C.H., Adams, G.S. and Gamble, W. (1988)
Utilization of mevalonate by aorta for the synthesis of medium-chain n-fatty
acids. Biochim. Biophys. Acta 960, 139-147.
79.
Marinier, E., Lincoln, B.C., Garneau, M., David, F. and Brunengraber,
H. (1987) Contribution of the shunt pathway of mevalonate metabolism to
the regulation of cholesterol synthesis in rat liver. J. Biol. Chem. 262,
16936-16940.
139
80.
Landau, B.R. and Brunengraber, H. (1985) Shunt pathway of mevalonate
metabolism. Methods Enzymol. 110, 100-114.
81.
O'Neill, H.J., Gordon, S.M., Krotoszynski, B., Kavin, H. and Szioon,
J.P. (1987) Identification of isoprenoid-type components in human expired
air: a possible shunt pathway in sterol metabolism. Biomed. Chromatogr.
2, 66-70.
82.
Keung, W.M. (1991) Human liver dehydrogenases catalyze the oxidation
of the intermediary alcohols of the shunt pathway of mevalonate
metabolism. Biochem. Biophys. Res. Comm. 174, 70 1-707.
83.
Brady, P.S., Scofield, R.F., Schumann, W.C., Ohgaku, S., Kozikot, K.,
Margolis, J.M. and Landau, B.R. (1982) The tracing of the pathway of
mevalonate's metabolism to other than sterols. J. Biol. Chem. 257,
10742-10746.
84.
Charon, L., Hoeffler, J.F., Pale-Grosdemange, C., Lois, L.M., Campos,
N., Boronat, A. and Rohmer, M. (2000) Deuterium-labelled isotopomers
of 2-C-methyl-D-erythritol as tools for the elucidation of the 2-C-methyl-Derythritol 4-phosphate pathway for isoprenoid biosynthesis. Biochemical
J. 346, 737-742.
85.
86.
Rohmer, M. (1999) The discovery of a mevalonate-independent pathway
for isoprenoid biosynthesis in bacteria, algae and higher plants. Nat. Prod.
Rep. 16, 565-574.
Disch, A., Schwender, J., Muller, C., Lichtenthaler, H.K. and Rohmer,
M. (1998) Distribution of the mevalonate and glyceraldehyde
phosphate/pyruvate pathways for isoprenoid biosynthesis in unicellular
algae and the cyanobacterium Synechocystis PCC 6714. Biochem. J. 333,
38 1-388.
87.
Lichtenthaler, H.K., Schwender, J., Disch, A., Rohmer, M. (1997)
Biosynthesis of isoprenoids in higher plant chioroplasts proceeds via a
mevalonate-independent pathway. FEBS Lett. 400, 27 1-274.
88.
Schwender, J., Seemann, M., Lichtenthaler, H.K. and Rohmer, M. (1996)
Biosynthesis of isoprenoids (carotenoids, sterols, prenyl side-chains of
chiorophylls and plastoquinone) via a novel pyruvate/glyceraldehyde 3phosphate non-mevalonate pathway in the green alga Scenedesmus
obliquus. Biochem. J. 316, 73-80.
89.
Ginger, M.L., Chance, M.L., Sadler, I.H. and Goad, L.J. (2001) The
90.
Mann, R.K. and Beachy, P.A. (2000) Cholesterol modification of
proteins. Biochim. Biophys. Acta 1529, 188-202.
biosynthetic incorporation of the intact leucine skeleton into sterol by the
trypanosomatid Leichmania mexicana. JBC papers in press. January 8,
2001 as manuscript M006850200.
91.
Hammerschmidt, M., Brook, A. and McMahon, A. (1997) The world
according to hedgehog. Trends in Genetics 13, 14-21.
92.
Alcedo, J. and Noll, M. (1994) Hedgehog and its patched-smoothened
receptor complex: a novel signalling mechanism at the cell surface.
Biological Chemistry 378, 583-590.
93.
Lee, J.J., Ekker, S.C., von Kessler, D.P., Porter, J.A., Sun, B.!. and
Beachy, P.A. (1994) Autoproteolysis in hedgehog biosynthesis. Science
266, 1528-1537.
94.
Porter, J., Young, K. and Beachy, P.A. (1996) Cholesterol modification
of hedgehog signalling proteins in animal development. Science 274, 255259.
95.
Adams, G.S. (1971) Isoprenoids of bovine aorta: isolation, purification
and biosynthesis. Ph.D. Thesis, Oregon State University.
96.
Koh, K.K. (1999) Effect of statins on the vascular wall: Vasomotor
function, inflammation, and plaque stability. Cardiovas. Res. 47, 648657.
97.
(1997) Pharmacodynamics and pharmacokinetics of the HMG-CoA
reductase inhibitors. Similarities and differences. Clin. Pharmacokinet 32,
403-425.
98.
Corsini, A. (2000) Fluvastatin effects beyond cholesterol lowering. J.
Cardiovascular Pharmacol. Ther. 5, 6 1-75.
99.
Bellosta, S., Fern, N., Bernini, F., Paoletti, R. and Corsini, A. (2000)
Non-lipid-related effects of statins. Ann. Med. 32, 164-176.
100.
Bellosta, S., Bernini, F., Fern, N., Quarato, P., Canavesi, M., Arnaboldi,
L., Fumagalli, R., Paoletti, R. and Corsini, A. (1998) Direct vascular
effects of HMG-CoA reductase inhibitors. Atherosclerosis 137, S 101S 109.
101.
Sakai, M., Kobori, S., Matsumura, T., Biwa, T., Sato, Y., Takemura, T.,
Hakamata, H., Horiuchi, S. and Shichiri, M. (1997) HMG-CoA reductase
inhibitors suppress macrophage growth induced by oxidized low density
lipoprotein. Atherosclerosis 133, 51-59.
102.
Elson, C.E., Peffley, D.M., Hentosh, P. and Mo, H. (1999) Isoprenoidmediated inhibition of mevalonate synthesis: potential application to cancer.
Proc. Soc. Exp. Biol. Med. 221, 294-311.
103.
Raiteri, M., Amabaldi, L., McGready, P., Geib, M.H., Veri, D.,
Tagliabue, C., Quarato, P., Ferraboschi, P., Santianello, E., Paoletti, R.,
Fumagelli, R. and Corsini, A. (1997) Pharmacological control of the
mevalonate pathway: effect on arterial smooth muscle cell proliferation. J.
Phar,nacol. Exp. Ther. 281, 1144-1153.
141
104.
105.
106.
Rogla, G., Lackner, K.J. and Schmitz, G. (1995) Mevalonate is essential
for growth of porcine and human vascular cells in vitro. Basic Res.
Cardiol. 90.
Roollet, J.B., Xue, H., Roullet, C., Fletcher, W., Cipolla, M. and Harku,
C. (1995) Mevalonate availability affects human and rat resistance vessel
function. J. Clin. Invest. 96, 239-244.
Roollet, J.B., Xue, H., Pappu, A., Roullet, C., Holcomb, S. and
McCarron, D.A. (1993) Mevalonate availability and cardiovascular
functions. Proc. Nati. Acad. Sci. USA 90, 11728-1 1732.
107.
Martinez-Gonsalez, J., Vinals, M., Vidal, F., Llorente-Cortes, V. and
Badimon, L. (1997) Mevaloriate deprivastin impairs IGF-Ilinsulin signaling
in human vascular smooth muscle cells. Atherosclerosis 135, 213-223.
108.
Finder, J.D., Litz, J.L., Blaskovitch, M.A., McGuire, T.F., Qian, Y.,
Hamilton, A.D., Davies, P., Sebti, S.M. (1997) Inhibition of protein
geranylgeranylation causes a superinduction of nitric-oxide synthase-2 by
interleukin-1-beta in vascular smooth muscle cells. J. Biol. Chem. 272,
13484- 13488.
109.
Schmidt, H.H.W. and Walter, U. (1994) NO at work. Cell 78, 919-925.
110.
Roullet, J.B., Luft, U.C., Xue, H., Chapman, J., Bychev, R., Roullet,
C., Luft, F.C., Hailer, H. and McCarron, D.A. (1997) Farnesol inhibits Ltype Ca2 Channels in Vascular Smooth Muscle Cells. J. Biol. Chem.
272, 32240-32246.
111.
Pomerantz, K.B., Lander, H.M., Summers, B., Robishaw, J., Balcueva,
E. and Hajjar, D.P. (1997) G-Protein-mediated signalling in cholesterolenriched arterial smooth muscle cells. 1. Reduced membrane-associated
G-protein content due to diminished isoprerylation of G-gamma subunits
and p21 ras. Biochemistry 36, 9523-953 1.
112.
Wiggers, K.D., Jacobsen, N.L., Getty, R. and Richard, M. (1973)
Depression of plasma cholesterol in calves by supplementing a high
cholesterol diet with dry feed. J. Nutr. 103, 1533-1536.
113.
Wiggers, K.D., Jacobson, N.L., Getty, R. and Richard, M. (1973) Mode
of cholesterol ingestion and atherosclerosis in the young bovine.
Atherosclerosis 17, 28 1-295.
Wiggers, K.D., Jacobsen, N.L. and Getty, R. (1971) Atherosclerosis in
ruminants. J. Animal Sci. 32, 1037-104 1.
114.
115.
Peterson, G.L. (1979) Review of the Folin Phenol Protein quantitation
method of Lowry. Anal. Biochem. 100, 20 1-220.
116.
Peterson, G.L. (1984) Determination of total protein. Meth. Enz. 91, 95119.
142
1 17.
Bradford, M. (1976) A rapid and sensitive method for the quantitation of
microgram quantities of protein utilizing the principle of protein dye
binding. Anal. Biochem. 72, 248-253.
118.
Heathcoate, J.G. and Washington, J.R. (1967) Analyst 92, 627-635.
119.
Reid, R.L. and Leelerer, M. (1951) Separation and estimation of C2-C7
fatty acids by paper partition chromatography. Biochem. J. 50, 61-67.
120.
Sangor, F. and Tuppy, H. (1951) The amino acid sequence in the
phenylalanine chain of insulin. I. The identification of lower peptides
from partial hydrolysates. Biocheni. J. 49, 463-48 1.
121.
Redfield, R.R. (1953) Two dimensional paper chromatographic systems
with high resolving power for amino acids. Biochim. Biophys. Acta 10,
344-352.
122.
Brown, J.R. and Hartley, B.S. (1966) Location of disulfide bridges by
diagonal paper electrophoresis. The disulfide bridges of bovine
chymotrypsinogen A. Biochein. J. 101, 2 14-228.
123.
Malencik, D.A., Zhao, Z. and Anderson, S.R. (1990) Determination of
dityrosine, phosphotyrosine, phosphothreonine and phosphoserine by high
performance liquid chromatography. Anal. Biochem. 184, 353-357.
124.
Malencik, D.A. (1997) Personal communication.
125.
Knecht, R. and Chang, J.Y. (1986) Liquid chromatographic determination
of amino acids after gas-phase hydrolysis and derivitization with 4dimethylamino azobenzene sulfonyl chloride. Anal. Chem. 58, 23752379.
126.
Meyers, W.F. and Hang, K.Y. (1969) Thin layerchromatography
127.
Edman, P. and Henschen A. (1975) Sequence Determination. Volume 8 of
Molecular Biology Biochemistry and Bophysics, S.B. Needleman, ed.
(Springer-Verlag: New York), 232-279.
128.
Smith, B. J. (1994) Chemical cleavage of proteins. Methods in Mo! Biol
32, 297-309.
129.
James, P. (ed). (2000) Proteome Research: Mass Spectrometry.
(Springer-Verlag: New York) 271 p.
130.
Hunt, D, F., Yates, J. R III, Shabonowitz H., Winston, S. and Hauer, C.
R. (1984) Protein sequencing by tandem mass spectrometry. Proc. Nat!.
Acad.Sci. USA 83,6233-6237.
132.
Thistle, J. L., Carison, G. L., Hofman, N. F., Larusso, N. F.,
MacCarty, R. L., Flynn, G.L., Higuchi, W. I., and Babayan V. K.,
(1980). Monooctanoin, a dissolutin agent for retained cholesterol bile duct


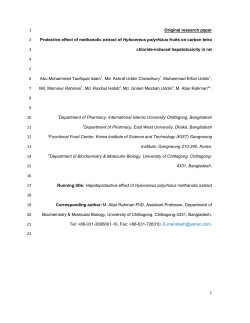


© Copyright 2026