
Evaluation of the Diagnostic Accuracy of Prototype Rapid
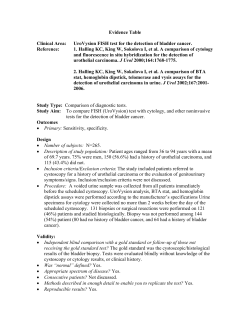
Evaluation of the Diagnostic Accuracy of Prototype
Rapid Tests for Human African Trypanosomiasis
Jeremy M. Sternberg1*, Marek Gierlin´ski2, Sylvain Bie´ler3, Michael A. J. Ferguson2, Joseph M. Ndung’u3
1 Institute of Biological and Environmental Sciences, University of Aberdeen, Aberdeen, United Kingdom, 2 College of Life Sciences, University of Dundee, Dundee, United
Kingdom, 3 Foundation for Innovative New Diagnostics (FIND) Campus Biotech, Geneva, Switzerland
Abstract
Background: Diagnosis of human African trypanosomiasis (HAT) remains a challenge both for active screening, which is
critical in control of the disease, and in the point-of-care scenario where early and accurate diagnosis is essential. Recently,
the first field deployment of a lateral flow rapid diagnostic test (RDT) for HAT, ‘‘SD BIOLINE HAT’’ has taken place. In this
study, we evaluated the performance of ‘‘SD BIOLINE HAT’’ and two new prototype RDTs.
Methodology/Principal Findings: The performance of ‘‘SD BIOLINE HAT’’ and 2 prototype RDTs was tested using archived
plasma from 250 Trypanosoma brucei gambiense patients, and 250 endemic controls. As well as comparison of the sensitivity
and specificity of each device, the performance of individual antigens was assessed and the hypothetical performance of
novel antigen combinations extrapolated. Neither of the prototype devices were inferior in sensitivity or specificity to ‘‘SD
BIOLINE HAT’’ (sensitivity 0.8260.01, specificity 0.9760.01, 95% CI) at the 5% margins, while one of the devices (BBI) had
significantly superior sensitivity (0.8860.03). Analysis of the performance of individual antigens was used to model new
antigen combinations to be explored in development of the next generation of HAT RDTs. The modelling showed that an
RDT using two recombinant antigens (rLiTat1.5 and rISG65) would give a performance similar to the best devices in this
study, and would also offer the most robust performance under deteriorating field conditions.
Conclusions/Significance: Both ‘‘SD BIOLINE HAT’’ and the prototype devices performed comparably well to one another
and also to the published performance range of the card agglutination test for trypanosomiasis in sensitivity and specificity.
The performance of individual antigens enabled us to predict that an all-recombinant antigen RDT can be developed with
an accuracy equivalent to ‘‘ SD BIOLINE HAT.’’ Such an RDT would have advantages in simplified manufacture, lower unit
cost and assured reproducibility.
Citation: Sternberg JM, Gierlin´ski M, Bie´ler S, Ferguson MAJ, Ndung’u JM (2014) Evaluation of the Diagnostic Accuracy of Prototype Rapid Tests for Human
African Trypanosomiasis. PLoS Negl Trop Dis 8(12): e3373. doi:10.1371/journal.pntd.0003373
Editor: Jayne Raper, New York University School of Medicine, United States of America
Received August 29, 2014; Accepted October 26, 2014; Published December 18, 2014
Copyright: ß 2014 Sternberg et al. This is an open-access article distributed under the terms of the Creative Commons Attribution License, which permits
unrestricted use, distribution, and reproduction in any medium, provided the original author and source are credited.
Data Availability: The authors confirm that all data underlying the findings are fully available without restriction. All relevant data are within the paper and its
Supporting Information files.
Funding: MAJF is supported by a Wellcome Trust Senior Investigator Award (101842) and MG by a Wellcome Trust Technology Platform Strategic Award
(097945). These funders had no role in study design, data collection and analysis, decision to publish, or preparation of the manuscript. JMS was supported by
FIND solely for the material and staff costs of the RDT evaluation, and this funder had no role in data collection and analysis, decision to publish and preparation
of manuscript.
Competing Interests: The authors have declared that no competing interests exist.
* Email: [email protected]
chronic and may persist for several years although there is a
spectrum of presentations within each sub-species [4].
Drug treatment, albeit with problems of toxicity, is available for
both sub-species [5], and this in combination with control
programmes dealing with the vector and infections in zoonotic
hosts have reduced the disease prevalence [6]. While the number
of reported new cases is now less than 10,000 per year, it is likely
that there is considerably greater burden of undiagnosed cases due
to diagnostic challenges and inadequate surveillance. The clinical
signs of HAT, especially in the early stages, are difficult to
distinguish other infectious diseases such as malaria [7]. Initial
screening of patients involves indirect diagnostic techniques, the
most widely used of which is a serological test, the Card
Agglutination Test for Trypanosomiasis (CATT) [7]. This must
be followed by parasitological diagnosis, which is laborious, may
Introduction
Human African trypanosomiasis (HAT), otherwise known as
sleeping sickness, is caused by infection with the haemoflagellate
parasites Trypanosoma brucei gambiense (in west and central
Africa) and T. b. rhodesiense (in east and southern Africa) [1].
Infection is initiated after the bite of an infected tsetse fly vector
and progresses through an ‘‘early’’ stage when parasites proliferate
in the haemo-lymphatic system causing a febrile illness, followed
by a second or ‘‘late’’ stage of disease in which parasites invade the
central nervous system (CNS) causing meningoencephalitis [2].
This latter stage is associated with neurological disturbances and
ultimately death [3]. Overall, T. b. rhodesiense infections have an
acute presentation with the onset of late stage and death within a
few months of infection, while T. b. gambiense infections are
PLOS Neglected Tropical Diseases | www.plosntds.org
1
December 2014 | Volume 8 | Issue 12 | e3373
Rapid Tests for Human African Trypanosomiasis
antibodies in finger prick samples of human blood. RDTs based
on lateral flow devices are simple to use, easy to read and have
stability characteristics that allow distribution and availability in
remote endemic areas. Recently the first RDT for HAT was
deployed in the field. The test, developed by the Foundation for
Innovative New Diagnostics (FIND) and Standard Diagnostics
(SD BIOLINE HAT), is based on a device using native variant
surface glycoproteins (VSG) LiTat1.3 and LiTat1.5 to detect
antibodies to trypanosomes [16]. A further lateral flow RDT based
on these antigens (HAT Sero-K-SeT) has been described and
developed by Coris Bioconcept [17].
In this paper we describe two further devices developed by SD
and BBI Solutions (UK). The first uses recombinant LiTat1.3 and
LiTat1.5 antigens. While these are the same antigenic targets as
used in the SD BIOLINE HAT, HAT Sero-K-SeT and CATT
(LiTat1.3) tests, the use of recombinant antigens has potential to
simplify the production and reduce the costs of RDTs. The second
prototype device, that uses the diagnostic potential of ISG65 [18],
is based on a combination of recombinant ISG65 and a native
VSG MiTat1.4 [19]. ISG65 is one of two well-characterised
moderately abundant invariant type-1 trans-membrane domain
surface glycoproteins that is expressed in Trypanosoma brucei [20].
A summary of the three RDTs studied here is presented in
Table 1.
The aim of this study was to evaluate the performance of the
two new prototype RDTs in comparison to SD BIOLINE HAT in
a side-by-side analysis using archived plasma samples from HAT
patients and endemic controls.
Author Summary
The most prevalent species of trypanosome causing
human African trypanosomiasis (HAT), Trypanosoma brucei
gambiense, presents a diagnostic challenge. While early
diagnosis is essential for effective treatment and also to
control transmission, symptoms are non-specific and
parasitological diagnosis is laborious and technically
difficult. Screening for HAT suspects has until now been
done using the card agglutination test for trypanosomiasis
(CATT), which requires a cold chain and equipment,
making it difficult to deploy. Thus there is an urgent need
for sensitive point of care diagnostic tests that are suitable
for use in rural areas in terms of stability, simplicity and
cost. We describe the evaluation of 3 rapid diagnostic tests
(RDTs) for HAT based on lateral flow devices that detect
antibodies against defined parasite antigens in blood
samples. We demonstrate that the SD BIOLINE HAT RDT
currently being deployed in HAT endemic regions, as well
as two new prototype devices, are accurate in screening
for HAT. By analysing the sensitivity of each of the antigens
used in the devices tested, we predict that a highly
sensitive RDT based on recombinant antigens can be
developed. An all-recombinant antigen RDT offers significant benefits in manufacturing reproducibility and cost,
and would dramatically simplify HAT diagnosis.
require concentration techniques due to low parasitaemia, and
must be carried out by skilled microscopists.
The CATT is based on the agglutination by serum antibodies of
lyophilized bloodstream forms of T. b. gambiense expressing
variant surface glycoprotein type LiTat1.3, which is expressed
widely in T. b. gambiense isolates. Using undiluted blood, reported
sensitivity varies between 0.688 and 1 and specificity between
0.835 and 0.993 [8]. Cases where specificity and sensitivity are
lower are most likely due to exposure of the host to nonpathogenic trypanosomes [9] and infections with clones of T. b.
gambiense that do not express LiTat1.3 [10], respectively.
Although a valuable diagnostic, the CATT does not meet the
ASSURED criteria [11] due to a lack of robustness [8], and the
production process is also difficult to scale up. Yet, CATT is the
only indirect diagnostic test that comes close to meeting the
ASSURED criteria. Other immunological and molecular methods
that perform well in a laboratory setting are expensive to conduct
and require a combination of specialized equipment and skilled
personnel (reviewed in [8]). Thus, for the aims of eliminating HAT
by 2020 as envisaged by the WHO Roadmap [12] and the
London Declaration on NTDs [13] to be achieved, it will be
essential to develop ASSURED compliant tests that are easy to
produce at scale.
Immunochromatographic lateral flow devices are capable of
detecting low concentrations of antibodies to target antigens in
biological fluids [14,15]. This technology may be used to develop
rapid diagnostic tests (RDTs) that can detect anti-trypanosome
Methods
Study Design
This was a retrospective study. Clinical samples of heparinised
plasma were obtained from 250 T. b. gambiense patients and 250
endemic controls. The sample size of infected and control groups
was calculated to detect a 5% performance margin between
devices at a power of 0.8 and confidence level of 0.95. The samples
were obtained from FIND-sponsored field studies in Angola,
Central African Republic (CAR) and Uganda, and held in
cryobanks in Makerere University (Uganda) and the University
of Limoges (France). Demographic details of the patient and
control cohorts are presented in S1 Table. The infection status of
patients was confirmed by observation of parasites in the blood,
lymphatic system or cerebrospinal fluid, and this provided the
reference standard. Patient samples were collected consecutively
and there was no further selection for the purpose of this study.
Controls were CATT negative and had no history of HAT or
evidence of trypanosomes in blood when tested using the
miniature anion exchange centrifugation test (mAECT). After
collection, samples from Angola and Uganda were kept in liquid
N2 in the field and during transportation, and then stored frozen at
280uC. In CAR samples were kept at +4uC in the field and
transferred to a central laboratory within 14 days where they were
Table 1. Antigens used in the three RDTs.
RDT
Band 1
Band 2
Reference
NatSD
LiTat1.3
LiTat1.5
[16]
RecSD
rLiTat1.3
rLiTat1.5
Not published
BBI
rISG65
MiTat1.4
[19]
doi:10.1371/journal.pntd.0003373.t001
PLOS Neglected Tropical Diseases | www.plosntds.org
2
December 2014 | Volume 8 | Issue 12 | e3373
Rapid Tests for Human African Trypanosomiasis
stored at 280uC. Samples were sent frozen on dry ice to the
University of Dundee where they were blinded and randomised,
and then to the University of Aberdeen for testing with the RDTs.
The readers in Aberdeen were blind to the status of all samples.
scored as 0, 1+, 2+, 3+ or 4+ depending on colour intensity.
Additionally, where readers detected a faint band that was judged
below the threshold of the 4-point standard (+/-), the result was
annotated with a score of 0.5 and used in a reanalysis of the
accuracy of each device. The 3rd band on each device was a
control band. Devices (4/1000 BBI devices and 1/1000 RecSD
device) where no control band was observed were discarded and
the test repeated on a new device.
Each RDT was scored independently by each of two readers.
The readers were not aware of each other’s scores until they had
both been recorded. Primary and secondary readings took place
within 5 minutes of each other.
Ethics Statement
All clinical samples were obtained after written informed
consent. Country-specific study protocols were approved by the
following institutional review boards: Comissa˜o de E´tica do
Instituto de Combate e Controlo das Tripanossomiases (Angola,
Meetings 12/02/08 and 12/07/11), Comite´ scientifique charge´ de
la validation des proto-coles d’e´tudes et des re´sultats de la Faculte´
des sciences de la sante´ de l’Universite´ de Bangui (CAR, 9/UB/
FACSS/CSCVPER/12) and Uganda National Council for
Science and Technology (HS 792).
Data Analysis
After all plasma samples had been run and scored, the raw data
were sent to Dundee University for the sample codes to be unblinded and identified as infected or control. Each score (0, 1+, 2+,
3+ 4+) was represented by an integer between 0 and 4. In a second
run analysis we rescored all the bands that had been annotated as
faint and below threshold as 1. We established an arbitrary limit,
L, to decide whether a score is positive or negative. A score was
considered positive if it was greater than or equal to L. Unless
otherwise stated in the results, sensitivity, specificity and accuracy
were calculated at the cut-off level of L = 1. When two antigen
bands were read from a single device, the result was considered
positive if either of the scores was positive. These positives and
negatives were then compared with patient data and the total
counts of true positives (TP), false positives (FP), true negatives
(TN) and false negatives (FN) were summed across all patients for
each reader and each duplicate device. The sensitivity, specificity
and accuracy were defined as
Rapid Diagnostic Tests
Three RDTs were used in this study (\).
N
N
N
A registered and commercialized RDT (‘‘SD BIOLINE
HAT’’) manufactured by Standard Diagnostics, Inc. (SD) that
is based on two native VSGs LiTat 1.3 and VSG LiTat 1.5
antigens (hereafter NatSD)
A prototype RDT developed by SD that is based on
Baculovirus-expressed recombinant VSG LiTat 1.3 and
VSG LiTat 1.5 antigens (RecSD)
A prototype RDT developed by BBI Solutions that is based on
recombinant ISG65 and native VSG MITat 1.4 antigens
(BBI).
Each device was run according to the manufacturers recommendations. Freshly thawed plasma (10 ml for SD devices, 5 ml for
BBI devices) was applied to the sample well, followed by chase
buffer (120 ml for SD devices, 95 ml for BBI devices). Each plasma
sample was applied to duplicate devices. The devices were
incubated for 15 min (NatSD and RecSD) or 30 min (BBI) at
room temperature. After the incubation period, each device was
read by visual comparison using a 4-point lateral flow test standard
(Fig. 1). The appearance of antigen bands (bands 1 and 2) was
Sen~
TP
FPzTN
Spc~1{
FP
FPzTN
Fig. 1. (a) 4-point-standard reference card for scoring RDT bands. Bands were assessed in realtion to the -, +, ++, +++ or ++++ ranges on the
reference card, and then converted to scores of 0, 1+, 2+, 3+ and 4+ respectively. Additionally faint bands (+/-) were recorded as 0.5 and unless
otherwise stated scored as sub-threshold (0). (b) Examples of positive and negative results with each device. Negative devices are presented in panels
(i)–(iii): (i) BBI, (ii) RecSD (iii) NatSD. In all of these devices the bands are scored: 4+, 0, 0 (control, band 2, Band 1). Positive devices are presented in
panels (iv)–(vi.) (iv) BBI bands were scored: control = 4+, 3+, 4+ (v) RecSD bands were scored: 4+, 3+, 1+ (vi) NatSD bands were scored: 4+, 2+ 2+. (vii):
Example of a BBI device scored as negative (4+, 0, 0) but where the readers noted faint bands (+/-) in positions 1 and 2.
doi:10.1371/journal.pntd.0003373.g001
PLOS Neglected Tropical Diseases | www.plosntds.org
3
December 2014 | Volume 8 | Issue 12 | e3373
Rapid Tests for Human African Trypanosomiasis
Acc~
formed the basis of further analysis of RDT and individual antigen
performance.
TPzTN
TPzFPzTNzFN
Performance of Each RDT
The sensitivity, specificity and accuracy of each device are
presented in Fig. 3a and Table 3. Both prototype devices are not
inferior to the NatSD RDT in any of these three parameters at the
required 5% margin. The sensitivity of the BBI device (0.8860.03)
is however significantly superior to both NatSD and RecSD (both
0.8260.01), with p = 961024 and 561024, respectively. All
devices show a performance similar to or better than the range
of sensitivity ($0.7) and specificity ($0.8) reported for the CATT
[8]. The specificity of the NatSD RDT is highest (0.9760.01) but
not significantly superior to the other devices. The accuracy of
both the prototype BBI (0.9160.02) and NatSD (0.89860.009)
devices are significantly higher than the accuracy of the RecSD
device (0.88460.008), with p = 0.003 and 0.01, respectively, and
we found no evidence for the BBI test having different accuracy
from the NatSD RDT (p = 0.06).
respectively. These can be alternatively defined as true and false
positive rates, where TPR = Sen and FPR = 12 Spc,
respectively. For the given reader and duplicate device, the errors
on the above quantities were found as 95% confidence intervals of
a proportion [21]. When reader data were combined, the counts of
TP, FP, TN and FN were averaged across both readers and
duplicate devices, which were considered as a set of 4 replicates.
The mean and its 95% confidence interval were found across these
replicates and errors were then propagated to Sen, Spc and Acc.
The diagnostic results from each plasma sample using replicate
devices or between reader 1 and 2 were tested for agreement using
Cohen’s kappa (k). To compare the duplicate devices, we
aggregated data from both readers and vice versa, to compare
the readers, we aggregated data from both duplicate devices.
Uncertainties of k were estimated following Fleiss et al. [22].
All errors quoted in this work are 95% confidence intervals. The
difference between the means is assessed by a t-test (assuming
equal variance) at a significance level of 0.05.
Effect of Scoring Any Faint Band as Positive (1+)
When scoring the RDTs in this trial, each reader also made a
record of any faint bands in the sub-threshold range (+/-) on the
reference card (Fig. 1a). These were given a nominal score of 0.5,
and were therefore below the cut off limit (L = 1) for a positive
result. In order to determine the effect of including such faint
bands as positive they were rescored as 1+. When this was done
there was an increase in sensitivity for all devices with a loss of
specificity (Table 4). This was most pronounced with the BBI
device with a sensitivity of 0.9660.03 (an increase of 8%) but a
specificity of 0.7960.15 (a loss of 15%). While the recording of
sub-threshold bands marginally increased inter-device agreement
for duplicate devices, it led to a considerable reduction of interreader agreement (Table 5) especially in the case of the BBI
device.
Results
Inter-Reader and Inter-Device Agreement
Examples of each RDT used in this study, in which the different
scores (faint-sub-threshold, 1+, 2+, 3+, 4+) and the difference
between typical positive and negative results, are illustrated in
Fig. 1.
Following scoring of the randomised and blinded groups of 250
HAT patient plasmas and 250 endemic control plasma samples,
the sensitivity and specificity of each RDT was calculated for each
reader and each duplicate test. The results presented in Fig. 2
demonstrate close agreement between readers and duplicate
assays. The level of agreement was further quantified using
Cohen’s k (Table 2). A value of k $0.9 was found for all interduplicate and inter-reader agreements, which represents a very
good level of agreement [23]. As there were no significant
differences between the diagnostic results of the two readers using
the minimum visual score of 1+ for a positive, the duplicate
readings by each reader were re-analysed as four replicates and
Individual Antigen Performance
The scores recorded for each band on the 3 devices allowed the
diagnostic potential of each of the 6 antigens to be evaluated
(Fig. 3). This analysis reveals that NatSD2 (LiTat1.5) provides the
best diagnostic performance, with the highest sensitivity, specificity
and accuracy. This is followed by RecSD2 (rLiTat1.5) and
Fig. 2. Sensitivity and specificity of devices by each reader (R1 and R2) and by duplicate device (D1 and D2). Error bars are 95%
confidence intervals of a proportion.
doi:10.1371/journal.pntd.0003373.g002
PLOS Neglected Tropical Diseases | www.plosntds.org
4
December 2014 | Volume 8 | Issue 12 | e3373
Rapid Tests for Human African Trypanosomiasis
Table 2. Cohen’s kappa and its 95% confidence intervals calculated for each RDT between duplicate devices and between
independent readers.
RDT
Inter duplicate RDT
Inter reader
NatSD
0.9660.02
0.9760.02
RecSD
0.9460.02
0.9660.02
BBI
0.9160.03
0.9360.02
doi:10.1371/journal.pntd.0003373.t002
0.9060.02 is not significantly different to the BBI device evaluated
here.
A similar analysis of performance of hypothetical 3 antigen
band multiplex lateral flow devices for all three-way combinations
of antigens was carried out and demonstrated no significant
improvement in performance over the 2 antigen devices (S1 Fig.).
RecBBI1 (rISG65), which had a comparable sensitivity, but a
poorer specificity.
Predicted Performance of All Antigen Combinations
The performance of each of the antigens was used to predict the
theoretical performance of all combinations of 2 antigens on
hypothetical new RDT formulations (Fig. 3c). This analysis
provides evidence that new antigen pairs have the potential for
use in developing new improved RDTs. On examination, 6 novel
combinations and the BBI device out-perform the NatSD RDT,
providing significantly better sensitivity (data above the dashed line
in Fig. 3c). The top combination with the highest sensitivity and
accuracy is NatSD2+RecBBI1 (LiTat1.5+rISG65), though neither
its sensitivity (0.9060.02) nor accuracy (0.9260.01) is superior to
the prototype BBI device (p.0.1 in both cases). A combination of
NatSD2+NatBBI2 (LiTat1.5+MiTat1.4) is among those with the
highest specificity (0.97260.009) while retaining a high sensitivity
(0.8660.01). The optimal pairing of recombinant antigens is
RecSD2+RecBBI1 (rLiTaT1.5+rISG65), whose accuracy of
Partial ROC Curves
The scores provided by readers for each antigen band are not
binary, but take into account the intensity of the band, comprising
a scale between 0 and 4. In the analysis so far, we converted them
into positives and negatives using a fixed limit of L = 1. In other
words any band scored by matching the colour scale (Fig. 1a) as 1+
or greater is scored as positive. By increasing this limit we can
study the effects of deteriorating field conditions such as poor
lighting or reader eyesight in which weak bands may not be
recognized.
Fig. 4 shows the effect of varying L on sensitivity and specificity.
The partial receiver operating characteristic (ROC) curves were
Fig. 3. Performance of (a) each RDT, (b) each antigen, and (c) all pairwise combinations of antigens, ordered by sensitivity. Error bars
represent 95% confidence intervals, derived from 4 replicates (2 readers using 2 duplicate RDTs). The asterisks in (a) indicate statistically significant
difference between the mean accuracy (from a t-test) of p* = 0.01 and p** = 0.003. The antigen combinations above the dashed horizontal line in (c)
have significantly better sensitivity to NatSD device.
doi:10.1371/journal.pntd.0003373.g003
PLOS Neglected Tropical Diseases | www.plosntds.org
5
December 2014 | Volume 8 | Issue 12 | e3373
Rapid Tests for Human African Trypanosomiasis
Table 3. Sensitivity, specificity and accuracy of RDTs.
RDT
Sensitivity
Specificity
Accuracy
NatSD
0.8260.01
0.9760.01
0.89860.009
RecSD
0.8260.01
0.9560.01
0.88460.008
BBI
0.8860.03
0.9460.02
0.9160.02
CATTa
$0.7
$0.8
Errors are 95% confidence intervals.
a
For CATT an approximate range of reported sensitivity and specificity is quoted after [8].
doi:10.1371/journal.pntd.0003373.t003
calculated for the cut-off from L = 1 (top right) up to L = 4 (bottom
left). We note that due to a very limited range of specificity, we
cannot reliably calculate the area under the curve. With increasing
L (corresponding to deteriorating field conditions) there is an often
dramatic drop in sensitivity, as fainter antigen bands are not
spotted. On the other hand, there is a corresponding increase in
specificity, as the faintest bands can create false positives.
Of the individual antigens (Fig. 4a), RecSD2 (rLiTat1.5) and
RecBBI1 (rISG65) show the most moderate loss of sensitivity,
down to ,0.4. The other four antigens drop in sensitivity below
0.2 in the limit of L = 4. Fig. 4b shows that the NatSD RDT, while
displaying consistently highest specificity, loses more sensitivity
with deteriorating conditions than RecSD and BBI. Fig. 4c shows
a selection of six hypothetical antigen combinations with highest
sensitivity (cf. Fig. 3c). The combination of the two antigens with
the lowest loss of sensitivity is RecSD2+RecBBI1 (rLiTat1.5 and
rISG65).
(LiTat1.3) or from individuals who were immunologically unresponsive to that antigen. We consider this unlikely, and indeed it
may be predicted if that was the case then the RDT bands using a
non-variant antigen (BBI1/ISG65) and a non-CATT antigen
(LiTat1.5, NatSD2, RecSD2) would exhibit a higher specificity.
The data (Table 3) did not support this prediction.
With all 3 RDTs a very high level of agreement (Cohen’s k$
0.9) was obtained between readers and also between the duplicate
RDTs used with each sample. Inter-reader agreement is in fact
better than for CATT (k = 0.84, [24]) and also for a recent
laboratory trial implementation of the loop-mediated isothermal
amplification (LAMP) diagnostic [25].
On the basis of these results, duplicate readings by each reader
were treated as replicates for the performance evaluation of each
device.
The sensitivity, specificity and accuracy were calculated for each
device. All the devices performed well, and while the prototypes
were not inferior at the 5% level in terms of sensitivity, specificity
and accuracy in comparison with the NatSD, the BBI prototype
was significantly more sensitive than the NatSD RDT. The
sensitivity and specificity compared well to the range of published
performance of the CATT (sensitivity 0.69–1.0, specificity 0.84–
0.99 [8]) and LAMP (sensitivity 0.87–0.93, specificity 0.93–0.96
[26]). When overall accuracy was calculated, there was no
significant difference in performance between the NatSD RDT
and the BBI prototype, but the RecSD prototype was significantly
inferior to both.
While sensitivity in this blinded study of both NatSD RDT and
the BBI prototype were 0.8260.01 and 0.8860.03 respectively, a
field trial study of the Coris Bioconcept HAT Sero-K-SeT lateral
flow device [17] has recently been reported to give a sensitivity of
z0:008
0:985z0:011
{0:038 and a specificity of 0:986{0:018 (95% CI) [27]. While
different lateral flow platforms are used in NatSD and HAT SeroK-SeT, they use the same antigens for detection. There are two
possible reasons for the apparent discrepancy between the results
for the RDTs presented here and those obtained with the HAT
Sero-K-SeT. First, in this study archived plasma was used rather
than whole blood. First, in this study archived plasma was used
Discussion
This study aimed to evaluate the performance of two novel
prototypes and the commercially available SD BIOLINE HAT
(NatSD) RDT in a side-by-side analysis using a panel of archived
plasma samples from HAT patients and endemic controls. The
sample size was designed using power analysis to be able to detect
an inferiority margin of 5%. Evaluation of the RDTs was carried
out by two readers in a blinded manner at a separate institution
remote from where the un-blinded sample identities were held,
and the two readers scored each device entirely independently of
each other’s readings. The samples were classified in the field at
the time of collection as infected or control on the basis of robust
criteria. For infected individuals, while initial identification of
suspects was via the CATT test and presenting symptoms, all cases
were confirmed parasitologically. All the controls had no
symptoms, were negative with CATT, and had no detectable
trypanosomes in the blood after the use of concentration
techniques. It is possible that within this group there could have
been sub-clinical cases with a very low parasitaemia, particularly if
they were from parasites that did not express the CATT antigen
Table 4. Sensitivity, specificity and accuracy of RDTs after sub-threshold faint bands (+/-) were scored as positive (1+).
RDT
Sensitivity
Specificity
Accuracy
NatSD
0.8960.03
0.9160.06
0.9060.03
RecSD
0.9160.05
0.8860.07
0.9060.04
BBI
0.9660.03
0.7960.15
0.8760.08
Errors are 95% confidence intervals.
doi:10.1371/journal.pntd.0003373.t004
PLOS Neglected Tropical Diseases | www.plosntds.org
6
December 2014 | Volume 8 | Issue 12 | e3373
Rapid Tests for Human African Trypanosomiasis
Table 5. Cohen’s kappa and its 95% confidence intervals calculated for each RDT between duplicate devices and between
independent readers after sub-threshold faint bands (+/-) were scored as positive (1+).
RDT
Inter duplicate RDT
Inter reader
NatSD
0.9760.02
0.8860.03
RecSD
0.9760.01
0.8660.03
BBI
0.9360.02
0.7660.04
doi:10.1371/journal.pntd.0003373.t005
rather than whole blood. While there have been no published
systematic side-by-side studies of the impact of this difference in
immunodiagnostic assays for HAT, it is possible that performance
of the tests would be improved when fresh blood samples are used.
Secondly, there were important differences in the observation
methodology. While in this study, all the results were scored
completely blind, for fully described clinical and operational
reasons [27] in the evaluation of HAT Sero-K-SeT about half of
the samples were scored by readers already knowing a parasitological diagnosis or being aware of the clinical signs of the subjects.
This has the potential to bias decisions on the reading of faint
bands according to the known diagnosis or symptomatology of the
subject, thus increasing the apparent sensitivity and specificity of
the test. To model the effect of including all faint bands with the
devices in this study, we reanalysed our data scoring every band
that had been annotated sub-threshold as 1+. This led to a
significant increase in sensitivity with a performance of the BBI
RDT that was not statistically different to the HAT Sero-K-SeT.
In this case there was naturally a loss of specificity, as all faint
bands were scored as positive. The scoring of faint bands led to a
reduction of inter-reader agreement, and this is likely to be due to
differences in visual acuity of different readers, given that both
readers worked under identical lighting conditions. This reduction
of inter-reader agreement justifies the use of the cut off of 0.5
(L = 1) on the 4 point reference card, as sensitivity data obtained
by scoring very faint bands as positive would not be reliably be
duplicated by other readers.
The current diagnostic procedure for HAT includes identification of suspects using a screening test, followed by parasitological
confirmation [7]. This is essential, first to ensure that subjects who
are false positive with the screening test do not undergo
uncomfortable lumbar puncture during staging, and secondly to
avoid exposing them to drug treatments that are associated with
toxicity [5]. Therefore in assessing the performance of RDTs, the
most important criterion is high sensitivity, as the false positives
resulting from lower specificity may be excluded during parasitological confirmation. In this respect, the BBI prototype outperformed the others used in this study. It exhibited a higher
sensitivity than both the RecSD and NatSD prototypes, despite a
small loss of specificity (less than 5% inferiority margin), and thus
would be best placed to take forward for further development.
This device has a further advantage over the other devices through
its use of a non-variant antigen (ISG65) that would be expressed in
all isolates of T.b. gambiense, thus theoretically allowing higher
sensitivity across a range of diverse T.b. gambiense foci. In
comparison LiTat1.5 and LiTat1.3, despite having been demonstrated to be very widely expressed [28], will probably not be
universally found in variant antigen repertoires as has been
demonstrated in the field [10].
When the performance of individual antigens was analysed, the
best antigen was NatSD2 (LiTat1.5), followed by RecSD2
(rLiTat1.5) and then RecBBI1 (rISG65). Thus, at the individual
antigen level, both the native and recombinant forms of LiTat1.5
were good diagnostic antigens. By increasing the cut-off limit at
which an antigen band was considered positive, we demonstrated
a deterioration of the performance of the antigens. This reflects the
situation that could be encountered in the field if those performing
the test are either not adequately trained, or they have other
Fig. 4. Partial receiver operating characteristic (ROC) curves for (a) individual antigens, (b) RDT devices and (c) top six performing
hypothetical combinations of two antigens. Each curve represents a changing antigen band intensity limit from L = 1 (top right) to L = 4
(bottom left). Error bars are 95% confidence intervals.
doi:10.1371/journal.pntd.0003373.g004
PLOS Neglected Tropical Diseases | www.plosntds.org
7
December 2014 | Volume 8 | Issue 12 | e3373
Rapid Tests for Human African Trypanosomiasis
challenges. For example, if the results were read by a person with
poor eyesight or the lighting is poor, the weakest antigen band may
not be spotted, that otherwise would have been scored as 1. In
relation to this, we found that RecSD2 (rLiTat1.5) and RecBBI1
(rISG65) lose much less of their sensitivity than the other antigens.
Based on the performance of the individual antigens, it was
possible to predict the performance of all 2-way and 3-way
combinations in hypothetical novel multiplex-RDTs [15], based
on the assumption that the antigens behave identically in
performance in different combinations. This is a powerful
approach to selection of antigens that should be exploited in
development of the next generation of RDTs for HAT. Of the
hypothetical devices, none of the 3-antigen combinations were
superior to 2-antigen devices. Of the 2-antigen devices tested here,
this analysis suggests that the combination in the BBI prototype
(LiTat1.5 and rISG65) is the best. However this device includes a
native antigen, which presents some production and manufacturing difficulties. Yet, when we examined the hypothetical performance of devices with recombinant antigens only, it was apparent
that one with rLiTat1.5 and rISG65 (RecSD2+RecBBI1) would
have a performance similar to the current best RDTs and would
have an advantage of the smallest drop in sensitivity under
deteriorating field conditions. Because recombinant antigens offer
significant advantages in device manufacturing and reproducibility, we suggest these two antigens as important candidates for
consideration in development of the next generation of RDTs for
HAT.
Supporting Information
Performance of all 3-way combinations of antigens,
ordered by sensitivity. Error bars represent 95% confidence
intervals, derived from raw performance data of individual antigen
band comprising 4 replicates (2 readers using 2 duplicate RDTs).
(EPS)
S1 Fig
S1 Table
Details of samples.
(DOCX)
S1 Checklist
STARD checklist.
(DOC)
Acknowledgments
We are grateful to the national sleeping sickness control programmes of
Uganda, Angola and the Central African Republic; to Me´decins sans
Frontie`res (Spain) and the Institute of Tropical Neurology (France) for the
collection of plasma samples used in this study. We thank Lauren Sullivan,
Jennifer Fleming and Lalitha Sastry (The University of Dundee) for
randomising and coding the plasma samples and Steven Wall at BBI
Solutions for providing adequate numbers of BBI prototypes, and
Margaret Wallace (University of Aberdeen) for acting as independent
reader.
Author Contributions
Conceived and designed the experiments: JMN MAJF SB JMS. Performed
the experiments: JMS. Analyzed the data: JMS SB MG. Contributed
reagents/materials/analysis tools: JMN MAJF. Wrote the paper: JMS MG
SB MAJF JMN.
References
1. Barrett MP, Burchmore RJ, Stich A, Lazzari JO, Frasch AC, et al. (2003) The
trypanosomiases. Lancet 362: 1469–1480.
2. Malvy D, Chappuis F (2011) Sleeping sickness. Clin Microbiol Infect 17: 986–
995.
3. Kennedy PG (2004) Human African trypanosomiasis of the CNS: current issues
and challenges. The Journal of clinical investigation 113: 496–504.
4. Sternberg JM, Maclean L (2010) A spectrum of disease in human African
trypanosomiasis: the host and parasite genetics of virulence. Parasitology 137:
2007–2015.
5. Burri C (2010) Chemotherapy against human African trypanosomiasis: is there a
road to success? Parasitology 137: 1987–1994.
6. Simarro PP, Diarra A, Ruiz Postigo JA, Franco JR, Jannin JG (2011) The
human African trypanosomiasis control and surveillance programme of the
World Health Organization 2000–2009: the way forward. PLoS Negl Trop Dis
5: e1007.
7. Chappuis F, Loutan L, Simarro P, Lejon V, Buscher P (2005) Options for field
diagnosis of human African trypanosomiasis. Clinical Microbiology Reviews 18:
133–146.
8. Mitashi P, Hasker E, Lejon V, Kande V, Muyembe JJ, et al. (2012) Human
african trypanosomiasis diagnosis in first-line health services of endemic
countries, a systematic review. PLoS Negl Trop Dis 6: e1919.
9. Garcia A, Jamonneau V, Magnus E, Laveissiere C, Lejon V, et al. (2000) Followup of Card Agglutination Trypanosomiasis Test (CATT) positive but apparently
aparasitaemic individuals in Cote d’Ivoire: evidence for a complex and
heterogeneous population. Trop Med Int Health 5: 786–793.
10. Dukes P, Gibson WC, Gashumba JK, Hudson KM, Bromidge TJ, et al. (1992)
Absence of the LiTat 1.3 (CATT antigen) gene in Trypanosoma brucei gambiense
stocks from Cameroon. Acta Trop 51: 123–134.
11. Peeling RW, Mabey D (2010) Point-of-care tests for diagnosing infections in the
developing world. Clin Microbiol Infect 16: 1062–1069.
12. WHO (editor Crompton DWT (2012) Accelerating Work to Overcome the
Global Impact of Neglected Tropical Diseases. Geneva: WHO press.
13. Hotez PJ (2013) NTDs V.2.0: "Blue Marble Health"-Neglected Tropical Disease
Control and Elimination in a Shifting Health Policy Landscape. Plos Neglected
Tropical Diseases 7.
14. Posthuma-Trumpie GA, Korf J, van Amerongen A (2009) Lateral flow
(immuno)assay: its strengths, weaknesses, opportunities and threats. A literature
survey. Anal Bioanal Chem 393: 569–582.
15. O’Farrell B (2013) Lateral Flow Immunoassay Systems: Evolution from the
Current State of the Art to the Next Generation of Highly Sensitive,
Quantitative Rapid Assays. In: Wild D, editor. The immunoassay handbook:
PLOS Neglected Tropical Diseases | www.plosntds.org
16.
17.
18.
19.
20.
21.
22.
23.
24.
25.
26.
27.
28.
8
theory and applications of ligand binding, ELISA, and related techniques.
Oxford: Elsevier. pp.89–107.
FIND_Diagnostics (2012) The first rapid test to screen for sleeping sickness is
launched. FIND Diagnostics.
Buscher P, Gilleman Q, Lejon V (2013) Rapid diagnostic test for sleeping
sickness. N Engl J Med 368: 1069–1070.
Sullivan L, Wall SJ, Carrington M, Ferguson MA (2013) Proteomic selection of
immunodiagnostic antigens for human African trypanosomiasis and generation
of a prototype lateral flow immunodiagnostic device. PLoS Negl Trop Dis 7:
e2087.
Sullivan L, Fleming J, Sastry L, Mehlert A, Wall SJ, et al. (2014) Identification of
sVSG117 as an Immunodiagnostic Antigen and Evaluation of a Dual-Antigen
Lateral Flow Test for the Diagnosis of Human African Trypanosomiasis. PLoS
Negl Trop Dis 8: e2976.
Ziegelbauer K, Multhaup G, Overath P (1992) Molecular Characterization of 2
Invariant Surface Glycoproteins Specific for the Blood-Stream Stage of
Trypanosoma brucei. Journal of Biological Chemistry 267: 10797–10803.
Agresti A, Coull BA (1998) Approximate is better than "exact" for interval
estimation of binomial proportions. American Statistician 52: 119–126.
Fleiss JL, Levin BA, Paik MC (2003) Statistical methods for rates and
proportions. Hoboken, N.J.: John Wiley. xxvii, 760 pp.
Landis JR, Koch GG (1977) Measurement of Observer Agreement for
Categorical Data. Biometrics 33: 159–174.
Hasker E, Mitashi P, Baelmans R, Lutumba P, Jacquet D, et al. (2010) A new
format of the CATT test for the detection of Human African Trypanosomiasis,
designed for use in peripheral health facilities. Tropical Medicine &
International Health 15: 263–267.
Wastling SL, Picozzi K, Kakembo ASL, Welburn SC (2010) LAMP for Human
African Trypanosomiasis: A Comparative Study of Detection Formats. Plos
Neglected Tropical Diseases 4.
Mitashi P, Hasker E, Ngoyi DM, Pyana PP, Lejon V, et al. (2013) Diagnostic
Accuracy of Loopamp Trypanosoma brucei Detection Kit for Diagnosis of
Human African Trypanosomiasis in Clinical Samples. Plos Neglected Tropical
Diseases 7.
Buscher P, Mertens P, Leclipteux T, Gilleman Q, Jacquet D, et al. (2014)
Sensitivity and specificity of HAT Sero-K-SeT, a rapid diagnostic test for
serodiagnosis of sleeping sickness caused by Trypanosoma brucei gambiense: a
case-control study. Lancet Global Health 2: E359–E363.
VanMeirvenne N, Magnus E, Buscher P (1995) Evaluation of variant specific
trypanolysis tests for serodiagnosis of human infections with Trypanosoma brucei
gambiense. Acta Tropica 60: 189–199.
December 2014 | Volume 8 | Issue 12 | e3373


© Copyright 2026