
a geometric accuracy design method of multi
Article citation info:
Cai L, Zhang Z, Cheng Q, Liu Z, Gu P. A geometric accuracy design method of multi-axis NC machine tool for improving machining
accuracy reliability. Eksploatacja i Niezawodnosc – Maintenance and Reliability 2015; 17 (1): 143–155.
Ligang Cai
Ziling Zhang
Qiang Cheng
Zhifeng Liu
Peihua Gu
A geometric accuracy design method of multi-axis NC machine tool
for improving machining accuracy reliability
Metoda projektowania i poprawy niezawodności dokładności
obróbczej wieloosiowej obrabiarki NC wykorzystująca pojęcie
dokładności geometrycznej
The reliability of machining accuracy is of great significance to performance evaluation and optimization design of the machine
tools. Different geometric errors have various influences on the machining accuracy of the machine tools. The main emphasis of
this paper is to propose a generalized method to distribute geometric accuracy of component for improving machining accuracy
reliability under certain design requirements. By applying MBS theory, a comprehensive volumetric model explaining how individual errors in the components of a machine affect its volumetric accuracy (the coupling relationship) was established. In order
to reflect the ability to reach the required machining accuracy, the concept of machining accuracy reliability is proposed in this paper. Based on advanced first order and second moment (AFOSM) theory, reliability and sensitivity with single failure modes were
obtained and the model of machining accuracy reliability and the model of machining accuracy sensitivity with multiple failure
modes were developed. By taking machining accuracy reliability as a measure of the ability of machine tool and taking machining accuracy sensitivity as a reference of optimizing the basic parameters of machine tools to design a machine tool, an accuracy
distribution method of machine tools for improving machining accuracy reliability with multiple failure modes was developed and
a case study example for a five-axis NC machine tool was used to demonstrate the effectiveness of this method. It is identified that
each improvement of the geometric errors leads to a decrease in the maximum values and mean values of possibility of failure,
and the gaps among reliability sensitivity of geometric parameter errors improved also decreased. This study suggests that it is
possible to obtain the relationships between geometric errors and specify the accuracy grades of main feeding components of
mechanical assemblies for improving machining accuracy reliability.
Keywords: Machine tool; Geometric error; Accuracy distribution; Machining accuracy reliability; Multi-body
system theory.
Niezawodność w zakresie dokładności obróbki ma wielkie znaczenie dla oceny funkcjonowania oraz projektowania optymalizacyjnego obrabiarek. Różne błędy geometryczne mają różny wpływ na dokładność obrabiarek. Głównym celem niniejszej pracy jest
zaproponowanie uogólnionej metody rozkładu dokładności geometrycznej elementów składowych obrabiarki, pozwalającej na
poprawę niezawodności w zakresie dokładności obróbczej przy spełnieniu pewnych wymagań projektowych. Dzięki zastosowaniu
teorii układów wielomasowych MBS, opracowano kompleksowy model wolumetryczny, który wyjaśnia, w jaki sposób pojedyncze
błędy występujące w elementach składowych obrabiarki wpływają na jej dokładność wolumetryczną (relacja sprzężeń). Zaproponowane w prezentowanym artykule pojęcie niezawodności dokładności obróbki odnosi się do możliwości uzyskania przez urządzenie wymaganej dokładności obróbki W oparciu o zaawansowaną teorię estymacji momentów AFOSM (Advanced First Order
and Second Moment therory), obliczono niezawodność i czułość dla przypadku wystąpienia pojedynczej przyczyny uszkodzenia
oraz opracowano model niezawodności dokładności obróbki oraz model czułości dokładności obróbki dla przypadku wystąpienia
wielu przyczyn uszkodzeń. Przyjmując niezawodność dokładności obróbki za miarę poprawnego działania obrabiarki oraz przyjmując czułość dokładności obróbki za punkt odniesienia dla optymalizacji projektowej podstawowych parametrów obrabiarek,
opracowano metodę, opartą na rozkładzie dokładności obrabiarki, mającą na celu poprawę niezawodności dokładności obróbki
dla przypadku wystąpienia wielu przyczyn uszkodzeń. Skuteczność metody wykazano na przykładzie pięcio-osiowej obrabiarki
NC. Stwierdzono, że każda korekta błędu geometrycznego prowadzi do spadku maksymalnych i średnich wartości możliwości
wystąpienia uszkodzenia oraz zmniejsza rozstęp między poszczególnymi czułościami niezawodnościowymi skorygowanych błędów
parametrów geometrycznych. Przedstawione badania wskazują, że możliwe jest ustalenie związku pomiędzy błędami geometrycznymi oraz określenie stopni dokładności głównych elementów składowych zespołów mechanicznych odpowiedzialnych za ruch
posuwowy obrabiarki w celu poprawy niezawodności dokładności obróbki.
Słowa kluczowe: Obrabiarka; Błąd geometryczny; Rozkład dokładności; niezawodność dokładności obróbki;
Teoria układów wielomasowych.
Eksploatacja i N iezawodnosc – Maintenance and Reliability Vol.17, No. 1, 2015
143
S cience and Technology
1. Introduction
Machining accuracy is critical for the quality and performance
of a mechanical product and is an important consideration for any
manufacturer. It is influenced by machining errors belonging to several categories, e.g. geometric errors caused by mechanical-geometric
imperfections, misalignments, wear of the linkages and elements of
the machine tool structure, by the non-uniform thermal expansion
of the machine structure, and static/dynamic load induced errors [8].
Geometric errors include pitch errors of the lead screws, straightness
errors of the guide ways, angular errors of machine slides, and orthogonal error among machine axis [3]. Because its contribution to
30% of the total error so it is given special consideration through the
configuration and allocation of appropriate dimensional errors in the
design of machine tools with satisfactory machining accuracy [19].
Machine tools are usually made by several assembling parts, and the
dimensional and geometric variations of each part have to be specified
by tolerances which guarantee a certain level of quality in terms of
satisfying functional requirements [20]. A as a result, the distribution
of accuracy of machine tools is a problem of distribution of tolerances
of these geometric errors. However, this practice of allocation has not
been developed and applied in any systematic manner to the design
of machine tools.
To enhance the machining accuracy of CNC machine tools, there
are two steps included in the accuracy design. The first is accuracy
prediction, which refers to forecasting volumetric errors of machine
tools based upon the known accuracy for updated and maintained
parts, and then predict the machining accuracy of work piece. The
other is accuracy allocation, which is to obtain the accuracy of updated and maintained parts from the preset total accuracy of machine
tools, and let the accuracy of parts reach optimal scheme [15]. Before accuracy distribution, a error modeling is crucial to maximize
the performance of machine tools, and robust and accurate volumetric
error modeling is also the first step to correct and compensate these
errors [5], therefore, a model explaining how individual error of the
components of a machine affect its volumetric accuracy is crucial to
the accuracy distribution approach and it is one aspect of importance
of this paper.
Geometric errors for each of the assembled parts and components
are random variables; the machining errors caused by such errors are
also random [40]. As a result, the dimensional and geometric variations for each error source are random and have to be specified by
variance (or standard deviation) and the probabilistic nature of the
errors produced on the dimensions of a manufactured part is taken
into consideration in this paper. Uncertainty in parameters such as
material, loading, geometry and the model exist in the process of
structural design and optimization, and it results from data shortage,
model simplification and human error [18]. Some of these errors can
be reduced by collecting more data, with a better understanding of the
problem and by implementing strict quality control; however, others
such as deviations due to random events cannot be reduced by the
above means [6]. To solve this problem, two main philosophies dealing with the uncertain deviations exist: ‘Deterministic Structural Optimization’ (DSO) uses safety-factors to accomplish the safety, while
‘Reliability-Based Structural Optimization’ (RBSO) takes the random
character of the variables into consideration [27]. Reliability-based
design optimization simulates all the uncertain variables to the random variables or random process and minimizes an objective function
under probabilistic constraints. The reliability of machine tool reflects
the ability to perform its specified functions under the stated conditions for a given period of time and it is often studied by possibility
of failure [26], so accuracy distribution based on the reliability theory
can maintain and improve the level of quality in terms of satisfying
functional requirements while keeping the maximum tolerances of
these geometric errors. As a result, the development of a systematic
144
method to realize accuracy distribution of machine tool based on reliability theory according to failure modes for improving machining
accuracy reliability is the second very important aspect of this paper.
The rest of this study is organized as follows: In Section 2, the
review of accuracy design of machine tool is given. Section 3 explains
the process of modeling machining tool geometric errors. Section 4
presents the proposed method to realize accuracy distribution of machine tool. A case study is accomplished as an example in Section 5.
The conclusions are presented in the last Section.
2. Accuracy Design of NC Machine Tool
2.1. Accuracy prediction
Up to present, there are many researches on the error modeling
technique to show the difference between the actual response of a
machine to a command issued according to the accepted protocol of
that machine’s operation and the response to that command anticipated by that protocol [9]. The development of modeling methods has
been experienced many years and it turns out to be various kinds such
as matrix translation method, error matrix method, rigid body kinematic, D-H method, model methods based on the multi-body system
kinematics theory and so on. In 1973 Love and Scarr obtained the
combined effects of the elemental errors in the machine tool and then
developed the volumetric errors of a multi-axis machine by using the
trigonometric technique [25]. In 1977 a matrix translation method was
reported and a calibration technique using three-dimensional metrology on a coordinate measuring machine (CMM) was presented by
Hocken et al. [13]. In 1981 Dufour and Groppetti reported the “error
matrix” method to obtain error predictions by interpolation between
the stored values [10]. In 1982 Portman used rigid body kinematics
to evolve an expression for the geometric error of a mechanism [30].
In 1991, Kiriden developed a general model to understand the effects
of component geometric errors on the kinematic chain of a machine
and the volumetric errors in the work space [21]. In 1993, they used
the D–H convention to develop kinematic models for three types of
machine. In 1995 a method based on direct consideration of the shape
and joint transformations was put forward by Srivastava et al. [33]. In
2007 Bohez et al. presented a new method to identify and compensate
the systematic errors in a multi-axis machine tool [1]. In recent years,
multi-body system (MBS) theory is used to generalize and provide
a unique systematic approach for its advantages such as stylization,
normalization, versatility, and ease for computer modeling [36]. There
are many investigators have carried out error modeling research for
complicated machinery system using MBS [41, 23, 44, 39], mainly
focus on designing and constructing a model to determine geometric error of machine tool and developing the key technique for compensation-identifying geometric error parameters.[43, 17, 4, 7, 22, 2,
11] introduce the methods of geometric error compensation, thermal
error modeling, position error compensation, position-independent
geometric errors modeling, volumetric error modeling and sensitivity
analysis and establishing a product of exponential(POE) model for
geometric error integration.
2.2. Accuracy allocation
In earlier years, many researches focused their attention to obtain
the tolerance allocation on structural design. In 2005 Prabhaharan et
al. introduced a kind of metaheuristic approach as an optimization tool
for minimizing the critical dimension deviation and allocating the costbased optimal tolerances [29]. In 2006 Huang and Shiau obtained the
optimized tolerance allocation of a sliding vane rotary compressor’s
components for the required reliability with the minimum cost and
quality loss [16]. In 2007 Huang and Zhong established the sequential
linear optimization models based on the process capabilities to release
Eksploatacja i N iezawodnosc – Maintenance and Reliability Vol.17, No. 1, 2015
S cience and Technology
the working tolerances, reduce manufacturing costs [14]. Siva Kumar
and Stalin [31] used Lagrange multiplier method to simultaneously
allocate both design and manufacturing tolerances based on minimum total manufacturing cost. Isabel González et al. [12] developed
a methodology to allow an automatic tolerance allocation capable of
minimizing manufacturing costs based on statistical approach. Muthu
et al. [28] used metaheuristic method to balance the manufacturing
cost and quality loss to achieve near optimal design and process tolerances simultaneously for minimum combined manufacturing cost
and quality loss over the life of the product. In 2010 K. Sivakumar, et
al proposed a novel multi-objective optimization method to enhance
the operations of the non-traditional algorithms and Multi-Objective
Particle Swarm Optimization and systematically distribute the tolerances among various the components of mechanical assemblies [32].
From the above literature, the previous researches on tolerance allocation mainly focus on structural design taking manufacturing cost
or manufacturing process into consideration, besides, there are many
of accuracy allocation in the field of hull construction, robotics, military application, and instruments [35, 24, 37, 42, 34]. However, works
on accuracy allocation of multi-axis machine tools are few. Reliability is a specification to measure the ability of
machine tool to overcome a certain functions
and reliability sensitivity reflects the influence
of basic parameters to the possibility of failure,
so reliability theory plays an important role
in accuracy allocation of NC machine tools
by determining the levels for these geometric
parameter errors, what’s more, multi-axis NC
machine tools composed of various parts are
complex structures and so they have multiple
failure modes. In 1994 Dorndorf U proposed
an error allocation approach to optimize allocation of manufacturing and assembly tolerances
along with specifying the operating conditions
to determine the optimal level for these errors
so that the cost is minimized [9], it is regardless
of reliability sensitivity and the model is a twoaxis machine. In 2013 Yu proposed a geometric
error propagation model and reliability approximately model to by response surface method
with error samples and improved the functions
of machine tools by optimization of the sensitivity [40] with single failure model. As a result,
the continuous effort lies on accuracy allocation
of NC machine tools taking machining accuracy reliability and sensitivity with multiple failure modes into consideration.
3. Error modeling of NC machine tool
There are two important aspects in this study: the first is the development of a systematic approach to obtain geometric/kinematic errors
on the kinematic chain of a machine tool. Another aspect, considered
more important, is the proposing of the concept of machining accuracy reliability and the addressing a reliability and sensitivity analysis
method in the multiple failure modes to realize the distribution of the
standard deviation for the geometric errors.
A method called MBS is used to establish a machine tool geometric/kinematic error model showing the relation between the individual
error of the components of a machine, and its volumetric accuracy is
crucial to the allocation of standard deviation for the geometric parameter errors. In this paper, a 5-axis machine tool is used to analyze
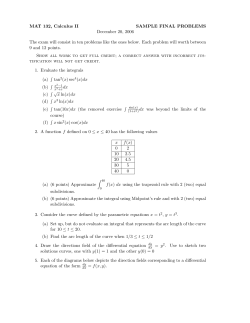
geometric errors and the geometric/kinematic error model is developed. This XKH1600 five-axis machining center is designed for leaf
blade machining, configured as three linear axes X, Y, Z axes and two
Fig. 1. The 3-dimension digital structure model of the NC machine tool
Fig. 2. The coordinate system structure diagram
Table 1 Lower body array of five-axis NC machine tool
Topic
body j
1
2
3
4
5
6
7
L0(j)
1
2
3
4
5
6
7
L1(j)
0
1
2
3
0
5
6
L2(j)
0
0
1
2
0
0
0
L3(j)
0
0
0
1
0
0
0
L4(j)
0
0
0
0
0
0
0
L5(j)
0
0
0
0
0
0
0
L6(j)
0
0
0
0
0
0
0
rotary axes A, B axis. The 3-dimension digital structure model of the
machine tool is shown in Figure 1.
Taking the error factors and coupling relations of the various parts
into consideration, based on the MBS theory, the five-axis machine
tool can be abstracted into a multi-body system. The coordinate sys-
Eksploatacja i N iezawodnosc – Maintenance and Reliability Vol.17, No. 1, 2015
145
S cience and Technology
tem structure diagram is shown in Figure 2. The error model between
BK and B j revealed, when the displacement and the displacement
error are zero, Ok and Qk coincide, qk refers to the initial position
vector between O j ( B j ’s origin) and Ok ( BK ’s origin), and qke is the
position error vector, including load error and thermal error. Sk is the
displacement vector between BK and B j , and Ske is the displacement
error vector, including geometric error and dynamic error. When there
is a displacement in one part or component of a machine tool, this
displacement is the position increment. The lower body array is listed
in Table 1.
Pt = Ptx
T
Ptz 1
Pty
(1)
The work-piece forming point in the work-piece coordinate system
coordinate is:
Pw = Pwx
Pwz 1
Pwy
T
(2)
When the machine tool moves in ideal form, that means the machine tool is without error, the ideal forming function of tool forming
point in work-piece coordinate system is:
k =1
u =1
∏ TLPk (t )Lk −1 (t )TLSk (t )Lk −1 (t ) Pt = ∏ TLPu (w)Lu −1 (w)TLSu (w)Lu −1 (w) Pw
n
n
k = n, L (t )= 0
u = n, L (w )= 0
(3)
In this paper, the ideal forming function of tool forming point of
this five-axis machine tool is:
−1
k =1
Pt =
∏ TLPk (t ) Lk −1 (t )TLSk (t ) Lk −1 (t )
n
k = n, L ( t ) = 0
1 0 0 − xt − cos ϕ sin ϕ 0
0 1 0 − yt − sin ϕ − cos ϕ 0
=
0 0 1 − zt 0
0
1
0
0
0 0 0 1 0
1
0
0
0
0
1
0
0
0 0 1 0
0 0 0 1
1 −z 0 0
0 1 0 0
− cos B 0 − sin B
1
0
0
sin B 0 − cos B
0
0
0
0 0 1
0 − y 0
1 0 0
0 1 0
0 1 0 0
0 0 1 0
0 0 0 1
1 0 0 0
0
1
0
0
u =1
∏ TLPu ( w) Lu −1 ( w)TLSu ( w) Lu −1 ( w) Pw
n
u = n, L ( w) = 0
0
0
0
0 1
0 0 − cos A sin A 0
0 0 − sin A − cos A 0
1 0
0
0
1
0
0
1
0
x
0
0
1
(4)
xwd
ywd
Pw
zwd
1
Machining accuracy is determined by relative displacement error
between the tool forming point of machine and work-piece. During
the actual machining process, the actual position of cutting tool point
will inevitably deviate from the ideal location, which results in volumetric error. Table 2 lists the characteristic matrices of this 5-axis
CNC machining center, including body ideal static, motion characteristic matrix ( T Pk k −1 , T Sk k −1 ) and body static, kinematic erL (t )L (t ) L (t )L (t )
ror characteristic matrix
( ∆T Pk k −1 , ∆T Sk k −1 ).As
L (t )L (t )
L (t )L (t )
a result,
the comprehensive volumetric error caused by the gap between actual
point and ideal point in this paper can be written as:
In the above equation, the values and means of the expressions
P
S
S
such as T05P , ∆T05
, T05
, ∆T05
and so on can be obtained from Table 2.
4. Accuracy allocation based on Reliability Theory
In Section 3, the development of a systematic approach to obtain
geometric/kinematic errors on the kinematic chain of a machine tool
has been finished. As a result, the concept of machining accuracy reliability should be proposed, besides, a reliability and sensitivity analysis method with multiple failure modes for improving machining accuracy reliability to realize the geometric errors allocation should be
addressed.
4.1. The concept of Machining Accuracy Reliability and
AFOSM Theory
The reliability of structure reflects the ability to perform its specified functions under the stated conditions for a given period of time
and it is often studied by possibility of failure. In order to reflect the
ability of machine tools to reach the required machining accuracy,
machining accuracy reliability is proposed in this paper and can be
defined as possibility of fulfilling the specified machining accuracy,
expressed by the possibility of failure of machine accuracy. Besides,
the probabilistic nature of the errors produced on the dimensions of
a manufactured part is taken into consideration in this paper. In order
to develop an approach to obtain the machining accuracy reliability
and sensitivity of this five-axis machine tool, there is an assumption
that the errors produced on a dimension are drawn from a Gaussian
distribution. Our task of error allocation is therefore to determine the
optimal levels for these geometric parameter errors according to the
machining accuracy reliability. In order to overcome this task, Advanced First Order and Second Moment (AFOSM) theory is introduced at first.
Supposing that there is a performance function Z = g ( x1, x2 ,…, xn )
, with some uncorrelated parameters xi ~ N ( µ xi ,σ xi ) , which are subject to random variation about their nominal values, let the functional
requirements be of the form Z=0 (limit state equation) which divides
the parameter space into two regions, one a failure domain can be
expressed as F = {T : g ( x) ≤ 0} and the other is the safe domain.
Supposing that there is a design point (the most possibility failure
point) P * ( x1* , x2* ,..., xn* ) in the failure domain, then g ( x1* , x2* ,..., xn* ) = 0
n ∂g
is obtained and Gi = g ( x1* , x2* ,..., xn* )+ ∑ ( ) * ( xi − xi* ) can be dep
i =1 ∂xi
veloped to represent the linear part as to Z = g ( x1, x2 ,…, xn ) by Tayn ∂g
*
lor, so the performance equation is ∑ ( ) p * ( xi − xi ) =0.
∂
x
i
i =1
n
*
Suppose µ z = ∑ ( µ xi − xi )(
i =1
n
∂g
∂g
) * , σ z2 ≈ ∑ [( ) * σ xi ]2 ,
p
∂
xi p
∂xi
i =1
∂g
) * σ xi
∂xi p
αi = n
, (i = 1, 2,..., n) which refers to the Sensi∂g
{∑ [( ) * σ xi ]2 }1/ 2
p
i =1 ∂xi
(
u =5
u =1
S
Pw −
p
E=
T Pu
∆T Pu
T Su
∆T Su
T Pu
∆T Pu
∆T Su
u −1
u −1 T u
u −1
u −1
u −1
u −1
u −1
u −1
∏
∏
L ( 4) L ( 4)
L ( 4) L ( 4) L ( 4) L ( 4)
L (7) L (7)
L (7) L (7) L (7) L (7)
L (7) L (7 )
L ( 4) L ( 4) t
n
n
u = n, L ( 7 ) = 0
u = n, L ( 4 ) = 0
(5)
P S
S P S
S P
P S
P S
S P
S
P
S P
P
T05∆T05
T56T56 ∆T56
T67 ∆T67
T67 Pw − T01
T01∆T01
T12 ∆T12PT12S ∆T12S T23
∆T23
∆T23
T34 ∆T34
pt
= T0P5∆T05
146
Eksploatacja i N iezawodnosc – Maintenance and Reliability Vol.17, No. 1, 2015
S cience and Technology
Table 2. Characteristic matrices of the 5-axis NC machining center
adjacent
body
Body ideal static, motion characteristic matrix
( T Pk
k −1
L (t )L
(t )
, T Sk
k −1
L (t )L
(t )
)
Body static, kinematic error characteristic matrix
( ∆T Pk k −1 , ∆TLSk t Lk −1 t )
() ()
L (t )L (t )
T01P = I 4×4
0-1
X axis
T01s = T01s ( x )
1
0
=
0
0
0
1
0
0
x
0
0
1
0
0
1
0
T12 P = I 4×4
1-2
Z axis
T12s = T12s ( z )
1
0
=
0
0
0
0
1
0
0
0
z
1
2-3
B axis
T23s
T34 p
3-4
Tool
0 sin B 0
1
0
0
0 cos B 0
0
0
1
1
0
=
0
0
0
1
0
0
0
0
1
0
xtd
ytd
ztd
1
∆β xz
−∆α yz
∆α yz
1
0
0
0
0
0
1
∆T12s
1
∆γ z
=
−∆β z
0
−∆γ z
1
∆α z
0
∆β z
−∆α z
1
0
∆xz
∆y z
∆z z
1
−∆γ yb
0
∆T23p
1
∆γ yb
=
0
0
1
−∆α yb
∆α yb
1
0
0
0
0
1
1
∆γ B
=
−∆β B
0
−∆γ B
1
∆α B
0
∆β B
−∆α B
1
0
∆xB
∆yB
∆z B
1
1
∆γ td
=
−∆βtd
0
−∆γ td
1
∆α td
0
∆βtd
−∆α td
1
0
∆T23s
∆T34 p
T34 S = I 4×4
0-5
Y axis
T05 P = I 4×4 T05s
0
1
0
0
0 0
0 y
1 0
0 1
6-7
Work piece
T56 s
T67 p
0
0
1
0 cos A − sin A
=
0 sin A cos A
0
0
0
1
0
=
0
0
0
1
0
0
0
0
1
0
∆T05 s
0
0
0
1
xwd
ywd
T
= I 4×4
zwd 67 P
1
∆T56s
∆T67 p
1
∆γ
= xy
0
0
1
∆γ y
=
−∆β y
0
∆T56p
T56 P = I 4×4
5-6
A axis
0
∆xtd
∆ytd
∆ztd
1
T34 P = I 4×4
∆T05 p
1
0
=
0
0
∆xx
∆y x
∆z x
1
∆β x
−∆α x
1
0
0
1
1
0
=
−∆β xz
0
∆T12p
0
1
0
0
T23P = I 4×4
cos B
0
=
− sin B
0
∆T01s
−∆γ x
1
∆α x
0
1
∆γ x
=
−∆β x
0
1
∆γ ya
=
−∆β xa
0
1
∆γ
a
=
−∆β a
0
1
∆γ wd
=
−∆β wd
0
−∆γ xy
0 0
0 0
1 0
0 1
1
0
0
−∆γ y
∆β y
1
−∆α y
∆α y
1
0
0
−∆γ ya
∆β xa
1
0
0
0
1
0
−∆γ a
1
∆α a
0
∆β a
−∆α a
1
0
−∆γ wd
1
∆α wd
0
∆x y
∆y y
∆z y
1
0
0
0
1
∆xa
∆ya
∆za
1
∆β wd
−∆α wd
1
0
Eksploatacja i N iezawodnosc – Maintenance and Reliability Vol.17, No. 1, 2015
∆xwd
∆ywd
∆zwd
1
147
S cience and Technology
tivity coefficient, reflecting the influence of the random parameter xi
∂g
acting on the σ z , so σ z = ( ) * σ xi α i , and then the reliability in∂xi p
dex and the possibility of failure are obtained as follows[26]:
n
∂g
− xi* )( ) *
∂xi p
µ z i =1
=
β=
∂g
σz
( ) * σ xi α i
∂xi p
(6)
Pf = Φ( − β )
(7)
∑ ( µ xi
Compare with machining accuracy reliability as a specification to
measure the ability of machine tool to overcome a certain functions,
machining accuracy sensitivity reflects the influence of basic parameters to the possibility of failure, which can be used for improving and
optimizing the basic parameters of machine tool. As a result, machining accuracy sensitivity plays an important role in determining the
levels for these geometric parameter errors. Based on the AFOSM
theory, the performance function Z = g ( x1, x2 ,…, xn ) can be changed:
∂(β j )
n
∂P{F }
=
∂σ xi
∑ [ f ( β j ) ∂σ
j =1
xi
n
i =1
m
m
2
j =1
i =1
i =2
(−1)] +
n j −1
∑ ∑ [ (3)τ jk [ (1)τ jk ( ( 4)τ jk ⋅ ( 4)ζ σ xi
∂g
) * ( xi − xi* )
∂xi p
n
g ( x) ≈ G ( x) = c0 + ∑ ci xi
i =1
n
µG
=
σG
c0 + ∑ ci µ xi
i =1
n
∑
∂σ xi
ci2σ x2i µG
∂Pf ∂β
1 µ
=−
=
exp[− ( G ) 2 ] (8)
3
∂β ∂σ xi
2 σG
2πσ G
(9)
( 5)
τ jk ⋅ (5)ζ σ ) + ( 2)τ jk ⋅ ( 2)ζ σ x ]] xi
qi q j Cov( gi , g j )
ρij =
Var[ gi ] Var[ g j ]
i
(10)
, βi and β j are the reliability indices with
respect to the ith and jth failure conditions respectively, and ρij is
the correlation between the two failure conditions, qi is positive when
Z>0 and is negative when Z≤0.
( 2)
ζσ
xi
( 4)
ζσ
xi
=
( 4)
ζσ
xi
= φ (− β j )
( 5)
ζ σ x = φ (− β k )
i
φ (t ) =
148
F
F
In the above expressions, i and j are the events of failing with
Z
Z
respect to the i and j condition respectively.
βi − ρij β j
β j − ρij βi
),
P ( Fi ) = Φ (− βi )Φ (−
) , P ( F j ) = Φ (− β j )Φ (−
1 − ρij2
1 − ρij2
ci2σ x2i
P = Φ( − β )
i =1
In this way,
and f
are obtained.
From the following equations, the reliability sensitivity can be
obtained as follows:
∂Pf
+
j = 2 k =1
.
∂
g
∂g
Suppose c0 = g ( x1* , x2* ,..., xn* ) − ∑ ( ) * xi* , ci = ( ) * ,
p
∂
x
∂
xi p
i
i =1
β=
The narrow bounds is the main method used for the reliability
and sensitivity analysis of a serial system though it fails to obtain the
certain valves of reliability and sensitivity, as a result, it is used for
verification of the method introduced in this paper.
Supposing that there are “m” failure modes, the reliability P {F}
∂P{F }
and the reliability sensitivity
based on AFOSM Theory are
∂σ xi
expressed as follows [9]:
∑ P{Fi F j }; 0], ∑ P{Fi } − ∑ max( j < i)P{Fi F j }]
n
Then,
4.2.1.The Narrow Bounds Method
i −1
into the following equation at the design point P * ( x1* , x2* ,..., xn* ) ,
g ≈ g ( x1* , x2* ,..., xn* )+ ∑ (
Failure mode is critical to the reliability of any structure. The
number of limit state equations divides failure mode into two parts:
single failure mode and multiple failure modes. Single failure mode
which means that there is only one limit state equation in the whole
system or structure, in contract, multiple failure modes refers to multiple limit state equations in the system and its complexes lies in the
logical relationship, correlation coefficient and joint probability density of a system or a structure with multiple failure modes[38]. According to the logical relationship with the failure modes of a machine
tool, this machine tool has multiple failure modes and so it is a serial
system. As a result, this paper aims to the reliability and sensitivity
analysis of such serial system.
m
P{F } ⊆ [ P{F1} + ∑ max[ P{Fi } −
4.2. An AFOSM Reliability and Sensitivity Analysis Method
with Multiple Failure Modes
+
( 5)
ζσ
xi
,
∂
∂
(− β j )Φ (−u jk ) + φ (−u jk )
(−u jk )Φ (− β j )
∂σ xi
∂σ xi
∂
∂
(− β k )Φ (−v jk ) + φ (−v jk )
(−v jk )Φ (− β k ) ,
∂σ xi
∂σ xi
1 2
1 − 2t
,
e
2π
Eksploatacja i N iezawodnosc – Maintenance and Reliability Vol.17, No. 1, 2015
S cience and Technology
∂β j
∂σ xi
P{F12 } = P ( F1 ) + P ( F2 ) − α12 P ( F2 ) = P ( F1 ) + (1 − α12 ) P ( F2 ) and the
possibility of failure with three failure modes can be given by:
n
c0 + ∑ ci µ xi
i =1
=
2
ci σ xi
β − βi ρij
β − β j ρij
, uij = j
, vij = i
,
n
2
2
2 2 3/ 2
−
−
ρ
ρ
1
1
ij
ij
[ ∑ ci σ xi ]
1
τ jk =
0
τ jk ≥ 0
0
τ jk =
1
τ jk ≥ 0
(1)
τ jk < 0
( 2)
τ jk < 0
P ( F123 ) = P ( F1 F2 F3 ) = P ( F12 F3 )
i =1
,
= P ( F12 ) + P ( F3 ) − α123 P ( F3 ) = P ( F12 ) + (1 − α123 ) P ( F3 )
(14)
In a similar way, the possibility of failure with “m” multiple failure modes in a serial system can be obtained by:
,
P ( F ) = P ( F12...m −1 ) + (1 − α12...m ) P ( Fm )
= P ( F1 ) + (1 − α12 ) P ( F2 ) + (1 − α123 ) P ( F3 ) + ... + (1 − α12...m ) P( Fm )
τ jk + ( 2)τ jk = 1
(15)
(1)
(3)
τ jk
( 4)
τ jk
=
0
In
if Pfjk = max(k < j ) Pfjk
1
=
0
otherwise
ϒj =
if Φ (− β j )Φ (−u jk ) ≥ Φ (− β k )Φ (−v jk )
1
otherwise
if Φ (− β k )Φ (−v jk ) > Φ (− β j )Φ (−u jk )
1
τ jk =
0
otherwise
( 4)
τ jk + (5)τ jk = 1
β1 β 2
β
... m ϕ (m; ρ )dm1dm2 ...dmm
−∞ −∞ −∞ m
∫
Φ(− β j )
+ (− P ( F3 ))
For the failure to obtain the certain valves of the reliability and
sensitivity by the narrow bounds, a method used for reliability and
sensitivity analysis with multiple failure modes was introduced in this
paper and the solution procedure roughly follows the approach developed by[38].
Given that there are “m” multiple failure modes in a system, the
calculation of its possibility of failure is to obtain the integration of a
multidimensional normal joint distribution. As a result, the possibility of failure of a serial structure with multiple failure modes is given
by:
i =1
ϕ (− β j )
(15),
α ij ≈ Φ (
− βi + ρij ϒ j
1 − ρij2 ϒ j (− β j + ϒ j )
),
.
∂P ( F3 )
∂P ( F ) ∂P ( F1 )
∂P ( F2 )
∂α
=
+ (1 − α12 )
+ (− P ( F2 )) 12 + (1 − α123 )
∂σ xi
∂σ xi
∂σ xi
∂σ xi
∂σ xi
4.2.2. A Method for Reliability and Sensitivity Analysis with Multiple Failure Modes
m
equation
Up to now, the possibility of failure with “m” multiple failure
modes is obtained and the next work is to focus attention on the calculation of reliability sensitivity. For lack of space, a description of
the complete theoretical analysis is avoided and only a conceptual
description and important results are given.
( 5)
P{F }=P ( Fi < 0)=1-Φ (β ;ρ )=1- ∫
the
∫
(11)
∂α123
∂P ( Fm )
∂α
+ ... + (1 − α12...m )
+ (− P ( Fm )) 12...m
∂σ xi
∂σ xi
∂σ xi
In the equation (16),
∂α ij
∂σ xi
= φ ( βij )
∂βij
∂σ xi
=
∂βij
∂σ xi
(16)
∂P( Fi )
can be obtain by equation(8) and
∂σ xi
, Ξ j = ϒ j (− β j + ϒ j ) ,
1
1 − ρij2Ξ j
(
− βi + ρij ϒ j 2 ∂Ξ j
∂ϒ j
∂βi
+ ρij
ρ
,
)+
3 ij ∂σ
∂σ xi
∂σ xi
xi
2
2
2(1 − ρij Ξ j )
As to a general serial system, the possibility of failure can be
expressed as follows:
P{F } = P{( F1 ≤ 0) ( F2 ≤ 0) ... ( Fm ≤ 0)} (12)
In order to calculate the equation (12), the correlation coefficient is proposed to show the correlation with multiple failure
modes. If there are two failure modes, the possibility of failure can
be expressed as follows:
P{F12 } = ( F1 F2 ) = P ( F1 ) + P ( F2 ) − P ( F1 F2 ) = P ( F1 ) + P ( F2 ) − P ( F1F2 ) (13)
Supposing P ( F1F2 ) = α12 P ( F2 ) , α12 is the correlation coefficient of these two failure modes. As a result,
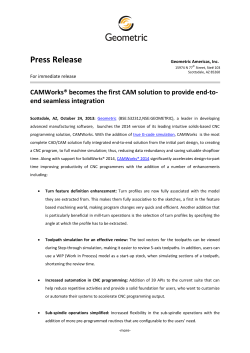
Fig. 3. The flowchart of method for geometric accuracy allocation of multi-axis machine tool for improving machining accuracy reliability
Eksploatacja i N iezawodnosc – Maintenance and Reliability Vol.17, No. 1, 2015
149
S cience and Technology
∂ϒ j
∂σ xi
=
−Φ (− β j ) β jφ (− β j ) + φ 2 (− β j )
2
Φ (− β j )
∂Ξ j
∂σ xi
(−
∂β j
∂σ xi
= (2ϒ j − β j )
T
E = [ E X , EY , EZ ] ) ,
∂ϒ j
∂σ xi
−ϒj
In this paper, the machining accuracy reliability limit state equations of the machine tool are subject to the expression as follows:
∂β 2
∂σ xi
l11 ≤ E x ≤ l12
In order to develop an approach to distribute this five-axis machine tool on machining accuracy, the method used for the machining accuracy reliability and sensitivity with multiple failure modes is
introduced in this paper and the calculation of the reliability and reliability sensitivity is developed in MatLab software. Besides, the process of this accuracy distribution method in this paper can be shown
in Figure 3.
l21 ≤ EY ≤ l22 (18)
l31 ≤ EZ ≤ l32
From the equation (18), it is not difficult to notice that this machine tool has 26 failure modes in total, including 6 single failure
modes, 12 double failure modes and 8 triple failure modes.
One of important aspect of the design requirements of such machine tool is that the probability of failure of position error less than
0.03mm should be no more than 5%. According to “Test code for
machine tools- Part 1: Geometric accuracy of machines operating
under no-load or finishing conditions” and “Test code for machine
tools-Part 2: Determination of accuracy and repeatability of positioning numerically controlled axes”, the values of geometric parameter
errors of five-axis NC machine tool were set initially and were shown
in Table 3.
5. Case Study
In the preceding section, a method of geometric accuracy design
of multi-axis machine tool for improving machining accuracy reliability was introduced and a machining accuracy reliability model
and a sensitivity model with multiple failure modes based on AFOSM
theory were established. Previous to it, a method for relating the volumetric accuracy of a machine to the errors on individual links and
joints in its kinematic chain was described and the error model can be
expressed by the form:
Table 3. Initial values of geometric parameter errors of five-axis NC machine tool (mm)
150
(17)
Number i
1
2
3
4
5
6
7
8
Parameter
∆xx
∆y x
∆z x
∆α x
∆β x
∆γ x
∆x y
∆y y
Value
0.0065
0.0065
0.0065
0.0037/
1000
0.0037/
1000
0.0037/
1000
0.007
0.007
Number i
9
10
11
12
13
14
15
16
Parameter
∆z y
∆α y
∆β y
∆γ y
∆xz
∆y z
∆xz
∆xz
Value
0.007
0.0028/
1000
0.0028/
1000
0.0028/
1000
0.007
0.007
0.007
0.0028/
1000
Number i
17
18
19
20
21
22
23
24
Parameter
∆β z
∆γ z
∆x A
∆y A
∆z A
∆α A
∆β A
∆γ A
Value
0.0028/
1000
0.0028/
1000
0.0058
0.0058
0.0058
0.0061/
1000
0.0061/
1000
0.0061/
1000
Number i
25
26
27
28
29
30
31
32
Parameter
∆xB
∆yB
∆z B
∆α B
∆β B
∆γ B
∆γ xy
∆β xz
Value
0.0068
0.0068
0.0068
0.0049/
1000
0.0049/
1000
0.0049/
1000
0.0037/
500
0.0037/
500
Number i
33
34
35
36
37
Parameter
∆α yz
∆γ xa
∆β xa
∆γ yb
∆α yb
Value
0.0037/
500
0.011/
300
0.011/
300
0.011/
300
0.011/
300
Eksploatacja i N iezawodnosc – Maintenance and Reliability Vol.17, No. 1, 2015
S cience and Technology
In order to improve the machining accuracy reliability of this fiveaxis NC machine tool, the models based on AFOSM theory addressed
in section 4 was used. The process was divided into two steps: one
was to determine some points by orthogonal sampling method in the
X-, Y- plane of this machine tool to obtain the reliability, and the other
was to realize accuracy allocation of all the geometric parameter errors of this machine tool. Five points 50, 225, 275, 325, 500 were
chosen in X-axis and −225, −50, 0, 50, 225 were selected in Y-axis, as
a result, there were 25 points in X-,Y- plane. The machining accuracy
reliability model for accuracy allocation of machine tool addressed in
this paper used to optimize errors was given by the expression (15),
and its process of calculation was operated in the MatLab environment. According to the constraint conditions, if max Pf (t ) > 5% or
1 m
∑ Pf (t ) > 3% , max Pf (t ) was obtained and chosen to calculate
m t =1
∂ max Pf (t )
∂σ xi
to determine the geometric parameter error to be im-
Table 4. Values of the possibility of failure of machining accuracy before
improvement
Vector of point i
Narrow bounds
method
(50, 225)
(50,50)
The method in this paper
Reliability
index
Possibility of
failure
[0.0961,0.1132]
1.236
0.1079
[0.0689,0.0821]
1.427
0.0766
(50.0)
[0.0531,0.0598]
1.578
0.0572
(50,-50)
[0.0689,0.0821]
1.427
0.0766
(50, -225)
[0.0961,0.1132]
1.236
0.1079
(225, 225)
[0.0997,0.1124]
1.234
0.1083
(225,50)
[0.0689,0.0821]
1.426
0.0766
(225,0)
[0.0531,0.0598]
1.578
0.0572
(225,-50)
[0.0689,0.0821]
1.426
0.0766
(225, -225)
[0.0997,0.1124]
1.234
0.1083
proved. This process was over until max Pf (t ) < Pfs max and
1 m
∑ Pf (t ) < Pfsmean. In this expression, l11 , l12 , l13 , l21 , l22 , l23 were
m t =1
(275, 225)
[0.0997,0.1124]
1.233
0.1083
(275,50)
[0.0689,0.0821]
1.426
0.0766
(275,0)
[0.0556,0.0606]
1.576
0.0575
obtained though putting the vector of each point into the equation (5)
and σ xi should be no more than the initial valves shown in Table 3. In
order to verify the effectiveness of the method introduced in this paper, the possibility of failure of this machine tool based on the narrow
bounds method was also calculated. The values of the possibility of
failure of machining accuracy before improvement were acquired and
shown in Table 4.
(275,-50)
[0.0689,0.0821]
1.426
0.0766
(275, -225)
[0.0997,0.1124]
1.233
0.1083
(325, 225)
[0.1042,0.1134]
1.231
0.1088
(325,50)
[0.0689,0.0821]
1.421
0.0772
(325,0)
[0.0556,0.0606]
1.576
0.0575
M
: max Pf (t ), max
S. t.
: l11 ≤ E x ≤ l12
(325,-50)
[0.0689,0.0821]
1.421
0.0772
(325, -225)
[0.1042,0.1134]
1.231
0.1088
∂ max Pf (t )
(500, 225)
[0.1042,0.1134]
1.231
0.1088
∂σ xi
(500,50)
[0.0668,0.0792]
1.421
0.0772
(500,0)
[0.0567,0.0605]
1.564
0.0584
(500,-50)
[0.0668,0.0792]
1.421
0.0772
l31 ≤ EZ ≤ l32
(500, -225)
[0.1042,0.1134]
0<σ xi ≤ initial values
Mean value
l21 ≤ EY ≤ l22
1.231
0.1088
1.378
0.0856
1 m
∑ Pf (t ) ≤ 3%
m t =1
max Pf (t ) ≤ 5%
It is not difficult to notice that there are two
important points in Table 4: one is that the method developed in this paper is verified because
the values of possibility of failure calculated by
such method are in the intervals obtained according to the narrow bounds method, and the
other is that the initial values of the reliability
of this machine tool failed to satisfy the design
requirement (no more than 5% and 3% respectively). As a result, it is necessary to reallocate
the initial values of geometric parameter errors
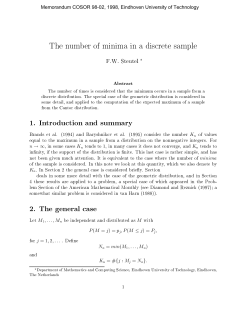
Fig. 4. Initial values of the reliability sensitivity of geometric parameter errors
in Table 3 according to the sensitivities of such
errors shown in Figure 4. In order to satisfy the
culated as shown in Table 5. It suggests that the whole process of acdesign requirement five times improvements have been developed.
curacy distribution have been finished after the forth improvements.
From the Figure 4 to Figure 8 we can learn that geometric parameter
Figure 9 illustrates the relation between the probability of failerrors ∆β xz , ∆α yz , ∆α y , ∆γ x , ∆β x have the largest values of reliure and each improvement, it is clear that each improvement leads
ability sensitivity and have been improved as the changing objects in
to a decrease in the maximum values and mean values of possibility
turn as a result, besides, the machine accuracy reliability (expressed
of failure and such decrease becomes very tight after a certain imby possibility of failure) with these five improvements have been calprovement. Figure 10 illustrates the relation between the reliability
sensitivity of geometric parameter errors improved and each improve-
Eksploatacja i N iezawodnosc – Maintenance and Reliability Vol.17, No. 1, 2015
151
S cience and Technology
cause the aim of each improvement is to reduce
or eliminate the largest reliability sensitivity of
geometric parameter errors. Figure 11 illustrates
that the values of reliability sensitivity of geometric parameter errors unimproved change in a
small scope, which means that these errors have
smaller sensitivity to the reliability of machine
tool in this machining case.
Conclusions
Different geometric errors have varying influence on accuracy of the machine tools. The
main emphasis of this research is to develop a
generalized method to obtain an optimal σ i of
Fig. 5. Reliability sensitivity of geometric parameter errors after the first improvement
each geometric error under certain machine accuracy design requirements. For machine accuracy reliability can be as a specification to measure the ability of machine tools to overcome a
certain functions and reliability sensitivity can
reflect the influence of basic parameters to the
possibility of failure, which can be used for improving and optimizing the basic parameters of
machine tools, the accuracy distribution of machine tools for improving the machine accuracy
reliability was a process of optimizing or reallocating σ i of each geometric error by taking
reliability as a measure of the ability of machine
tool and taking reliability sensitivity as a reference of optimizing the basic parameters of machine tools to design a machine tool.
Fig. 6. Reliability sensitivity of geometric parameter errors after the second improvement
In order to realize the distribution of σ i of
each geometric error, a generalized machine accuracy reliability model and a sensitivity model
for accuracy distribution of machine tools with
multiple failure modes are developed here.
Based on such models, the optimal σ i of each
geometric error can be obtained for improving
accuracy of machine tools. This study contains:
(1) A comprehensive volumetric model explains how individual errors in the components
of a machine affect its volumetric accuracy (the
coupling relationship). This was established by
MBS theory, which shows the geometric structure, the change of comparative position and
orientation, and the geometric errors.
Fig. 7. Reliability sensitivity of geometric parameter errors after the third improvement
(2) The definition of machine accuracy reliability of machine tool was given .Because
it can reflect the ability to perform its specified functions and machine accuracy sensitivity
can be used for optimizing the basic parameters
of machine tools, accuracy distribution based on
the reliability theory can improve the level of
machining accuracy in terms of satisfying design requirements such as machining accuracy
reliability while keeping the maximum tolerances of these geometric errors. As a result, the
development of a systematic method to realize
accuracy distribution of machine tool based on
reliability theory according to failure modes is
the second very important aspect of this paper.
(3) In order to use the systematic method to
Fig. 8. Reliability sensitivity of geometric parameter errors after the fourth improvement
realize accuracy distribution of machine tool, a
reliability theory called advanced first order and
ment. As expected, with each improvement, the gaps among reliabilsecond moment (AFOSM) theory was introduced to obtain the reliity sensitivity of geometric parameter errors improved decreased be-
152
Eksploatacja i N iezawodnosc – Maintenance and Reliability Vol.17, No. 1, 2015
S cience and Technology
Table 5. Improved values of errors and possibility of failure in different improvements
The first improvement
The second
improvement
The third
improvement
The forth
improvement
The fifth
improvement
∆β xz
∆α yz
∆α y
∆γ x
∆β x
Initial
value
0.0037/500
0.0037/500
0.0037/1000
0.0028/1000
0.0037/1000
Improved
value
0.003/500
0.003/500
0.003/1000
0.002/1000
0.003/1000
maximum
value
8.96%
7.32%
5.89%
4.57%
3.95%
Mean
value
7.36%
5.53%
4.25%
2.79%
2.43%
Improved object
Parameter
errors
Possibility
of failure
Fig. 9. Tendency of the maximum values and mean values of possibility of failure with different improvements
ability and sensitivity with single failure mode.
Besides, the multiple failure modes based on
AFOSM theory were studied and the model of
reliability and the model of sensitivity of a serial system with multiple failure modes were
established.
(4) Based on the previous theoretical research, a case study example for a five-axis
machine tool was used to demonstrate the effectiveness of this method. Each geometric error under certain accuracy design requirements
was optimized. Accuracy grades of main feeding components of mechanical assemblies were
also specified.
Despite the progress, a number of issues
need to be further investigated to improve the
method proposed here: the proposed method is
developed on the premise that the volumetric
machining accuracy is influenced only geometric errors, however, thermal errors and dynamic
errors as other main errors can arise as a result
of joint interface deformation between machine
tool structural components and contribute to
volumetric machining accuracy. As a result, the
development of a method of accuracy allocation
of machine tool for improving machining accuracy reliability while considering such errors
would be a focus of future research.
Acknowledgment
The authors are most grateful to the National Natural Science Foundation of China
(No.51005003), the Leading Talent Project of
Guangdong Province, Rixin Talent Project of
Beijing University of Technology, Beijing Education Committee Scientific Research Project
and Basic Research Foundation of Beijing
University of Technology for supporting the
research presented in this paper.
Fig. 10. Tendency of the reliability sensitivity of geometric parameter errors improved
Fig. 11. Tendency of the reliability sensitivity of geometric parameter errors unimproved
Eksploatacja i N iezawodnosc – Maintenance and Reliability Vol.17, No. 1, 2015
153
S cience and Technology
References
1.
2.
3.
4.
5.
6.
7.
8.
9.
10.
11.
12.
13.
14.
15.
16.
17.
18.
19.
20.
21.
22.
23.
24.
25.
26.
27.
28.
29.
30.
31.
32.
33.
Bohez EL, Ariyajunya B, Sinlapeecheewa C, et al. Systematic geometric rigid body error identification of 5-axis milling machines .
International Journal of Comp. Aided Des. 2007; V 39(4): 229-244.
Chen GD, Liang YC, Sun YZ. Volumetric error modeling and sensitivity analysis for designing a five-axis ultra-precision machine tool.
International Journal of Advanced Manufacturing Technology 2013; (68):2525-2534.
Chen JS. Computer-aided accuracy enhancement for multi-axis CNC machine tool. International Journal of Machine Tools and Manufacture
1995; 35(4):593–605.
Chen JX, Lin SW, He BW, et al. Geometric error compensation for multi-axis CNC machines based on differential transformation.
International Journal of Advanced Manufacturing Technology 2014; (71):635-642.
Cheng Q, Wu C, Gu PH. An Analysis Methodology for Stochastic Characteristic of Volumetric Error in Multi-axis CNC Machine Tool.
Journal of Mathematical Problems in Engineering 2013; (2013):1-12.
Chu QB, Ma L, Chang LM. Deterministic design, reliability design and robust design. Machinery Industry Standardization and Quality 2012;
8(471):16-20.
Deng C, Xie SQ, Wu J, et al. Position error compensation of semi-closed loop servo system using support vector regression and fuzzy PID
control. International Journal of Advanced Manufacturing Technology 2014; (71):887-898.
Diplaris SC, Sfantsikopoulos MM. Cost–Tolerance Function. A New Approach for Cost Optimum Machining Accuracy. International Journal
of Advanced Manufacturing Technology 2000; (16):32-38.
Dorndorf U, Kiridena VSB, Ferreira PM. Optimal budgeting of quasistatic machine tool errors. Journal of Engineering for Industry 1994;
116(1): 42-53.
Dufour P, Groppetti R. Computer Aided Accuracy Improvement in Large NC Machine-Tools. In Proceedings of the 2006 International
Conference on the MTDR 1981; 22: 611-618.
Fu GQ, Fu JZ, Xu YT. Product of exponential model for geometric error integration of multi-axis machine tools. International Journal of
Advanced Manufacturing Technology 2014; (71):1653-1667.
González I, Sánchez I Statistical tolerance synthesis with correlated variables. International Journal of Mech Mach Theory 2009; 44(6):10971107.
Hocken R, Simpson JA, Borchardt B, et al. Three Dimensional Metrology. Journal of Ann. CIRP 1977; 26(2): 403-408.
Huang MF, Zhong YR. Optimized sequential design of two-dimensional tolerances. International Journal of Advanced Manufacturing
Technology 2007; (33):579-593.
Huang X, Ding W, Hong R. Research on accuracy design for remanufactured machine tools. In Proceedings of the 2006 International
Conference on Technology and Innovation 2006; 1403-1410.
Huang YM, Shi CS. Optimal tolerance allocation for a sliding vane compressor. Journal of Mechanical Design 2006; 128(1):98-107.
Huang YQ, Zhang J, Li X. Thermal error modeling by integrating GA and BP algorithms for the high-speed spindle. International Journal of
Advanced Manufacturing Technology 2014; (71):1669-1675.
Karadeniz H, Toğan V, Vrouwenvelder T. An integrated reliability-based design optimization of offshore towers. Reliability Engineering and
System Safety 2009; 94(10): 1510-1516.
Khan AW, Chen WY. A methodology for systematic geometric error compensation in five-axis machine tools. International Journal of
Advanced Manufacturing Technology 2011; (53):615-628.
Khodaygan S, Movahhedy MR. Fuzzy-small degrees of freedom representation of linear and angular variations in mechanical assemblies for
tolerance analysis and allocation. Mechanism and Machine Theory 2011; (46):558-573.
Kiridena VSB, Ferreira PM. Kinematic modeling of quasistatic errors of three-axis machining centers. International Journal of Machine
Tools and Manufacture 1994; 34(1): 85-100.
Lee K, Yang SH. Measurement and verification of position-independent geometric errors of a five-axis machine tool using a double ball-bar.
International Journal of Machine Tools and Manufacture 2013; (70):45-52.
Liu HL, Li B, Wang XZ, et al. Characteristics of and measurement methods for geometric errors in CNC machine tools. International Journal
of Advanced Manufacturing Technology 2011; (54):195-201.
Liu Y, Li Y. Dimension chain calculation precision in control of hull construction. Chinese Journal of Shipbuilding of China 2004; 45(2):
81-87.
Love WJ, Scarr. AJ. The determination of the volumetric accuracy of multi-axis machines. In Proceedings of the 2006 International
Conference on the 14th MTDR 1973: 307-315.
Lu ZY, Song SF, Li HS, et al. Structural reliability and reliability sensitivity analysis organization. China: Sciences Press 2009.
Mínguez R, Castillo E. Reliability-based optimization in engineering using decomposition techniques and forms. Structural Safety 2009;
31(3): 214-223.
Muthu P, Dhanalakshmi V, Sankaranarayanasamy K. Optimal tolerance design of assembly for minimum quality loss and manufacturing cost
using metaheuristic algorithms. International Journal of Advanced Manufacturing Technology 2009; (44):1154-1164.
Prabhaharan G, Asokan P, Rajendran S. Sensitivity-based conceptual design and tolerance allocation using the continuous ants colony
algorithm (CACO). International Journal of Advanced Manufacturing Technology 2005; (25):516-526.
Portman VT. A Universal Method for Calculating the Accuracy of Mechanical Devices. Journal of Soviet Engineering Research 1982; V1
(7): 11-15.
Siva KM, Stalin B. Optimum tolerance synthesis for complex assembly with alternative process selection using Lagrange multiplier method.
International Journal of Advanced Manufacturing Technology 2009; (44):405-411.
Sivakumar K, Balamurugan C, Ramabalan S. Concurrent multi-objective tolerance allocation of mechanical assemblies considering
alternative manufacturing process selection. International Journal of Advanced Manufacturing Technology 2011; (53):711-732.
Srivastava A, Veldhuis S, Elbestawi MA. Modeling geometric and thermal errors in a five-axis CNC machine tool. International Journal of
Machine Tools and Manufacture 1995; V35(9): 1321-1337.
154
Eksploatacja i N iezawodnosc – Maintenance and Reliability Vol.17, No. 1, 2015
S cience and Technology
34. Wang C, Fei Y, Hu P, et al. Accuracy distribution and determination of the flexible three-coordinate measuring machine. The Third International
Symposium on Precision Mechanical Measurements, International Society for Optics and Photonics 2006; 62800U-7.
35. Wang E. An investigation in cyclic optimum method of accuracy allocation for instruments. Chinese Journal of Scientific instrument 1985;
6(2):140-146.
36. Wang SX, Yun JT, Zhang ZF. Modeling and compensation technique for the geometric errors of five-axis CNC Machine Tools. Chinese
Journal of Mechanical Engineering 2003; 16(2):197-201.
37. Yang H, Fei Y, Chen X. Uncertainty Analysis and Accuracy Design of Nano-CMM. Journal of Chongqing University 2006; 29 (8):82-86.
38. Yang J. Research on structure reliability calculation method and sensitivity analysis. China: Dalian University of Technology, 2012.
39. Ye B, Salustri FA. Simultaneous tolerance synthesis for manufacturing and quality. Res Eng Des. 2003; 14(2):98-106.
40. Yu ZM, Liu ZJ, Ai YD, Xiong M. Geometric error model and precision distribution based on reliability theory for large CNC gantry
guideway grinder. Chinese Journal of Mechanical Engineering 2013; 49(17):142-151.
41. Zhang GJ, Cheng Q, Shao XY, et al. Accuracy analysis for planar linkage with multiple clearances at turning pairs. Chinese Journal of
Mechanical Engineering 2008; 21(2): 36-41.
42. Zhang X, Chang W, Tan Y. Accuracy Allocation of anti-tank missile weapon system. Journal of Projectiles Rockets Missiles and Guidance
2003; 23(2):17-19.
43. Zhu PH, Chen LH. A novel method of dynamic characteristics analysis of machine tool based on unit structure. Science China Technological
Sciences 2014; 57 (5): 1052-1062.
44. Zhu SW, Ding GF, Qin SF, et al. Integrated geometric error modeling, identification and compensation of CNC machine tools, International
Journal of Machine Tools and Manufacture 2012; (52): 24-29.
Appendix Nomenclature
∆xx
∆y x
∆z x
∆yB
= Positioning error
= Y direction of straightness error
= Z direction of straightness error
∆α x =
∆β x =
∆γ x =
=
∆x y
∆y y =
=
∆z y
∆α y =
∆β y =
∆γ y =
∆xz =
∆y z =
=
∆z z
∆α z =
∆β z =
∆γ z =
∆xB =
Rolling error
Britain swing error
Yaw error
X direction of straightness error
Positioning error
Z direction of straightness error
Rolling error
Britain swing error
Yaw error
X direction of straightness error
Y direction of straightness error
Positioning error
Rolling error
Britain swing error
Yaw error
X direction run-out error
∆z B
= Y direction run-out error
= Z direction run-out error
∆α B =
∆β B =
∆γ B =
∆x A =
∆y A =
∆z A =
∆α A =
∆β A =
∆γ A =
∆γ xy =
∆β xz =
∆α yz =
∆γ yb =
∆α yb =
∆γ xa =
∆β xa =
Around the X axis turning error
Turning error
Around the Z axis turning error
X direction run-out error
Y direction run-out error
Z direction run-out error
Turning error
Around the Y axis turning error
Around the Z axis turning error
X, Y -axis perpendicularity error
X, Z -axis perpendicularity error
Y, Z -axis perpendicularity error
B, X- axis parallelism error in XY plane
B, Z- axis parallelism error in ZY plane
A, Y-axis perpendicularity error
A, Z-axis perpendicularity error
Ligang Cai
Ziling Zhang
Qiang Cheng
Zhifeng Liu
College of Mechanical Engineering and Applied Electronics Technology Beijing
University of Technology, Beijing 100124, China
Peihua Gu
Department of Mechatronics Engineering
Shantou University, Shantou, Guangdong, China 515063
E-mails: [email protected], [email protected], [email protected],
[email protected]; [email protected]
Eksploatacja i N iezawodnosc – Maintenance and Reliability Vol.17, No. 1, 2015
155


© Copyright 2026