
Final Revised Paper - Atmospheric Chemistry and Physics
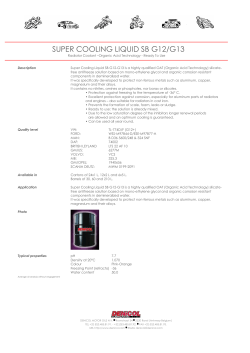
Atmos. Chem. Phys., 14, 13773–13787, 2014 www.atmos-chem-phys.net/14/13773/2014/ doi:10.5194/acp-14-13773-2014 © Author(s) 2014. CC Attribution 3.0 License. Submicron aerosol source apportionment of wintertime pollution in Paris, France by double positive matrix factorization (PMF2) using an aerosol chemical speciation monitor (ACSM) and a multi-wavelength Aethalometer J.-E. Petit1,2 , O. Favez1 , J. Sciare2 , F. Canonaco3 , P. Croteau4 , G. Moˇcnik5 , J. Jayne4 , D. Worsnop4 , and E. Leoz-Garziandia1 1 Institut National de l’EnviRonnement Industriel et des risqueS, INERIS, Parc Technologique ALATA BP2, 60550 Verneuil-en-Halatte, France 2 Laboratoire des Sciences du Climat et de l’Environnement, LSCE, UMR8212, CNRS-CEA-UVSQ, 91191 Gif-sur-Yvette, France 3 Laboratory of Atmospheric Chemistry, Paul Scherrer Institute, 5232 PSI Villigen, Switzerland 4 Aerodyne Research, Inc. 45 Manning Road Billerica, MA, USA 5 Aerosol d.o.o., Kamniška 41, 1000 Ljubljana, Slovenia Correspondence to: O. Favez ([email protected]) Received: 6 April 2014 – Published in Atmos. Chem. Phys. Discuss.: 2 June 2014 Revised: 3 October 2014 – Accepted: 8 October 2014 – Published: 22 December 2014 Abstract. Online non-refractory submicron aerosol mass spectrometer (AMS) measurements in urban areas have successfully allowed the apportionment of specific sources and/or physical and chemical properties of the organic fraction. However, in order to be fully representative of PM pollution, a comprehensive source apportionment analysis is needed by taking into account all major components of submicron aerosols, creating strengthened bonds between the organic components and pollution sources. We present here a novel two-step methodology to perform such an analysis, by taking advantage of high time resolution of monitoring instruments: the aerosol chemical speciation monitor (ACSM) and the multi-wavelength absorption measurements (Aethalometer AE31) in Paris, France. As a first step, organic aerosols (OA) were deconvolved to hydrocarbon-like OA (HOA), biomass burning OA (BBOA) and oxygenated OA (OOA) with positive matrix factorization (PMF), and black carbon was deconvolved into its wood burning and fossil fuel combustion fractions. A second PMF analysis was then carried out with organic factors, BC fractions and inorganic species (nitrate, sulfate, ammonium, chloride), leading to a four-factor solution allowing highly time-resolved characterization of the major sources of PM1 . Outputs of this PMF2 include two dominant combustion sources (wood burning and traffic) as well as semi-volatile and low-volatile secondary aerosols. While HOA is found to be emitted by both wood burning and traffic, the latter sources occurred to significantly contribute also to OOA. 1 Introduction The source apportionment of aerosolized particulate matter has become one of the main concerns of air quality studies as well as stakeholder initiatives. This is primarily related to growing evidence of their adverse health effects (Pope and Dockery, 2006; Pope et al., 2004), impacts on air quality, by means of frequent exceedances of EU limit values at urban sites, and, globally, climate change, through its direct and indirect effects on the Earth’s radiative balance (Haywood and Boucher, 2000; Rosenfeld et al., 2008). Moreover, despite geographical disparities, the understanding of the particulate matter in urban areas remains complex by virtue of its chemical composition and the multitude of emission sources. Published by Copernicus Publications on behalf of the European Geosciences Union. 13774 J.-E. Petit et al.: Submicron aerosol source apportionment of wintertime pollution The organic aerosol (OA) fraction gathers in itself all of the aforementioned challenges. It is especially complex and dynamic, exhibiting an outstanding number of molecules, structures, transformation pathways, and physical and chemical properties. While primary OA are linked to local/regional emission sources (e.g., traffic and biomass burning), secondary OA (SOA) usually result from the chemical transformation of pre-existing particles or from the condensation of gaseous precursors through several oxidation reactions, and thus present diverse degrees of oxidation. This issue is emphasized by strong discrepancies between laboratory and ambient measurements, and traditional SOA formation models, which could underestimate secondary particle formation and/or the condensation of oxidized primary organic aerosols (OPOA) (Robinson et al., 2007), especially for wood burning (Adler et al., 2011; Grieshop et al., 2009; Heringa et al., 2011; Robinson et al., 2006) and traffic (Chirico et al., 2010; Platt et al., 2013; Sage et al., 2008; Weitkamp et al., 2007) emissions. Previous worldwide high-time resolution measurements of the chemical composition of non-refractory submicron aerosols (nitrate, sulfate, ammonium, chloride and organic matter), performed by aerosol mass spectrometers (Aerodyne Research, Inc., ARI), highlight the quantitative predominance of OA, and have enhanced the understanding of the chemical and physical transformations of OA (Jimenez et al., 2009). The aerosol chemical speciation monitor (ACSM, ARI) shares the same technology and measurement principle as the regular aerosol mass spectrometer (AMS), except for size distribution information, and allows for robust long-term ambient monitoring (Ng et al., 2011). Through the use of source-receptor model toolkits based on positive matrix factorization (PMF; Ulbrich et al., 2009; Canonaco et al., 2013), both instruments allow for the deconvolution of OA into several subgroups characterized by their fragmentation fingerprints. Such source apportionment (SA) studies are nowadays widely reported in the literature (e.g., Lanz et al., 2010; Zhang et al., 2011; Crippa et al., 2014) and have led to a significant improvement of our understanding of OA sources and atmospheric ageing. This type of statistical analysis commonly leads to the identification of several organic factors presenting various degrees of oxidation and/or having mass spectra signatures which can be related to specific tracers of a given emission source. Oxidized organic aerosols (OOA) are thought to be linked to secondary organic aerosols (SOA), which can be further divided into semi-volatile and low-volatile fractions (SV-OOA and LV-OOA, respectively); while hydrogenated organic aerosols (HOA) are usually considered as primary organic aerosols (POA) emitted by combustion of fossil fuels (gasoline, diesel or crude oil for instance). Other OA sources such as biomass burning organic aerosols (BBOA) or cooking organic aerosols (COA) were also observed depending on the site location and the season of study (Lanz et al., 2007; Allan et al., 2010; Crippa et al., 2013a, b). Atmos. Chem. Phys., 14, 13773–13787, 2014 However, OA source apportionment does not address the mass of the contributions from different pollution sources, as other carbonaceous (e.g., black carbon) and inorganic species (nitrate, sulfate and ammonium) account or a significant fraction of PM1 mass. Since the AMS also allows for the measurement of non-refractory inorganic compounds, some alternative and innovative approaches recently make use of PMF analyses including the latter species. For instance, Sun et al. (2012) proposed the combination of organic MS and specific inorganic fragments to investigate the links between these two fractions. More recently, McGuire et al. (2014) used the total AMS mass spectra to simultaneously take organic and inorganic fragments into account. These novel methodologies are of prime interest for an improved understanding of pollution sources and their evolution in the atmosphere. The combination of measurements obtained from different instruments is also quite helpful. In this context, Crippa et al. (2013a) combined organic AMS data with PTR-MS (proton-transfer-reaction mass spectrometer) data, creating strengthened bonds between particulate phase organics and their gaseous precursors. Including tracer measurements of other individual species, molecules, or elements (e.g., BC fractions, levoglucosan, transition metals) may also greatly improve PM1 source apportionments. Online measurements of specific organic tracers and transition metals might be envisaged for networking activities in near future. For BC, among the various instruments that already allow its monitoring in ambient air, the multi-wavelength Aethalometer (Magee Scientific) offers the possibility for absorption spectral dependence analyses of the various absorbing materials (e.g., fossil fuel BC and wood burning BC, as defined by Sandradewi et al., 2008 and Favez et al., 2010). Here, we propose a novel methodology using conventional AMS/PMF approaches and external data sets. This methodology shares the same goal than innovative approaches mentioned above, but has been developed with ACSM measurements, which shows less sensitivity than high-resolution AMS measurements. The first step of the presented work aims to identify and characterize wintertime OA sources and transformation processes in the region of Paris, as usually performed with mass spectrometer data sets for about 10 years. Then, going beyond a single OA source apportionment, the resulted organic tracers combined with inorganic species (nitrate, sulfate, ammonium and chloride) and source specific black carbon concentrations, are used for PM1 source apportionment. 2 2.1 Methodology Measurement site and instrumentation Measurements were conducted at the SIRTA atmospheric supersite (Site Instrumental de Recherche par Télédétection Atmosphérique, 2.15◦ E; 48.71◦ N; 150 m a.s.l.; www.atmos-chem-phys.net/14/13773/2014/ J.-E. Petit et al.: Submicron aerosol source apportionment of wintertime pollution Haeffelin et al., 2005; http://sirta.ipsl.fr). This site is located about 20 km southwest of Paris and is representative of suburban background conditions of the Ile-de-France region (Sciare et al., 2011; Crippa et al., 2013a; Freutel et al., 2013). Data presented here are part of the long-term in situ aerosol properties monitoring observations performed from mid-2011 onwards at SIRTA within the EU-FP7 (European Union Seventh Framework Programme for Research) ACTRIS program (Aerosols, Clouds, and Trace gases Research InfraStructure Network; http://www.actris.net). We selected the period from 31 January to 26 March 2012 for its representativeness of late winter–early spring conditions, a period of the year with frequent exceedances of the European daily PM10 threshold (50 µg m−3 ) and a significant contribution towards exceeding the annual mean PM2.5 target value (20 µg m−3 ). The combination of enhanced domestic heating emissions and stagnant atmospheric conditions in late winter–early spring is propitious for the accumulation of pollutants within the boundary layer, and for photochemical processes influencing air quality in North-Western Europe (Favez et al., 2012; Waked et al., 2014; Bressi et al., 2013). An overview of meteorological parameters and submicron aerosol chemical composition during the selected period is shown in Fig. 1, illustrating the occurrence of high concentrations of organics initially and ammonium nitrate later in the measurement period. Since summer 2011, measurements of the chemical composition of non-refractory submicron aerosol have been carried out at SIRTA using an ACSM. This recent instrument shares the same general structure with the AMS but has been specifically developed for long-term monitoring. An exhaustive description is available in Ng et al. (2011). Briefly, submicron particles are sampled at 3 L min−1 with a PM2.5 cut off, and sub-sampled at 85 mL min−1 through an aerodynamic focusing lens toward a conical porous tungsten vaporizer heated to 600 ◦ C. Non-refractory submicron particles are then flash-vaporized, ionized with electron impact at 70 eV. Ions are detected by a quadrupole mass spectrometer with a scan rate and m/z window of 500 ms amu−1 and [10; 150], respectively. As described by Ng et al. (2011), instrument mass calibration was performed by injecting generated mono-disperse 300 nm ammonium nitrate particles into both ACSM and a condensation particle counter (CPC), and assuming a particle density of 1.72 g cm−3 and a shape factor of 0.8, the response factor (RF) of nitrate and relative response factor of ammonium could be calculated. Performed in November 2011, i.e., 3 months before the start of this study, the RF of nitrate and the relative ionization efficiency (RIE) of ammonium were 2.31 × 10⁻¹¹ amps µg−1 m−3 and 6.0, respectively. Twenty scans (10 scans at ambient conditions and 10 blank scans with filtered air) allowed for the continuous measurement of the concentrations of total nonrefractory organics, nitrate, sulfate, ammonium, and chloride every 29 min. www.atmos-chem-phys.net/14/13773/2014/ 13775 Aerosol light absorption coefficients (babs ) were obtained every 5 min at seven different wavelengths (370, 470, 520, 590, 660, 880 and 950 nm) using a Magee Scientific Aethalometer (model AE31) equipped with a PM2.5 cut-off inlet. As previously highlighted, ambient BC mass size distributions predominantly show a size range between 0.1 and 1 µm (e.g., Healy et al., 2012; Laborde et al., 2013); thus, very little bias is assumed when combining PM2.5 BC and NR-PM1 species. This instrument was operated at a flow rate of 5 L min−1 . Due to the methodology used within the Aethalometer (filter-based measurement), absorption coefficients directly obtained from this instrument are affected by various sampling and analytical artifacts (mostly referred as multiple scattering and loading effects) which need to be carefully compensated (Collaud Coen et al., 2010). In the present work, the correction procedure introduced by Weingartner et al. (2003) was applied to our data set, as fully described in Sciare et al. (2011). Multi-wavelength absorption measurements were then used to apportion BC to two main fractions: fossil fuel BC (BCff ) and wood burning BC (BCwb ), following the “Aethalometer model” methodology (Sect. A in the Supplement) introduced by Sandradewi et al. (2008) and successfully applied to the same instrument and at the same site 1 year earlier than the present study (Sciare et al., 2011). This model assumes that the enhanced absorption at near UV wavelengths is due to absorbing organic molecules (brown carbon, BrC) linked to woodburning emissions. Although brown carbon may originate from other sources than wood burning emissions, to the best of our knowledge, there is no study in ambient conditions showing at near-UV wavelengths used by the Aethalometer significant absorption from BrC related to other sources than biomass burning. The consistency of such a deconvolution is furthermore illustrated by the good correlation (r 2 = 0.73, N = 2040) obtained between BCwb and m/z 60 from the ACSM (commonly used as a biomass burning tracer; Aiken et al., 2009), contrasting with the poor correlation between m/z 60 and BC (r 2 = 0.23, N = 2040). The consistency of ACSM and AE31 measurements has been checked performing 3 h PM1 chemical mass closure obtained through the comparison of the sum of individual chemical species monitored using both instruments with total PM1 concentrations measured independently using a co-located Tapered Element Oscillating Microbalance equipped with a Filter Dynamic Measurement System (TEOM-FDMS). This comparison shows a rather low correlation coefficient (r 2 ) of 0.65 (N = 394), that might be attributed to likely high uncertainties of TEOM-FDMS measurements at low PM1 concentrations and that is comparable to the ones previously obtained within such mass closure exercises (r 2 of 0.68 and 0.71 respectively for Sun et al., 2012 and Budisulistiorini et al., 2014). However the slope of 0.99 obtained from this comparison tends to reinforce the validity of the combination (and the calibration) of both ACSM and Atmos. Chem. Phys., 14, 13773–13787, 2014 13776 J.-E. Petit et al.: Submicron aerosol source apportionment of wintertime pollution 1 Figure 1. Meteorological parameters (ambientparameters temperature, pressure, wind speed and direction); fossil and wood burning fraction of 2 Figure 1. Meteorological (ambient temperature, pressure, wind speed and fuel direction); black carbon measured by anfuel Aethalometer; and Aerosol concentration of organics, sulfate, and ammonium 3 fossil and wood burning fractionmass of black carbon measured by annitrate, Aethalometer; Aerosol and chloride measured by ACSM (note different scales). 4 mass concentration of organics, nitrate, sulfate, ammonium and chloride measured by ACSM 5 (note different scales). 6 to characterize the major chemical comAE31 instruments ponents of the PM1 mass. 2.2 Source apportionment methods al. (2013). It allows users to take advantage of the multilinear engine (ME-2) algorithm (Paatero and Hopke, 2003), where a priori information might be introduced in form of known factor profiles and/or factor time series into the PMF analysis (Lanz et al., 2008). In this study the a value technique of the ME-2 solver was employed, where the constrained factor profiles were allowed to vary within the scalar value “a” (Eq. 3). Developed about 20 years ago (Paatero and Tapper, 1994), PMF is nowadays intensively used for the source apportionment of atmospheric PM pollutants using filter-based as well as on-line measurements. Briefly, time series of chemical fj,solution = fj ± a · fj , (3) species (or organic mass spectra for ACSM data) arranged as a matrix (X), are factorized into a linear combination of where f represents one factor profile in the F matrix. a factor (i.e., source profile) and time-series sub-matrices (F 7 a) b) Time-series and uncertainty matrices were both obtained and G, respectively) following from data (average analysis software (acsm_local Igor 8 Figure 2. a) Mean PM1 chemical composition over the 2012the lateACSM winter period X 3 3 9 PM = 21.7 µg/m ) b) Average PM chemical composition (in µg/m ) and ambient temperature procedure v1520) (Zhang et al., 2005; Ng et al., 2011; Ul1 xij = gip · fpj + eij 1, (1) 10 over several periods. brich et al., 2009). In our study, the two matrices conp tain 73 mass fragments (m/z), from m/z = 12 to m/z = 11 where xij correspond to the elements of matrix X, p repre100, and 2040 samples. Previous AMS measurements persents the number of factors in the solution, gip and fpj corformed in Paris (Crippa et al., 2013a, b) offered the opporrespond to the element of matrices G and F representing retunity to implement a priori factor profiles specifically repspectively time series and profiles (mass spectra for ACSM) resentative of the Ile-de-France wintertime pollution; HOA 25 of each factor, and eij correspond to residuals not fitted by and BBOA factor profiles were retrieved from the AMS the model for each data point. G and F matrices are resolved spectral database (http://cires.colorado.edu/jimenez-group/ for a minimum value of Q, defined as follows: AMSsd/, Ulbrich et al., 2009). The model was run several ! times, testing several numbers of (unconstrained) factors and 2 XX eij a values, as presented in the Sects. B, C and D in the SupQ= , (2) 2 plement. The best solutions are presented and discussed in σ ij i j Sect. 3.2. The second step of the source apportionment strategy prewhere σij represents the measurement uncertainty of each sented here consists of a PM1 source apportionment usdata point. ing outputs of the preliminary OA source apportionment The analysis of ACSM organic mass spectra was performed using SourceFinder (SoFi v4.5, http://www.psi.ch/ described above, source specific black carbon concentrations from the Aethalometer model (BCwb and BCff ) and acsm-stations/me-2). This toolkit, implemented along with − + − inorganic species (SO2− AMS and ACSM data processing software in Igor Pro 4 , NO3 , NH4 , Cl ) from ACSM measurements. This was performed using the EPA PMF (Wavemetrics, Inc.), was recently developed by Canonaco et Atmos. Chem. Phys., 14, 13773–13787, 2014 www.atmos-chem-phys.net/14/13773/2014/ J.-E. Petit et al.: Submicron aerosol source apportionment of wintertime pollution 13777 Table 1. Limits of detection (in µg m−3 ) and relative uncertainties (in %) for each species used in the second PMF analysis. LOD (µg m−3 ) u (%) HOA BBOA OOA NO3 SO4 NH4 Cl K BCwb BCff 0.1 30 0.1 30 0.1 30 0.12 15 0.28 15 0.51 15 0.1 20 0.02 50 0.1 40 0.1 40 software v3.0 (http://www.epa.gov/heasd/research/pmf.html, Norris et al., 2008). Based on the ME-2, this model has been extensively used for source apportionment from off-line measurements (Viana et al., 2008). Two approaches are available in the EPA software to put into the uncertainty matrix; one can either put in a predetermined uncertainty matrix, or only limits of detection (LOD) and relative uncertainties (u in %) for each variable, where the final uncertainty Uij for the ith species at j row is eventually calculated following (Polissar et al., 1998) (Eq. 4): 5 · LODi 6 q Uij = u2 · C 2 + LOD2 i j i if Cj ≤ LODi (4) if Cj > LODi Uncertainties of the concentrations of ACSM inorganic species from mass spectra were largely underestimated in the version of the ACSM analysis package used here, resulting in signal-to-noise ratios (S/N) which were too high for use in PMF analysis (Paatero and Hopke, 2003). Therefore, they were eventually obtained using the Polissar approach (Eq. 4). Moreover, the use of a single methodology for uncertainty calculations has the advantage to lead to a homogeneous error matrix. LODs for the inorganic species were calculated as 3 times the standard deviation calculated during a 3 day period, where a total filter was inserted at the ACSM inlet (Table 1). For OA PMF outputs, bootstrapping is an efficient tool to estimate uncertainties of their chemical profiles. Nevertheless, the distribution of factor time series from a bootstrap analysis is not currently available. Alternatively, LODs and relative uncertainties of OA factors were empirically determined in order to give enough weight to organic matter in the second PMF analysis. When applying the law of propagation of errors to concentration and error matrices, the median and average OA uncertainties are about 12 and 18 %, respectively. Then, assuming that prior PMF analysis should add additional errors, the relative uncertainties of OA factors were set to 30 %. Similarly, for BCwb and BCff , a relative uncertainty of 40 % was used as an extended uncertainty applied to the 20 % error of BC concentrations due to the Weingartner correction (Favez et al., 2009). Finally, a relative uncertainty of 50 % was set for potassium because major measurement artifacts with C3 H+ 3 fragment may occur (Ji et al., 2010) but are hardly quantifiable using unit-mass resolution ACSM data. The “weight” of a given variable in PMF analysis can be related to the relative uncertainty used through the Polissar approach. Too low, the considered variable may www.atmos-chem-phys.net/14/13773/2014/ be explained by only one factor; too high, an unspecific distribution of this species in all factor profiles is likely to occur. An investigation of the impacts of uncertainty changes is described in Sect. E in the Supplement. Results of these sensitivity tests are supporting the validity of values initially chosen. EPA PMF v3.0 also allows the empirical implementation of additional uncertainties following signal-to-noise ratios (Paatero and Hopke, 2003). Usually, species with a S/N ratio below 0.2, between 0.2 and 2, or greater than 2 are respectively considered as “bad”, “weak”, or “strong”. “Bad” variables are excluded from the data set; “weak” variables get their uncertainties tripled, while uncertainties of “strong” variables stay unchanged. In the present study, all variables were considered as “strong”, except for chloride and potassium, set as “weak” as they exhibit low S/N ratios and are not specific tracers of a given emission source. 2.3 Non-parametric Wind Regression analysis In an attempt to assign a geographical origin to the main sources of submicron aerosols and to perform a crossvalidation of these results, a non-parametric wind regression analysis (NWR) was performed on PMF2 outputs. Developed by Henry et al. (2009), the NWR is a source-to-receptor model using kernel smoothing methods to estimate the average concentration of a pollutant given wind directions and wind speeds. The objective of NWR is thus to calculate E (θ | ϑ), the smoothed concentration field of the pollutant given any predictor variable coordinates (θ , ϑ) representing wind direction and wind speed (Eq. 5). PN ϑ−Yi θ −Wi · K · Ci K 2 i=1 1 σ h (5) E (θ | ϑ) = P N θ−Wi i · K2 ϑ−Y i=1 K1 σ h where Ci , Wi and Yi are the measured concentration, wind direction and wind speed at ti ; σ and h, the smoothing parameters; and K1 and K2 the two kernel functions defined as follows: 1 2 K1 (x) = √ · e−0.5·x , −∞ < x < ∞ 2π (6) K2 (x) = 0.75 · 1 − x 2 , −1 < x < 1 = 0 (7) Smoothing parameters σ and h can be calculated using Gaussian distribution equations (Full Width at Half Maximum), Atmos. Chem. Phys., 14, 13773–13787, 2014 2 3 4 5 13778 Figure 1. Meteorological parameters (ambient temperature, pressure, wind speed and direction); fossil fuel and wood burning fraction of black carbon measured by an Aethalometer; and Aerosol mass concentration of organics, nitrate, sulfate, ammonium and chloride measured by ACSM (note different scales). 6 J.-E. Petit et al.: Submicron aerosol source apportionment of wintertime pollution 7 a) b) −3 ) (b) Average PM chemical 8 PM Figure 2. a) Mean PM1 chemical over the 2012 late PM winter period (average Figure 2. (a) Mean composition over the composition 2012 late winter period (average µg m 1 chemical 1 = 21.7 1 3 3 −3 composition (in µg ) 1and ambient temperature overPM several periods.composition (in µg/m ) and ambient temperature 9 m PM = 21.7 µg/m ) b) Average 1 chemical 10 over several periods. but their empirical determination leads to similar results, 11 since reasonable variations from their theoretical values do not change the final interpretation. Meteorological data used for NWR were obtained from continuous 1 min measurements carried out on the campus of the Polytechnic School (Ecole Polytechnique) (4 km east of the measurement site) with an A100R Campbell Scientific anemometer and a W200P Campbell Scientific weather vane at 25 m above ground level (a.g.l.), above any impediment (e.g., trees or buildings) that could affect the measurement of a particular wind sector. 3 3.1 Results and discussion Temporal trends of aerosol chemical composition During the late 2012 winter, average PM1 chemical composition (Fig. 2a) was clearly dominated by organic matter and secondary inorganic salts (mostly ammonium nitrate), which is fully consistent with the wintertime PM2.5 chemical composition reported by Bressi et al. (2013) for the Paris region. Three distinct periods (I, II and III) were considered here (Fig. 2a and b). The first period, from 30 January to 19 February is characterized by high concentrations of organic matter and BCwb (44 and 5.5 % of PM1 on average, respectively), low temperatures (−1.9 ◦ C on average, and below 0 ◦ C all day long during the second third of the period) and wind originating essentially from the NNW–NNE sector. A very intense organic peak is observed on the 5 February, and reaches maximum concentration (of about 70 µg m−3 ) at 23:00 UTC. Along with high organic loading, a significant amount of BCwb is also observed during that period, suggesting an intense wood burning emission episode. In addition, combined with low temperatures (below 0 ◦ C), which increase domestic heating emissions, low wind speeds enable the accumulation of local pollutants within the boundary layer, exacerbating measured concentrations. The influence of this intense Atmos. Chem. Phys., 14, 13773–13787, 2014 episode to the results of the PMF2 analysis is investigated in Sect. F in the Supplement. The second period, from 19 February to 10 March, exhibits lower PM concentrations (15 µg m−3 on average), 25 higher ambient temperatures and lower atmospheric pressure. Minor BCwb and BCff peaks are observed (e.g., on 20, 27, 29 February) and associated with low wind speeds from the N–NNE sector, suggesting an influence of (local) combustion sources from Paris city. The third period, from 10 to 26 March , is characterized by the highest temperatures and daily temperature amplitudes (maximum of 15 ◦ C in 1 day) along with dynamic winds blowing from all directions with an SW–NE axis. Also, higher PM concentrations with a significantly enhanced role of ammonium nitrate are observed, whose temporality (fast diurnal increases and decreases) is related to its gas-particle partitioning. 3.2 Preliminary OA source apportionment As explained above, the first step of the PMF2 analysis was conducted using SoFi constraining both HOA and primary BBOA (pBBOA) factor profiles which remain difficult to differentiate (Lanz et al., 2007). This constrained analysis was carried out with a value of 0.05 and 0.1 for HOA and pBBOA reference profiles, respectively, and remaining factors staying unconstrained. The three-factor solution (designated to HOA, p-BBOA and OOA) presented in Fig. 3 gave most satisfactory results. As presented in Sect. B in the Supplement, any higher number of factors led to unstable solutions. Outputs from constrained analysis were largely consistent with preliminary unconstrained PMF outputs (Sect. C in the Supplement) and ranging a values from 0.05 to 0.80 for HOA and/or pBBOA reference profiles within the constrained analysis also exhibits quite stable solutions (Sect. D in the Supplement). It is also to note that COA could not be clearly deconvolved in this study, although it has been identified with previous AMS measurements at SIRTA by Crippa www.atmos-chem-phys.net/14/13773/2014/ J.-E. Petit et al.: Submicron aerosol source apportionment of wintertime pollution 13779 1 1 2 Figure 3. Factor profiles and timeseries of the 3-factor solution from the OA constrained PMF Figure 3. Factor 2 profiles and time series profiles of the three-factor solution the OA constrained PMFthe analysis. Figure 3. Factor and timeseries of3 from theanalysis. 3-factor solution from OA constrained PMF 3 analysis. 4 et al. (2013a), 4 essentially due to lower sensitivity and narrower m/z scan range from ACSM measurements. Based on the ME-2 outputs, OOA represents up to 78 % of the average organic mass (Fig. 4a), in good agreement with worldwide and European OOA high proportions (Zhang et al., 2007; Lanz et al., 2010). The contributions of HOA and pBBOA were 9.9 and 12.3 %, respectively, on average, which is consistent with results obtained for Paris urban background conditions during winter 2009 (10–15 % for each factors) by applying PMF analysis to AMS organic mass spectra (Crippa et al., 2013a). As expected, diurnal variations obtained for the three factors (Fig. 4b) indicate predominant nighttime contributions for pBBOA and OOA (mainly due to the subsidence a) b) of the boundary layer height and the condensation of semi- 5 volatile material in the particulate phase at low temperatures) 6 Figure 4. a) Mean contribution to OM (in %) of the three organic factors b) diurnal mean Figure 4. (a) Mean contribution to organic matter (OM) (in %) and increases of HOA during traffic peaks. These diurnal pro- 7 concentrations of the three organic factors. of the three organic factors (b) diurnal mean concentrations of the files are also in good agreement with those obtained using three organic factors. 8 AMS–PMF during wintertime in the region of Paris (Crippa et al., 2013a). We thus conclude that outputs chosen for the 5 a) b) present source apportionment are representative of those typically obtained 6 fromFigure AMS (or analysis. 4. a)ACSM)–PMF Mean contribution to OM (in %) of the three organic factors b) diurnal mean a second PMF analysis could allow for the apportionment of Conceptually7 speaking and applied to OA mass spectra, concentrations of the three organic factors. the main submicron aerosol sources and processes. this model gathers m/z fragments into factors regarding the Nevertheless, as PMF model doesn’t necessarily reconchemical structures of parent organic molecules (hydrocar8 struct the input data perfectly: residuals could then still conbons, carboxylic acids, aromatics, ketones etc.) as well as tain some pieces of information, and could increase the untheir temporality, and thus does not lead to direct informacertainty of the outputs, potentially leading to erroneous retion of pollution sources. The organic chemical composition 26 of key sults from a subsequent PMF analysis. Here, residuals of aerosol pollution sources may indeed not be limited to one variables (m/z 43, 44, 55, 57 and 60) all follow an unimodal kind of molecular structure. Here, the high temporal corre2 Gaussian distribution centered at zero (Fig. 5a). Moreover, lation between pBBOA and HOA (r = 0.85 for the whole the sum of all organic m/z (row-wise) was compared to the campaign, but down to 0.55 when discarding the intense losum of OA factors (HOA, BBOA and OOA). The regression cal wood smoke event on 6 February) contrasts with the poor 2 (Fig. 5b) shows a slope very close to 1 (1.01) and a very satcorrelation between BCwb and BCff (r = 0.09), and thus isfactory r 2 (> 0.99). This highlights the fact that (i) Q and could suggest a common source of pBBOA and HOA. In this residuals were satisfactorily minimized; (ii) no significant inrespect, combining the obtained OA factors with inorganic formation remain unaccounted from this OA PMF analysis; species and specific combustion tracers (BC constituents) in (iii) in our case, residuals from this OA PMF analysis as it www.atmos-chem-phys.net/14/13773/2014/ Atmos. Chem. Phys., 14, 13773–13787, 2014 26 13780 J.-E. Petit et al.: Submicron aerosol source apportionment of wintertime pollution 1 a) b) Figure 5. (a) of m/z 44, 43, 55, of 57 m/z and 60 Scatter plot of 60 measured OM plot (sumof ofmeasured all m/z, row-wise) 2 Residuals Figure distributions 5. a) Residuals distributions 44,(b) 43, 55, 57 and b) Scatter OM and calculated OM (sum of HOA + BBOA + OOA). 3 (sum of all m/z, row-wise) and calculated OM (sum of HOA + BBOA + OOA). 4 that the majority of biomass burning POA is semi-volatile and emphasizing the role of fast SOA formation processes from intermediate VOCs. However, the OOA found in this 3.3 PM1 source apportionment and geographical profile should not be representative of the whole diversity of origins wood-burning related SOA, since its formation may occur over various timescales. PM1 source apportionment (i.e., the second step of the PMF2 The average OMwb -to-BCwb ratio calculated here is 10.3 methodology) was carried out using US EPA PMF v3.0 in or(where OMwb equals the sum of the concentration of der to allow bootstrap analyses (this option being unavailable the three organic constituents in the wood-burning factor). so far using SoFi v4.5). The optimal number of factors was When assuming that OOA in this factor is only secondary, determined using atmospheric relevance of factor profiles the OMwb_primary -to-BCwb ratio decreases to 4.7 (where and then bootstrap analysis. The four-factor solution feaOMwb_primary = OMwb − OOAwb ). Part of wood burning tured the most stable and realistic results with very satisOOA could be considered as primary (Weimer et al., 2008; factory bootstrap analysis (Table 2), and was used to idenGrieshop et al., 2009; Heringa et al., 2011) but its apportiontify two factors corresponding to distinct pollution sources, ment remains very challenging due to the lack of identificabiomass and fossil fuel combustion; and two factors reltion of specific secondary organic tracers. 5 ative to secondary material characterized by one of their Using the PMF2 methodology introduced here, the averphysical properties, semi-volatile and low-volatile secondary age contribution of the wood burning source to total OA is 6 Figure 6. Factor profiles and timeseries for the 4-factor solution of the global PM1 source aerosols. Factor profiles and time series are presented in found to be of about 35 % during the present study. This conFig. 6. 7 apportionment analysis. Note the different scales. tribution is very consistent with the one obtained for Paris urban background conditions during winter 2009 (about 30 %) 8 3.3.1 Wood-burning factor when applying PMF analysis to combined AMS and PTRMS (proton-transfer reaction mass spectrometer) organic The wood-burning factor includes significant contributions mass spectra (Crippa et al., 2013a). Indeed, the use of adfrom pBBOA, HOA, and OOA. For pBBOA and BCwb , reditional tracers (VOCs or BCwb and BCff ) leads to a betspectively, 90 and 85 % of the total mean concentration fall ter characterization of wood burning emissions, especially within the wood-burning factor. This factor also accounts for by taking into account secondary related 27 organic material 30 % of total HOA (Fig. 9), which is in accordance with the (Fig. 10). The wood burning factor contributes up to 17 % to fact that HOA concentrations were found to be present within the PM1 mass on average (Fig. 7b), but significant sporadic wood burning emissions of combustion processes (DeCarlo episodes are noticeable, especially on 2 and 12 February, riset al., 2010; Poulain et al., 2011). The very high concentraing to 66 and 38 % of PM1 , respectively. Wind regression tion of OOA in this factor suggests that the secondary organic (Fig. 8) highlights clear local emissions with high concenmaterial is associated with wood burning, possibly origitrations linked to low wind speeds (below 5 km h−1 ), undernating from condensation of VOCs and atmospheric ageing lining the significance of local wood burning emissions to (SOA and OPOA formation, respectively). This is consistent wintertime pollution events. with recent laboratory studies (May et al., 2013) showing has been performed would have little weight in the subsequent PMF calculation. Atmos. Chem. Phys., 14, 13773–13787, 2014 www.atmos-chem-phys.net/14/13773/2014/ J.-E. Petit et al.: Submicron aerosol source apportionment of wintertime pollution 13781 Table 2. Bootstrap mapping of the four-factor solution from the global PM1 source apportionment analysis. 1 2 3 % of bootstrap mapping Base SV-SA a) Base wood burning Base LV-SA Base traffic b) Boot SV-SA 100 0 0 0 Boot wood burning 0 44, 43, 100 Figure 5. a) Residuals distributions of m/z 55, 57 and 60 b) 0Scatter plot of0 measured OM LV-SA 0 OM (sum 0of HOA + BBOA 100 + OOA). 0 (sum ofBoot all m/z, row-wise) and calculated Boot traffic 0 0 0 100 4 5 Figure 6. Factor 6 profiles and 6. time seriesprofiles for the and four-factor solution of 4-factor the globalsolution PM1 source analysis. Note the different Figure Factor timeseries for the of theapportionment global PM1 source scales. 7 apportionment analysis. Note the different scales. 3.3.2 8 Fossil fuel combustion factor A fossil fuel combustion factor was identified accounting for, on average, 11 % of the total PM1 mass (Fig. 6b). This factor includes strong contributions from HOA and BCff concentrations (60 and 80 %, respectively) (Fig. 6). The predominance of traffic emissions within this factor is highlighted by its diurnal variation, in phase with traffic peaks (Fig. 7a). Another striking feature is that OOA represents about half of OA in this profile (Fig. 9). While primary traffic emissions of OOA are unlikely to be predominant, fast oxidation and condensation processes (Chirico et al., 2011; Carbone et al., 2013) could explain the high concentrations of OOA in this factor. The OMff -to-BCff ratio of 1.15 found here is very consistent with the ratio of 1.05 obtained from measurements carried out in September 2012 in a highway tunnel near Paris (Petit et al., unpublished data), although tunnel measurements can be impacted by gas-particle partitioning (Chirico et al., 2010, 2011). Despite challenging uncertainties of these results, these two features particularly highlight the presence of secondary organic material from traffic emissions in ambient measurements. Ammonium and nitrate in this factor (in stoichiometric proportion) suggest condensation of these species with mobile emissions, as previously highlighted in the region of Paris by Healy et al. (2013). www.atmos-chem-phys.net/14/13773/2014/ Wind regression shows clear local emissions (high concentrations at low wind speed), and additionally a diffuse concentration field from the directions between the North and the East. This suggests the transport of traffic carbonaceous emissions with ammonium nitrate or its gaseous precursor (NH3 , HNO3 /NOx ) over the Ile-de-France region 27 (the influence of Paris city emissions cannot be highlighted with this method) (Fig. 8). 3.3.3 Semi-volatile secondary aerosol The semi-volatile secondary aerosol factor is characterized by a large contribution from (semi-volatile) ammonium nitrate and, to a lesser extent, of OOA (76 and 23 % of mass in factor, respectively) (Fig. 6). This factor is found to represent about 57 % of PM1 (Fig. 7b). The nitrate appears to be fully neutralized by ammonium (only 2 % of cation excess). Temporal variations show a clear diurnal pattern (Fig. 7a), with a decrease of concentrations during the afternoon linked to the gas-phase partitioning of condensed semi-volatile material following ambient temperature variations. Since atmospheric (trans)formation pathways of secondary organic and inorganic aerosols are different, no thorough assessments can be undertaken to link the amount of OOA in this factor profile to a specific atmospheric process or source; here the OOA should only be characterized as mainly semi-volatile. Atmos. Chem. Phys., 14, 13773–13787, 2014 13782 J.-E. Petit et al.: Submicron aerosol source apportionment of wintertime pollution a) 1 1 2 3 b) Figure 7. a) Diurnal mean concentrations of the four factors b) Mean contribution to PM1 (in %) a) b) of the four factors. Figure 7. (a) Diurnal mean concentrations of the four factors (b) Mean contribution to PM1 (in contribution %) of the four factors. 2 Figure to PM1 4 7. a) Diurnal mean concentrations of the four factors b) Mean 3 (in %) of the four factors. 4 5 Figure 8. Non-parametric wind regression normalized concentrations of the four factors, and the associated wind rose. Tangential and radial 6 direction Figure 8.and Non-parametric Wind Regression normalized concentrations of the four factors, and the axes represent wind speed (in km h−1 ), respectively. 7 associated wind rose. Tangential and radial axes represent wind direction and speed (in km/h), 8 respectively. The NWR for this factor exhibits two distinct hot spots in 3.3.4 Low-volatility secondary aerosol −1 , the N and NNE wind sector at wind speeds above 10 km h 5 as well as a diffuse signal between the aforementioned wind The last identified factor is assigned as low-volatility secsectors, highlighting probable trans-boundary transport from ondary aerosol and accounts for 15factors, % of the total 28 thePM1 on 6 Figure 8. Non-parametric Wind Regression normalized concentrations of the four and highly industrialized regions upwind of the region of Paris average. This factor contains most of the sulfate 7 associated wind rose. Tangential and radial axes represent wind direction and speed (in km/h), as well as (Belgium, the Netherlands and western Germany) (Fig. 8). significant amounts of ammonium, OOA, and some nitrate. 8 result respectively. This is in accordance with (i) the European concentraIt also includes half of total non-refractory chloride, suggesttion distribution of nitrogen oxides, nitric acid and ammonia, ing secondary aerosols from industrial emissions. Moreover, reported by Pay et al. (2012); (ii) previous PMF analysis the presence of primary aerosols in the factor profile, espeidentifying an ammonium nitrate rich factor in this region cially BCff , suggests that part of BCff is internally mixed with of France (Waked et al., 2014; Bressi et al., 2014); and (iii) secondary organic aerosols and sulfates. 28 the Lenschow methodology (Lenschow et al., 2001) applied The diurnal cycle shows a rather flat pattern, as less in Paris (Ghersi et al., 2012). volatile oxidized aerosols do not evaporate at ambient temAtmos. Chem. Phys., 14, 13773–13787, 2014 www.atmos-chem-phys.net/14/13773/2014/ J.-E. Petit et al.: Submicron aerosol source apportionment of wintertime pollution 13783 1 2 3 4 Figure Mean factor contributions %)double of thePMF double PMF Figure 9.9. Mean factor contributions (in %) (in of the analysis to analHOA, OOA,Figure pBBOA,10. Comparison of source apportionment studies in Paris, 2+ − 2− + − , BC France. NO3-,to SOHOA, , Cl-, BC 4 , NH4OOA, wb and BC ff , SO , NH , Cl and ysis pBBOA, NO wb 3 4 4 BCff . peratures (by definition) (Fig. 7a). Wind regression allows the identification of a very specific hot spot located in the NE wind sector at wind speeds above 20 km h−1 (Fig. 8). At lower wind speeds, a diffuse but significant signal appears in NW wind sector. These two sectors are well known to contribute to sulfur dioxide emissions through (i) a dense network of petrochemical cracking facilities, and (ii) intense shipping traffic in the English Channel (Pay et al., 2012; Waked et al., 2014; Bressi et al., 2014). Long-range transport is also consistent with a low degree of diurnal variation. As for the semi-volatile secondary aerosol factor, it should be noted that it is not expected that organic and inorganic species exhibit constant ratio during time. This kind of approximation is however inherent to PMF analysis, even if a better separation of the different type of inorganic/organic aerosols may be achieved through the use of high-resolution mass spectrometry and/or specific organic and elemental tracers (which were not available here). 4 Conclusions We are using here a novel methodology to perform the source apportionment of PM1 highly time-resolved data. This method has been applied to wintertime pollution in the Paris region from early February to late March 2012. First, high time resolution organic aerosol concentrations were measured by ACSM and statistically analyzed by PMF in order to investigate sources and transformation processes of OA. This OA source apportionment led to the identification of three factors that are commonly observed in industrialized regions during winter (HOA, pBBOA and OOA). However, the two combustion OA factors (HOA and pBBOA) seem to share a common source as suggested by the simultaneous www.atmos-chem-phys.net/14/13773/2014/ correlation of HOA with BCwb and BCff . Instead of only documenting poor or satisfactory correlations between OA factors and external tracers, co-variations were more thoroughly investigated through a second factorization analysis step. This second PMF analysis, including OA factors, inorganic species and BC fractions (BCff and BCwb ) were then achieved to investigate major sources of submicron aerosols, leading to a considerably improved characterization of local and regional signal combustion sources. Wood burning was found to significantly contribute to HOA and OOA, characterizing primary and secondary related wood burning contributions in a single source specific factor. Therefore, pBBOA remains a specific tracer of biomass burning, but does not fully represent the total contribution to the mass of this 29 source. HOA, commonly used as a tracer of traffic, is found here to also originate from wintertime local wood burning emissions. Moreover, OOA is found to significantly contribute to the traffic organic mass. Nevertheless, as for OOA present in the wood-burning factor, this may not be representative of the whole diversity of traffic related SOA, since its formation could occur over various time-scales. The robustness of the methodology used here has been investigated through various sensitivity tests. First of all, the validity of the preliminary unconstrained PMF analysis leading to OA factors has been checked against a recently proposed constrained analysis. For the latter one, a values chosen for p-BBOA and HOA reference profiles have been carefully investigated. It appeared that a wide range of a values (from 0.05 to 0.8) led to similar results, in terms of timeseries’ slopes (0.7–1.1) and correlation coefficients (> 0.98). Then, the determination of the relative uncertainties of OA factors and BC fractions used in the second PMF analysis has been cross-validated. While BC uncertainties do not significantly change final results, a 30–40 % uncertainty range Atmos. Chem. Phys., 14, 13773–13787, 2014 13784 J.-E. Petit et al.: Submicron aerosol source apportionment of wintertime pollution for OA factors also lead to similar results. Finally, bootstrap analysis on PMF2 outputs showed very satisfying results for the four-factor solution, whereas the adding of a fifth factor leads to unstable solutions. To our knowledge, this is the first time that two consecutive PMF analyses have been performed in order to optimize the characterization of PM1 pollution sources. This methodology is especially efficient when characterizing the mass of wintertime PM1 pollution sources in urban areas and helped to strengthen the bonds between OA factors and pollution sources. It shares the same goal than other innovative approaches including inorganic compounds, as recently proposed for measurements obtained using high resolution AMS (Sun et al., 2012; Crippa et al., 2013b; McGuire et al., 2014). It also allows distributing OA factors usually obtained from PMF analysis applied to organic mass spectra to more specific PM1 sources. Furthermore, similarly to the methodology proposed by Crippa et al. (2013a) for AMS and PTR-MS data sets, such an approach may offer various interesting possibilities for future analyses, such as the inclusion of on-line measurements of metals to apportion specific sources (e.g., shipping, petrochemical facilities, smelters) or size distribution information to identify and/or characterize transformation processes. The Supplement related to this article is available online at doi:10.5194/acp-14-13773-2014-supplement. Acknowledgements. The research leading to the these results has received funding from INERIS, the European Union Seventh Framework Program (FP7/2007-2013) project ACTRIS under grant agreement no. 262254, the DIM-R2DS program for the funding of the ACSM equipment, the PRIMEQUAL PREQUALIF program for long-term observations of Black Carbon. Edited by: N. Mihalopoulos References Adler, G., Flores, J. M., Abo Riziq, A., Borrmann, S., and Rudich, Y.: Chemical, physical, and optical evolution of biomass burning aerosols: a case study, Atmos. Chem. Phys., 11, 1491–1503, doi:10.5194/acp-11-1491-2011, 2011. Aiken, A. C., Salcedo, D., Cubison, M. J., Huffman, J. A., DeCarlo, P. F., Ulbrich, I. M., Docherty, K. S., Sueper, D., Kimmel, J. R., Worsnop, D. R., Trimborn, A., Northway, M., Stone, E. A., Schauer, J. J., Volkamer, R. M., Fortner, E., de Foy, B., Wang, J., Laskin, A., Shutthanandan, V., Zheng, J., Zhang, R., Gaffney, J., Marley, N. A., Paredes-Miranda, G., Arnott, W. P., Molina, L. T., Sosa, G., and Jimenez, J. L.: Mexico City aerosol analysis during MILAGRO using high resolution aerosol mass spectrometry at the urban supersite (T0) – Part 1: Fine particle composi- Atmos. Chem. Phys., 14, 13773–13787, 2014 tion and organic source apportionment, Atmos. Chem. Phys., 9, 6633–6653, doi:10.5194/acp-9-6633-2009, 2009. Allan, J. D., Williams, P. I., Morgan, W. T., Martin, C. L., Flynn, M. J., Lee, J., Nemitz, E., Phillips, G. J., Gallagher, M. W., and Coe, H.: Contributions from transport, solid fuel burning and cooking to primary organic aerosols in two UK cities, Atmos. Chem. Phys., 10, 647–668, doi:10.5194/acp-10-647-2010, 2010. Bressi, M., Sciare, J., Ghersi, V., Bonnaire, N., Nicolas, J. B., Petit, J.-E., Moukhtar, S., Rosso, A., Mihalopoulos, N., and Féron, A.: A one-year comprehensive chemical characterisation of fine aerosol (PM2.5 ) at urban, suburban and rural background sites in the region of Paris (France), Atmos. Chem. Phys., 13, 7825– 7844, doi:10.5194/acp-13-7825-2013, 2013. Bressi, M., Sciare, J., Ghersi, V., Mihalopoulos, N., Petit, J.-E., Nicolas, J. B., Moukhtar, S., Rosso, A., Féron, A., Bonnaire, N., Poulakis, E., and Theodosi, C.: Sources and geographical origins of fine aerosols in Paris (France), Atmos. Chem. Phys., 14, 8813–8839, doi:10.5194/acp-14-8813-2014, 2014. Budisulistiorini, S. H., Canagaratna, M. R., Croteau, P. L., Baumann, K., Edgerton, E. S., Kollman, M. S., Ng, N. L., Verma, V., Shaw, S. L., Knipping, E. M., Worsnop, D. R., Jayne, J. T., Weber, R.J., and Surratt, J. D.: Intercomparison of an Aerosol Chemical Speciation Monitor (ACSM) with ambient fine aerosol measurements in downtown Atlanta, Georgia, Atmos. Meas. Tech., 7, 1929–1941, doi:10.5194/amt-7-1929-2014, 2014. Canonaco, F., Crippa, M., Slowik, J. G., Baltensperger, U., and Prévôt, A. S. H.: SoFi, an IGOR-based interface for the efficient use of the generalized multilinear engine (ME-2) for the source apportionment: ME-2 application to aerosol mass spectrometer data, Atmos. Meas. Tech., 6, 3649–3661, doi:10.5194/amt6-3649-2013, 2013. Carbone, S., Saarikoski, S., Frey, A., Reyes, F., Reyes, P., Castillo, M., Gramsch, E., Oyola, P., Jayne, J. T., Worsnop, D. R., and Hillamo, R.: Chemical Characterization of Submicron Aerosol Particles in Santiago de Chile, Aerosol Air Qual. Res., 13, 462– 473, doi:10.4209/aaqr.2012.10.0261, 2013. Chirico, R., DeCarlo, P. F., Heringa, M. F., Tritscher, T., Richter, R., Prévôt, A. S. H., Dommen, J., Weingartner, E., Wehrle, G., Gysel, M., Laborde, M., and Baltensperger, U.: Impact of aftertreatment devices on primary emissions and secondary organic aerosol formation potential from in-use diesel vehicles: results from smog chamber experiments, Atmos. Chem. Phys., 10, 11545–11563, doi:10.5194/acp-10-11545-2010, 2010. Chirico, R., Prévôt, A. S. H., DeCarlo, P. F., Heringa, M. F., Richter, R., Weingartner, E., and Baltensperger, U.: Aerosol and trace gas vehicle emission factors measured in a tunnel using an Aerosol Mass Spectrometer and other on-line instrumentation, Atmos. Environ., 45, 2182–2192, doi:10.1016/j.atmosenv.2011.01.069, 2011. Collaud Coen, M., Weingartner, E., Apituley, A., Ceburnis, D., Fierz-Schmidhauser, R., Flentje, H., Henzing, J. S., Jennings, S. G., Moerman, M., Petzold, A., Schmid, O., and Baltensperger, U.: Minimizing light absorption measurement artifacts of the Aethalometer: evaluation of five correction algorithms, Atmos. Meas. Tech., 3, 457–474, doi:10.5194/amt-3-457-2010, 2010. Crippa, M., Canonaco, F., Slowik, J. G., El Haddad, I., DeCarlo, P. F., Mohr, C., Heringa, M. F., Chirico, R., Marchand, N., Temime-Roussel, B., Abidi, E., Poulain, L., Wiedensohler, A., Baltensperger, U., and Prévôt, A. S. H.: Primary and sec- www.atmos-chem-phys.net/14/13773/2014/ J.-E. Petit et al.: Submicron aerosol source apportionment of wintertime pollution ondary organic aerosol origin by combined gas-particle phase source apportionment, Atmos. Chem. Phys., 13, 8411–8426, doi:10.5194/acp-13-8411-2013, 2013a. Crippa, M., El Haddad, I., Slowik, J. G., DeCarlo, P. F., Mohr, C., Heringa, M. F., Chirico, R., Marchand, N., Sciare, J., Baltensperger, U., and Prévôt, A. S. H.: Identification of marine and continental aerosol sources in Paris using high resolution aerosol mass spectrometry, J. Geophys. Res.-Atmos., 118, 1950–1963, doi:10.1002/jgrd.50151, 2013b. Crippa, M., Canonaco, F., Lanz, V. A., Äijälä, M., Allan, J. D., Carbone, S., Capes, G., Ceburnis, D., Dall’Osto, M., Day, D. A., DeCarlo, P. F., Ehn, M., Eriksson, A., Freney, E., Hildebrandt Ruiz, L., Hillamo, R., Jimenez, J. L., Junninen, H., Kiendler-Scharr, A., Kortelainen, A.-M., Kulmala, M., Laaksonen, A., Mensah, A. A., Mohr, C., Nemitz, E., O’Dowd, C., Ovadnevaite, J., Pandis, S. N., Petäjä, T., Poulain, L., Saarikoski, S., Sellegri, K., Swietlicki, E., Tiitta, P., Worsnop, D. R., Baltensperger, U., and Prévôt, A. S. H.: Organic aerosol components derived from 25 AMS data sets across Europe using a consistent ME-2 based source apportionment approach, Atmos. Chem. Phys., 14, 6159– 6176, doi:10.5194/acp-14-6159-2014, 2014. DeCarlo, P. F., Ulbrich, I. M., Crounse, J., de Foy, B., Dunlea, E. J., Aiken, A. C., Knapp, D., Weinheimer, A. J., Campos, T., Wennberg, P. O., and Jimenez, J. L.: Investigation of the sources and processing of organic aerosol over the Central Mexican Plateau from aircraft measurements during MILAGRO, Atmos. Chem. Phys., 10, 5257–5280, doi:10.5194/acp-10-52572010, 2010. Favez, O., Cachier, H., Sciare, J., Sarda-estève, R., and Martinon, L.: Evidence for a significant contribution of wood burning aerosols to PM2.5 during the winter season in Paris, France, Atmos. Environ., 43, 3640–3644, 2009. Favez, O., El Haddad, I., Piot, C., Boréave, A., Abidi, E., Marchand, N., Jaffrezo, J.-L., Besombes, J.-L., Personnaz, M.-B., Sciare, J., Wortham, H., George, C., and D’Anna, B.: Inter-comparison of source apportionment models for the estimation of wood burning aerosols during wintertime in an Alpine city (Grenoble, France), Atmos. Chem. Phys., 10, 5295–5314, doi:10.5194/acp-10-52952010, 2010. Favez, O., Petit, J.-E., Bessagnet, B., Meleux, F., Chiappini, L., Lemeur, S., Labartette, C., Chappaz, C., Guergnion, P.-Y., Saison, J.-Y., Chretien, E., Pallares, C., Verlhac, S., Aujay, R., Malherbe, L., Beauchamp, M., Piot, C., Jaffrezo, J.-L., Besombes, J.-L., Sciare, J., Rouïl, L., and Leoz-Garziandia, E.: Main properties and origines of winter PM10 pollution events in France, Pollut. Atmospherique, November 2012 special issue, 163–182, 2012. Freutel, F., Schneider, J., Drewnick, F., von der Weiden-Reinmüller, S.-L., Crippa, M., Prévôt, A. S. H., Baltensperger, U., Poulain, L., Wiedensohler, A., Sciare, J., Sarda-Estève, R., Burkhart, J. F., Eckhardt, S., Stohl, A., Gros, V., Colomb, A., Michoud, V., Doussin, J. F., Borbon, A., Haeffelin, M., Morille, Y., Beekmann, M., and Borrmann, S.: Aerosol particle measurements at three stationary sites in the megacity of Paris during summer 2009: meteorology and air mass origin dominate aerosol particle composition and size distribution, Atmos. Chem. Phys., 13, 933–959, doi:10.5194/acp-13-933-2013, 2013. Ghersi, V., Rosso, A., Moukhtar, S., Léger, K., Sciare, J., Bressi, M., Nicolas, J., Féron, A., and Bonnaire, N.: Origine des particules www.atmos-chem-phys.net/14/13773/2014/ 13785 fines (PM2.5 ) en Ile-de-France, Pollut. Atmospherique, November 2012 special issue, p. 189, 2012. Grieshop, A. P., Logue, J. M., Donahue, N. M., and Robinson, A. L.: Laboratory investigation of photochemical oxidation of organic aerosol from wood fires 1: measurement and simulation of organic aerosol evolution, Atmos. Chem. Phys., 9, 1263–1277, doi:10.5194/acp-9-1263-2009, 2009. Haeffelin, M., Barthès, L., Bock, O., Boitel, C., Bony, S., Bouniol, D., Chepfer, H., Chiriaco, M., Cuesta, J., Delanoë, J., Drobinski, P., Dufresne, J.-L., Flamant, C., Grall, M., Hodzic, A., Hourdin, F., Lapouge, F., Lemaître, Y., Mathieu, A., Morille, Y., Naud, C., Noël, V., O’Hirok, W., Pelon, J., Pietras, C., Protat, A., Romand, B., Scialom, G., and Vautard, R.: SIRTA, a ground-based atmospheric observatory for cloud and aerosol research, Ann. Geophys., 23, 253–275, doi:10.5194/angeo-23-253-2005, 2005. Haywood, J. and Boucher, O.: Estimates of the direct and indirect radiative forcing due to tropospheric aerosols: A review, Rev. Geophys., 38, 513–543, 2000. Healy, R. M., Sciare, J., Poulain, L., Kamili, K., Merkel, M., Müller, T., Wiedensohler, A., Eckhardt, S., Stohl, A., Sarda-Estève, R., McGillicuddy, E., O’Connor, I. P., Sodeau, J. R., and Wenger, J. C.: Sources and mixing state of size-resolved elemental carbon particles in a European megacity: Paris, Atmos. Chem. Phys., 12, 1681–1700, doi:10.5194/acp-12-1681-2012, 2012. Healy, R. M., Sciare, J., Poulain, L., Crippa, M., Wiedensohler, A., Prévôt, A. S. H., Baltensperger, U., Sarda-Estève, R., McGuire, M. L., Jeong, C.-H., McGillicuddy, E., O’Connor, I. P., Sodeau, J. R., Evans, G. J., and Wenger, J. C.: Quantitative determination of carbonaceous particle mixing state in Paris using single-particle mass spectrometer and aerosol mass spectrometer measurements, Atmos. Chem. Phys., 13, 9479–9496, doi:10.5194/acp13-9479-2013, 2013. Henry, R., Norris, G. A., Vedantham, R., and Turner, J. R.: Source Region Identification Using Kernel Smoothing, Environ. Sci. Technol., 43, 4090–4097, doi:10.1021/es8011723, 2009. Heringa, M. F., DeCarlo, P. F., Chirico, R., Tritscher, T., Dommen, J., Weingartner, E., Richter, R., Wehrle, G., Prévôt, A. S. H., and Baltensperger, U.: Investigations of primary and secondary particulate matter of different wood combustion appliances with a high-resolution time-of-flight aerosol mass spectrometer, Atmos. Chem. Phys., 11, 5945–5957, doi:10.5194/acp-11-59452011, 2011. Ji, X., Le Bihan, O., Ramalho, O., Mandin, C., D’Anna, B., Martinon, L., Nicolas, M., Bard, D., and Pairon, J.-C.: Characterization of particles emitted by incense burning in an experimental house, Indoor Air, 20, 147–158, doi:10.1111/j.16000668.2009.00634.x, 2010. Jimenez, J. L., Canagaratna, M. R., Donahue, N. M., Prevot, A. S. H., Zhang, Q., Kroll, J. H., DeCarlo, P. F., Allan, J. D., Coe, H., Ng, N. L., Aiken, A. C., Docherty, K. S., Ulbrich, I. M., Grieshop, A. P., Robinson, A. L., Duplissy, J., Smith, J. D., Wilson, K. R., Lanz, V. A., Hueglin, C., Sun, Y. L., Tian, J., Laaksonen, A., Raatikainen, T., Rautiainen, J., Vaattovaara, P., Ehn, M., Kulmala, M., Tomlinson, J. M., Collins, D. R., Cubison, M. J., Dunlea, E. J., Huffman, J. A., Onasch, T. B., Alfarra, M. R., Williams, P. I., Bower, K., Kondo, Y., Schneider, J., Drewnick, F., Borrmann, S., Weimer, S., Demerjian, K., Salcedo, D., Cottrell, L., Griffin, R., Takami, A., Miyoshi, T., Hatakeyama, S., Shimono, A., Sun, J. Y., Zhang, Y. M., Dzepina, K., Kimmel, Atmos. Chem. Phys., 14, 13773–13787, 2014 13786 J.-E. Petit et al.: Submicron aerosol source apportionment of wintertime pollution J. R., Sueper, D., Jayne, J. T., Herndon, S. C., Trimborn, A. M., Williams, L. R., Wood, E. C., Middlebrook, A. M., Kolb, C. E., Baltensperger, U., and Worsnop, D. R.: Evolution of Organic Aerosols in the Atmosphere, Science, 326, 1525–1529, doi:10.1126/science.1180353, 2009. Laborde, M., Crippa, M., Tritscher, T., Jurányi, Z., Decarlo, P. F., Temime-Roussel, B., Marchand, N., Eckhardt, S., Stohl, A., Baltensperger, U., Prévôt, A. S. H., Weingartner, E., and Gysel, M.: Black carbon physical properties and mixing state in the European megacity Paris, Atmos. Chem. Phys., 13, 5831–5856, doi:10.5194/acp-13-5831-2013, 2013. Lanz, V. A., Alfarra, M. R., Baltensperger, U., Buchmann, B., Hueglin, C., and Prévôt, A. S. H.: Source apportionment of submicron organic aerosols at an urban site by factor analytical modelling of aerosol mass spectra, Atmos. Chem. Phys., 7, 1503– 1522, doi:10.5194/acp-7-1503-2007, 2007. Lanz, V. A., Alfarra, M. R., Baltensperger, U., Buchmann, B., Hueglin, C., Szidat, S., Wehrli, M. N., Wacker, L., Weimer, S., and Caseiro, A.: Source attribution of submicron organic aerosols during wintertime inversions by advanced factor analysis of aerosol mass spectra, Environ. Sci. Technol., 42, 214–220, 2008. Lanz, V. A., Prévôt, A. S. H., Alfarra, M. R., Weimer, S., Mohr, C., DeCarlo, P. F., Gianini, M. F. D., Hueglin, C., Schneider, J., Favez, O., D’Anna, B., George, C., and Baltensperger, U.: Characterization of aerosol chemical composition with aerosol mass spectrometry in Central Europe: an overview, Atmos. Chem. Phys., 10, 10453–10471, doi:10.5194/acp-10-10453-2010, 2010. Lenschow, P., Abraham, H.-J., Kutzner, K., Lutz, M., Preuß, J.-D., and Reichenbächer, W.: Some ideas about the sources of PM10 , Atmos. Environ., 35, S23–S33, 2001. May, A. A., Levin, E. J. T., Hennigan, C. J., Riipinen, I., Lee, T., Collett, J. L., Jimenez, J. L., Kreidenweis, S. M., and Robinson, A. L.: Gas-particle partitioning of primary organic aerosol emissions: 3. Biomass burning, J. Geophys. Res.-Atmos., 118, 11327–11338, doi:10.1002/jgrd.50828, 2013. McGuire, M. L., Chang, R. Y.-W., Slowik, J. G., Jeong, C.-H., Healy, R. M., Lu, G., Mihele, C., Abbatt, J. P. D., Brook, J. R., and Evans, G. J.: Enhancing non-refractory aerosol apportionment from an urban industrial site through receptor modeling of complete high time-resolution aerosol mass spectra, Atmos. Chem. Phys., 14, 8017–8042, doi:10.5194/acp-14-80172014, 2014. Ng, N. L., Herndon, S. C., Trimborn, A., Canagaratna, M. R., Croteau, P. L., Onasch, T. B., Sueper, D., Worsnop, D. R., Zhang, Q., and Sun, Y. L.: An aerosol chemical speciation monitor (ACSM) for routine monitoring of the composition and mass concentrations of ambient aerosol, Aerosol Sci. Technol., 45, 780–794, 2011. Norris, G. A., Vedantham, R., Wade, K., Brown, S., Prouty, J., and Foley, C.: EPA Positive Matrix Factorization (PMF) 3.0: Fundamentals & User Guide, US Environmental Protection Agency, available at: http://nepis.epa.gov/Exe/ZyNET.exe/P100GDUM.TXT? ZyActionD=ZyDocument&Client=EPA&Index=2006+Thru+ 2010&Docs=&Query=&Time=&EndTime=&SearchMethod= 1&TocRestrict=n&Toc=&TocEntry=&QField=&QFieldYear= &QFieldMonth=&QFieldDay=&IntQFieldOp= 0&ExtQFieldOp=0&XmlQuery=&File=D:_zyfiles_ Atmos. Chem. Phys., 14, 13773–13787, 2014 IndexData_06thru10_Txt_00000033_P100GDUM.txt&User= ANONYMOUS&Password=anonymous&SortMethod=h| -&MaximumDocuments=1&FuzzyDegree=0&ImageQuality= r75g8/r75g8/x150y150g16/i425&Display=p|f&DefSeekPage= x&SearchBack=ZyActionL&Back=ZyActionS&BackDesc= Resultspage&MaximumPages=1&ZyEntry=1&SeekPage= x&ZyPURL (last access: 20 February 2014), 2008. Paatero, P. and Hopke, P. K.: Discarding or downweighting highnoise variables in factor analytic models, Anal. Chim. Acta, 490, 277–289, 2003. Paatero, P. and Tapper, U.: Positive matrix factorization: A non-negative factor model with optimal utilization of error estimates of data values, Environmetrics, 5, 111–126, doi:10.1002/env.3170050203, 1994. Pay, M. T., Jiménez-Guerrero, P., and Baldasano, J. M.: Assessing sensitivity regimes of secondary inorganic aerosol formation in Europe with the CALIOPE-EU modeling system, Atmos. Environ., 51, 146–164, doi:10.1016/j.atmosenv.2012.01.027, 2012. Platt, S. M., El Haddad, I., Zardini, A. A., Clairotte, M., Astorga, C., Wolf, R., Slowik, J. G., Temime-Roussel, B., Marchand, N., Ježek, I., Drinovec, L., Moˇcnik, G., Möhler, O., Richter, R., Barmet, P., Bianchi, F., Baltensperger, U., and Prévôt, A. S. H.: Secondary organic aerosol formation from gasoline vehicle emissions in a new mobile environmental reaction chamber, Atmos. Chem. Phys., 13, 9141–9158, doi:10.5194/acp-13-91412013, 2013. Polissar, A. V., Hopke, P. K., Paatero, P., Malm, W. C., and Sisler, J. F.: Atmospheric aerosol over Alaska: 2. Elemental composition and sources, J. Geophys. Res.-Atmos., 103, 19045–19057, doi:10.1029/98JD01212, 1998. Pope, C. A. and Dockery, D. W.: Health Effects of Fine Particulate Air Pollution: Lines that Connect, J. Air Waste Manage., 56, 709–742, doi:10.1080/10473289.2006.10464485, 2006. Pope, C. A., Hansen, M. L., Long, R. W., Nielsen, K. R., Eatough, N. L., Wilson, W. E., and Eatough, D. J.: Ambient Particulate Air Pollution, Heart Rate Variability, and Blood Markers of Inflammation in a Panel of Elderly Subjects, Environ. Health Perspect., 112, 339–345, 2004. Poulain, L., Iinuma, Y., Müller, K., Birmili, W., Weinhold, K., Brüggemann, E., Gnauk, T., Hausmann, A., Löschau, G., Wiedensohler, A., and Herrmann, H.: Diurnal variations of ambient particulate wood burning emissions and their contribution to the concentration of Polycyclic Aromatic Hydrocarbons (PAHs) in Seiffen, Germany, Atmos. Chem. Phys., 11, 12697–12713, doi:10.5194/acp-11-12697-2011, 2011. Robinson, A. L., Subramanian, R., Donahue, N. M., BernardoBricker, A., and Rogge, W. F.: Source Apportionment of Molecular Markers and Organic Aerosol 2. Biomass Smoke, Environ. Sci. Technol., 40, 7811–7819, doi:10.1021/es060782h, 2006. Robinson, A. L., Donahue, N. M., Shrivastava, M. K., Weitkamp, E. A., Sage, A. M., Grieshop, A. P., Lane, T. E., Pierce, J. R., and Pandis, S. N.: Rethinking Organic Aerosols: Semivolatile Emissions and Photochemical Aging, Science, 315, 1259–1262, doi:10.1126/science.1133061, 2007. Rosenfeld, D., Lohmann, U., Raga, G. B., O’Dowd, C. D., Kulmala, M., Fuzzi, S., Reissell, A., and Andreae, M. O.: Flood or drought: how do aerosols affect precipitation?, Science, 321, 1309–1313, 2008. www.atmos-chem-phys.net/14/13773/2014/ J.-E. Petit et al.: Submicron aerosol source apportionment of wintertime pollution Sage, A. M., Weitkamp, E. A., Robinson, A. L., and Donahue, N. M.: Evolving mass spectra of the oxidized component of organic aerosol: results from aerosol mass spectrometer analyses of aged diesel emissions, Atmos. Chem. Phys., 8, 1139–1152, doi:10.5194/acp-8-1139-2008, 2008. Sandradewi, J., Prévôt, A. S. H., Szidat, S., Perron, N., Alfarra, M. R., Lanz, V. A., Weingartner, E., and Baltensperger, U.: Using Aerosol Light Absorption Measurements for the Quantitative Determination of Wood Burning and Traffic Emission Contributions to Particulate Matter, Environ. Sci. Technol., 42, 3316– 3323, doi:10.1021/es702253m, 2008. Sciare, J., d’ Argouges, O., Sarda-Estève, R., Gaimoz, C., Dolgorouky, C., Bonnaire, N., Favez, O., Bonsang, B., and Gros, V.: Large contribution of water-insoluble secondary organic aerosols in the region of Paris (France) during wintertime, J. Geophys. Res.-Atmos., 116, D22203, doi:10.1029/2011JD015756, 2011. Sun, Y., Wang, Z., Dong, H., Yang, T., Li, J., Pan, X., Chen, P., and Jayne, J. T.: Characterization of summer organic and inorganic aerosols in Beijing, China with an Aerosol Chemical Speciation Monitor, Atmos. Environ., 51, 250–259, doi:10.1016/j.atmosenv.2012.01.013, 2012. Ulbrich, I. M., Canagaratna, M. R., Zhang, Q., Worsnop, D. R., and Jimenez, J. L.: Interpretation of organic components from Positive Matrix Factorization of aerosol mass spectrometric data, Atmos. Chem. Phys., 9, 2891–2918, doi:10.5194/acp-9-2891-2009, 2009. Viana, M., Kuhlbusch, T. A. J., Querol, X., Alastuey, A., Harrison, R. M., Hopke, P. K., Winiwarter, W., Vallius, M., Szidat, S., Prévôt, A. S. H., Hueglin, C., Bloemen, H., Wåhlin, P., Vecchi, R., Miranda, A. I., Kasper-Giebl, A., Maenhaut, W., and Hitzenberger, R.: Source apportionment of particulate matter in Europe: A review of methods and results, J. Aerosol Sci., 39, 827–849, doi:10.1016/j.jaerosci.2008.05.007, 2008. Waked, A., Favez, O., Alleman, L. Y., Piot, C., Petit, J.-E., Delaunay, T., Verlinden, E., Golly, B., Besombes, J.-L., Jaffrezo, J.L., and Leoz-Garziandia, E.: Source apportionment of PM10 in a north-western Europe regional urban background site (Lens, France) using positive matrix factorization and including primary biogenic emissions, Atmos. Chem. Phys., 14, 3325–3346, doi:10.5194/acp-14-3325-2014, 2014. www.atmos-chem-phys.net/14/13773/2014/ 13787 Weimer, S., Alfarra, M. R., Schreiber, D., Mohr, M., Prévôt, A. S. H., and Baltensperger, U.: Organic aerosol mass spectral signatures from wood-burning emissions: Influence of burning conditions and wood type, J. Geophys. Res., 113, D10304, doi:10.1029/2007JD009309, 2008. Weingartner, E., Saathoff, H., Schnaiter, M., Streit, N., Bitnar, B., and Baltensperger, U.: Absorption of light by soot particles: determination of the absorption coefficient by means of Aethalometers, J. Aerosol Sci., 34, 1445–1463, 2003. Weitkamp, E. A., Sage, A. M., Pierce, J. R., Donahue, N. M., and Robinson, A. L.: Organic Aerosol Formation from Photochemical Oxidation of Diesel Exhaust in a Smog Chamber, Environ. Sci. Technol., 41, 6969–6975, doi:10.1021/es070193r, 2007. Zhang, Q., Alfarra, M. R., Worsnop, D. R., Allan, J. D., Coe, H., Canagaratna, M. R., and Jimenez, J. L.: Deconvolution and Quantification of Hydrocarbon-like and Oxygenated Organic Aerosols Based on Aerosol Mass Spectrometry, Environ. Sci. Technol., 39, 4938–4952, doi:10.1021/es048568l, 2005. Zhang, Q., Jimenez, J. L., Canagaratna, M. R., Allan, J. D., Coe, H., Ulbrich, I., Alfarra, M. R., Takami, A., Middlebrook, A. M., Sun, Y. L., Dzepina, K., Dunlea, E., Docherty, K., DeCarlo, P. F., Salcedo, D., Onasch, T., Jayne, J. T., Miyoshi, T., Shimono, A., Hatakeyama, S., Takegawa, N., Kondo, Y., Schneider, J., Drewnick, F., Borrmann, S., Weimer, S., Demerjian, K., Williams, P., Bower, K., Bahreini, R., Cottrell, L., Griffin, R. J., Rautiainen, J., Sun, J. Y., Zhang, Y. M., and Worsnop, D. R.: Ubiquity and dominance of oxygenated species in organic aerosols in anthropogenically-influenced Northern Hemisphere midlatitudes, Geophys. Res. Lett., 34, L13801, doi:10.1029/2007GL029979, 2007. Zhang, Q., Jimenez, J. L., Canagaratna, M. R., Ulbrich, I. M., Ng, N. L., Worsnop, D. R., and Sun, Y.: Understanding atmospheric organic aerosols via factor analysis of aerosol mass spectrometry: a review, Anal. Bioanal. Chem., 401, 3045–3067, doi:10.1007/s00216-011-5355-y, 2011. Atmos. Chem. Phys., 14, 13773–13787, 2014


© Copyright 2026