
Implementation of the State Children’s Health Insurance Program:
Contract No.:
MPR Reference No.:
500-96-0016 (03)
8644-102
Implementation of the
State Children’s Health
Insurance Program:
Momentum Is Increasing
After a Modest Start
First Annual Report
January 2001
Margo Rosenbach
Marilyn Ellwood
John Czajka
Carol Irvin
Wendy Coupé
Brian Quinn
Submitted to:
Health Care Financing Administration
Office of Strategic Planning
7500 Security Boulevard
Baltimore, MD 21244
Project Officer:
Rosemarie Hakim
Submitted by:
Mathematica Policy Research, Inc.
50 Church Street, Fourth Floor
Cambridge, MA 02138
(617) 491-7900
Project Director:
Margo Rosenbach
This report was prepared for the Health Care Financing Administration, U.S. Department of Health
and Human Services, under HCFA contract number 500-96-0016 (03). The contents of this
publication do not necessarily reflect the views or policies of HCFA or DHHS, nor does the
mention of trade names, commercial products, or organizations imply endorsement by HCFA,
DHHS, or Mathematica Policy Research, Inc. The authors are solely responsible for the contents of
this publication.
CONTENTS
CHAPTER I:
INTRODUCTION AND SUMMARY OF MAJOR FINDINGS ........................................1
CHAPTER II: STATE VARIATIONS IN ELIGIBILITY FOR SCHIP ................................................13
CHAPTER III: TRENDS IN SCHIP AND MEDICAID ENROLLMENT ............................................25
CHAPTER IV: TRENDS IN THE NUMBER OF UNINSURED CHILDREN
BEFORE AND AFTER SCHIP ..................................................................................39
CHAPTER V:
SUCCESSES AND CHALLENGES IN ENROLLING AND RETAINING
CHILDREN IN SCHIP...............................................................................................53
CHAPTER VI: STATE RECOMMENDATIONS FOR IMPROVING TITLE XXI ................................69
REFERENCES ....................................................................................................................................81
APPENDIX A: SUMMARY OF AMENDMENTS TO TITLE XXI STATE PLANS,
AS OF AUGUST 1, 2000
APPENDIX B: SIMULATED PROGRAM ELIGIBILITY FOR A HYPOTHETICAL
FAMILY AT 100, 133, 150, 185, 200, AND 250 PERCENT OF POVERTY
APPENDIX C: NUMBER OF CHILDREN EVER ENROLLED IN SCHIP BY STATE
FROM FIRST QUARTER OF FFY 1998 THROUGH SECOND QUARTER
OF FFY 2000
CHAPTER I
INTRODUCTION AND SUMMARY
OF MAJOR FINDINGS
U
nder the Balanced Budget Act of 1997, Congress established the State Children’s
Health Insurance Program (SCHIP) to expand health insurance coverage to
uninsured low-income children. States were given the option of developing
separate child health programs, expanding Medicaid, or using a combination of
the two approaches. States also were given flexibility to initiate employer buy-in or premium
assistance programs, to develop family coverage components, or to develop public health
initiatives for low-income children.
The SCHIP program has been more challenging to implement than might have been
expected. States are gaining momentum, however, as their programs mature and gain public
awareness. Enrollment continues to grow at a steady pace; the number of children ever
enrolled during the first three months of 2000 was higher than the number ever enrolled
during federal fiscal year (FFY) 1999. In this report, we review how SCHIP programs have
evolved over time and how they are likely to evolve as states examine the strengths and
weaknesses of their programs. We also present state perspectives on how the rules and
regulations surrounding the implementation of SCHIP have affected their progress.
This report summarizes the major findings of the first year of a national evaluation of
SCHIP, sponsored by the Health Care Financing Administration (HCFA) and conducted by
Mathematica Policy Research, Inc. (MPR). The report addresses the following key
questions:
!" What
is the extent of coverage expansion offered under SCHIP, and how
much does SCHIP expand eligibility beyond Medicaid?
!" How
time?
many children enrolled in SCHIP, and how has enrollment grown over
2
!" What
effect has SCHIP had on the uninsured rate for low-income children?
!" How
do states assess their successes and challenges in enrolling and retaining
children in SCHIP?
!" What
recommendations do states have for improving Title XXI?
Our analysis is based on several sources, including the state SCHIP evaluations
mandated under Title XXI (submitted to HCFA in spring 2000), quarterly enrollment data
submitted by states to HCFA, and national data on trends in the number of uninsured
children. We begin with an overview of the current status of SCHIP, then review our major
findings before presenting our detailed findings in later chapters.
THE CURRENT STATUS OF SCHIP
All 50 states and the District of Columbia have implemented SCHIP programs, which
are tailored to each state’s need, context, and capacity.1 As of March 31, 2000, 19 states
operated Medicaid expansion programs (which we call M-SCHIP programs), 15 states
operated separate SCHIP programs (known as S-SCHIP programs), and 17 states used both
approaches to expand coverage. The implementation of SCHIP has been gradual. Although
Title XXI authorized enrollment as of October 1, 1997, only eight states began covering
children under SCHIP during 1997 (Table 1). The majority of states began enrollment in
1998 (33 states in all), while eight states began enrollment in 1999. Two states began
enrolling children in 2000.
The SCHIP program continues to grow and is still evolving; state approaches are being
modified and expanded as states gain experience and knowledge. As of August 1, 2000, 31
states have received approval for 52 program amendments, and 11 states have amendments
pending. Since their initial implementation, 21 states have amended their state plans to
expand eligibility, either by raising eligibility thresholds within existing SCHIP programs (13
states) or by establishing new S-SCHIP programs (8 states). Appendix A summarizes
amendments approved as of August 1, 2000.
As the program approached its three-year anniversary, states and the Congress raised
concerns about the significant portion of the FFY 1998 SCHIP allotment that remained
unspent. Only 45 percent of the FFY 1998 allotment had been spent as of June 30, 2000.
This could potentially leave $1.9 billion of the FFY 1998 allotments to be reallocated to
states that have been able to spend their full FFY 1998 allotment.
1In addition, the five territories utilize Title XXI funds to extend their Medicaid programs.
territories’ SCHIP programs are not discussed in this report and will be evaluated separately.
I. Introduction and Summary of Major Findings
The
TABLE 1
PROGRAMS FUNDED THROUGH TITLE XXI, AS OF MARCH 31, 2000
State
Alabama
Alaska
Arizona
Arkansas
California
Colorado
Connecticut
Delaware
District of Columbia
Floridab
Georgia
Hawaii
Idaho
Illinois
Indiana
Iowa
Kansas
Kentucky
Louisiana
Maine
Marylandc
Massachusettsd
Michigan
Minnesota
Mississippi
Missouri
Montana
Nebraska
Nevada
New Hampshire
New Jersey
New Mexico
New York
North Carolina
North Dakota
Ohio
Oklahoma
Oregon
Pennsylvania
Rhode Island
Type of SCHIP
Program
COMBO
M-SCHIP
S-SCHIP
M-SCHIP
COMBO
S-SCHIP
COMBO
S-SCHIP
M-SCHIP
COMBO
S-SCHIP
M-SCHIP
M-SCHIP
COMBO
COMBO
COMBO
S-SCHIP
COMBO
M-SCHIP
COMBO
M-SCHIP
COMBO
COMBO
M-SCHIP
COMBO
M-SCHIP
S-SCHIP
M-SCHIP
S-SCHIP
COMBO
COMBO
M-SCHIP
COMBO
S-SCHIP
COMBO
M-SCHIP
M-SCHIP
S-SCHIP
S-SCHIP
M-SCHIP
Program Namea
Medicaid Expansion/ALL Kids
Denali KidCare
KidsCare
Arkansas Medicaid Program
Medi-Cal for Children/Healthy Families Program
Child Health Plan Plus (CHP+)
Husky
Delaware Healthy Children Program
DC Healthy Families
Medicaid for Teens/Healthy Kids
PeachCare for Kids
Hawaii Title XXI Program
Idaho Children's Health Insurance Program
KidCare Assist Expansion/KidCare Share/KidCare Premium
Hoosier Healthwise
Medicaid/HAWK-I
HealthWave
KCHIP
LaCHIP
Medicaid Expansion/Cub Care
Maryland's Children's Health Program
MassHealth/Family Assistance
Healthy Kids/MIChild
Minnesota Medical Assistance Program
Mississippi Health Benefits Program
MC+ for Kids
Children's Health Insurance Plan
Kids Connection
Nevada Check-Up
Healthy Kids
NJ KidCare
State Children's Health Insurance Program
Medicaid/Child Health Plus (CHPlus)
NC Health Choice for Children
Healthy Steps
Healthy Start
SoonerCare
CHIP
CHIP
RIte Care
Date Enrollment Began
M-SCHIP
S-SCHIP
February 1998
March 1999
October 1998
March 1998
October 1997
October 1998
April 1998
July 2000
October 1997
January 1998
June 1997
July 1998
July 1998
November 1998
July 1998
July 1998
October 1997
April 1998
September 1998
July 1998
July 1998
July 1998
May 1998
February 1998
March 1999
January 1999
October 1998
January 1998
December 1997
October 1997
October 1998
Novermber 1998
July 1998
April 1998
July 1998
February 1999
April 1998
January 1999
October 1998
January 2000
January 1999
January 1999
November 1999
August 1998
August 1998
May 1998
January 2000
January 1999
October 1998
January 1999
March 1998
April 1998
October 1998
October 1999
July 1998
May 1998
-
TABLE 1 (continued)
State
South Carolina
South Dakota
Tennessee
Texase
Utah
Vermont
Virginia
Washington
West Virginiaf
Wisconsin
Wyoming
Type of SCHIP
Program
M-SCHIP
M-SCHIP
M-SCHIP
M-SCHIP
S-SCHIP
S-SCHIP
S-SCHIP
S-SCHIP
COMBO
M-SCHIP
S-SCHIP
Date Enrollment Began
M-SCHIP
S-SCHIP
Program Namea
Partners for Healthy Children
South Dakota's Health Insurance Program
TennCare for Children
Medicaid
Utah CHIP
Dr. Dynasaur
Virginia's Children's Medical Insurance Plan
Washington State CHIP
WV SCHIP
BadgerCare
Wyoming Kid Care
August 1997
July 1998
October 1997
July 1998
July 1998
April 1999
-
August 1998
October 1998
October 1998
February 2000
April 1999
December 1999
SOURCE: Title XXI State Evaluations, Section 2.1 of State Evaluation Framework.
M-SCHIP = State operates Medicaid expansion program
S-SCHIP = State operates separate SCHIP program
COMBO = State operates both an M-SCHIP and S-SCHIP program
a
When more than one name is noted, the first is that of the M-SCHIP program, and the rest are the names of S-SCHIP programs.
b
Florida also uses Title XXI funds for its MediKids, CMS (Children's Medical Services), and BHSCN (Behavioral Network) programs. These programs cover children under
age five, those with special health care needs, and those with serious behavioral health care needs, respectively. Enrollment for these programs began on October 1, 1998.
c
On November 7, 2000, Maryland received approval for an S-SCHIP program; enrollment will begin July 1, 2001.
d
Massachusetts also uses Title XXI funds for its Common Health program. This program covers disabled children. Enrollment began on October 1, 1997.
e
On November 8, 1999, Texas received approval for an S-SCHIP program; enrollment began April 3, 2000.
f
As of October 13, 2000, West Virginia's SCHIP program was amended to incorporate the M-SCHIP component into the S-SCHIP component effectively eliminating the MSCHIP program.
5
As shown in Figure 1, 8 states spent all their FFY 1998 allotment as of June 30, 2000
(Alaska, Indiana, Kentucky, Maryland, Massachusetts, New York, North Carolina, and South
Carolina); at the other end of the continuum, 12 states spent less than a fourth of their
allotment. The level of SCHIP spending depends on a variety of factors, including the time
it takes to design and implement a new program, when enrollment actually begins, and
limitations within the Title XXI statute that have prevented some states with pre-existing
child health programs from qualifying for SCHIP. The level of federal SCHIP expenditures
is clearly a function of how early a state implemented its SCHIP program (Table 2). The
states that implemented SCHIP programs in 1997 spent 76 percent of their FFY 1998
allotment, declining to 43 percent for those implementing in 1998, and 31 percent for those
implementing in 1999.
Figure 1: Percentage of the FFY 1998 SCHIP Allotment Claimed by States,
As Of June 30, 2000
18
16
Number of States
16
14
12
12
12
10
8
8
6
3
4
2
0
0 - 24%
25 - 49%
50 - 74%
75 - 99%
100%
Percentage of Allotment Claimed through June 30, 2000
SOURCE: Mathematica Policy Research analysis of Federal expenditures as reported by states on HCFA
form 21-C through June 30, 2000.
Table 2: Summary of SCHIP Federal Allotments and Federal Expenditures
(As of June 30, 2000)
FFY 1998 Federal
Federal Expenditures
Date Enrollment Began
Allotment (in millions)
(in millions)
1997 (8 states)
$ 390.3
$ 295.2
1998 (33 states)
3,485.1
1,509.4
1999 (8 states)
293.3
91.0
2000 (2 states)
55.6
0.1
Percent of FFY 1998
Allotment Spent
75.6
43.3
31.0
0.3
I. Introduction and Summary of Major Findings
6
SUMMARY OF MAJOR FINDINGS
State Variations in Eligibility for SCHIP
States vary in the extent to which they have expanded health insurance coverage for lowincome children under SCHIP. Title XXI authorized states to expand coverage to children
in families with income up to the higher of 200 percent of poverty or 50 percentage points
above the Medicaid eligibility level in effect on March 31, 1997.
!" As
of March 31, 2000, 18 states had implemented SCHIP eligibility at 200
percent of poverty, and another 10 states set eligibility thresholds above 200
percent of poverty. Twenty-three states chose a threshold lower than 200
percent of poverty.
!" States
implementing M-SCHIP only programs tend to have more modest
income eligibility thresholds; as of March 31, 2000, 12 of the 19 states with
M-SCHIP only programs set eligibility below 200 percent of poverty,
whereas 5 of the 15 S-SCHIP only programs and 6 of the 17 states with
combination programs had an income threshold below 200 percent of
poverty. States with combination programs typically have implemented a
modest expansion through Medicaid and a broader expansion through their
S-SCHIP programs.
!" States
with Section 1115 demonstration programs or other Medicaid
expansions prior to SCHIP typically have implemented narrower SCHIP
programs because they had established relatively high Medicaid income
thresholds pre-SCHIP. Thus, it is important to view SCHIP expansions in
the context of prior Medicaid expansions. These states typically have used
SCHIP to fill the gaps for specific age or income groups (such as
adolescents).
!" Simulations
of eligibility for a hypothetical family of six with an infant and
children ages 5, 10, and 17 demonstrate state variation in eligibility for
traditional Medicaid, M-SCHIP, and S-SCHIP programs. Of the 27 states
included in the simulation, 18 covered all four children in families where
gross income was 200 percent of poverty and one state covered only the
infant.
I. Introduction and Summary of Major Findings
7
Age of Child
Infant
Age 5
Age 10
Age 17
Number of States Covering Children in Families With Gross Income of
200 Percent of Poverty Through:
Traditional
Child Not
Medicaid
M-SCHIP
S-SCHIP
Eligible
8
3
8
8
4
3
11
9
3
4
11
9
3
4
11
9
!" Of
the 27 states included in the simulation, 16 had implemented an S-SCHIP
program, either alone or in combination with an M-SCHIP program. At 133
percent of poverty, in 9 of the 16 states, the two older children would be
eligible for S-SCHIP and the two younger children would be eligible for
Medicaid.
Families with children enrolled in both Medicaid and S-SCHIP programs may face
complexities resulting from differences across programs such as eligibility rules, benefit
packages, and provider networks. States with S-SCHIP programs and age-based eligibility
standards in Medicaid have the additional challenge of developing a system that is seamless
from the family’s perspective and that provides for smooth transitions as children age out of
the Medicaid program and into SCHIP.
Trends in SCHIP and Medicaid Enrollment
SCHIP enrollment is continuing to increase at an impressive pace. Only about 1 million
children were enrolled in SCHIP in FFY 1998, while in FFY 1999, close to 2 million children
were enrolled in SCHIP at some point during the year. Growth appears to be continuing at
a steady pace into the first half of FFY 2000.
!" SCHIP
enrollment grew 29 percent from the fourth quarter of FFY 1999
through the second quarter of FFY 2000, among the 37 states that have
submitted enrollment data for the second quarter of FFY 2000.
!" Ten
of the 37 states reported growth rates exceeding 50 percent during the
first six months of FFY 2000.
!" Between
the second quarter of FFY 1999 and the second quarter of FFY
2000, enrollment grew by 90 percent in the 35 states reporting data in both
quarters. Enrollment more than doubled in 17 states.
I. Introduction and Summary of Major Findings
8
SCHIP enrollment is heavily concentrated in states that implemented their programs in
the first year following passage of the SCHIP legislation.
!" Altogether,
the 19 states implementing SCHIP programs before July 1, 1998
accounted for over three-fourths of SCHIP enrollment during FFY 1999.
The three states with preexisting comprehensive child health programs-Florida, New York, and Pennsylvania--accounted for close to 40 percent of
total SCHIP enrollment in FFY 1999.
Information on the extent of turnover in SCHIP is not yet available. We estimated that
about 18 percent of children who were ever enrolled in SCHIP in FFY 1999 were not
enrolled in the last quarter of that year. In other words, about 350,000 children were
enrolled at some time during the year but had disenrolled by the last quarter. States have
indicated that many of the children who disenrolled from SCHIP did so because they were
eligible for Medicaid coverage or because they aged out of SCHIP. A more thorough
analysis is needed before any definitive conclusions can be reached about SCHIP turnover.
For example, many states had not yet faced annual redeterminations for their SCHIP
programs by the end of FFY 1999. Further research is required to analyze the extent of
transfers between Medicaid and SCHIP, versus disenrollment in which children leave public
insurance coverage altogether.
One measure of the effect of SCHIP is the extent to which public insurance coverage for
children has expanded beyond the traditional Medicaid program. In FFY 1999, SCHIP has
increased the number of children with public insurance coverage by 10 percent or more in
17 states. The greatest gain was in Oklahoma, where the number of children with public
insurance coverage increased by 66 percent.
SCHIP also may have been instrumental in stemming declines in child Medicaid
enrollment, due both to its expansion of Medicaid coverage through M-SCHIP programs
and the spillover effect of state outreach efforts for SCHIP. HCFA 2082 data for FFY 1995,
1996, and 1997 showed child Medicaid enrollment (under age 21) of 21.6, 21.2, and 21.0
million, respectively (data are not yet available for FFY 1998). We estimate that overall child
Medicaid enrollment, including the 700,000 children enrolled in M-SCHIP, reached 21.0
million in FFY 1999.
Trends in the Number Of Uninsured Children Before and After SCHIP
SCHIP was implemented at a time when uninsured rates were rising, especially among
the lowest-income children, many of whom were eligible for Medicaid but were not enrolled.
During the five years preceding SCHIP (1993 to 1997), uninsured rates rose an average of
three-tenths of a percentage point per year (from 14.1 to 15.3 percent). The increase was
largest among children in families below 50 percent of poverty, where the proportion
uninsured rose from 18.8 percent in 1993 to 26.1 percent in 1997. Throughout this period,
however, the highest proportion uninsured was found among children in families between
I. Introduction and Summary of Major Findings
9
100 and 150 percent of poverty, 27.8 percent of whom were uninsured in 1997. That
SCHIP will extend coverage to many children in this group raises expectations that the
uninsured rates will be reduced in the near future.
Only limited data are available to measure the short-term effect of SCHIP on uninsured
rates. We compared uninsured rates in 1997 (pre-SCHIP) and 1998 (post-SCHIP) based on
the 1998 and 1999 Current Population Survey (CPS).
!" There
were no statistically significant changes in the uninsured rates between
1997 and 1998, whether for all children or for subgroups by poverty level.
The rise of 0.3 percentage point in the overall child uninsured rate between
1997 and 1998 appears to be a continuation of the pre-SCHIP trend, but the
lack of statistical significance requires a more cautious interpretation.
These findings should not be surprising, given that most states were just beginning to
implement their programs in 1998. In addition, about 250,000 children were transferred into
SCHIP from preexisting state programs. Although none of the differences within poverty
group were significant, the following trends may signal the early effects of SCHIP on
reducing the rate of uninsured low-income children.
!" Among
children between 100 and 150 percent of poverty, the group with the
highest proportion uninsured in every year from 1993 through 1997, there
appears to be a reversal of the recent pre-SCHIP trend. The proportion
uninsured dropped from 1997 to 1998 and while the reduction was not
statistically significant, it suggests a divergence from the pattern found in
earlier years among children in the two lower income groups. Given where
the early eligibility expansions were most far-reaching, if SCHIP had any
effect in 1998, it is in this group that we would expect the effect to be most
pronounced.
!" In
the next higher income group, children between 150 and 200 percent of
poverty, a gradual year-to-year rise in the uninsured rate between 1993 and
1996 flattens out and stays relatively flat through 1998.
In sum, our findings on the trend in the uninsured rate by poverty level are at least
suggestive of an early influence of SCHIP, but the time series must be extended before we
can draw valid inferences about the direction and magnitude of change.
I. Introduction and Summary of Major Findings
10
Successes and Challenges in Enrolling and Retaining Children in SCHIP
In their SCHIP evaluation reports to HCFA, states highlighted many changes they have
made to their enrollment and re-enrollment procedures to facilitate access to insurance
coverage. Almost all states have made a deliberate attempt to streamline and simplify their
SCHIP application and redetermination policies and forms. The vast majority of states have
eliminated assets testing, and many have also reduced verification requirements. In addition,
the majority have moved to mail-in applications for SCHIP and are not requiring face-toface interviews.
Many states have made similar changes to their Medicaid programs as well. States also
discussed broader enrollment issues they are trying to address, such as reducing stigma,
improving retention rates, implementing cost-sharing, training staff, modifying automated
systems to accommodate SCHIP, and centralizing eligibility determination.
Many examples of state strategies to improve enrollment and retention were included in
the evaluation reports. For example:
!" Oklahoma
reduced its application form from 16 pages to 1 page, eliminated
the assets test and began to accept a self-declaration of income. In FFY
1999, the state’s M-SCHIP program increased enrollment in Medicaid by
more than 60 percent.
!" Illinois
reported that its approval rate for KidCare applications improved to
about 80 percent after the state ended face-to-face interviews, dropped the
asset test, reduced and simplified verification requirements, streamlined the
application, developed a centralized intake unit and began to reimburse
KidCare Application Agents who assist families with paperwork.
!" Florida
uses what it calls a passive re-enrollment process in its S-SCHIP
program. At the point of redetermination, families receive a letter with
information from their initial application and are asked to make corrections
as necessary. If there is no response, Florida assumes that there have been
no changes and coverage continues. The premiums provide assurance that
families are active participants.
States reported that they face ongoing enrollment challenges as well.
!" In
particular, states with S-SCHIP programs often face coordination issues
with Medicaid. Navigating and understanding coverage can be a problem
when the same family has children covered by two different programs. The
redetermination process can be confusing when the Medicaid and SCHIP
programs are not using the same redetermination forms. States also
I. Introduction and Summary of Major Findings
11
recognize the need for system changes to seamlessly transfer children
between Medicaid and S-SCHIP programs when eligibility changes.
!" Other
problem areas include processing applications for SCHIP when a
family is also receiving food stamps and determining eligibility when families
do not pay the required premiums or enrollment fees (at least one state
identified nonpayment as the leading cause of denied applications).
There is no single approach to structuring SCHIP enrollment and redetermination
processes; states must assess the positives and negatives of each approach to find the
practices best suited to their program. Additional research on best practices will also be
useful in informing state efforts.
State Recommendations for Improving Title XXI
Congress mandated that the Title XXI state evaluations identify ways that SCHIP could
be improved. To assist them in meeting their objectives under Title XXI, states
recommended various changes in coverage, financing, administration, and program
orientation. The following recommendations were mentioned most frequently:
!" The
most common concern among states is that the 10 percent
administrative cap significantly constrains state efforts to conduct outreach,
particularly among states with S-SCHIP programs that cannot obtain regular
Medicaid matching funds for excess expenditures. States offered a number
of suggestions ranging from changes in the way the cap is calculated to
removal of outreach costs from the cap to raising the level of the cap.
!" States
perceive a shift in the direction of the Title XXI program at the federal
level, signaling less flexibility, particularly for S-SCHIP programs. This
concern is motivated by the perception that the proposed SCHIP regulations
reflect a Medicaid orientation that could add to the costs and limit creativity
among SCHIP programs.
!" States
reported that they face significant barriers in coordinating with
employer-sponsored insurance, an important vehicle for expanding insurance
coverage among low-income children and for avoiding crowd-out of private
insurance coverage. Some barriers mentioned by states are the requirements
for employer contributions, waiting periods without health insurance
coverage, and requirements for health plans (such as benefits and costsharing limits).
!" States
also suggest that they cannot succeed in reducing the number of
uninsured low-income children until coverage is expanded to certain omitted
I. Introduction and Summary of Major Findings
12
groups, such as children of public employees, immigrant children, and
uninsured parents. Some states believe that a sizable proportion of
uninsured children will not gain coverage until their parents are covered as
well. In addition, some states suggest extending SCHIP to children with
catastrophic coverage only (the “underinsured”), who may lack insurance
coverage for routine and preventive care.
CONCLUDING REMARKS
The SCHIP program is exhibiting growing momentum. The number of enrollees is
rising each quarter, and states are considering new approaches to reach those who are
potentially eligible but who remain uninsured. States also are turning increasing attention
toward retention, to ensure continuity of coverage among those who are enrolled. Recent
evidence also suggests that SCHIP outreach and enrollment simplification may have had
spillover effects onto Medicaid enrollment.
As new data become available, further research will be conducted to document SCHIP
enrollment and disenrollment trends and to measure the extent of transfers between SCHIP
and Medicaid. In addition, we will continue to track national trends in the number and
proportion of children who remain uninsured. We also will continue to highlight “best
practices” in state performance, as reflected in the state evaluations and annual reports.
The federal and state governments have gained considerable experience over the past
three years since the SCHIP program was implemented. They are continually striving to
improve the SCHIP program to meet the goal of reducing the number of uninsured lowincome children.
I. Introduction and Summary of Major Findings
CHAPTER II
STATE VARIATIONS IN ELIGIBILITY
FOR SCHIP
T
o understand how states have expanded publicly-financed health insurance
coverage for low-income children, it is first necessary to understand the extent of
eligibility expansions under SCHIP relative to each state’s traditional Medicaid
program.1 Prior Medicaid expansions set a “floor” for SCHIP eligibility; where
traditional Medicaid eligibility ends, SCHIP coverage begins. Medicaid income thresholds
typically vary by age and states have considerable flexibility in the design of Medicaid and
SCHIP eligibility policies, such as how they conduct income tests, how they define income
and family size, whether they perform asset tests, and whether they impose residency
requirements. State variation in eligibility policies results in considerable differences across
states in the extent of the SCHIP expansion and, ultimately, in who is eligible for SCHIP.
This chapter begins with an overview of the extent of eligibility expansions under
SCHIP, and then presents a simulation of Medicaid and SCHIP eligibility for a hypothetical
family with four children to illustrate the level of state variation in SCHIP eligibility. State
policies regarding income definitions, thresholds, and disregards were abstracted from each
1
Title XXI authorized states to expand coverage to children in families with income up to the higher of
200 percent of poverty or 50 percentage points above the Medicaid level in effect on March 31, 1997. Some
groups of children cannot be covered under SCHIP, such as children residing in a public institution or
institution for mental diseases; children who are eligible for coverage through a state employee health benefits
plan; or certain types of immigrants.
14
state’s evaluation of its Title XXI program.2 In an addendum to the state evaluation
framework, states were asked to describe their eligibility policies as of September 30, 1999,
for the Medicaid poverty expansion program and each component of SCHIP.
VARIATIONS IN MEDICAID AND SCHIP INCOME THRESHOLDS
The “floor” for SCHIP eligibility was set by the mandatory and voluntary Medicaid
expansions for children in the late 1980s and early 1990s.3 As of March 31, 1997, ten states
had implemented the Medicaid expansions as mandated, while the remaining states opted to
provide more generous coverage for children (see Table 3). Thirty-five states covered
infants at levels above 133 percent of poverty and 9 states covered children ages 1 through
16 above the mandated levels.4 Seventeen states covered children born on or before
September 30, 1983, at 100 percent of poverty, and 7 states used even more generous
thresholds for this group of children. The other 27 states, however, covered these children at
the much lower levels set by state welfare and medically needy programs.
With the introduction of SCHIP, more children are eligible for publicly-financed health
insurance. As of March 31, 2000, 18 states had established SCHIP eligibility at 200 percent
of poverty and another 10 states have established even more generous thresholds. Twentythree states set more modest thresholds below 200 percent of poverty. States implementing
M-SCHIP only programs tend to have more modest income thresholds; as of March 31,
2000, 12 of the 19 states with M-SCHIP only programs set eligibility below 200 percent of
poverty, whereas only 5 of the 15 states with S-SCHIP only programs and 6 of the 17 states
with combination programs had an income threshold below 200 percent of poverty. Of the
10 states that established income thresholds above 200 percent of poverty, 4 implemented
M-SCHIP only programs, 2 implemented S-SCHIP only programs, and 4 implemented
combination programs. States with combination programs typically have implemented a
modest expansion through Medicaid (often targeted to a particular age group) and a broader
expansion through their S-SCHIP programs.
2
Information was abstracted from Sections 3.1.1 through 3.1.4 and the addendum to Table 3.1.1 of the
state evaluation framework.
3
State Medicaid programs are mandated to cover children through age five under 133 percent of poverty,
and children six years and older (born after September 30, 1983) under 100 percent of poverty. Medicaid
programs also have had the option of covering children born on or before September 30, 1983 up to 100
percent of poverty.
4
Two states (Rhode Island and Wisconsin) cover children ages 1 through 5 above the mandated level,
but cover children ages 6 through 16 at the mandated level. Massachusetts and Maine cover children ages 6
through 16 above the mandated level, but cover children ages 1 through 5 at the mandated level.
II. State Variations in Eligibility for SCHIP
TABLE 3
MEDICAID AND SCHIP INCOME THRESHOLDS BY PROGRAM TYPE AND BY STATE
State
M-SCHIP Only (N = 19)
Medicaid thresholds as of March 31, 1997
Ages 1
Ages 6
Ages 17
Infants
through 5
through 16
through 18
Alaska
Arkansasa
District of Columbia
Hawaiib
Idaho
Louisiana
Marylandc
Minnesotad
Missouri
Nebraska
New Mexico
Ohioe
Oklahomaf
Rhode Islandg
South Carolina
South Dakota
Tennesseeh
Texasi
Wisconsin
133
133
185
185
133
133
185
275
185
150
185
133
150
250
185
133
No limit
185
185
133
133
133
133
133
133
185
275
133
133
185
133
133
250
133
133
No limit
133
185
S-SCHIP Only (N = 15)
Arizona
Colorado
Delaware
Georgia
Kansas
Montana
Nevada
North Carolina
Oregon
Pennsylvania
Utah
Vermont
Virginia
Washington
Wyomingj
140
133
185
185
150
133
133
185
133
185
133
225
133
200
133
133
133
133
133
133
133
133
133
133
133
133
225
133
200
133
Percent of FPL
100
71
100
18
100
50
100
100
100
100
100
10
185
40
275
275
100
100
100
33
185
185
100
33
100
48
100
100
100
48
100
100
No limit
No limit
100
17
100
45
100
100
100
100
100
100
100
100
100
100
100
225
100
200
100
30
37
100
100
100
41
31
100
100
41
100
225
100
200
55
SCHIP thresholds as of
March 31, 2000
M-SCHIP
S-SCHIP
200
100
200
185
150
150
200
280
300
185
235
150
185
250
150
140
100
100
185
-
-
200
185
200
200
200
150
200
200
170
200
200
300
185
250
133
TABLE 3 (continued)
State
Medicaid standards as of March 31, 1997
Ages 6
Ages 17
Ages 1
Infants
through 16
through 18
through 5
Combination Programs (N = 17)
Alabama
California
Connecticut
Florida
Illinois
Indiana
Iowa
Kentucky
Maine
Massachusetts
Michigan
Mississippi
New Hampshirek
New Jersey
New Yorkl
North Dakotam
West Virginian
133
200
185
185
133
150
185
185
185
185
185
185
185
185
185
133
150
133
133
185
133
133
133
133
133
133
133
150
133
185
133
133
133
133
100
100
185
100
100
100
100
100
125
114
150
100
185
100
100
100
100
15
82
100
28
46
100
37
33
125
86
100
34
185
41
51
100
100
SCHIP standards as of
March 31, 2000
M-SCHIP
100
100
185
100
133
150
133
150
150
150
150
100
300
133
100
100
150
S-SCHIP
200
250
300
200
185
200
185
200
185
200
200
200
300
350
192
140
150
SOURCES: SCHIP standards based on Mathematica Policy Research analysis of Title XXI State Evaluations, Table
3.1.1; Medicaid standards based on HCFA web site and Table 2 from HCFA's State Children's Health
Insurance Program Annual Enrollment Report, October 1, 1998 - September 20, 1999.
NOTE:
Title XXI stipulates that a child's family income must exceed the Medicaid income level that was in effect
on March 31, 1997 in order for that child to be eligible for SCHIP-funded coverage.
a
Only children born after 9/1/82 but before 10/1/83 are eligible for M-SCHIP. Arkansas increased Medicaid eligibility
to 200 percent of FPL, effective September 1997, through Section 1115 demonstration authority.
b
Children ages 1 through 5 are eligible for M-SCHIP. An amendment to increase the SCHIP threshold to 200 percent
and the age criterion to all children under age 19 was approved September 22, 2000 and took effect July 1, 2000.
c
Effective July 1, 2001, Maryland will implement an S-SCHIP program that extends coverage to children in families
with income above 200 percent of poverty but at or below 300 percent of poverty.
d
e
Only children ages 0 through 2 are eligible for M-SCHIP.
Ohio was approved to extend coverage to 200 percent of poverty as of July 2000.
f
M-SCHIP covers children through age 17.
g
The Rhode Island Medicaid program covers children ages 0 through 7 to 250 percent of FPL, and children 8 and older
to 100 percent of FPL. An amendment to increase the M-SCHIP income threshold to 300 percent of poverty has been
approved, but not implemented.
TABLE 3 (continued)
h
Under its Section 1115 demonstration, Tennessee has no upper eligibility level. The currently approved Title XXI plan
covers children born before 10/1/83 in the expansion group and who enrolled in TennCare on or after April 1, 1997.
TennCare recipients with income above the poverty level are charged a monthly premium based on a sliding scale.
Premium subsidies end when income reaches 400 percent of poverty.
i
On April 3, 2000, Texas implemented an S-SCHIP program with an income threshold of 200 percent of poverty.
j
S-SCHIP covers children ages 6 through 18.
k
Infants are covered through M-SCHIP, and children ages 1 through 18 are covered through S-SCHIP.
l
New York's S-SCHIP program covers children up to 192 percent of the non-farm poverty threshold, which effectively
covers children in families with gross income up to 222 percent of poverty.
m
n
M-SCHIP only covers 18-year-olds.
As of March 31, 2000, children ages 1 through 5 were covered through M-SCHIP, all others through S-SCHIP.
Beginning October 2000, West Virginia was approved as an S-SCHIP only program to cover children through 200
percent of poverty. Their program is no longer a combination plan.
18
TAXONOMY OF SCHIP EXPANSIONS
The level of coverage expansion brought about by Title XXI is a function not only of
the upper income eligibility threshold established under SCHIP, but also the “floor” where
Medicaid coverage stops and SCHIP coverage begins. To better understand the extent of
eligibility expansions under SCHIP, we developed a taxonomy that arrays each state along
two dimensions: the absolute level of its SCHIP income threshold as of March 31, 2000, and
the level of the expansion relative to eligibility thresholds under the Medicaid program in
place as of March 31, 1997. Both dimensions are important in understanding the generosity
of SCHIP coverage expansions within each state.
Table 4 classifies states according to the two dimensions. The columns reflect the
absolute level of each state’s SCHIP income threshold as of March 31, 2000: at or below 150
percent of poverty (12 states); between 150 and 200 percent of poverty (11 states); at 200
percent of poverty (18 states); or above 200 percent of poverty (10 states). The rows reflect
the extent to which SCHIP has extended eligibility for publicly-financed health insurance
coverage beyond the thresholds set by Medicaid as of March 31, 1997. Narrow expansions
reflect increases of less than 50 percentage points in all age categories, or at least a 50
percentage point increase in one age category only (9 states); intermediate expansions reflect
increases of at least 50 percentage points in two age categories (8 states); and broad
expansions reflect increases of at least 50 percentage points in three or four age categories
(34 states). 5
Many states with narrow expansions had previously expanded Medicaid through Section
1115 demonstration programs (such as Arkansas, Maryland, Minnesota, and Tennessee). In
such cases, SCHIP fills the gaps for specific age or income groups. Of the 9 states with
narrow SCHIP programs, 7 implemented M-SCHIP only programs. Relatively few children
will be eligible for SCHIP coverage in these states and consequently, these programs can be
expected to enroll a small number of children.
!" Maryland’s
Medicaid program covers children born after September 31, 1983
up to 185 percent of poverty. The M-SCHIP program covers children with
family income below 200 percent of poverty. As a result, the Maryland
SCHIP program provides coverage to children of all ages, but within a
narrowly defined income group.
!" Minnesota’s
M-SCHIP program extends coverage to children two years old
and younger who live in families with incomes between 275 and 280 percent
of poverty.
5
The four age categories are: less than age 1, 1 through 5, 6 through 16, and 17 through 18.
II. State Variations in Eligibility for SCHIP
TABLE 4
ABSOLUTE AND RELATIVE LEVELS OF INCOME THRESHOLDS UNDER
THE STATE CHILDREN'S HEALTH INSURANCE PROGRAM
AS OF MARCH 31, 2000
Absolute Level of SCHIP Income Thresholds
Level of SCHIP Income
Thresholds Relative to Medicaid
Narrow (N=9)
At or below 150 percent of
poverty (N = 12)
a
Arkansas
North Dakota
South Dakota
151 to 200 percent of poverty
(N = 11)
Hawaii
b
At 200 percent of poverty
(N = 18)
Maryland
Over 200 percent of
poverty (N = 10)
a,b
Minnesota
a
a
Tennessee
b
Texas
Wyoming
Intermediate (N = 8)
Idaho
Louisiana
Montana
Oregon
Wisconsin
b
Ohio
South Carolina
West Virginia
Broad (N = 34)
b
Colorado
Illinois
Iowa
Maine
Nebraska
New York
Alabama
Alaska
Arizona
Delaware
District of Columbia
Florida
California
Connecticut
Missouri
New Hampshire
New Jersey
New Mexico
Oklahoma
Virginia
Georgia
Indiana
Kansas
Kentucky
Massachusetts
Michigan
Mississippi
Nevada
North Carolina
Pennsylvania
Utah
Rhode Island
Vermont
Washington
b
SOURCE: Mathematica Policy Research analysis of Title XXI State Evaluations.
NOTE: The relative level of SCHIP income reflects the magnitude of the expansion relative to traditional Medicaid across four age categories: less than 1
year, 1 through 6, 5 through 16, and 17 through 18.
Narrow = Increased coverage by less than 50 percentage points or increased coverage by at least 50 percent points for one age category
Intermediate = Increased coverage by at least 50 percentage points for two age categories
Broad = Increased coverage by at least 50 percentage points for three or four age categories
a
Coverage of children through Medicaid was generous in these states prior to SCHIP. As a result, SCHIP programs in these states are small. The Section 1115
Medicaid waiver program in Arkansas provides coverage through 200 percent of FPL, and the Tennessee Medicaid waiver program does not base eligibility on
income. The Medicaid program in Maryland covers children born after September 30, 1983 up to 185 percent of poverty while Minnesota's Medicaid program
covers all children under age 19 up to 275 percent of poverty.
b
These states expanded SCHIP eligibility after March 31, 2000. See Table 3 for details.
20
Of the 34 states that implemented broad expansions through SCHIP, 26 target families
with incomes of 200 percent of poverty or higher.6 Among states with broad expansions, all
but eight had established S-SCHIP programs (either alone or in combination with M-SCHIP
programs). States with broad expansions can be expected to extend publicly-financed
insurance coverage to a larger proportions of children than states with narrower expansions.
SCHIP is a dynamic program, with new programs being established and income
thresholds of existing programs being raised. We can expect states to shift within the
taxonomy as they increase their SCHIP thresholds and the size of their expansions relative
to Medicaid. Since initial implementation, 21 states have raised their SCHIP eligibility
thresholds, 13 within an existing SCHIP program (Arizona, California, Florida, Hawaii,
Kentucky, Louisiana, Mississippi, Nebraska, New York, Pennsylvania, Rhode Island, South
Dakota, and Wisconsin), and another 8 by phasing in an S-SCHIP program after initially
implementing an M-SCHIP program (Alabama, Illinois, Indiana, Iowa, Mississippi, North
Dakota, Texas, and West Virginia).7 Idaho is the only state where eligibility decreased, from
160 percent to 150 percent of poverty.
SIMULATION OF MEDICAID AND SCHIP ELIGIBILITY
Whether a child is eligible for Medicaid or SCHIP in a given state is not always readily
apparent because Medicaid and SCHIP programs vary not only in the income thresholds
that are used, but also in other eligibility criteria that are applied. For example, program
eligibility may vary depending on the type of income test that is used (income tests can be
based on gross or net income or a combination of both), how income is counted, and the
disregards that are used. To demonstrate the effects of varying eligibility policies, we
simulated Medicaid and SCHIP eligibility for a hypothetical family of four children. The
simulation is based on detailed information on Medicaid and SCHIP eligibility rules from 27
states.8
Our simulation is based on a hypothetical two-parent family with four children--an
infant and three children ages 5, 10, and 17. In each program and state, we assumed the
6
As of July 1, 2000, Hawaii increased its threshold to 200 percent of poverty and changed the age
criterion from covering only children ages 1 through 5 to covering all children under age 19. These changes
move Hawaii into the group of states with broad expansions and a SCHIP income threshold at 200 percent of
poverty. Similarly, the implementation of Texas’ S-SCHIP program on April 3, 2000, covering children up to
200 percent of poverty, shifts Texas from a narrow to a broad expansion. Beginning October 2000, the SCHIP
threshold in West Virginia was increased to 200 percent of poverty which moves West Virginia into the broad
expansion group.
7
The legislature in South Dakota has approved an increase in the M-SCHIP threshold from 140 to 200
percent of poverty Rhode Island has approval to increase coverage to 300 percent of poverty, but has not
implemented this change as of this report.
8
In an addendum to Table 3.1.1 of the state evaluation framework, states reported Medicaid and SCHIP
income eligibility criteria by age, income counting rules, and disregard policies. As of this report, 31 states had
submitted the addendum and 27 states provided sufficient information for the simulation. One addendum was
not submitted in time for inclusion in this report.
II. State Variations in Eligibility for SCHIP
21
family qualifies for any earnings and child care disregards used by the program. Monthly
child-care expenses were assumed to be $329.9 Program eligibility was determined at six
levels of gross income: 100, 133, 150, 185, 200, and 250 percent of poverty.10 The
simulations take into account whether programs use gross or net income tests, the income
thresholds for each program, and the types and amounts of earnings and child care
disregards that are allowed.
Results
Figure 2 summarizes the results of the simulation. (Refer to Appendix B for results for
each state.) Each bar in Figure 2 represents the number of states where an individual child is
eligible for public coverage at each level of gross income. Results are grouped by income
level. Prior to SCHIP, there was considerable variation across ages and income levels in the
number of states offering coverage under Medicaid. Older children were less likely to have
been eligible for coverage at all levels of income relative to younger children. With the
implementation of SCHIP, income eligibility for publicly-financed coverage has become
more uniform across the different age groups. At each level of income, either all children in
the family typically are eligible for coverage, or they are not. In general, younger children
are more likely to obtain coverage through traditional Medicaid, while adolescents often
obtain coverage through SCHIP. As a result, SCHIP has become vitally important for
adolescents given the high level of uninsured within this population.11
9
The most recent research available estimates that the average weekly child care expenditure for
preschoolers in families with income above poverty was $76.03 in 1993 (Casper 1995). When this is annualized
to 52 weekly payments and converted to a monthly rate, the amount is $329 per month.
10
In 1999, for a family of six, these levels translate to gross annual income of $22,340 (100 percent of
poverty), $29,712 (133 percent of poverty), $33,510 (150 percent of poverty), $41,329 (185 percent of poverty),
$44,680 (200 percent of poverty), and $55,850(250 percent of poverty) (Federal Register 1999).
11
Adolescents had the highest uninsured rates prior to SCHIP; 16.1 percent of children ages 12 to 17 were
uninsured in 1996, compared to 14.8 percent of all children (U.S. Census Bureau 1998). M-SCHIP programs in
10 states are designed to extend coverage to adolescents. Most of these states (9 of the 10) accelerated
coverage of children born on or before September 30, 1983, with family income at or below 100 percent of
poverty, a group of children states must cover through age 18 by September 30, 2001. Unless these states
amend their SCHIP programs to cover additional groups of children, M-SCHIP enrollment will drop over time
as these children age into traditional Medicaid and become ineligible for SCHIP.
II. State Variations in Eligibility for SCHIP
FIGURE 2
SIMULATED MEDICAID AND SCHIP ELIGIBILITY OF FOUR CHILDREN
BY FAMILY INCOME AS A PERCENT OF THE 1999 FEDERAL POVERTY LEVEL (BASED ON A SIMULATION FOR 27 STATES)
30
27
27
27
27
27
27
27
27
27
27
27
27
25
22
21
21
21
19
20
Number of States (N = 27)
18
18
18
15
S-SCHIP
M-SCHIP
Medicaid
10
7
6
6
5
100% FPL
133% FPL
185% FPL
200% FPL
SOURCE: Mathematica Policy Research analysis of Title XXI State Evaluations, Addendum to Table 3.1.1.
NOTE: Based on 27 states that submitted a complete addendum (11 M-SCHIP only programs, 6 S-SCHIP only programs, and 10 combination programs).
In
fa
nt
Ye
ar
O
10
ld
Ye
ar
O
17
ld
Ye
ar
O
ld
5
In
fa
nt
Ye
ar
O
10
ld
Ye
ar
O
17
ld
Ye
ar
O
ld
5
In
fa
nt
Ye
ar
O
10
ld
Ye
ar
O
17
ld
Ye
ar
O
ld
150% FPL
5
In
fa
nt
Ye
ar
O
10
ld
Ye
ar
O
17
ld
Ye
ar
O
ld
5
In
fa
nt
Ye
ar
O
10
ld
Ye
ar
O
17
ld
Ye
ar
O
ld
5
In
fa
nt
5
Ye
ar
O
10
ld
Ye
ar
O
17
ld
Ye
ar
O
ld
0
250% FPL
6
23
Up through 150 percent of poverty, all children in this hypothetical family are eligible for
coverage in all 27 states, although the source of coverage may vary by age and income level.
At 100 percent of poverty, for example, the three younger children are covered through the
Medicaid programs, while the 17-year-old is covered by Medicaid in 11 of the 27 states, MSCHIP in 13 states and, S-SCHIP in the remaining 2 states. At 133 percent of poverty (the
mandatory level for Medicaid coverage for all children through age 5), the infant and 5-yearold are always eligible through traditional Medicaid, while the 10-year-old is covered by the
SCHIP program in 19 states, and the 17-year-old is covered by SCHIP in 23 states.
At 250 percent of poverty, only 6 of the 27 states cover all four children, including 2
states through traditional Medicaid (Tennessee and Minnesota), 1 state through its M-SCHIP
program (Nebraska), and 3 states through their S-SCHIP programs (California, New Jersey,
and Washington).12 Tennessee and Minnesota have established generous Medicaid thresholds
through Section 1115 demonstration programs, while the SCHIP programs use generous
disregards to raise the effective income eligibility level for SCHIP. Nebraska disregards 20
percent of earnings and all child care expenses; based on our simulation, a family of six with
gross family income of 250 percent of poverty would have a net income of 182 percent of
poverty, qualifying the children for coverage under M-SCHIP. These results illustrate the
impact of disregards and demonstrate that income thresholds alone do not always fully
indicate who is eligible for program benefits.
Families living in states that have implemented an S-SCHIP program may face additional
complexities if younger children are covered through Medicaid and older children through
the state’s S-SCHIP program. Of the 27 states represented in our simulation, 16 had
implemented an S-SCHIP (either alone or in combination with an M-SCHIP program). In
our simulations, this family would have at least one child in Medicaid and another in SSCHIP in at least a few states at all but the highest (250 percent of poverty) levels of income.
For example, at 133 percent of poverty, in 9 of the 16 states the two older children would be
eligible for S-SCHIP and the two younger children would be eligible for Medicaid. At levels
above 133 percent of poverty, the infant is likely to be covered by Medicaid, while the older
children are covered by S-SCHIP.
For families negotiating Medicaid and S-SCHIP programs at the same time, they may
face complexities that result from differences across programs in such areas as eligibility
rules (including the timing of redeterminations), benefits packages, and provider networks.
States with S-SCHIP programs have the additional challenge of developing a well
coordinated system that is seamless from the family’s perspective and that provides for
smooth transitions as children age out of the Medicaid program and into SCHIP.
12
In Iowa, only the infant is eligible for coverage through the Medicaid program at this level of income,
due the use of a 20 percent earnings disregard.
II. State Variations in Eligibility for SCHIP
24
Caveats
In practice, results are likely to differ somewhat from these simulations. Earnings and
child-care disregards may not apply to all families, and some families may benefit from other
disregards such as those for child support. Asset tests were not modeled because few states
use such tests in their SCHIP programs; but in those few states, low-income children may be
determined ineligible for Medicaid or SCHIP due to assets in excess of program limits,
despite meeting income requirements. The simulations also do not adequately account for
the impact of the reporting process. Programs that conduct extensive review and verification
of income may calculate income differently than programs relying on self-declaration. For
example, Medicaid programs may require more extensive income reporting and verification
than SCHIP programs, which are trying to simplify the eligibility determination process
(although in many states efforts to simplify the application process are spilling over to
Medicaid).
Implications
This analysis demonstrates how SCHIP interacts with and builds on Medicaid for
children of different ages and income levels. In general, SCHIP has established income
thresholds that are uniform across different age groups and therefore plays an important role
in extending coverage to adolescents. Prior to SCHIP, older adolescents (ages 17 and 18)
living below poverty were not eligible for Medicaid coverage in nearly half the states. Future
analyses will focus on enrollment patterns and uninsured rates within the adolescent
population to determine whether SCHIP has made a difference within this group of
children.
The simulation graphically depicts state variation in the role of Medicaid, M-SCHIP, and
S-SCHIP in providing public insurance coverage for low-income children. This variation is
evident in the different income thresholds used by the programs and the Medicaid
thresholds that vary by age group in most states. It also illustrates how some families must
negotiate two programs. For example, in 9 of the 16 states with S-SCHIP programs that
were included in the simulation, a family with income at 133 percent of poverty would have
the two older children in Medicaid and the two younger children in S-SCHIP. This
interaction between programs increases the challenge that states face in explaining the
options available to families and in coordinating coverage between programs when family
circumstances change or when children age out of one program and into another.
The simulation also demonstrates that most of the expansions at the higher levels of
income are through S-SCHIP programs, although in some states, traditional Medicaid
continues to play an important role. In general, when states have opted to expand eligibility
at or above 200 percent of poverty, it has been through separate programs, rather than
through Medicaid expansions. This is reflected in the enrollment patterns, which we turn to
next.
II. State Variations in Eligibility for SCHIP
CHAPTER III
TRENDS IN SCHIP AND MEDICAID
ENROLLMENT
C
onsiderable attention has focused on state progress in enrolling children in
SCHIP. State data show that the SCHIP program is gaining momentum;
enrollment figures for the most recent quarter suggest that as many children were
ever enrolled in the second quarter of federal fiscal year (FFY) 2000 as were ever
enrolled in all of FFY 1999. This section discusses annual and quarterly trends in
SCHIP enrollment and quantifies the extent to which coverage has expanded beyond
traditional Medicaid. This analysis is based on the Statistical Information Management
System (SIMS), a quarterly reporting system for SCHIP (Title XXI) and Medicaid (Title
XIX) enrollment maintained by HCFA. MPR worked closely with states to validate their
data and reconcile inconsistencies as necessary.
ANNUAL SCHIP ENROLLMENT TRENDS
SCHIP enrollment is continuing to increase at an impressive pace. Only about 1 million
children were enrolled in SCHIP in FFY 1998, and a sizeable proportion of these (over one
quarter) transferred to SCHIP from preexisting child health programs.1 In FFY 1999, close
1Florida, New York, and Pennsylvania had preexisting comprehensive child health programs that were
permitted to convert to SCHIP by Title XXI. Estimated enrollment in these pre-SCHIP programs totaled
275,000, with 50,000, 170,000, and 55,000 children, respectively, by state.
26
to 2 million children were enrolled in SCHIP at some point during the year (Table 5).2 Thus,
program enrollment almost doubled in a one-year period as new programs were
implemented and existing programs gained greater public awareness.
The size of individual state SCHIP programs in FFY 1999 varied considerably, ranging
from less than 100 children enrolled in Minnesota’s M-SCHIP program to over 500,000
children enrolled in New York’s S-SCHIP program.3 Several factors can influence program
size, including the relative generosity of the financial criteria used for eligibility, the size of
the potentially eligible population, and program maturity. In Minnesota, for example, the
state’s income threshold for Medicaid children was already at 275 percent of poverty prior to
SCHIP. Minnesota’s M-SCHIP program extended eligibility to a narrow eligibility group
(children ages 0 through 2 with family income from 275 to 280 percent of poverty). In
contrast, New York’s program, which existed before the SCHIP legislation was passed, had
pre-SCHIP enrollment of about 170,000 children, who were subsequently rolled over to
SCHIP. New York’s program uses an income threshold ranging from 100 to 192 percent of
poverty (plus disregards) for children age 6 and older. These factors, coupled with the state’s
large potentially eligible population, have caused New York’s S-SCHIP enrollment to far
surpass other states.
During FFY 1999, SCHIP enrollment was heavily concentrated in the 19 states that
implemented their programs before July 1, 1998. Altogether, the 19 early implementation
states accounted for more than three-fourths of FFY 1999 SCHIP enrollment (1.5 million).
The three states with pre-SCHIP programs (Florida, New York, and Pennsylvania) and thus
the longest period of implementation, accounted for close to forty percent of total SCHIP
enrollment in FFY 1999 (750,000 children). Indeed, the grandfathered programs in Florida
and New York have come close to tripling their enrollments under SCHIP, suggesting that
substantial enrollment growth may occur in other states, as their SCHIP programs mature.
2In
states with combination programs, it is possible that children could be double counted in the total if
they were enrolled in the M-SCHIP program for part of the year and the S-SCHIP program for another part of
the year. In future analyses, MPR will access how often this occurs.
3As this report was being completed, an article by Jennifer Steinhauer in The New York Times (September
30, 2000) suggested that half of New York’s S-SCHIP children were eligible for Medicaid, although some of
these children may have qualified for the state’s M-SCHIP program. This could reduce overall SCHIP
enrollment in FFY1999 by as many as 250,000 children, but increase Medicaid enrollment by the same amount.
However, in the absence of definitive information, we have not changed any of the SCHIP enrollment data
reported by New York to HCFA.
III. Trends in SCHIP and Medicaid Enrollment
TABLE 5
NUMBER OF CHILDREN EVER ENROLLED IN SCHIP, BY STATE AND BY PROGRAM
FOR FEDERAL FISCAL YEAR (FFY) 1999
State
Type of SCHIP
Programa
Date SCHIP Enrollment
Beganb
Total
Number of states reporting
Number Ever Enrolled FFY 1999
S-SCHIP
1,288,932
M-SCHIP
669,230
Totalc
1,958,162
48
Alabama
COMBO
2/2/1998
26,213
13,242
Alaska
M-SCHIP
3/1/1999
-
8,033
8,033
Arizona
S-SCHIP
11/1/1998
26,807
-
26,807
10/1/1998
-
39,455
Arkansas
M-SCHIP
California
COMBO
913
913
3/1/1998
187,854
34,497
222,351
Colorado
S-SCHIP
4/22/1998
Connecticut
COMBO
24,116
5,277
-
24,116
10/1/1997
4,635
Delaware
S-SCHIP
9,912
2/1/1999
2,433
-
District of Columbia
M-SCHIP
2,433
10/1/1998
-
2,180
2,180
Florida
COMBO
4/1/1998
Georgiad
Hawaii
S-SCHIP
1/1/1999
116,123
38,471
154,594
47,584
-
M-SCHIP
7/1/2000
-
NI
47,584
NI
Idaho
M-SCHIP
10/1/1997
-
8,482
8,482
Illinois
COMBO
1/5/1998
7,567
35,132
42,699
Indiana
COMBO
6/1/1997
NI
31,246
31,246
Iowa
COMBO
7/1/1998
2,890
10,398
13,288
Kansas
S-SCHIP
1/1/1999
14,443
-
14,443
Kentucky
COMBO
7/1/1998
NI
Louisiana
M-SCHIP
11/1/1998
-
COMBO
Maine
830
830
21,580
21,580
7/1/1998
3,786
9,871
13,657
Maryland
Massachusetts
M-SCHIP
7/1/1998
-
18,072
18,072
COMBO
10/1/1997
24,408
43,444
67,852
Michigan
COMBO
4/1/1998
14,825
11,827
26,652
Minnesota
M-SCHIP
9/30/1998
-
COMBO
7/1/1998
M-SCHIP
Montana
Nebraska
e
19
19
NR
13,218
13,218
7/1/1998
-
49,529
49,529
S-SCHIP
1/1/1999
1,019
-
1,019
M-SCHIP
7/1/1998
-
9,713
9,713
Nevada
S-SCHIP
10/1/1998
7,573
-
7,573
New Hampshire
COMBO
5/1/1998
3,700
854
4,554
New Jersey
COMBO
2/1/1998
43,824
31,828
75,652
New Mexicod
M-SCHIP
3/1/1999
-
1,908
1,908
New Yorkd
COMBO
4/15/1998
519,401
3,000
522,401
North Carolinad
North Dakota
S-SCHIP
10/1/1998
59,542
-
59,542
COMBO
10/1/1998
NI
Mississippi
Missouri
f
266
266
TABLE 5 (continued)
Number Ever Enrolled FFY 1999
Type of SCHIP
Programa
M-SCHIP
Date SCHIP Enrollment
Beganb
Oklahoma
M-SCHIP
12/1/1997
-
40,196
40,196
Oregon
S-SCHIP
7/1/1998
27,285
-
27,285
Pennsylvania
S-SCHIP
5/28/1998
81,758
-
81,758
State
Ohio
1/1/1998
S-SCHIP
-
M-SCHIP
83,688
Totalc
83,688
Rhode Island
M-SCHIP
10/1/1997
-
7,288
7,288
South Carolina
M-SCHIP
8/1/1997
-
56,819
56,819
South Dakota
M-SCHIP
7/1/1998
-
3,191
3,191
Tennessee
M-SCHIP
10/1/1997
-
9,732
9,732
Texas
M-SCHIP
7/1/1998
-
50,878
50,878
Utah
S-SCHIP
8/3/1998
14,898
-
14,898
Vermont
S-SCHIP
10/1/1998
2,055
-
2,055
Virginia
S-SCHIP
10/26/1998
16,895
-
16,895
Washington
S-SCHIP
2/1/2000
NI
-
NI
West Virginia
COMBO
7/1/1998
6,656
1,301
7,957
Wisconsin
M-SCHIP
4/1/1999
-
12,949
12,949
Wyoming
S-SCHIP
12/1/1999
NI
-
NI
SOURCE: Mathematica Policy Research analysis of HCFA's Statistical Information Management System (SIMS) as of June 27, 2000.
NI = State's SCHIP program was not implemented in FFY 1999. Hawaii, Washington and Wyoming did not implement their SCHIP
programs until FFY 2000. Indiana, Kentucky, and North Dakota had active M-SCHIP programs in FFY 1999, but did not implement
their S-SCHIP programs until FFY 2000.
NR = State has not yet reported SCHIP enrollment to HCFA.
a
The type of SCHIP program is as of March 31, 2000.
b
The date enrollment began is taken from the state evaluations submitted by states to HCFA in spring 2000.
c
In states with combination programs, it is possible that children could be double counted in the total if they were enrolled in the MSCHIP program for part of the year and in the S-SCHIP program for another part of the year.
d
The enrollment data are from HCFA's SIMS system as of June 27, 2000, with a few exceptions. The data for Georgia, New Mexico, and
North Carolina came from the state evaluations submitted to HCFA in spring 2000. In addition, New York's M-SCHIP data were
provided directly by the state.
e
In July 2000, Maryland was authorized to claim enhanced match retroactively for children covered under the state's Section 1115
demonstration program. The revised SCHIP enrollment count for the number ever enrolled in FFY 1999 is 69,452.
f
Mississippi has not yet reported on its S-SCHIP program.
29
QUARTERLY SCHIP ENROLLMENT PATTERNS FOR FFY 1999
HCFA’s SCHIP reporting system also captures information on the number of children
ever enrolled in SCHIP for each quarter. Appendix C includes quarterly enrollment data by
state from the first quarter of FFY 1998, through the second quarter of FFY 2000. As a
result of program turnover, the number ever enrolled in any single quarter during a year is
always expected to be less than the number ever enrolled at any point during that year.
The number of children ever enrolled in the fourth quarter of FFY 1999 was about 1.6
million (Table 6), compared to 2.0 million children ever enrolled during the year (Table 5).
This suggests a turnover rate of about 18 percent for the year (if we calculate program
turnover by dividing the number of children ever enrolled in the fourth quarter by the
number of children ever enrolled for the year). Stated another way, about 350,000 children
were enrolled in SCHIP at some point during the first three quarters of FFY 1999 who were
not enrolled during the fourth quarter. However, numerous states mentioned that the most
common reason for children disenrolling from SCHIP was that family circumstances had
changed, making children eligible for traditional Medicaid instead of SCHIP. Thus, many
children who disenrolled from SCHIP may not have lost their public insurance status—they
may have simply transferred from SCHIP to Medicaid. Some children may also have gained
private insurance coverage. States also mentioned that some level of program turnover is
explained by older children who “aged out” of the SCHIP program. In addition, turnover
can occur when family income exceeds SCHIP income thresholds, or families fail to meet
other redetermination requirements. In states that charge premiums, families that are not upto-date in their premium payments may lose eligibility.
Several states reported in their evaluations that their SCHIP turnover rates were lower
than they experience with children in their traditional Medicaid programs. For example,
South Carolina reported a disenrollment rate of 8.6 percent for its SCHIP program in FFY
1999, compared to an 11.1 percent rate for Medicaid. South Carolina attributed its low
turnover in part to the state’s guarantee of continuous eligibility for a 12 month period—a
policy adopted by SCHIP programs in 25 states. However, states were not always clear about
how they were calculating disenrollment in their evaluation reports, so a more thorough
analysis is needed before any definitive conclusions can be reached about SCHIP turnover.
In addition, many states had not yet faced annual redeterminations for their SCHIP
programs.
As part of our evaluation activities in the coming year, MPR staff will be applying a
uniform methodology for determining turnover rates across states for both their SCHIP and
traditional Medicaid programs, using person-based data from HCFA’s Medicaid Statistical
Information System (MSIS). This will enable us to differentiate the extent of disenrollment
or turnover caused by transfers between SCHIP and Medicaid, versus disenrollment in
which children leave publicly insured coverage altogether.
III. Trends in SCHIP and Medicaid Enrollment
TABLE 6
NUMBER OF CHILDREN EVER ENROLLED IN SCHIP BY STATE FROM SECOND
QUARTER OF FFY1999 THROUGH SECOND QUARTER OF FFY 2000
Type of SCHIP
Programa
Date SCHIP
Enrollment Beganb
COMBO
M-SCHIP
S-SCHIP
M-SCHIP
COMBO
S-SCHIP
COMBO
S-SCHIP
M-SCHIP
COMBO
S-SCHIP
M-SCHIP
M-SCHIP
COMBO
COMBO
COMBO
S-SCHIP
COMBO
M-SCHIP
COMBO
M-SCHIP
COMBO
COMBO
M-SCHIP
COMBO
M-SCHIP
S-SCHIP
M-SCHIP
S-SCHIP
COMBO
2/2/1998
3/1/1999
11/1/1998
10/1/1998
3/1/1998
4/22/1998
10/1/1997
2/1/1999
10/1/1998
4/1/1998
1/1/1999
7/1/2000
10/1/1997
1/5/1998
6/1/1997
7/1/1998
1/1/1999
7/1/1998
11/1/1998
7/1/1998
7/1/1998
10/1/1997
4/1/1998
9/30/1998
7/1/1998
7/1/1998
1/1/1999
7/1/1998
10/1/1998
5/1/1998
State
Total
Number of states reporting
Alabama
Alaska
Arizona
Arkansasd
Californiac
Colorado
Connecticutc
Delaware
District of Columbia
Florida
Georgiae
Hawaii
Idaho
Illinois
Indianae
Iowa
Kansas
Kentucky
Louisianag
Maine
Marylandh
Massachusetts
Michigang
Minnesota
Mississippic
Missouri
Montana
Nebraskag
Nevada
New Hampshire
Number Ever Enrolledc
Second Quarter
Fourth Quarter
Second Quarter
FFY 1999
FFY 1999
FFY 2000
1,129,606
1,608,383
1,809,005
44
46
38
17,532
2,274
11,445
NR
87,587
15,135
2,860
816
1,317
78,827
17,433
NI
4,672
28,750
27,063
6,926
7,955
6,753
12,503
8,247
12,889
41,380
14,484
15
9,719
34,104
948
5,164
4,436
1,219
26,213
7,936
19,924
913
178,791
20,932
4,478
2,565
1,964
128,432
45,789
NI
5,285
39,099
30,647
9,896
13,882
27,766
20,504
10,180
16,657
55,028
21,052
6
10,872
44,190
924
6,925
7,190
2,053
26,866
NR
34,958
1,140
265,402
33,114
5,264
6,552
1,914
155,969
74,337
NI
7,450
50,189
NR
11,877
18,345
73,595
29,400
12,594
16,554
67,087
NR
NR
NR
55,529
3,949
7,382
9,016
2,953
Percent Change Between
Second Quarter FFY 1999
Fourth Quarter FFY 1999
and
and
Second Quarter FFY 2000
Second Quarter FFY 2000
89.6%
29.1%
35
37
53.2%
205.4%
203.0%
118.8%
84.1%
702.9%
45.3%
97.9%
326.4%
59.5%
74.6%
71.5%
130.6%
989.8%
135.1%
52.7%
28.4%
62.1%
62.8%
316.6%
43.0%
103.2%
142.2%
2.5%
75.5%
24.9%
48.4%
58.2%
17.6%
155.4%
-2.5%
21.4%
62.3%
41.0%
28.4%
20.0%
32.1%
165.1%
43.4%
23.7%
-0.6%
21.9%
25.7%
327.4%
6.6%
25.4%
43.8%
TABLE 6 (continued)
State
New Jerseyg
New Mexico
New Yorkd, g
North Carolina
North Dakotae
Ohio
Oklahoma
Oregon
Pennsylvaniae
Rhode Island
South Carolina
South Dakota
Tennesseec
Texasf
Utah
Vermont
Virginia
Washington
West Virginia
Wisconsin
Wyoming
Type of SCHIP
Programa
Date SCHIP
Enrollment Beganb
COMBO
M-SCHIP
COMBO
S-SCHIP
COMBO
2/1/1998
3/1/1999
4/15/1998
10/1/1998
10/1/1998
Second Quarter
FFY 1999
31,645
NI
330,741
33,835
135
M-SCHIP
M-SCHIP
S-SCHIP
S-SCHIP
M-SCHIP
M-SCHIP
M-SCHIP
M-SCHIP
M-SCHIP
S-SCHIP
S-SCHIP
S-SCHIP
S-SCHIP
COMBO
M-SCHIP
S-SCHIP
1/1/1998
12/1/1997
7/1/1998
5/28/1998
10/1/1997
8/1/1997
7/1/1998
10/1/1997
7/1/1998
8/3/1998
10/1/1998
10/26/1998
2/1/2000
7/1/1998
4/1/1999
12/1/1999
51,637
22,651
15,803
74,046
4,055
42,813
1,827
NR
40,358
8,117
907
8,145
NI
438
NI
NI
Number Ever Enrolledc
Fourth Quarter
Second Quarter
FFY 1999
FFY 2000
46,653
65,896
1,736
3,705
438,421
511,787
57,420
69,996
134
1,491
60,985
NR
17,472
82,893
5,752
49,469
2,696
NR
34,980
13,697
1,483
14,580
NI
7,569
12,350
NI
Percent Change Between
Second Quarter FFY 1999
Fourth Quarter FFY 1999
and
and
Second Quarter FFY 2000
Second Quarter FFY 2000
108.2%
41.2%
113.4%
54.7%
16.7%
106.9%
21.9%
1004.4%
1012.7%
NR
NR
21,266
89,610
7,278
NR
3,391
NR
30,353
17,028
2,218
NR
NI
12,280
NR
1,270
34.6%
21.0%
79.5%
85.6%
-24.8%
109.8%
144.5%
2703.7%
-
21.7%
8.1%
26.5%
25.8%
-13.2%
24.3%
49.6%
62.2%
-
SOURCE: Mathematica Policy Research analysis of HCFA's Statistical Information Management System (SIMS) as of June 27, 2000.
NI = State's SCHIP program was not implemented in FFY 1999. Hawaii, Washington, and Wyoming did not implement their SCHIP programs until FFY 2000. Indiana, Kentucky, and North
Dakota had active M-SCHIP programs in FFY 1999, but did not implement their S-SCHIP programs until FFY 2000.
NR = State has not yet reported SCHIP enrollment to HCFA, or, if noted, the reported data have not been included due to inconsistencies.
a
The type of SCHIP program is as of March 31, 2000.
b
The date enrollment began is taken from the state evaluations submitted by states to HCFA in spring 2000.
c
Data for the following state programs are not reported, since the quarterly data the states have provided to HCFA are not complete or appear to have inconsistencies: California M-SCHIP,
Connecticut M- SCHIP, Mississippi M-SCHIP, and Tennessee M-SCHIP.
d
Because Arkansas and New York did not report any quarterly M-SCHIP enrollment for the fourth quarter of FFY 1999, data shown here are the ever enrolled in FFY 1999. However, the
number ever enrolled for the year is usually higher than the number ever enrolled for the quarter. MPR did not include Arkansas M-SCHIP data for Q1 1999 through Q3 1999 due to data
inconsistencies.
e
Data for the first quarter of FFY2000 were imputed averaging data from the fourth quarter of FFY1999 and the second quarter of FFY 2000 for the following states: Georgia S-SCHIP, North
Dakota M-SCHIP, and Pennsylvania S-SCHIP. MPR also imputed Pennsylvania's data for Q2 1999 by averaging data from Q1 1999 and Q3 1999.
f
Enrollment in the Texas M-SCHIP program declined because children aged out of M-SCHIP and onto traditional Medicaid. The S-SCHIP program in Texas began in the third quarter of FFY
2000; however, no enrollment data have been reported to HCFA. Beginning in the third quarter of FFY 2000, the type of program for Texas will change to COMBO.
g
The enrollment data are taken from HCFA's SIMS system as of June 27, 2000, for all states except Louisiana, Michigan, Nebraska, New Jersey, and New York. For these states, MPR received
the following data directly: Louisiana Q2 1999 and Q2 2000 M-SCHIP; Michigan Q1 2000 S-SCHIP; Nebraska Q1 2000 M-SCHIP; New Jersey Q2 1999 through Q2 2000 all SCHIP data; and
New York Q1 2000 and Q2 2000 M-SCHIP.
h
In July 2000, Maryland was authorized to claim enhanced match retroactively for children covered under the state's Section 1115 demonstration program. Revised SCHIP enrollment counts
are as follows: 29,054 (second quarter, FFY 1999); 63,016 (fourth quarter, FFY 1999); and 74,437 (second quarter, FFY 2000).
32
QUARTERLY SCHIP ENROLLMENT PATTERNS FOR FFY 2000
Preliminary data for the first two quarters of FFY 2000, also shown in Table 6, indicate
that the number of children covered by SCHIP programs is still increasing at a substantial
rate and that program enrollment has not yet reached a plateau. As of June 27, 2000, 37
states had submitted enrollment data for both the fourth quarter of FFY 1999 and the
second quarter of FFY 2000. Overall enrollment for these 37 states increased by 29 percent
from the fourth quarter of FFY 1999 to the second quarter of FFY 2000.
Several states are reporting extraordinary rates of growth from the last quarter of FFY
1999 through the second quarter of FFY 2000. During this six-month period, SCHIP
enrollment grew by 50 percent or more in 10 states (Arizona, Colorado, Delaware, Georgia,
Kentucky, Montana, New Mexico, North Dakota, Vermont, and West Virginia). About 11
states have not yet reported their second quarter data for FFY 2000, so this assessment is
based on partial data. If we compare enrollment in the second quarter of FFY 2000 to that
in the second quarter of FFY 1999, or one year back, an even larger group of states
experienced high growth rates. Over this one year period, SCHIP enrollment more than
doubled in 17 states. Variation in growth rates across states may be a function of recent
eligibility expansions, outreach initiatives or simplification efforts, or other features of
program implementation.
After making some conservative assumptions about the enrollment levels for states not
yet reporting, we estimate that total SCHIP enrollment for the quarter ending March 31,
2000 reached at least 2.1 million children, an increase of at least 27 percent from the fourth
quarter of FFY 1999 (Figure 3).4 S-SCHIP programs continue to expand at a faster rate than
M-SCHIP programs. These projections suggest S-SCHIP enrollment in the second quarter
of FFY 2000 had increased by at least 31 percent from the fourth quarter of FFY 1999,
while overall M-SCHIP enrollment increased by at least 17 percent over this six-month
period.
ANNUAL MEDICAID ENROLLMENT PATTERNS FOR CHILDREN
SCHIP programs are prohibited from enrolling children who qualify under traditional
Medicaid eligibility rules. Title XXI requires states to screen SCHIP applicants to see if they
qualify for coverage under the traditional Medicaid program and enroll eligible children in
Medicaid. As a result, SCHIP outreach and recruitment were expected to have a spillover
4This
estimate is based on actual enrollment data for the states reporting complete information and, in the
states not yet reporting, we assumed no additional SCHIP enrollment growth beyond the fourth quarter of
FFY 1999. In addition, quarterly M-SCHIP data were not available for California, Connecticut, Hawaii and
Tennessee, and quarterly S-SCHIP data were not available for Mississippi or Washington. Thus, this is a very
conservative estimate.
III. Trends in SCHIP and Medicaid Enrollment
FIGURE 3
TOTAL SCHIP, M-SCHIP, AND S-SCHIP ENROLLMENT
FROM QUARTER 2, FFY1998 THROUGH QUARTER 2, FFY 2000
2,500,000
Number Ever Enrolled
2,000,000
Total SCHIP Enrollment
S-SCHIP Enrollment
M-SCHIP Enrollment
Projected Enrollment
1,500,000
1,000,000
500,000
0
Q2 98
Q3 98
Q4 98
Q1 99
Q2 99
Q3 99
Q4 99
Q1 00
Q2 00
SOURCE: Mathematica Policy Research analysis of HCFA's Statistical Information Management System.
NOTE: For states not yet reporting enrollment in the first and second quarters of FFY 2000, enrollment was projected using data from the most recent quarter.
Neither actual nor projected data are included for M-SCHIP programs in California, Connecticut, Hawaii, and Tennessee, nor for S-SCHIP programs in
Mississippi and Washington.
34
effect that might help stem annual declines in Medicaid child enrollment that began to occur
in many states around 1995 and 1996 (Ellwood and Ku 1998).
As part of their SCHIP reporting through SIMS, states are required to provide data on
child enrollment in traditional Medicaid to HCFA, including the number ever enrolled by
year and the number ever enrolled by quarter.5 The counts of Medicaid children ever
enrolled during the year reported into the SIMS system differ somewhat from the counts of
children ever enrolled in Medicaid during the year under the HCFA-2082 report. SIMS data
are supposed to be limited to Medicaid children under age 19, while HCFA-2082 data for
states can include children through age 20 (states have the option of covering children under
Medicaid through age 20). Thus, SIMS counts of Medicaid children may understate the
number of children ever enrolled in Medicaid for a year, compared to the HCFA-2082
report.
In FFY 1999, about 19.7 million children under age 19 were ever enrolled in the
traditional Medicaid program according to the SIMS data, with five states not reporting
(Table 7).6 In FFY 1997, the five states not yet reporting enrolled just under 0.8 million
children, according to HCFA-2082 data. If these states have been able to maintain threefourths of their FFY 1997 child enrollment levels for Medicaid (0.6 million children), we
estimate that traditional Medicaid enrollment for children under age 19 reached 20.3 million
in FFY 1999. If we add the 0.7 million children enrolled in M-SCHIP, 21 million children
under age 19 were enrolled in Medicaid in FFY 1999.7
HCFA-2082 data for FFY 1995, 1996 and 1997 showed Medicaid enrollment for
children to be 21.6, 21.2 and 21.0 million, respectively (Ku and Bruen 1999).8 We estimate
Medicaid child enrollment in FFY 1999 using SIMS data reached 21 million (including MSCHIP children). Based on the SIMS data, it appears that the FFY 1999 enrollment levels
for Medicaid children (when they are eventually published in an edited form from the
HCFA-2082 report) will equal and may exceed the FFY 1997 level. If Medicaid child
enrollment does finally stabilize in FFY 1999, it is important to note that the 0.7 million
children enrolled in Medicaid as a result of M-SCHIP may have made a critical difference.
In addition, anecdotal reports from states indicate that SCHIP outreach and coordination
efforts have been important to maintaining or even increasing enrollment in the traditional
Medicaid groups, since the SCHIP screening process determines that many children are
eligible for traditional Medicaid when they apply for SCHIP.
5This
reporting is in addition to the routine HCFA-2082 reporting for Medicaid.
not reporting child Medicaid enrollment data for FFY 1999 into SIMS include Hawaii, Idaho, New
Hampshire, Washington, and Wyoming.
7HCFA instructions indicate that M-SCHIP children are not supposed to be included in the Medicaid
counts.
8HCFA-2082 data for FFY 1998 are not yet available in the edited time-series on enrollment produced by
the Urban Institute.
6States
III. Trends in SCHIP and Medicaid Enrollment
TABLE 7
NUMBER OF CHILDREN EVER ENROLLED IN MEDICAID AND SCHIP, BY STATE FOR FEDERAL
FISCAL YEAR (FFY) 1999
State
Total
Number of states reporting
Type of SCHIP
Programa
Date SCHIP Enrollment
Beganb
Number Ever Enrolled FFY 1999
Medicaid
SCHIP
19,668,711
1,958,162
46
48
SCHIP Ever Enrolled as a
Percent of Medicaid Ever
Enrolled
9.9%
46
Alabama
COMBO
2/2/1998
242,732
39,455
16.3%
Alaska
M-SCHIP
3/1/1999
53,421
8,033
15.0%
Arizona
S-SCHIP
11/1/1998
387,213
26,807
6.9%
Arkansas
M-SCHIP
10/1/1998
155,504
913
0.6%
California
COMBO
3/1/1998
3,263,848
222,351
6.8%
Colorado
S-SCHIP
4/22/1998
195,217
24,116
12.4%
Connecticut
COMBO
10/1/1997
167,892
9,912
5.9%
Delaware
S-SCHIP
2/1/1999
52,617
2,433
4.6%
District of Columbia
M-SCHIP
10/1/1998
74,522
2,180
2.9%
Florida
COMBO
4/1/1998
1,067,409
154,594
14.5%
4.8%
Georgiac
S-SCHIP
1/1/1999
986,566
47,584
Hawaii
M-SCHIP
7/1/2000
NR
NI
Idaho
M-SCHIP
10/1/1997
NR
8,482
-
Illinois
COMBO
1/5/1998
896,115
42,699
4.8%
Indiana
COMBO
6/1/1997
342,666
31,246
9.1%
Iowa
COMBO
7/1/1998
147,496
13,288
9.0%
-
Kansas
S-SCHIP
1/1/1999
144,415
14,443
10.0%
Kentucky
COMBO
7/1/1998
312,171
830
0.3%
Louisiana
M-SCHIP
11/1/1998
425,592
21,580
5.1%
Maine
COMBO
7/1/1998
90,000
13,657
15.2%
Marylandd
M-SCHIP
7/1/1998
325,983
18,072
5.5%
Massachusetts
COMBO
10/1/1997
448,403
67,852
15.1%
Michigan
COMBO
4/1/1998
749,683
26,652
3.6%
Minnesota
M-SCHIP
9/30/1998
301,987
19
0.0%
Mississippie
COMBO
7/1/1998
339,861
13,218
3.9%
Missouri
M-SCHIP
7/1/1998
404,817
49,529
12.2%
Montana
S-SCHIP
1/1/1999
69,313
1,019
1.5%
Nebraska
M-SCHIP
7/1/1998
124,194
9,713
7.8%
Nevada
S-SCHIP
10/1/1998
84,960
7,573
8.9%
New Hampshire
COMBO
5/1/1998
NR
4,554
-
New Jersey
COMBO
2/1/1998
413,756
75,652
18.3%
New Mexicoc
M-SCHIP
3/1/1999
248,181
1,908
0.8%
New Yorkc
COMBO
4/15/1998
972,188
522,401
53.7%
North Carolinac
S-SCHIP
10/1/1998
642,500
59,542
9.3%
North Dakota
COMBO
10/1/1998
29,517
266
0.9%
TABLE 7 (continued)
State
Type of SCHIP
Programa
Date SCHIP Enrollment
Beganb
Number Ever Enrolled FFY 1999
Medicaid
SCHIP
SCHIP Ever Enrolled as a
Percent of Medicaid Ever
Enrolled
Ohio
M-SCHIP
1/1/1998
610,851
83,688
13.7%
Oklahoma
Oregon
M-SCHIP
S-SCHIP
12/1/1997
7/1/1998
60,772
238,339
40,196
27,285
66.1%
11.4%
Pennsylvania
S-SCHIP
5/28/1998
813,407
81,758
10.1%
Rhode Island
M-SCHIP
10/1/1997
67,706
7,288
10.8%
South Carolina
M-SCHIP
8/1/1997
353,245
56,819
16.1%
South Dakota
M-SCHIP
7/1/1998
28,463
3,191
11.2%
Tennessee
M-SCHIP
10/1/1997
637,141
9,732
1.5%
Texas
M-SCHIP
7/1/1998
1,585,918
50,878
3.2%
Utah
S-SCHIP
8/3/1998
206,255
14,898
7.2%
Vermont
S-SCHIP
10/1/1998
60,286
2,055
3.4%
Virginia
S-SCHIP
10/26/1998
370,163
16,895
4.6%
Washington
S-SCHIP
2/1/2000
NR
NI
West Virginia
COMBO
7/1/1998
193,264
7,957
4.1%
Wisconsin
M-SCHIP
4/1/1999
282,162
12,949
4.6%
Wyoming
S-SCHIP
12/1/1999
NR
NI
-
-
SOURCE: Mathematica Policy Research analysis of HCFA's Statistical Information Management System (SIMS) as of June 27, 2000.
NI = State's SCHIP program was not implemented in FFY 1999. Hawaii, Washington, and Wyoming did not implement their SCHIP
programs until FFY 2000. Indiana, Kentucky, and North Dakota had active M-SCHIP programs in FFY 1999, but did not implement
their S-SCHIP programs until FFY 2000.
NR = State has not yet reported any Medicaid or SCHIP enrollment to HCFA. Hawaii, Idaho, New Hampshire, Washington, and
Wyoming have not reported child Medicaid enrollment for FFY1999.
a
The type of SCHIP program is as of March 31, 2000.
b
The date enrollment began is taken from the state evaluations submitted by states to HCFA in spring 2000.
c
The enrollment data are from HCFA's SIMS system as of June 27, 2000, with a few exceptions. The data for Georgia, New Mexico and
North Carolina came from the state evaluations submitted to HCFA in spring 2000. In addition, New York's M-SCHIP data were
provided directly by the state.
d
In July 2000, Maryland was authorized to claim enhanced match retroactively for children enrolled in the state's Section 1115
demonstration program. Revised enrollment counts for the number ever enrolled in Medicaid and SCHIP are 279,284 and 69,452,
respectively.
e
Mississippi has not yet reported on its S-SCHIP program.
37
State Highlight: Measuring the Effect of SCHIP on Traditional
Medicaid Enrollment
New Jersey estimates that, as of September 30, 1999, more than
22,000 children were enrolled in Medicaid as a result of the NJ
KidCare program publicity and outreach. The state constructed a
monthly Medicaid eligibility database of new enrollments from
January 1993 through July 1998 and found that, during the five
years prior to SCHIP, April enrollment was 7 to 8 percent greater
than the level during the same month in the previous year. In April
1998, after SCHIP began, enrollment was 28 percent greater than
the previous April.
This difference was trended forward to
September 1999. Adding the 22,133 new Medicaid enrollees to the
42,100 SCHIP enrollees raises the total new enrollment attributable
to SCHIP by more than 50 percent, to 64,233.
EXTENT OF SCHIP EXPANSION BEYOND MEDICAID
One measure of the effect of the SCHIP program is the extent to which the number of
children who are publicly insured in each state has grown beyond those covered by the
traditional Medicaid program. We calculate this measure by dividing the number of children
enrolled in SCHIP by the number of children enrolled in the traditional Medicaid program
for a state. This approach no doubt underestimates the effect of SCHIP, since outreach
efforts for SCHIP may have boosted Medicaid enrollment (the denominator). Nevertheless,
this measure is useful in assessing SCHIP impacts.
Table 7 shows that, in FFY 1999, SCHIP extended federally financed child health
insurance coverage beyond traditional Medicaid by 10 percent nationally.9 In FFY 1999, just
over 20 million children under age 19 were enrolled in traditional Medicaid, while the SCHIP
programs accounted for another 2 million children. Several states reported extraordinary
extensions of coverage through SCHIP. The most dramatic example is Oklahoma, where
60,772 children were covered under its traditional Medicaid program in FFY 1999, and an
additional 40,196 children were covered as a result of its M-SCHIP program. Thus, in
Oklahoma, 66 percent more children were covered as a result of SCHIP than would have
been covered by traditional Medicaid alone. Other states with major expansions beyond
9If we adjusted for the children who were publicly insured in Florida, New York and Pennsylvania prior
to the implementation of SCHIP, the extent of public coverage beyond traditional Medicaid at the national
level would be 8.5 percent, instead of 9.9 percent in FFY 1999.
III. Trends in SCHIP and Medicaid Enrollment
38
Medicaid include New York (53.7 percent increase in coverage), New Jersey (18.3 percent),
Alabama (16.3 percent), South Carolina (16.1 percent), Maine (15.2 percent), Massachusetts
(15.1 percent), and Alaska (15.0 percent). Six of these eight states were in the group that
implemented their programs before July 1, 1998. Five of these eight states had both MSCHIP and S-SCHIP programs, while three had only M-SCHIP programs.
At the other end of the spectrum, SCHIP enrollment in eight states appears to have had
a negligible effect on total enrollment at least through FFY 1999, with enrollment expanding
by less than 3 percent relative to Medicaid. These states include Minnesota (0.0 percent
beyond Medicaid), Kentucky (0.3 percent), Arkansas (0.6 percent), New Mexico (0.8
percent), North Dakota (0.9 percent), Montana (1.5 percent), Tennessee (1.5 percent), and
the District of Columbia (2.9 percent). However, these data have to be interpreted with
caution, since several of these states had already undertaken major expansions to their
traditional Medicaid programs prior to SCHIP (through Section 1115 demonstrations or
Section 1931 changes), including Arkansas, Minnesota, and Tennessee. Additionally, SCHIP
enrollment from the fourth quarter of FFY 1999 through the second quarter of FFY 2000
increased substantially in four of these states--Kentucky (165.1 percent), Montana (327.4
percent), New Mexico (113.4 percent), and North Dakota (1,012.7 percent). The dramatic
growth in Kentucky and North Dakota occurred in part because they began to implement SSCHIP programs, in addition to their M-SCHIP programs.
CONCLUSION
The SCHIP program is beginning to hit its stride now that all 50 states and the District
of Columbia have begun enrolling children in SCHIP, and several have expanded eligibility
to reach a larger segment of the uninsured population. We will continue to track enrollment
in SCHIP and Medicaid on a quarterly basis, to document aggregate trends. Future reports
also will provide a more in-depth assessment of enrollment in SCHIP and Medicaid based
on MSIS. Analyses will focus on the dynamics of eligibility across states and programs,
including continuity of coverage and turnover. As mentioned earlier, we also will examine
the extent of transfers between programs and, where possible, examine the extent to which
transfers occur between Medicaid programs (either traditional Medicaid or M-SCHIP) and SSCHIP programs. In addition, we will track patterns of new enrollment and disenrollment
across states and programs.
III. Trends in SCHIP and Medicaid Enrollment
39
CHAPTER IV
TRENDS IN THE NUMBER OF UNINSURED
CHILDREN BEFORE AND AFTER SCHIP
A
s we have just seen, SCHIP enrollment continues to grow at a steady pace. One
issue of great interest to policymakers is whether the growth in SCHIP
enrollment is producing a measurable reduction in the number of uninsured
children or whether the enrollment growth is being offset by losses in coverage
elsewhere, including a substitution of public for private coverage. The possibility of a
substitution effect is a particular concern in the states with broad expansions that target
families with incomes above 200 percent of poverty (as seen, for example, in Table 4). A
fundamental measure of the effectiveness of SCHIP is the extent to which SCHIP has
reduced the proportion of low-income children without health insurance. A related measure
is the distribution of health insurance coverage among low-income children, to ensure that
children eligible for Medicaid are enrolled and that children who are covered by employersponsored insurance (ESI) maintain that coverage, rather than substituting SCHIP for other
coverage.
Change in health insurance status is difficult to measure. Not only are there widespread
concerns about the accuracy of self-reports on the presence and type of coverage, but,
because aggregate coverage tends to change slowly, several years of data may be required to
ascertain the direction and magnitude of any trends. Moreover, very large sample sizes are
required to produce reliable estimates of effects within the target population, even at the
national level. At the State level, existing sample sizes are generally inadequate to support
precise estimates of coverage even for all children. Due to lag times in data collection and
dissemination, only limited evidence is available at this time to shed light on the early effects
of SCHIP on health insurance coverage among low-income children.
40
This chapter focuses on three questions:
1. What national trends, if any, were evident in the percentage of children who were
without health insurance prior to the implementation of SCHIP?
2. Is there any evidence that these trends have been altered or interrupted during early
implementation of SCHIP?
3. How has the source of health insurance coverage changed during the early
implementation of SCHIP?
DATA AND METHODS
This analysis is based on the Current Population Survey (CPS), a monthly survey whose
primary purpose is to measure labor force participation at the national and state levels. The
March supplement gathers information on health insurance coverage of the general
population.1 Because the March CPS provides annual measures of the health insurance
coverage of the population, and because the data are released within six months of their
collection, the CPS has become the most widely cited source of estimates of the size and
characteristics of the uninsured population.
The time series for this analysis is from 1993 through 1998, as measured in the March
CPS of the subsequent year.2 This analysis uses 1997 data (based on the March 1998 CPS) as
the baseline year for determining the effect of SCHIP. Although SCHIP went into effect
during late 1997, most states began enrolling children in mid-1998 or later. Currently, we
have only one year of post-SCHIP data (corresponding to the 1998 reference year).
1The March supplement also is the source of the federal government’s official annual estimates of the
incidence of poverty in the United States.
2We start our series at 1993 because the March 1994 CPS, the source of the 1993 estimates, was the first
to use population weights based on the 1990 census, and the introduction of the new census data has been
shown to affect estimates of the uninsured (Fronstin 1997). The CPS health insurance questions changed with
the March 1996 data release, but the major impact of these changes is seen in the distribution of coverage
between employer-sponsored insurance and a residual “other insurance” category. The effect of the new
questions on estimates of the uninsured has been shown to be negligible (Fronstin 1997).
IV. Trends in the Number of Uninsured Children Before and After SCHIP
41
Classification of Insurance Coverage
Taking into account the Census Bureau’s edits, all insurance coverage reported in the
March CPS is assigned to one or more of the following sources: (1) coverage by a current or
former employer or union, which may be paying all, part, or none of the cost of premiums;
(2) coverage purchased directly by the insured; (3) CHAMPUS, CHAMPVA, or military
coverage; (4) Medicare; (5) Medicaid, including “other government coverage”; or (6)
coverage obtained from someone living in another household and which cannot be assigned
to any of the previous sources.
Because the CPS asks the respondent to report every source of coverage during the
previous calendar year, a respondent or child may be recorded as having several different
sources of coverage. To simplify our description of the sources of coverage, we created a
hierarchical classification that, with one exception, assigns coverage to only one source. The
classification includes the following:
!" Medicaid
without employer-sponsored insurance (ESI)
!" ESI without
Medicaid
!" Medicaid
and ESI
!" Privately
purchased coverage
!" CHAMPUS,
CHAMPVA, or military coverage
!" Medicare
!" Source
unknown (coverage provided by someone outside the household)
Children were assigned to the first category for which they qualified. Children who could
not be assigned to any of the sources of coverage were classified as uninsured.3
Caveats About Measurement of the Uninsured
The CPS is widely used for estimates and analysis of health insurance coverage despite
certain well-known limitations in the data (Lewis et al. 1998). The three main concerns are,
first, that the uninsured are measured only indirectly; second, that there is uncertainty about
the reference period of the uninsured episode; and third, that the CPS undercounts by as
3Beginning with the March 1998 CPS, the Census Bureau has removed the Indian Health Service from
the sources of coverage that identify persons as insured. A person with only Indian Health Service coverage is
now classified as uninsured. We have maintained that convention.
IV. Trends in the Number of Uninsured Children Before and After SCHIP
42
much as a third the number of children enrolled in Medicaid. The annual estimates of
insurance coverage, collected in March of each year, are intended to refer to the previous
calendar year. Respondents are asked to indicate whether they were ever covered by specific
types of health insurance during that period. Those who do not report that they had any
type of insurance coverage during the year are counted as uninsured, but they are never
asked if they were indeed uninsured. Those who report that they had no insurance coverage
were, in theory, uninsured for the entire year. Yet the magnitude of the estimated number of
uninsured children lies close to alternative survey estimates of the number who are
uninsured at a point in time, or roughly twice the number estimated to be uninsured for an
entire year.4 As a result, the estimates of uninsured children from the CPS are commonly
interpreted as describing the number who are uninsured at a point in time.
The Medicaid undercount in the CPS has always been a problem but it is getting worse.
Although there have been widespread reports of declining Medicaid enrollment (Ellwood
and Ku 1998), the CPS counts of Medicaid coverage are declining much more significantly
than the HCFA counts. As a percentage of the HCFA estimate, the CPS estimate fell from
83 percent in 1993 to 68 percent in 1998, and the gap between the estimates grew by nearly 3
million children. If a third of Medicaid children are not counted under Medicaid, where are
they counted? Unfortunately, the answer to this question is unknown, making it difficult to
assess how the continuing growth in the undercount may affect observed trends in the
uninsured population.
The indirect measurement of the uninsured, the uncertainty about the reference period,
and the size of the Medicaid undercount pose obstacles for analyses of the effects of SCHIP,
especially those concerning changes in the number and characteristics of uninsured children.5
TRENDS AMONG THE UNINSURED
Table 8 reports the trend from 1993 to 1998, in the number and percentage of children
under age 19 without health insurance.6 Because SCHIP expands coverage differentially
4These estimates were derived from the Survey of Income and Program Participation (SIPP), a
longitudinal survey much better suited than the CPS to measuring the incidence and duration of spells without
insurance.
5In future work under this project we hope to document both the strengths and limitations of the CPS
estimates of insurance coverage by conducting comparative analysis with the National Health Interview Survey
(NHIS), an annual survey which measures insurance coverage as of the survey date.
6The universe is the civilian, noninstitutionalized population under the age of 19 (at the time of the
survey, the following March).
IV. Trends in the Number of Uninsured Children Before and After SCHIP
TABLE 8
NUMBER AND PERCENTAGE OF CHILDREN WITHOUT HEALTH INSURANCE,
BY POVERTY LEVEL, 1993 THROUGH 1998
Reference Year of Survey
Poverty Level
(Percent of FPL)
Total
Less than 50%
50% to < 100%
100% to < 150%
150% to < 200%
200% to < 250%
250% to < 300%
300% to < 350%
350% or more
Total
Less than 50%
50% to < 100%
100% to < 150%
150% to < 200%
200% to < 250%
250% to < 300%
300% to < 350%
350% or more
1993
10,293
1,472
2,099
2,066
1,496
1,030
622
417
1,091
1994
1997
1998
Number of Children Uninsured (Thousands)
10,678
10,503
11,300
11,586
11,871
1,643
2,115
2,084
1,594
1,067
670
414
1,091
14.1
14.4
18.8
23.1
25.2
19.0
13.7
9.6
7.6
5.3
21.4
24.0
25.4
20.1
14.8
10.0
7.1
5.1
1995
1,594
1,993
2,066
1,707
969
709
368
1,098
1996
1,784
2,061
2,200
1,818
1,066
739
524
1,108
Percent of Children Uninsured
14.0
15.1
23.3
22.0
24.6
20.8
13.0
10.3
6.3
5.0
24.8
24.3
26.2
21.7
14.1
10.9
8.8
5.0
1,900
2,006
2,210
1,691
1,116
743
494
1,425
1,886
2,111
2,065
1,726
1,274
614
576
1,618
15.3
15.6
26.1
24.8
27.8
21.2
15.0
10.8
8.3
5.9
27.9
26.3
26.1
21.7
17.2
9.4
10.1
6.3
SOURCE: Mathematica Policy Research analysis of Current Population Survey, March 1994 through
March 1999.
44
within the low-income population, trends in the uninsured are disaggregated by poverty
level.7
Pre-SCHIP Trends
SCHIP was implemented at a time when uninsured rates were rising, especially among
the lowest-income children who presumably were eligible for Medicaid but were not enrolled
(Selden et al. 1998). During the pre-SCHIP period, the percentage of children without
health insurance rose 1.2 percentage points, from 14.1 percent in 1993 to 15.3 percent in
1997, or an average of 0.3 percentage points per year. The increase was largest among
children in families below 50 percent of poverty, where the proportion uninsured rose an
average of nearly 2 percentage points a year, from 18.8 percent in 1993 to 26.1 percent in
1997. The uninsured rates in other poverty groups showed a generally upward trend--but
much more modest than what we found among children below 50 percent of poverty.
As shown in Table 8, 27.8 percent of children in families between 100 and 150 percent
of the federal poverty level (FPL) were uninsured in 1997. These children often were not
eligible for Medicaid, and their families either were not offered or could not afford other
types of insurance coverage. SCHIP extended coverage to many of these children as well as
other low-income children.
Preliminary Evidence of the Short-term Effects of SCHIP
According to the CPS, there were no statistically significant changes in the uninsured
rates between 1997 and 1998, whether for all children or for subgroups by poverty level.8
The rise of 0.3 percentage points in the overall child uninsured rate between 1997 and 1998
is not statistically significant, but it appears to be a continuation of the pre-SCHIP trend.9
7Poverty is measured relative to the Census Bureau’s poverty thresholds, which are the basis for the
official estimates of poverty in the United States. Medicaid and SCHIP programs generally use the alternative
“poverty guidelines” prepared by the Department of Health and Human Services (DHHS). The two are
comparable in level, but the poverty guidelines are simpler, having uniform increments by family size, although
they also recognize higher living costs in Alaska and Hawaii than the rest of the states, which the poverty
thresholds do not do (Fisher 1992).
8Over the range of observed rates the standard error for an annual estimate for the entire population of
children is about 0.18 percent, implying a 95 percent confidence interval of plus or minus .36 percent for each
of the estimates. Taking into account the sample overlap between consecutive March surveys, a 0.45
percentage point change in the entire population of children between consecutive years would be defined as
statistically significant at the 0.05 level. The Census Bureau favors a .1 percent level of significance in its
published reports on the CPS; but, even with this more liberal standard, the change in the percentage of
children uninsured between 1997 and 1998 is not statistically significant (Campbell 1999). This is true as well
of the much larger percentage point change in the proportion uninsured among children in poverty; that is, this
change is not significant either.
9A confidence interval of plus or minus 0.45 percentage points around the estimated change of 0.3
percentage point covers a rather broad range of possibilities that only additional years of data can help to
(footnote continued)
IV. Trends in the Number of Uninsured Children Before and After SCHIP
45
Thus, it would appear that implementation of SCHIP had not yet had a measurable effect on
the modest year-to-year growth in the percentage of children without health insurance.
Moreover, the estimate of change in the uninsured rate is simply not precise enough for us
to draw conclusions about whether the earlier upward trend has abated since SCHIP was
introduced. These findings should not be surprising given the early enrollment patterns in
SCHIP and the start-up time needed to implement these programs. As we saw in the
previous chapter, enrollment doubled from FFY 1998 to 1999 and continued to grow at the
rate of one million per year through early 2000.
Although none of the differences within poverty group were significant, two trends may
signal the early effects of SCHIP on reducing the rate of uninsured low-income children.
The first trend is that among children between 100 and 150 percent of poverty, who had the
highest proportion uninsured in every year from 1993 through 1997, there appears to be a
reversal of the recent pre-SCHIP trend. The proportion uninsured drops between 1997 and
1998; although not statistically significant, these data suggest an apparent reversal of the preSCHIP trend and a divergence from the pattern found among children in the two lowerincome groups. Children between 100 and 150 percent of poverty were more likely to gain
coverage under SCHIP than those at lower poverty levels, many of whom were already
eligible for Medicaid. If SCHIP has had any effect on the uninsured as yet, it is in this group
that we would expect the effect to be most pronounced. The second encouraging trend is
that in the next higher income group, children between 150 and 200 percent of poverty, a
gradual year-to-year rise in the uninsured rate between 1993 and 1996 flattens out and stays
relatively flat through 1998.
In sum, our findings on the trend in the uninsured rate by poverty level are at least
suggestive of an early influence of SCHIP, but the time series must be extended before we
can draw valid inferences about the direction and magnitude of change. However, it is clear
from the findings presented in this section that, as additional data become available, it will be
important to look within poverty level for evidence of an effect of SCHIP on the uninsured
rate.
resolve. The March 2000 CPS, to be released at the end of September 2000, will provide important data on the
number of uninsured children during 1999.
IV. Trends in the Number of Uninsured Children Before and After SCHIP
46
CHANGES IN THE SOURCE OF COVERAGE
Information on changes in the source of insurance coverage for children over time is of
interest, for two reasons. First, it can help explain trends in the proportion of children who
are uninsured; second, it can demonstrate the extent to which shifts in coverage coincided
with the implementation of SCHIP.
Changes in Coverage from 1997 to 1998
Table 9 reports the distribution of children by source of coverage in 1997 and 1998 (as
recorded in the March 1998 and 1999 CPS supplements, respectively). Among all children,
the proportion who were covered by ESI during the preceding year (including those who
also had Medicaid coverage during the year) rose by 0.8 percentage points, while the
proportion covered by Medicaid declined by 0.6 percentage points. Both changes, while
relatively modest, are statistically significant.
None of the changes in coverage within the poverty level are statistically significant,
although certain patterns are suggestive of changes that may become more evident with one
or more additional years of data. Among children below 100 percent of poverty--those most
likely to have been eligible for Medicaid for much of the year--the proportion with Medicaid
coverage for any part of the year declined by a few percentage points, while the proportion
with ESI coverage rose by almost the same amount.10 That low-income children might be
replacing Medicaid with ESI could be interpreted as a favorable outcome of welfare reform
or the strong economy if the result were confirmed with additional data, but the magnitude
of this change in coverage is small.
Among children in families with incomes between 100 percent and 250 percent of
poverty--the group most likely to be eligible for coverage under SCHIP--we see the opposite
movement. Medicaid coverage rose by about two percentage points, while ESI held steady
(100 to 150 percent of poverty) or declined by 2 to 3 percentage points (150 to 250 percent
of poverty). The Census Bureau includes SCHIP coverage under Medicaid if it was reported
as some form of government insurance, so the rise in Medicaid coverage--again, if supported
by additional data--could be due to coverage obtained under SCHIP.
The offsetting reduction in ESI among those with higher income levels (above 150
percent of poverty), though not statistically significant, could be explained by a number of
factors such as: involuntary loss of ESI due to job loss or job transition; voluntary
discontinuation of coverage by employers or employees due to cost; substitution of public
10Poverty level is based on income for the entire calendar year. A child might have been income-eligible
for Medicaid for only part of the year, and thus we see children with reported Medicaid coverage even among
those whose families had annual incomes well above poverty.
IV. Trends in the Number of Uninsured Children Before and After SCHIP
TABLE 9
DISTRIBUTION OF SOURCES OF COVERAGE BY POVERTY LEVEL, 1997 AND 1998: CHILDREN UNDER 19
Source of Coverage
in Previous Year
All
Children
< 50%
50% to
< 100%
Poverty Level (Percent of FPL)
100% to
200% to
150% to
< 150%
< 200%
< 250%
250% to
< 300%
300% to
< 350%
350% or
Greater
100.0
3.9
73.5
2.2
3.9
2.1
0.0
3.4
10.8
100.0
2.9
79.2
1.6
3.6
1.3
0.0
3.1
8.3
100.0
1.6
84.1
1.6
3.8
1.1
0.0
1.8
5.9
100.0
4.0
73.4
3.5
3.2
2.1
0.0
4.3
9.4
100.0
2.7
75.6
2.3
3.4
1.7
0.0
4.2
10.1
100.0
1.3
84.3
1.8
3.2
1.1
0.0
2.0
6.3
1997 Reference Year (March 1998 CPS)
Total
Medicaid without ESI
ESI without Medicaid
ESI and Medicaid
Privately purchased coverage
CHAMPUS, CHAMPVA
Medicare
Source unknown
Uninsured
100.0
17.1
56.6
2.9
3.4
1.5
0.1
3.0
15.3
100.0
59.2
6.5
1.4
1.5
1.0
0.3
3.9
26.1
100.0
51.9
11.7
4.7
2.0
0.8
0.4
3.6
24.8
100.0
26.6
30.7
5.5
3.3
2.0
0.3
3.7
27.8
100.0
11.8
52.1
5.2
4.1
1.7
0.1
3.7
21.2
100.0
6.6
64.6
3.4
4.0
2.7
0.1
3.6
15.0
1998 Reference Year (March 1999 CPS)
Total
Medicaid without ESI
ESI without Medicaid
ESI and Medicaid
Privately purchased coverage
CHAMPUS, CHAMPVA
Medicare
Source unknown
Uninsured
100.0
16.3 *
57.2 *
3.1
3.0
1.3
0.2
3.3
15.6
100.0
56.6
7.3
1.7
1.9
0.5
0.5
3.7
27.9
100.0
47.9
14.6
5.0
2.0
0.5
0.4
3.2
26.3
100.0
28.9
30.8
5.2
2.8
1.5
0.6
4.2
26.1
100.0
13.7
50.4
4.0
3.8
1.9
0.0
4.5
21.7
SOURCE: Mathematica Policy Research analysis of the Current Population Survey, March 1998 and March 1999.
*Significantly different from the previous year at the .05 level.
100.0
8.4
61.5
3.7
3.6
1.9
0.1
3.8
17.2
48
coverage for private coverage; or simply “noise” in the data. This is similar to findings by
Cunningham and Park (2000) in their analysis of the first two rounds of the Community
Tracking Study (CTS) household survey.11 Accounting for these patterns, however, requires
much better data than either the CPS or CTS can provide at present.
Longitudinal Analysis of Change in Coverage
While the overall distribution by source of coverage changed little from 1997 to 1998, it
would be incorrect to infer that changes in coverage among children were rare. Rather, the
relative stability of the aggregate distribution over the two years masks considerable
movement among different sources of coverage. To estimate the amount of movement
between sources of coverage, we exploited a feature of the CPS sample design that provides
a sizable subsample of respondents for whom data are collected in two consecutive March
surveys. When the respondents’ records are matched between surveys, they can be analyzed
longitudinally.12
Altogether, we estimate that 28 percent of children changed their source of insurance
coverage, gained coverage, or lost coverage between 1997 and 1998 (data not shown).
Changes were more common among lower-income children than higher income children; 37
percent of those below 200 percent of poverty, but only 21 percent of those above 200 percent
of poverty changed their coverage between 1997 and 1998. This percentage is broadly
consistent with estimates based on longitudinal data from earlier in the decade.13
Table 10 focuses on transitions among uninsured children. Of those uninsured in 1997,
45 percent were still uninsured in 1998; another 30 percent gained ESI coverage and 16
percent obtained Medicaid. Children just above poverty were most likely to remain
11Comparing
sources of coverage between 1996-97 and 1998-99, Cunningham and Park (2000) found that
a rise in public coverage was offset by a decline in private coverage among children below 200 percent of
poverty, with most of the change occurring between 100 and 200 percent of poverty. Below the poverty level
public coverage did not change while private insurance declined.
12There are some caveats that should be mentioned regarding the longitudinal analysis of matched CPS
records. First, to maintain the representativeness of the sample over time, the Census Bureau returns to the
same addresses rather than following their original occupants to new addresses. Respondents who move are
not reinterviewed; rather, the new occupants—if any—are interviewed in their place. As a result, when records
are matched at the person level, the resulting sample excludes persons who moved between the two years.
Since moving may be associated with changes in employment and other characteristics, the exclusion of movers
probably understates the amount of change in health insurance coverage. Second, response error and
imputation for nonresponse to individual questions may have the opposite effect; that is, they may result in the
amount of year-to-year change being overstated. Third, the CPS public use file does not contain unique
person-level identifiers that can be matched over time. While the matches that users can construct are highly
accurate, they are not perfect. Matching errors will tend to overstate year-to-year change as well.
13Czajka and Olsen (2000), using data from the 1992 panel of the SIPP, found that the number of
transitions reported between July 1993 and June 1994 amounted to nearly one change for every three children.
While the types of changes they examined were somewhat less inclusive than those represented here, it was
quite common for children to record two transitions during the period. The actual number of children with one
or more changes in coverage was probably closer to one in five.
IV. Trends in the Number of Uninsured Children Before and After SCHIP
49
uninsured in 1998. Of those who obtained coverage, it was fairly evenly divided between
Medicaid and ESI. Not surprisingly, uninsured children in the lowest-income group (less
than 50 percent of poverty) were the most likely to obtain Medicaid (30 percent), while
higher-income children were more likely to gain ESI coverage.
CONCLUSION
States are pursuing a variety of initiatives under the SCHIP “umbrella” that could have
an effect on uninsured rates in the future, including coverage expansions, outreach
initiatives, enrollment simplification, and increased coordination with ESI. Future analyses
will track not only aggregate trends in uninsured rates, but also transitions between
uninsured and insured status, and trends within individual states.14
It should not be surprising that we observed no significant reductions in uninsured
rates, given the enrollment patterns in 1998 and the large fraction of initial enrollment
attributed to grandfathered programs. A longer time series will be required to observe the
effects of SCHIP on uninsured rates. Additional data from both the March CPS and other
14Congress
has appropriated $10 million annually for the Census Bureau to increase the sample size of the
March supplement to the Current Population Survey, which provides the most widely used annual estimates of
the health insurance coverage of the U.S. population. The funding will support a near-doubling of the March
CPS sample size beginning in March 2001, with most of the increase being allocated to improve the precision
of state estimates.
IV. Trends in the Number of Uninsured Children Before and After SCHIP
TABLE 10
CHILDREN UNINSURED IN 1997: SOURCE OF COVERAGE IN 1998 BY POVERTY LEVEL IN 1997,
ESTIMATES BASED ON MATCHED CPS SAMPLES
Poverty Level in 1997
(Percent of FPL)
Total
Less than 50%
50% to < 100%
100% to < 150%
150% to < 200%
200% to < 250%
250% to < 300%
300% to < 350%
350% or more
Source of Coverage in 1998
ESI
ESI
without
and
Private
Medicaid
Medicaid
Coverage
Still
Uninsured
Medicaid
without
ESI
100.0%
44.8
16.2
29.7
1.4
3.7
0.5
0.1
3.6
100.0%
100.0%
100.0%
100.0%
100.0%
100.0%
100.0%
100.0%
42.2
53.3
55.5
47.9
40.3
34.8
42.4
24.8
30.1
16.2
17.5
16.8
13.6
8.7
10.3
2.8
19.1
21.8
16.2
26.0
35.9
51.6
43.1
61.1
0.5
1.6
1.1
4.6
1.2
0.6
0.0
0.4
3.3
2.0
4.6
3.9
7.4
1.9
1.4
3.7
0.3
0.6
1.2
0.0
0.0
1.2
0.0
0.2
0.0
0.0
0.4
0.0
0.0
0.0
0.0
0.1
4.5
4.5
3.6
0.8
1.3
1.2
2.8
6.8
Total
CHAMPUS,
CHAMPVA
Medicare
Source
Unknown
SOURCE: Mathematica Policy Research analysis of matched records in the March 1998 and March 1999 Current Population Survey samples.
ESI = employer sponsored insurance.
51
sources will be released over the next several months.15 Further analysis also is required of
the dynamics of insurance coverage. This analysis underscores the dynamic nature of health
insurance coverage among children. There is considerable movement between insured and
uninsured status over a two-year period. One goal of SCHIP is to provide seamless health
insurance coverage for low-income children, helping them transition between Medicaid and
ESI as their circumstances change. Through longitudinal analyses, we can assess whether
fewer children are continuously uninsured and whether more children remain continuously
insured by transitioning between sources of public and private coverage.
15Data
from the March 2000 CPS will be released at the end of September 2000. Data from the 1998 NHIS will
be released in November 2000, providing an alternative annual time series to the March CPS. Data from the
second round of the National Survey of America’s Families (NSAF) will be released in the fall as well,
providing estimates that parallel the CTS in their reference period. Longitudinal data from the SIPP and the
Medical Expenditure Panel Survey (MEPS) lag behind these cross-sectional surveys. Ultimately, they will
support analyses of the dynamics of insurance coverage pre- and post-SCHIP, and their data may prove to be
essential to investigating the existence of crowd-out; based on projected release dates, however, it will be at
least another year before either survey will be available for the evaluation of SCHIP.
IV. Trends in the Number of Uninsured Children Before and After SCHIP
CHAPTER V
SUCCESSES AND CHALLENGES IN
ENROLLING AND RETAINING
CHILDREN IN SCHIP
W
e turn now to a synthesis of states’ reflections on the strengths and
weaknesses of their SCHIP eligibility determination and redetermination
processes, as reported in their SCHIP evaluations to HCFA. States recognize
that families may encounter barriers that can prevent or impede their
successful enrollment and retention in SCHIP. Therefore, states are attempting to identify,
address, and overcome these barriers to enroll more children in SCHIP. The chapter begins
with state perspectives on key aspects of the eligibility determination process for SCHIP,
including application and redetermination forms, the mail-in option, coordination of
eligibility among programs, verification of personal information, and the timeliness of
eligibility determinations. Then, several broader enrollment issues are addressed: reducing
stigma, improving retention rates, implementing cost-sharing, training staff, modifying
automated systems to accommodate SCHIP, and centralizing eligibility determination.
This chapter is based on information reported in Sections 3.1.7, 3.1.8, 4.2.2, 5.1.1, and
5.2 of the state evaluations. It is important to note that individual states highlighted
particular themes in their discussion of enrollment and retention. Undoubtedly, many of the
successes and challenges described in this section are shared by several states, although not
all states discussed them.
54
KEY ASPECTS OF THE SCHIP ELIGIBILITY DETERMINATION PROCESS
Application and Redetermination Forms
Recognizing that Medicaid applications are confusing and lengthy, almost all the states
have made a deliberate effort to streamline and simplify their SCHIP application and
redetermination forms. In the evaluation reports, close to 40 states indicated that they had
simplified their application forms. The vast majority of states have eliminated assets testing
for SCHIP and many have also reduced verification requirements. Not all states reported on
the length of their SCHIP application forms, but over 20 states indicated that their forms are
four pages or less, including Arizona, Arkansas, the District of Columbia, Florida, Georgia,
Indiana, Iowa, Kentucky, Maine, Maryland, Michigan, Minnesota, Nebraska, Nevada, North
Carolina, Ohio, Oklahoma, Oregon, Pennsylvania, Tennessee, and Virginia.
In Oklahoma, where the M-SCHIP program in FFY 1999 increased the number of
publicly insured children by over 60 percent beyond traditional Medicaid, the state reduced
its application form for all children applying for Medicaid from 16 pages to 1 page. The
state also eliminated the assets test and moved to accept a self-declaration of income—steps
that enabled the state to simplify the application process considerably.
State Highlight: Developing Shorter Forms
Initially, California developed a 28-page SCHIP/Medicaid
application form. Focus group testing and stakeholder review
pointed to the length and complexity of the application as barriers to
enrollment. Although the form was a good training tool for
Community-Based Organizations and Certified Application
Assistants, it was not effective as an application. Subsequently, the
state produced a four-page user-friendly application, as well as a
two-page redetermination form. California also provided application
materials and toll-free information lines in eleven languages.
V. Successes and Challenges in Enrolling and Retaining Children in SCHIP
55
Thirteen states mentioned areas in which their application or redetermination forms
could still use improvement (Connecticut, Delaware, Iowa M-SCHIP, Maine, Nebraska,
New Hampshire, North Dakota, Oregon, Pennsylvania, Tennessee, Vermont, Virginia, and
West Virginia). For example, Vermont plans to develop SCHIP application forms in
languages other than English. North Dakota is revising its application form to make it
shorter. Several states are focusing additional attention on improving the redetermination
process:
!" During
redetermination, enrollees in Connecticut, Delaware, and Maine must
provide information already collected at the initial application, such as birth
date or social security numbers. All three states hope to include pre-filled
information so that enrollees do not have to provide duplicate information at
renewal.
!" New
Hampshire reported that currently there is no difference in the state’s
SCHIP application and redetermination process and that streamlining the
redetermination form and procedures would enhance operations.
The Mail-in Option
To decrease the burden on new applicants or re-enrollees, close to 40 states reported in
their evaluations that they have eliminated the requirement for face-to-face interviews and
moved to mail-in applications. This approach is more convenient because it assists working
families who find it difficult to visit an eligibility office during the day and helps those who
have transportation issues.
!" Several
states, including Alaska, California, Delaware, Kansas, Louisiana, and
Massachusetts, mentioned that they also provide postage paid return
envelopes.
!" Michigan
has a “no wrong door” policy. Maximus (the state’s administrative
contractor), local TANF offices, and local health departments all accept
applications via mail or in-person.
V. Successes and Challenges in Enrolling and Retaining Children in SCHIP
56
State Highlight:
Application
The
Benefits
of
a
Simplified,
Mail-in
Illinois believes that its mail-in application has increased enrollment.
It allows families to interact with KidCare by phone and through the
mail, as they would interact with a private insurer. Ending face-toface interviews encourages working families to apply. Other steps
to improve the mail-in process include: dropping the assets test;
removing the verification requirements regarding where and with
whom children live; simplifying the income verification
requirements; eliminating all non-essential questions; and
developing a centralized intake unit at the state level that can
accurately and consistently process a large volume of applications.
Illinois also reimburses KidCare Application Agents who assist
families with needed paperwork. Illinois indicated that their approval
rate for submitted applications has improved significantly to about 8
out of 10.
Some states, however, mentioned that the use of mail-in applications can have
unintended consequences. For example, this process does not allow intake workers to
educate applicants about eligibility requirements, benefits, or the redetermination process.
The mail-in approach also limits the amount of assistance a state may provide in completing
the application. Nine states noted limitations with the mail-in application process:
Delaware, Kansas, Kentucky, Louisiana, Maine, Mississippi, Missouri, Oregon and Virginia.
!" Louisiana
and Missouri reported that some applicants would benefit from
face-to-face assistance because illiteracy may be a barrier to filling out the
mail-in application. To address this problem, Missouri and many other states
offer a toll-free assistance line.
!" Delaware,
Kansas, and Kentucky reported that the mail-in process increases
the likelihood that applications will be incomplete, thereby lengthening the
eligibility determination process. As a result, Kentucky provides reminders
on the application envelope that list the “must do’s” for the application.
Coordination of Eligibility Among Programs
Most states are striving to achieve a seamless relationship between their SCHIP and
Medicaid programs, so that children move easily between programs as their life
circumstances change. Because S-SCHIP and Medicaid programs can differ in eligibility
rules and benefits, coordination between programs can be complicated. Of importance in
V. Successes and Challenges in Enrolling and Retaining Children in SCHIP
57
addressing this problem, the state evaluations revealed that 30 of the 32 states with S-SCHIP
programs (as of March 2000) are using a combined application form for S-SCHIP and
Medicaid. States have also designed with other strategies for improving coordination.
!" Oregon
designed its S-SCHIP program to build on its 1115 Medicaid
demonstration experience.
A single application and joint eligibility
determination process allow members of mixed-eligibility families to be
enrolled in the same health plan.
!" Arizona
locates eligibility staff for Kids Care (its S-SCHIP program) and
Medicaid in the same office.
State Highlight: Coordinating with Medicaid
Georgia’s SCHIP application includes a check-off box for parents to
request that their children’s applications be referred to Medicaid if
they are identified as potentially eligible for Medicaid. Parents can
then apply for Medicaid without having to file a separate application
and without any further intervention. For families that do not check
the box, a representative from Right from the Start Medicaid (RSM)
calls the family and provides information and counseling about the
benefits of the Medicaid program. To date, no one has ultimately
refused Medicaid after speaking with an RSM worker. The state
considers this component “a tremendous strength to the program
as families receive the information necessary for them to make an
informed choice and correct any misperceptions they may have
about the Medicaid program.”
In the evaluation reports, several states pointed to ongoing challenges in making sure
their systems are seamless, particularly when S-SCHIP programs are involved.
!" Alabama
has difficulty during the redetermination process because its MSCHIP and S-SCHIP programs do not use the same redetermination forms,
making referrals between the two programs more challenging.
!" Connecticut
is still working to make the referral process between Husky A
(M-SCHIP) and Husky B (S-SCHIP) seamless. The state has developed an
automated tracking and referral process and conducted training to assist staff
in transferring cases between the two programs more easily.
V. Successes and Challenges in Enrolling and Retaining Children in SCHIP
58
!" Kansas
and Wyoming reported that families are confused by the relationship
between their S-SCHIP programs and Medicaid and the different eligibility
criteria for the two programs. Kansas is working to create a “seamless single
program (from the public perspective).” Until that is done, however, the state
seeks to improve communication with S-SCHIP families.
!" Families
in Florida do not always understand that S-SCHIP and Medicaid are
separate programs, and that they can get either program even if they are
denied welfare. The state has also found that families in which children are
enrolled in two different programs may not understand the need to reapply
for one child if they just reapplied for another child.
Verification of Personal Information
To determine eligibility, SCHIP programs generally verify applicant age, income, and
citizenship. Thirteen states cited documentation requirements as a barrier to enrollment and
retention (Alabama M-SCHIP, Arkansas, District of Columbia, Iowa M-SCHIP, Louisiana,
Minnesota, New Hampshire, New Jersey, North Carolina, North Dakota, Oregon,
Pennsylvania, and Virginia). As a result of the burden caused by verification, states are using
a variety of methods to assist enrollees:
!" Louisiana
applicants.
uses on-line birth records to verify age to reduce the burden on
!" Pennsylvania
is working to reduce the amount of income verification
required. Currently, the state requires documentation of a full month’s work;
however, the state is considering allowing one pay stub (for a shorter time
period) to serve as sufficient verification of income.
!" New
Jersey is evaluating the use of alternate verification sources, such as data
from the Department of Health and Social Services vital statistics records.
!" Georgia,
Idaho, and Maryland have chosen to allow self-declaration of
income, to decrease the burden on applicants. HCFA reports that at least
seven states are now using this approach.
!" Illinois
and Ohio recognize that income verification is a barrier; they believe,
however, that it is essential to maintaining program integrity and have chosen
to reduce other documentation requirements but not the requirement for
income verification.
!" West
Virginia has decided not to require income verification as part of the
redetermination process, in order to reduce the number of children
disenrolling from SCHIP.
V. Successes and Challenges in Enrolling and Retaining Children in SCHIP
59
!" Minnesota
has a delayed verification process. An applicant has 30 days after
enrollment to submit necessary verification.
State Highlight: Simplifying Documentation Requirements for
Cash Income
New Jersey is working to make income-verification requirements
easier for those "paid under the table.” New Jersey will accept a
letter from an employer on the its letterhead stating the monthly
amount an employee receives. If the employer refuses to submit
such a letter due to legal concerns, New Jersey offers a solution:
the agency obtains verbal confirmation from the employer as to the
applicant’s income. The agency, on its letterhead, attests to
communication with the employer and the stated income of the
employee.
The Timeliness of Eligibility Determinations
In discussing the strengths of their SCHIP programs, several states highlighted their
ability to quickly process SCHIP applications. Timely processing of applications allows
eligible applicants rapid access to the services offered by the SCHIP program. Alaska
reported that it is able to process applications within two working days. Georgia’s third
party administrator must process applications within 10 days to meet contract performance
specifications.
Other states expressed some concern with delays in applications processing (Alabama,
Delaware, District of Columbia, Kansas, Indiana, Maryland, Nebraska, New Jersey, Virginia,
and West Virginia).
!" Delaware
and the District of Columbia are finding that a lack of staff leads to
delays in processing applications. In Delaware, processing times exceed the
optimum level of 10 days, but are within the mandated 45 days. Delaware is
attempting to hire more staff to address its shortage.
!" Maryland
reported that 68 percent of M-SCHIP applications are processed
by local health departments in 10 days or less. However, the state
determined that M-SCHIP applications with an associated food stamp case
were a weakness in the system because those cases must be transferred to the
local department of social services for processing. To correct this delay, the
V. Successes and Challenges in Enrolling and Retaining Children in SCHIP
60
state worked with advocates to develop a plan to expedite processing of all
applications, including those with food stamps; the goal is to process all
applications within 10 days.
!" Kansas
expressed concern that its simplified renewal process is not designed
to handle the significant changes in personal information that may occur
within the 12 months of guaranteed eligibility, such as changes in family
composition, address, and income. Kansas is working to improve the renewal
process to accommodate this issue, and is not considering changing its 12
months guaranteed eligibility policy.
BROADER ISSUES RELATED TO ENROLLMENT AND RETENTION
Now, we turn from the eligibility determination (or redetermination) process to focus on
state comments about broader issues related to SCHIP enrollment and retention.
Reducing Stigma
Families’ perceptions of SCHIP can affect enrollment and retention. Because SCHIP is a
public program, many states have found that some applicants attach a certain stigma to the
program, often linking it with welfare or Medicaid. State officials believe this stigma
discourages some eligible families from applying for health coverage through SCHIP
(Arizona, Georgia, Iowa, Kansas, Kentucky, Michigan, North Dakota, Ohio, Oregon, and
Rhode Island). For example, Arizona, Kansas, Michigan and Ohio mentioned in their
evaluation reports that some families who applied for SCHIP coverage, but were determined
to be eligible for Medicaid, decided to defer coverage because of the stigma attached to
Medicaid.
To reduce the stigma associated with SCHIP and Medicaid, states are using a variety of
approaches.
!" Arkansas
decided to name its M-SCHIP program ARKids Plus to take
advantage of the outreach efforts and positive name recognition associated
with its ARKids First 1115 demonstration.
!" In
Vermont and several other states, families that apply only for health care
benefits mail their applications to a centralized processing unit, which has no
overt connection to the state’s welfare department.
V. Successes and Challenges in Enrolling and Retaining Children in SCHIP
61
State Highlight: Reducing Stigma At Little or No Cost
Indiana has taken a number of steps to reduce the stigma
associated with its M-SCHIP program. The old Indiana Medicaid
card was replaced with a Hoosier Health Card that resembles a
commercial insurance card. Hoosier Healthwise is referred to as
health insurance rather than public assistance. Children enrolled in
the program are “members” not “recipients.”
Improving Retention Rates
States also are finding that continuity of enrollment is affected by the structure of the reenrollment process. Thus, many states are now shifting their focus so that they not only
enroll, but “keep” eligible children in SCHIP and Medicaid. Some report that the process of
re-enrolling has its own barriers, such as duplicative verification requirements, the need to
complete a new application form, or a face-to-face interview. As shown in Table 11, states
are undertaking or planning several initiatives to improve retention rates:
!" Simplifying
redetermination forms and the re-enrollment process (35 states)
!" Using
caseworkers or outreach programs to follow up with SCHIP recipients
who do not respond to redetermination notices (31 states)
!" Providing
!" Allowing
easy-to-use renewal form (30 states)
mail-in of renewal application (23 states)
!" Conducting
surveys to learn more about why people disenroll (9 states)
!" Mailing
specific notices to recipients at risk of disenrolling, such as those
with incomes on the border of eligibility limits (6 states)
!" Using
media campaigns to increase awareness about SCHIP and
redetermination procedures (4 states)
States provided many examples of steps they are taking to improve the renewal process.
!" In
Alabama, children enrolled in the state’s S-SCHIP program receive an
ALL Kids insurance card with a “good through” date printed on the card.
Parents and providers then know when coverage ends and when to expect
the annual renewal. Alabama’s M-SCHIP program allows a family to set up
one review date, even if family members have multiple entry dates into
Medicaid.
V. Successes and Challenges in Enrolling and Retaining Children in SCHIP
TABLE 11
STATE APPROACHES FOR IMPROVING SCHIP RETENTION RATES FOR ELIGIBLE CHILDREN
State
Total (N = 51)
Simplify Reenrollment
Processes
and/or
Policiesa
Follow-Up
through
Caseworkers Provide Easy- Allow Mail-In
and Outreach to-Use Renewal of Renewal
Form
Application
Programsb
Send out
Reminder
Notices
Conduct
Send Targeted
Special Surveys
Mailings
Conduct
Information
Campaigns
35
31
30
23
22
9
6
4
M-SCHIP Only (N = 19)
Alaska
Arkansas
District of Columbia
Hawaii
Idaho
Louisiana
Maryland
Minnesota
Missouri
Nebraska
New Mexico
Ohio
Oklahoma
Rhode Island
South Carolina
South Dakota
Tennessee
Texas
Wisconsin
13
1
12
1
8
8
1
1
1
7
1
1
1
1
4
3
S-SCHIP Only (N = 15)
Arizona
Colorado
Delaware
Georgia
Kansas
Montana
Nevada
North Carolina
Oregon
Pennsylvania
7
1
1
1
1
1
1
1
1
1
1
1
1
1
1
1
1
1
1
1
1
1
1
1
1
1
1
1
1
1
1
1
1
1
1
1
1
1
1
1
1
1
1
1
1
1
1
1
6
1
8
1
7
1
8
4
1
1
1
1
1
1
1
1
1
1
1
1
1
1
1
1
1
1
1
1
1
1
1
1
1
1
1
1
1
1
1
0
TABLE 11 (continued)
Simplify Reenrollment
Processes
and/or
Policiesa
State
Utah
Vermont
Virginia
Washington
Wyoming
Combination Programs c (N = 17)
Alabama
California
Connecticut
Florida
Illinois
Indiana
Iowa
Kentucky
Maine
Massachusetts
Michigan
Mississippi
New Hampshire
New Jersey
New York
North Dakota
West Virginia
1
Follow-Up
through
Caseworkers Provide Easy- Allow Mail-In
and Outreach to-Use Renewal of Renewal
Form
Application
Programsb
1
1
1
1
1
1
1
Conduct
Send Targeted
Special Surveys
Mailings
Conduct
Information
Campaigns
1
1
15
1
1
1
1
1
1
1
1
1
Send out
Reminder
Notices
13
1
1
1
1
1
1
14
1
1
1
1
1
1
1
1
1
1
1
1
1
1
1
1
1
1
1
1
1
8
1
7
1
1
1
4
1
1
1
1
1
1
1
1
1
1
1
1
1
1
1
1
1
1
1
1
1
1
1
1
SOURCE: Mathematica Policy Research analysis of Title XXI State Evaluations, Sections 3.1.8 and 4.2.4 of State Evaluation Framework. It is important to note that individual
states highlighted particular themes in their discussion of retention. The approaches shown in this table may be used by other states, although they may not have mentioned
them in their evaluation.
a
Simplifying processes and policies may include: reducing verification requirements, offering 12 months continuous enrollment, and convening workgroups to review and
modify re-enrollment policies.
b
c
States reported a variety of approaches to follow-up, including phone calls, caseworker visits, and community-based outreach programs.
Combination states did not report separately on their re-enrollment efforts for S-SCHIP and M-SCHIP programs.
64
!" Pennsylvania
conducted focus groups to determine why many parents were
not returning redetermination information. The state found that the reasons
given for failure to renew mostly related to “lifestyle.” Many parents said
that they meant to do it, but got too busy, or forgot to send it in by the
deadline. To improve retention, Pennsylvania is altering the appearance of
renewal notices, conducting follow up telephone calls, and reducing income
verification requirements.
State Highlight: Making Renewal Easier
Florida uses what it calls a passive re-enrollment process to
maintain enrollment in its S-SCHIP and M-SCHIP programs
(Healthy Kids, MediKids, and the Children’s Medical Services
Network). Families whose children are up for renewal receive a
letter including demographic information they submitted with the
initial application and are asked to make corrections as necessary.
If there is no response, Florida assumes that there have been no
changes and coverage extends for six more months. The use of
premiums in the S-SCHIP program also provides assurance to the
state that families are active participants.
V. Successes and Challenges in Enrolling and Retaining Children in SCHIP
65
State Highlight:
Retention
A
Multi-Faceted
Approach
to
Improve
Massachusetts is engaged in a number of activities to improve
retention in its M-SCHIP and S-SCHIP programs. First, the state is
hoping to increase the response from families at re-certification
time by sending up to four reminder letters including a selfaddressed return envelope and making follow-up phone calls. In
addition, the state is looking into a computer-generated form that
prints out current information about the family and requires that
they correct any information that has changed, sign the form, and
return it to the state.
Finally, the state has a number of targeted initiatives to learn more
about the children who disenroll from SCHIP such as (1)
developing a profile of the characteristics of people who drop out of
the program; (2) assessing whether premiums are a barrier to
participation in the program; and (3) awarding small grants to
provide community-based support for outreach in an effort to
identify those who may be eligible and help them enroll as well as
help those who are enrolled maintain eligibility.
Implementing Cost-sharing
A few states have found that their cost-sharing policies have resulted in barriers to
enrollment either due to an applicant’s failure to pay the enrollment fee or premium or the
state’s lack of experience in collecting fees. This is an area, however, where more empirical
research is required in order to understand better the extent to which cost-sharing serves as a
barrier.
!" North
Carolina found that failure to pay an enrollment fee--$50 per child
with a $100 family maximum--was the leading cause of denied applications.
!" New
Jersey requires that families mail a monthly premium check, but the
process has proven to be time-consuming and costly for both the state and
families. To address concerns with financial barriers, New Jersey is
considering implementing features that would make it easier for families to
pay premiums, such as an automatic debit or credit card payments.
!" In
March 2000, California established a “sponsorship” process to allow third
parties to pay premiums on behalf of SCHIP applicants. The state reported
V. Successes and Challenges in Enrolling and Retaining Children in SCHIP
66
that this drew local charitable organizations into the outreach process and
helped uninsured families learn about insurance coverage.
Training SCHIP Staff
SCHIP has imposed new expectations on state eligibility staff. In the past, many
eligibility workers focused on moving people off welfare and Medicaid, and relatively little
attention was focused on whether families were staying on Medicaid at the point of
redetermination. Now, the orientation in most state SCHIP programs is that staff should
encourage and assist eligible families during both the application and redetermination
processes.
!" North
Carolina likens the changes with SCHIP to a paradigm shift saying
that “there is a need to retool the thinking of eligibility workers into a form
of insurance agent.”
!" Ohio
found that its caseworkers were not perceived as being helpful in the
application process, so the state began a series of technical assistance sessions
for front line eligibility staff. These sessions focused on Medicaid eligibility
rules, but they also promoted consistency and a consumer-friendly
philosophy.
State Highlight: Internal Marketing to Field Staff
Louisiana trained eligibility field staff about the importance of health
insurance and the consequences of being uninsured. They also
explained why families may incorrectly assume children are not
eligible and discussed other barriers to enrollment. They then
challenged field staff to find solutions in assisting children to obtain
coverage in LaCHIP or Medicaid. The state found that staff buy-in
reduced procedural rejections. They also reported that staff were
more creative and proactive in obtaining essential verifications.
Modifying Automated Systems for SCHIP
To determine eligibility, either initially or upon renewal, most states rely on automated
eligibility systems. Ideally, these systems should be able to accommodate any special SCHIP
eligibility rules, such as 12-month continuous eligibility. Quite often, however, it is difficult
V. Successes and Challenges in Enrolling and Retaining Children in SCHIP
67
to incorporate SCHIP rules when the systems are primarily designed for welfare and food
stamps eligibility. A number of states felt that their systems served as a barrier to enrollment
and reenrollment (Alabama S-SCHIP, Delaware, Kansas, Minnesota, New Hampshire, New
Jersey, Ohio, Rhode Island, and West Virginia).
!" Ohio’s
system does not fully support different programs’ eligibility
determination and application processes; for example, it does not allow for
verification requirements related to Medicaid and M-SCHIP that differ from
those used by the food stamp and cash assistance programs. Ohio is working
to enhance its system so that traditional Medicaid or M-SCHIP eligibility will
continue when other eligibility, such as food stamps, is terminated due to
unrelated requirements.
!" The
West Virginia SCHIP program guarantees eligibility for 12 months
unless a child ages out or applies and is found eligible for Medicaid. The
system in West Virginia, however, automatically and erroneously transfers
children from SCHIP to Medicaid if something changes in the child’s case,
such as initiating services from another program.
State Highlight: An Interactive System for SCHIP and Medicaid
Eligibility
Wisconsin designed its BadgerCare program to use an automated
eligibility determination system called Client Assistance for
Reemployment and Economic Support (CARES). The CARES
system leads an eligibility worker through an interactive process to
determine eligibility in four programs: Medicaid, food stamps, child
care, and Temporary Assistance for Needy Families (TANF). This
minimizes costs and integrates program delivery to families who
have family members eligible for traditional Medicaid and others
eligible under the BadgerCare expansion.
Centralizing Eligibility Determination
Many states process initial applications and reapplications at a central location, to
facilitate consistency in applying SCHIP eligibility rules and to increase efficiency compared
to processing applications at multiple local sites. States, however, note a variety of pros and
cons to centralization (Alabama S-SCHIP, Alaska, Kansas, Nebraska, Ohio, and Virginia).
V. Successes and Challenges in Enrolling and Retaining Children in SCHIP
68
!" Alaska
uses a single, statewide office to process SCHIP applications. As a
result, clients needing assistance must rely on the state’s outreach partners or
take the initiative and seek support from the statewide office. Alaska’s
concern is that applicants may not find the support they need to apply.
!" Kansas
processes S-SCHIP applications at a central location, unless the
applicant is involved in other programs, such as food stamps. In that
situation, the application is sent to a local office, where it is maintained. As
family circumstances change, a case may move between the central location
and local agencies. This may be confusing to a family enrolled in SCHIP
who is notified of the transfer, but does not understand the reason for it.
!" In
Virginia, because eligibility determination is performed at the local level,
there are inconsistencies in the length of the eligibility determination process.
!" Ohio
conducts eligibility determination at local county offices and believes
that this inhibits consistency. For example, county agencies sometimes
impose additional documentation and verification requirements. Ohio is
training its staff to ensure consistent application of eligibility rules and
procedures.
CONCLUSION
It is interesting to note that some program features were viewed as barriers to enrollment
in some states and beneficial to enrollment in other states. For example, Alaska thought
centralization of the application process was a barrier, while Virginia believed that the lack of
centralization was a barrier. Furthermore, some of the practices designed to overcome
barriers were found to have inherent trades-offs. Mail-in redetermination applications are
designed to reduce the burden on recipients; however, they also impede direct
communication between SCHIP staff and SCHIP recipients. It is apparent that there is no
clear solution to structuring enrollment and redetermination processes; rather each state
must assess the positives and negatives of each approach to find the practices best suited to
their state. Additional research on “best practices” will also be useful in informing state
efforts.
V. Successes and Challenges in Enrolling and Retaining Children in SCHIP
CHAPTER VI
STATE RECOMMENDATIONS FOR
IMPROVING TITLE XXI
C
ongress mandated that the state evaluations include recommendations for
improving the State Children’s Health Insurance Program, and virtually all states
suggested ways in which the program could be improved to help them achieve the
goal of expanding health insurance coverage for previously uninsured low-income
children. States offered a wide range of recommendations, and their responses ranged in
length from a single sentence to several pages. Because the question was open-ended, some
states focused on a single priority, while others specified multiple priorities. It should be
noted, however, that priorities mentioned by one state could be important to other states
even though the issues were not raised in their state evaluations.
This chapter synthesizes the states’ comments, reported in Section 5.3 of the state
evaluations. The recommendations reflect several basic themes:
!" Improve
coverage of uninsured low-income children by extending coverage
to certain excluded populations (such as children of public employees), by
covering uninsured parents, and by increasing options for buying into
employer-sponsored insurance (ESI)
!" Improve
the financing and administration of the program by eliminating or
modifying the 10 percent administrative cap, by allowing a longer time frame
for spending the Title XXI allotment, and by improving technical assistance
and coordination among federal programs (for example, by facilitating
outreach through other public assistance programs or conducting national
media campaigns)
70
!" Maintain
flexibility for separate SCHIP programs, rather than imposing
Medicaid-like rules and regulations
RECOMMENDATIONS TO IMPROVE COVERAGE
Expand Coverage for Children of Public Employees
One of the most common recommendations made by states was to extend SCHIP
coverage to children of public employees (Alabama, Arizona, Arkansas, Florida, Georgia,
Iowa, Kansas, Louisiana, Maine, and Ohio). The Title XXI statute explicitly excludes
coverage of “a child who is a member of a family that is eligible for health benefits coverage
under a State health benefits plan on the basis of a family members employment with a
public agency in the State” (Section 2110(b)(2) (B)). States view this exclusion as inequitable
to children in families where one of the parents is employed by the state.
State Perspectives on Coverage of Children of Public
Employees
Alabama: “We have many state employees whose income is well
within the ALL Kids guidelines and they are not able to afford the
$164 per month premiums for family coverage.”
Louisiana: “If a Medicaid expansion program is the chosen option,
then these children would be eligible.... (We) recommend that this
exclusion be removed so that this population would qualify for both
options.”
Maine: “The state recognizes the importance of preventing crowdout. However, we are concerned that children of public employees
are treated differently than other children in this regard. We
recommend that state crowd-out strategies, such as waiting
periods, apply to all children who are applying regardless of the
families’ source of employment.”
Allow Coverage of Uninsured Parents
Title XXI allows states to purchase family coverage through group health plans if such
coverage is cost-effective relative to coverage of children only. States are concerned that this
poses a barrier to covering parents and, therefore, recommended that Title XXI be amended
to allow uninsured parents to qualify and enroll in SCHIP. Several states (California, Illinois,
VI. Recommendations for Improving Title XXI
71
Kentucky, Nevada, Rhode Island, and Wisconsin) noted that expanding coverage to
uninsured parents is necessary if SCHIP programs are to meet their goals of reaching
uninsured children.
!" Wisconsin
officials noted that they view such coverage “as a matter of good
public policy and for practical purposes: more eligible children are enrolled
when a public health program is offered to the entire family, rather than
children alone.” The state was required to utilize a Section 1115 waiver
under Title XIX to cover uninsured adults through BadgerCare, rather than
through the SCHIP program.
!" Rhode
Island also “wants to cover adults under its CHIP program. The
State believes firmly that comprehensive quality care cannot be accomplished
to meet identified needs of targeted, low-income children until this is
accomplished.”
Allow Coverage of Other Populations
Several states commented that specific populations are excluded from coverage under
SCHIP, and recommended modifying treatment of these groups. For example:
!" Florida
and Minnesota both suggested allowing coverage of noncitizen
children who do not currently qualify for SCHIP. As Minnesota wrote,
“states cannot effectively cover all children as long as the citizenship barriers
are in place” in both the Medicaid and SCHIP programs.
!" Montana
requested that children residing in Institutions for Mental Diseases
(IMD) at the time of eligibility redetermination be allowed to remain on
SCHIP.
Remove Barriers to Coordinating with Employer-Sponsored Insurance
To more effectively expand coverage and avoid crowd-out, states felt the need for
increased flexibility to coordinate with employer-sponsored insurance coverage (Arizona,
California, Florida, Iowa, Kansas, Kentucky, Minnesota, Ohio, Oregon, and Washington).
To date, three states have developed premium assistance initiatives (see box); others are
interested in following their lead but expressed concerns about the requirements imposed
either under statute or as a matter of federal policy. The requirements are not viewed as
“employer- or insurer-friendly” (Florida), and they are considered more restrictive than the
employer buy-in requirements under Title XIX (Kansas). States cited a variety of barriers to
coordination with ESI coverage, including requirements for benefits, premiums, costsharing, and waiting periods.
VI. Recommendations for Improving Title XXI
72
!" Florida,
Maryland, and Wisconsin reported that the requirement that
employers share at least 60 percent of the premium cost is too stringent.
Maryland conducted a survey of employers and found that the average
employer contribution was less than 60 percent. Maryland’s premium
assistance program, signed into law in April 2000 (but not yet implemented),
requires a minimum employer contribution of 50 percent. Wisconsin
recommended that the primary criterion be cost effectiveness relative to
other SCHIP coverage, without specifying a minimum percentage
contribution.
!" Utah
and Washington recommend that children be made eligible for
premium assistance without having to be uninsured for six months. This
can introduce an inequity for families who have been struggling to pay the
premium.
!" Arizona
noted that unique SCHIP protections mandated in the Title XXI
statute (such as no cost-sharing for preventive care and a five percent cap on
total cost-sharing) make coordination with employer-sponsored insurance
challenging and impose additional administrative costs on the state and on
providers.
State Highlights: Coordination
Insurance (ESI) Coverage
with
Employer-sponsored
Several states are in the forefront of developing initiatives to assist
families in obtaining ESI coverage for children and, in some cases,
their parents. These programs are funded through a variety of
sources, including Title XXI (SCHIP), Title XIX (Medicaid), and
state-only funds.
Illinois offers the KidCare Rebate program through state-only
funds to provide support to low-income families (between 133 and
185 percent of poverty) who have “acted prudently” and purchased
coverage for their children. Families receive $75 per month per
child toward the purchase of private insurance. The program offers
families a choice of health plans that are not government operated.
According to the state, “Some families with uninsured children who
would otherwise be eligible for KidCare Share or Premium choose
to enroll their kids in private insurance with the assistance of
KidCare Rebate.” As of April 1, 2000, about 3,200 children were
enrolled in this state-only program.
VI. Recommendations for Improving Title XXI
73
Massachusetts offers a Premium Assistance option to families that
have access to ESI coverage through an employer. The employer
must contribute at least 50 percent of the cost and must meet the
benchmark benefit level to qualify for coverage under Title XXI.
Family premiums generally do not exceed $10 per child or $30 per
family per month. The state pays the cost-sharing for well-child
visits and for out-of-pocket expenses exceeding 5 percent of
income.
Wisconsin has developed the BadgerCare Health Insurance
Premium Payment (HIPP) program to help families purchase ESI
coverage, provided they have not had employer-sponsored group
coverage in the previous six months and that the employer pays at
least 60 percent but less than 80 percent of the premium share.
Employer verification of insurance coverage and determination of
the cost-effectiveness of subsidizing ESI coverage through
BadgerCare are routine components of the Medicaid/SCHIP
eligibility determination process. If cost effectiveness of family
coverage can be demonstrated, parents and children are covered
under the Title XXI enhanced match. Otherwise, adults are
covered under a Medicaid (Title XIX) waiver rather than through
SCHIP (Title XXI).
Ease Provisions Related to Crowd-Out
Six states (Connecticut, New Hampshire, South Carolina, Utah, Washington, and
Wisconsin) reported that anti-crowd-out provisions are counterproductive to the goal of
providing seamless coverage for low-income children. Connecticut, for example, is opposed
to the proposed minimum six-month waiting period for ESI premium assistance, and
suggested reducing the waiting period or designing other strategies to avoid crowd-out.
South Carolina also is opposed to anti-crowd-out requirements because they may
discriminate against low-income families (especially those below 150 percent FPL) who have
struggled to provide health insurance coverage to their children. They are concerned that
families may drop coverage to be eligible for SCHIP, and then third-party resources are lost.
South Carolina recommends requiring that families retain such coverage and that SCHIP
coverage be coordinated with other third parties.
VI. Recommendations for Improving Title XXI
74
RECOMMENDATIONS TO IMPROVE FINANCING AND ADMINISTRATION
Eliminate or Modify the 10 Percent Administrative Cap
Twenty-one states commented that the 10 percent administrative cap posed significant
limitations on program design, implementation, and expansion (Arizona, California,
Colorado, Connecticut, Georgia, Idaho, Illinois, Indiana, Iowa, Kansas, Kentucky, Maine,
Maryland, Michigan, Montana, New Hampshire, New Jersey, New York, North Carolina,
Vermont, and Washington). States recognize that Congress intended to devote Title XXI
funds to purchase child health insurance and to minimize administrative expenses; North
Carolina noted that this was a “laudable goal,” but “unrealistic.”
Some states indicated that the cap has limited their ability to conduct outreach and
enrollment--activities essential to make families aware of SCHIP, help them apply, determine
their eligibility, and, ultimately, get them services. Moreover, Arizona and Connecticut
suggested that the 10 percent administrative cap limits evaluation. The limits are particularly
difficult for small states, like Vermont, that have only a limited administrative claim under
Title XXI.1
Several comments focused on the inequities faced by S-SCHIP programs because, unlike
M-SCHIP programs, they cannot obtain matching funds for SCHIP administrative expenses
under Title XIX. They recommended expanding the cap to minimize disincentives to states
that prefer to develop S-SCHIP programs. Several states (such as Idaho, Indiana, and
Nebraska) had been interested in designing an S-SCHIP program but did not pursue that
option because they thought it would not be possible to design and operate such a program
within the 10 percent cap.
State recommendations ranged from outright elimination of the cap to more targeted
modifications.
!" New
Hampshire recommended lifting the 10 percent cap to allow states to
staff SCHIP programs adequately and make system improvements with the
goal of “having the ‘old’ Medicaid program look more like the ‘new’ CHIP
program.”
!" New
York suggested redefining the expenditures that are subject to the 10
percent cap, requesting that the cost of premiums be excluded for children
who are presumptively eligible but who are later found to be ineligible.
1Some
states, in contrast, reported that the 10 percent cap had no effect on program design or else they
relied on other funding sources to supplement the administrative funds allowed under Title XXI. Many states
used state funds to support outreach efforts under SCHIP. Other states subsidized labor costs, systems
development, supplies, printing, and mailing, among other expenses.
VI. Recommendations for Improving Title XXI
75
!" Nevada
offered several suggestions for relieving the financial pressure on
states, including raising the cap from 10 to 15 percent, removing outreach
and marketing expenses and the costs of external quality review from the
cap, and allowing states to draw up to 10 percent of the unused portion of
the allotment for administrative expenses.
!" Indiana,
Iowa, and Michigan suggested removing outreach activities from the
cap. According to Michigan, the cap “is a structural barrier to an effective
CHIP outreach program... A solution would be legislation that distinguishes
outreach activity from activities that administer the program.”
States also recommended that special allowances be made to help states during the startup period of new SCHIP programs or new components:
!" Maryland
expressed concern that the 10 percent cap would impose financial
constraints in setting up a unit to administer its new premium assistance
program. Texas also expressed concern about the effect of the cap on the
design and implementation of its new S-SCHIP program.
!" California
and Colorado recommended that expenditures be permitted to
exceed the 10 percent cap during program start-up (such as the first three
years of the program), while Washington recommended that all up-front
administrative costs be funded through federal matching dollars.
!" Kansas
suggested that the 10 percent cap be based on the state allocation or
some other amount to allow for start-up expenses before premiums are paid
on behalf of eligible children.
Extend the Deadline for Spending the SCHIP Allotment
At the time states submitted their evaluations in March 200, the deadline for spending
their FFY 1998 SCHIP allotment was approaching. Some states recommended that they be
allowed to keep their unspent SCHIP allotments for more than three years. Maryland and
New Jersey, for example, suggested that the reallocation take place after five years rather
than three years, to allow states to cover more uninsured individuals (including uninsured
parents).
Oklahoma recommended that states be allowed to spend their allotment to cover
uninsured children who are newly enrolled in Medicaid. Children who are eligible for
Medicaid must be enrolled in Medicaid and are ineligible for SCHIP. According to
Oklahoma, “states with high numbers of prior Medicaid eligible uninsured children (like
Oklahoma) will never be able to access all of their federal allotment in order to enroll this
traditionally hard to reach population; at the same time SCHIP holds states accountable for
VI. Recommendations for Improving Title XXI
76
enrolling them.” Oklahoma concluded that states would have an incentive to adopt more
effective outreach programs if the SCHIP allotment could be applied to covering uninsured
children who are found eligible for traditional Medicaid.
Several states that had exhausted their FFY 1998 allotment were seeking opportunities to
increase their funding to continue serving uninsured children. New York, for example,
recommended that unspent allotments be redirected to states in need of additional funding.
“Therefore, we recommend that those states that exceed their approved allotments be given
the necessary funding to sustain their successful programs.” Indiana suggested that states
with S-SCHIP programs be allowed to access federal Medicaid funds once their SCHIP
allocation has been exhausted (similar to M-SCHIP programs).
Improve Technical Assistance and Coordination Among Federal Programs
One area frequently cited by states is the need for additional coordination at the federal
level to assist states with outreach and enrollment. States offered several examples where
federal leadership would be helpful in resolving issues:
!" Colorado
cited the importance of resolving the confidentiality issues in
working with the National School Lunch Program (NSLP). In fact,
considerable progress has been made in this area as a result of federal
interagency efforts. A new law became effective October 1, 2000, allowing
school lunch and SCHIP authorities to share information.
!" North
Dakota called for federal involvement in working with the U.S. Postal
Service to allow school districts to send out information about SCHIP
through their bulk mail permit although it may identify insurance companies
participating in the program.
!" Indiana
recommended increased coordination of multiple funding sources
(such as the Special Supplemental Food Program for Women, Infants, and
Children [WIC], maternal and child health [MCH], and the NSLP), to avoid
duplication and maximize resources. Areas for coordination include
standardization of eligibility and reimbursement guidelines and assistance
with data-sharing.
In addition to improved coordination at the federal level, several states called for
additional technical assistance from the federal government:
!" Colorado
recommended federal leadership in developing and disseminating
outreach materials and developing a clearinghouse for state-based
information on activities that demonstrate best practices.
VI. Recommendations for Improving Title XXI
77
!" Kentucky
recommended federal leadership in developing approaches to
measuring outcomes and quality of care (similar to what has been done for
outreach and eligibility simplification).
!" The
District of Columbia requested assistance in developing more precise
estimates of the number of uninsured children who are eligible for SCHIP.
Idaho and North Carolina emphasized the need for federal leadership in undertaking
aggressive marketing through national media campaigns, especially since media markets may
cross over state boundaries. Idaho indicated that it cannot use state dollars to purchase
media coverage in out-of-state markets. North Carolina suggested that the federal
government explore “product placement” within national television programs (such as “ER”
or “Chicago Hope”) to highlight why it is important to have health insurance for children.
RECOMMENDATIONS TO MAINTAIN OR INCREASE FLEXIBILITY
Reduce Requirements for SCHIP Programs
In the view of 13 states--Florida, Kentucky, Massachusetts, Minnesota, Missouri, New
York, North Carolina, Ohio, Pennsylvania, Utah, Vermont, Virginia, and Wyoming--the
Title XXI program has begun to take on a new direction, one that signals less flexibility in
designing and implementing SCHIP programs. These states, almost all of which have
developed S-SCHIP programs, are concerned that the proposed SCHIP regulations will,
one, add to the administrative burden; two, stifle creativity; and, three, increase tensions
between the federal government and states. They commented that the proposed SCHIP
regulations appeared to be “patterned after Medicaid” (New York) and reflected a “Medicaid
mindset” (Ohio). Florida cited three examples of areas where additional requirements not
specified in the Title XXI statute have been proposed: (1) lowering cost-sharing levels based
on a family’s income; (2) exempting Native American children from cost-sharing; and (3)
requiring states to implement the Consumer Bill of Rights.
Some states perceived a bias against S-SCHIP programs and recommended that these
restrictions be reduced. Five states (California, Florida, Kansas, North Carolina, and
Washington) recommended that S-SCHIP programs be allowed to participate in the federal
Vaccines for Children program, on a par with M-SCHIP programs. Several states also raised
concerns about the policy prohibiting S-SCHIP programs from requiring applicants to
submit their Social Security number (SSN). They note that the SSN facilitates matching
against Medicaid eligibility records and verifying income reporting.
VI. Recommendations for Improving Title XXI
78
Other recommendations included allowing S-SCHIP programs to participate in the drug
rebate program (again like M-SCHIP programs); compensating states for lost revenues due
to prohibitions against cost-sharing for Native American children under SCHIP and giving
states the flexibility to change funding sources for the state share of the match without
having to obtain an amendment.
One area where S-SCHIP programs are given greater flexibility than M-SCHIP programs
is who can determine eligibility. Only state employees are permitted to determine Medicaid
eligibility (and, by extension, M-SCHIP eligibility), whereas S-SCHIP programs can rely on
employees at health centers, day care centers, schools, and other settings. Illinois advocated
that M-SCHIP programs be allowed greater flexibility in making eligibility determinations,
similar to the options offered to S-SCHIP programs.
A View from the States: On Maintaining Flexibility in SCHIP
“When Title XXI was authorized, Massachusetts had already given
thought to expanding access and was in the process of moving
forward. With the new options available under Title XXI, the state
was able to pursue these plans even more vigorously. For states
not already planning an expansion it is clear that Title XXI provided
the impetus to move in the direction of expanding coverage to
children. In addition, the political dynamic encouraged states to
take on the challenge of moving forward.... In thinking about the
future of Title XXI it is important that the flexibility that states have
had to design their own programs be maintained. We have
concern, however, that the direction of the proposed Title XXI
regulations would remove some of this flexibility.”
Increase Flexibility Regarding Cost-Sharing
States recommended that HCFA provide increased flexibility to impose cost-sharing for
specific services or populations and not cap cost-sharing for higher-income families. Several
objectives motivate their recommendations: to ease administrative complexity, to increase
parental responsibility, to control program costs, or to emulate private insurance practices.
In particular, states would like the flexibility to impose cost-sharing on families whose
income is above 100 percent of poverty rather than 150 percent (Alaska and Arkansas) or to
impose targeted copayments on M-SCHIP enrollees for services such as inappropriate
VI. Recommendations for Improving Title XXI
79
emergency room use (Ohio).2 Other states recommended refinements to cost-sharing
policies for SCHIP families above 150 percent of poverty:
!" New
Jersey requested that HCFA eliminate the 5 percent cost-sharing cap
for families with income above 200 percent FPL because they have found
that it is difficult to monitor the total income of higher-income families.
!" To
increase parental responsibility, Montana suggested that the cost-sharing
limit remain at 5 percent for families with incomes between 100 and 150
percent FPL (rather than being capped at 2.5 percent of income). Montana
also is opposed to other cost-sharing provisions that would deviate from
typical commercial practices, such as allowing only one copayment during a
single office visit rather than on a per-service basis; prohibiting cost-sharing
for laboratory tests and preventive or diagnostic dental services; and allowing
noncovered services to be counted against the cost-sharing limit for children
with chronic conditions.
!" Idaho
had proposed a graduated voucher system to help families “become
self-reliant from the CHIP program” as their income increases, but this
approach was rejected. The state recommended that the federal government
review options that states could use to foster increasing parental
responsibility for the cost of health insurance as their income increases.
Increase Flexibility in the Definition of Creditable Coverage
Several states also requested additional flexibility in defining “creditable coverage” under
Title XXI. Washington found the definition confusing and recommended that HCFA
simplify the definition. Other states expressed concern that underinsured children are being
excluded.
!" Iowa,
New Hampshire, and New York questioned the exclusion of children
with catastrophic, high deductible insurance who are considered to have
creditable coverage and, therefore, are not eligible for SCHIP. As New
Hampshire noted, “These policies offer little value to families with children
since they do [not] cover preventive and routine care. Yet these families are
penalized, while families who have been willing to take a risk in being
uninsured qualify. It would be helpful to allow flexibility in the CHIP
funding to provide supplemental benefits to these children.”
2Arkansas’ Section 1115 Medicaid waiver program currently charges copayments for families with
incomes above 100 percent of poverty.
VI. Recommendations for Improving Title XXI
80
!" California
suggested that families without insurance coverage for dental or
vision services be allowed to buy into SCHIP for those services.
CONCLUSION
The SCHIP program is exhibiting growing momentum as programs mature and gain
visibility. The number of enrollees is rising each quarter, and states are considering new
approaches to reach those who are potentially eligible but not enrolled. As mandated by
Congress, the state evaluations presented numerous recommendations for improving Title
XXI. Four recommendations were mentioned most frequently in the state evaluations. The
most common concern is that the 10 percent administrative cap significantly constrains
many states’ efforts to conduct outreach, particularly among states with S-SCHIP programs
that cannot obtain regular Medicaid matching funds for excess expenditures. States offered
a number of suggestions, ranging from changing the way the cap is calculated, to removing
outreach costs from the cap, to raising the level of the cap.
Second, many states perceive a shift in the direction of the Title XXI program at the
federal level, signaling less flexibility, particularly for S-SCHIP programs. This concern is
motivated by the perception that the proposed SCHIP regulations reflect a Medicaid
orientation, which could add to the costs and stifle creativity among S-SCHIP programs.
Specific examples include more stringent limits on cost-sharing for lower-income families,
requirements for fraud detection, and requirements to implement the Consumer Bill of
Rights in managed care programs.
Third, states reported that they face significant barriers in coordinating with employersponsored insurance, an important vehicle for expanding insurance coverage among lowincome children and for avoiding crowd-out of private insurance coverage. Areas for
improvement include reducing requirements for employer contributions, minimizing waiting
periods without health insurance coverage, and easing requirements for health plans (such as
benefits and cost-sharing limits).
Fourth, states suggest that they cannot succeed in reducing the number of uninsured
low-income children until coverage is expanded to certain omitted groups, such as children
of public employees and uninsured parents. Some states believe that uninsured children will
not gain coverage until their parents are covered as well.
As the SCHIP program enters its fourth year, states will continue to strive to meet the
goal of reducing the number of low-income uninsured children. These recommendations
reflect state priorities for improving the SCHIP program.
VI. Recommendations for Improving Title XXI
REFERENCES
Campbell, J.A. “Health Insurance Coverage, 1998.” Current Population Reports, P60-208. U.S. Census
Bureau, October 1999.
Cunningham, P.J., and M.H. Park. “Tracking Recent Changes in Health Coverage for Low-Income
Children with the Community Tracking Study, 1996-1997 and 1998-1999. Research Report #4.”
Washington, DC: Center for Studying Health System Change, April 2000.
Czajka, J.L., and C. Olsen. “The Effects of Trigger Events on Children’s Changes in Health
Insurance Coverage.” Washington, DC: Mathematica Policy Research, April 2000.
Ellwood, M.R., and L. Ku. “Welfare and Immigration Reforms: Unintended Side Effects for
Medicaid.” Health Affairs, vol. 17, no. 3, May/June 1998.
Federal Register, vol. 64, no. 52, March 18, 1999, pp. 13428-13430.
Fisher, G. “Poverty Guidelines for 1992.” Social Security Bulletin, vol. 55, no. 1, spring 1992, pp. 4346.
Fronstin, P. “Trends in Health Insurance Coverage.” EBRI Issue Brief Number 185. Washington,
DC: EBRI, May 1997.
Ku, L., and B. Bruen. “The Continuing Decline in Medicaid Coverage.” Washington, DC: The
Urban Institute. Assessing the New Federalism, Series A, No. A-37, December 1999.
Lewis, K. A., M.R. Ellwood, and J.L. Czajka. “Counting the Uninsured: A Review of the Literature.”
Assessing the New Federalism, Occasional Paper No. 8. Washington, DC: The Urban Institute,
July 1998.
Selden, T.M., J.S. Banthin, and J.W. Cohen. “Medicaid's Problem Children: Eligible But Not
Enrolled.” Health Affairs, vol. 17, 1998, pp. 192-200.
U.S. Department of Commerce, Bureau of the Census. Children Without Health Insurance. Census
Brief, March 1998.
U.S. House of Representatives, Committee on Ways and Means. 1998 Green Book. Washington, DC:
U.S. Government Printing Office, 1998.
APPENDIX A
SUMMARY OF AMENDMENTS TO
TITLE XXI STATE PLANS,
AS OF AUGUST 1, 2000
TABLE A.1
SUMMARY OF AMENDMENTS TO TITLE XXI STATE PLANS, AS OF AUGUST 1, 2000
State
Alabama
Approval Date
Effective Date
Description
1
2
8/18/1998
9/28/1999
10/1/2000
1
5/21/1999
5/21/1999
2
8/23/1999
10/1/1999
3
12/1/1999
10/1/1999
Amended the reporting requirements regarding quality indicators, strategic objectives
and performance goals to the assurances and reports required by Title XXI. Also
clarified that cost sharing of any kind will not be imposed on American Indians and
that children who have been terminated from private insurance as a result of reaching
the lifetime limit are considered uninsured for Title XXI eligibility purposes
1
1
2
3
Pending
6/29/1998
12/21/1999
11/23/1999
7/1/1998
4
3/6/2000
5
7/7/2000
Colorado
Connecticut
1
1
9/21/1999
7/14/2000
9/21/1999
7/14/2000
Delaware
1
11/23/1999
7/1/1999
District of
Columbia
Florida
Established a gross income test for the S-SCHIP program
Increased enrollment broker fees from $25 to $50 per successful applicant
Raised the income threshold from 200 to 250 percent of FPL for S-SCHIP, expanded
retroactive coverage for medical services from 30 to 90 days prior to enrollment in
Healthy Families, and allowed Healthy Families to use the Medi-Cal income disregards
Allowed a Family Contribution Sponsor to pay a specific child's Healthy Families
Program premiums for the first year of enrollment
Exempted cost sharing for American Indians and Alaskan Native children who meet
the eligibility criteria for the Healthy Families Program and provide acceptable
documentation of their status
Expanded the upper age limit from 17 to 18
Provided for the implementation of full mental health parity. Provided Husky Part B
coverage to children of municipal employees if dependent coverage was terminated due
to extreme economic hardship. Removed children of Federal employees from the list
of ineligible children for Husky, Part B. Also exempted American Indian/Alaskan
Native children from cost sharing.
Discontinued the six-month waiting period for people who were disenrolled from the
program because they failed to pay their premiums
No amendment
1
9/8/1998
Georgia
2
3
1
Denied
3/31/2000
4/20/2000
10/1/1999
Hawaii
1
9/22/2000
7/1/2000
Idaho
1
2
1
1
12/4/1998
Pending
3/30/2000
12/22/1999
7/1/1998
Expanded eligibility from 185 to 200 percent of poverty and expanded the age criterion
from children age 1 through 5 to all children under age 19
Lowered income threshold from 160 percent of FPL to 150 percent
8/12/1998
1/1/2000
Established the S-SCHIP program and introduced cost sharing
Established the S-SCHIP program
Alaska
Arizona
Arkansas
California
Illinois
Indiana
Established the S-SCHIP program
Established All Kids Plus, a wrap around for children with special health care needs
No amendment
Added four reasons why a child would not be guaranteed an initial 12 months of
continuous coverage: 1) failure to cooperate, 2) whereabouts of the child are unknown,
3) child is a patient in an institution for mental diseases, and 4) child voluntarily
withdraws from the program
Established monthly premiums and increased the income limit to 200 percent FPL
Expanded eligibility for Healthy Kids from 185 percent of FPL to 200 percent of FPL
and added MediKids and CMS
Implemented a pilot for minimal dental benefits in two counties
Modified the reinstatement process to facilitate resuming coverage to children who
were cancelled due to non-payment of premiums. Also exempted cost sharing for
American Indians and Alaskan Native children who meet the eligibility criteria for the
program and provide acceptable documentation of their status.
TABLE A.1 (continued)
State
Approval Date
Effective Date
Description
1
2
6/16/1999
3/31/2000
1/1/1999
10/1/1999
3
6/14/2000
3/1/2000
Kansas
1
4/20/2000
Kentucky
1
9/3/1999
Established the S-SCHIP program
Established a 20 percent earnings disregard and added Unity Choice from Wellmark
Health Plan of Iowa
Added John Deere Health Plan in selected counties, removed cost sharing for
American Indian/Alaska Native children, and allowed a deduction of capital assets
when considering self-employment income
Extended coverage to newborns of mothers enrolled for a family member enrolled in SSCHIP through the end of the current continuous 12-month eligibility period of the
family member
Expanded M-SCHIP eligibility from 100 percent of FPL for 14 through 18 year old
children to 150 percent of FPL for children ages 1 to 19
Louisiana
Maine
Maryland
2
1
1
1
2
Pending
8/27/1999
Pending
Pending
Pending
1
6/29/1998
2
Pending
Iowa
Massachusetts
Michigan
Minnesota
Mississippi
Missouri
Montana
Nebraska
Nevada
New Hampshire
New Jersey
New Mexico
10/1/1999
Expanded eligibility from 133 percent to 150 percent of FPL
No amendment
Established a M-SCHIP program for children 16 through 18 through 150 percent of
FPL. Reduced family premiums for S-SCHIP to $5 per month regardless of the
number of children. Eliminated all copayments for S-SCHIP covered services and
required final eligibility determinations to be made by State staff.
No amendment
Established the S-SCHIP program with an income threshold of 133 percent of FPL
2/10/1999
1/1/1999
1
12/17/1999
1/1/2000
2
1
1
1
Pending
9/11/1998
Pending
10/13/1998
9/1/1998
Expanded M-SCHIP eligibility from 100 percent of FPL for children ages 15 through
18 to 185 percent of FPL for children under 19 years of age
1
1
1
2
Pending
3/25/1999
5/7/1999
8/3/1999
1/1/1999
1/13/1999
7/1/1999
Modified the benefit package
Shorten the waiting period from 12 to 6 months
Introduced income disregards, effectively expanding eligibility to 350 percent of FPL
3
7/7/2000
7/26/1999
4
3/16/2000
1/1/2000
Provided that a child whose gross family income does not exceed 200 percent of FPL
(Plans B and C) will be exempt from the 6-month waiting period if the child was
covered under an individual health benefits plan or COBRA plan prior to application.
Exceptions were also granted in Plans B, C, and D if the child had not been voluntarily
disenrolled from an ESI plan during the 6-month period prior to application, or the
child loses insurance as a result of a job change, when the insured does not have access
to affordable coverage in the new job.
Established presumptive eligibility if a preliminary determination by staff of an acute
care hospital, FQHC, or local health department indicates that the child meets either
NJ KidCare Plan A, B, C or Medicaid program eligibility standards, and the child is a
member of a household with a gross income not exceeding 200 percent of FPL
1
2
Denied
Pending
Expanded S-SCHIP eligibility from 133 percent of FPL to 200 percent of FPL and
introduced cost-sharing elements
Amended crowd-out policy
TABLE A.1 (continued)
State
New York
North Carolina
North Dakota
Ohio
Oklahoma
Oregon
Pennsylvania
Rhode Island
South Carolina
South Dakota
Tennessee
Texas
Utah
Vermont
Virginia
Washington
West Virginia
Wisconsin
Wyoming
1
2
Approval Date
Denied
9/24/1999
Effective Date
1
1/15/1999
2
6/23/1999
3
9/30/1999
4
1
1
1
1
2
1
2
3
Pending
11/12/1999
7/7/2000
3/25/1999
Pending
Pending
10/29/1998
3/7/2000
3/7/2000
1
2/5/1999
To be determined
1
10/29/1999
4/1/1999
1
1
1
2
3
1
11/5/1999
Denied
8/11/1999
2/28/2000
Pending
Pending
5/1/2000
1
2
3
1
3/19/1999
Pending
Pending
1/22/1999
1/1/1999
10/1/1998
11/1/1998
7/1/1999
4/1/1999
7/1/1999
Description
Requested retroactive matching funds
Expanded M-SCHIP eligibility to children 15 to 18 years in families with incomes at or
below 100 percent of FPL (who were not Medicaid eligible prior to March 31, 1997).
Expanded S-SCHIP eligibility from 185 percent of non-farm FPL to 192 percent. The
amendment also reduced cost-sharing requirements and provided additional benefits to
enrollees.
Modified the definition of "uninsured" to allow children formerly covered under the
Caring Program for Children, who are eligible for Title XXI, to enroll in SCHIP
without a six month waiting period
Expanded the acceptable sites for delivery of clinic services to include School-Based
Health Centers
Expanded dental services to include flouride applications, sealants, simple extractions,
therapeutic pulpotomies, and prefabricated stainless steel crowns
Established the S-SCHIP program
Increased the income level for eligibility up to 200 percent of the FPL
Accelerated the enrollment of children born prior to October 1, 1983
Expanded eligibility from 185 percent of FPL to 200 percent
Established disregards for child care and work expenses
Added outpatient mental health services, inpatient and outpatient substance abuse
services, rehabilitation services, and disposable medical supplies
Expanded eligibility from 250 percent of FPL to 300 percent
No amendment
Expanded eligibility from 133 percent of FPL to 140 percent
No amendment
Established the S-SCHIP program
Increased monthly premiums
Implemented a primary care case management delivery system
No amendment
Established the S-SCHIP program
Expanded M-SCHIP eligibility from 100 percent of FPL for children ages 15 through
18 to 185 percent of FPL. The parents of children enrolled under this M-SCHIP
expansion will be covered at the regular Federal Medical Assistance Percentage
(FMAP) using Section 1115 demonstration authority for Title XIX. Enhanced Title
XXI FMAP can be used to cover both the parents and the children if cost-effectiveness
for family coverage can be demonstrated. Once a family is enrolled, eligibility is
retained in the program until family income is above 200 percent of FPL. Children
living with a caretaker relative will also be covered if not otherwise covered by
Medicaid. The caretaker relative for these children will not be covered under this
expansion.
No amendment
NOTE: A number of states have amendments to disregard wages paid by the Census Bureau for temporary employment related to
Census 2000 activities. Since these are temporary amendments, they are not listed above.
APPENDIX B
SIMULATED PROGRAM ELIGIBILITY
FOR A HYPOTHETICAL FAMILY
AT 100, 133, 150, 185, 200, AND 250
PERCENT OF POVERTY
TABLE B.1
SIMULATED PROGRAM ELIGIBILITY FOR FOUR CHILDREN--INFANT AND AGES 5, 10, AND 17--IN A FAMILY OF SIX WITH
GROSS FAMILY INCOME OF 100 PERCENT OF THE 1999 FEDERAL POVERTY LEVEL
Infant
5 year old
10 year old
17 year old
M-SCHIP Only (N = 11)
Alaska
Idaho
Louisiana
Maryland
Minnesota
Nebraska
Ohio
South Carolina
South Dakota
Tennessee
Wisconsin
Medicaid
Medicaid
Medicaid
Medicaid
Medicaid
Medicaid
Medicaid
Medicaid
Medicaid
Medicaid
Medicaid
Medicaid
Medicaid
Medicaid
Medicaid
Medicaid
Medicaid
Medicaid
Medicaid
Medicaid
Medicaid
Medicaid
Medicaid
Medicaid
Medicaid
Medicaid
Medicaid
Medicaid
Medicaid
Medicaid
Medicaid
Medicaid
Medicaid
M-SCHIP
Medicaid
M-SCHIP
M-SCHIP
Medicaid
M-SCHIP
M-SCHIP
M-SCHIP
Medicaid
Medicaid
M-SCHIP
S-SCHIP Only (N = 6)
Kansas
Montana
North Carolina
Pennsylvania
Virginia
Washington
Medicaid
Medicaid
Medicaid
Medicaid
Medicaid
Medicaid
Medicaid
Medicaid
Medicaid
Medicaid
Medicaid
Medicaid
Medicaid
Medicaid
Medicaid
Medicaid
Medicaid
Medicaid
Medicaid
S-SCHIP
Medicaid
S-SCHIP
Medicaid
Medicaid
Combination programs (N = 10)
Alabama
California
Florida
Illinois
Indiana
Iowa
Maine
Massachusetts
New Jersey
North Dakota
Medicaid
Medicaid
Medicaid
Medicaid
Medicaid
Medicaid
Medicaid
Medicaid
Medicaid
Medicaid
Medicaid
Medicaid
Medicaid
Medicaid
Medicaid
Medicaid
Medicaid
Medicaid
Medicaid
Medicaid
Medicaid
Medicaid
Medicaid
Medicaid
Medicaid
Medicaid
Medicaid
Medicaid
Medicaid
Medicaid
M-SCHIP
M-SCHIP
M-SCHIP
M-SCHIP
Medicaid
M-SCHIP
Medicaid
M-SCHIP
M-SCHIP
Medicaid
SOURCE:
Mathematica Policy Research simulations based on analysis of Title XXI State Evaluations, Addendum to Table 3.1.1
NOTE:
The 1999 Federal poverty level for a family of six is a gross annual income of $22,340 in the 48 contiguous states and
D.C., $27,920 in Alaska, and $25,690 in Hawaii (Federal Register 1999). The simulation accounts for any income and
child care disregards used by each Medicaid and SCHIP program.
TABLE B.2
SIMULATED PROGRAM ELIGIBILITY FOR FOUR CHILDREN--INFANT AND AGES 5, 10, AND 17--IN A FAMILY OF SIX WITH
GROSS FAMILY INCOME OF 133 PERCENT OF THE 1999 FEDERAL POVERTY LEVEL
Infant
5 year old
10 year old
17 year old
M-SCHIP Only (N = 11)
Alaska
Idaho
Louisiana
Maryland
Minnesota
Nebraska
Ohio
South Carolina
South Dakota
Tennessee
Wisconsin
Medicaid
Medicaid
Medicaid
Medicaid
Medicaid
Medicaid
Medicaid
Medicaid
Medicaid
Medicaid
Medicaid
Medicaid
Medicaid
Medicaid
Medicaid
Medicaid
Medicaid
Medicaid
Medicaid
Medicaid
Medicaid
Medicaid
M-SCHIP
M-SCHIP
M-SCHIP
Medicaid
Medicaid
Medicaid
Medicaid
M-SCHIP
M-SCHIP
Medicaid
M-SCHIP
M-SCHIP
M-SCHIP
M-SCHIP
M-SCHIP
Medicaid
M-SCHIP
M-SCHIP
M-SCHIP
M-SCHIP
Medicaid
M-SCHIP
S-SCHIP Only (N = 6)
Kansas
Montana
North Carolina
Pennsylvania
Virginia
Washington
Medicaid
Medicaid
Medicaid
Medicaid
Medicaid
Medicaid
Medicaid
Medicaid
Medicaid
Medicaid
Medicaid
Medicaid
S-SCHIP
S-SCHIP
S-SCHIP
S-SCHIP
S-SCHIP
Medicaid
S-SCHIP
S-SCHIP
S-SCHIP
S-SCHIP
S-SCHIP
Medicaid
Combination programs (N = 10)
Alabama
California
Florida
Illinois
Indiana
Iowa
Maine
Massachusetts
New Jersey
North Dakota
Medicaid
Medicaid
Medicaid
Medicaid
Medicaid
Medicaid
Medicaid
Medicaid
Medicaid
Medicaid
Medicaid
Medicaid
Medicaid
Medicaid
Medicaid
Medicaid
Medicaid
Medicaid
Medicaid
Medicaid
S-SCHIP
S-SCHIP
S-SCHIP
M-SCHIP
M-SCHIP
Medicaid
Medicaid
M-SCHIP
M-SCHIP
S-SCHIP
S-SCHIP
S-SCHIP
S-SCHIP
M-SCHIP
M-SCHIP
M-SCHIP
Medicaid
M-SCHIP
M-SCHIP
S-SCHIP
SOURCE: Mathematica Policy Research simulations based on analysis of Title XXI State Evaluations, Addendum to Table 3.1.1
NOTE:
133 percent of the 1999 Federal poverty level for a family of six is a gross annual income of $29,712 in the 48 continguous
states and D.C., $37,134 in Alaska, and $34,168 in Hawaii (Federal Register 1999). The simulation accounts for any income
and child care disregards used by each Medicaid and SCHIP program.
TABLE B.3
SIMULATED PROGRAM ELIGIBILITY FOR FOUR CHILDREN--INFANT AND AGES 5, 10, AND 17--IN A FAMILY OF SIX WITH
GROSS FAMILY INCOME OF 150 PERCENT OF THE 1999 FEDERAL POVERTY LEVEL
Infant
5 year old
10 year old
17 year old
M-SCHIP Only (N = 11)
Alaska
Idaho
Louisiana
Maryland
Minnesota
Nebraska
Ohio
South Carolina
South Dakota
Tennessee
Wisconsin
M-SCHIP
M-SCHIP
M-SCHIP
Medicaid
Medicaid
Medicaid
Medicaid
Medicaid
Medicaid
Medicaid
Medicaid
M-SCHIP
M-SCHIP
M-SCHIP
Medicaid
Medicaid
Medicaid
Medicaid
Medicaid
Medicaid
Medicaid
Medicaid
M-SCHIP
M-SCHIP
M-SCHIP
Medicaid
Medicaid
M-SCHIP
Medicaid
M-SCHIP
M-SCHIP
Medicaid
M-SCHIP
M-SCHIP
M-SCHIP
M-SCHIP
M-SCHIP
Medicaid
M-SCHIP
M-SCHIP
M-SCHIP
M-SCHIP
Medicaid
M-SCHIP
S-SCHIP Only (N = 6)
Kansas
Montana
North Carolina
Pennsylvania
Virginia
Washington
Medicaid
S-SCHIP
Medicaid
Medicaid
S-SCHIP
Medicaid
S-SCHIP
S-SCHIP
S-SCHIP
S-SCHIP
S-SCHIP
Medicaid
S-SCHIP
S-SCHIP
S-SCHIP
S-SCHIP
S-SCHIP
Medicaid
S-SCHIP
S-SCHIP
S-SCHIP
S-SCHIP
S-SCHIP
Medicaid
Combination programs (N = 10)
Alabama
California
Florida
Illinois
Indiana
Iowa
Maine
Massachusetts
New Jersey
North Dakota
S-SCHIP
Medicaid
Medicaid
S-SCHIP
Medicaid
Medicaid
Medicaid
Medicaid
Medicaid
Medicaid
S-SCHIP
S-SCHIP
S-SCHIP
S-SCHIP
M-SCHIP
Medicaid
M-SCHIP
M-SCHIP
S-SCHIP
Medicaid
S-SCHIP
S-SCHIP
S-SCHIP
S-SCHIP
M-SCHIP
M-SCHIP
M-SCHIP
M-SCHIP
S-SCHIP
S-SCHIP
S-SCHIP
S-SCHIP
S-SCHIP
S-SCHIP
M-SCHIP
M-SCHIP
M-SCHIP
M-SCHIP
S-SCHIP
S-SCHIP
SOURCE: Mathematica Policy Research simulations based on analysis of Title XXI State Evaluations, Addendum to Table 3.1.1
NOTE:
150 percent of the 1999 Federal poverty level for a family of six is a gross ananual income of $33,510 in the 48 continguous
states and D.C., $41,880 in Alaska, and $38,535 in Hawaii (Federal Register 1999). The simulation accounts for any income
and child care disregards used by each Medicaid and SCHIP program.
TABLE B.4
SIMULATED PROGRAM ELIGIBILITY FOR FOUR CHILDREN--INFANT AND AGES 5, 10, AND 17--IN A FAMILY OF SIX WITH
GROSS FAMILY INCOME OF 185 PERCENT OF THE 1999 FEDERAL POVERTY LEVEL
Infant
5 year old
10 year old
17 year old
M-SCHIP Only (N = 11)
Alaska
Idaho
Louisiana
Maryland
Minnesota
Nebraska
Ohio
South Carolina
South Dakota
Tennessee
Wisconsin
M-SCHIP
Not eligible
Not eligible
Medicaid
Medicaid
Medicaid
Medicaid
Medicaid
Not eligible
Medicaid
Medicaid
M-SCHIP
Not eligible
Not eligible
Medicaid
Medicaid
Medicaid
Medicaid
Not eligible
Not eligible
Medicaid
Medicaid
M-SCHIP
Not eligible
Not eligible
Medicaid
Medicaid
M-SCHIP
M-SCHIP
Not eligible
Not eligible
Medicaid
M-SCHIP
M-SCHIP
Not eligible
Not eligible
M-SCHIP
Medicaid
M-SCHIP
M-SCHIP
Not eligible
Not eligible
Medicaid
M-SCHIP
S-SCHIP Only (N = 6)
Kansas
Montana
North Carolina
Pennsylvania
Virginia
Washington
S-SCHIP
Not eligible
Medicaid
Medicaid
S-SCHIP
Medicaid
S-SCHIP
Not eligible
S-SCHIP
S-SCHIP
S-SCHIP
Medicaid
S-SCHIP
Not eligible
S-SCHIP
S-SCHIP
S-SCHIP
Medicaid
S-SCHIP
Not eligible
S-SCHIP
S-SCHIP
S-SCHIP
Medicaid
Combination programs (N = 10)
Alabama
California
Florida
Illinois
Indiana
Iowa
Maine
Massachusetts
New Jersey
North Dakota
S-SCHIP
Medicaid
Medicaid
S-SCHIP
S-SCHIP
Medicaid
Medicaid
Medicaid
Medicaid
Not eligible
S-SCHIP
S-SCHIP
S-SCHIP
S-SCHIP
S-SCHIP
Medicaid
S-SCHIP
S-SCHIP
S-SCHIP
Not eligible
S-SCHIP
S-SCHIP
S-SCHIP
S-SCHIP
S-SCHIP
M-SCHIP
S-SCHIP
S-SCHIP
S-SCHIP
Not eligible
S-SCHIP
S-SCHIP
S-SCHIP
S-SCHIP
S-SCHIP
M-SCHIP
S-SCHIP
S-SCHIP
S-SCHIP
Not eligible
SOURCE: Mathematica Policy Research simulations based on analysis of Title XXI State Evaluations, Addendum to Table 3.1.1
NOTE:
185 percent of the 1999 Federal poverty level for a family of six is a gross annual income of $41,329 in the 48 continguous states
and D.C., $51,652 in Alaska, and $47,527 in Hawaii (Federal Register 1999). The simulation accounts for any income and child
care disregards used by each Medicaid and SCHIP program.
TABLE B.5
SIMULATED PROGRAM ELIGIBILITY FOR FOUR CHILDREN--INFANT AND AGES 5, 10, AND 17--IN A FAMILY OF SIX WITH
GROSS FAMILY INCOME OF 200 PERCENT OF THE 1999 FEDERAL POVERTY LEVEL
Infant
5 year old
10 year old
17 year old
M-SCHIP Only (N = 11)
Alaska
Idaho
Louisiana
Maryland
Minnesota
Nebraska
Ohio
South Carolina
South Dakota
Tennessee
Wisconsin
M-SCHIP
Not eligible
Not eligible
M-SCHIP
Medicaid
Medicaid
Medicaid
Medicaid
Not eligible
Medicaid
Not eligible
M-SCHIP
Not eligible
Not eligible
M-SCHIP
Medicaid
M-SCHIP
Medicaid
Not eligible
Not eligible
Medicaid
Not eligible
M-SCHIP
Not eligible
Not eligible
M-SCHIP
Medicaid
M-SCHIP
M-SCHIP
Not eligible
Not eligible
Medicaid
Not eligible
M-SCHIP
Not eligible
Not eligible
M-SCHIP
Medicaid
M-SCHIP
M-SCHIP
Not eligible
Not eligible
Medicaid
Not eligible
S-SCHIP Only (N = 6)
Kansas
Montana
North Carolina
Pennsylvania
Virginia
Washington
S-SCHIP
Not eligible
S-SCHIP
S-SCHIP
Not eligible
Medicaid
S-SCHIP
Not eligible
S-SCHIP
S-SCHIP
Not eligible
Medicaid
S-SCHIP
Not eligible
S-SCHIP
S-SCHIP
Not eligible
Medicaid
S-SCHIP
Not eligible
S-SCHIP
S-SCHIP
Not eligible
Medicaid
Combination programs (N = 10)
Alabama
California
Florida
Illinois
Indiana
Iowa
Maine
Massachusetts
New Jersey
North Dakota
S-SCHIP
Medicaid
S-SCHIP
Not eligible
S-SCHIP
Medicaid
S-SCHIP
M-SCHIP
S-SCHIP
Not eligible
S-SCHIP
S-SCHIP
S-SCHIP
Not eligible
S-SCHIP
S-SCHIP
S-SCHIP
S-SCHIP
S-SCHIP
Not eligible
S-SCHIP
S-SCHIP
S-SCHIP
Not eligible
S-SCHIP
S-SCHIP
S-SCHIP
S-SCHIP
S-SCHIP
Not eligible
S-SCHIP
S-SCHIP
S-SCHIP
Not eligible
S-SCHIP
S-SCHIP
S-SCHIP
S-SCHIP
S-SCHIP
Not eligible
SOURCE: Mathematica Policy Research simulations based on analysis of Title XXI State Evaluations, Addendum to Table 3.1.1
NOTE:
200 percent of the 1999 Federal poverty level for a family of six is a gross annual income of $44,680 in the 48 continguous
states and D.C., $55,840 in Alaska, and $51,380 Hawaii (Federal Register 1999). The simulation accounts for any income
and child care disregards used by each Medicaid and SCHIP program.
TABLE B.6
SIMULATED PROGRAM ELIGIBILITY FOR FOUR CHILDREN--INFANT AND AGES 5, 10, AND 17--IN A FAMILY OF SIX WITH
GROSS FAMILY INCOME OF 250 PERCENT OF THE 1999 FEDERAL POVERTY LEVEL
Infant
5 year old
10 year old
17 year old
M-SCHIP Only (N = 11)
Alaska
Idaho
Louisiana
Maryland
Minnesota
Nebraska
Ohio
South Carolina
South Dakota
Tennessee
Wisconsin
Not eligible
Not eligible
Not eligible
Not eligible
Medicaid
M-SCHIP
Not eligible
Not eligible
Not eligible
Medicaid
Not eligible
Not eligible
Not eligible
Not eligible
Not eligible
Medicaid
M-SCHIP
Not eligible
Not eligible
Not eligible
Medicaid
Not eligible
Not eligible
Not eligible
Not eligible
Not eligible
Medicaid
M-SCHIP
Not eligible
Not eligible
Not eligible
Medicaid
Not eligible
Not eligible
Not eligible
Not eligible
Not eligible
Medicaid
M-SCHIP
Not eligible
Not eligible
Not eligible
Medicaid
Not eligible
S-SCHIP Only (N = 6)
Kansas
Montana
North Carolina
Pennsylvania
Virginia
Washington
Not eligible
Not eligible
Not eligible
Not eligible
Not eligible
S-SCHIP
Not eligible
Not eligible
Not eligible
Not eligible
Not eligible
S-SCHIP
Not eligible
Not eligible
Not eligible
Not eligible
Not eligible
S-SCHIP
Not eligible
Not eligible
Not eligible
Not eligible
Not eligible
S-SCHIP
Combination programs (N = 10)
Alabama
California
Florida
Illinois
Indiana
Iowa
Maine
Massachusetts
New Jersey
North Dakota
Not eligible
S-SCHIP
Not eligible
Not eligible
Not eligible
Medicaid
Not eligible
Not eligible
S-SCHIP
Not eligible
Not eligible
S-SCHIP
Not eligible
Not eligible
Not eligible
Not eligible
Not eligible
Not eligible
S-SCHIP
Not eligible
Not eligible
S-SCHIP
Not eligible
Not eligible
Not eligible
Not eligible
Not eligible
Not eligible
S-SCHIP
Not eligible
Not eligible
S-SCHIP
Not eligible
Not eligible
Not eligible
Not eligible
Not eligible
Not eligible
S-SCHIP
Not eligible
SOURCE: Mathematica Policy Research simulations based on analysis of Title XXI State Evaluations, Addendum to Table 3.1.1
NOTE:
250 percent of the 1999 Federal poverty level for a family of six is a gross annual income of $55,850 in the 48 continguous
states and D.C., $69,800 in Alaska, and $64,225 Hawaii (Federal Register 1999). The simulation accounts for any income
and child care disregards used by each Medicaid and SCHIP program.
APPENDIX C
NUMBER OF CHILDREN EVER ENROLLED
IN SCHIP BY STATE FROM FIRST
QUARTER OF FFY 1998 THROUGH
SECOND QUARTER OF FFY 2000
TABLE C.1
NUMBER OF CHILDREN EVER ENROLLED IN SCHIP, BY STATE FROM FIRST QUARTER OF FFY 1998 THROUGH SECOND QUARTER OF FFY 2000a
State
Type of
SCHIP
Programb
Date
SCHIP
Enrollment
Beganc
Number Ever Enrolled
Q1
Federal Fiscal Year 1998
Q2
Q3
Q4
Q1
Federal Fiscal Year 1999
Q2
Q3
Q4
Federal Fiscal Year 2000
Q1
Q2
Total
41,444
96,413
407,330
664,723
880,947
1,129,606
1,407,123
1,608,383
1,770,448
1,809,005
Number of states reporting
Number of states NI
Number of states NR
Alabama
COMBO
Alaska
M-SCHIP
Arizona
S-SCHIP
M-SCHIP
Arkansasd
COMBO
Californiae
Colorado
S-SCHIP
COMBO
Connecticute
Delaware
S-SCHIP
District of Columbia
M-SCHIP
Florida
COMBO
S-SCHIP
Georgiaf
Hawaii
M-SCHIP
Idaho
M-SCHIP
Illinois
COMBO
COMBO
Indianag
Iowa
COMBO
Kansas
S-SCHIP
Kentucky
COMBO
M-SCHIP
Louisianaa
Maine
COMBO
M-SCHIP
Marylandh
Massachusetts
COMBO
COMBO
Michigana
Minnesota
M-SCHIP
COMBO
Mississippie
6
43
2
NI
NI
NI
NI
NI
NI
NR
NI
NI
NI
NI
NI
959
NI
13,355
NI
NI
NI
NI
NI
NI
844
NI
NI
NI
10
38
3
3,671
NI
NI
NI
NR
NI
NR
NI
NI
NI
NI
NI
2,413
18,193
14,687
NI
NI
NI
NI
NI
NI
1,240
NI
NI
NI
15
33
3
6,699
NI
NI
NI
NR
6,797
NR
NI
NI
27,907
NI
NI
3,593
20,558
15,653
NI
NI
NI
NI
NI
NI
2,309
4,076
NI
12,433
28
22
1
8,106
NI
NI
NI
15,984
10,377
895
NI
NI
51,664
NI
NI
4,339
22,899
20,551
4,798
NI
5,779
NI
3,204
6,326
17,378
5,224
NI
5,477
40
9
2
12,988
NI
1,316
NR
39,667
12,830
1,889
NI
707
63,301
639
NI
4,772
24,938
24,981
6,293
NI
5,467
3,509
6,272
10,338
30,913
10,003
9
8,077
44
3
2
17,532
2,274
11,445
NR
87,587
15,135
2,860
816
1,317
78,827
17,433
NI
4,672
28,750
27,063
6,926
7,955
6,753
12,503
8,247
12,889
41,380
14,484
15
9,719
46
3
2
21,229
4,878
16,068
NR
129,443
19,362
3,524
2,577
1,686
103,723
64,407
NI
4,877
33,940
28,909
8,644
11,910
7,964
17,808
9,138
15,359
46,867
19,568
10
10,375
46
3
2
26,213
7,936
19,924
913
178,791
20,932
4,478
2,565
1,964
128,432
45,789
NI
5,285
39,099
30,647
9,896
13,882
27,766
20,504
10,180
16,657
55,028
21,052
6
10,872
43
2
6
29,879
NR
29,838
1,108
218,856
23,388
4,810
3,041
2,225
136,638
60,063
NI
6,414
45,046
37,644
11,252
16,148
49,640
28,739
11,584
17,519
58,437
21,729
NR
NR
38
2
11
26,866
NR
34,958
1,140
265,402
33,114
5,264
6,552
1,914
155,969
74,337
NI
7,450
50,189
NR
11,877
18,345
73,595
29,400
12,594
16,554
67,087
NR
NR
NR
02/02/98
03/01/99
11/01/98
10/01/98
03/01/98
04/22/98
10/01/97
02/01/99
10/01/98
04/01/98
01/01/99
01/03/00
10/01/97
01/05/98
06/01/97
07/01/98
01/01/99
07/01/98
11/01/98
07/01/98
07/01/98
10/01/97
04/01/98
09/30/98
07/01/98
TABLE C.1 (continued)
State
Missouri
Montana
Nebraskaa
Nevada
New Hampshire
New Jerseya
New Mexico
New Yorka,d
North Carolina
North Dakotaf
Ohio
Oklahoma
Oregon
Pennsylvaniaf
Rhode Island
South Carolina
South Dakota
Tennesseee
Texas g
Utah
Vermont
Virginia
Washington
West Virginia
Wisconsin
Wyoming
Type of
SCHIP
Programb
M-SCHIP
S-SCHIP
M-SCHIP
S-SCHIP
COMBO
COMBO
M-SCHIP
COMBO
S-SCHIP
COMBO
M-SCHIP
M-SCHIP
S-SCHIP
S-SCHIP
M-SCHIP
M-SCHIP
M-SCHIP
M-SCHIP
M-SCHIP
S-SCHIP
S-SCHIP
S-SCHIP
S-SCHIP
COMBO
M-SCHIP
S-SCHIP
Date
SCHIP
Enrollment
Beganc
07/01/98
01/01/99
07/01/98
10/01/98
05/01/98
02/01/98
03/01/99
04/15/98
10/01/98
10/01/98
01/01/98
12/01/97
07/01/98
05/28/98
10/01/97
08/01/97
07/01/98
10/01/97
07/01/98
08/03/98
10/01/98
10/26/98
02/01/00
07/01/98
04/01/99
12/01/99
Number Ever Enrolled
Q1
NI
NI
NI
NI
NI
NI
NI
NI
NI
NI
NI
2,837
NI
NI
2,232
21,217
NI
NR
NI
NI
NI
NI
NI
NI
NI
NI
Federal Fiscal Year 1998
Q2
Q3
NI
NI
NI
NI
NI
3,603
NI
NI
NI
NI
14,659
8,054
NI
NI
2,476
27,417
NI
NR
NI
NI
NI
NI
NI
NI
NI
NI
NI
NI
17
NI
3
9,073
NI
219,051
NI
NI
30,416
11,791
NI
NI
2,775
34,179
NI
NR
NI
NI
NI
NI
NI
NI
NI
NI
Q4
Q1
10,809
NI
2,115
NI
71
16,614
NI
259,999
NI
NI
40,804
14,746
6,488
57,481
2,790
40,768
1,047
NR
25,176
2,653
NI
NI
NI
161
NI
NI
23,950
NI
4,358
2,850
174
24,336
NI
297,569
19,649
87
47,822
17,944
11,930
71,819
2,855
40,154
1,519
NR
37,078
5,128
370
2,125
NI
321
NI
NI
SOURCE: Mathematica Policy Research analysis of HCFA's Statistical Information Management System (SIMS) as of June 27, 2000.
Federal Fiscal Year 1999
Q2
Q3
34,104
948
5,164
4,436
1,219
31,645
NI
330,741
33,835
135
51,637
22,651
15,803
74,046
4,055
42,813
1,827
NR
40,358
8,117
907
8,145
NI
438
NI
NI
42,817
924
5,665
6,067
618
38,326
1,168
388,038
45,445
145
55,737
26,288
16,175
76,272
4,726
46,347
2,180
NR
37,918
10,816
1,207
11,793
NI
2,794
3,391
NI
Q4
44,190
924
6,925
7,190
2,053
46,653
1,736
438,421
57,420
134
60,985
NR
17,472
82,893
5,752
49,469
2,696
NR
34,980
13,697
1,483
14,580
NI
7,569
12,350
NI
Federal Fiscal Year 2000
Q1
Q2
52,134
2,459
6,923
8,354
2,403
57,736
2,520
479,244
66,582
1,013
63,611
NR
19,149
86,252
4,466
NR
3,032
NR
32,109
15,454
1,950
19,167
NI
10,160
21,470
262
55,529
3,949
7,382
9,016
2,953
65,896
3,705
511,787
69,996
1,491
NR
NR
21,266
89,610
7,278
NR
3,391
NR
30,353
17,028
2,218
NR
NI
12,280
NR
1,270
TABLE C.1 (continued)
NI = State's SCHIP program was not implemented.
NR = State has not yet reported SCHIP enrollment to HCFA, or, if noted, the reported data have not been included due to inconsistencies.
a
The enrollment data are taken from HCFA's SCHIP reporting system as of June 27, 2000, for all states except Louisiana, Michigan, Nebraska, New Jersey, and New York. For these states, MPR received the
following data directly: Louisiana Q2 1999 and Q2 2000 M-SCHIP; Michigan Q1 2000 S-SCHIP; Nebraska Q1 2000 M-SCHIP; New Jersey Q2 1998 through Q2 2000 all SCHIP data; and New York Q1 2000
and Q2 2000 M-SCHIP.
b
The type of SCHIP program is as of March 31, 2000.
c
The date enrollment began is taken from the state evaluations submitted by states to HCFA in spring 2000.
d
Because Arkansas and New York did not report any quarterly M-SCHIP enrollment for the fourth quarter of FFY 1999, data shown here are the ever enrolled in FFY 1999. However, the number ever enrolled
for the year is usually higher than the number ever enrolled for the quarter. MPR did not include Arkansas M-SCHIP data for Q1 1999 through Q3 1999 due to data inconsistencies.
e
Data for the following state programs are not reported, because the quarterly data they provided to HCFA are not complete or appear to have inconsistencies: California M-SCHIP; Connecticut M- SCHIP;
Mississippi M-SCHIP; and Tennessee M-SCHIP.
f
Data for the first quarter of FFY2000 were imputed averaging data from the fourth quarter of FFY1999 and the second quarter of FFY 2000 for the following states: Georgia S-SCHIP, North Dakota MSCHIP, and Pennsylvania S-SCHIP. MPR also imputed Pennsylvania's data for Q2 1999 by averaging data from Q1 1999 and Q3 1999.
g
Enrollment in the Texas M-SCHIP program declined because children aged out of M-SCHIP and onto traditional Medicaid. The S-SCHIP program in Texas began in the third quarter of FFY 2000.
Beginning in the third quarter of FFY 2000, the type of program for Texas will change to COMBO.
h
In July 2000, Maryland was authorized to claim enhanced matching retroactively for children enrolled in the state's Section 1115 waiver demonstration. Revised enrollment counts are as follows: FFY 1999,
Q1: 39,792; Q2: 29,054; Q3: 55,842; Q4: 63,016; FFY 2000, Q1: 68,707; Q2: 74,437.


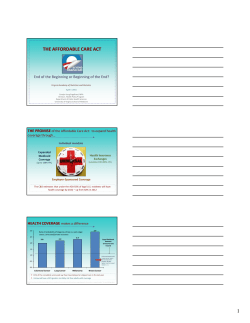


© Copyright 2026