
Document 672
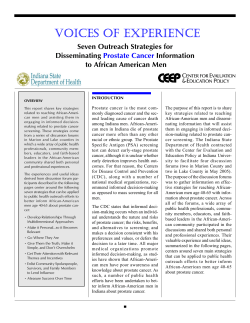
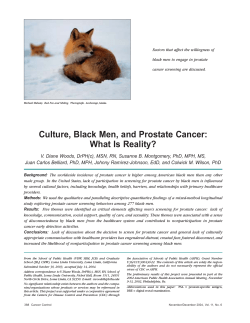
Reams et al. Infectious Agents and Cancer 2011, 6(Suppl 2):S1
http://www.infectagentscancer.com/content/6/S2/S1
PROCEEDINGS
Open Access
Detecting gene-gene interactions in prostate
disease in African American men
R Renee Reams1*, Krishna Rani Kalari2, Honghe Wang3, Folakemi T Odedina4,5, Karam FA Soliman1, Clayton Yates3
From The Science of Global Prostate Cancer Disparities in Black Men
Jacksonville, FL, USA. 27-29 August 2010
Abstract
Background: The most common male malignancy in the United States is prostate cancer; however its rate of
occurrence varies significantly among ethnic groups. In a previous cDNA microarray study on CaP tumors from African
American (AA) and Caucasian (CA) patients, we identified 97 candidate genes that exhibited opposite gene expression
polarity with respect to race groups; genes up-regulated in AA were simultaneously down-regulated in CA.
Purpose: The purpose of this study was to narrow the 97 member gene list, to a smaller number of genes in order to
focus studies on a limited number of genes/SNPs that might explain prostate cancer disparity in African Americans.
Methods: We performed genotype-phenotype, SNP and expression transcript levels correlations using HapMap
Yoruba population with 85 of our 97 prostate candidate genes using SCAN database.
Results: Findings revealed an association of SNPs surrounding ABCD3 gene with basal gene expression of
RanGAP1 is important in prostate tumors in AA. Hence, to confirm our results in clinical biospecimen, we
monitored expression of ABCD3 in a novel panel of African American and Caucasian prostate cancer paired cell
lines. The LNCaP, C4-2B showed 2-fold increase; MDA-2PC-2B cell line, derived from AA, showed highest foldchange, 10-fold. The EGFR over expressing DU-145 WT cell line exhibited a 4-fold increase in expression relative to
non transfected DU-145 prostate cell lines. Furthermore, Ingenuity Network analysis implicated our AA prostate
candidate genes are involved in three network hubs, ERK, MapK and NFkB pathways.
Conclusions: Taken together, these findings are intriguing because other members of the ABC gene family, namely,
ABCC3, ABCD1, and ABCD2 have been shown to confer chemoresistance in certain cancer types. Equally important, is
the fact that activation of the MapK/ERK pathway via EGFR stimulation is vital for increased transcription of numerous
cancer related genes. It is especially noteworthy that overexpression of EGFR has been widely observed in AA prostate
tumors. Collectively our findings lead us to think that a novel signaling cascade, through which increased
aggressiveness and chemoresistance is achieved, may explain prostate cancer health disparity in AA males and the
nature of aggressive CaP tumors in general.
Introduction
Prostate cancer (CaP) is the second leading cause of
cancer-related death among all men in the United States.
However, incidence and mortality rates for this disease
vary substantially among geographic areas and ethnic
groups. Most notably African American men (AA) in the
United States have the highest risk (19%) of developing
* Correspondence: [email protected]
1
College of Pharmacy and Pharmaceutical Sciences, Florida A&M University,
Tallahassee, Florida, USA
Full list of author information is available at the end of the article
prostate cancer, and due to the development of more
aggressive disease, they have more than twice the mortality
rate observed for other racial and ethnic groups [1]. The
explanation for these differences is still unknown; however
proposed explanations include genetic factors, dietary factors, behavioral factors, biological tumor aggressiveness,
socio-economic factors and gene-environment interaction
[2-35]. While AA race/ethnicity is one of the three primary non-modifiable risk factors confirmed for CaP, there
are only a few published cDNA microarray studies [36-38]
that have focused on gene expression differences in AA
© 2011 Reams et al; licensee BioMed Central Ltd. This is an open access article distributed under the terms of the Creative Commons
Attribution License (http://creativecommons.org/licenses/by/2.0), which permits unrestricted use, distribution, and reproduction in
any medium, provided the original work is properly cited.
Reams et al. Infectious Agents and Cancer 2011, 6(Suppl 2):S1
http://www.infectagentscancer.com/content/6/S2/S1
Page 2 of 10
Population in Ibaden, Nigeria, Africa was used because of
close ancestral ties of Nigerians to African Americans.
The SCAN analysis output reports a list of SNPs in gene
(s) that predict expression quantitative trait loci found in
mRNA profiles from YRI with p-values less than 0.0001.
tumors compared to CA in an attempt to understand
prostate cancer health disparity. Previously we identified
97 genes differentially expressed in AA prostate tumors.
To narrow down this number of genes, we utilized
advance bioinformatics methods. In the present study we
performed genotype-phenotype or SNP and expression
transcript level correlations of HapMap lymphoblastoid
cell lines from Yoruba population to the 97 prostate candidate genes in AA, in an attempt to ferret out genetic
variants associated with AA population. In addition, we
used Ingenuity pathway analysis to calculate the probability of finding our set of candidate genes within a given
pathway(s) to establish probable signal transduction
mechanisms.
To enter a list of genes into SCAN, it is first necessary to
use the HUGO (Human Genome Organization) gene symbol - the unique gene name and symbol given to each
human gene by The HUGO Gene Nomenclature Committee (HGNC). From our 97 gene list, we were able to obtain
HUGO gene symbols for 85 of the 97 genes (hereafter
referred to as 85/97).
Methods
Ingenuity pathway analysis
Microarray prostate candidate gene list for AA tumors
Ingenuity software (http://www.ingenuity.com/) was used
for pathway analysis. Ingenuity software calculates p-value
for the probability of finding a set of genes within a given
pathway. Fisher’s exact test was used to calculate the
p-values associated with finding 536 prostate genes
obtained during this study (which includes 85/97 candidate genes, from previous differential expression study
[36] and 451 candidate genes that are corresponding to
Cis- regulatory SNPs, that are significantly associated with
the 85 candidate genes) within a annotated network from
Ingenuity Knowledge Base.
The gene list used in this study was obtained from our
previously published cDNA microarray study [36].
SCAN database analysis to look for gene-gene
interactions
SCAN is a large-scale database of genetics and genomics
data associated to a web-interface and a set of methods
and algorithms that can be used for mining the data in it
(http://www.scandb.org/newinterface/about.html). Information on the relationship between SNPs and expression
transcript levels (eQTLs) that is served by SCAN comes
from a series of publications describing studies characterizing eQTLs in lymphoblastoid cell lines from HapMaP
Caucasian (CEU) and Yoruba (YRI) samples for which
transcript levels have been assayed using the Affymetrix
Human Exon 1.0 ST Array [39-44].
The SCAN database contains two categories of SNP
annotations: (1) Physical-based annotation or SNPs categorized according to their position relative to genes (intronic, antigenic, etc.) and according to linkage disequilibrium
(LD) patterns (an intergenic SNP can be annotated to a
gene if it is in LD with variation in the gene). (2) Functional
annotation where SNPs are classified according to their
effects on expression levels, i.e. whether they are eQTLs for
that gene. Information on physical, functional and LD
annotation served on the SCAN database comes directly
from public resources, including HapMap (release 23a),
NCBI (dbSNP 129), or is information created by using data
downloaded from these public resources. In SCAN database, genotype data for the YRI samples was obtained from
HapMap project (http://www.hapmap.org). Genotype and
gene annotations were obtained from NCBI, dbSNP 129.
We uploaded appropriate gene identifiers for our prostate candidate genes and queried for SNPs that are significantly associated with expression of prostate candidate
genes in Yoruba (YRI) population in lymphoblastoid cell
lines. SCAN genetic and genomic data for the Yoruba
Hugo gene symbols
RT-PCR validation in novel panel of prostate cancer lines
RT-PCR assay was done using a 7500 FAST Real-Time
ABI System.
Briefly, total RNA from each cultured prostate cell line
was extracted, separately, with RNAzol B (Tel-Test Inc.,
Friedswood, Tx) according to the manufacturer’s protocol
and quantified with Nucleic Acid Quantitation Kit (NBI,
Plymouth, MN). Total RNA (1 ug) was reverse transcribed
into cDNA with RT2 First strand Kit (SABiosciences/A
Qiagen Company)) and 1.10 of the reverse-transcribed
product from each sample was used for PCR to amplify
ABCD3 gene, using a RT2 qPCR Primer Assay for Human
ABCD3 (SABiosciences/A Qiagen Company) The expression of GAPDH was used as an internal control/housekeeping gene. Experimental conditions for the ABCD3
gene was optimized to analyze the amplified product in
the linear range of amplification by adjusting amplification
cycles for each set of primers. The expected band size (bp)
size of the PCR product was 83, as described by vendor
(SABiosciences).
Novel prostate cancer cell lines: description
Non-malignant (RC-77N/E) and malignant (RC-77T/E)
prostate cells were derived from an African American
prostate cancer patient and both are androgen sensitive
[45]. RC-77N/E cells were isolated from pathological
Reams et al. Infectious Agents and Cancer 2011, 6(Suppl 2):S1
http://www.infectagentscancer.com/content/6/S2/S1
normal cells, while RC-77T/E were derived from stage
T3 tumor. Both cell lines are cultured in Keratinocyte
Serum-Free Medium (KGM) Life Technologies,
Gaithersburg, Md., USA), supplemented with bovine
pituitary extract (BPE), recombinant epidermal growth
factor (rEGF), 1% (v/v) penicillin-streptomycin-neomycin (PSN) antibiotic mixtures and 1% (v/v) amphotericin
B (KGM) (Life Technologies, Gaithersburg, MD, USA).
MDA-2PC-2B, also derived from an African American
patient are androgen dependent, metastatic and are cultured in F12 K medium. DU-145, a cell line originally
derived from a brain metastasis of a human prostate
adenocarcinoma [46] retains the androgen independence
of the original tumor and does not express a functional
AR [47]. This cell line has both LHRH-R and epidermal
growth factor receptors (EGFR) and produces the EGFR
ligands, transforming growth factor a (TGF-a) and EGF
[48,49]. Utilizing established protocols, DU-145 cells
were transfected by retroviral-containing EGFR constructs [50]. The wild-type (WT) EGFR construct is a
full-length cDNA derived from a placental cDNA
library. Cells expressing WT EGFR at levels that escape
downregulation demonstrate enhanced invasiveness in
vitro [51]. LNCaP cells were derived from a lymph node
metastasis [52]. The Caucasian LNCaP, C42-B prostate
cancer cell lines were maintained in T-medium as previously described.
Results
Origin of the 97 prostate candidate genes
To detect for gene-gene interactions in AA prostate
tumors in African American males, we used a cDNA
microarray gene list obtained from a pilot project cDNA
microarray comparison study of prostate tumor gene
expression in AA and CA [36]. To obtain differentially
expressed gene or the gene list, we used four snap frozen
tumors and four snap frozen non-tumor matched controls,
each, from AA and CA . All tumors had a Gleason score
of six. Gene expression profiles were measured for each of
the micro dissected CaP tumor samples using Affymetrix
U133A human arrays as described in [36]. Each of the 8
prostate tumors and 8 matched controls underwent single
hybridization and was arrayed individually (i.e. samples
were not pooled). Data from the micro array CEL files
were uploaded to R-Bioconductor for analysis [53]. We
paired normal AA tissue to tumor AA and paired normal
CA to tumor CA to generate for case paired t-tests for
each race group; gene lists of differentially expressed genes
in AA Tumor vs. AA controls and of CA Tumor vs. CA
controls were generated. We looked for differentially
expressed genes that met the filtering criteria of a 4.0-fold
change and a p< 0.0001. Neither the comparison of AA
tumor to AA controls nor the comparison CA tumors to
CA controls yielded genes that met both parts of our
Page 3 of 10
filtering criteria. However, when we looked at the ratio of
CA tumor/CA normal to AA tumor/AA normal (casematched ratios-race group tests for specific expression
trends) we found 97 statistically significant, differentially
expressed genes with 4-fold or greater fold change and
p<0.0001. It was necessary to ratio the ratios to control for
the high degree of genetic variation in AA tumor and AA
non-tumor samples.
Scan database SNP and expression transcript level
association results
After uploading our 85/97 prostate candidate genes with
appropriate HUGO gene symbols and querying for SNPs
in our 85/97 significantly associated with SNPs in the
HapMap Yoruba (YRI) population; approximately, 26527
genotype-phenotype associations were obtained with a
p-value < 10-3, of which 17542/26527 associations had a
p-value <10-4 ( data not shown)
SNPs and expression transcript levels (eQTL) associations results identified two gene-gene associations. Association results in lymphoblastoid cell lines showed that
expression of RanGAP1 gene which is a key regulator of
the RAN GTP/GDP cycle, located on chromosome 22,
may be involved with several SNPs in ABCD3 gene which
is ATP-Binding cassette, subfamily member that is located
on chromosome 1 (Shown as encircled dots on far left in
Figure 1). In addition, expression of STXBP2 gene which
is a syntaxin-binding protein that is located on chromosome 19 may be involved with a region on chromosome
12. The chromosome 12 region consists of transmembrane and tetratricopeptide repeat containing 2 (TMTC2)
gene that is approximately 400kb away from the region
where STXBP2 gene is associated (shown as encircled
dots on far right of Figure 1). Genome-wide results also
showed that there were 1167 cis interactions (where
expression gene and SNP are located on the same chromosome) out of 26527 associations with a p-value < 10-3.
Most of the cis-regulatory associations were found in protein coding regions.
CaP candidate genes found in ERK, MapK, NFKB pathways
Pathway analysis was performed in an attempt to define
biological relationships among candidate genes identified
during our study using the genes that are involved with
the downstream effects of SNPs along with the 85/97
candidate prostate cancer genes as described in methods. Ingenuity Pathway Analysis (IPA) was used to perform the pathway analysis. This software consists of a
curated database and several analysis tools to determine
the probability of finding a set of genes within annotated
pathway or network annotation. Results showed a high
probability for finding our candidate genes in three network hubs centered on ERK, MAPK and NFkB pathways (Shown in Figures 2, 3 and 4, respectively). These
Reams et al. Infectious Agents and Cancer 2011, 6(Suppl 2):S1
http://www.infectagentscancer.com/content/6/S2/S1
Page 4 of 10
9
8
7
6
5
4
1
2
3
4
5
6
7
8
9
10
11
12
13 14 15 16 17 18 19 20 21 22
Chromosome Number
Figure 1 GWAS Plot of Gene-Gene Associations illustrates p-values (shown on y-axis) of SNP for gene variants found on chromosomes 1-22(xaxis). The x-axis shows Chromosomes 1 thru 22. Each dot represents gene variants or SNPs. In the circled dots to the extreme left positioned
above Chromosome 1 (x-axis), the dot with the highest p-value represents an ABCD3 gene variant with a defined rs# that is strongly interacting
with RANGAP1 to influence CaP tumors in African American. All of the dots in the circle reveal an association of SNPs surrounding ABCD3 gene
with basal gene expression of RanGAP1. This variation in gene expression RanGAP1 might be influenced by the SNPs in ABCD3 Similarly in the
circled points to the far right, positioned above chromosome 12 ( x-axis), the dot with the highest p-value represents the TMTC2 gene variant
with a defined rs#, that strongly interacts with STXBP2. All the dots in the circle represent an association of SNPs surrounding TMTC2 gene with
basal gene expression of STXBP2.
Figure 2 Ingenuity Pathway Analysis identified ERK as the Top network signaling Hub where the shaded shapes indicate the candidate genes
from the present study. RANGAP1 is found in the ERK pathway. Dotted line indicates an indirect cellular interaction and solid lines indicate a
physical interaction between genes. Genes are identified with their HUGO symbol. Dotted line indicates an indirect cellular interaction and solid
lines indicate a physical interaction (acts on or inhibits) between genes. Different shapes (diamond, circle or rectangles) of the nodes represent
functional classification of the genes.
Reams et al. Infectious Agents and Cancer 2011, 6(Suppl 2):S1
http://www.infectagentscancer.com/content/6/S2/S1
Page 5 of 10
Figure 3 Ingenuity Pathway Analysis identified MapK as second Top network signaling Hub where the shaded shapes indicate the candidate
genes from current study. Dotted line indicates an indirect cellular interaction and solid lines indicate a physical interaction between genes.
Molecules are identified with their HUGO symbol. Different shapes (diamond, circle or rectangles) of the nodes represent functional classification
of the genes shown.
“top” three networks with p values of <0.05 based on
Fisher’s exact test were associated with genetic disorder,
cellular development, cell death and cell signaling.
Direct interactions between the genes in the network
pathways are indicated by solid lines and indirect relationships are indicated by dashed lines. The shaded
genes represent our 536 candidate genes identified in
our association study as described in method section (85
candidate genes + 451 cis-regulatory genes that are
associated with the 85 candidate genes). Diamond
shapes represent enzymes, oval represent transcription
regulators. Squares: cytokines and triangles: kinases. (For
full explanation of shapes and the functional classification they represent go to http://www.springerimages.
com/Images/LifeSciences/1-10.1007_s12014-0109053-0-2),
ABCD3 gene highly expressed in aa metastatic prostate
cancer lines
Our association study of 85 candidate genes with genome-wide SNPs in HapMap YRI lymphoblastoid cell
lines has revealed an association of SNPs surrounding
ABCD3 gene with basal gene expression of RanGAP1
using data obtained from SCAN database (Figure 1). This
variation in expression levels of RanGAP1 might be influenced by the SNPs in ABCD3. To confirm our results
obtained during the association study, we tested ABCD3
expression in clinically relevant cell lines. Verification of
Reams et al. Infectious Agents and Cancer 2011, 6(Suppl 2):S1
http://www.infectagentscancer.com/content/6/S2/S1
Page 6 of 10
Figure 4 Ingenuity Pathway Analysis identified NFKB as the Top Network signaling Hub where the shaded shapes indicate the candidate genes
from the present study. Dotted line indicates an indirect cellular interaction and solid lines indicate a physical interaction (.I.e. binding) between
genes. Molecules are identified with their HUGO symbol. Different shapes (diamond, circle or rectangles) of the nodes represent functional
classification of the genes shown.
ABCD3 in novel AA/CA prostate cancer cell lines
revealed an increase in expression with increased metastasis across a novel panel of African American and Caucasian prostate cancer paired cell lines (Figure 5). The
malignant RC-77T/E cells isolated from AA showed 2fold increased expression compared to non-malignant
RC-77N/E matched pair (Figure 5). The metastatic,
androgen dependent MDA-2PC-2B cell line derived
from AA ) exhibited a 10-fold ABCD3 expression (Figure
5). Previously we have demonstrated that DU-145 WT
(EGFR overexpressing) cells exhibit increased invasiveness and metastasis both in vitro and in vivo [49]. Therefore, we examined ABCD3 gene expression in the
DU-145 WT cell and in non-transfected DU-145 cells.
DU-145 WT cells showed a 4-fold increase in expression
relative to DU-145 prostate cell lines (Figure 5). A similar
pattern of expression was observed in the androgen independent metastatic C4-2B cells derived from Caucasian
androgen dependent LNCaP cells, thus providing firm
evidence of increased ABCD3 gene expression with
increased prostate cancer progression in AA tumors
(Figure 5).
Discussion/conclusion
To address the underlying genetic cause of prostate cancer
burden in African Americans, we previously obtained a
cohort of normal tumor paired samples from African
American and Caucasian men, and looked for differential
gene expression within each group. Utilizing a strict filtering criteria, we observed over 97 differentially expressed
genes in our African American vs. Caucasian sample set
[36]. To further narrow the list to genes of utmost importance in prostate disease onset, we used a genome-wide
association approach that allowed us to rapidly scan for
SNPs in the genome of healthy Yorubai population (Yorubai from Ibaden, Nigeria) that might possibly be associated
Reams et al. Infectious Agents and Cancer 2011, 6(Suppl 2):S1
http://www.infectagentscancer.com/content/6/S2/S1
Figure 5 Expression of ABCD3 in panel of paired prostate cancer
cell lines. (A) qRT-PCR of non-malignant African American RC-77N/E
was compared to malignant RC-77T/E cells, DU-145 was compared
to DU-145 WT (EGFR overexpressing), LnCaP was compared to C42B, and all samples were compared to African American MDA-PC-2b
cells. Results shown is representative of experiments performed in
triplicate.
with our 85/97 prostate candidate genes. We utilized the
HapMap database of YBI, Nigerian lymphoblastoid cell
lines, since there are a limited number of SNP databases
containing African American patients. Most importantly
the Yorubai population rather than the Caucasian (CEU)
population was utilized because the close ancestral ties
[54] between West African Africans and African Americans would increase our chances of finding similar genetic
variants associated with prostate disease in men of African
descent (Nigerians and African Americans). Approximately 536 genes were identified in our association study
as described in methods section (85 candidate genes + 451
cis-regulatory genes) that are associated with the 85/97
candidate genes. Herein we report that a significant number of direct gene-gene interactions were found, however
the most significant interactions were observed on chromosome 1 and chromosome 12. Given the importance of
these chromosomes in prostate disease, it was appropriate
to investigate ABCD3 gene involvement in African American prostate cancer. Our analysis of gene-gene interactions
on chromosome 1 and 12 revealed that ABCD3/RanGAP1
and STXBP and TMTC2 gene showed the strongest associations. Of these the ABCD3/RanGAP1 genes were predicted to have the most significant interactions. As such
neither ABCD3 or RanGAP1 expression has been implicated in prostate cancer, therefore we chose to focus on
ABCD3. The ATP-binding cassette genes consist of various subfamilies, are typically expressed in both normal
and cancer cells. Their functions have been implicated in
acquired Multidrug Resistance, MDR, in cancer cell lines.
Page 7 of 10
For example, recent reports have shown that MCF-7/
AdVp3000 cells that were derived by selection for growth
in the presence of doxorubicin, exhibit a 459-fold overexpression of ABCC3 relative to the parental cell line [55].
A similar situation in prostate cancer cell lines has been
observed as MDR1/Pgp/ABCB1 and multidrug resistanceassociated protein-1(MRP1/ABCC1), with the half ABC
transporter, breast cancer resistance protein BCRP/
ABCG2, is able to selectively isolate the putative prostate
stem cells from the prostate tissue microenvironment
through constitutive efflux of androgen and protects the
putative tumor stem cells from androgen deprivation,
hypoxia, or adjuvant chemotherapy [56]. These findings
are supported by unpublished data, from Yates laboratory,
that suggest that fluorescence-activated cell sorting, FACS
isolation of the (SP) cells, selective for functional ABC
transporter pumps, have higher in vivo tumorigenicity
compared to other cell surface markers (unpublished
data). Thus, it is possible that ABCD3 could possibly contribute to aggressive prostate cancer.
Multiple ABC family genes have been implicated to play
a role in chemoresistance and progression of prostate and
breast cancer, however given the large number of family
subtypes only a few have been associated with prostate
cancer progression to aggressive disease. Since ABCD3
gene expression has not been identified previously in prostate cancer, we verified this in commonly utilized prostate
cancer cell lines, as well as in a normal and primary tumor
cell line pair derived from an African American prostate
cancer patient [45,57]. As in prostate patient samples,
ABCD3 was consistently overexpressed in the RC-77N/E/
RC-77T/E, LNCaP/C4-2B models, with MDA-PC-2B cells
exhibiting the highest expression (10-fold). This data is
consistent with the expression of other members of the
ABC gene family that have been implicated in prostate
cancer, and serves as proof-of-principle evidence that
ABCD3 overexpression is indeed correlated with prostate
cancer progression. That MDA-2PC-2B cells exhibited the
highest expression levels, further implicates a role for
ABCD3 in African American prostate cancers.
To further substantiate the link of ABCD3 with other
cell signaling molecules that contribute to prostate cancer, we utilized an indirect in silico ingenuity pathway
analysis. ABCD3, showed a high probability of being
found within three growth factor initiated network hubs
involving ERK, MAPK and NFkB proteins. The ERK
MAPK has been implicated in a number of pathophysiological events including androgen receptor signaling [58]
and the epithelial-to-mesenchymal (EMT) [59] that
occurs as cancer cells acquire the property to metastasize.
That we observed a 4 fold increase in ABCD3 expression
in an EGFR overexpressing DU-145 WT cell line compared to non-transfected DU-145 cells, highlights a putative novel regulator of ABCD3. EGFR is overexpressed in
Reams et al. Infectious Agents and Cancer 2011, 6(Suppl 2):S1
http://www.infectagentscancer.com/content/6/S2/S1
African American Prostate patients [60] and a robust
activator of MAPK ERK in normal and cancer cell [61].
Furthermore overexpression is sufficient to increase
proliferation, invasion related EMT, and metastasis
[49,62,63]. Thus, it appears that ABDC3 is a novel prostate cancer associated gene, that could, in part, be regulated by EGFR signaling.
Although further studies to investigate the ABCD3/RanGAP1 relationship need to be conducted, our results
clearly illustrate the utility of high density SNP analysis, in
conjunction with appropriate cell lines that represent the
clinical conditions, to identify regulatory genes in prostate
cancer. Although a more in-depth analysis of the exact
role of ABCD3 in such events as cell proliferation, and
chemoresistance is warranted and are underway. The
results of this study provide a rationale for use of DU-145/
DU-145WT and MDA-PC-2B as culture models to study
molecular mechanisms associated with the health disparity
in African American prostate cancer patients.
Limitation of study
The 97 member candidate gene list was derived from a
limited number of prostate tumor samples and matched
control from AA and CA. Nonetheless, approximately,
26527 genotype-phenotype associations were obtained
with a p-value < 10-3, of which 17542/26527 associations
has a p-value <10-4. The associations with the highest Pvalues showed two distinct association; one of which has
led us to think that the ABC gene family plays an
important role in prostate cancer aggressiveness and
chemoresistance.
Acknowledgements
We acknowledge DoD Grant # W81XWH-04-1-03-26 and NIH/NCRR/RCMI Grant
# SG12RR0020-26 to R.R.R; Mayo Clinic Dept of Medical Informatics for support
services to K.R.K; Grant# G12RR03059-21A1 to C.Y; RCMI Cancer Cluster for
provided networking opportunities among its investigators ( R.R.R. and C. Y.).
Special thanks to Karunya Kandimalla for introducing R.R.R. to K.R.K.
This article has been published as part of Infectious Agents and Cancer
Volume 6 Supplement 2, 2011: Proceedings of the First Biennial Conference
on the Science of Global Prostate Cancer Disparities in Black Men. The full
contents of the supplement are available online at http://www.
infectagentscancer.com/supplements/6/S2.
Author details
1
College of Pharmacy and Pharmaceutical Sciences, Florida A&M University,
Tallahassee, Florida, USA. 2Department of Medical Informatics, Mayo Clinic
College of Medicine, Rochester, MN, USA. 3Dept of Biology and Center for
Cancer Research, Tuskegee University, Tuskegee, Alabama, USA. 4College of
Pharmacy, University of Florida, Gainesville, Florida, USA. 5Prostate Disease
Center, Department of Urology, University of Florida, Gainesville, Florida,
USA.
Authors’ contributions
All authors read and approved the final manuscript.
RRR identified the 97 prostate candidate genes in a previous study; RRR was
responsible for the GWAS study design, manuscript preparation, editing &
critical revisions of the manuscript. KRK conducted the GWAS study and
ingenuity pathway analysis studies and contributed to manuscript
preparation. HW conducted RT-PCR experiments using novel panel of
Page 8 of 10
prostate cell lines contributed by CY. CY established novel panel of prostate
cell lines; contributed their use for this study (in his laboratory) and provided
critical revisions and pertinent scientific discussions of his published and
unpublished data that linked ABCD3 gene expression in metastatic cell lines
to being regulated in part by EGFR. FTO. and KFAS participated in scientific
discussions, proofing of the manuscript and brought together CY and RRR
as collaborators.
Competing interests
The authors do not have any competing interests to declare.
Published: 23 September 2011
References
1. American Cancer Society Facts and Figures (2008). Atlanta: American
Cancer Society.
2. Powell IJ: Keynote address: prostate cancer among African-American
men–from the bench to the community. Prostate cancer and AfricanAmerican men. Oncology (Williston Park) 1997, 11(5):599-605, discussion
606-15 passim. Review.PMID: 9159788.
3. Powell IJ: Prostate cancer in the African American: is this a different
disease? Semin Urol Oncol 1998, 16(4):221-6, Review.PMID: 9858329.
4. Giovannucci E, Platz EA, Stampfer MJ, Chan A, Krithivas K, Kawachi I, et al:
The CAG repeat within the androgen receptor gene and benign prostatic
hyperplasia. Urology 1999, 53:121-5, doi:10.1016/S0090-4295(98)00468-3.
5. Caskey CT, Pizzuti A, Fu YH, Fenwick RG Jr, Nelson DL: Triplet repeat
mutations in human disease. Science 1992, 256(5058):784-9, doi:10.1126/
science.1589758.
6. Platz EA, Rimm EB, Willett WC, Kantoff PW, Giovannucci E: Racial variations
in prostate cancer incidence and in hormonal system markers among
male health professionals. J Natl Cancer Inst 2000, 92(24):2009-17,
doi:10.1093/jnci/92.24.2009.
7. Smith GE, DeHaven MJ, Grundig JP, Wilson GR: African-American males
and prostate cancer: assessing knowledge levels in the community. J
Natl Med Assoc 1997, 89(6):387-91.
8. Barber KR, Shaw R, Folts M, Taylor DK, Ryan A, Hughes M, et al: Differences
between African-American and Caucasian men participating in a
community-based prostate cancer screening program. J Community
Health 1998, 23(6):441-51, doi:10.1023/A:1018758124614.
9. Abbott RR, Taylor DK, Barber K: A comparison of prostate knowledge of
African-American and Caucasian men: Changes from prescreening
baseline to post-intervention. Cancer J Sci Am 1998, 4(3):175-7.
10. Steele CB, Miller DS, Maylahn C, Uhler RJ, Baker CT: Knowledge, attitudes,
and screening practices among older men regarding prostate cancer.
Am J Public Health 2000, 90(10):1595-600.
11. Agho AO, Lewis MA: Correlates of actual and perceived knowledge of
prostate cancer among African Americans. Cancer Nurs 2001, 24(3):165-71,
doi:10.1097/00002820-200106000-00001.
12. Ashford AR, Albert SM, Hoke G, Cushman LF, Miller DS, Bassett M: Prostate
carcinoma knowledge, attitudes, and screening behavior among AfricanAmerican men in Central Harlem, New York City. Cancer 2001,
91(1):164-72, doi:10.1002/1097-0142(20010101)91:13.0.CO;2-A.
13. Magnus M: Prostate cancer knowledge among multiethnic black men.
J Natl Med Assoc 2004, 96(5):650-6.
14. Richardson JT, Webster JD, Fields NJ: Uncovering myths and transforming
realities among low-SES African-American men: Implications for
reducing prostate cancer disparities. J Natl Med Assoc 2004,
96(10):1295-302.
15. Woods VD, Montgomery SB, Belliard JC, Ramirez-Johnson J, Wilson CM:
Culture, black men, and prostate cancer: What is reality? Cancer Control
2004, 11(6):388-96.
16. Forrester-Anderson IT: Prostate cancer screening perceptions, knowledge,
and behaviors among African American men: Focus group findings.
J Health Care Poor Underserved 2005, 16(4, Suppl A):22-30, doi:10.1353/
hpu.2005.0122.
17. Jones AR, Shipp M, Thompson CJ, Davis MK: Prostate cancer knowledge
and beliefs among black and white older men in rural and urban
counties. J Cancer Educ 2005, 20:96-102, doi:10.1207/s15430154jce2002_10.
18. Ross LE, Uhler RJ, Williams KN: Awareness and use of prostate-specific
antigen test among African-American men. J Natl Med Assoc 2005,
97(7):963-71.
Reams et al. Infectious Agents and Cancer 2011, 6(Suppl 2):S1
http://www.infectagentscancer.com/content/6/S2/S1
19. Pruthi RS, Tornehl C, Gaston K, Lee K, Moore D, Carson CC, et al: Impact of
race, age, income, and residence on prostate cancer knowledge,
screening behavior, and health maintenance in siblings of patients with
prostate cancer. Eur Urol 2006, 50(1):64-9, doi:10.1016/j.eururo.2005.09.024.
20. McWhorter WB, Schatzkin AG, Horm JW, Brown CC: Contribution of
socioeconomic status to Black/White differences in cancer incidence.
Cancer 1989, 63:982-7, doi:10.1002/1097-0142(19890301)63:53.0.CO;2-I.
21. Baguet CR, Horm JW, Gibbs T, Greewald P: Socioeconomic factors and
cancer incidence among Blacks and Whites. J Natl Cancer Inst 1991,
83:551-7, doi:10.1093/jnci/83.8.551.
22. Robbins AS, Whittemore AS, Van Den Eeden SK: Race, prostate cancer
survival, and membership in a large health maintenance organization. J
Natl Cancer Inst 1989, 90(13):986-90, doi:10.1093/jnci/90.13.986.
23. Brawn PN, Johnson EH, Kuhl DL, Riggs MW, Speights VO, Johnson CFIII,
et al: Stage at presentation and survival of white and black patients with
prostate carcinoma. Cancer 1993, 71(8):2569-73, doi:10.1002/1097-0142
(19930415)71:83.0.CO;2-R.
24. Ndubuisi SC, Kofie VY, Andoh JY, Schwartz EM: Black-white differences in
the stage at presentation of prostate cancer in the District of Columbia.
Urology 1995, 46(1):71-7, doi:10.1016/S0090-4295(99)80162-9.
25. Freedland SJ, Amling CL, Dorey F, Kane CJ, Presti JC, Terris MK, et al: Race
as an outcome predictor following radical prostatectomy: Results from
the Shared Equal Access Regional Cancer Hospital (SEARCH) Database.
Urology 2002, 60:670-4, doi:10.1016/S0090-4295(02)01847-2.
26. Polednak AP, Flannery JT: Black versus white racial differences in clinical
stage at diagnosis and treatment of prostatic cancer in Connecticut.
Cancer 1992, 70:2152-8, doi:10.1002/1097-0142(19921015)70:83.0.CO;2-#.
27. Moul JW, Sesterhenn IA, Connelly RR, Douglas T, Srivastava S, Mostofi FK,
et al: Prostate-specific antigen values at the time of prostate cancer
diagnosis in African American men. J Am Med Assoc 1995, 274:1277-81.
28. Horner RD: Racial variation in cancer care: A case study of prostate
cancer. Cancer Treat Res 1998, 97:99-114, doi:10.1007/978-0-585-30498-4_8.
29. Brawley OW, Knopf K, Thompson I: The epidemiology of prostate cancer
part II: The risk factors. Semin Urol Oncol 1998, 16:193-201.
30. Fowler JE Jr, Bigler S, Bowman G, Kilambi N: Race and cause specific
survival with prostate cancer: Influence of clinical stage, Gleason score,
age and treatment. J Urol 2000, 163(1):137-42, doi:10.1016/S0022-5347(05)
67989-X.
31. Whittemore AS, Kolonel LN, Wu AH, John EM, Gallagher RP, Howe GR, et al:
Prostate cancer in relation to diet, physical activity, and body size in
blacks, whites, and Asians in the United States and Canada. J Natl Cancer
Inst 1995, 87(9):652-61, doi:10.1093/jnci/87.9.652.
32. Freedland SJ, Isaacs WB: Explaining racial differences in prostate cancer in
the United States: Sociology or biology? Prostate 2005, 62:243-52,
doi:10.1002/pros.20052.
33. Guo Y, Sigman DB, Borkowski A, Kyprianou N: Racial differences in
prostate cancer growth: Apoptosis and cell proliferation in Caucasian
and African-American patients. Prostate 2000, 42:130-6, doi:10.1002/(SICI)
1097-0045(20000201)42:23.0.CO;2-3.
34. Ross R, Bernstein L, Judd H, Hanisch R, Pike M, Henderson B: Serum
testosterone levels in healthy young black and white men. J Natl Cancer
Inst 1986, 76:45-8.
35. Ross R, Bernstein L, Lobo RA, Shimizu H, Stanczyk FZ, Pike MC, et al: 5alpha-reductase activity and risk of prostate cancer among Japanese
and US White and Black males. Lancet 1999, 339:887-9, doi:10.1016/01406736(92)90927-U.
36. Reams RR, Agrawal D, Davis M, Yoder S, Odedina F, Kumar N,
Higginbotham J, Akinremi T, Suther S, Soliman K: Microarray comparison
of prostate tumor gene expression in African-American and Caucasian
American males: a pilot project study. Infectious Agents and Cancer 2009,
4(Suppl 1):S3.
37. Wallace TA, Prueitt RL, Yi M, Howe TM, Gillespie JW, Yfantis HG,
Stephens RM, Caporaso NE, Loffredo CA, Ambs S: Tumor
Immunobiological Differences in Prostate Cancer between AfricanAmerican and European-American Men. Cancer Res 2008, 68(3):927-936.
38. Timofeeva OA, Zhang X, Ressom HW, Varghese RS, Kallakury BV, Wang K,
Ji Y, Cheema A, Jung M, Brown ML, Rhim JS, Dritschilo A: Enhanced
expression of SOS1 is detectable in prostate cancer epithelial cells from
African-American men. Int J Oncol 2009, 35(4):751-60.
39. Gamazon ER, Zhang W, Konkashbaev A, Duan S, Kistner EO, Nicolae DL,
Dolan ME, Cox NJ: SCAN: SNP and copy number annotation.
Page 9 of 10
40.
41.
42.
43.
44.
45.
46.
47.
48.
49.
50.
51.
52.
53.
54.
55.
56.
57.
58.
59.
Bioinformatics 2010, 26(2):259-62, Epub 2009 Nov 17.PMID: 19933162
[PubMed - indexed for MEDLINE].
Nicolae DL, Gamazon E, Zhang W, Duan S, Dolan ME, Cox NJ: TraitAssociated SNPs Are More Likely to Be eQTLs: Annotation to Enhance
Discovery from GWAS. PLoS Genet 2010, 6(4):e1000888, doi:10.1371/journal.
pgen.1000888 PMID 20369019.
Gamazon ER, Zhang W, Konkashbaev A, Duan S, Kistner E, Nicolae DL,
Dolan ME, Cox NJ: SCAN: SNP and copy number annotation.
Bioinformatics , Advance Access published on November 17, 2009,
doi:10.1093/bioinformatics/btp644 PMID 19933162.
Duan S, Huang RS, Zhang W, Bleibel WK, Roe CA, Clark TA, Chen TX,
Schweitzer AC, Blume JE, Cox NJ, Dolan ME: Genetic Architecture of
Transcript-Level Variation in Humans. Amer. J. Human Genetics 2008,
82:1101-1113, PMID 18439551.
Zhang W, Duan S, Kistner EO, Bleibel WK, Huang RS, Clark TA, Chen TX,
Schweitzer AC, Blume JE, Cox NJ, Dolan ME: Evaluation of Genetic
Variation Contributing to Differences in Gene Expression Between
Populations. Amer. J. Human Genetics 2008, 82:631-640, PMID 18313023.
Duan S, Zhang W, Bleibel WK, Cox NJ, Dolan ME: SNPinProbe_1.0: A
database for filtering out probes in the Affymetrix GeneChip(R) Human
Exon 1.0 ST array potentially affected by SNPs. Bioinformation 2008,
2(10):469-70, PMID 18841244.
Theodore S, Sharp S, Zhou J, et al: Establishment and characterization of
a pair of non-malignant and malignant tumor derived cell lines from an
African American prostate cancer patient. International journal of oncology
37:1477-82.
Stone KR, Mickey DD, Wunderli H, Mickey GH, Paulson DF: Isolation of a
human prostate carcinoma cell line (DU 145). International journal of
cancer 1978, 21:274-81.
Dondi D, et al: Growth-inhibitory effects of luteinizing hormone-releasing
hormone (LHRH) agonists on xenografts of the DU 145 human
androgen-independent prostate cancer cell line in nude mice. Int J
Cancer 1998, 76(4):506-11.
Jungwirth A, Pinski J, Galvan G, et al: Inhibition of growth of androgenindependent DU-145 prostate cancer in vivo by luteinising hormonereleasing hormone antagonist Cetrorelix and bombesin antagonists RC3940-II and RC-3950-II. Eur J Cancer 1997, 33:1141-8.
Turner T, Chen P, Goodly LJ, Wells A: EGF receptor signaling enhances in
vivo invasiveness of DU-145 human prostate carcinoma cells. Clinical &
experimental metastasis 1996, 14:409-18.
Wells A, Welsh JB, Lazar CS, Wiley HS, Gill GN, Rosenfeld MG: Ligandinduced transformation by a noninternalizing epidermal growth factor
receptor. Science 1990, 247:962-964.
Xie H, Turner T, Wang MH, Singh RK, Siegal GP, Wells A: In Vitro
invasiveness of DU-145 human prostate carcinoma cells is modulated by
EGF receptor-mediated signals. Clin Exp Metastasis 1995, 13(6):407-19.
Horoszewicz JS, et al: The LNCaP cell line–a new model for studies on
human prostatic carcinoma. Prog Clin Biol Res 1980, 37:115-32.
Tusher VG, Tibshirani R, Chu G: Significance analysis of micro arrays
applied to the Ionizing radiation response. Proc Nation Acad Sci USA 2001,
98(9):5116-21.
Odedina FT, Akinremi TO, Chinegwundoh F, Roberts R, Yu D, Reams RR,
Freedman ML, Rivers B, Green BL, Kumar N: Prostate cancer disparities in
Black men of African descent: a comparative literature review of prostate
cancer burden among Black men in the United States, Caribbean, United
Kingdom, and West Africa. Infect Agent Cancer 2009, 10(4 Suppl 1):S2.
Liu Y, Peng H, Zhang JT: Expression profiling of ABC transporters in a
drug-resistant breast cancer cell line using AmpArray. Mol Pharmacol
2005, 68:430-8.
Huss WJ, Gray DR, Greenberg NM, Mohler JL, Smith GJ: Breast cancer
resistance protein-mediated efflux of androgen in putative benign and
malignant prostate stem cells. Cancer research 2005, 65:6640-50.
Theodore SC, Rhim JS, Turner T, Yates C: MiRNA 26a expression in a novel
panel of African American prostate cancer cell lines. Ethn Dis 20:S1-96100.
Peterziel H, Mink S, Schonert A, Becker M, Klocker H, Cato AC: Rapid
signalling by androgen receptor in prostate cancer cells. Oncogene 1999,
18:6322-9.
Odero-Marah VA, Wang R, Chu G, et al: Receptor activator of NF-kappaB
Ligand (RANKL) expression is associated with epithelial to mesenchymal
transition in human prostate cancer cells. Cell Res 2008, 18:858-70.
Reams et al. Infectious Agents and Cancer 2011, 6(Suppl 2):S1
http://www.infectagentscancer.com/content/6/S2/S1
Page 10 of 10
60. Shuch B, Mikhail M, Satagopan J, et al: Racial disparity of epidermal
growth factor receptor expression in prostate cancer. J Clin Oncol 2004,
22:4725-9.
61. Gan Y, Shi C, Inge L, Hibner M, Balducci J, Huang Y: Differential roles of
ERK and Akt pathways in regulation of EGFR-mediated signaling and
motility in prostate cancer cells. Oncogene 29:4947-58.
62. Yates C, Wells A, Turner T: Luteinising hormone-releasing hormone
analogue reverses the cell adhesion profile of EGFR overexpressing DU145 human prostate carcinoma subline. British journal of cancer 2005,
92:366.
63. Yates CC, Shepard CR, Stolz DB, Wells A: Co-culturing human prostate
carcinoma cells with hepatocytes leads to increased expression of Ecadherin. British journal of cancer 2007, 96:1246-52.
doi:10.1186/1750-9378-6-S2-S1
Cite this article as: Reams et al.: Detecting gene-gene interactions in
prostate disease in African American men. Infectious Agents and Cancer
2011 6(Suppl 2):S1.
Submit your next manuscript to BioMed Central
and take full advantage of:
• Convenient online submission
• Thorough peer review
• No space constraints or color figure charges
• Immediate publication on acceptance
• Inclusion in PubMed, CAS, Scopus and Google Scholar
• Research which is freely available for redistribution
Submit your manuscript at
www.biomedcentral.com/submit


© Copyright 2026