
BHP Billiton Operational Review for the Year Ended 30 June 2014
NEWS RELEASE Release Time IMMEDIATE Date 23 July 2014 Number 11/14 BHP BILLITON OPERATIONAL REVIEW FOR THE YEAR ENDED 30 JUNE 2014 Strong operating performance delivered a 9% increase in Group production with annual records achieved across 12 operations and four commodities. Western Australia Iron Ore achieved a fourteenth consecutive annual production record as volumes increased to 225 Mt (100% basis), significantly exceeding initial full-year guidance. We now expect production of 245 Mt (100% basis) from the Pilbara in the 2015 financial year. Metallurgical coal production of 45 Mt exceeded full-year guidance as Queensland Coal achieved record production and sales volumes. Copper production increased to 1.7 Mt as an improvement in mill throughput and concentrator utilisation offset grade decline at a number of operations. Petroleum production increased by 4% to a record 246 MMboe with an 18% increase in liquids volumes underpinned by significant growth at Onshore US and Atlantis. Six major projects were completed and another two projects achieved first production, including the Caval Ridge coal mine which was completed ahead of schedule and under budget in the June 2014 quarter. BHP Billiton Chief Executive Officer, Andrew Mackenzie, said: “Our focus on productivity has resulted in a significant improvement in operating performance at each of our major businesses this year, with a nine per cent1 increase in Group production and record output at 12 operations. Western Australia Iron Ore and Queensland Coal annual production exceeded guidance, with both rising by more than 20 per cent as we delivered more tonnes from existing infrastructure and growth projects ahead of schedule. At Escondida, an increase in mill throughput and concentrator utilisation offset copper grade decline, while our Onshore US business delivered a 73 per cent increase in petroleum liquids production. “We expect to maintain strong momentum and remain on track to generate Group production growth of 16 per cent1 over the two years to the end of the 2015 financial year. In Petroleum, we are investing in our highest-return acreage while a broader improvement in productivity is expected to underpin stronger iron ore, copper and metallurgical coal volumes. We will remain focused on value over volume as we prioritise our brownfield development options and consider the next phase of portfolio simplification.” Note: Unless specified otherwise: variance analysis relates to the relative performance of BHP Billiton and/or its operations during the 2014 financial year compared with the 2013 financial year or the June 2014 quarter compared with the March 2014 quarter; production volumes, sales volumes and capital and exploration expenditure from subsidiaries (which include Escondida, Jimblebar, BHP Billiton Mitsui Coal and our manganese operations) are reported on a 100 per cent basis; production volumes, sales volumes and capital and exploration expenditure from equity accounted investments (which include Antamina, Samarco and Cerrejón) and other operations are reported on a proportionate consolidation basis. Abbreviations referenced in this report are explained on page 14. Summary Operational performance Production summary JUN 2014 YTD JUN JUN YTD14 2014 vs QTR JUN YTD13 Total petroleum production (MMboe) 246.0 64.7 Copper (kt) 1,727.1 Iron ore (kt) JUN Q14 vs JUN Q13 JUN Q14 vs MAR Q14 4% 9% 6% 470.0 2% 2% 14% 203,564 56,643 20% 19% 15% Metallurgical coal (kt) 45,078 11,886 20% 9% 4% Energy coal (kt) 73,492 18,363 1% (1%) 4% Alumina (kt) 5,178 1,325 6% 5% 6% Aluminium (kt) 1,174 276 (0%) (11%) (3%) Manganese ores (kt) 8,302 2,255 (3%) 0% 25% 646 181 6% (1%) 12% 143.2 30.9 (7%) (23%) (9%) Manganese alloys (kt) Nickel (kt) Strong operating performance in the 2014 financial year delivered a nine per cent1 increase in Group production as records were achieved across 12 operations and four commodities. Group production growth of 16 per cent1 is expected over the two years to the end of the 2015 financial year. Western Australia Iron Ore (WAIO) significantly exceeded initial full-year production guidance as the early commissioning of Jimblebar and our productivity agenda raised the capacity of our integrated supply chain. The ramp-up of Jimblebar to 35 Mtpa (100 per cent basis) is now expected before the end of the 2014 calendar year and will support a further 20 Mt increase in WAIO production to approximately 245 Mt (100 per cent basis) in the 2015 financial year. A low-cost option to expand Jimblebar to 55 Mtpa (100 per cent basis) and broader debottlenecking of the supply chain are expected to underpin further growth in capacity towards 270 Mtpa (100 per cent basis). Metallurgical coal production exceeded full-year guidance as Queensland Coal achieved record production and sales volumes. This included first production from Caval Ridge, the successful ramp-up of Daunia and record production at Peak Downs, Saraji, South Walker Creek and Poitrel. Metallurgical coal production is forecast to increase by four per cent in the 2015 financial year to 47 Mt as the ramp-up of Caval Ridge is completed. Escondida copper production increased by two per cent as an improvement in mill throughput and concentrator utilisation offset declining ore grades. With further improvements in productivity anticipated, Escondida is on track to produce approximately 1.27 Mt of copper in the 2015 financial year, while Group copper production is forecast to increase by five per cent2 to 1.8 Mt. Energy coal volumes were broadly unchanged in the 2014 financial year as a fifth consecutive production record at New South Wales Energy Coal and record volumes at Cerrejón were offset by lower production at South Africa Energy Coal and Navajo Coal. Energy coal production for the 2015 financial year is expected to remain broadly unchanged at 73 Mt. Petroleum production of 246 MMboe marginally exceeded revised full-year guidance as liquids volumes in our Onshore US business increased by 23 per cent in the June 2014 quarter. Petroleum production is forecast to increase by five per cent2 in the 2015 financial year to 255 MMboe with high-margin liquids volumes expected to increase by 16 MMboe. We remain confident that Onshore US will be strongly EBIT positive in the 2015 financial year as the liquids contribution is forecast to rise to approximately 40 per cent of total shale production. BHP Billiton operational review for the year ended 30 June 2014 2 Production guidance for the 2015 financial year is summarised in the table below. FY142 FY15e % change Petroleum (MMboe) 243 255 5% Copper (Mt) 1.7 1.8 5% Iron ore (Mt) 204 225 11% Metallurgical coal (Mt) 45 47 4% Energy coal (Mt) 73 73 - Production guidance Major development projects At the end of the 2014 financial year, BHP Billiton had eight low-risk, largely brownfield major projects under development with a combined budget of US$14.1 billion. During the 2014 financial year we successfully completed six projects, namely: Macedon; North West Shelf North Rankin B Gas Compression; WAIO Jimblebar Mine Expansion; WAIO Port Blending and Rail Yard Facilities; Samarco Fourth Pellet Plant; and Caval Ridge. Caval Ridge was completed in the June 2014 quarter, ahead of schedule and under budget, and will not be reported in future Operational Reviews. Another two projects, Newcastle Third Port Stage 3 and Cerrejón P40, delivered first coal during the year. A US$212 million increase in the budget of the Escondida Oxide Leach Area project to US$933 million has been approved. The project is now expected to be completed in the second half of the 2014 calendar year with no associated impact to production. Corporate update BHP Billiton expects Underlying EBIT in the June 2014 half year to include additional charges in a range of approximately US$0.9 billion to US$1.3 billion related to: (1) impairments and mine site rehabilitation; and (2) redundancies and the closure of operations associated with our productivity agenda. Items include impairments (related to the Port of Vancouver and small Gulf of Mexico petroleum assets) and mine site rehabilitation costs in Petroleum and Potash, and the impairment of assets at South Africa Energy Coal. Redundancy costs will be recognised in our Coal, Iron Ore and Aluminium, Manganese and Nickel Businesses, while additional costs will be recognised following the closure of aluminium smelting activities at Bayside. This guidance will be updated should material information or events arise as the Company finalises its financial statements. Additional charges to be recognised in the June 2014 half year (US$ million) EBITDA EBIT Impairments and mine site rehabilitation 200 to 400 700 to 900 Redundancy and closure 200 to 400 200 to 400 Total charges 400 to 800 900 to 1,300 We continued to simplify our portfolio during the 2014 financial year with the successful completion of numerous transactions, including Jimblebar and Pinto Valley. In the last two years alone, the Group has completed transactions exceeding US$6.7 billion in Australia, the United States, Canada, South Africa and the United Kingdom, including petroleum, copper, iron ore, coal, mineral sands, uranium and diamonds assets. We continue to actively study the next phase of simplification, including structural options, but we will only pursue options that maximise value for BHP Billiton shareholders. BHP Billiton operational review for the year ended 30 June 2014 3 Marketing update The average realised prices achieved for our major commodities are summarised in the table below. Iron ore shipments, on average, were linked to the index price for the month of shipment, with price differentials reflecting product quality. The majority of metallurgical coal and energy coal exports were linked to the index price for the month of shipment or sold on the spot market, with price differentials reflecting product quality. H1 FY14 H2 FY14 FY14 FY13 FY14 vs FY13 Oil (crude and condensate) (US$/bbl) 103 102 102 106 (4%) (4%) (1%) Natural gas (US$/Mscf) 3.81 4.89 4.35 3.76 16% 26% 28% US natural gas (US$/Mscf) 3.44 4.75 4.10 3.29 25% 35% 38% 14.63 14.71 14.67 14.82 (1%) 0% 1% Copper (US$/lb) 3.36 3.09 3.22 3.40 (5%) (4%) (8%) Iron ore (US$/wmt, FOB) 112 96 103 110 (6%) (18%) (14%) Hard coking coal (US$/t) 142 121 131 163 (20%) (22%) (15%) Weak coking coal (US$/t) 116 104 111 129 (14%) (19%) (10%) 74 67 70 81 (14%) (15%) (9%) 291 320 307 302 2% 2% 10% 1,996 2,049 2,022 2,160 (6%) (4%) 3% 4.90 4.41 4.64 4.83 (4%) (14%) (10%) 952 1,001 980 1,042 (6%) 0% 5% 13,615 16,391 14,925 16,037 (7%) 4% 20% Average realised prices3 LNG (US$/Mscf) 4 5 Thermal coal (US$/t) Alumina (US$/t) 6 Aluminium (US$/t) Manganese ore (US$/dmtu) Manganese alloy (US$/t) Nickel metal (US$/t) 6 H2 FY14 vs H2 FY13 H2 FY14 vs H1 FY14 At 30 June 2014, the Group had 350 kt of outstanding copper sales that were revalued at a weighted average price of US$3.19 per pound. The final price of these sales will be determined in the 2015 financial year. In addition, 386 kt of copper sales from the 2013 financial year were subject to a finalisation adjustment in 2014. The provisional pricing and finalisation adjustments will increase earnings before interest and tax by US$73 million in the 2014 financial year (2013 financial year: US$303 million decrease; December 2013 half year: US$196 million increase). BHP Billiton operational review for the year ended 30 June 2014 4 Petroleum and Potash Production JUN 2014 YTD JUN JUN YTD14 2014 vs QTR JUN YTD13 Crude oil, condensate and natural gas liquids (MMboe) 106.1 28.9 Natural gas (bcf) 839.3 Total petroleum production (MMboe) 246.0 JUN Q14 vs JUN Q13 JUN Q14 vs MAR Q14 18% 23% 6% 215.0 (4%) 0% 6% 64.7 4% 9% 6% Total petroleum production – Petroleum production increased by four per cent in the 2014 financial year to 246 MMboe and included strong performance from Onshore US, which delivered a 73 per cent increase in liquids volumes. Petroleum production is forecast to increase by five per cent2 in the 2015 financial year to 255 MMboe as continued growth at Onshore US contributes to a 16 MMboe increase in total liquids production. Conventional volumes for the 2015 financial year are forecast to remain broadly unchanged, consistent with prior guidance. Total petroleum production (MMboe) Total 2014 financial year Less: divested assets 246 (3) Adjusted 2014 financial year 243 Forecast change in liquids volumes 16 Forecast change in gas volumes (4) 2015 financial year 255 Crude oil, condensate and natural gas liquids – Crude oil, condensate and natural gas liquids production increased by 18 per cent in the 2014 financial year to 106 MMboe. Onshore US liquids production increased by 23 per cent in the June 2014 quarter and we expect to carry strong momentum into the 2015 financial year as shale liquids volumes are forecast to increase by over 17 MMboe in the period. We remain confident that Onshore US will be strongly EBIT positive in the 2015 financial year as the liquids contribution is forecast to rise to approximately 40 per cent of total shale production. In our conventional business, a near doubling of production at Atlantis was achieved ahead of prior guidance as the early completion of two production wells brought forward volumes into the 2014 financial year. While production at Pyrenees declined by 12 per cent as a result of major maintenance, volumes recovered strongly in the second half of the financial year following the completion of five new production wells. Natural gas – Natural gas production declined by four per cent in the 2014 financial year to 839 bcf. The delivery of first gas from Macedon partially offset lower demand at Bass Strait and natural field decline at Haynesville. BHP Billiton operational review for the year ended 30 June 2014 5 Projects and Onshore US capital expenditure Project and ownership Capital expenditure (US$m) Initial production target date Capacity Progress North West Shelf Greater Western Flank-A (Australia) 16.67% (non-operator) 400 CY16 To maintain LNG plant throughput On schedule and budget. The overall from the North West Shelf operations. project is 80% complete. Bass Strait Longford Gas Conditioning Plant (Australia) 50% (non-operator) 520 CY16 Designed to process approximately 400 MMcf/d of high-CO2 gas. On schedule and budget. The overall project is 33% complete. In the 2014 financial year, approximately 75 per cent of Onshore US drilling and development expenditure of US$4.2 billion was invested in the Eagle Ford, with the majority focused on our Black Hawk acreage. Onshore US 2014 financial year (2013 financial year) Liquids focused areas (Eagle Ford and Permian) Gas focused areas (Haynesville and Fayetteville) Total 3.6 (3.9) 0.6 (0.9) 4.2 (4.8) Capital expenditure US$ billion Production MMboe 51.9 (33.4) 56.2 (65.8) 108.1 (99.2) Production mix Natural gas Natural gas liquids Crude and condensate 36% (42%) 22% (23%) 42% (35%) 100% (100%) - (-) - (-) 69% (80%) 11% (8%) 20% (12%) Petroleum exploration There were no exploration or appraisal wells drilled during the June 2014 quarter. Petroleum exploration expenditure for the 2014 financial year was US$600 million, of which US$369 million was expensed. Activity for the period was largely focused on the Gulf of Mexico and Western Australia. Potash Project and ownership Jansen Potash (Canada) 100% Investment (US$m) Scope 2,600 Investment to finish the excavation and lining of the production and service shafts, and to continue the installation of essential surface infrastructure and utilities. Progress The overall project is 30% complete and on budget. During the June 2014 quarter, BHP Billiton allowed the exclusivity agreement for Terminal 5 at the Port of Vancouver (US) to lapse. Our development schedule at Jansen provides us with the flexibility to consider a broad range of port and rail options. BHP Billiton operational review for the year ended 30 June 2014 6 Copper Production JUN 2014 YTD JUN 2014 QTR FY14 vs FY13 JUN Q14 vs JUN Q13 JUN Q14 vs MAR Q14 Copper (kt) 1,727.1 470.0 2% 2% 14% Lead (t) 188,026 46,165 (12%) (31%) (3%) Zinc (t) 109,935 29,116 (14%) (37%) 50% 34,804 8,509 (11%) (27%) (3%) 3,988 1,044 (2%) (6%) 8% Silver (koz) Uranium oxide concentrate (t) Copper – Total copper production increased by two per cent in the 2014 financial year to 1.7 Mt as planned. Total copper production is forecast to increase by five per cent2 in the 2015 financial year to 1.8 Mt. Escondida copper production increased by two per cent in the 2014 financial year to 1.2 Mt as an improvement in mill throughput and concentrator utilisation offset declining ore grades. With further improvements in productivity anticipated, Escondida is on track to produce approximately 1.27 Mt of copper in the 2015 financial year. A power outage throughout Northern Chile in July 2014 and a six-day maintenance shutdown at the Laguna Seca concentrator will impact production in the September 2014 quarter. Commissioning of Organic Growth Project 1 is scheduled for the June 2015 quarter. Pampa Norte copper production of 233 kt for the 2014 financial year was unchanged from the prior period. Production is forecast to remain at a similar level in the 2015 financial year as higher grades and recoveries at Spence offset declining grades and recoveries at Cerro Colorado. A 12-day maintenance shutdown at Cerro Colorado and tertiary crusher maintenance at Spence is expected to impact production in the September 2014 quarter. Record mining rates at Olympic Dam underpinned an 11 per cent increase in copper production in the 2014 financial year to 184 kt. While an annualised production rate of 219 kt in the June 2014 quarter indicates the degree of improvement achieved in the existing underground operation, volumes in the 2015 financial year are expected to remain broadly unchanged as a result of the current smelter maintenance program which is expected to be completed early in the September 2014 quarter. A major smelter maintenance campaign is scheduled to commence in the June 2015 quarter. Antamina achieved records for mill throughput and copper production in the 2014 financial year. Average copper grades at Antamina in the 2015 financial year are expected to remain at a similar level to the June 2014 quarter, leading to lower copper production, consistent with the mine plan. Lead/silver – Lead and silver production decreased by 12 per cent and 11 per cent, respectively, in the 2014 financial year as lower average ore grades at Cannington were partially offset by a record mining rate. Zinc – Total zinc production decreased by 14 per cent in the 2014 financial year and reflected lower grades at Antamina, consistent with the mine plan. Uranium – The production of uranium oxide concentrate was broadly unchanged in the 2014 financial year. BHP Billiton operational review for the year ended 30 June 2014 7 Projects Project and ownership Capital expenditure (US$m) Escondida Oxide Leach Area Project (Chile) 57.5% 933 Escondida Organic Growth Project 1 (Chile) 57.5% 3,838 Escondida Water Supply (Chile) 57.5% 3,430 Initial production target date Capacity Progress H2 CY14 New dynamic leaching pad and mineral handling system. Maintains oxide leaching capacity. Budget and schedule revised. Challenges associated with civil engineering works have been resolved. The overall project is 93% complete. H1 CY15 Replaces the Los Colorados concentrator with a new 152 ktpd plant. On schedule and budget. The overall project is 79% complete. CY17 New desalination facility to ensure On schedule and budget. The overall continued water supply to Escondida. project is 12% complete. BHP Billiton operational review for the year ended 30 June 2014 8 Iron Ore Production Iron ore (kt) JUN 2014 YTD JUN 2014 QTR JUN FY14 vs JUN FY13 JUN Q14 vs JUN Q13 JUN Q14 vs MAR Q14 203,564 56,643 20% 19% 15% Iron ore – Iron ore production increased by 20 per cent in the 2014 financial year to a record 204 Mt, exceeding initial full-year guidance by more than eight per cent. Total iron ore production is forecast to increase by 11 per cent in the 2015 financial year to 225 Mt. Western Australia Iron Ore production of 225 Mt (100 per cent basis) represents a fourteenth consecutive annual record and was underpinned by the early commissioning of Jimblebar and our productivity agenda, which raised the capacity of our integrated supply chain. Production from the Wheelarra Joint Venture, which was previously processed through Newman, was permanently connected to the Jimblebar processing hub during the period. The spare capacity created at Newman is now being utilised by existing operations. The ramp-up of Jimblebar to 35 Mtpa (100 per cent basis) is now expected before the end of the 2014 calendar year. In the 2015 financial year WAIO production is expected to increase by a further 20 Mt to approximately 245 Mt (100 per cent basis). Yet another year of record performance will be supported by additional productivity gains despite the tie-in of shiploaders 1 and 2 during the period. A low-cost option to expand Jimblebar to 55 Mtpa (100 per cent basis) and broader debottlenecking of the supply chain are expected to underpin further growth in capacity towards 270 Mtpa (100 per cent basis). Samarco production of 22 Mt (100 per cent basis) was broadly unchanged in the 2014 financial year. The fourth pellet plant was commissioned in the March 2014 quarter and the ramp-up to 30.5 Mtpa (100 per cent basis) is expected before the end of the 2015 financial year. Major increase in Mineral Resource at Western Australia Iron Ore BHP Billiton also confirms a 13 per cent increase in the Mineral Resource at WAIO compared to the previous 30 June 2013 estimate (Table 2). The increase reflects the inclusion of 500 km of infill drilling and revised resource estimates that have continued to delineate orebodies primarily with Brockman (67 per cent of the increase) and Marra Mamba (33 per cent of the increase) ore types, with changes after consideration of mining depletion in the 2014 financial year. BHP Billiton ownership averages 88 per cent but varies between 85 per cent and 100 per cent. Information pertaining to the orebodies that contribute to the increase in Mineral Resource is contained in Appendix 1. WAIO is located within the Pilbara region of Western Australia. The geology of the region, comprising the Hamersley and North East Pilbara Provinces, has been extensively studied and is well documented based on extensive mapping, exploratory drilling and mining. The Hamersley Group forms the central part of the Mt Bruce Supergroup and contains two iron bearing stratigraphic sequences, with major bedded ores hosted by the Brockman Iron Formation and Marra Mamba Iron Formation. The Nimingarra Iron Formation in the North East Pilbara, hosts the Yarrie-Nimingarra iron ore deposits. Another important iron bearing sequence is the Marillana Formation which is a detrital derived Channel Iron Deposit currently mined at Yandi. WAIO Mineral Resources contain the ore types: BKM – Brockman, CID – Channel Iron Deposits, MM – Marra Mamba and NIM – Nimingarra. Mineral Resource estimates are largely based upon three metre samples obtained from 140 millimetre Reverse Circulation (RC) drill holes and to a lesser extent 0.3 metre to three metre samples obtained from HQ3 and PQ3 type Diamond Drill holes and three metre samples obtained from 140 millimetre open Percussion holes. BHP Billiton operational review for the year ended 30 June 2014 9 RC and Percussion samples are either riffle or static cone split whereas diamond core is typically sampled as a whole. Samples are crushed to 90 per cent minus 2.8 millimetres and then pulverised to 95 per cent minus 0.16 millimetres. Pulp (200 grams) is then used for chemical analysis by X-Ray Fluorescence (XRF) for Fe, SiO2, Al2O3, P, MnO, CaO, K2O, MgO, S and TiO2 and Robotic Thermo-Gravimetric Analysis (ROBTGA) for Loss on Ignition (LOI). Resource estimation is typically performed by Ordinary Kriging (OK) interpolation which uses search criteria consistent with geostatistical models separately developed for both Fe and associated deleterious elements such as SiO2, Al2O3 and P according to the appropriate geological controls. To a lesser extent some deposits contributing Inferred Resources have been estimated using Inverse Distance Weighted (IDW) interpolation or Cross Sectional Area of Influence techniques reflecting data density. Mineral resources have been classified considering data density, data quality, geological continuity and/or complexity, estimation quality, weathering zones and proximity to the water table (Table 1). Table 1. Nominal drill grid spacing for WAIO Mineral Resource category Classification BKM CID MM NIM Measured (average) 50x50 metres 50x50 metres 50x50 metres 30x30 metres Indicated (average) 150x50 metres 150x50 metres 150x50 metres 120x60 metres Inferred (maximum) 1200x100 metres 1200x100 metres 1200x100 metres 1200x120 metres Typically a 54 per cent Fe cut-off is used for resource reporting of Marra Mamba and Brockman Iron Formations, a 52 per cent Fe cut-off is used for Channel Iron Deposits and a 50 per cent Fe cut-off for operational areas within the Nimingarra Formation. These cut-offs employed for the Pilbara Mineral Resources estimates are based on break-even economic analysis and assumed open pit extraction and processing by crushing and screening. It is reasonable to consider that all material above the Mineral Resource cut-off grade would be eligible for sale, either now or in the future as indicated by WAIO strategic mine planning. BHP Billiton operational review for the year ended 30 June 2014 10 Table 2. Mineral Resources (inclusive of Ore Reserves) (100%)7 As at 30 June 2014 As at 30 June 2013 Measured Resources Commodity Ore Deposit type % % SiO2 Al2O3 Indicated Resources % LOI Mt % P 4.1 4,200 59.9 0.14 4.9 2.5 430 56.7 0.06 6.1 2.1 870 60.7 0.07 3.8 2.1 120 61.6 0.06 8.0 1.1 1.7 Mt % P BKM 1,300 62.2 0.12 3.9 2.4 CID 960 56.1 0.05 6.4 2.0 10.9 MM 360 61.9 0.07 3.2 1.8 6.0 NIM 10 59.0 0.08 10.1 1.2 3.8 Total Resources Inferred Resources % Fe % Fe % % SiO2 Al2O3 % LOI % % SiO2 Al2O3 % LOI Mt % Fe % P 6.2 9,200 59.0 0.14 5.4 2.8 790 54.9 0.06 6.6 3.0 11.0 6.7 5,100 59.6 0.07 4.5 2.3 7.2 60.5 0.05 9.9 1.2 1.7 Mt % Fe % P BHP Billiton interest Total Resources % % SiO2 Al2O3 % LOI Mt % Fe % P % % SiO2 Al2O3 % LOI % 88 Iron Ore WAIO 10.3 70 6.6 15,000 59.5 0.14 5.1 2.7 6.3 13,000 59.6 0.14 5.2 2.7 6.1 2,200 55.8 0.05 6.4 2.3 10.8 6,400 59.9 0.07 4.3 2.2 7.0 2,400 55.7 0.05 6.4 2.4 10.9 5,400 59.9 0.07 4.4 2.2 6.9 200 61.1 0.06 8.8 1.2 1.8 190 61.0 0.06 8.9 1.2 1.9 Additional information is contained in Appendix 1. BHP Billiton operational review for the year ended 30 June 2014 11 Coal Production JUN 2014 YTD JUN 2014 QTR JUN FY14 vs JUN FY13 JUN Q14 vs JUN Q13 JUN Q14 vs MAR Q14 Metallurgical coal (kt) 45,078 11,886 20% 9% 4% Energy coal (kt) 73,492 18,363 1% (1%) 4% Metallurgical coal – Metallurgical coal production increased by 20 per cent in the 2014 financial year to a record 45 Mt, exceeding full-year guidance. Metallurgical coal production is forecast to increase by four per cent in the 2015 financial year to 47 Mt as the ramp-up of Caval Ridge is completed. Queensland Coal achieved record production and sales volumes in the 2014 financial year, supported by strong performance across all operations. This included first production from Caval Ridge, the successful ramp-up of Daunia and record production at Peak Downs, Saraji, South Walker Creek and Poitrel. A sustainable increase in truck and wash-plant utilisation rates underpinned a further improvement in productivity across the business. Illawarra Coal production declined by five per cent in the 2014 financial year to 7.5 Mt. An extended outage at the Dendrobium mine impacted performance, primarily in the September 2013 quarter. As a result of continued weakness in coal prices, persistent strength of the Australian dollar and the recognition of redundancy and restructuring charges, Queensland Coal was marginally EBIT positive during the second half of the 2014 financial year. Energy coal – Energy coal production of 73 Mt in the 2014 financial year was broadly unchanged from the prior period as planned. Another year of robust performance was underpinned by a fifth consecutive annual production record at New South Wales Energy Coal and record volumes at Cerrejón. Extended outages at both a local utility and the Richards Bay Coal Terminal led to lower production at South Africa Energy Coal, while Navajo Coal production declined following the permanent closure of three of the five power units at the Four Corners Power Plant. Energy coal production for the 2015 financial year is expected to remain broadly unchanged at 73 Mt. A drought in the La Guajira region of Colombia is expected to constrain Cerrejón production for the remainder of the 2014 calendar year given the requirement to manage dust emissions. The port expansion associated with the Cerrejón P40 project is currently being commissioned, although operational issues are expected to constrain capacity at approximately 35 Mtpa (100 per cent basis) in the medium term. Projects Project and ownership Capital expenditure (US$m) 8 Initial production target date Capacity Progress Caval Ridge (Australia) 50% 1,870 CY14 Greenfield mine development to produce an initial 5.5 Mtpa of export metallurgical coal. Hay Point Stage Three Expansion (Australia) 50% 1,5058 CY15 Increases port capacity from 44 Mtpa On revised schedule and budget. The to 55 Mtpa and reduces storm overall project is 87% complete. vulnerability. 845 CY16 Maintains Illawarra Coal’s production On schedule and budget. The overall capacity with a replacement mining project is 67% complete. domain and capacity to produce 3.5 Mtpa of metallurgical coal. Appin Area 9 (Australia) 100% BHP Billiton operational review for the year ended 30 June 2014 First coal achieved in Q2 CY14, ahead of schedule and under budget. The overall project is 100% complete. 12 Aluminium, Manganese and Nickel Production JUN 2014 YTD JUN JUN YTD14 2014 vs QTR JUN YTD13 Alumina (kt) 5,178 1,325 Aluminium (kt) 1,174 Manganese ores (kt) Manganese alloys (kt) Nickel (kt) JUN Q14 vs JUN Q13 JUN Q14 vs MAR Q14 6% 5% 6% 276 0% (11%) (3%) 8,302 2,255 (3%) 0% 25% 646 181 6% (1%) 12% 143.2 30.9 (7%) (23%) (9%) Alumina – Alumina production increased by six per cent in the 2014 financial year to a record 5.2 Mt. The Efficiency and Growth project at Worsley reached nameplate capacity during the year and annual production records were achieved at both the Worsley and Alumar refineries. Aluminium – Aluminium production in the 2014 financial year was unchanged at 1.2 Mt. Production records at both Hillside and Mozal were offset by lower volumes at Alumar following the phased suspension of 103 kt (BHP Billiton share) of annualised capacity during the 2014 financial year. The final potline at Bayside was closed in June 2014, although the cast house will be supplied by our Hillside smelter as we continue to assess its future. Manganese ores – Despite achieving record production in the June 2014 quarter, manganese ore volumes declined by three per cent in the 2014 financial year as GEMCO was affected by higher than usual rainfall during the wet season. Manganese alloys – Manganese alloy production increased by six per cent from the 2013 financial year which was affected by the temporary suspension of operations at TEMCO. Nickel – Nickel production declined by seven per cent in the 2014 financial year to 143 kt as production at Cerro Matoso was affected by kiln and furnace outages, and lower nickel grades. Nickel West production declined by four per cent following the closure of the Perseverance underground mine in November 2013. Saleable nickel production at Nickel West is expected to decline by four per cent in the 2015 financial year to 95 kt. Ferro-nickel production at Cerro Matoso is expected to decline by three per cent to 43 kt as a result of lower grades and recoveries. On 14 May 2014, BHP Billiton announced a review of the Nickel West business, comprising the Mt Keith, Cliffs and Leinster mines, its concentrators, the Kalgoorlie smelter and the Kwinana refinery. The review is considering all options for the long-term future of Nickel West, including the potential sale of all or part of the business. BHP Billiton operational review for the year ended 30 June 2014 13 Minerals exploration Minerals exploration expenditure in the 2014 financial year was US$410 million, of which US$347 million was expensed. Greenfield minerals exploration is predominantly focused on advancing copper targets within Chile and Peru. 1. Refers to copper equivalent production based on average realised prices for the 2013 financial year. 2. Excludes operations which were sold during the year (Liverpool Bay and Pinto Valley). 3. Based on provisional, unaudited estimates. Prices exclude third party product and represent the weighted average of various sales terms (for example, FOB, CIF and CFR), unless otherwise noted. 4. Includes third party product. 5. Export sales only, excludes Cerrejón. Includes thermal coal sales from metallurgical coal mines. 6. Excludes internal sales. 7. Competent Persons – P. Whitehouse (MAusIMM), M. Lowry (MAusIMM), M. Smith (MAusIMM), D. Stephens (MAIG). The statement of Mineral Resources is presented on a 100 per cent basis, represents an estimate as at 30 June 2014, and is based on information compiled by the above named Competent Persons. Mr. Whitehouse, Mr. Lowry, Mr. Smith and Mr. Stephens are full time employees of BHP Billiton Iron Ore Ltd, are members of either The Australasian Institute of Mining and Metallurgy or The Australian Institute of Geoscientists, and have sufficient experience relevant to the style of mineralisation and type of deposit under consideration and to the activity they are undertaking to qualify as Competent Persons as defined in the 2012 Edition of the 'Australasian Code for Reporting of Exploration Results, Mineral Resources and Ore Reserves'. Mr. Whitehouse, Mr. Lowry, Mr. Smith and Mr. Stephens consent to the inclusion in the report of the matters based on their information in the form and context in which it appears. 8. Excludes announced pre-commitment funding. The following abbreviations have been used throughout this report: barrels (bbl) billion cubic feet (bcf); cost and freight (CFR); cost, insurance and freight (CIF), dry metric tonne unit (dmtu); free on board (FOB); grams per tonne (g/t); kilograms per tonne (kg/t); kilometre (km); metre (m); million barrels of oil equivalent (MMboe); million cubic feet per day (MMcf/d); million tonnes (Mt); million tonnes per annum (Mtpa); ounces (oz); pounds (lb) thousand barrels of oil equivalent (Mboe); thousand ounces (koz); thousand standard cubic feet (Mscf); thousand tonnes (kt); thousand tonnes per annum (ktpa); thousand tonnes per day (ktpd); tonnes (t); and wet metric tonnes (wmt). BHP Billiton operational review for the year ended 30 June 2014 14 Further information on BHP Billiton can be found at: www.bhpbilliton.com. Media Relations Investor Relations Australia Australia Emily Perry Tel: +61 3 9609 2800 Mobile: +61 477 325 803 email: [email protected] Tara Dines Tel: +61 3 9609 2222 Mobile: +61 499 249 005 email: [email protected] Paul Hitchins Tel: + 61 3 9609 2592 Mobile: + 61 419 315 001 email: [email protected] Jodie Phillips Tel: +61 3 9609 2069 Mobile: +61 418 710 516 email: [email protected] Eleanor Nichols Tel: +61 3 9609 2360 Mobile: +61 407 064 748 email: [email protected] United Kingdom and South Africa United Kingdom Jonathan Price Tel: +44 20 7802 4131 Mobile: +44 7990 527 726 email: [email protected] Ruban Yogarajah Tel: +44 20 7802 4033 Mobile: +44 7827 082 022 email: [email protected] Dean Simon Tel: +44 20 7802 7461 Mobile: +44 7717 511 193 email: [email protected] Jennifer White Tel: +44 20 7802 7462 Mobile: +44 7827 253 764 email: [email protected] Americas Americas James Agar Tel: +1 212 310 1421 Mobile: +1 347 882 3011 email: [email protected] Ruban Yogarajah Tel: +44 20 7802 4033 Mobile: +44 7827 082 022 email: [email protected] Joseph Suarez Tel: +1 212 310 1422 Mobile: +1 646 400 3803 email: [email protected] BHP Billiton Limited ABN 49 004 028 077 Registered in Australia Registered Office: Level 16, 171 Collins Street Melbourne Victoria 3000 Australia Tel +61 1300 55 4757 Fax +61 3 9609 3015 BHP Billiton Plc Registration number 3196209 Registered in England and Wales Registered Office: Neathouse Place London SW1V 1LH United Kingdom Tel +44 20 7802 4000 Fax +44 20 7802 4111 Members of the BHP Billiton Group which is headquartered in Australia BHP Billiton operational review for the year ended 30 June 2014 15 BHP BILLITON PRODUCTION SUMMARY QUARTER ENDED % CHANGE YEAR TO DATE JUN YTD14 JUN Q14 JUN MAR JUN JUN JUN vs vs JUN Q14 vs 2013 2014 2014 2014 2013 JUN YTD13 JUN Q13 MAR Q14 23,441 27,244 28,877 106,147 90,051 18% 23% 214.5 202.0 215.0 839.3 874.3 (4%) 0% 6% 59.2 60.9 64.7 246.0 235.8 4% 9% 6% Petroleum Crude oil, condensate and NGL (Mboe) Natural gas (bcf) Total petroleum production (MMboe) 6% Copper Copper (kt) 461.7 413.9 470.0 1,727.1 1,689.4 2% 2% 14% Lead (t) 67,034 47,577 46,165 188,026 214,432 (12%) (31%) (3%) 50% Zinc (t) 45,881 19,409 29,116 109,935 128,205 (14%) (37%) Gold (oz) 56,070 43,883 59,705 194,288 184,769 5% 6% 36% Silver (koz) 11,602 8,757 8,509 34,804 38,913 (11%) (27%) (3%) Uranium (t) 1,105 966 1,044 3,988 4,066 (2%) (6%) 8% Molybdenum (t) 376 281 83 1,201 1,561 (23%) (78%) (70%) (kt) 47,689 49,280 56,643 203,564 169,856 20% 19% 15% Metallurgical coal (kt) 10,858 11,467 11,886 45,078 37,650 20% 9% 4% Energy coal (kt) 18,561 17,723 18,363 73,492 72,445 1% (1%) 4% 1,265 1,250 1,325 5,178 4,880 6% 5% 6% Iron ore Iron ore Coal Aluminium, Manganese and Nickel Alumina (kt) Aluminium (kt) 310 286 276 1,174 1,179 (0%) (11%) (3%) Manganese ores (kt) 2,246 1,801 2,255 8,302 8,517 (3%) 0% 25% Manganese alloys (kt) 182 162 181 646 608 6% (1%) 12% Nickel (kt) 40.3 34.1 30.9 143.2 154.1 (7%) (23%) (9%) Throughout this report figures in italics indicate that this figure has been adjusted since it was previously reported. ___________________________________________________________________________________________________________ 16 BHP Billiton operational review for the year ended 30 June 2014 BHP BILLITON PRODUCTION QUARTER ENDED BHP Billiton JUN SEP DEC MAR JUN JUN JUN interest 2013 2013 2013 2014 2014 2014 2013 Petroleum Production Crude oil, condensate and NGL (Mboe) (1) Natural gas (bcf) Total petroleum production (MMboe) Copper (2) Copper Payable metal in concentrate (kt) Escondida (3) Antamina Pinto Valley Total Cathode (kt) Escondida (3) Pampa Norte (4) Pinto Valley Olympic Dam Total Total Copper Lead Payable metal in concentrate (t) Cannington Antamina Total Zinc Payable metal in concentrate (t) Cannington Antamina Total Gold Payable metal in concentrate (oz) Escondida (3) Olympic Dam (refined gold) Pinto Valley Total Silver Payable metal in concentrate (koz) Escondida (3) Antamina Cannington Olympic Dam (refined silver) Pinto Valley Total Uranium Payable metal in concentrate (t) Olympic Dam Total Molybdenum Payable metal in concentrate (t) Antamina Total YEAR TO DATE 23,441 214.5 59.2 26,053 219.7 62.7 23,973 202.6 57.7 27,244 202.0 60.9 28,877 215.0 64.7 106,147 839.3 246.0 90,051 874.3 235.8 57.5% 33.8% 100% 223.0 34.7 10.8 268.5 205.1 41.9 10.9 257.9 208.0 42.4 1.6 252.0 190.6 33.0 223.6 241.0 26.2 267.2 844.7 143.5 12.5 1,000.7 831.5 139.7 16.6 987.8 57.5% 100% 100% 100% 79.3 64.7 1.3 47.9 193.2 461.7 73.2 43.5 0.8 27.9 145.4 403.3 77.5 59.4 0.1 50.9 187.9 439.9 75.8 63.4 51.1 190.3 413.9 81.5 66.8 54.5 202.8 470.0 308.0 233.1 0.9 184.4 726.4 1,727.1 297.9 232.6 4.9 166.2 701.6 1,689.4 100% 33.8% 66,666 368 67,034 46,287 158 46,445 47,259 580 47,839 47,214 363 47,577 45,768 397 46,165 186,528 1,498 188,026 213,425 1,007 214,432 100% 33.8% 20,206 25,675 45,881 16,033 12,522 28,555 16,123 16,732 32,855 10,074 9,335 19,409 15,666 13,450 29,116 57,896 52,039 109,935 56,281 71,924 128,205 57.5% 100% 100% 17,593 38,477 56,070 17,347 27,649 49 45,045 19,384 26,271 45,655 15,253 28,630 43,883 20,920 38,785 59,705 72,904 121,335 49 194,288 71,529 113,240 184,769 57.5% 33.8% 100% 100% 100% 890 1,297 9,101 266 48 11,602 891 1,205 6,361 190 41 8,688 982 1,350 6,306 212 8,850 1,078 961 6,465 253 8,757 1,320 843 6,029 317 8,509 4,271 4,359 25,161 972 41 34,804 2,960 3,952 31,062 880 59 38,913 100% 1,105 1,105 970 970 1,008 1,008 966 966 1,044 1,044 3,988 3,988 4,066 4,066 33.8% 376 376 458 458 379 379 281 281 83 83 1,201 1,201 1,561 1,561 Refer footnotes on page 19. ____________________________________________________________________________________________________________ 17 BHP Billiton operational review for the year ended 30 June 2014 BHP BILLITON PRODUCTION QUARTER ENDED Iron Ore Production (kt) (5) Newman Yarrie Area C Joint Venture Yandi Joint Venture Jimblebar (6) Wheelarra (7) Samarco Total Coal Metallurgical coal Production (kt) (8) BMA BHP Mitsui Coal (9) Illawarra Total Energy coal Production (kt) South Africa (10) USA Australia Colombia Total Aluminium, Manganese and Nickel Alumina Saleable production (kt) Worsley Alumar Total Aluminium Production (kt) Hillside Bayside (11) Alumar Mozal Total Manganese ores Saleable production (kt) South Africa (12) Australia (12) Total Manganese alloys Saleable production (kt) South Africa (12) (13) Australia (12) Total Nickel Saleable production (kt) Cerro Matoso Nickel West Total YEAR TO DATE BHP Billiton JUN SEP DEC MAR JUN JUN JUN interest 2013 2013 2013 2014 2014 2014 2013 85% 85% 85% 85% 85% 85% 50% 14,391 12,552 17,027 1,017 2,702 47,689 12,196 202 11,814 18,146 700 3,166 2,729 48,953 12,483 428 11,383 17,135 1,702 2,716 2,841 48,688 15,470 206 11,282 15,622 2,721 1,698 2,281 49,280 16,766 12,481 17,615 3,740 2,973 3,068 56,643 56,915 836 46,960 68,518 8,863 10,553 10,919 203,564 44,620 1,106 44,717 60,054 8,377 10,982 169,856 50% 80% 100% 6,696 1,846 2,316 10,858 6,705 2,057 1,423 10,185 7,494 2,114 1,932 11,540 7,461 1,995 2,011 11,467 7,596 2,143 2,147 11,886 29,256 8,309 7,513 45,078 22,645 7,063 7,942 37,650 90% 100% 100% 33.3% 7,902 2,752 4,893 3,014 18,561 7,937 3,145 5,372 3,185 19,639 7,036 2,896 4,544 3,291 17,767 7,398 2,359 5,018 2,948 17,723 8,013 2,412 5,030 2,908 18,363 30,384 10,812 19,964 12,332 73,492 31,627 12,791 18,010 10,017 72,445 86% 36% 961 304 1,265 946 305 1,251 1,024 328 1,352 936 314 1,250 1,010 315 1,325 3,916 1,262 5,178 3,675 1,205 4,880 100% 100% 40% 47.1% 181 24 39 66 310 184 24 35 67 310 183 24 28 67 302 172 23 26 65 286 176 18 15 67 276 715 89 104 266 1,174 665 96 154 264 1,179 44.4% 60% 939 1,307 2,246 864 1,182 2,046 944 1,256 2,200 782 1,019 1,801 936 1,319 2,255 3,526 4,776 8,302 3,490 5,027 8,517 60% 60% 104 78 182 86 51 137 94 72 166 91 71 162 106 75 181 377 269 646 374 234 608 99.9% 100% 12.8 27.5 40.3 12.0 28.4 40.4 12.3 25.5 37.8 9.8 24.3 34.1 10.2 20.7 30.9 44.3 98.9 143.2 50.8 103.3 154.1 Refer footnotes on page 19. ____________________________________________________________________________________________________________ 18 BHP Billiton operational review for the year ended 30 June 2014 BHP BILLITON PRODUCTION (1) LPG and ethane are reported as natural gas liquids (NGL). Product-specific conversions are made and NGL is reported in barrels of oil equivalent (boe). Total boe conversions are based on 6,000 scf of natural gas equals 1 boe. (2) (3) Metal production is reported on the basis of payable metal. Shown on 100% basis following the application of IFRS 10 which came into effect from 1 July 2013. BHP Billiton interest in saleable production is 57.5%. (4) Includes Cerro Colorado and Spence. (5) Iron ore production is reported on a wet tonnes basis. (6) Shown on 100% basis. BHP Billiton interest in saleable production is 85%. (7) All production from Wheelarra is now processed via the Jimblebar processing hub. (8) Metallurgical coal production is reported on the basis of saleable product. Production figures include some thermal coal. (9) Shown on 100% basis. BHP Billiton interest in saleable production is 80%. (10) Shown on 100% basis. BHP Billiton interest in saleable production is 90%. (11) Aluminium smelting at Bayside ceased with the closure of the final potline in June 2014. (12) Shown on 100% basis. BHP Billiton interest in saleable production is 60%, except Hotazel Manganese Mines which is 44.4%. (13) Production includes Medium Carbon Ferro Manganese. ___________________________________________________________________________________________________________ 19 BHP Billiton operational review for the year ended 30 June 2014 PRODUCTION AND SALES REPORT QUARTER ENDED YEAR TO DATE JUN SEP DEC MAR JUN JUN JUN 2013 2013 2013 2014 2014 2014 2013 Petroleum Crude oil, condensate and NGL (Mboe) Crude oil and condensate Bass Strait North West Shelf Stybarrow Pyrenees Other Australia (1) Atlantis (2) Mad Dog (2) Shenzi (2) Onshore US (3) Trinidad/Tobago Other Americas (2) (4) UK (5) Algeria Pakistan Total NGL Bass Strait North West Shelf Atlantis (2) Mad Dog (2) Shenzi (2) Onshore US (3) Other Americas (2) (4) UK (5) Total Total crude oil, condensate and NGL Natural gas (bcf) Bass Strait North West Shelf Other Australia (1) Atlantis (2) Mad Dog (2) Shenzi (2) Onshore US (3) Trinidad/Tobago Other Americas (2) (4) UK (5) Pakistan Total Total petroleum production (MMboe) (1) (2) (3) (4) (5) (6) (6) 2,229 1,646 401 1,817 12 2,594 649 3,378 3,614 259 403 282 1,210 65 18,559 2,247 1,865 348 1,707 14 2,953 732 3,467 5,044 320 378 142 1,142 62 20,421 1,958 1,497 317 1,295 12 3,988 496 3,201 4,238 314 373 305 1,156 52 19,202 2,095 1,504 282 2,386 11 3,734 704 3,467 5,589 279 329 254 1,069 49 21,752 2,355 1,408 255 2,075 14 4,114 187 3,530 7,069 248 371 27 996 37 22,686 8,655 6,274 1,202 7,463 51 14,789 2,119 13,665 21,940 1,161 1,451 728 4,363 200 84,061 8,813 6,868 1,722 8,460 59 7,995 2,715 14,749 11,701 1,328 1,564 1,223 5,042 273 72,512 1,753 312 200 224 2,375 9 9 4,882 2,001 399 255 38 266 2,656 11 6 5,632 1,603 234 348 24 252 2,295 10 5 4,771 1,621 276 288 36 280 2,986 2 3 5,492 2,026 288 111 39 252 3,471 4 6,191 7,251 1,197 1,002 137 1,050 11,408 23 18 22,086 6,553 1,374 559 143 1,187 7,631 55 37 17,539 23,441 26,053 23,973 27,244 28,877 106,147 90,051 33.6 30.3 4.5 0.8 0.1 0.8 118.1 9.1 0.3 4.1 12.8 214.5 34.2 34.2 9.3 1.3 0.1 0.8 114.9 9.9 0.3 3.5 11.2 219.7 22.7 30.3 15.1 1.8 0.1 0.8 105.3 9.7 0.3 6.2 10.3 202.6 21.2 31.4 13.2 1.8 0.1 0.8 109.7 9.3 0.2 5.4 8.9 202.0 30.5 31.8 13.6 1.9 0.1 0.8 118.9 9.1 0.2 0.8 7.3 215.0 108.6 127.7 51.2 6.8 0.4 3.2 448.8 38.0 1.0 15.9 37.7 839.3 123.7 131.0 21.4 2.9 0.4 4.6 479.4 36.3 1.7 19.1 53.8 874.3 59.2 62.7 57.7 60.9 64.7 246.0 235.8 Other Australia includes Minerva and Macedon. Macedon achieved first production in August 2013. Gulf of Mexico volumes are net of royalties. Onshore US volumes are net of mineral holder royalties. Other Americas includes Neptune, Genesis and Overriding Royalty Interest. UK includes Bruce/Keith and Liverpool Bay. BHP Billiton completed the sale of its 46.1% operated interest in Liverpool Bay on 31 March 2014. Total boe conversions are based on 6,000 scf of natural gas equals 1 boe. ___________________________________________________________________________________________________________ 20 BHP Billiton operational review for the year ended 30 June 2014 PRODUCTION AND SALES REPORT QUARTER ENDED YEAR TO DATE JUN SEP DEC MAR JUN JUN JUN 2013 2013 2013 2014 2014 2014 2013 Copper Metals production is payable metal unless otherwise stated. Escondida, Chile (1) Material mined (kt) 98,665 93,744 93,814 96,420 94,673 378,651 392,669 Sulphide ore milled (kt) 19,295 18,276 19,584 21,051 21,438 80,349 73,905 Average copper grade (%) 1.42% 1.37% 1.30% 1.12% 1.33% 1.28% 1.40% Production ex mill (kt) 231.9 210.6 214.4 195.5 235.6 856.1 863.0 Production Payable copper (2) Payable gold concentrate (kt) (fine oz) 223.0 205.1 208.0 190.6 241.0 844.7 831.5 17,593 17,347 19,384 15,253 20,920 72,904 71,529 Copper cathode (EW) (kt) 79.3 73.2 77.5 75.8 81.5 308.0 297.9 Payable silver concentrate (koz) 890 891 982 1,078 1,320 4,271 2,960 Sales Payable copper (kt) Payable gold concentrate (fine oz) 228.2 192.3 228.1 173.2 239.1 832.7 836.2 15,831 12,490 18,602 20,889 20,920 72,901 69,041 Copper cathode (EW) (kt) 95.0 63.0 86.7 76.4 83.3 309.4 303.0 Payable silver concentrate (koz) 908 836 1,076 1,046 1,320 4,278 2,963 (1) Shown on 100% basis following the application of IFRS 10 which came into effect from 1 July 2013. BHP Billiton interest in saleable production is 57.5%. (2) June 2014 quarter includes 4.3 kt of copper contained in ore sold to third parties. Pampa Norte, Chile Cerro Colorado Material mined (kt) 16,303 15,771 17,487 15,939 17,087 66,284 63,056 Ore milled (kt) 4,351 4,161 4,501 4,508 4,016 17,186 17,412 Average copper grade (%) 0.82% 0.78% 0.76% 0.75% 0.76% 0.76% 0.67% Copper cathode (EW) (kt) 21.2 17.6 19.4 22.0 21.3 80.3 71.5 Sales Copper cathode (EW) (kt) 21.7 17.3 17.6 12.4 28.7 76.0 70.3 Production Spence Material mined (kt) 28,646 24,331 27,911 25,037 25,962 103,241 111,047 Ore milled (kt) 4,146 4,860 4,788 4,735 3,775 18,158 16,100 Average copper grade (%) 1.16% 1.11% 1.25% 1.23% 1.30% 1.22% 1.25% Copper cathode (EW) (kt) 43.5 25.9 40.0 41.4 45.5 152.8 161.1 Sales Copper cathode (EW) (kt) 57.9 25.9 35.9 40.0 49.6 151.4 161.4 Production _________________________________________________________________________________________________________________ 21 BHP Billiton operational review for the year ended 30 June 2014 PRODUCTION AND SALES REPORT QUARTER ENDED YEAR TO DATE JUN SEP DEC MAR JUN JUN JUN 2013 2013 2013 2014 2014 2014 2013 56,254 12,424 56,428 11,765 50,872 12,521 45,837 11,729 49,797 12,756 202,934 48,771 208,014 46,780 Copper Metals production is payable metal unless otherwise stated. Antamina, Peru Material mined (100%) Sulphide ore milled (100%) Average head grades - Copper - Zinc (kt) (kt) (%) (%) Production Payable copper Payable zinc Payable silver (kt) (t) (koz) Payable lead Payable molybdenum (t) (t) Sales Payable copper Payable zinc Payable silver (kt) (t) (koz) Payable lead Payable molybdenum 1.03% 1.02% 1.21% 0.56% 1.15% 0.72% 1.00% 0.54% 0.77% 0.58% 1.03% 0.60% 1.06% 0.81% 34.7 25,675 1,297 41.9 12,522 1,205 42.4 16,732 1,350 33.0 9,335 961 26.2 13,450 843 143.5 52,039 4,359 139.7 71,924 3,952 368 376 158 458 580 379 363 281 397 83 1,498 1,201 1,007 1,561 31.9 22,560 1,165 41.3 16,123 1,503 44.5 18,397 1,367 30.2 10,158 910 26.5 14,527 893 142.5 59,205 4,673 138.4 72,015 3,887 (t) (t) 262 283 297 411 368 442 405 347 521 142 1,591 1,342 983 1,571 Material mined (kt) 802 893 974 773 806 3,446 3,146 Ore milled (kt) 866 750 852 779 821 3,202 3,145 Cannington, Australia Average head grades - Silver (g/t) 401 315 274 311 286 296 360 - Lead (%) 9.1% 7.4% 6.7% 7.3% 6.9% 7.1% 7.9% - Zinc (%) 3.8% 3.3% 3.1% 2.4% 3.1% 3.0% 3.0% Production Payable silver (koz) 9,101 6,361 6,306 6,465 6,029 25,161 31,062 Payable lead (t) 66,666 46,287 47,259 47,214 45,768 186,528 213,425 Payable zinc (t) 20,206 16,033 16,123 10,074 15,666 57,896 56,281 Sales Payable silver (koz) 7,793 7,844 6,548 6,127 5,641 26,160 30,258 Payable lead (t) 64,633 56,500 47,185 43,649 41,607 188,941 218,655 Payable zinc (t) 21,056 17,286 18,241 11,020 15,708 62,255 57,195 _________________________________________________________________________________________________________________ 22 BHP Billiton operational review for the year ended 30 June 2014 PRODUCTION AND SALES REPORT QUARTER ENDED YEAR TO DATE JUN SEP DEC MAR JUN JUN JUN 2013 2013 2013 2014 2014 2014 2013 Copper Metals production is payable metal unless otherwise stated. Olympic Dam, Australia Material mined (1) (kt) 2,750 2,897 2,717 2,495 2,405 10,514 9,547 (kt) 2,641 2,404 2,641 2,421 2,654 10,120 9,900 Average copper grade (%) 1.86% 1.85% 1.86% 1.90% 1.91% 1.88% 1.80% Average uranium grade (kg/t) 0.56 0.53 0.52 0.54 0.51 0.52 0.53 154.2 Ore milled Production Copper cathode (ER) (kt) 45.1 25.9 47.6 48.4 51.3 173.2 Copper cathode (EW) (kt) 2.8 2.0 3.3 2.7 3.2 11.2 12.0 Uranium oxide concentrate (t) 1,105 970 1,008 966 1,044 3,988 4,066 Refined gold (fine oz) 38,477 27,649 26,271 28,630 38,785 121,335 113,240 Refined silver (koz) 266 190 212 253 317 972 880 154.8 Sales Copper cathode (ER) (kt) 46.4 26.8 43.3 47.5 54.2 171.8 Copper cathode (EW) (kt) 3.5 2.1 2.8 2.5 3.0 10.4 12.7 Uranium oxide concentrate (t) 1,374 930 1,037 732 1,426 4,125 4,148 38,394 21,675 32,226 31,129 38,500 123,530 109,248 275 176 177 262 367 982 920 Refined gold (fine oz) Refined silver (koz) (1) Material mined refers to run of mine ore mined and hoisted. Pinto Valley, US (1) Production Payable copper (kt) 10.8 10.9 1.6 - - 12.5 16.6 Copper cathode (EW) (kt) 1.3 0.8 0.1 - - 0.9 4.9 Payable silver (koz) 48 41 - - - 41 59 Payable gold (oz) - 49 - - - 49 - Sales Payable copper (kt) 9.9 10.0 - - - 10.0 12.5 Copper cathode (EW) (kt) 1.4 1.1 0.2 - - 1.3 4.9 Payable silver (koz) 48 41 - - - 41 59 Payable gold (oz) - 49 - - - 49 - (1) On 11 October 2013 BHP Billiton completed the sale of its Pinto Valley operations. _________________________________________________________________________________________________________________ 23 BHP Billiton operational review for the year ended 30 June 2014 PRODUCTION AND SALES REPORT QUARTER ENDED YEAR TO DATE JUN SEP DEC MAR JUN JUN JUN 2013 2013 2013 2014 2014 2014 2013 Iron Ore (kt) Iron ore Pilbara, Australia Production (1) Newman Yarrie (2) 14,391 12,196 12,483 15,470 16,766 56,915 - 202 428 206 - 836 1,106 Area C Joint Venture 12,552 11,814 11,383 11,282 12,481 46,960 44,717 Yandi Joint Venture Jimblebar (3) 17,027 18,146 17,135 15,622 17,615 68,518 60,054 - 700 1,702 2,721 3,740 8,863 - Wheelarra (4) 44,620 1,017 3,166 2,716 1,698 2,973 10,553 8,377 Total 44,987 46,224 45,847 46,999 53,575 192,645 158,874 Total production (100%) 52,926 54,258 53,638 54,812 62,369 225,077 186,911 Sales Lump 11,284 10,292 9,996 11,230 11,572 43,090 38,767 Fines 34,621 35,283 35,756 35,880 40,834 147,753 122,188 Total 45,905 45,575 45,752 47,110 52,406 190,843 160,955 Total sales (100%) 54,006 53,561 53,808 55,018 61,015 223,402 189,357 (1) Iron ore production and sales are reported on a wet tonnes basis. (2) Yarrie ceased production on 25 February 2014. (3) Shown on 100% basis. BHP Billiton interest in saleable production is 85%. (4) All production from Wheelarra is now processed via the Jimblebar processing hub. Samarco, Brazil Production (1) Sales 2,702 2,729 2,841 2,281 3,068 10,919 10,982 2,651 2,676 3,025 2,036 3,077 10,814 11,015 (1) Iron ore production and sales are reported on a wet tonnes basis. ___________________________________________________________________________________________________________ 24 BHP Billiton operational review for the year ended 30 June 2014 PRODUCTION AND SALES REPORT QUARTER ENDED YEAR TO DATE JUN SEP DEC MAR JUN JUN JUN 2013 2013 2013 2014 2014 2014 2013 Coal (kt) Metallurgical coal Queensland Coal Production (1) BMA Blackwater 1,539 1,691 1,655 1,759 1,625 6,730 5,432 Goonyella 1,816 1,737 1,999 2,041 1,553 7,330 6,221 Peak Downs 1,140 1,112 1,201 1,314 1,282 4,909 4,545 971 1,197 1,195 1,108 1,058 4,558 3,449 Gregory Joint Venture 854 464 850 654 997 2,965 2,523 Daunia Caval Ridge (2) 376 504 594 585 518 2,201 475 - - - - 563 563 - 6,696 6,705 7,494 7,461 7,596 29,256 22,645 1,215 1,298 1,313 1,312 1,323 5,246 4,351 631 759 801 683 820 3,063 2,712 Total BHP Mitsui Coal 1,846 2,057 2,114 1,995 2,143 8,309 7,063 Total Queensland Coal 8,542 8,762 9,608 9,456 9,739 37,565 29,708 Coking coal 6,316 6,123 6,517 7,030 7,250 26,920 20,868 Weak coking coal 2,417 2,397 2,505 2,594 2,358 9,854 7,811 30 160 271 122 134 687 581 8,763 8,680 9,293 9,746 9,742 37,461 29,260 Saraji Total BMA BHP Mitsui Coal (3) South Walker Creek Poitrel Sales Thermal coal Total (1) Metallurgical coal production is reported on the basis of saleable product. Production figures include some thermal coal. (2) Caval Ridge achieved first production in the June 2014 quarter. (3) Shown on 100% basis. BHP Billiton interest in saleable production is 80%. Illawarra, Australia Production (1) 2,316 1,423 1,932 2,011 2,147 7,513 7,942 1,877 1,084 1,495 1,581 1,761 5,921 7,032 436 359 318 460 486 1,623 1,410 2,313 1,443 1,813 2,041 2,247 7,544 8,442 Sales Coking coal Thermal coal Total (1) Metallurgical coal production is reported on the basis of saleable product. Production figures include some thermal coal. ___________________________________________________________________________________________________________ 25 BHP Billiton operational review for the year ended 30 June 2014 PRODUCTION AND SALES REPORT QUARTER ENDED YEAR TO DATE JUN SEP DEC MAR JUN JUN JUN 2013 2013 2013 2014 2014 2014 2013 Coal (kt) Energy coal South Africa (1) Production 7,902 7,937 7,036 7,398 8,013 30,384 31,627 Export 3,363 2,504 4,087 3,179 3,528 13,298 13,935 Local utility 4,353 4,543 3,811 3,478 4,498 16,330 18,008 24 - - - - - 122 7,740 7,047 7,898 6,657 8,026 29,628 32,065 7,468 Sales Inland Total (1) Shown on 100% basis. BHP Billiton interest in saleable production is 90%. New Mexico, USA Production Navajo Coal (1) 1,569 1,670 1,400 975 1,082 5,127 San Juan Coal 1,183 1,475 1,496 1,384 1,330 5,685 5,323 Total 2,752 3,145 2,896 2,359 2,412 10,812 12,791 Sales - local utility 2,815 3,129 2,950 2,360 2,382 10,821 12,775 (1) BHP Billiton completed the sale of Navajo Mine on 30 December 2013. As BHP Billiton will retain control of the mine until full consideration is received, production will continue to be reported by the Group. NSW Energy Coal, Australia Production 4,893 5,372 4,544 5,018 5,030 19,964 18,010 Export 4,289 4,037 4,887 4,346 4,548 17,818 17,469 Inland 478 446 332 270 333 1,381 1,167 4,767 4,483 5,219 4,616 4,881 19,199 18,636 Production 3,014 3,185 3,291 2,948 2,908 12,332 10,017 Sales - export 3,157 3,155 3,067 2,647 2,858 11,727 10,263 Sales Total Cerrejón, Colombia ___________________________________________________________________________________________________________ 26 BHP Billiton operational review for the year ended 30 June 2014 PRODUCTION AND SALES REPORT QUARTER ENDED YEAR TO DATE JUN SEP DEC MAR JUN JUN JUN 2013 2013 2013 2014 2014 2014 2013 Aluminium, Manganese and Nickel (kt) Alumina Saleable production Worsley, Australia 961 946 1,024 936 1,010 3,916 3,675 Alumar, Brazil 304 305 328 314 315 1,262 1,205 1,265 1,251 1,352 1,250 1,325 5,178 4,880 1,031 897 961 986 1,020 3,864 3,677 Total Sales Worsley, Australia Alumar, Brazil Total 329 278 320 262 388 1,248 1,275 1,360 1,175 1,281 1,248 1,408 5,112 4,952 181 184 183 172 176 715 665 24 24 24 23 18 89 96 39 35 28 26 15 104 154 Aluminium Production Hillside, South Africa Bayside, South Africa (1) Alumar, Brazil Mozal, Mozambique 66 67 67 65 67 266 264 310 310 302 286 276 1,174 1,179 191 180 173 187 168 708 667 26 24 24 24 24 96 105 Alumar, Brazil 38 34 28 25 17 104 164 Mozal, Mozambique 65 68 74 72 62 276 264 320 306 299 308 271 1,184 1,200 Total Sales Hillside, South Africa Bayside, South Africa (1) Total (1) Aluminium smelting at Bayside ceased with the closure of the final potline in June 2014. Manganese ores Saleable production South Africa (1) 939 864 944 782 936 3,526 3,490 Australia (1) 1,307 1,182 1,256 1,019 1,319 4,776 5,027 Total 2,246 2,046 2,200 1,801 2,255 8,302 8,517 Sales South Africa (1) 970 920 714 915 931 3,480 3,491 Australia (1) 1,102 1,078 1,445 1,252 1,288 5,063 4,578 Total 2,072 1,998 2,159 2,167 2,219 8,543 8,069 104 86 94 91 106 377 374 78 51 72 71 75 269 234 Total 182 137 166 162 181 646 608 Sales South Africa (1) (2) 110 88 87 113 112 400 385 61 54 63 85 74 276 227 171 142 150 198 186 676 612 Manganese alloys Saleable production South Africa (1) (2) Australia (1) Australia (1) Total (1) Shown on 100% basis. BHP Billiton interest in saleable production is 60%, except Hotazel Manganese Mines which is 44.4%. (2) Production includes Medium Carbon Ferro Manganese. ___________________________________________________________________________________________________________ 27 BHP Billiton operational review for the year ended 30 June 2014 PRODUCTION AND SALES REPORT QUARTER ENDED YEAR TO DATE JUN SEP DEC MAR JUN JUN JUN 2013 2013 2013 2014 2014 2014 2013 Aluminium, Manganese and Nickel (kt) Nickel Cerro Matoso, Colombia Production 12.8 12.0 12.3 9.8 10.2 44.3 50.8 Sales 13.1 12.6 12.3 10.0 10.2 45.1 52.1 Nickel contained in concentrate 3.0 3.4 2.4 2.5 1.6 9.9 11.5 Nickel contained in finished matte 8.6 8.8 6.1 6.1 4.4 25.4 31.7 Nickel metal 15.9 16.2 17.0 15.7 14.7 63.6 60.1 Nickel production 27.5 28.4 25.5 24.3 20.7 98.9 103.3 Nickel contained in concentrate 3.0 2.7 2.8 2.3 1.6 9.4 10.6 Nickel contained in finished matte 9.7 7.8 7.4 5.3 6.2 26.7 32.4 Nickel metal 17.7 15.3 17.2 16.7 14.4 63.6 64.2 Nickel sales 30.4 25.8 27.4 24.3 22.2 99.7 107.2 Nickel West, Australia Saleable production Sales ___________________________________________________________________________________________________________ 28 BHP Billiton operational review for the year ended 30 June 2014 Appendix 1 Supporting document to the BHP Billiton Operational Review for the year ended 30 June 2014. Executive summary Western Australia Iron Ore Table 1: Mineral Resources (inclusive of Ore Reserves) as at June 30 2014 in 100% terms – reported in compliance with the 2012 JORC Code As at 30 June 2014 As at 30 June 2013 Measured Resources Commodity Ore Deposit type Indicated Resources % % SiO2 Al2O3 Mt % Fe % P BKM 1,300 62.2 0.12 3.9 2.4 % LOI Inferred Resources Mt % Fe % P % % SiO2 Al2O3 4.1 4,200 59.9 0.14 4.9 2.5 % LOI Total Resources Mt % Fe % P % % SiO2 Al2O3 6.2 9,200 59.0 0.14 5.4 2.8 % LOI Mt % Fe % P BHP Billiton interest Total Resources % % SiO2 Al2O3 % LOI Mt % Fe % P % % SiO2 Al2O3 % LOI % 88 Iron Ore WAIO 10.3 6.6 15,000 59.5 0.14 5.1 2.7 6.3 13,000 59.6 0.14 5.2 2.7 6.1 CID 960 56.1 0.05 6.4 2.0 10.9 430 56.7 0.06 6.1 2.1 790 54.9 0.06 6.6 3.0 11.0 2,200 55.8 0.05 6.4 2.3 10.8 2,400 55.7 0.05 6.4 2.4 10.9 MM 360 61.9 0.07 3.2 1.8 6.0 870 60.7 0.07 3.8 2.1 6.7 5,100 59.6 0.07 4.5 2.3 7.2 6,400 59.9 0.07 4.3 2.2 7.0 5,400 59.9 0.07 4.4 2.2 6.9 NIM 10 59.0 0.08 10.1 1.2 3.8 120 61.6 0.06 8.0 1.1 1.7 60.5 0.05 9.9 1.2 1.7 200 61.1 0.06 8.8 1.2 1.8 190 61.0 0.06 8.9 1.2 1.9 70 Western Australia Iron Ore (WAIO) is located within the Pilbara region of Western Australia. The geology of the region, comprising the Hamersley and North East Pilbara provinces, has been extensively studied and is well documented from over five decades of mapping, exploratory drilling and mining. Notably, the geological information is publicly available from the Geological Survey of Western Australia (GSWA – Department of Mines and Petroleum) in the form of maps, cross-sections, drillhole based information and other publications. Mineral Resources are divided into the ore types: BKM – Brockman, CID – Channel Iron Deposits, MM – Marra Mamba and NIM – Nimingarra. The Mineral Resources grades listed refer to in situ mass percentage on a dry weight basis. Wet tonnes are reported for WAIO deposits with moisture contents as: BKM 3%, MM 4%, CID 8% and NIM 3.5%, For Mineral Resources a single Fe cut-off value was applied per deposit ranging from 50-57% Fe across the WAIO resource inventory. BHP Billiton ownership varies between 85% and 100%. The WAIO BHP Billiton interest is calculated as a ‘Pilbara Ore Reserves tonnes weighted average’ across all Joint Ventures. The BKM Mineral Resources increase was due to infill drilling and revised resource models for Mindy; Ministers North; Wheelarra 1-2, 3 and 5-6; Packsaddle 1 and 3; Orebody 25 and Marillana. The MM Mineral Resources increase was due to infill drilling and revised resource models for A Deposit; C Deposit; Southeast Corner; Orebody 32 and Orebody 35, with maiden Mineral Resources Eastern Syncline and Orebody 37. Tonnes are rounded to two significant figures unless they are less than 100 million wmt, in which case they are rounded to the nearest 10 million wmt. The following abbreviations have been used throughout this report: centimetre (cm); kilogram (kg); kilometre (km); metre (m); millimetre (mm); micron (μm); billion tonnes (Bt); million tonnes (Mt); wet metric tonnes (wmt); thousand tonnes (kt); tonnes (t); parts per million (ppm). BHP Billiton operational review for the year ended 30 June 2014 – Appendix 1 1 Competent Person acknowledgement This Competent Persons Report, which provides supporting documentation for the Mineral Resources for WAIO as at 30 June 2014, was prepared under the direction of the Competent Persons listed below (Table 2). These Competent Persons verify that: They have full knowledge of information contained in this report relating to the estimation of the Mineral Resources estimates of the said deposits; the Mineral Resources are estimated in accordance with the relevant assessment criteria contained in Table 1 of the JORC Code; they are members of the AusIMM, AIG or approved RPO, and have the relevant experience and competency required by the JORC Code; and Material issues are transparently disclosed on an 'if not, why not' basis. Table 2: WAIO Mineral Resource Competent Persons Name Professional Membership Title Paul Whitehouse Member of the Australasian Institute of Mining and Metallurgy Superintendent Mineral Inventory Michael Lowry Member of the Australasian Institute of Mining and Metallurgy Superintendent Resource Geology Michael Smith Member of the Australasian Institute of Mining and Metallurgy Manager Exploration Darren Stephens Member of the Australian Institute of Geoscientists Manager Exploration BHP Billiton operational review for the year ended 30 June 2014 – Appendix 1 2 1 Introduction This report covers Mineral Resources for BHP Billiton's Western Australia Iron Ore asset and is issued in support of the BHP Billiton Operational Review for the year ended 30 June 2014. BHP was the first company to start iron ore mining in Western Australia in the Kimberley area in 1956 at Yampi Sound's Cockatoo Island – the adjacent Koolan Island mine followed in 1965. These mines primarily supplied BHP's domestic steelworks at Newcastle and Port Kembla, although some product was exported. In 1966 BHP developed the Pilbara's first wholly export mine at Mt Goldsworthy by Goldsworthy Mining Limited (GML) and the Koolyanobbing (by Dampier Mining Company Ltd – DMC) mine in the Yilgarn. The latter mainly provided ore for BHP's steelworks in Kwinana near Perth with a minor portion exported to the Chinese market. Major export operations commenced in 1969 with the creation of the Mt Newman Mining Joint Venture (MNM), and subsequent production from the Mt Whaleback deposit. In 1986 BHP acquired majority ownership of MNM, which along with the 100% BHP owned but undeveloped Yandi property (eventually developed in 1991) began a growth phase. Acquisition of Goldsworthy Mining Limited (GML) and Jimblebar (formerly McCamey's Monster) followed in 1990 and 1992 respectively. In July 2013, the completion of the ITOCHU Corporation (ITOCHU) and Mitsui & Co., Ltd. (Mitsui) transaction reduced our ownership in the Jimblebar Joint Venture to 85%. BHP Billiton has been expanding the WAIO operations in response to increasing demand for iron ore. Production has increased from 68 Mt (100% basis) in the 2001 financial year to 225 Mt (100% basis) in the 2014 financial year. BHP Billiton’s share of 2014 financial year production was 193 Mt. 2 Tenure The majority of deposits reported are located over five main lease areas held by WAIO (and its joint venture partners, as appropriate) as shown in Figure 1. The leases, listed in Table 3, are governed by State Agreement Acts. These State Agreement Acts are: Iron Ore (Mount Newman) Agreement Act 1964 (WA) Iron Ore (Mount Goldsworthy) Agreement Act 1964 (WA) Iron Ore (Goldsworthy-Nimingarra) Agreement Act 1972 (WA) Iron Ore (McCamey's Monster) Agreement Authorisation Act 1972 (WA) Iron Ore (Marillana Creek) Agreement Act 1991 (WA) Table 3: WAIO main lease areas Lease number Joint venture or tenement name ML 244 SA Mt Newman JV M 266 SA Jimblebar M 270 SA Yandi JV ML 281 SA Mt Goldsworthy (Area C) JV ML 235 SA, ML 249 SA, ML 263 SA, ML 251 SA Mt Goldsworthy (Northern Areas) JV There is a well-defined process for operating within the tenements that comprise each of the State Agreement Acts. This process includes various State Agreement approvals required before mining, processing and transport of iron ore products can commence. In addition, one minor operation (Callawa part of Mt Goldsworthy JV Northern) is conducted upon a mining tenement issued under the Mining Act 1978 (WA). Proposals approved under State Agreements are a binding commitment between the State and the relevant Joint Venture and provide long-term security to the tenure and thereby the rights to mine. The approvals will remain current whilst operations are actively conducted and the State Agreements, which are ratified by the relevant Act, provide security to the renewal of tenure for the life of the operations. BHP Billiton operational review for the year ended 30 June 2014 – Appendix 1 3 Tenure is managed by the Land Tenure Team. The systems in place include a database of all tenure which includes details of the location, ownership, size, grant and expiry dates and records of the rent paid. In October 2013, the 1SAP Tenement Contract Management (TCM) Module was implemented and, since then, all WAIO tenements are captured in TCM with all payments governed through this process. A minority of deposits for which Mineral Resources have been stated are located on exploration licences. The tenements systems described above manage all mining, exploration and infrastructure tenements. Exploration titles are applied for under the processes set out in the Mining Act 1978 (WA) and once an exploration licence is granted it entitles the holder to explore for minerals over the tenement area. Retention of these licences is subject to annual rental and reporting obligations and meeting annual expenditure commitments or being granted exemptions. During FY14, Exploration Licences and Mining Leases under the Mining Act 1978 (WA) held by BHP Coal Pty Ltd and BHP Billiton Minerals Pty Ltd as detailed in the points below were transferred to BHP Iron (Jimblebar) Pty Ltd. East Jimblebar / Caramulla – Mining Leases 52/865 – 52/869 and 52/874 – 52/885 MAC North – Exploration Licence 47/628 and Mining Lease applications 47/703 – 47/709 Mindy / Coondiner – Mining Leases 47/710 – 47/731 Prairie Downs – Exploration Licences 52/21 – 52/23, Mining Leases 52/886 – 52/893, 52/907 – 52/909 and Mining Lease applications 52/870 – 52/873 and 52/897 – 52/900 Roy Hill – Exploration Licence 45/1073 and 45/1074 and Mining Lease applications 45/1038 – 45/1065 Western Ridge – Exploration Licence 52/170 and Mining Leases 52/901 – 52/906 Western Ridge – Exploration Licence 52/2008 In 2010, amendments were made to the five State Agreements managed by BHP Billiton Iron Ore Pty Ltd to, amongst other matters, permit applications to be made to include the area of exploration and mining tenements granted under the Mining Act 1978 (WA) into mining and mineral leases granted under the State Agreements up to 777 km2. The State Agreement amendments also allow separate applications to be made to increase the total area of these State Agreement mining and mineral leases up to a limit not exceeding 1,000 km2. BHP Billiton made an application to the Minister for State Development for the inclusion of areas into Mining Lease 266SA pursuant to clause 11B(1) of the McCamey's Monster State Agreement. The Minister approved the application and in order for the new sections of Mining Lease 266SA to be granted, conditional surrenders for the tenements in Application 1 were required. The tenements within Application 1 are: East Jimblebar / Caramulla – Mining Leases 52/865 – 52/869 and 52/874 – 52/885 Mindy / Coondiner – Mining Leases 47/710 – 47/731 Prairie Downs – Mining Leases 52/886 – 52/893, 52/907 – 52/909 West Jimblebar – Mining Lease 52/894 – 52-896 Dongardoo – Exploration Licence 52/1830 and Mining Lease 52/1056 Western Ridge – Exploration Licence 52/170 and Mining Leases 52/901 – 52/906 Western Ridge – Exploration Licence 52/2008 The conditional surrenders have now been registered and these areas are now part of Mining Lease 266SA. BHP Billiton operational review for the year ended 30 June 2014 – Appendix 1 4 Fig gure 1: WAIO tenement loc cation plan BH HP Billiton operational review w for the year ended 30 Jun ne 2014 – App pendix 1 5 3 Deposit geology The Hamersley Province, Figure 2 (after Harmsworth et al 1990), covers an area of 80,000 km2 and contains late Archaean – Lower Proterozoic age (2,800-2,300 Ma) sediments of the Mount Bruce Supergroup. The Hamersley Group forms the central part of the Mt Bruce Supergroup and is conformable with both the underlying Fortescue Group and overlying Turee Creek Group. It is a 2.5 km thick sequence of dominantly deep water chemical sediments, with subordinate turbiditic sediments and various intrusive and extrusive rocks. Sediments include (in approximate order of decreasing abundance) banded iron-formation (BIF), shale, dolomite derived from peri-platformal ooze, chert, pyroclastic shale and tuff, turbiditic carbonate and turbiditic volcanic, Figure 3 (after Harmsworth et al 1990). The Hamersley Province overall can be considered as two structurally distinct regions: i. a northern / northwest region of mild deformation typified by shallow, open folds with a west to north-west trend; ii. a southern region displaying more intense deformation where the major iron deposits occur. This latter area can be further subdivided into a south-western area dominated by en echelon type open folds, and a south-eastern area dominated by tight E-W trending folds of shorter wavelength. Within the banded iron-formations of the Hamersley Group there are two iron bearing stratigraphic sequences where the major bedded ores are formed: Brockman Iron Formation Marra Mamba Iron Formation On the northern margin of the Archaean Pilbara Craton, in the North-East Pilbara (Figure 2) the Nimingarra Iron Formation hosts the Yarrie-Nimingarra iron ore deposits. Another important iron bearing sequence is the Marillana Formation which is a detrital derived Channel Iron Deposit (CID) of late Eocene – Early Miocene age. Detrital Iron deposits are colluvial-alluvial fans adjacent to some bedded iron deposits with their chemistry aligned to their source rocks. A schematic structural relationship of the various ore types in the SE Pilbara is represented as Figure 4. BHP Billiton operational review for the year ended 30 June 2014 – Appendix 1 6 Fig gure 2: Hamersley Provinc ce – Pilbara geological g ske etch map BH HP Billiton operational review w for the year ended 30 Jun ne 2014 – App pendix 1 7 Fig gure 3: WAIO Hamersley Province P stratigraphic col umn BH HP Billiton operational review w for the year ended 30 Jun ne 2014 – App pendix 1 8 Fig gure 4: Schem matic structural sections of o mineralisa ation types off the South Ea ast Pilbara 4 Data acq quisition A consistent c m method of data acquisition n is used by W WAIO for exp ploration and d developmeent drilling ca ampaigns. The data acquiired includess: Drillhole colllar coordinattes, surveyed before and d after drilling g. Drillholes a are geophysiically logged d for gamma a, gamma-ga amma densiity, calliper aand magnettic susceptib bility using industtry standard tools and ca alibration metthods. Magnetic susceptibility tool is used for measu uring downh hole deviatio on data as w well as inte ermittent use e of gyroscopess, chiefly for holes h greaterr than 250 m length. Chip sampling protocolss for Revers se Circulation n (RC) holes s follow benchmark induustry practice es, with QA//QC targets esta ablished and monitored. Standard ge eological logging and auttomated data a capture pro ocedures are e followed forr the differen nt mineralisattion types and d different drillin ng methods. Geotechnical logging iss typically un ndertaken in accordance e with the BHP Billiton W WAIO Geote echnical logg ging manual or u under a sepa arate consulta ants system which record ds similar fea atures. Hydrogeolo ogical logging g, bore consttruction and a aquifer testin ng are complleted in line w with Australia an Standardss. 4.1 1 Drilling Sp pacing of the e drillholes is i project de ependent, b ut as a guid de, the nom minal grids hhave their grreatest spaccing occ curring along g the main strike s of the mineralisatio m on and closer spacing oc ccurring perppendicular to the main strrike of mineralisatio on. Drilling grids, g where present, varry from 1,20 00 m - 50 m along strikee and 200 m - 50 m across strike. BH HP Billiton operational review w for the year ended 30 Jun ne 2014 – App pendix 1 9 A range of historical and current drilling methods are used in geological modelling and/or resource estimation: Conventional Open-hole Percussion drilling (historical): Utilised a 140 mm conventional downhole hammer drill bit to produce chip samples of the rock mass. Compressed air forces the drill spoil up the outside of the drill rods where it is collected in a rig mounted cyclone and then drops down through a drop box into a five tier riffle splitter to produce a final sample split and reject sample. Open-hole Percussion drilling with a Cross Over Sub (historical): Identical to Conventional Open-Hole Percussion drilling except that compressed air forces drill spoil from the drill bit through a cross over sub and into dual tubed drill rods (outer and inner) and then back to the surface where it is collected in a rig mounted cyclone. Reverse Circulation (RC) drilling (current): Utilises a 140 mm RC hammer face sampling bit to produce chip samples of the rock mass. Dual tube drill rods (outer and inner) are used to carry air to the hammer and drill spoil to the surface. The volume of air forces the drill spoil up the inner tubes where it is collected in a rig mounted cyclone and then drops down through a drop box into either a static cone splitter or a five tier riffle splitter to produce a final sample split and reject sample. Diamond drillholes (current and historical): Utilises a diamond impregnated drill bit to advance an attached hollow drill rod string into hard bedrock, producing a cylindrical core sample representing the formation being drilled. BHP Billiton Iron Ore uses various diameter diamond drillholes depending on the intended use of the drillhole samples (e.g. geological drillhole, geotechnical drillhole, hydrological drillhole, geo-metallurgical drillhole). Typically though the drillhole diameters are either 63.5 mm (HQ3) or 85 mm (PQ3). In FY14, exploration activity was completed over multiple project areas and deposits. Drilling totalled 500,464 m comprising: 426,214 m RC (reverse circulation drilling utilising 140 mm Face Hammer) 52,300 m DD (diamond drilling typically 63.5 mm HQ triple core) 21,950 m Hydrology* drilling. * Hydrology drilling incorporates a range of methods and diameters including conventional air rotary, dual rotary and flooded reverse. Table 4 details the historical drilling carried out in the Pilbara since the 1950's by main drill types. It is interesting to note that 68% of all drilling has occurred since the year 2000. BHP Billiton operational review for the year ended 30 June 2014 – Appendix 1 10 Table 4: Historical Drill Metres by Decade or Calendar Year Period Period Drilled Air Core Conventional Hammer (Percussion) Diamond Percussion Reverse Circulation RC Hammer Face Sampling Bit Other Drill Type Total Per Period 1950's - - 132 - - - 86,034 86,166 1960's - - 1,518 5,963 1,898 - 80,602 89,981 1970's 15 107 37,298 51,560 2,354 205 381,854 473,392 1980's 3,612 6,722 15,308 54,973 10,599 - 490,444 581,659 1990's 17,407 8,411 68,450 12,243 70,745 106,937 771,694 1,055,887 2000's 1,419 46,660 246,593 1,809 237,627 2,054,475 24,731 2,613,309 2010 - 15,774 41,618 - - 409,541 5,482 472,415 2011 - 6,393 75,680 - 1,194 502,693 2,151 588,111 2012 - 28,091 85,655 - - 556,359 5,314 675,420 2013 - 31,914 44,211 - - 459,473 10,780 546,378 Total 22,453 144,072 616,463 126,548 324,417 4,089,683 1,859,086 7,182,712 Note: Other Drill Types comprised of Blade; Conventional Blade; Conventional Hammer - Crossover Sub; Conventional Rock Roller; Dual Rotary; Drag Bit; Reverse Flush / Flooded Reverse; Flushing; Hydro; RC Blade - Crossover Sub; Rotary Mud; Sonic; Vacuum and Unknown Drill Type. 4.2 Survey Survey practices have improved over time, ground truthing and re-survey of historic data is completed where issues are identified and it is practical to do so. All surveys are referenced to Geocentric Datum of Australia 1994 (GDA94) and the Australian Height Datum (AHD). Current practices are based on industry standards and best practice. The typical methodologies utilised and minimum accuracy requirements are; For collar surveys: Multi Frequency Real Time Kinematic Global Positioning System (RTK GPS). Positional uncertainty: Horizontal 0.3 m; Vertical 0.1 m. For QA/QC 5% of each drill program is re-surveyed. Historical drillhole collars were surveyed using traditional terrestrial based techniques including trigonometric heighting and gridding by theodolite. Current RTK GPS practices were adopted circa 2000. For mapping and relief modelling: Aerial Survey. Positional uncertainty: Horizontal 2.5 m; Vertical 1.0 m. For downhole surveys: A Magnetic susceptibility tool is used for measuring downhole deviation data as well as intermittent use of gyroscopes, chiefly for holes greater than 250 m length. Any holes with greater than 2 degrees deviation over 5 m are investigated. For QA/QC purposes 5% of each drill program is re-surveyed. BHP Billiton operational review for the year ended 30 June 2014 – Appendix 1 11 4.3 Sampling and Analytical Procedures The standard sample interval employed for the vast majority of drill holes is 3 m in the Bedded Iron Formations, and 2 m in Channel Iron Deposits. There is no specific trigger driving the choice of diamond drilling over RC drilling. In fact there are many varying reasons, these may include but are not limited to; QA/QC of RC techniques, geotechnical requirements, increased sample confidence below water table and detailed structural logging requirements in geologically complex deposits. For diamond drillholes the entire interval of core is sent for Hylogging (HyLogger: Automated visible to infrared drill core scanning system that provides semi-quantitative colour and mineralogy estimates), Geometallurgy processing (typically studies on lump / fines relationships) and sample preparation. For Open-hole Percussion and RC drillholes approximately 6 kg sample of drill cuttings is collected using either a static cone splitter or a five tier riffle splitter. Historical assaying processes were employed by Mt Newman Mining Ltd and Goldsworthy Mining Ltd in the 1960's and 1970's where samples were processed in company-owned laboratories. Mt Newman Mining Ltd regularly assayed samples for Fe, P, SiO2, Al2O3 by X-Ray Fluorescence (XRF) and sporadically for other elements such Mn, CaO, K2O, MgO, S and TiO2. Very early scout drill campaigns in the 1960's at Area C Goldsworthy Mining Ltd assayed Fe using a wet chemical titration method for analysis which only determined soluble Fe. Later drill programs were assayed for Fe, P, SiO2, Al2O3 by X-Ray Fluorescence (XRF). Post 1980, BHP Billiton Iron Ore has employed third party owned laboratories to process and assay drillhole samples. Samples are first oven dried and then are subsequently crushed to minus 2.8 mm (90% passing) and from each, a 2.5 kg split is robotically pulverised to minus 160μm (95% passing). After this process, 200 g of pulp is collected and later used for chemical analysis by X-Ray Fluorescence (XRF) for Fe, P, SiO2, Al2O3, MnO, CaO, K2O, MgO, S and TiO2 and Robotic Thermo-Gravimetric Analysis (ROBTGA) for LOI. Since FY13, RC drilling requires the injection of water at the bit so as to minimise dust exposure. Early indications are that a 40% reduction in dust exposure to personnel has been achieved. This practice produces wet samples of slurry consistency. During the FY14 drilling campaign, approximately 90% of the samples collected were from reverse circulation face hammer (RC) (140 mm diameter) and 10% from diamond drilling HQ triple tube core (DDH) (63.5 mm diameter). A total of 181,284 samples were analysed, with 21,462 samples collected by diamond drilling and 159,822 samples by RC drilling. During FY14, WAIO used external laboratories for the realisation of chemical analysis. UltraTrace (Bureau Veritas) was the main lab, processing 99% of WAIO samples, SGS laboratory was also used for processing project samples, chiefly from Bulk Sampling programs. Both are ISO 17025 certified Labs and work under the same procedures. Sample preparation protocols (drying temperatures and times, crushing and pulverising sizing requirements, etc) at laboratories meet standards defined in contracts in line with ISO standards, with QA/QC targets established; duplicates, blanks and standards are routinely included in sample batches for monitoring of precision, contamination and accuracy. Diagrammatic flow chart of the sample preparation process is shown Figure 5. BHP Billiton operational review for the year ended 30 June 2014 – Appendix 1 12 Fig gure 5: Sampling and anallytical flow diiagram 4.4 4 Quality of assay da ata and laboratory tests s Sin nce the yea ar 2000, WA AIO have em mployed a fformalised QA/QC Q program that inccludes routine controls for approximately 10% of the e samples sent s for che emical analy ysis. The WAIO W QA/QC C controls in nclude certiffied refference mate erials (CRM)), duplicates samples forr RC drillhole es, and blank ks. They havve specific objectives o in the pro ocess contro olling mechan nical prepara ation of samp pling and an nalyses. Certtified referen ce materials s were prepa ared by Ore Research & Exploration Lab (ORE, an ind dependent company c spe ecialising in CRM preparation) in 20 010. Ad dditionally byy contract, WAIO W have se et third partyy laboratory QA/QC conttrols that incclude sizing checks, c crussher duplicates, pulp p repeats, blanks and sta andards. Ac cceptance lim mits have bee en defined ac ccording to B BHP Billiton guidelines g an nd global sam mpling bench hmarks. QA A/QC controls include rou utine and ‘wiithout prior n notice’ visits to t the labora atories, with tthe aim of ensuring that the lab boratories are e working acccording to our o procedurre and to sup pervise samp ple integrity. If issues are e detected, th hey are e raised with the laborato ory managers s and an actiion plan is de eveloped to improve the process. QA A/QC improvvements implemented du uring FY14, iincluding the e quantificatio on of sampliing error and d the facilitattion of QA/QC imprrovements in n the field, sa aw a reductio on of the business risk as ssociated withh sampling uncertainty. u BH HP Billiton operational review w for the year ended 30 Jun ne 2014 – App pendix 1 13 4.5 Verification of sampling and assaying WAIO drillhole data is managed internally using processes and systems including: Computerised field logging system that includes controlled input through drop down lists and inbuilt validation checks to trap erroneous data at the earliest possible stage. Comprehensive SQL Server relational database that is structured such that quality data and relevant meta-data are integrated with the primary geological, geochemical and geophysical data, and Strict validation rules including confirmation of acceptable QA/QC results for each batch of samples assayed. Data is only loaded to the master database after all data for the hole has been validated and signed off by the field geologist. The WAIO drillhole database was audited by Golder Associates in July 2008 with no fatal flaws identified and all the key recommendations actioned. The WAIO database has a security model which requires user access to have supervisor approval. The system is backed up per standard backup procedures nightly. A disaster recovery test was successfully completed in May 2010 which recovered the database from a server image and backup. Primary data sources for all drillhole data are stored on the database server in a secure archive directory. As part of standard work procedures, 5% of the assay data stored in the drillhole database are physically checked by geologists against hardcopy laboratory certificates. The details of these checks and approvals are stored in the database. Additionally QA/QC requirements require 5% of all drillhole collars to be resurveyed. Data exported from the drillhole database for modelling contains summary statistics, and on the upload of the exported data into the modelling systems, work procedures require statistical checks to ensure the data loaded is the same as exported. 4.6 Physical parameters In general, in situ bulk density is measured using gamma-gamma single density tool. A single detector density tool with a cobalt source is used. The density tool is calibrated every fortnight at designated calibration sites against known physical densities. The tool measures electron density and it is then converted to bulk density using the calibration points. The following QA/QC measures are taken to monitor data quality and ensure the credibility of the density data for geological modelling and resource evaluation: Calibration of log responses to known engineering units (accuracy). Logging a repeatability borehole (demonstrate accuracy and determine precision / repeatability). Resurveying of 5-10% of drill holes on a drill program (repeatability / reproducibility check). Comparison of independent density measures, i.e. downhole gamma-gamma density versus density measurements made on diamond drill core samples ('volume and weight' method). RC drilling techniques cause a rougher sidewall condition in the drillhole internally termed rugosity. This rugosity causes an air gap between the downhole gamma density tool and the wall rock thus resulting in reduced density values. Therefore all RC derived density information is verified on a project by project basis. 4.7 Audits and reviews The WAIO resource drillhole process was audited by Golder Associates in July 2008. The audit covered drillhole planning; set out, pick up and downhole survey practices; drilling supervision; sample collection and submission; downhole geophysical surveys and calibration; data management processes; chain of custody; procedure documentation; data security and data validation. The audit had no fatal flaws identified and all the key recommendations have been actioned. BHP Billiton operational review for the year ended 30 June 2014 – Appendix 1 14 5 Resource estimation The resource estimation process followed by WAIO is well established and is consistent with standard industry practice. A set of procedures governs geological interpretation, estimation and reporting of Mineral Resources including, peer reviews and independent auditing. Documentation of the modelling work performed for each resource model used for resource reporting is stored electronically in a secure centralised location. These reports contain information on deposit extents, geometry, detailed geological and geostatistical modelling, data preparation and compositing and classification parameters including discussion of data spacings. Competent Persons visited the sites regularly for project planning and reviews. 5.1 Assumptions Cut-off parameters Typically a 54% Fe cut-off is used for resource reporting of Marra Mamba and Brockman Iron Formations, a 52% Fe cut-off is used for Channel Iron Deposits and a 50% Fe cut-off for operational areas within the Nimingarra Formation. A single cut-off value is applied per deposit however cut-offs range from 50-57% Fe across the WAIO inventory. These cut-offs employed for the Pilbara Mineral Resources estimates are based on operating successes and reserve work as outlined below. It is reasonable to consider that all material above the Mineral Resource cut-off grade would be eligible for sale via blending with higher grade ores or via beneficiation, either now or in the future as indicated by WAIO strategic mine planning. Mining factors Reported Mineral Resources assume extraction will continue with open pit bulk mining methods similar to the methods in operation currently with bench heights not decreasing below composite lengths. The current bench heights vary from mine to mine depending on deposit style, ranging from 6-12 m with some mines also mining benches with flitches of 3 and 4 m. Mineralisation volume modelling including internal waste and internal dilution consider continuity of volumes across multiple holes such that there is prospect for bulk mining extraction. Operating data and reconciliation outcomes support that the estimated Mineral Resources can be extracted using current open-pit bulk mining methods. Metallurgical factors Mineral Resource reporting is based on head grades with the assumption that lump and fines split products can be blended and marketed. Environmental factors Potentially Acid Forming (PAF) waste is coded in resource models based on three criteria: 1. Total sulphur content >0.2%, and 2. Not weathered, i.e. below the base of complete oxidisation, and 3. The waste is from a stratigraphy that has been identified as a potential PAF risk. All three criteria must apply to confirm PAF. Identification of stratigraphies as presenting a potential PAF risk is based on previous test work. The PAF coding is carried through to the reserve model. At an operational level, blast hole samples are tested for total sulphur content to confirm whether the waste will be managed as PAF material. Environment impacts from potential acid mine drainage are considered in waste management strategies during mine planning and at times lead to modification of the extracted resource; traditionally this impact is small and is not considered as a constraint on the reported Mineral Resources. BHP Billiton operational review for the year ended 30 June 2014 – Appendix 1 15 5.2 Estimation and modelling techniques Geological interpretation and data analysis The standard geological resource modelling method used by WAIO involves cross sectional interpretation followed by wire-frame modelling to produce a three dimensional interpretation of the geology and mineralised zones of the deposit. Increasingly, WAIO is adopting processes and systems for implicit modelling of geology, relying less on sectional interpretation to focus more directly on the three-dimensional consistency of the resulting geology model. The interpretation relies on downhole wireline logs of natural gamma supported by drill hole logging, geochemistry, downhole televiewer data and surface mapping. Interpretations undergo an internal peer review process to ensure accuracy and consistency. The work performed is documented in the Drilling and Geological Modelling Report for each model. Data preparation for resource modelling involves flagging the original sample intervals to the geological interpretation, then compositing the data to a uniform composite length (breaking at the geology contacts) for statistical and geostatistical analysis, these are typically 3 m for the Bedded Iron Deposits (BID) and 2 m for CID type deposits. The outputs from the geostatistical analysis are used to verify and determine the appropriateness of the estimation domains. Mineralisation domains are based on ‘natural’ cut-offs identifying stationary in-situ mineralisation volumes. They incorporate un-mineralised samples and/or low grade mineralised samples depending on the globally assessed mineralisation cut-offs and the degree of local continuity found during interpretation. Depending on grade continuity, dilution of mineralised domains ranges from a few to about 10% of samples within a domain. Any outlier deleterious values can be locally constrained during estimation; however top cutting is not currently part of WAIO estimation practices. Block modelling Using Vulcan software, block models are constructed using the wire-framed interpretation with the grade interpolation achieved by ordinary kriging, constraining sample selection within mineralised domains, stratigraphy and weathering horizons as defined during Exploratory Data Analysis. Block models use estimation parent cells with dimensions approximately half drillhole spacing in Easting/Northing. The block sizes vary depending on the density of the drilling or maturity in the understanding of an orebody's continuity e.g. a wider spaced Inferred Resource may justify parent block cell sizes of 300 m x 150 m x 15 m whereas a closer spaced Measured Resource may adopt a 25 m x 25 m x 3 m cell size. Sub-cells are used to ensure robust representation of geological boundaries and domain volumes. Resource models used by WAIO to generate Mineral Resource estimates stated in this report are comprised of models generated for the purpose of global resource reporting and medium to long-term mine planning studies. In some cases where the evaluation is at an early stage and drill information is broadly spaced, cross sectional area of influence type estimates have been generated for global resource reporting purposes, these represent 1,800 million wmt or 8% of WAIO's total Mineral Resources. All Mineral Resources estimated by cross sectional area of influence are classified as Inferred. Typically, Ordinary Kriging (OK) is used for grade estimation into parent cells for Fe, P, SiO2, Al2O3 and LOI, and Inverse Distance Weighting (IDW) or OK for the remaining trace chemical constituents – CaO, Mn, S, MgO, K2O and TiO2. Thirteen deposits have been interpolated using IDW only, these represent 1,400 million wmt or 6% of WAIO's total Mineral Resources. The majority of Mineral Resources estimated by IDW are classified as Inferred. For OK, search neighbourhood optimisation is performed to balance the risk of local conditional bias and smoothing of the estimate. Reconciliation confirms that overall, selectivity represented in the resource models mimics mining practice. In-situ (wet) bulk density is assigned in the models based on domain averages of filtered density data from geophysical wirelines (gamma-gamma single density tool) or from core measurements. Some models do employ a local estimate based on wireline data; however often data quality is regarded as insufficient for local estimation into cells. BHP Billiton operational review for the year ended 30 June 2014 – Appendix 1 16 Validation of the estimates include: A visual comparison of the drillhole grades and the block estimates in cross section. A comparison of length weighted domain averages from the composited drillhole database versus the volume weighted domain averages from the block estimate. A comparison of east-west, north-south and depth ‘swath’ panels on a domain basis throughout the deposit comparing composite versus block estimate grade averages, scatter plots and Q-Q plots. A review of the estimation performance parameters including number of samples utilised, number of drillholes utilised, average distance to samples, theoretical slopes of regression and kriging efficiency. A Discrete Gaussian Global Change of Support analysis. 6 Mineral Resources statement 6.1 Resource classification The classification of Mineral Resource is completed by BHP Billiton Competent Persons in accordance with the Australasian Code for the Reporting of Exploration Results, Mineral Resources and Ore Reserves (JORC, 2012). Factors influencing resource classification include data density, data quality, geological continuity and/or complexity, estimation quality, weathering zones, proximity to the water table. The possibility of eventual economic extraction is considered as a decision point for whether it is a Mineral Resource or not. 6.2 Discussion of relative accuracy / confidence The relative accuracy and therefore confidence of the resource estimates are deemed appropriate for their intended purpose of global resource reporting and medium to long-term mine planning studies. The underlying influencing factors effecting the accuracy and confidence as stated in section 6.1 above are taken into consideration during classification of the model and are therefore addressed by the Competent Person in the attributed resource classification. Reconciliation carried out on a quarterly and annual basis supports the confidence WAIO has in the estimations and related resource classifications. As a move to communicate the relative accuracy of our estimates we have changed our reporting precision for tonnes to two significant figures unless they are less than 100 Mt, in which case they are rounded to the nearest 10 Mt. 6.3 Mineral Resources declared Table 1 contains the statement of Mineral Resources for WAIO as at 30 June 2014. Mineral Resources are reported in compliance with the JORC Code (2012). Figure 6 shows the Mineral Resources changes by the significant contributing deposits, incorporating rounding. As can be seen, Mindy, Southeast Corner and Marillana are driving the total changes with 1.5 billion wmt between them. Measured Resource classification has seen a slight increase after consideration of mining depletion with increases occurring at or in the near vicinity of our producing mines. An overall increase of Indicated Resource classification is dominated by 1.2 billion wmt at Marillana which will provide improved resource confidence in our Life of Asset work for this deposit. A corresponding decrease of 0.9 billion wmt of Inferred Resource at Marillana is more than offset by an increase of Inferred Resource classification at the early stage Mindy and Southeast Corner deposits, contributing to no overall change in the quantity of WAIO Inferred Resource. BHP Billiton operational review for the year ended 30 June 2014 – Appendix 1 17 Total Mineral Resource Changes FY13-FY14 23.0 Ministers North Orebody 37 Eastern Syncline Others FY14 0.6 21.0 Bt 0.1 Orebody 32 0.5 0.2 0.1 0.3 0.2 0.4 Marillana 25 0.3 20 Southeast Corner Mindy Mining depletion FY13 15 Figure 6: Waterfall chart for major Mineral Resources changes 7 Independent review Selected operations and deposits are targeted for external audit as part of the Planning Department business plan based mainly on the significance of changes and the time from last audit. The last Mineral Resources audit was completed in FY14 by AMC consultants for the Jimblebar deposits Wheelarra 1-2, 3, 5-6; Hashimoto 1 and Mindoona. Actions closed out in FY14 are: 1. Creation of a centralised Geological Modelling team was completed in July 2013 – procedures are in place for validation and sign-off prior to estimation usage. 2. All current resource modelling projects evaluate the amount and quality of density data available for the project and then utilises the most appropriate method of applying that data to the resource model. Preference is given to estimating in-situ density via linear estimation techniques however, where this is not practicable density is based on domain averages of filtered density data from geophysical wirelines (gamma-gamma single density tool) or from core measurements. Investigations into the use of gamma-gamma dual density tools and further filtering and or correction of single density tools are ongoing. The remaining action items requiring close out are resource re-estimations for Orebody 29; Capricorn; Hashimoto H2-3-4 and E Deposit all of which are scheduled to be completed in the resource modelling five year plan. 8 Further work Mineral Resources confidence is reflected in the applied resource classifications as guided by the JORC Code (2012) with factors influencing resource classification including but not limited to data density, data quality, geological continuity and/or complexity, estimation quality and weathering zones. Reconciliation data from operating mines supports our position. Other estimation improvements being investigated include unfolding techniques and usefulness of recoverable resource estimation techniques such as uniform conditioning. 9 References Harmsworth R.A., Kneeshaw M., Morris R.C., Robinson C.J., and Shrivastava P.K., 1990. BIF–Derived Iron Ores of the Hamersley Province in Monograph 14, Geology of the Mineral Deposits of Australia and Papua New Guinea, pp 617-642. (AusIMM, Melbourne). BHP Billiton operational review for the year ended 30 June 2014 – Appendix 1 18


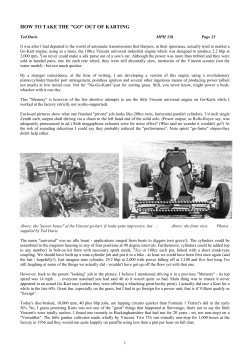


© Copyright 2026