
Improving Acute and Long-term Myocardial Infarction Care
Improving Acute and Long-term
Myocardial Infarction Care
S.S. Liem
Su-San Liem
Colophon
The studies described in this thesis were performed at the department of Cardiology
of the Leiden University Medical Center, Leiden, The Netherlands
Copyright © Su-San Liem, The Hague, The Netherlands. All rights reserved. No part
of this book may be reproduced of transmitted, in any form or by any means, without
prior permission of the author.
Cover after a painting by Su-San Liem, and ECG by Arie Maan
Lay out Optima Grafische Communicatie, Rotterdam
Printed by Optima Grafische Communicatie, Rotterdam
ISBN 978-90-8559-512-0
Improving
Improving Acute
Acute and
and Long-term
Long-term
Myocardial
Myocardial Infarction
Infarction Care
Care
PROEFSCHRIFT
ter verkrijging van
de graad van Doctor aan de Universiteit Leiden,
op gezag van de Rector Magnificus prof. mr. P.F. van der Heijden,
volgens besluit van het College van Promoties
te verdedigen op donderdag 23 april 2009
klokke 13.45 uur
S.S. Liem
door
Su-San Liem
geboren te Tegelen
in 1976
PROMOTIECOMISSIE
Promotores
Professor Dr. E.E. van der Wall
Professor Dr. M.J. Schalij
Referent
Dr. W. Jaarsma (St. Antonius Ziekenhuis, Nieuwegein)
Overige leden
Prof. Dr. J.W. Jukema
Dr. S.C. Cannegieter
Dr. P.V. Oemrawsingh (Medisch Centrum Haaglanden, Den Haag)
Financial support by the Netherlands Heart Foundation and the Bronovo Research
Fund for the publication of this thesis is gratefully acknowledged.
TABLE OF CONTENTS
Chapter 1
7
General introduction and outline of the thesis
Chapter 2
27
MISSION!: optimization of acute and chronic care for patients with acute
myocardial infarction.
Am Heart J. 2007; 153: 14.e1-11.
Letter to the editor
49
Am Heart J 2007; 153: e33
Response to the letter to the Editor by van de Werf
51
Am Heart J 2007; 153: e35
Chapter 3
55
Optimization of acute and long-term care for patients with an acute
myocardial infarction: The Leiden MISSION! project
Submitted for publication
Chapter 4
75
Does left ventricular dyssynchrony immediately after acute myocardial
infarction result in left ventricular dilatation?
Heart Rhythm. 2007; 4: 1144-8.
Chapter 5
87
Left ventricular dyssynchrony acutely after myocardial infarction predicts
left ventricular remodeling.
J Am Coll Cardiol. 2007; 50: 1532-40.
Chapter 6
Sirolimus-eluting stents versus bare-metal stents in patients with
ST-segment elevation myocardial infarction: 9-month angiographic and
intravascular ultrasound results and 12-month clinical outcome results
from the MISSION! Intervention Study.
J Am Coll Cardiol. 2008; 51: 618-26.
107
Chapter 7
129
Cardiovascular Risk in Young Apparently Healthy Descendents from Asian
Indian Migrants in the Netherlands: The SHIVA study
Accepted Netherlands Heart Journal
Chapter 8
Role of calcified spots detected by intravascular ultrasound in patients
147
with ST-segment elevation acute myocardial infarction.
Am J Cardiol. 2006; 98: 309-13.
Summary, conclusions and future perspectives
157
Samenvatting, conclusies en toekomstperspectieven
167
List of publications
179
Curriculum Vitae
183
CHAPTER 1
General introduction and outline of the thesis
S.S. Liem
Chapter 1 : Introduction
I
Epidemiology and burden
Cardiovascular diseases are the number one cause of death and are projected to
remain so for the next decades.(1) An estimated 17.5 million people died from cardiovascular diseases in 2005, representing 30% of all global deaths.(1) Of these deaths,
7.6 million were due to ischaemic heart disease. In the Netherlands, rates are comparable: of the 136.553 people who died in 2004, 33% were due to a cardiovascular
disease, of whom 31% due to ischaemic heart disease.(2) In comparison, in the
beginning of the 20th century only 9% of all death were the result of a cardiovascular
disease. During the last century however degenerative diseases became more common as the incidence of infectious pandemics decreased. The peak of cardiovascular
related mortality was reached in the seventies. In those years cardiovascular disease
related mortality was responsible for 45% of all death in the Netherlands.(3) Since
then cardiovascular mortality declined steadily. The impressive reduction in mortality
rates of 54% among men and 44% among women for ischemic heart disease can
be explained by development and introduction of better prevention and treatment
strategies, as natural history and pathophysiology of ischaemic heart disease became more clear.(2) The introduction of the coronary care unit in the beginning of
the seventies of the last century alone resulted in a decline of in-hospital mortality of
acute myocardial infarction (AMI) patients by 50% due to a major reduction of fatal
arrhythmic events.(4,5) The introduction of fibrinolytic therapy(6), aspirin (7-9) and
ACE-inhibitors (10-12) reduced short-term infarct related mortality further to 15%.
Due to fibrinolytic therapy it became possible to open the infarct related artery in a
significant number of patients by resolving the thrombus, which resulted in a reduction of the extent of myocardial necrosis.(6) The latest major improvement, mechanical revascularization therapy by Percutaneous Coronary Interventions in the acute
phase of the myocardial infarction, further reduced mortality rates to 5-15% at 12
months follow-up.(13-16) Since the majority of patients presenting in a hospital with
an AMI became survivors, long-term treatment strategies to prevent a second heart
attack or complications of the initial heart attack (such as ventricular arrhythmias or
heart failure) became more important. Secondary prevention by aspirin (9,17,18) and
statins reduced the relative risk of a second myocardial infarction by more than 30%.
Beta-blockers (19,20), ACE-inhibitors(10-12,21), AT-II blockers(22), and aldosteron
blockers (23) improved long-term prognosis by improving ventricular function. Betablockers (19,20) and Implantable Cardioverter Defibrillators (24-26) have reduced
the risk for sudden cardiac death. Moreover, favorable modification of classical risk
factors, like tobacco use (27), unhealthy eating patterns (28) and physical inactivity
9
10
(29,30) reduced the rate of coronary events. In addition, participation in a cardiac
rehabilitation program post-AMI helps the patient to establish and maintain these
healthy lifestyles.(29,30) With the widespread application of coronary interventions,
fibrinolytic agents, antithrombotic therapy and secondary prevention, the overall
1-year mortality was reduced to 4-6%, at least in those who participated in the
latest large-scale randomized trials.(31,32) Despite these positive results, mortality
rates in registries remain higher compared to the mortality rates in trials. Moreover,
cardiovascular diseases are still the leading causes of mortality worldwide.
II
Pathophysiology of ischaemic heart disease
Ischemic heart disease is caused by atherosclerosis. Atherosclerosis represents a
chronic inflammatory response to the stress imposed by various risk factors, i.e.
male sex, tobacco use, psychosocial stress, unhealthy diet, diabetes, hypertension, obesity and physical inactivity.(33) These stimuli induce a cascade of pathophysiological and patho-anatomical processes in the coronary artery. A schematic
overview of the development of atherosclerosis is given in Figure 1.(34) Endothelial
dysfunction of the artery wall is considered to be the first step in the development of
atherosclerosis, which leads to hyper-adhesiveness of leucocytes, enhanced perme-
1
2
3
4
5
6
7
Figure 1. Development and complications of a human atheroslerotic plaque.
On top. The development of the atherosclerotic lesion is depicted in time from normal artery (1)
Figurethat
1 chapter
to atheroma
caused 1clinical manifestations (5-7). On the bottom. Cross sections of different
Afkomstig
van PDF Libby
fig1.1 Normal artery. 2. Endothelial dysfunction and recruitment
stages of
the atherosclerotic
lesion
of leucocytes resulting in lipid accumulation in the intimal space. 3. Evolution to fibrofatty stage
due to foam cell formation and amplification of leukocyte recruitment, smooth muscle cell
migration and proliferation. 4. Expression of tissue factor resulting in weakening of the fibrous
cap. 5. Rupture of fibrous cap resulting in thrombus formation. 6. Thrombus resorbs and the lesion
evolves to an advanced fibrous and calcified plaque. 7. Thrombus formation due to erosion of the
endothelial layer. See text for further explanation. Adapted from Libby, et al. (34)
Chapter 1 : Introduction
ability of lipoproteins, functional imbalance between pro- and anti-thrombotic factors,
imbalance between growth stimulators and inhibitors and vasoactive substances.
Atherosclerosis can become clinically manifest as stable angina pectoris, an acute
coronary syndrome (i.e. unstable angina, non-ST segment elevation or ST-segment
elevation myocardial infarction) and/or sudden cardiac death. In acute coronary syndromes, rupture or erosion of the atherosclerotic lesion causes partial or total occlusion
of the coronary artery by forming a luminal thrombus.(34) This thrombotic response
can be explained by several factors: the content of the exposed atherosclerotic plaque
is highly thrombogenic as a result of ongoing inflammation, expression of tissue factors by macrophages and the lipid core containing active tissue factors. After plaque
rupture, these contents are exposed directly to the circulating blood. High shear
stress forces promote arterial thrombosis, probably via shear stress induced platelet
activation. Subsequently, fibrin plays an important role to stabilize the initial and fragile
platelet thrombus. Of note, the thrombotic response to plaque rupture is dynamic:
thrombosis and thrombolysis tend to occur simultaneously, often in association with
vasospasm, causing intermittent flow obstruction and distal embolization.(35)
For the optimal treatment of myocardial infarctions, several issues have to be kept
in mind:
1. Irreversible myocardial damage occurs already after 15 to 20 minutes of occlusion
of the coronary artery, and progresses from the subendocardium to the subepicardium in a time dependent fashion (“the wave-front phenomenon”).(36)
2. The extent of myocardial damage is inversely related to the time of onset of the
coronary artery occlusion (start symptoms) and the restoration of blood flow.
Maximal damage occurs within the first 4 to 6 hours of sustained occlusion,
however most damage arises already in the first 2 or 3 hours.(36-38)
3. Of those who die, approximately half do so within 2 hours after onset of symptoms, before reaching the hospital.(39)
4. Most early deaths are related to ventricular arrhythmias.
5. Most myocardial infarctions originate from atherosclerotic lesions who, prior to
the event, were mildly to moderately stenotic. Hence, not the extent of plaque
burden, but the biological state, predicts whether or not rupture of the atherosclerotic lesion and myocardial infarction will occur.(40)
6. As AMI is an acute exacerbation of a chronic process, interventions have to focus
not only on the acute event, but also on reduction of the burden of atherosclerosis
and the complications of AMI during follow-up. Furthermore, to prevent AMI it is
important to identify and treat patients at high risk.
11
12
III Guidelines and implementation
To optimize care and outcome of AMI patients many organizations, e.g. the European
Society of Cardiology, the American College of Cardiology with the American Heart
Association, and The Netherlands Society of Cardiology, have published guidelines
for the treatment of patients with AMI.(41-44) Guidelines are systematically developed statements to assist practitioners and patients in making evidence-based decisions about appropriate health care for specific clinical conditions.(45) These AMI
guidelines advocate early and aggressive reperfusion strategies, recommend the
use of a combination of evidence-based medicine and support programs to stimulate
a healthier lifestyle. Compliance to these guidelines is proven beneficial. Shiele et al.
demonstrated that the degree of guideline compliance is independently correlated
with the one-year mortality after AMI.(46) In this study, a risk score based on initial
presentation, and a compliance index based on patient characteristics, type of myocardial infarction, in-hospital management (including revascularization strategies and
use of recommended drugs) were established. Mortality was found independently
related to three variables: type of myocardial infarction, risk score and compliance index. After stratification for risk score and type of infarction the relationship between
extent of guideline compliance and mortality remained strong. These findings were
confirmed by the recently published report of the GRACE registry, which analyzed
the in-hospital management of 44372 myocardial infarction patients enrolled at 113
hospitals in 14 countries from 1999 to 2005.(47) A clear trend was shown towards an
increased use of guideline-recommended medication and interventional strategies
over the course of this study. These changes were accompanied by a significant
decrease in in-hospital death, cardiogenic shock, recurrent myocardial infarction, and
the development of heart failure independent of the risk status of the patient at
presentation.
Registries are of major importance to provide clear insights in day-to-day practice,
effectiveness of treatment and to determine the actual implementation level of
guidelines in the real world. Beside the fact that these registries revealed a global
effort to improve day-to-day practice, they also identified substantial opportunities
for improvement. For example, in the Grace registry, still one third of all AMI patients
did not receive any reperfusion therapy; a similar number (36%) was found in the
second Euro Heart survey.(48,49) Median door-to-balloon time remained relatively
constant from 1999 to 2005: i.e. between 75 and 84 minutes.(48) Even worse is
the situation after the acute phase: modifiable risk factors were often not controlled
and optimal medication is often not prescribed.(50,51) Also confirmed by the recent
Chapter 1 : Introduction
registries, but also reported in prior surveys, guidelines were applied less thoroughly
in highest risk patients, for example patients of older age, patients with prior myocardial infarction or patients with diabetes.(46,48,52) Moreover, women overall are less
adequately treated compared to men.(46,48,52-54) In conclusion, over the years
treatment of AMI patients has improved significantly, however, still a large number
of patients is treated far from optimal. Therefore, all efforts should be addressed to
elevate the standard of care to a level that all patients benefit from optimal therapy.
This can be accomplished by changing the system of care delivery. Herein, money
might seem an obstacle; however in the Western world it seems more a question
of the correct allocation of money and how to overcome bureaucratic organizational
barriers.
IV Barriers of guideline implementation
Lack of implementation of guidelines can be explained by several factors: the guidelines themselves, patient- and physician’s constrains, and organizational barriers.
(55)
- Guidelines: First, the number of guidelines dealing with at least partly the same
patient population makes it difficult to implement the different, sometimes even conflicting recommendations into clinical practice; Second, most guidelines consist of
numerous pages (for example the American Heart Organization/American College of
Cardiology guidelines for management of ST-elevation myocardial infarction patients
contains 212 pages) making it less likely that physicians have knowledge of the
complete contents of all guidelines.(41) Third, the basis of these guidelines ranges
from randomized clinical trials to expert panel opinions.(56) The “generalisability” of
trial data are sometimes questionable due to the often highly selected study populations enrolled in these randomized trials. Additionally, statements are classified by
level of evidence making interpretation of the guidelines complex.
- Physicians’ constrains: Not all physicians are familiar with the guidelines.(57)
Moreover, physicians’ awareness of the guidelines is not similar as reaching the
recommended treatment goals in patients. For example, 95% of the physicians
were aware of the cholesterol recommendations as written in the National Education
Cholesterol Program, however only 38% of the patients achieved adequate cholesterol levels.(54) Some physicians judge guidelines as oversimplified, “cookbook”
medicine, too rigid to apply to individual patients and a threat for the autonomy of
the physicians.(57)
13
14
- Patients’ factors: Patients play a central role in the success of therapy. It takes a
lot of effort, time and money to adopt and maintain a healthier behavior and to use
all prescribed drugs. Factors that appear to influence compliance include patient’s
knowledge, confidence in the ability to follow recommended behavioral changes,
perception of health and benefits of therapy or behavior, availability of social support,
and complexity of the regimen.(58-60) Of importance, reinforcement on a regular
basis is crucial to maintain a healthier lifestyle.(55)
- Organizational barriers: optimal treatment of AMI patients should be a continuumof-care; it should include acute and long-term care.(41,43,44) Therefore, regional
ambulance services, general physicians, regional hospitals, cardiologist, nurses and
rehabilitation centers should work all together. Guidelines of the different professionals should be aligned to make smooth transition from one setting to the other
possible. Besides optimizing care processes, political, economical and financial issues have to be overcome. A mental switch has to be established from self-interest
to community-interest.
V Bridging the gap between science and practice
The question is how to bridge the gap between science and practice? Translational
research refers to translating research into practice: i.e. ensuring that new diagnostics and treatment modalities actually reach the patients or population for whom
they are intended, and that they are implemented in a correct manner.(61) Registries
confirm that passive diffusion of guideline recommendations into clinical practice is
not sufficient.(41,47,49,50,62) A more active approach is therefore needed, focusing
on changing the system of care delivery to accomplish a high and uniform standard
of care for all patients.(63) The Cooperative Cardiovascular Project was one of the
first quality improvement programs for patients with AMI.(64) This project started in
1992 with the aim to improve the quality of care for patients with AMI by data feedback and the use of predefined quality indicators. By doing so, better performance
was achieved in prescription of aspirin during hospitalization and beta-blockers at
discharge. This resulted in a reduction of both in-hospital and one-year mortality.
Data feedback remains a crucial step in the cycle of continuous quality improvement
(figure 2).(65, 66)
Various quality improvement programs followed the Cooperative Cardiovascular
Project: for example, Get with the Guidelines, Guidelines Applied in Practice and
Crusade.(67-68) In addition to the data feedback these programs created a system
differ substantially.
and fibrinolytic
tically reduce morreatment for NSTE
y reduce early morMI are rapidly identi, but identification
TEMI often is dencertainty about
on and other highFinally, although
TEMI have been
des, the relative
TE ACS are being
of new trials and
mmon pathophysioSTE ACS, strategies
differ markedly in
acing quality
gins with the publid after expert comoverview reuse of therapies
CPGs, perforestablish benchmance indicators
uality of care proeir adherence to
patient outcomes
ence to practice
improvements in
he logical construct
es limit the success
age the adoption of
appear to be multified lack of physieement with pracments to
care.6 These limitaonal deficits and
physician behavior,
blished practice
of resources dediement.6,31 Local ports, as clinicians
re benchmarks or
care delivery
iders.30,32 Finally,
limitations, such as
ineation of grading
tions based solely
Chapter 1 : Introduction
Roe et al 607
Figure 1
15
The cycle of continuous quality improvement. Adapted from Califf
Figure
2. The cycle of continuous quality improvement. Adapted from Califf et al. (66)
28
et al
with permission.
of reminders (e.g. care-tools) in the form of standard orders, discharge forms and
upon expert consensus,
inadequate
processes
regu- of the use of these care-tools was corinformation
forms for
patients.
The for
extent
lar updates of guidelines based on data from new stud-
related
to the degree of following the guidelines.(63) Nowadays it is clear that care
ies, and uncertainty about the relevance of treatment
recommendations only
for diverse
and clinical situ- when it is embedded into a system of
improvement
can patients
be accomplished
33,34
ations.
Thus, guidelines should be considered sup-
reminders.
Memory
is fallible,
plements to clinical
judgment
rather thanand
rigidthe
stan-more we can do to assure patients of the
dards.
consistent
application of knowledge at the highest level, the better.(70)
Multiple strategies designed to change physician beOn have
the other
hand, optimal
AMI
havior
been evaluated,
but success
ratescare
haveshould cover both acute and long-term care.
varied
greatly.
Interventions
designed
to
enhance
phyThe above mentioned projects mainly focused
on acute cardiac care and secondary
sician education, such as continuing medical education
prevention
strategies
during
the
index
conferences and
printed materials,
have
been
shownhospitalization phase only. In the last few
to affect performance only slightly.32,35,36 Reminder
years,
more and more projects installed pre-hospital care systems: networks of
systems, such as critical-care pathways, standard admission and discharge
orders, patient-oriented
collaborating
emergency
medical intervenservices, community hospitals and interventional
tions, and the use of local opinion leaders to educate
cardiac
foster
early
physicians,centers
generallyto
have
shown
morereperfusion
success in im- therapy in acute AMI patients.(71-74) Pre32,35,37,38
proving adherence
although
hospital
triage to
is CPGs.
effective inFurther,
limiting
myocardial damage and improving outcome.
modest, success has been shown when physicians
15,39
(72,74)
Moreover,
well-functioning
system of care… and fast transport to
have received
feedback“a
about
their performance.regional
A
randomized
trial
has
confirmed
that
improvements
the most appropriate facility is the key to the success of the treatment”, as stated
in patient care are greater when physicians are motiin
thebymost
recent
published
guidelines
vated
feedback
provided
according to
achievable for AMI patients of the European Society
benchmarks of care (performance indicators based
of Cardiology of 2008.(43) Although, as addressing systematically one phase of AMI
upon top-performing practices) rather than longitudi40
care
improves outcome
it can be expected that further improvement of
nal, physician-specific
feedback.significantly,
Despite the modest
benefits of these single interventions, however, systemcare
and outcome can be achieved by maximizing the use of evidence-based therapy
atic reviews have concluded that combined or multifaceted QI
most likely
to improve
the
during
allinterventions
essential are
phases
of AMI
care. Therefore,
in 2004 an all-phases integrated
use of evidence-based therapies and interventions.32,35
guideline-implementation
program
for patients with AMI: the MISSION! protocol
Although a comprehensive approach
to QI seems
the best
strategy for
improving
adherence in
to CPGs,
was
designed
and
implemented
daily clinical practice. The aim of MISSION! was
institutional and methodologic hurdles must be overto
improve
careimprovements
by implementation
come
to ensureAMI
sustained
in patient of the most recent international guidelines
care.
prospective phases
study has of
identified
characteristics
in
allAessential
AMI care,
i.e. the pre-hospital, in-hospital and outpatient
phase up to one-year after AMI, thereby maximizing the use of evidence-based
medicine in real life.
16
VI Aim and outline of the thesis
The aim of this thesis was to evaluate the design, and subsequent implementation of
the MISSION! protocol in daily AMI care. The rationale, design and implementation of
the MISSION! protocol is described in Chapter 2 MISSION! is a framework for clinical
decision making and treatment to improve acute and long-term AMI care. MISSION!
was a multifaceted intervention, and lessons learned from prior quality improvement
programs were incorporated in the MISSION! protocol. To our knowledge, this allphases integrated approach is unique, and implicates a close collaboration among all
health care professionals in the “Hollands-Midden” region in The Netherlands.
Chapter 3 presents the results of the MISSION! protocol on AMI care. Using a
before (n=84) and after implementation cohort of AMI patients (n=518) we assessed
the impact of MISSION! by performance indicators.
In Chapter 4 and 5 we evaluated the relation between LV dyssynchrony early after
AMI and the occurrence of long-term LV dilatation. One out of 6 AMI patients develops
LV dilatation (defined as an increase of left ventricle end-systolic volume of ≥ 15%).(75)
LV dilation is associated with adverse long-term prognosis.(76) Early identification of
patients prone to LV remodeling is needed to optimize therapeutic management.
Chapter 6 describes the outcome of the MISSION! Intervention Study, a prospective randomized control trial comparing the efficacy and safety of sirolimus-eluting
stents and bare-metal stents in patients with ST-elevation AMI. Eligible patients from
the MISSION! protocol were included in this intervention study.
In Chapter 7 the results of the SHIVA study is described. Asian Indian migrants
in the Western world are highly susceptible for ischemic heart disease (IHD).(77,78)
Until now, most IHD risk studies were performed in 1st and 2nd generation Asian Indian expatriates.(79-83) For optimal prevention, knowledge of the cardiovascular risk
profile of younger generations is crucial. In this study we assessed the prevalence of
conventional IHD risk factors and Framingham risk score in asymptomatic 3rd to 7th
generation Asian Indian descendants, compared to Europeans. Asymptomatic was
defined as not being familiar with IHD, diabetes, hypertension or high cholesterol,
nor receiving any form of treatment for any of these conditions.
Chapter 8 describes the results of a study investigating the distribution, arc and
location of calcified spots in AMI related coronary artery of patients with ST-elevation
myocardial infarction. From Electron Beam Computed Tomography studies it is
known that the extent of intracoronary calcium is related to the risk of coronary
events.(84-88) In this study we investigated the degree of intracoronary calcium by
the use of gray-scale imagines.
Chapter 1 : Introduction
Finally, a general summary, conclusions and future perspectives are described in
English and Dutch respectively.
17
18
References
1.
World Health Organization. Cardiovascular diseases, fact sheet no 317. 2007. World Health
Organization. http://www.who.int/mediacentre/factsheets/fs317/en/index.html
2.
Koek H.L., Engelfriet-Rijk C.J.M., Bots ML. Hart- en vaatziekten in Nederland 2006. In:
Jager-Geurts MH, Peters RJG, van Dis SJ, Bots ML, editors. Hart- en vaatziekten in Nederland 2006. Den Haag: Nederlandse Hartstichting, 2006.
3.
Kromhout D, van Dis I, Verschuren M. Een vermijdbare kwaal? Een eeuw hart- en vaatziekten in Nederland. Nederlandse Hartstichting, Nederlandse Vereniging voor Cardiologie
i.s.m. Waanders Uitgevers Zwolle, 2004: 35-47.
4.
Julian D.G., Valentine P.A., Miller G.G. Disturbance of rate, rhythm and conduction in acute
myocardial infarction: a prospective study of 100 consecutive patients with the aid of
electrocardiographic monitoring. Am J Med 1964; 37:915-927.
5.
Goble AJ, Sloman G, Robinson JS. Mortality reduction in a coronary care unit. Br Med J
1966; 1(5494):1005-1009.
6.
Indications for fibrinolytic therapy in suspected acute myocardial infarction: collaborative
overview of early mortality and major morbidity results from all randomised trials of more
than 1000 patients. Fibrinolytic Therapy Trialists’ (FTT) Collaborative Group. Lancet 1994;
343(8893):311-322.
7.
Randomised trial of intravenous streptokinase, oral aspirin, both, or neither among 17,187
cases of suspected acute myocardial infarction: ISIS- 2. ISIS-2 (Second International Study
of Infarct Survival) Collaborative Group. Lancet 1988; 2(8607):349-360.
8.
ISIS-3: a randomised comparison of streptokinase vs tissue plasminogen activator vs
anistreplase and of aspirin plus heparin vs aspirin alone among 41,299 cases of suspected
acute myocardial infarction. ISIS-3 (Third International Study of Infarct Survival) Collaborative Group. Lancet 1992; 339(8796):753-770.
9.
Collaborative meta-analysis of randomised trials of antiplatelet therapy for prevention of
death, myocardial infarction, and stroke in high risk patients. BMJ 2002; 324(7329):71-86.
10.
Flather MD, Yusuf S, Kober L, Pfeffer M, Hall A, Murray G et al. Long-term ACE-inhibitor
therapy in patients with heart failure or left-ventricular dysfunction: a systematic overview
of data from individual patients. ACE-Inhibitor Myocardial Infarction Collaborative Group.
Lancet 2000; 355(9215):1575-1581.
11.
Danchin N, Cucherat M, Thuillez C, Durand E, Kadri Z, Steg PG. Angiotensin-converting
enzyme inhibitors in patients with coronary artery disease and absence of heart failure or
left ventricular systolic dysfunction: an overview of long-term randomized controlled trials.
Arch Intern Med 2006; 166(7):787-796.
Chapter 1 : Introduction
12.
Indications for ACE inhibitors in the early treatment of acute myocardial infarction: systematic overview of individual data from 100,000 patients in randomized trials. ACE Inhibitor
Myocardial Infarction Collaborative Group. Circulation 1998; 97(22):2202-2212.
13.
Keeley EC, Boura JA, Grines CL. Comparison of primary and facilitated percutaneous coronary interventions for ST-elevation myocardial infarction: quantitative review of randomised
trials. Lancet 2006; 367(9510):579-588.
14.
Keeley EC, Boura JA, Grines CL. Primary angioplasty versus intravenous thrombolytic
therapy for acute myocardial infarction: a quantitative review of 23 randomised trials.
Lancet 2003; 361(9351):13-20.
15.
Dalby M, Bouzamondo A, Lechat P, Montalescot G. Transfer for primary angioplasty versus
immediate thrombolysis in acute myocardial infarction: a meta-analysis. Circulation 2003;
108(15):1809-1814.
16.
Zijlstra F, Hoorntje JC, de Boer MJ, Reiffers S, Miedema K, Ottervanger JP et al. Long-term
benefit of primary angioplasty as compared with thrombolytic therapy for acute myocardial
infarction. N Engl J Med 1999; 341(19):1413-1419.
17.
Anand SS, Yusuf S. Oral anticoagulant therapy in patients with coronary artery disease: a
meta-analysis. JAMA 1999; 282(21):2058-2067.
18.
Collaborative overview of randomised trials of antiplatelet therapy--I: Prevention of death,
myocardial infarction, and stroke by prolonged antiplatelet therapy in various categories of
patients. Antiplatelet Trialists’ Collaboration. BMJ 1994; 308(6921):81-106.
19.
Olsson G, Wikstrand J, Warnold I, Manger C, V, McBoyle D, Herlitz J et al. Metoprololinduced reduction in postinfarction mortality: pooled results from five double-blind randomized trials. Eur Heart J 1992; 13(1):28-32.
20.
Freemantle N, Cleland J, Young P, Mason J, Harrison J. beta blockade after myocardial
infarction: systematic review and meta regression analysis. BMJ 1999; 318(7200):17301737.
21.
Teo KK, Yusuf S, Pfeffer M, Torp-Pedersen C, Kober L, Hall A et al. Effects of long-term
treatment with angiotensin-converting-enzyme inhibitors in the presence or absence of
aspirin: a systematic review. Lancet 2002; 360(9339):1037-1043.
22.
Pfeffer MA, McMurray JJ, Velazquez EJ, Rouleau JL, Kober L, Maggioni AP et al. Valsartan,
captopril, or both in myocardial infarction complicated by heart failure, left ventricular dysfunction, or both. N Engl J Med 2003; 349(20):1893-1906.
23.
Pitt B, Remme W, Zannad F, Neaton J, Martinez F, Roniker B et al. Eplerenone, a selective
aldosterone blocker, in patients with left ventricular dysfunction after myocardial infarction.
N Engl J Med 2003; 348(14):1309-1321.
19
20
24.
Wilber DJ, Zareba W, Hall WJ, Brown MW, Lin AC, Andrews ML et al. Time dependence
of mortality risk and defibrillator benefit after myocardial infarction. Circulation 2004;
109(9):1082-1084.
25.
Moss AJ, Zareba W, Hall WJ, Klein H, Wilber DJ, Cannom DS et al. Prophylactic implantation of a defibrillator in patients with myocardial infarction and reduced ejection fraction. N
Engl J Med 2002; 346(12):877-883.
26.
Hohnloser SH, Kuck KH, Dorian P, Roberts RS, Hampton JR, Hatala R et al. Prophylactic use
of an implantable cardioverter-defibrillator after acute myocardial infarction. N Engl J Med
2004; 351(24):2481-2488.
27.
Aberg A, Bergstrand R, Johansson S, Ulvenstam G, Vedin A, Wedel H et al. Cessation of
smoking after myocardial infarction. Effects on mortality after 10 years. Br Heart J 1983;
49(5):416-422.
28.
Mead A, Atkinson G, Albin D, Alphey D, Baic S, Boyd O et al. Dietetic guidelines on food and
nutrition in the secondary prevention of cardiovascular disease - evidence from systematic
reviews of randomized controlled trials (second update, January 2006). J Hum Nutr Diet
2006; 19(6):401-419.
29.
Graham I, Atar D, Borch-Johnsen K, Boysen G, Burell G, Cifkova R et al. European guidelines
on cardiovascular disease prevention in clinical practice: executive summary. Eur Heart J
2007; 28(19):2375-2414.
30.
Taylor RS, Brown A, Ebrahim S, Jolliffe J, Noorani H, Rees K et al. Exercise-based rehabilitation for patients with coronary heart disease: systematic review and meta-analysis of
randomized controlled trials. Am J Med 2004; 116(10):682-692.
31.
Primary versus tenecteplase-facilitated percutaneous coronary intervention in patients
with ST-segment elevation acute myocardial infarction (ASSENT-4 PCI): randomised trial.
Lancet 2006; 367(9510):569-578.
32.
Armstrong PW, Granger CB, Adams PX, Hamm C, Holmes D, Jr., O’Neill WW et al. Pexelizumab for acute ST-elevation myocardial infarction in patients undergoing primary percutaneous coronary intervention: a randomized controlled trial. JAMA 2007; 297(1):43-51.
33.
Ross R. Atherosclerosis--an inflammatory disease. N Engl J Med 1999; 340(2):115-126.
34.
Libby P. Current concepts of the pathogenesis of the acute coronary syndromes. Circulation
2001; 104(3):365-372.
35.
Davies MJ. The pathophysiology of acute coronary syndromes. Heart 2000; 83(3):361-366.
36.
Reimer KA, Jennings RB. The “wavefront phenomenon” of myocardial ischemic cell death.
II. Transmural progression of necrosis within the framework of ischemic bed size (myocardium at risk) and collateral flow. Lab Invest 1979; 40(6):633-644.
Chapter 1 : Introduction
37.
Boersma E, Maas AC, Deckers JW, Simoons ML. Early thrombolytic treatment in acute
myocardial infarction: reappraisal of the golden hour. Lancet 1996; 348(9030):771-775.
38.
De Luca G, Suryapranata H, Ottervanger JP, Antman EM. Time delay to treatment and mortality in primary angioplasty for acute myocardial infarction: every minute of delay counts.
Circulation 2004; 109(10):1223-1225.
39.
Tunstall-Pedoe H, Kuulasmaa K, Mahonen M, Tolonen H, Ruokokoski E, Amouyel P. Contribution of trends in survival and coronary-event rates to changes in coronary heart disease
mortality: 10-year results from 37 WHO MONICA project populations. Monitoring trends
and determinants in cardiovascular disease. Lancet 1999; 353(9164):1547-1557.
40.
Fuster V, Moreno PR, Fayad ZA, Corti R, Badimon JJ. Atherothrombosis and high-risk
plaque: part I: evolving concepts. J Am Coll Cardiol 2005; 46(6):937-954.
41.
Antman EM, Anbe DT, Armstrong PW, Bates ER, Green LA, Hand M et al. ACC/AHA
guidelines for the management of patients with ST-elevation myocardial infarction: a report
of the American College of Cardiology/American Heart Association Task Force on Practice
Guidelines (Committee to Revise the 1999 Guidelines for the Management of Patients with
Acute Myocardial Infarction). Circulation 2004; 110(9):e82-292.
42.
Van de Werf F, Ardissino D, Betriu A, Cokkinos DV, Falk E, Fox KA et al. Management of
acute myocardial infarction in patients presenting with ST-segment elevation. The Task Force
on the Management of Acute Myocardial Infarction of the European Society of Cardiology.
Eur Heart J 2003; 24(1):28-66.
43.
Van de Werf F, Bax J, Betriu A, Blomstrom-Lundqvist C, Crea F, Falk V et al. Management
of acute myocardial infarction in patients presenting with persistent ST-segment elevation:
the Task Force on the Management of ST-Segment Elevation Acute Myocardial Infarction of
the European Society of Cardiology. Eur Heart J 2008; 29(23):2909-2945.
44.
Guidelines acute myocardial infarction with ST-elevation. 2003. The Netherlands Society of
Cardiology. http://www.nvvc.nl/UserFiles/Richtlijnen/Richtlijnen.htm
45.
Field MJ, Lohr KN. Clinical Practice Guidelines: Directions for a New Program. Washinghton:
National Academy Press, 1999.
46.
Schiele F, Meneveau N, Seronde MF, Caulfield F, Fouche R, Lassabe G et al. Compliance
with guidelines and 1-year mortality in patients with acute myocardial infarction: a prospective study. Eur Heart J 2005; 26(9):873-880.
47.
Fox KA, Steg PG, Eagle KA, Goodman SG, Anderson FA, Jr., Granger CB et al. Decline in
rates of death and heart failure in acute coronary syndromes, 1999- 2006. JAMA 2007;
297(17):1892-1900.
21
22
48.
Eagle KA, Nallamothu BK, Mehta RH, Granger CB, Steg PG, Van de WF et al. Trends in acute
reperfusion therapy for ST-segment elevation myocardial infarction from 1999 to 2006: we
are getting better but we have got a long way to go. Eur Heart J 2008; 29(5):609-617.
49.
Mandelzweig L, Battler A, Boyko V, Bueno H, Danchin N, Filippatos G et al. The second
Euro Heart Survey on acute coronary syndromes: Characteristics, treatment, and outcome
of patients with ACS in Europe and the Mediterranean Basin in 2004. Eur Heart J 2006;
27(19):2285-2293.
50.
Clinical reality of coronary prevention guidelines: a comparison of EUROASPIRE I and II in
nine countries. EUROASPIRE I and II Group. European Action on Secondary Prevention by
Intervention to Reduce Events. Lancet 2001; 357(9261):995-1001.
51.
Burwen DR, Galusha DH, Lewis JM, Bedinger MR, Radford MJ, Krumholz HM et al. National and state trends in quality of care for acute myocardial infarction between 1994-1995
and 1998-1999: the medicare health care quality improvement program. Arch Intern Med
2003; 163(12):1430-1439.
52.
Peterson ED, Shah BR, Parsons L, Pollack CV, Jr., French WJ, Canto JG et al. Trends in
quality of care for patients with acute myocardial infarction in the National Registry of
Myocardial Infarction from 1990 to 2006. Am Heart J 2008; 156(6):1045-1055.
53.
Yusuf S, Flather M, Pogue J, Hunt D, Varigos J, Piegas L et al. Variations between countries
in invasive cardiac procedures and outcomes in patients with suspected unstable angina or
myocardial infarction without initial ST elevation. OASIS (Organisation to Assess Strategies
for Ischaemic Syndromes) Registry Investigators. Lancet 1998; 352(9127):507-514.
54.
Pearson TA, Laurora I, Chu H, Kafonek S. The lipid treatment assessment project (L-TAP):
a multicenter survey to evaluate the percentages of dyslipidemic patients receiving lipidlowering therapy and achieving low-density lipoprotein cholesterol goals. Arch Intern Med
2000; 160(4):459-467.
55.
Miller NH, Hill M, Kottke T, Ockene IS. The multilevel compliance challenge: recommendations for a call to action. A statement for healthcare professionals. Circulation 1997;
95(4):1085-1090.
56.
Gibbons RJ, Smith S, Antman E. American College of Cardiology/American Heart Association clinical practice guidelines: Part I: where do they come from? Circulation 2003;
107(23):2979-2986.
57.
Tunis SR, Hayward RS, Wilson MC, Rubin HR, Bass EB, Johnston M et al. Internists’ attitudes about clinical practice guidelines. Ann Intern Med 1994; 120(11):956-963.
58.
Robertson D, Keller C. Relationships among health beliefs, self-efficacy, and exercise
adherence in patients with coronary artery disease. Heart Lung 1992; 21(1):56-63.
Chapter 1 : Introduction
59.
Richardson MA, Simons-Morton B, Annegers JF. Effect of perceived barriers on compliance
with antihypertensive medication. Health Educ Q 1993; 20(4):489-503.
60.
Schmid TL, Jeffery RW, Onstad L, Corrigan SA. Demographic, knowledge, physiological,
and behavioral variables as predictors of compliance with dietary treatment goals in hypertension. Addict Behav 1991; 16(3-4):151-160.
61.
Woolf SH. The meaning of translational research and why it matters. JAMA 2008; 299(2):211213.
62.
McNamara RL, Herrin J, Bradley EH, Portnay EL, Curtis JP, Wang Y et al. Hospital improvement in time to reperfusion in patients with acute myocardial infarction, 1999 to 2002.
J Am Coll Cardiol 2006; 47(1):45-51.
63.
Mehta RH, Montoye CK, Faul J, Nagle DJ, Kure J, Raj E et al. Enhancing quality of care
for acute myocardial infarction: shifting the focus of improvement from key indicators to
process of care and tool use: the American College of Cardiology Acute Myocardial Infarction Guidelines Applied in Practice Project in Michigan: Flint and Saginaw Expansion. J Am
Coll Cardiol 2004; 43(12):2166-2173.
64.
Marciniak TA, Ellerbeck EF, Radford MJ, Kresowik TF, Gold JA, Krumholz HM et al. Improving
the quality of care for Medicare patients with acute myocardial infarction: results from the
Cooperative Cardiovascular Project. JAMA 1998; 279(17):1351-1357.
65.
Roe MT, Ohman EM, Pollack CV, Jr., Peterson ED, Brindis RG, Harrington RA et al. Changing the model of care for patients with acute coronary syndromes. Am Heart J 2003;
146(4):605-612.
66.
Califf RM, Peterson ED, Gibbons RM, et al. Integrating quality into the cycle of therapeutic
development. J Am Coll Cardiol 2002;40: 1895–1901.
67.
Eagle KA, Montoye CK, Riba AL, Defranco AC, Parrish R, Skorcz S et al. Guideline-based
standardized care is associated with substantially lower mortality in medicare patients with
acute myocardial infarction: the American College of Cardiology’s Guidelines Applied in
Practice (GAP) Projects in Michigan. J Am Coll Cardiol 2005; 46(7):1242-1248.
68.
Lewis WR, Peterson ED, Cannon CP, Super DM, LaBresh KA, Quealy K et al. An organized
approach to improvement in guideline adherence for acute myocardial infarction: results
with the Get With The Guidelines quality improvement program. Arch Intern Med 2008;
168(16):1813-1819.
69.
Peterson ED, Roe MT, Mulgund J, DeLong ER, Lytle BL, Brindis RG et al. Association
between hospital process performance and outcomes among patients with acute coronary
syndromes. JAMA 2006; 295(16):1912-1920.
70.
Dans PE. Credibility, cookbook medicine, and common sense: guidelines and the college.
Ann Intern Med 1994; 120(11):966-968.
23
24
71.
Jacobs AK, Antman EM, Faxon DP, Gregory T, Solis P. Development of systems of care
for ST-elevation myocardial infarction patients: executive summary. Circulation 2007;
116(2):217-230.
72.
Kalla K, Christ G, Karnik R, Malzer R, Norman G, Prachar H et al. Implementation of guidelines improves the standard of care: the Viennese registry on reperfusion strategies in
ST-elevation myocardial infarction (Vienna STEMI registry). Circulation 2006; 113(20):23982405.
73.
Krumholz HM, Bradley EH, Nallamothu BK, et al. A campaign to improve the timeliness of
primary percutaneous coronary intervention: door-to-balloon: an alliance for quality. J Am
Coll Cardiol Intv 2008; 1:97-104.
74.
Ortolani P, Marzocchi A, Marrozzini C, Palmerini T, Saia F, Serantoni C et al. Clinical impact
of direct referral to primary percutaneous coronary intervention following pre-hospital
diagnosis of ST-elevation myocardial infarction. Eur Heart J 2006; 27(13):1550-1557.
75.
Giannuzzi P, Temporelli PL, Bosimini E, Gentile F, Lucci D, Maggioni AP et al. Heterogeneity
of left ventricular remodeling after acute myocardial infarction: results of the Gruppo Italiano per lo Studio della Sopravvivenza nell’Infarto Miocardico-3 Echo Substudy. Am Heart J
2001; 141(1):131-138.
76.
White HD, Norris RM, Brown MA, Brandt PW, Whitlock RM, Wild CJ. Left ventricular
end-systolic volume as the major determinant of survival after recovery from myocardial
infarction. Circulation 1987; 76(1):44-51.
77.
Enas EA, Yusuf S, Mehta JL. Prevalence of coronary artery disease in Asian Indians. Am J
Cardiol 1992; 70(9):945-949.
78.
Balarajan R. Ethnic differences in mortality from ischaemic heart disease and cerebrovascular disease in England and Wales. BMJ 1991; 302(6776):560-564.
79.
Anand SS, Yusuf S, Vuksan V, Devanesen S, Teo KK, Montague PA et al. Differences in
risk factors, atherosclerosis, and cardiovascular disease between ethnic groups in
Canada: the Study of Health Assessment and Risk in Ethnic groups (SHARE). Lancet 2000;
356(9226):279-284.
80.
Bhatnagar D, Anand IS, Durrington PN, Patel DJ, Wander GS, Mackness MI et al. Coronary
risk factors in people from the Indian subcontinent living in west London and their siblings
in India. Lancet 1995; 345(8947):405-409.
81.
Bhopal R, Unwin N, White M, Yallop J, Walker L, Alberti KG et al. Heterogeneity of coronary
heart disease risk factors in Indian, Pakistani, Bangladeshi, and European origin populations: cross sectional study. BMJ 1999; 319(7204):215-220.
Chapter 2 : Introduction
82.
Cappuccio FP, Cook DG, Atkinson RW, Strazzullo P. Prevalence, detection, and management of cardiovascular risk factors in different ethnic groups in south London. Heart 1997;
78(6):555-563.
83.
McKeigue PM, Ferrie JE, Pierpoint T, Marmot MG. Association of early-onset coronary heart
disease in South Asian men with glucose intolerance and hyperinsulinemia. Circulation
1993; 87(1):152-161.
84.
Wayhs R, Zelinger A, Raggi P. High coronary artery calcium scores pose an extremely
elevated risk for hard events. J Am Coll Cardiol 2002; 39(2):225-230.
85.
Arad Y, Spadaro LA, Goodman K, Newstein D, Guerci AD. Prediction of coronary events
with electron beam computed tomography. J Am Coll Cardiol 2000; 36(4):1253-1260.
86.
Raggi P, Callister TQ, Cooil B, He ZX, Lippolis NJ, Russo DJ et al. Identification of patients at
increased risk of first unheralded acute myocardial infarction by electron-beam computed
tomography. Circulation 2000; 101(8):850-855.
87.
Pohle K, Ropers D, Maffert R, Geitner P, Moshage W, Regenfus M et al. Coronary calcifications in young patients with first, unheralded myocardial infarction: a risk factor matched
analysis by electron beam tomography. Heart 2003; 89(6):625-628.
88.
Shaw LJ, Raggi P, Schisterman E, Berman DS, Callister TQ. Prognostic value of cardiac
risk factors and coronary artery calcium screening for all-cause mortality. Radiology 2003;
228(3):826-833.
25
cHAPTER 2
MISSION!: Optimization of acute
and chronic care for patients with
acute myocardial infarction
Su-San Liem
Barend L. van der Hoeven
Pranobe V. Oemrawsingh
Jeroen J. Bax
Johanna G. van der Bom
Jan Bosch
Eric P. Viergever
Cees van Rees
Iman Padmos
Meredith I. Sedney
Henk J. van Exel
Harriette F. Verwey
Douwe E. Atsma
Enno T. van der Velde
J. Wouter Jukema
Ernst E. van der Wall
Martin J. Schalij
Am Heart J 2007; 153: 14.e1-14.e11
28
ABSTRACT
Background
Guideline implementation programs for patients with acute myocardial infarction
(AMI) enhance adherence to evidence-based medicine (EBM) and improve clinical
outcome. Although undertreatment of patients with AMI is well recognized in both
acute and chronic phases of care, most implementation programs focus on acute
and secondary prevention strategies during the index hospitalization phase only.
Hypothesis
Implementation of an all-phase integrated AMI care program maximizes EBM in daily
practice and improves the care for patients with AMI.
Aim
The objective of this study is to assess the effects of the MISSION! program on
adherence to EBM for patients with AMI by the use of performance indicators.
Design
The MISSION! protocol is based on the most recent American College of Cardiology/American Heart Association and European Society of Cardiology guidelines
for patients with AMI. It contains a prehospital, inhospital, and outpatient clinical
framework for decision making and treatment, up to 1 year after the index event.
MISSION! concentrates on rapid AMI diagnosis and early reperfusion, followed by
active lifestyle improvement and structured medical therapy. Because MISSION!
covers both acute and chronic AMI phase, this design implies an intensive multidisciplinary collaboration among all regional health care providers.
Conclusion
Continuum of care for patients with AMI is warranted to take full advantage of EBM
in day-to-day practice. This manuscript describes the rationale, design, and preliminary results of MISSION!, an all-phase integrated AMI care program.
Chapter 2 : The Leiden MISSION! Project: design and implementation
Coronary heart disease is the leading cause of death in the western world, with an
estimated 3.8 million men and 3.4 million women dying each year worldwide.(1)
Furthermore, the number of chronic heart disease patients in North America and
Western Europe is increasing rapidly because of better survival after acute myocardial infarction (AMI), improved treatment, and the presence of an aging population.
This imposes a significant socioeconomic burden on society.(1)
To optimize care and outcome of patients with AMI, many organizations, for
example, the American College of Cardiology/American Heart Association and the
European Society of Cardiology, have published guidelines for treatment of patients
with AMI.(2,3) These guidelines advocate early and aggressive reperfusion strategies
and recommend the use of a combination of evidence-based medicine (EBM) and
support programs to stimulate a healthier lifestyle. Because most of these guidelines
are based on large-scale clinical trials, clinical benefit has already been established.
Nevertheless, the proven benefit and the endorsement of these guidelines by
the scientific society do not seem sufficient to alter well-established daily clinical
practice. Consequently, a large gap between EBM and daily practice still exists. For
example, despite the fact that there is clear evidence that reperfusion therapy in the
acute phase improves survival of patients with AMI, registries show that only 56%
to 76% of the eligible patients actually receives this form of therapy.(4-6)
Furthermore, a recent publication of the National Registry of Myocardial Infarction
reported that only 4.2% of patients with AMI transferred for primary percutaneous
coronary intervention (PCI) were treated within 90 minutes, which is the benchmark
recommended by the international guidelines.(7) Even worse is the situation after
the acute phase: modifiable risk factors are often not controlled and optimal medication is often not prescribed.(4,8) Consequently, a significant number of patients with
AMI is treated less than optimal.
Schiele et al.(9) demonstrated that the degree of guideline compliance is independently correlated with the 1-year mortality after AMI. Various guideline implementation programs, such as Guidelines Applied in Practice, Get With the Guidelines and
Crusade, have been successful in improving the quality of care.(10-12) Implementation of this kind of programs resulted not only in better adherence to key indicators,
but also in a lower 1-year mortality in patients with AMI.(10,13) Therefore guideline
implementation programs are of paramount importance to optimize AMI care.
Still, most quality improvement programs only focus on acute care and secondary
prevention strategies during the index hospitalization phase, whereas it is known
that the prehospital and chronic phase is also important. Thus, to improve AMI care,
we have to maximize the diffusion of EBM into daily clinical practice across practical
29
30
setting. Therefore, we developed and implemented an all-phase integrated AMI care
program in the region “Hollands-Midden” The Netherlands: MISSION!.
Methods
Study design
MISSION! is designed according to a quasi-experimental approach.(14) The MISSION! protocol is developed based on the most recent American College of Cardiol-
Figure 1.
The MISSION! flowchart presents the clinical framework for decision making and treatment.
The flowchart covers all phases of AMI care: the prehospital and inhospital phase, followed by a
structured outpatient program, up to 1 year after the index infarction.
Chapter 2 : The Leiden MISSION! Project: design and implementation
ogy/American Heart Association and European Society of Cardiology guidelines for
AMI.(2,3) It contains a prehospital, inhospital, and outpatient clinical framework for
decision making and treatment, up to 1 year after the index event (Figure 1). The
MISSION! goals, addressing all aspects of AMI care, are summarized in Figure 2. The
Hollands-Midden region has 750.000 inhabitants and covers an area of approximately
50 x 25 miles. Based on historical data, it is estimated that approximately 1000 pa-
tients
within
the area
suffercovers
from all
an phases
AMI annually.
An intensive
collaboration has
ework for decision making
and
treatment.
The will
flowchart
of AMI care:
the
uctured outpatient program,
up
to
1
year
after
the
index
infarction.
been established among primary care physicians, the regional ambulance service, 3
that only 4.2%
ry percutaneted within
mmended by
s the situation
ors are often
often not
number of
mal.
ree of
rrelated with
deline implepplied in
usade, have
of care.10-12
resulted not
community hospitals (without PCI facilities), 3 cardiac rehabilitation centers, and the
Leiden University Medical Center, Leiden, The Netherlands (serving as the primary
PCI facility), to align AMI care. To provide insight into the rationale of the MISSION!
program, we described the 3 MISSION! care phases and MISSION! care tools.
Figure 2
The MISSION!
goals, addressing all phases of AMI care, are
Figure
2.
The
MISSION! in
goals,
all phases of AMI care, are summarized in this figure.
summarized
this addressing
figure.
Prehospital phase
As advocated by the different guidelines, the cornerstones of optimal prehospital AMI
care are rapid diagnosis, early risk stratification to identify patients who benefit from
early intervention, minimal treatment delay, and aggressive reperfusion strategies.
Prehospital triage by 12-lead electrocardiogram (ECG) in the field, thereby allowing
early AMI diagnosis and rapid access to an intervention or community center, can
reduce the treatment delay significantly.(15) Thereupon, primary PCI or thrombolysis
prevents unnecessary infarct extension and saves lives.(16,17)
All these aspects are incorporated in the prehospital MISSION! protocol: in patients
with chest pain, trained paramedics obtain a high-quality 12-lead ECG at the patient’s
31
32
home (Lifepak 12 Defibrillator/Monitor Series; Medtronic, Redmond, WA). If the ECG
fulfills the positive identification criteria as shown in the prehospital MISSION! stan-
American Heart Journal
dard
Volume 153, Number
1
order form (Figure 3), the ECG is transmitted directly to the computer networkLiem et al 14.e3
of the PCI hospital (Lifenet RS system; Medtronic). Trained coronary care unit (CCU)
nurses analyze the ECG for determining patient’s eligibility for primary PCI, based
Figure 3
Figure 3.
Prehospital triage of patients with AMI is performed according to clinical and ECG criteria shown in
this standard order: to determine the patient’s eligibility for PCI or thrombolysis and to allow rapid
access to the appropriate center for early and aggressive reperfusion therapy.
Prehospital triage of patients with AMI is performed according to the clinical and ECG criteria shown in this standard order: to determine the
patient’s eligibility for PCI or thrombolysis and to allow rapid access to the appropriate center for early and aggressive reperfusion therapy.
only in better adherence to key indicators, but also in a
lower 1-year mortality in patients with AMI.10,13 There-
Therefore, we developed and implemented an all-phase
integrated AMI care program in the region bHollands-
14.e4 Liem et al
American Heart Journal
January 2007
Chapter 2 : The Leiden MISSION! Project: design and implementation
Figure 4
33
Figure
This communication
form 4.
is used by the CCU nurses, when they call the ambulance personnel immediately after receiving the ECG of the primary
PCI candidate. This communication form is used by the CCU nurses, when they call the ambulance personal
immediately after receiving the ECG of the primary PCI candidate.
benefit from early intervention, minimal treatment delay, and
Association and European Society of Cardiology guidelines for
on apredefined
criteria. Ifand
the
patient is eligible
for PCI,
and after
confirmation
aggressive
reperfusion
strategies.
Prehospitalby
triage by 12-lead
AMI.2,3 It contains
prehospital, inhospital,
outpatient
electrocardiogram
in the
clinical framework
for decision
making andparamedic
treatment, up
to
phone,
the ambulance
administers
clopidogrel and(ECG)
aspirin
andfield,
thethereby
patientallowing early
AMI diagnosis and rapid access to an intervention or commu1 year after the index event (Figure 1). The MISSION! goals,
is transferred directly to the PCI center (Figures
3 and 4). Meanwhile, the CCU is
nity center, can reduce the treatment delay significantly.15
addressing all aspects of AMI care, are summarized in Figure 2.
prepared
catheterization
Theprimary
catheterization
laboratory
is unnecessary
The Hollands-Midden
regionand
has the
750 000
inhabitants andstaff is informed.
Thereupon,
PCI or thrombolysis
prevents
16,17
� 25 miles. Based on
covers an area of
approximately
50
infarct
extension
and
saves
lives.
operational within 20 minutes, 24 hours/d, 7 days/wk.
historical data, it is estimated that approximately 1000 patients
All these aspects are incorporated in the prehospital
If suffer
the ECG
does
fulfillAnthe
criteria forMISSION!
primaryprotocol:
PCI, but
the patient
may pain,
be trained parawithin the area will
from an
AMI not
annually.
intensive
in patients
with chest
collaboration has
been
established
among
primary
care
medicsfor
obtain
a high-quality
12-lead ECGisatperthe patient’s home
a candidate for thrombolysis, prehospital triage
inhospital
thrombolysis
physicians, the regional ambulance service, 3 community
(Lifepak 12 Defibrillator/Monitor Series; Medtronic, Redmond,
formed
(Figure
5).
These
patients
also
receive
clopidogrel
and
aspirin.
The
patient
is
hospitals (without PCI facilities), 3 cardiac rehabilitation
WA). If the ECG fulfills the positive identification criteria as
to the
nearest
community
hospital
directly,
which
neverMISSION!
exceedsstandard
10 mi in
centers, and thetransferred
Leiden University
Medical
Center,
Leiden, The
shown
in the
prehospital
order form
Netherlands (serving
as
the
primary
PCI
facility),
to
align
AMI
(Figure
3),
the
ECG
is
transmitted
directly
to
the computer
this region, allowing rapid access.
care. To provide insight into the rationale of the MISSION!
network of the PCI hospital (Lifenet RS system; Medtronic).
program, we described the 3 MISSION! care phases and
Trained coronary care unit (CCU) nurses analyze the ECG for
MISSION! care tools.
determining patient’s eligibility for primary PCI, based on
predefined criteria. If the patient is eligible for PCI, and after
confirmation by phone, the ambulance paramedic administers
Prehospital phase. As advocated by the different guideclopidogrel and aspirin and the patient is transferred directly to
lines, the cornerstones of optimal prehospital AMI care are
the PCI center (Figures 3 and 4). Meanwhile, the CCU is
rapid diagnosis, early risk stratification to identify patients who
American Heart Journal
Volume 153, Number 1
start a mobilization program within 12 hours
(supervised by a physiotherapist) and are trans
down unit within 24 hours. In the presence o
the patient remains at the CCU until clinical s
Resting 2-dimensional echocardiography is p
48 hours after admission, and left ventricular
(LVEF) is calculated to evaluate the need for a
inhibition (ie, LVEF b40% and existence of eith
heart failure or diabetes) (Figure 1).
An important part of the inhospital MISSION
educate and involve the patient actively in ch
lifestyle (smoking cessation, healthy diet, exer
management) and to emphasize the need for d
This secondary prevention program is provide
ciplinary team (physicians, nurses, and a nurs
and is continued in the outpatient cardiac reh
program and during follow-up.
Furthermore, in an era of growing economic
health care, attention is paid to early and safe d
uncomplicated patient. Patients without comp
discharged at day 3. Complications include stro
ischemia, cardiogenic shock, heart failure (Kill
bypass surgery, balloon pumping, emergency c
ization, or need for cardioversion or defibrillatio
risk of uncomplicated patients to develop adve
discharge is low, the strategy of early discharge
Figure 5.
This form is used to determine patient’s eligibility for thrombolysis.
possibility of rapid access to medical help.18 Th
This form is used to determine patient’s eligibility for thrombolysis.
provide a network: first, before discharge, pati
members are informed how to recognize acute
Inhospital
phase
toms and how to take appropriate actions in res
prepared and
the catheterization staff is informed. The
the emergency
number 1-1-2); second, the gen
The
patient
with
AMI
is
directly
admitted
to
the
CCU,
bypassing
the emergency
catheterization laboratory is operational within 20 minutes,
is
informed
concerning
24
hours/d,
7
days/wk.
department, where all PCI patients receive abciximab (dose abciximab, 0.25 mg/the diagnosis and treatm
third, all patients are contacted by phone with
If the ECG does not fulfill the criteria for primary PCI, but the
kg bolus followed by an infusion of 0.125 Ag/kg per minute during
12 hours)
in the
discharge;
and fourth,
all patients are offered a
patient may be a candidate for thrombolysis, prehospital triage
program
absence
of contraindications,
and a PCI
is performed
6). Likewise,
throm-starting within 2 weeks
for inhospital
thrombolysis is performed
(Figure
5). These (Figurerehabilitation
Outpatient
phase.
patients patients
also receive
clopidogrel
and aspirin.
The
patient is on arrival
bolysis
receive
fibrinolytic
therapy
immediately
at the CCU
of theThe patient visits the M
tient clinic 4 times during the first year after AM
transferred to the nearest community hospital directly, which
community hospital. This approach minimizes inhospital delay as much as possible.
the protocol, a number of functional tests are
never exceeds 10 mi in this region, allowing rapid access.
After
reperfusion
therapy,
the
patient
stays
for
24
hours
at thevisits.
CCU.
Electro- further tests/interven
these
If necessary,
Inhospital phase. The patient with AMI is directly admitperformed (Figure
1). The achieved medical an
cardiogram
andbypassing
hemodynamic
monitoring
are performed
continuously.
According
ted to the CCU,
the emergency
department,
where
are monitored, and if required, the physician
all
PCI
patients
receive
abciximab
(dose
abciximab,
0.25
mg/kg
to protocol, all patients receive supplemental oxygen (3 L/min or more, according
practitioner emphasize the principles of secon
bolus followed by an infusion of 0.125 Ag/kg per minute during
to
the oxygen need) for the first 6 hours. If no contraindications
Each exist,
patientβ-blockers,
receives the appointment schedu
12 hours) in the absence of contraindications, and a PCI is
at discharge within
to stress the importance of a
angiotensin-converting
enzyme
(ACE) inhibitors,
statins areyear
administrated
performed (Figure 6). Likewise,
thrombolysis
patientsand
receive
tion of
patient.
fibrinolytic
therapy
immediately
on arrival
at the
CCU of the
24
hours of
admission.
Reasons
for not
prescribing
these drugs
arethe
documented.
After 1 year of follow-up, patients are referr
community hospital. This approach minimizes inhospital delay
Respective drugs are titrated to control heart rate (target heart rate,
60-70
beats/min)
general
practitioner
(asymptomatic patients an
as much as possible.
and
blood
pressure
(target
level,
<140/90
mm
Hg
or
<130/80
mm
Hg
for
patients
N45%), to a regional
cardiologist (patients with
After reperfusion therapy, the patient stays for 24 hours at
LVEF between 35% and 45%), or to the outpat
the CCU.
Electrocardiogram
and hemodynamic
monitoring are
with
diabetes
or chronic renal
disease).
university hospital (LVEF b35%, after implanta
performed continuously. According to protocol, all patients
or in case of serious symptoms).
receive supplemental oxygen (3 L/min or more, according to
MISSION! care tools. We created guideli
the oxygen need) for the first 6 hours. If no contraindicatools for each phase of the MISSION! protocol.
tions exist, h-blockers, angiotensin-converting enzyme (ACE)
were developed to facilitate adherence to the
inhibitors, and statins are administrated within 24 hours of
protocol and function as a check for physician
admission. Reasons for not prescribing these drugs are docupatients to maximize EBM in practice.10 The f
mented. Respective drugs are titrated to control heart rate
MISSION! care tools are customized and imple
(target heart rate, 60-70 beats/min) and blood pressure (target
Figure 5
34
14.e6 Liem et al
American Heart Journal
January 2007
Chapter 2 : The Leiden MISSION! Project: design and implementation
Figure 6
35
6. for nurses to maximize EBM in practice. Adequate feedback can be given by the use of check boxes.
This order function Figure
as a check
This order function as a check for nurse to maximize EBM in practice. Adequate feedback can be
given by the use of check boxes.
free of protocol,
recurrentchart
ischemic symptoms,
of heart
failure, orthe
hemopersonal digital assistant Patients
(PDA) MISSION!
MISSION!symptoms
protocol (Figure
3). Inhospital,
AMI diagnosis is
stickers, patients’ brochures,
posters
with
lifestyle
advices,
and
confirmed
by
the
presence
of
an
unstable
coronary
dynamically compromising arrhythmias start a mobilization program within 12 hours lesion on
a MISSION! Web site for patients and professionals. Physicians
acute angiography and/or the presence of enzymatic myocarand nurses are trained to use these care tools. The use of these
dial damage, defined as an increase in cardiac biomarker(s)
care tools is guaranteed by handing out as standard order sets
above normal level(s). Also, patients who are presenting
for each patient and the use of EPD-VISION inhospital and in
without typical ST-elevation inhospital, but with elevated
the outpatient setting.
cardiac biomarker(s), are diagnosed as patients with AMI.
Based on this ba posterioriQ diagnosis, patients with AMI follow
Patients
the subacute inhospital and outpatient MISSION! program.
36
postreperfusion (supervised by a physiotherapist) and are transferred to a stepdown
unit within 24 hours. In the presence of complications, the patient remains at the
CCU until clinical stable.
Resting 2-dimensional echocardiography is performed within 48 hours after admission, and left ventricular ejection fraction (LVEF) is calculated to evaluate the need
for aldosterone inhibition (ie, LVEF <40% and existence of either symptomatic heart
failure or diabetes) (Figure 1).
An important part of the inhospital MISSION! protocol is to educate and involve
the patient actively in changing the lifestyle (smoking cessation, healthy diet, exercise, and weight management) and to emphasize the need for drug compliance. This
secondary prevention program is provided by a multidisciplinary team (physicians,
nurses, and a nurse practitioner) and is continued in the outpatient cardiac rehabilitation program and during follow-up.
Furthermore, in an era of growing economic pressure in health care, attention
is paid to early and safe discharge of the uncomplicated patient. Patients without
complications are discharged at day 3. Complications include stroke, reinfarction,
ischemia, cardiogenic shock, heart failure (Killip class >1), bypass surgery, balloon
pumping, emergency cardiac catheterization, or need for cardioversion or defibrillation. Although the risk of uncomplicated patients to develop adverse events after
discharge is low, the strategy of early discharge inquires the possibility of rapid access to medical help.(18) Therefore, we provide a network: first, before discharge,
patient and family members are informed how to recognize acute cardiac symptoms
and how to take appropriate actions in response (ie, calling the emergency number
1-1-2); second, the general practitioner is informed concerning the diagnosis and
treatment at discharge; third, all patients are contacted by phone within 1 week after
discharge; and fourth, all patients are offered an outpatient rehabilitation program
starting within 2 weeks after discharge.
Outpatient phase
The patient visits the MISSION! outpatient clinic 4 times during the first year after
AMI. According to the protocol, a number of functional tests are obtained during
these visits. If necessary, further tests/interventions are performed (Figure 1). The
achieved medical and lifestyle goals are monitored, and if required, the physician and
nurse practitioner emphasize the principles of secondary prevention. Each patient
receives the appointment schedule for the first year at discharge to stress the importance of active participation of the patient.
Chapter 2 : The Leiden MISSION! Project: design and implementation
After 1 year of follow-up, patients are referred either to the general practitioner
37
(asymptomatic patients and an LVEF > 45%), to a regional cardiologist (patients with
symptoms or an LVEF between 35% and 45%), or to the outpatient clinic of the
university hospital (LVEF < 35%, after implantation of a device or in case of serious
symptoms).
MISSION! care tools
We created guideline-oriented care tools for each phase of the MISSION! protocol.
American Heart Journal
These care tools were developed to facilitate adherence to the MISSION! protocolLiem et al 14.e7
Volume 153, Number 1
and function as a check for physician, nurses and patients to maximize EBM in
practice.(10) The following MISSION! care tools are customized and implemented:
standard orders with check boxes for each clinical decision-making step and medical
Figure 7
7.
EPD-VISION 6.01Figure
is the electronic
patient file and data management system that is used to store all the information of each patient, using a unique
EPD-VISION
6.01 isthethe
electronic
patientinfile
data management
thatsystem
is used
to store
identification number.
After applying
medical
information
the and
inhospital
and outpatient system
setting, this
produces
automatically a letter
all the information
of each
using a sent
unique
identification
number.
applying the medical
concerning the diagnosis
and treatment,
whichpatient,
is electronically
to the
patient’s primary
careAfter
physician.
information in the inhospital and outpatient setting, this system produces automatically a letter
concerning the diagnosis and treatment, which is electronically sent to the patient’s primary care
physician.
protocol. However, these patients are treated according to the
outpatient MISSION! protocol after discharge.
No specific age threshold for exclusion is defined. Nevertheless, carefulness is needed in elderly patients, given the
relative low number of studies and lack of consensus of optimal
treatment strategies in this group. Elderly people with severe
preexisting comorbidities are excluded.
committee, all patients of the control group gave written
informed consent.
Data collection
Data are systematically collected for each MISSION! patient in
EPD-VISION, using a unique identification number. This database includes patient’s medical history, symptoms on arrival,
38
intervention (Figures 3-6), a guideline-based electronic patient file and data management system (EPD-VISION 6.01, Leiden University Medical Center) (Figure
7), a personal digital assistant (PDA) MISSION! protocol, chart stickers, patients’
brochures, posters with lifestyle advices, and a MISSION! website for patients and
professionals. Physicians and nurses are trained to use these care tools. The use of
these care tools is guaranteed by handing out as standard order sets for each patient
and the use of EPD-VISION inhospital and in the outpatient setting.
Patients
Patients who comply with the predefined criteria mentioned in the prehospital flowchart are included in the prehospital MISSION! protocol (Figure 3). Inhospital, the
AMI diagnosis is confirmed by the presence of an unstable coronary lesion on acute
angiography and/or the presence of enzymatic myocardial damage, defined as an increase in cardiac biomarker(s) above normal level(s). Also, patients who are presenting without typical ST-elevation inhospital, but with elevated cardiac biomarker(s),
are diagnosed as patients with AMI. Based on this “a posteriori” diagnosis, patients
with AMI follow the subacute inhospital and outpatient MISSION! program. Patients
who need mechanical ventilation at the time of index event are excluded for the
prehospital and inhospital MISSION! protocol. However, these patients are treated
according to the outpatient MISSION! protocol after discharge.
No specific age threshold for exclusion is defined. Nevertheless, carefulness is
needed in elderly patients, given the relative low number of studies and lack of
consensus of optimal treatment strategies in this group. Elderly people with severe
preexisting comorbidities are excluded. No informed consent is required, whereas
MISSION! is the standard AMI care regimen in the region Hollands-Midden, The
Netherlands.
Control group
MISSION! data are compared with data of AMI, patients treated with primary PCI
at the Leiden University Medical Center from January 2003 until December 2003.
This historical group was treated just before implementation of MISSION!, thereby
limiting the effect of changes in, for example, drug regimen and/or technical aspects
of PCI procedures. Although a randomized design to compare the effects of MISSION! with routine care would have been better, this was considered unethical.
The patients of the historical group were selected by using the code for “primary
PCI” in EPD-VISION. We retrospectively included only those with an “a posteriori”
AMI diagnoses by using the same criteria as in the MISSION! patients’ group. After
Chapter 2 : The Leiden MISSION! Project: design and implementation
approval by the institutional ethical committee, all patients of the control group gave
written informed consent.
Data collection
Data are systematically collected for each MISSION! patient in EPD-VISION, using
a unique identification number. This database includes patient’s medical history,
symptoms on arrival, electrocardiographic examination, medication at the time of
index, index times (ie, time onset symptoms, time call for medical help, time of first
medical contact, time arrival hospital, needle time, time of first balloon inflation),
inhospital treatment and events, clinical examination at admission and discharge,
discharge treatment, clinical examination at follow-up, follow-up treatment and
events, laboratory measurements, functional tests, achieved lifestyle changes and
the use of prescribed drugs. Similar data were extracted retrospectively from the
hospitals’ patient files in the historical patients with AMI group treated in 2003.
Data analysis
To assess the impact of MISSION!, we developed performance indicators (Table 1).
The MISSION! performance indicators are based on key indicators used in previous
studies, but in an extended version in accordance with the most recent guidelines.
(19) This extended version creates the opportunity to assess the quality of care of
all phases of the MISSION! protocol. For each performance indicator, a target level
of improvement is given. We extracted these target levels from the Euro Heart
Survey and EuroAspire registry.(6,20,21) For performance indicators without prior
predefined target levels, we determined target levels that we considered reasonable
and achievable based on clinical experiences, prior performance data, and prevalence rates of risk factors.(6,20-23) The indicators will be calculated for both levels of
eligibility, in “eligible” patients and “ideal” patients, as reported in previous studies.
(19) Although not the main object, we also measure clinical end points, that is, allcause mortality and reinfarction, at 30 days, at 6 months, and at 1 year. Analyses
are only performed in those patients with an “a posteriori” diagnosis of AMI. The
efficacy of the MISSION! guideline implementation program is assessed in the first
300 patients with AMI. This sample size was calculated based on Dutch performance
and cardiovascular risk factors’ prevalence data and the predefined targets levels
of improvement for each performance indicator.(6,20-23) Sample comparisons are
made using a χ2 test for categorical variables and a paired t test for continuous
variables. All P values will be 2 tailed with an α of .05. All data will be analyzed in
SPSS 12.0.1 (SPSS Inc, Chicago, IL).
39
Time points of <24 hours
measurement
40
Discharge
30 days 6 months 12 months
TARGET
Performance
indicators
Primary PCI
Door-to-Balloon <90 min
X
> 75%
Abciximab before PCI
X
> 90%
Thrombolysis
Door-to-Needle <30 min
X
> 75%
Aspirin
X
X
X
X
X
> 90%
Clopidogrel
X
X
X
X
X
> 90%
Beta-blocker
X
X
X
X
X
> 75%
Angiotensin-Converting enzyme
inhibitor / Angiotensin-II receptor
blocker
X
X
X
X
X
> 75%
Statin
X
X
X
X
X
> 90%
X
X
X
X
> 90%
Total cholesterol < 4.5 mmol/L
(180 mg/dl)
X
X
X
> 90%
LDL cholesterol < 2.5 mmol/L
(100 mg/dl)
X
X
X
> 90%
Complete smoking cessation
X
X
X
> 50%
Moderate physical activity
minimal 3 X 30 min/week
X
X
X
> 75%
BMI < 27 Kg/m2
X
X
X
> 60%
Waist circumference
women < 88 cm, men < 102 cm
X
X
X
> 60%
Participation cardiac rehabilitation
program
X
X
X
> 75%
Bloodpressure < 140/90 mm Hg
Table 1. MISSION! Performance indicators, time points of measurement and targets.
PCI = Percutaneous Coronary Intervention, LDL Cholesterol = Low Density Lipoprotein
Cholesterol, BMI = Body Mass Index
Preliminary results
MISSION! is a multifaceted intervention. Figure 8 shows the timeline of implementation of the MISSION! protocol. The development of the MISSION! protocol started
in October 2003. The first patients were enrolled in February 2004. Until now, 300
Chapter 2 : The Leiden MISSION! Project: design and implementation
patients are included in the inhospital and outpatient MISSION! protocol. The communication between a limited number of ambulances and the PCI center started as
a pilot in September 2004. Since January 2005, all ambulances are participating.
Baseline characteristics are shown in Table 2. The MISSION! patients were more
often diabetics, were less known with hyperlipidemia, and exhibited higher blood
pressures at the time of presentation compared with the historical group. In the
MISSION! group, 56% presented with an anterior infarction compared with 70% in
the historical group ( P = .02). No significant difference in treatment strategy could
be observed (96% vs 95% primary PCI, P = 1) (Table 3). After implementation of the
prehospital MISSION! protocol, more patients were treated within the recommended
90-minute door-to-balloon time (80% vs 63%, P = .01), and a significant reduction of
door-to-balloon time of 16 minutes was observed (67 ± 38 minutes [n = 106] vs 83
Baseline characteristics
Historical group 2003
n=100
MISSION!
n=300
P-value
Demographics
Male
77 (77%)
233 (78%)
1
Age (years)
58.8 ± 11.5 (33-81)
60.1 ± 11.8 (28-84)
0.3
Non-white
8 (8%)
25 (8%)
0.9
5 (5%)
37 (12%)
0.06
Medical history
Diabetes
Hyperlipidemia
30 (30%)
56 (19%)
0.02
Hypertension
32 (32%)
86 (29%)
0.6
Current smokers
53 (53%)
148 (49%)
0.6
Ischaemic heart disease
13 (13%)
22 (7%)
0.1
Family history
43 (43%)
129 (43%)
0.9
Systolic
125 ± 3 (60-190)
136 ± 26 (60-233)
<0.001
Diastolic
74 ± 2 (20-125)
79 ± 17 (30-120)
0.01
I
93 (93%)
270 (90%)
0.5
II
4 (4%)
17 (5.7%)
0.7
III or IV
3 (3%)
13 (4.3%)
0.8
27.2 ± 3 (18-38)
26.5 ± 4 (18-46)
0.3
70 (70%)
167 (56%)
0.02
Clinical
Blood pressure (mm Hg)
Killip class at admission
Body Mass Index (kg/m2)
Anterior myocardial infarction
Table 2.
Baseline characteristics of the historical group and the MISSION! patients
41
Complete smoking cessation
Moderate physical activity minimal 3 � 30 min/wk
BMI b27 kg/m2
Waist circumference: women b88 cm, men b102 cm
Participation cardiac rehabilitation program
M
M
M
M
M
M
M
M
M
M
M
M
M
M
M
N50
N75
N60
N60
N75
LDL-C, low-density lipoprotein cholesterol; BMI, body mass index.
Figure 8
42
MISSION!
Figure
8. is a multifaceted intervention. The timeline of implementation of the MISSION! protocol is given.
MISSION! is a multifaceted intervention. The timeline of implementation of the MISSION! protocol
is given.
The efficacy of the MISSION! guideline implementation
opportunity to assess the quality of care of all phases of the
program is assessed in the first 300 patients with AMI. This
MISSION! protocol. For each performance indicator, a target
± 33 minutes, P < .01). The MISSION! patients received more frequently β-blocker
sample size was calculated based on Dutch performance and
level of improvement is given. We extracted these target
vs 64%,
< .001)
and ACE-inhibitor
therapy
(85%risk
vs factors’
34%, prevalence
P < .001) data
within
cardiovascular
and the predefined
levels from the (83%
Euro Heart
SurveyPand
EuroAspire
regislevels
of improvement
for
each
performance indicatry.6,20,21 For performance
without prior
24 hours indicators
after admission,
and predefined
more patientstargets
were
discharged
with
an
ACE
inhibitor
tor.6,20-23 Sample comparisons are made using a v 2 test for
target levels, we determined target levels that we considered
(96%
vs
73%,
P
<
.01).
MISSION!
patients
were
discharged
compared
with
categorical
variables earlier
and a paired
t test for
continuous
reasonable and achievable based on clinical experiences, prior
variables.
All P values will be 2 tailed with an a of .05. All data
performance data,
prevalence
rates(3.9
of risk
factors.
theand
historical
group
± 2.8
vs 76,20-23
.3 ± 8.2 days,
P < .001).
will be analyzed in SPSS 12.0.1 (SPSS Inc, Chicago, IL).
The indicators will be calculated for both levels of eligibility,
in beligibleQ patients and bidealQ patients, as reported in
previous studies.19 Although not the main object, we also
Preliminary results
measure clinicalDiscussion
end points, that is, all-cause mortality and
MISSION! is a multifaceted intervention. Figure 8
reinfarction, at 30 days, at 6 months, and at 1 year. Analyses
shows the timeline of implementation of the MISSION!
are only performed in those patients with an ba posteriorib
diagnosis of AMI.
protocol.
development
of the MISSION!
protocol
The treatment of patients with AMI has expanded
andThe
improved
tremendously
over
the last 2 decades. However, widespread dissemination of EBM in daily practice is
still lacking, and a significant number of patients with AMI is undertreated.(4-8) Prior
AMI guideline implementation programs succeeded to increase the uptake of guidelines in daily care.(10,11,13) However, these programs mainly focus on inhospital
AMI care, whereas it is known that the prehospital and chronic care for patients with
AMI is equally important. Therefore, we developed and implemented an all-phase
integrated AMI care program, MISSION!. The aim of MISSION! is to maximize the
use of EBM across practical settings and thereby to further improve the care for
patients with AMI in real life.
MISSION! is a multifaceted intervention. Lessons learned from prior studies are
incorporated in the MISSION! program.(24) Changing routine care into a systematic
process of care is essential to improve AMI care in real life.(24) Furthermore, imple-
Chapter 2 : The Leiden MISSION! Project: design and implementation
Primary PCI
Historical group 2003
n=100
MISSION!
n=300
P-value
96 (96%)
286 (95%)
1
Door-to-Balloon time
< 90 min (%)
63
80*
0.01
Abxicimab before PCI (%)
90
91*
0.9
Aspirin
97
95
0.6
Clopidogrel
98
97
0.9
Statin
98
96
0.5
Beta-blocker
64
83
<0.001
ACE-inhibitor
34
85
<0.001
Aspirin
96
98
0.5
Clopidogrel
100
98
0.3
Statin
98
100
0.3
Beta-blocker
94
90
0.3
ACE-inhibitor
73
96
<0.001
89
94
0.1
Length of stay (days)
7.3 ± 8.2 (1-44)
3.9 ± 2.8 (1-18)
<0.001
In-hospital mortality
5 (5%)
7 (2.3%)
0.3
Medical therapy <24 h (%)
Medical therapy at discharge (%)
Blood pressure < 140/90 mm Hg
at discharge (%)
Table 3. In-hospital preformance and outcome
* % out of n=106 patients, since the pre-hospital MISSION! protocol started January 2005
mentation of guideline-orientated care tools makes this consistent and structural
approach of patients with AMI possible and thereby enhances adherence of EBM.
(24)
During the development and implementation of MISSION!, we encountered the
following problems. First, financial resources are mandatory to build and implement
such a comprehensive project as MISSION!. Therefore, we developed a clear statement of the intended improvements. We obtained financial support from the Dutch
Heart Foundation and The Netherlands Society of Cardiology. Second, because MISSION! covers all phases of AMI care, an intensive collaboration among all regional
healthcare providers had to be established. Before MISSION!, these settings operated as distinct independent institutions with their own policies, (financial) interests,
and individual guidelines resulting in a dispersion of AMI care. The university center
served as a key initiator. We organized meetings for all healthcare providers concern-
43
44
ing AMI care in our region. In addition, we enraptured leaders in each practical setting
to create a MISSION! working group. These working groups are responsible for the
implementation of MISSION! and monitoring of the care processes. Furthermore,
these groups provide educational activities at a regular basis. Short- and long-term
feedback is given and received to optimize the care process. When necessary, the
protocol is adjusted and updated according to new evidence, taking into account that
quality improvement is a continuous process.(25) It takes a lot of effort to establish
such a project. However, taking responsibility and persuasively underscoring the
need for alignment of regional AMI care are the way to accomplish patient-centered
care and improve AMI care in real life.
The preliminary data of the first 300 MISSION! patients are promising. Baseline
characteristics among the historical and MISSION! group differ (Table 2). However,
prior studies have shown that patients with AMI who actually receive reperfusion
therapy in routine care are less likely diabetic, are more known with hyperlypidemia
and are more often present with an anterior AMI.(5) A shift in these variables is observed between the 2 groups. Hence, it can be concluded that MISSION! succeeded
in changing the care system into a system in which more eligible patients benefit
from EBM in real life than in the past. Implementation of the prehospital MISSION!
protocol resulted in a significant reduction of door-to-balloon time compared with
the historical group and an increase of patients treated within the recommended 90
minutes. Although the historical performance in the prescription of evidence-based
drugs was good, MISSION! improved the performance in early use of β-blockers and
ACE inhibitors, and discharge ACE inhibitors. It is known that prescription of medication before discharge increases the compliance during follow-up.(13) Moreover,
Mukherjee et al(26) demonstrated marked survival advantage in patients with acute
coronary syndromes, if a combination of evidence-based drugs were prescribed.
Finally, MISSION! decreased the length of inhospital stay in low-risk patients with
AMI. In an era of increasing economic pressures in health care, the efficient use of
medical resources is mandatory.
Conclusions
MISSION! adds a new dimension in the field of AMI quality improvement initiatives,
by integrating all AMI care phases in 1 structured patient-centered care program.
The aim of MISSION! is to improve AMI care by implementing the most recent AMI
guidelines across practical settings in real life. The preliminary results of MISSION!
Chapter 2 : The Leiden MISSION! Project: design and implementation
are promising. If this integrated approach of AMI care proves to work, MISSION!
may function as a guideline implementation program beyond our region.
45
46
References
1.
Sans S, Kesteloot H, Kromhout D. The burden of cardiovascular diseases mortality in
Europe. Task Force of the European Society of Cardiology on Cardiovascular Mortality and
Morbidity Statistics in Europe. Eur Heart J. 1997;18:1231-1248.
2.
Antman EM, Anbe DT, Armstrong PW et al. ACC/AHA guidelines for the management of
patients with ST-elevation myocardial infarction: a report of the American College of Cardiology/American Heart Association Task Force on Practice Guidelines (Committee to Revise
the 1999 Guidelines for the Management of Patients with Acute Myocardial Infarction).
Circulation. 2004;110:e82-292.
3.
Van de Werf, Ardissino D, Betriu A et al. Management of acute myocardial infarction in patients presenting with ST-segment elevation. The Task Force on the Management of Acute
Myocardial Infarction of the European Society of Cardiology. Eur Heart J. 2003;24:28-66.
4.
Burwen DR, Galusha DH, Lewis JM et al. National and state trends in quality of care for
acute myocardial infarction between 1994-1995 and 1998-1999: the medicare health care
quality improvement program. Arch Intern Med. 2003;163:1430-1439.
5.
Barron HV, Bowlby LJ, Breen T et al. Use of reperfusion therapy for acute myocardial infarction in the United States: data from the National Registry of Myocardial Infarction 2.
Circulation. 1998;97:1150-1156.
6.
Hasdai D, Behar S, Wallentin L et al. A prospective survey of the characteristics, treatments
and outcomes of patients with acute coronary syndromes in Europe and the Mediterranean
basin; the Euro Heart Survey of Acute Coronary Syndromes (Euro Heart Survey ACS). Eur
Heart J. 2002;23:1190-1201.
7.
Nallamothu BK, Bates ER, Herrin J et al. Times to treatment in transfer patients undergoing primary percutaneous coronary intervention in the United States: National Registry of
Myocardial Infarction (NRMI)-3/4 analysis. Circulation. 2005;111:761-767.
8.
Clinical reality of coronary prevention guidelines: a comparison of EUROASPIRE I and II in
nine countries. EUROASPIRE I and II Group. European Action on Secondary Prevention by
Intervention to Reduce Events. Lancet. 2001;357:995-1001.
9.
Schiele F, Meneveau N, Seronde MF et al. Compliance with guidelines and 1-year mortality
in patients with acute myocardial infarction: a prospective study. Eur Heart J. 2005;26:873880.
10.
Eagle KA, Montoye CK, Riba AL et al. Guideline-based standardized care is associated
with substantially lower mortality in medicare patients with acute myocardial infarction: the
American College of Cardiology’s Guidelines Applied in Practice (GAP) Projects in Michigan.
J Am Coll Cardiol. 2005;46:1242-1248.
Chapter 2 : The Leiden MISSION! Project: design and implementation
11.
LaBresh KA, Ellrodt AG, Gliklich R et al. Get with the guidelines for cardiovascular secondary prevention: pilot results. Arch Intern Med. 2004;164:203-209.
12.
Ohman EM, Roe MT, Smith SC, Jr. et al. Care of non-ST-segment elevation patients: insights
from the CRUSADE national quality improvement initiative. Am Heart J. 2004;148:S34S39.
13.
Fonarow GC, Gawlinski A, Moughrabi S et al. Improved treatment of coronary heart disease
by implementation of a Cardiac Hospitalization Atherosclerosis Management Program
(CHAMP). Am J Cardiol. 2001;87:819-822.
14.
Krumholz HM, Peterson ED, Ayanian JZ et al. Report of the National Heart, Lung, and
Blood Institute working group on outcomes research in cardiovascular disease. Circulation.
2005;111:3158-3166.
15.
Canto JG, Rogers WJ, Bowlby LJ et al. The prehospital electrocardiogram in acute myocardial infarction: is its full potential being realized? National Registry of Myocardial Infarction
2 Investigators. J Am Coll Cardiol. 1997;29:498-505.
16.
Boersma E, Maas AC, Deckers JW et al. Early thrombolytic treatment in acute myocardial
infarction: reappraisal of the golden hour. Lancet. 1996;348:771-775.
17.
De Luca G, Suryapranata H, Ottervanger JP et al. Time delay to treatment and mortality in
primary angioplasty for acute myocardial infarction: every minute of delay counts. Circulation. 2004;109:1223-1225.
18.
Kaul P, Newby LK, Fu Y et al. International differences in evolution of early discharge after
acute myocardial infarction. Lancet. 2004;363:511-517.
19.
Marciniak TA, Ellerbeck EF, Radford MJ et al. Improving the quality of care for Medicare
patients with acute myocardial infarction: results from the Cooperative Cardiovascular
Project. JAMA. 1998;279:1351-1357.
20.
Lifestyle and risk factor management and use of drug therapies in coronary patients from
15 countries; principal results from EUROASPIRE II Euro Heart Survey Programme. Eur
Heart J. 2001;22:554-572.
21.
Simoons ML, Boer de M.J, Boersma E et al. Continuously improving the practice of cardiology. Netherlands Heart Journal. 2004;12:110-116.
22.
Jager-Geurts MH, Peters RJ, van Dis SJ et al. Cardiovascular diseases in The Netherlands, 2006. Nederlandse Hartstichting, The Hague, The Netherlands, 2006.
23.
Scholte op RW, de Swart E, De Bacquer D et al. Smoking behaviour in European patients
with established coronary heart disease. Eur Heart J. 2006;27:35-41.
47
48
24.
Montoye CK, Eagle KA. An organizational framework for the AMI ACC-GAP Project. J Am
Coll Cardiol. 2005;46:1-29.
25.
Roe MT, Ohman EM, Pollack CV, Jr. et al. Changing the model of care for patients with
acute coronary syndromes. Am Heart J. 2003;146:605-612.
26.
Mukherjee D, Fang J, Chetcuti S et al. Impact of combination evidence-based medical
therapy on mortality in patients with acute coronary syndromes. Circulation. 2004;109:745749.
Chapter 2 : Letter to the editor
Letter to the editor
Dear Sir, I read with interest the article on the MISSION! program on adherence
to guidelines and evidence-based medicine in patients with an ST-elevation acute
myocardial infarction by Liem et al.(1) The authors must be congratulated with this
initiative aiming at improving daily clinical practice. The authors have developed a nice
clinical framework for decision making in the acute phase. They provide criteria for
selecting primary percutaneous coronary intervention versus thrombolytic therapy.
However, they do not mention prehospital thrombolysis as a reperfusion option. If
the decision to give thrombolytic therapy is taken, it is to the benefit of the patient
that this treatment is started already in the ambulance even if the distance to the
hospital is relatively short. Traffic jams and overwork at the emergency department
of the hospital may significantly delay the start of thrombolytic treatment. Randomized trials have shown a 17% reduction in inhospital mortality if fibrinolytic therapy
is started in the ambulance compared with inhospital administration.(2) Also, the
recent ASSENT-3 PLUS trial showed an almost 50-minute earlier onset of treatment
with ambulance administration of fibrinolytic therapy.(3) Figure 5 of the article indirectly suggests that age of >80 years is an exclusion criterion for fibrinolytic therapy.
There are no data in the literature indicating that thrombolytic therapy is ineffective
or particularly harmful for age of >80 years. On the contrary, the SENIOR PAMI trial
results suggest that thrombolytic therapy may even be slightly better than primary
percutaneous coronary intervention in the very elderly (>80 years).(4) I would suggest
that the authors incorporate these remarks in their otherwise excellent protocol.
Frans van de Werf, MD, PhD
Department of Cardiology
University Hospital Gasthuisberg
Leuven, Belgium
Am Heart J 2007;153:e33
49
50
References
1.
Liem SS, van der Hoeven BL, Oemrawsingh PV, et al. MISSION!: optimization of acute and
chronic care for patients with acute myocardial infarction. Am Heart J 2007;153:14.e1-14.
e11.
2.
Morrison LJ, Verbeek PR, McDonald AC, et al. Mortality and prehospital thrombolysis for
acute myocardial infarction: a meta-analysis? JAMA 2000;283:2686 - 92.
3.
Wallentin L, Goldstein P, Armstrong PW, et al. Efficacy and safety of tenecteplase in
combination with the low-molecular-weight heparin enoxaparin or unfractionated heparin in
the prehospital setting: the Assessment of the Safety and Efficacy of a New Thrombolytic
Regimen (ASSENT)–3 PLUS randomized trial in acute myocardial infarction. Circulation
2003;108:135 -442 [electronic publication 2003 Jul 7].
4.
Grines C. SENIOR PAMI, a prospective randomized trial of primary angioplasty and thrombolytic therapy in elderly patients with acute myocardial infarction. Results presented at the
TCT 2005 meeting, Washington DC. Available at www.theheart.org.
Chapter 2 : Letter to the editor
Response to the letter to the Editor by van de Werf
Dear Sir, It is with interest that we read the “Letter to the Editor” and the stimulating
comments by van de Werf referring to our recently published article, which presented
the study design of MISSION!, an all-phases integrated guideline implementation program for patients with an acute myocardial infarction in the region of Holland-Midden,
The Netherlands.(1) Van de Werf critically remarked that we use inhospital fibrinolysis
instead of prehospital fibrinolysis despite the benefit of earlier administration and the
evidence of reduction of inhospital mortality when choosing the latter.(2,3) Indeed,
we fully agree that prehospital fibrinolysis is preferred to inhospital fibrinolysis, looking at the available outcome data. However, we have chosen inhospital fibrinolysis
for several reasons: 1) implementation of such a comprehensive protocol requires
a lot of coordination and efforts; all regional health care providers across practical
settings (ie, primary physicians, ambulance personnel, cardiologists, and coronary
care unit nurses) are involved and collaborate closely to establish this program.
Therefore, we tried to keep our MISSION! prehospital protocol as simple, manageable, and workable as possible. 2) In line with this, timely and efficient administration
of prehospital fibrinolysis demands experience and practice. Although, most of our
patients (>90%) are treated with primary percutaneous coronary intervention (PCI)
according to our predefined criteria.(1) Hence, we primarily focused on training the
ambulance personnel to perform high-quality 12-lead electrocardiogram in the field
and what to do afterward to get rapid access to the appropriate center. 3) Finally, as
van de Werf mentioned, benefit of prehospital administration of fibrinolysis would
probably remain even if distances are relatively short as is in our region, for example,
because of overwork at the emergency department. We tried to avoid the last by
paging the coronary care unit of the nearest community hospital already en route to
the hospital and directly transferring the fibrinolysis candidate to the coronary care
unit, thereby bypassing the emergency department.
With regard to the exclusion of patients >80 years for fibrinolysis, consensus
of optimal reperfusion therapy in this subpopulation, a population which exhibits
high risk for mortality and severe bleeding complications, is still lacking.(3-6) This is
caused by the systematic exclusion of these patients from large clinical trials, and
if they are included they are often underrepresented.(4) In the beginning of MISSION!, we used >80 years as an exclusion criterion for primary PCI. However, we are
confronted with elderly patients who are vital and do not have any contraindications
for PCI. Therefore, >80 years per se is not an exclusion criterion anymore. With
regard to fibrinolysis use, the threshold of >80 years is defined to be rather too
51
52
cautious than too aggressive. However, if an eligible patient >80 years is presented
at the nearest emergency department by the ambulance, fibrinolysis indeed remains
an option. MISSION! is not written and designed “as if”, but demands individual
assessment and tailoring, specially in a subpopulation in whom best practice is
still a subject of debate. Moreover, as quality improvement is an ongoing process,
clearly targeted large-scale clinical trials are needed to evaluate the relative merits of
available reperfusion strategies in the elderly with ST-segment elevation myocardial
infarction.(4,5,7)
Su San Liem
J. Wouter Jukema
Martin J. Schalij
Department of Cardiology
Leiden University Medical Center
Leiden, The Netherlands
Am Heart J 2007;153:e35.
Chapter 2 : Response to the letter to the Editor by van de Werf
References
1.
Liem SS, van der Hoeven BL, Oemrawsingh PV, et al. MISSION!: optimization of acute and
chronic care for patients with acute myocardial infarction. Am Heart J 2007;153:14.e1-14.
e11.
2.
Morrison LJ, Verbeek PR, McDonald AC, et al. Mortality and prehospital thrombolysis for
acute myocardial infarction: a metaanalysis. JAMA 2000;283:2686 - 92.
3.
Wallentin L, Goldstein P, Armstrong PW, et al. Efficacy and safety of tenecteplase in
combination with the low-molecular-weight heparin enoxaparin or unfractionated heparin in
the prehospital setting: the Assessment of the Safety and Efficacy of a New Thrombolytic
Regimen (ASSENT)–3 PLUS randomized trial in acute myocardial infarction. Circulation
2003;108:135 - 42.
4.
Mehta RH, Granger CB, Alexander KP, et al. Reperfusion strategies for acute myocardial
infarction in the elderly: benefits and risks. J Am Coll Cardiol 2005;45:471 -8.
5.
Sinnaeve PR, Huang Y, Bogaerts K, et al. Age, outcomes, and treatment effects of fibrinolytic
and antithrombotic combinations: findings from Assessment of the Safety and Efficacy of
a New Thrombolytic (ASSENT)–3 and ASSENT-3 PLUS. Am Heart J 2006;152:684.e1 -9.
6.
Ahmed S, Antman EM, Murphy SA, et al. Poor outcomes after fibrinolytic therapy for STsegment elevation myocardial infarction: impact of age (a meta-analysis of a decade of
trials). J Thromb Thrombolysis 2006;21:119 - 29.
7.
Roe MT, Ohman EM, Pollack CV Jr3, et al. Changing the model of care for patients with
acute coronary syndromes. Am Heart J 2003;146:605 -12.
53
Chapter 3
Optimization of acute and long-term
care for acute myocardial infarction
patients: The Leiden MISSION! project
Su San Liem
Barend L. van der Hoeven
Sjoerd A. Mollema
Jan Bosch
Johanna G. van der Bom
Eric P. Viergever
Cees van Rees
Marianne Bootsma
Enno T. van der Velde
J. Wouter Jukema
Ernst E. van der Wall
Martin J. Schalij
Submitted for publication
56
Abstract
Aim
We developed an all-phases comprising regional AMI guideline implementation program (MISSION!) to optimize the use of evidence-based medicine (EBM) in clinical
practice.
Background
Under treatment of acute myocardial infarction (AMI) patients occurs in both the
acute and the chronic phase, however most quality improvement programs focus on
the index hospitalization only.
Methods
MISSION! contains a pre-hospital, in-hospital, and outpatient clinical framework for
decision making and treatment of AMI patients. Using a before (n=84) and after
implementation cohort of AMI patients (n=518) the impact of MISSION! was assessed using predefined performance indicators.
Results
The use of primary PCI increased (94% historical vs. 99% MISSION!; p<0.001); prehospital triage reduced median door-to-balloon time (81 min. vs. 55 min.; p<0.001),
and more patients were treated within the guideline-recommended 90-minutes doorto-balloon time (66% vs. 79%; p=0.04). More patients received beta-blockers (64%
vs. 84%; p<0.001) and ACE-inhibitors (40% vs. 87%; p<0.001) within 24 hours after
admission, and ACE-inhibitors at discharge (70% vs. 98%; p<0.001). At one-year
follow-up more patients used clopidogrel (72% vs. 94%; p<0.001), beta-blockers
(81% vs. 90%; p=0.046), and ACE-inhibitors (66% vs. 98%; p<0.001). Target total
cholesterol levels <4.5 mmol/L were achieved more frequently in MISSION! (58%
vs. 80%; p<0.001).
Conclusion
An all-phases integrated AMI care program is a strong tool to enhance adherence to
evidence based medicine and is likely to improve clinical outcome in AMI patients.
Chapter 3 : The Leiden MISSION! Project: results
Introduction
Guidelines for the treatment of patients with acute myocardial infarction (AMI) have
been developed to increase knowledge and to promote the use of best practice in
daily AMI care.(1-3) However, widespread dissemination in clinical practice is still
lacking, resulting in under treatment of significant numbers of AMI patients; both in
the acute and chronic phase.(4-7)
Prior guideline implementation programs demonstrated that a more systematic
approach of AMI care delivery increases adherence to evidence-based medicine
(EBM).(8-11) Even more important, enhanced adherence results in improved outcome of AMI patients.(8,10,11) However, these programs mainly focused on acute
cardiac care and secondary prevention strategies during the index hospitalization
only. Moreover, initiatives to foster early reperfusion therapy by pre-hospital triage
also seem to be effective in limiting myocardial damage and improving outcome.
(12,13) Although, addressing systematically one phase of AMI care may improve
outcome significantly, it can be expected that further improvement of care and
outcome can be achieved by maximizing the use of evidence-based therapy during
all phases of AMI care. Therefore, a regional guideline implementation AMI care
program was developed to improve not only acute care, but long-term care also.
(14) MISSION! contains a pre-hospital, in-hospital, and outpatient clinical framework
for decision making and treatment, up to one year after the index event.(14) The
design of the MISSION! protocol is unique in its kind and implicates an intensive
collaboration among all healthcare providers of the Netherlands “Hollands-Midden”
region.(14) The results of the first 518 patients enrolled in the MISSION! program
are reported.
Methods
Design
The MISSION! study design has been described previously.(14) In brief, MISSION!
is designed according to a quasi-experimental approach. The MISSION! protocol is
based on the current American College of Cardiology/American Heart Association
and European Society of Cardiology guidelines for AMI.(1-3) It contains a pre-hospital,
in-hospital, and outpatient framework for decision-making and treatment, up to one
year following the index event (Figure 1). To accomplish this, an intensive collaboration was established between primary care physicians, regional ambulance service,
57
58
Figure 1.
The MISSION! flowchart, see text for further explanation.
four community hospitals (without percutaneous coronary intervention (PCI) facilities), three rehabilitation centers and the Leiden University Medical Center (serving
as regional PCI facility).
The pre-hospital protocol focuses on reduction of treatment delay by pre-hospital
triage; a twelve-lead ECG is obtained at the patient’s home by trained ambulance
personnel. Patients eligible for PCI (according to predefined criteria as shown in Figure 1) are transported directly to the PCI center, and the catheterization laboratory is
activated while the patient is transported to the hospital. Candidates for thrombolytic
therapy are transported to the Coronary Care Unit (CCU) of the nearest community
hospital. If no contraindications exist, aspirin 300 mg and clopidogrel 600 mg are
Chapter 3 : The Leiden MISSION! Project: results
administrated in the ambulance. PCI patients receive abciximab prior to PCI (0,25
mg/kg bolus followed by an infusion of 0,125 microgram/kg/min during 12 hours).
The in-hospital protocol focuses on early reperfusion therapy, and administration of evidence-based drugs (i.e. beta-blocker, ACE-inhibitor, and statin) within 24
hours of admission (Figure 1). Furthermore, patients are educated and involved in
the principles of secondary prevention by a multidisciplinary team (i.e. the need
for smoking cessation, healthy diet, exercise, weight control and drug compliance).
Patients without complications are discharged within three days.
In the outpatient program, patients visit the outpatient clinic four times during the
first year after index hospitalization. During follow-up a number of tests are obtained,
medical and lifestyle targets are monitored and therapy is adjusted if necessary
(Figure 1). To facilitate adherence, guideline-oriented care-tools were created for
each phase of the MISSION! protocol.(14)
Both in-hospital and outpatient programs are located at the university hospital.
After one year follow-up, patients are referred either to their general practitioner
(asymptomatic patients with a left ventricular ejection fraction (LVEF) >45%), to a
regional cardiologist (patients with symptoms or a LVEF between 35% and 45%), or
to the outpatient clinic of the university hospital (LVEF <35%, after implantation of a
device or in case of serious remaining symptoms).
Patients
Consecutive patients, fulfilling the predefined criteria mentioned in the pre-hospital
phase of the flowchart, were included in the pre-hospital MISSION! protocol (Figure
1). In-hospital, AMI diagnosis was confirmed by the presence of an unstable coronary
lesion on angiography and/or the presence of enzymatic myocardial damage, defined
as an increase in cardiac biomarker(s) above normal level(s).(15) Also patients, presenting without typical ST-elevation in-hospital, but with ischemic symptoms and
elevated cardiac biomarker(s), were diagnosed as AMI patients and included in the
program.(15) Patients on mechanical ventilation at the time of index event admission
were excluded for the pre-hospital and in-hospital MISSION! protocol. However,
these patients were treated according to the outpatient MISSION! protocol after
discharge. No age threshold for exclusion was defined.
For the current study, MISSION! data were compared with data of a historical
reference group, i.e. a 50% random sample of patients with an acute AMI treated
at the Leiden University Medical Center just before implementation of MISSION!
in 2003. These patients were included by using the same criteria as in the MISSION! patients’ group. Analyses were only performed in those patients with an “a
59
60
posteriori“ diagnosis of AMI. Hence, of 140 historical patients studied 84 patients
were included in the current study after written informed consent was obtained (approved by the institutional ethical committee). Data of each MISSION! patient was
collected prospectively in an electronic patient file and data management system
(EPD-VISION 6.01, Leiden University Medical Center).(14)
Measurement of the quality of care and statistical methods
The change of quality of pre-hospital, in-hospital and outpatient care induced by the
MISSION! program was assessed by using predefined performance indicators in
both the historical and the MISSION! population.(14) To examine the impact of the
pre-hospital triage protocol, MISSION! patients were divided in subgroups according
to the timeline of implementation of the pre-hospital protocol (Figure 2). Moreover,
to reveal the impact of pre-hospital triage, we sub-analyzed the data of all MISSION!
patients treated since January 2005 (after implementation of the pre-hospital MISSION! protocol); patients treated according to the protocol (i.e. after pre-hospital
triage directly referred to the CCU of the PCI center) and patients who were not
treated according to pre-hospital protocol (i.e. first (self-) presentation at one of the
(regional) emergency rooms and then referred for primary PCI). Door-to-balloon time
indicates the time window between first presentation at CCU or (regional) emergency room and first balloon deployment. For assessment of the performance in the
outpatient phase, we used the data of the historical group per indicator recorded/
obtained within 18 months after the index event and closest to one year follow-up.
These data were compared with the one-year follow-up of the MISSION! group.
In-hospital &
outpatient
n=111
Pre-hospital
n=63
n=23 (37%)
n=344
N=518
n=232 (67%)
Okt ‘03
Feb ‘04
Sep ‘04
Jan ‘05
Development
MISSION!
protocol &
care-tools
Start inclusion patients
In-hospital & outpatient
protocol
Pilot
pre-hospital
protocol
Pre-hospital protocol
fully operational
Apr ‘06
Figure 2.
Timeline of implementation of the MISSION! protocol and inclusion of the MISSION! patients.
Figure 2
Chapter 3 : The Leiden MISSION! Project: results
Clinical endpoints were all cause mortality and re-infarction, at 30 days, six months
and one year. Re-infarction was defined as recurrent ischemic symptoms or electrocardiographic changes, accompanied by recurrent elevation of cardiac enzyme
levels.
Continuous data are presented as medians with interquartile ranges. Time values
were analyzed using a Man-Whitney test. Other continues data were analyzed by
2-sample t-tests. Categorical data are summarized as proportions and were analyzed
using a Fisher exact test or Chi-square test with Yates’ correction, as appropriate. To
assess the benefit of MISSION! in patient outcome, separate multivariate logistic regression models were used to compare mortality and re-infarction between patients
treated according to the MISSION! protocol and the patients in the historical group.
Based on univariate analyses and data from the literature following confounders were
included: age, sex, index smoking status, diabetes, prior infarction, prior PCI, Killip
class ≥2, anterior infarction, and systolic blood pressure. All tests were two-sided, a
p-value <0.05 was considered statistically significant. All analyses were performed
using SPSS v 12.0 (SPSS Inc., Chicago, Il, USA).
Results
The timeline of implementation of MISSION! and inclusion of patients are shown
in Figure 2. A total of 518 consecutive patients were included since the start of the
in-hospital and outpatient MISSION! program in 2004. Since 2005 the MISSION!
pre-hospital triage protocol became fully operational, and since then 344 patients
(66% of the total MISSION! population) were included of whom 232 (67%) were
admitted to the hospital following the pre-hospital triage protocol. The remaining
patients (n=112, 33%) were either referred to the PCI center by another hospital
or were admitted after self referral. As during the study period only a small number
of patients (n=18) was transported to a regional hospital to receive thrombolytic
therapy they were excluded from analysis.
Baseline characteristics of the historical group (n=84) and the MISSION! group
(n=518) are summarized in Table 1. In the MISSION! group fewer patients had a
history of prior AMI (13% historical vs. 6% MISSION!; p=0.02) or PCI (7% vs. 3%;
p=0.046). MISSION! patients presented more often with Killip class I (73% vs. 88%;
p<0.001), and had higher systolic and diastolic blood pressures at the time of admission. More information regarding modifiable cardiovascular risk factors was recorded
in MISSION! patients than in historical patients (Table 2).
61
11/83 (13)
6/83 (7)
2/84 (2)
Family history
Previous myocardial infarction
Previous PCI
Previous CABG
1/83 (1)
16/82 (20)
9/82 (11)
9/82 (11)
Clopidogrel
Beta-blocker
ACE-I/ARB
Statin
Aspirin
15/82 (18)
37/79 (47)
Current smokers
Medication use at the time of
admission
27/82 (33)
46/80 (58)
Hypertension
18/80 (23)
4/82 (5)
38-81
57.3 (49.8-68.7)
65/84 (77)
74/515 (14)
64/514 (13)
80/514 (16)
1/515 (0.2)
64/515 (12)
6/515 (1)
14/515 (3)
29/516 (6)
218/511 (43)
252/512 (49)
159/513 (31)
112/512 (22)
47/513 (9)
22-89
60.5 (51.1-69.4)
404/518 (78)
n=518
n=84
Hyperlipidemia
Diabetes
Medical history
Range
Age (years)
Male
Demographics
MISSION!
Historical group
0.5
0.9
0.4
0.6
0.2
0.7
0.046
0.02
0.5
0.2
0.8
0.9
0.3
0.4
0.9
p-value
77/112 (69)
20/111 (18)
10/111 (9)
20/111 (18)
0/111 (0)
17/111 (15)
2/111 (2)
3/110 (3)
8/111 (7)
55/110 (50)
52/110 (47)
29/110 (26)
29/109 (27)
11/110 (10)
22-89
59.2 (53.7-69.0)
30/231 (13)
33/230 (14)
36/230 (16)
0/231 (0)
24/231 (10)
2/231 (1)
4/232 (2)
12/232 (5)
97/230 (42)
115/231 (50)
82/231 (36)
49/231 (21)
12/231 (5)
28-87
59.8 (51.1-68.2)
189/232 (82)
With PHT
n=232
MISSION! subgroups
Without PHT
n=112
0.3
0.2
0.6
1
0.2
0.8
0.8
0.5
0.2
0.7
0.1
0.3
0.1
0.9
0.01
p-value*
62
80 (70-90)
10/82 (12)
III/IV
-
-
15/51 (29)
31/422 (7)
3.9 (3.2-4.6)
95/484 (20)
5.4 (4.6-6.2)
314/506 (62)
40/63 (64)
5.1 (4.2-6.0)
25.8 (24.0-28.4)
25.7 (23.4-28.3)
4.9 (2.2-9.8)
33/515 (6)
28/515 (5)
454/515 (88)
-
-
0.1
0.2
0.9
0.2
0.1
0.001
0.8
0.002
0.004
0.2
8/82 (10)
3.9 (3.2-4.6)
20/100 (20)
5.3 (4.7-6.1)
61/105 (58)
25.6 (23.7-28.4)
4.5 (1.5-8.4)
8/111 (7)
7/111 (6)
96/111 (87)
71 (60-81)
80 (70-89)
130 (117-150)
55/112 (49)
16/211 (8)
3.7 (3.1-4.6)
49/231 (21)
5.3 (4.6-6.1)
149/230 (65)
25.7 (24.0-28.1)
4.9 (2.4-9.3)
12/232 (5)
6/232 (3)
214/232 (92)
73 (60-85)
80 (70-90)
138 (120-150)
104/232 (45)
0.6
0.9
0.9
1
0.3
0.9
0.9
0.2
0.9
0.03
0.09
0.5
Table 1.
Baseline and clinical characteristics of the historical and MISSION! group
Values expressed as n/total (%) or median (25th-75th percentiles)
PHT, pre-hospital triage; PCI, percutaneous coronary intervention; CABG, coronary artery bypass graft; ACE-I, angiotensin-converting enzyme
inhibitor; ARB, angiotensin II receptor blocker; LDL, low-density lipoprotein
*P-value: MISSION! patients without vs. with pre-hospital triage
<2.5 mmol/L (100 mg/dL)
LDL-cholesterol (mmol/L)
<4.5 mmol/L (175 mg/dL)
Total cholesterol (mmol/L)
2
<27 Kg/m
Body Mass Index (kg/m2)
6.5 (2.9-11.4)
12/82 (15)
Troponine T max (μg/L)
60/82 (73)
II
71 (60-84)
76 (65-85)
70 (60-81)
135 (120-150)
257/518 (50)
130 (110-140)
49/84 (58)
I
Killip class at admission
Heart rate (beats/minute)
Diastolic
Systolic
Blood pressure (mm Hg)
Anterior myocardial infarction
Clinical
Chapter 3 : The Leiden MISSION! Project: results
63
‡
-
Rehabilitation
-
0.6
-
428/444 (96)
66 (89)
68 (92)
53 (72)
1 (1)
60 (81)
56 (76)
Historical
n=74
487 (99)
456 (93)
475 (97)
426 (87)
464 (95)
458 (93)
1 month
n=491
-
455 (93)
466 (96)
376 (77)
415 (85)
460 (94)
6 months
n=487
Follow-up
-
437 (90)
463 (96)
370 (76)
400 (83)
454 (94)
1 year
n=484
<0.001
0.8
<0.001
<0.001
0.7
<0.001
p-value*
Table 2.
Available information regarding modifiable cardiovascular risk factors and cardiac rehabilitation program participation in the historical and MISSION!
group
Values expressed as n (%)
LDL, low-density lipoprotein
*P-value: Historical follow-up vs. one-year follow-up MISSION!
†Assessment <24 hours of admission
‡Assessment <24 hours before discharge to home
69/70 (99)
Blood pressure
‡
0.05
<0.001
<0.001
<0.001
p-value
512 (99)
422 (81)
1 (1)
80 (95)
Smoking status
LDL-cholesterol
†
484 (93)
51 (61)
506 (98)
63 (75)
Body Mass Index
MISSION!
n=518
In-hospital
Total cholesterol†
Historical
n=84
64
88 (72-120)
51/99 (52)
52 (40-65)
81 (65-100)
44/67 (66)
160 (135-212)
Door-to-Cath lab (min)
Door-to-Balloon (min)
Door-to-Balloon <90 min
Symptom onset-balloon (min)
94/104 (90)
57/59 (97)
0.02
0.08
0.02
<0.001
0.9
0.2
0.2
0.2
<0.001
0.09
p-value
180 (130-262)
238/303 (79)
55 (41-82)
27 (15-53)
272/284 (96)
247/284 (87)
89 (51-167)
110 (80-186)
272/313 (87)
313/344 (91)
Pre-hospital
MISSION!
protocol fully
operational
1/1/5-31/3/6
0.1
0.04
<0.001
<0.001
0.8
0.06
0.8
<0.001
0.7
0.7
p-value*
Table 3.
Pre-hospital and in-hospital time delays in patients treated with primary PCI
Values are expressed as n/total (%) and median (25th-75th percentiles)
PHT, pre-hospital triage; PCI, percutaneous coronary intervention; min, minutes; ECG, electrocardiogram
*
p-value: Historical group vs. MISSION patients treated from 1/1/5-31/3/6
†
p-value: MISSION! patients without vs. with pre-hospital triage
194 (152-243)
64 (50-90)
101/104 (97)
57/59 (97)
106 (64-139)
<360 minutes
79 (60-123)
Symptom onset - 1st AMI ECG
100 (60-132)
56/107 (52)
107/111 (96)
Pre-hospital
MISSION!
protocol
not operational
1/2/4-31/8/4
<240 minutes
74 (50-120)
64/75 (85)
Of whom directly admitted
to the PCI center
Symptom onset – Arrival
hospital (min)
75/84 (89)
Patients treated with prim PCI
Historical
group
2003
209/220 (95)
48 (38-60)
20 (14-30)
210/215 (98)
193/215 (90)
76 (44-135)
105 (77-180)
223/223 (100)
223/232 (96)
With PHT
n=232 (67%)
255 (197-345) 162 (123-232)
29/83 (35)
105 (80-130)
75 (52-100)
62/69 (90)
54/69 (78)
138 (86-229)
126 (80-228)
50/90 (56)
90/112 (80)
Without
PHT
n=112 (33%)
MISSION!
1/1/5-31/3/6
<0.001
<0.001
<0.001
<0.001
0.01
0.02
<0.001
0.09
<0.001
<0.001
p-value†
Chapter 3 : The Leiden MISSION! Project: results
65
66
Pre-hospital performance and time intervals
Table 3 lists the pre-hospital and in-hospital time delays of patients treated with primary PCI, according to the timeline of implementation of MISSION! (Figure 2). Due to
the larger geographic area and because more patients (48% vs. 15%, p<0.001) were
referred for PCI than before MISSION! (due to the participation of the community
hospitals), pre- and in-hospital time-intervals increased after the implementation of
the in-hospital and outpatient MISSION! protocol (between 1/2/2004 and 31/8/2004).
Moreover, patients treated with primary PCI in MISSION! tended to present later
after onset of symptoms at the hospital (74 min vs. 100 min; p=0.2). This resulted in
a prolonged total ischemic time (i.e. symptom onset-balloon time). However, after
implementation of the pre-hospital triage protocol, door-to-balloon time decreased
with 26 min (81 min vs. 55 min; p<0.001), and 79% of the patients benefited a
PCI within the guideline-recommended 90 minutes door-to-balloon time compared
to 66% before implementation of the pre-hospital triage protocol (p=0.04). In the
67% of patients admitted directly to the PCI center after pre-hospital triage, AMI
diagnosis was confirmed substantial earlier (i.e. symptom onset - 1st AMI ECG 138
min vs. 76 min; p<0.001). Furthermore, nearly all patients admitted after pre-hospital
triage benefited primary PCI within 90 minutes door-to-balloon time (35% vs. 95%;
p<0.001), and total ischemic time was 93 minutes shorter (255 min vs. 162 min;
p<0.001) compared to the one third of patients not treated according to pre-hospital
protocol during the same period.
In-hospital performance
In-hospital performance is presented in Table 4. No difference was seen in the proportion of patients receiving acute reperfusion therapy (95% historical vs. 92% MISSION!; p=0.4); though, in MISSION! PCI was more often the reperfusion strategy of
choice instead of thrombolytic therapy (94% vs. 99%; p<0.001). MISSION! patients
received more frequently beta-blockers (64% vs. 84%; p<0.001) and ACE-inhibitor
therapy <24 hours after admission (40% vs. 87%; p<0.001), and more patients were
discharged with ACE-inhibitors (70% vs. 98%; p<0.001). Furthermore, 73% of MISSION! patients were discharged within three days compared to only 23% of the
historical patients (p< 0.001).
Outpatient phase
At one-year follow-up more MISSION! patients used clopidogrel (72% historical vs.
94% MISSION!; p<0.001), beta-blockers (81% vs. 90%; p<0.05), and ACE-inhibitors
(66% vs. 98%; p<0.001) (Table 5). The proportion of patients achieving a target blood
Chapter 3 : The Leiden MISSION! Project: results
pressure <140/90 mmHg tended to be higher in the MISSION! group (63% vs. 70%;
p=0.3). Despite the fact that in both groups statin use was >95%, more MISSION!
patients achieved target total cholesterol levels of <4.5 mmol/L (58% vs. 80%;
p<0.001). Before MISSION!, LDL levels were not assessed (table 2); in the MISSION! program the proportion of patients achieving target LDL levels <2.5 mmol/L
increased from 7% at the time of index event up to 71% at one-year follow-up.
In both groups, a similar proportion of smokers stopped smoking during follow-up
Primary reperfusion therapy
Historical group
n=84
MISSION!
n=518
p-value
80/84 (95)
477/518 (92)
PCI
75/80 (94)
474/477 (99)
0.4
Abciximab before PCI
70/75 (93)
460/474 (97)
0.2
<0.001
Medication <24hrs
Aspirin
78/78 (100)
480/508 (95)
0.07
Clopidogrel
77/78 (99)
492/508 (97)
0.6
Beta-blocker
50/78 (64)
428/508 (84)
<0.001
ACE-I/ABR
31/78 (40)
443/508 (87)
<0.001
Statin
72/78 (92)
479/508 (94)
0.3
Medication discharge*
Aspirin
64/70 (91)
426/444 (96)
0.1
Clopidogrel
69/70 (99)
442/444 (99)
0.9
Beta-blocker
62/70 (89)
415/444 (94)
0.1
ACE-I/ABR
49/70 (70)
434/444 (98)
<0.001
Statin
70/70 (100)
442/444 (99)
1
62/69 (90)
395/428 (92)
0.5
Blood pressure at discharge*
<140/90 mmHg
Length of stay* (days)
Discharge ≤3 days
5 (4-7)
3 (2-4)
<0.001
16/70 (23)
326/444 (73)
<0.001
Table 4. Performance in-hospital
Values expressed as n/total (%) or median (25th-75th percentiles)
ACE-I, angiotensin-converting enzyme inhibitor; ARB, angiotensin II receptor blocker
*
In patients discharge to home
67
68
Historical
group
MISSION!
6-mth FU
p-value†
Follow-up*
1-mth FU
1-year FU
Median follow-up (days)
377 (309-445)
42 (36-48)
Patients alive, n (actual
visits,n(%))
74 (74(100))
491 (477(97)) 487 (468(96)) 484 (478(99))
Aspirin
61/73 (84)
444/477 (93)
435/466 (93)
433/475 (91)
Clopidogrel
48/67 (72)
470/477 (99)
459/466 (98)
446/475 (94) <0.001
Beta-blocker
60/74 (81)
454/477 (95)
423/466 (91)
427/475 (90) 0.046
ACE-I/ARB
49/74 (66)
466/477 (98)
457/466 (98)
465/475 (98) <0.001
Statin
72/74 (97)
470/477 (99)
460/466 (99)
462/475 (97)
Blood pressure <140/90 mmHg
43/68 (63)
309/456 (68)
303/455 (67)
307/437 (70)
0.3
Body Mass Index <27 Kg/m2
29/56 (52)
297/458 (65)
310/460 (67)
295/454 (65)
0.06
Total cholesterol <4.5 mmol/L
35/60 (58)
375/464 (81)
330/415 (80)
318/400 (80) <0.001
LDL-cholesterol <2.5 mmol/L
-
286/426 (67)
249/376 (66)
262/370 (71)
201 (192-207) 398 (376-410)
0.2
-
Medication
0.06
1
-
Smokers stopped
24/37 (65)
166/233 (71)
152/234 (65)
146/228 (64)
1
Rehabilitation
62/66 (94)
422/487 (87)
-
-
0.1
Table 5. Performance in the outpatient phase
Values expressed as n/total (%) or median (25th-75th percentiles)
mth, month; FU, follow-up; ACE-I, angiotensin-converting enzyme inhibitor; ARB, angiotensin II
receptor blocker; LDL, low-density protein
*Follow-up derived from the available historical data closest to 1-year
†P-value assessed out of the historical follow-up data and the 1-year follow-up of MISSION!
(65% vs. 64%; p=1); however of the index smokers smoking status during follow-up
was unknown in 18% of the historical group compared to only 2% in the MISSION!
group (p<0.001).
Clinical outcome
In-hospital mortality was 10.7% in the historical versus 4.6% in the MISSION! group
(p=0.03), 6-month mortality was 11.9% in the historical versus 6.0% in the MISSION! group ( p=0.05), and at one-year follow-up 13.1% in the historical and 6.6% in
Chapter 3 : The Leiden MISSION! Project: results
69
Historical
n=84
MISSION!
n=518
In-hospital, n(%)
9 (10.7)
24 (4.6)
0.03
0.7
6-months, n(%)
10 (11.9)
31 (6.0)
0.05
0.7
1-year, n(%)
11 (13.1)
34 (6.6)
0.04
0.7
In-hospital, n(%)
3 (3.6)
3 (0.6)
0.03
0.09
6-months, n(%)
4 (4.8)
8 (1.5)
0.06
0.1
1-year, n(%)
5 (6.0)
10 (1.9)
0.04
0.1
Odds ratio (95% CI)*
P-value
Mortality
Re-infarction
0
0.5
1.0
MISSION! benefits
1.5
2.0
2.5
No benefit
Figure 3.
Clinical outcomes in-hospital, at 6 months and one-year.
CI = Confidence interval *Solid lines: unadjusted odds ratio (95% CI); dashed lines: adjusted odds
ratio (95% CI), Mortality adjusted for sex, age, diabetes, index smoking status, prior AMI, prior
PCI, Killip class ≥2, systolic blood pressure, anterior infarction; Re-infarction adjusted for: sex, age,
Figure 3
diabetes, index smoking status, prior AMI, prior PCI, Killip class ≥2
the MISSON! group (p=0.04) (Figure 3). Moreover, re-infarction occurred less often
in the MISSION! group during the in-hospital phase (3.6% historical vs. 0.6% MISSION!; p=0.03) and at one-year follow-up (6.0% vs. 1.9%; p=0.04). After multivariate
adjustment a clear trend remained, with an odds ratio of 0.82 for one-year mortality
and 0.35 for one-year re-infarction in favor of MISSION!.
Discussion
Implementation of an all-phases comprising AMI care program resulted in: 1) shortening of treatment delays in the acute phase, 2) increased and improved long-term
utilization of evidence-based medication, 3) improved control of cholesterol and
blood pressure levels.
70
Pre-hospital
In line with previous studies, implementation of the pre-hospital MISSION! triage
protocol resulted in a significant reduction of treatment delay compared to those
not following the pre-hospital triage protocol.(13) The median door-to-balloon time of
55 minutes is shorter than the 70 minutes reported by the second European Heart
Survey, and also considerable shorter than 108 minutes reported in the large NRMI
(National Registry of Myocardial Infarction) study.(5,6) In the last study 37% were
treated <90 minutes door-to-balloon window (6); whereas for the total MISSION!
population this was 79%, and among those referred by pre-hospital triage even 95%,
stressing the importance of a pre-hospital triage protocol. As a larger geographic
area was incorporated in MISSION! and due to increased patient delay (reflected
by symptom onset-balloon time) total ischemic time (i.e. symptom onset-balloon)
was not shortened. Of importance, McNamara et al. showed that not symptom
onset-balloon time, but door-to-balloon time is strongly associated with mortality
regardless of time from symptom onset to presentation.(16) Of the six pre- and inhospital strategies to fasten door-to-balloon time defined by Bradley et al., four were
applied in MISSION!: 1) the catheterization laboratory is activated while the patient
is still en route, 2) a maximum of two calls are needed to activate the catheterization
team (i.e. one to the interventional cardiologist and one to the laboratory staff), 3) the
interval between page and arrival of catheterization staff is less than 20 minutes, 4)
real time feedback.(17) The door-to-balloon time of 55 minutes achieved in MISSION!
was shorter than the 79 minutes reported by Bradley.(17) The effectiveness of the
pre-hospital MISSION! program is explained by the following factors: 1) the development and use of a clear and simple-to-use pre-hospital flowchart, uniform for the
whole region, and for all health care providers involved in acute AMI care(14); 2) the
training of all ambulance employees and CCU nurses of the PCI center involved; and
3) performance reviews on a regular basis. Further improvement can be achieved by
referring the patient directly to the catheterization laboratory which may shorten the
door-to-balloon time with another 20 minutes. The time delay caused by the patient
self (i.e. not seeking prompt medical help after onset symptoms), and the 33% of
MISSION! patients not “caught” by pre-hospital triage (especially women), warrants
that all efforts are addressed to increase public awareness.
In-hospital
The proportion of patients receiving primary PCI was similar in both groups. In patients presenting with ST-elevation the rate of primary PCI was 96%, which is higher
compared to routine care worldwide (i.e. reperfusion rates vary between 64% to
Chapter 3 : The Leiden MISSION! Project: results
71%).(5,6) In a recent study reporting AMI care in Vienna Austria, it was shown that
by establishing a cooperative network between ambulance services and cardiology
departments, the use of reperfusion therapy in the acute phase increased to 87%.
(12)
Although the historical performance in the prescription of evidence-based drugs
was reasonable compared to other studies, implementation of the MISSION!
program increased the use of beta-blockers and ACE inhibitors. The use of these
drugs at the time of discharge was higher compared to prior observations and quality
improvement programs.(4,5,7,18) MISSION! resulted in a decreased length of stay in
low-risk AMI patient, important in an era of increasing economic pressure. Moreover,
in selected patients early discharge appeared to be safe and effective.
Outpatient
MISSION! succeeded to increase the use of medication during follow-up. The use
and continuation of a combination of evidence-based drugs is associated with marked
survival advantage.(18,19) Discontinuation of medical therapy occurs mainly in the
first month after hospital discharge.(18) Hence, short term medical contact followed
by systematic outpatient visits after discharge, as in the MISSION! program, seems
to play an important role in increasing compliance by monitoring and emphasizing
the need for using the prescribed drugs.(18) Statin use was already high in the historical group, yet 80% of the MISSION! patients achieved target lipid compared to
only 58% in the historical group. The atherosclerosis management program CHAMP
succeeded to increase the proportion of patients achieving the LDL target level from
6% to 58%.(8) Therefore therapy adjustment during follow-up is essential to achieve
medical goals.
The proportion of patients achieving a target blood pressure level of <140/90
mmHg increased and blood pressure control at one-year (70%) was better than observed in EuroAspire II (54%).(20) We didn’t achieve an increase in the proportion of
stopped smokers in the outpatient phase (64%), though performance is better than
described in EuroAspire II (52%).(21) Moreover, 87% of MISSION! patients followed
a cardiac rehabilitation programs fostering the possibility for maximal psychosocial
reintegration of the AMI patient.(1,2)
Clinical outcome
Although not primarily designed to show differences in clinical outcome, mortality and
re-infarction rates declined during the first year following the index infarct compared
to the results obtained in the historical group. Although baseline characteristics were
71
72
different in the historical and MISSION! group after adjustment for several possible
confounders a clear trend of clinical improvement remained which is consistent with
prior quality improvement initiatives and studies.(8,10,11,19)
Limitations
Some limitations of the study have to be addressed. MISSION! is a non-randomized
cohort study reflecting daily clinical practice, as randomization between evidencebased guideline medicine and standard clinical care was considered unethical.(8-11)
Second, MISSION! is limited to the region “Hollands-Midden” in the Netherlands.
Healthcare systems differ between countries and even between regions in one
country. However MISSION! may serve as a template of an all-phases integrated
AMI care program.
Conclusion
An all-phases integrated AMI care program is a strong tool to enhance adherence to
evidence based medicine and is likely to improve clinical outcome in AMI patients.
Chapter 3 : The Leiden MISSION! Project: results
References
1.
Antman EM, Anbe DT, Armstrong PW, et al. ACC/AHA guidelines for the management of
patients with ST-elevation myocardial infarction: a report of the American College of Cardiology/American Heart Association Task Force on Practice Guidelines. J Am Coll Cardiol.
2004;44(3):E1-E211.
2.
Van de Werf F, Ardissino D, Betriu A, et al. Management of acute myocardial infarction
in patients presenting with ST-segment elevation. The Task Force on the Management of
Acute Myocardial Infarction of the European Society of Cardiology. Eur Heart J. 2003;24:2866.
3.
De Backer G, Ambrosioni E, Borch-Johnsen K, et al. European guidelines on cardiovascular
disease prevention in clinical practice. Third Joint Task Force of European and Other Societies on Cardiovascular Disease Prevention in Clinical Practice. Eur Heart J. 2003;24:160110.
4.
Carruthers KF, Dabbous OH, Flather MD, et al. Contemporary management of acute
coronary syndromes: does the practice match the evidence? The global registry of acute
coronary events (GRACE). Heart. 2005;91:290-8.
5.
Mandelzweig L, Battler A, Boyko V, et al. The second Euro Heart Survey on acute coronary
syndromes: Characteristics, treatment, and outcome of patients with ACS in Europe and
the Mediterranean Basin in 2004. Eur Heart J. 2006;27:2285-93.
6.
McNamara RL, Herrin J, Bradley EH, et al. Hospital improvement in time to reperfusion in
patients with acute myocardial infarction, 1999 to 2002. J Am Coll Cardiol. 2006;47:45-51.
7.
Roe MT, Parsons LS, Pollack CV, et al. Quality of care by classification of myocardial infarction: treatment patterns for ST-segment elevation vs non-ST-segment elevation myocardial
infarction. Arch Intern Med. 2005;165:1630-6.
8.
Fonarow GC, Gawlinski A, Moughrabi S, Tillisch JH. Improved treatment of coronary heart
disease by implementation of a Cardiac Hospitalization Atherosclerosis Management
Program (CHAMP). Am J Cardiol. 2001;87:819-22.
9.
LaBresh KA, Ellrodt AG, Gliklich R, Liljestrand J, Peto R. Get with the guidelines for cardiovascular secondary prevention: pilot results. Arch Intern Med. 2004;164:203-9.
10.
Marciniak TA, Ellerbeck EF, Radford MJ, et al. Improving the quality of care for Medicare
patients with acute myocardial infarction: results from the Cooperative Cardiovascular
Project. JAMA. 1998;279:1351-7.
11.
Eagle KA, Montoye CK, Riba AL, et al. Guideline-based standardized care is associated
with substantially lower mortality in medicare patients with acute myocardial infarction: the
73
American College of Cardiology’s Guidelines Applied in Practice (GAP) Projects in Michigan.
J Am Coll Cardiol. 2005;46:1242-8.
74
12.
Kalla K, Christ G, Karnik R, et al. Implementation of guidelines improves the standard of
care: the Viennese registry on reperfusion strategies in ST-elevation myocardial infarction
(Vienna STEMI registry). Circulation. 2006;113:2398-2405.
13.
Ortolani P, Marzocchi A, Marrozzini C, et al. Clinical impact of direct referral to primary percutaneous coronary intervention following pre-hospital diagnosis of ST-elevation myocardial
infarction. Eur Heart J. 2006;27:1550-7.
14.
Liem SS, van der Hoeven BL, Oemrawsingh PV, et al. MISSION!: optimization of acute and
chronic care for patients with acute myocardial infarction. Am Heart J. 2007;153:14.e1-11.
15.
Alpert JS, Thygesen K, Antman E, Bassand JP. Myocardial infarction redefined--a consensus
document of The Joint European Society of Cardiology/American College of Cardiology
Committee for the redefinition of myocardial infarction. J Am Coll Cardiol. 2000;36:95969.
16.
McNamara RL, Wang Y, Herrin J, et al. Effect of door-to-balloon time on mortality in patients
with ST-segment elevation myocardial infarction. J Am Coll Cardiol. 2006;47:2180-6.
17.
Bradley EH, Herrin J, Wang Y, et al. Strategies for reducing the door-to-balloon time in acute
myocardial infarction. N Engl J Med. 2006;355:2308-20.
18.
Ho PM, Spertus JA, Masoudi FA, et al. Impact of medication therapy discontinuation on
mortality after myocardial infarction. Arch Intern Med. 2006;166:1842-7.
19.
Mukherjee D, Fang J, Chetcuti S, Moscucci M, Kline-Rogers E, Eagle KA. Impact of
combination evidence-based medical therapy on mortality in patients with acute coronary
syndromes. Circulation. 2004;109:745-9.
20.
EUROASPIRE II study group. Lifestyle and risk factor management and use of drug therapies in coronary patients from 15 countries; principal results from EUROASPIRE II Euro
Heart Survey Programme. Eur Heart J. 2001;22:554-72.
21.
Scholte op Reimer W, de Swart E, De Bacquer D, Pyorala K, Keil U, Heidrich J, Deckers JW,
Kotseva K, Wood D, Boersma E. Smoking behaviour in European patients with established
coronary heart disease. Eur Heart J. 2006;27:35-41.
Chapter 4
Does left ventricular dyssynchrony
immediately after acute myocardial infarction
result in left ventricular dilatation?
Sjoerd A. Mollema
Gabe B. Bleeker
Su San Liem
Eric Boersma
Bas L. van der Hoeven
Eduard R. Holman
Ernst E. van der Wall
Martin J. Schalij
Jeroen J. Bax
Heart Rhythm 2007;4:1144 –1148
76
Abstract
Background
Reverse remodeling of the left ventricle (LV) is one of the advantageous mechanisms
of cardiac resynchronization therapy (CRT). Substantial LV dyssynchrony seems mandatory for echocardiographic response to CRT. Conversely, LV dyssynchrony early
after acute myocardial infarction may result in LV dilatation during follow-up.
Objective
The purpose of this study was to evaluate the relation between LV dyssynchrony
early after acute myocardial infarction and the occurrence of long-term LV dilatation.
Methods
A total of 124 consecutive patients presenting with acute myocardial infarction who
underwent primary percutaneous coronary intervention were included. Within 48
hours of intervention, 2D echocardiography was performed to assess LV volumes, LV
ejection fraction (LVEF) and wall motion score index (WMSI). LV dyssynchrony was
quantified using color-coded tissue Doppler imaging (TDI). At 6 months follow-up, LV
volumes and LVEF were reassessed.
Results
Patients with substantial LV dyssynchrony (≥ 65 ms) at baseline (18%) had comparable baseline characteristics to patients without substantial LV dyssynchrony (82%),
except for a higher prevalence of multi-vessel coronary artery disease (p = .019),
higher WMSI (p = .042), and higher peak levels of creatine phosphokinase (p = .021).
During 6 months follow-up, 91% of the patients with substantial LV dyssynchrony at
baseline developed LV remodeling, compared to 2% in the patients without substantial LV dyssynchrony. LV dyssynchrony at baseline was strongly related to the extent
of long-term LV dilatation at 6 months follow-up.
Conclusion
Most patients with substantial LV dyssynchrony immediately after acute myocardial
infarction develop LV dilatation during 6 months follow-up.
Chapter 4 : LV dilatation after LV dyssynchrony
Introduction
Nowadays, a substantial proportion of patients with moderate to severe ischemic
heart failure, despite optimal medical therapy, is treated with cardiac resynchronization therapy (CRT).(1-5) The presence of left ventricular (LV) dyssynchrony seems
to be of considerable importance for response and prognosis after CRT.(6-8) Importantly, reverse remodeling of the left ventricle more frequently occurs in those
patients with substantial LV dyssynchrony at baseline. In addition, patients with LV
reverse remodeling after CRT have a better prognosis than those without LV reverse
remodeling.(6-8)
Presumably, LV dyssynchrony after acute myocardial infarction results in LV dilatation. However, no study thus far has systematically examined this potential relationship. Tissue Doppler imaging (TDI) is established for the assessment of myocardial
velocities and the detection of LV dyssynchrony, and has been used in patients who
had a myocardial infarction.(9) This study evaluates the relation between LV dyssynchrony at baseline, assessed with TDI, and the occurrence of long-term LV dilatation
in patients following acute myocardial infarction.
Methods
Patients
A total of 135 consecutive patients, admitted with an acute myocardial infarction,
were screened. Patients who were treated conservatively (n = 4) or who underwent
thrombolysis (n = 3) or coronary artery bypass grafting (n = 1) in the acute setting
were excluded from the study in order to obtain a homogenous study group. Three
patients died during follow-up and therefore did not have the follow-up assessment.
These patients were excluded from the study. The final study population comprised
124 patients who all underwent primary percutaneous coronary intervention.
Protocol
Two-dimensional echocardiography was performed within 48 hours of admission
(baseline) and at 6 months follow-up. At baseline, conventional echocardiography
was used to assess LV volumes, LV ejection fraction (LVEF) and wall motion score
index (WMSI). LV dyssynchrony was quantified using color-coded tissue Doppler
imaging (TDI). LV volumes and LVEF were reassessed at 6 months follow-up.(10)
77
78
The study was approved by the institutional ethics committee, and informed consent was obtained from all patients.
Echocardiography
Patients were imaged in the left lateral decubitus position using a commercially
available system (Vivid Seven, General Electric-Vingmed, Milwaukee, Wisconsin,
USA). Standard images were obtained using a 3.5-MHz transducer, at a depth of
16 cm in the parasternal (long- and short-axis) and apical (2- and 4-chamber) views.
Standard 2-dimensional and color Doppler data, triggered to the QRS complex, were
saved in cine-loop format. LV volumes (end-systolic and end-diastolic) and LVEF were
calculated from the conventional apical 2- and 4-chamber images, using the biplane
Simpson’s technique.(11) LV remodeling at 6 months follow-up was defined as an
increase in LV end-systolic volume (LVESV) ≥15%.(6,12,13)
The LV was divided into 16 segments. A semiquantitative scoring system (1,
normal; 2, hypokinesia; 3, akinesia; 4, dyskinesia) was used to analyze each study.
Global WMSI was calculated by the standard formula: sum of the segment scores
divided by the number of segments scored.(14,15)
All echocardiographic measurements were obtained by two independent observers without knowledge of the clinical status of the patient. Inter- and intra-observer
agreement for assessment of LV volumes were 90% and 93% for LVESV, and 92%
and 93% for LVEDV, respectively.
Tissue Doppler imaging
Color Doppler frame rates were >80 and pulse repetition frequencies were between
500 Hz and 1 KHz, resulting in aliasing velocities between 16 and 32 cm/s. TDI
parameters were measured from color images of three consecutive heart beats
by offline analysis. Data were analyzed using commercial software (Echopac 6.01,
General Electric-Vingmed). To determine LV dyssynchrony, the sample volume (6 x
6 mm) was placed in the LV basal portions of the anterior, inferior, septal and lateral
walls (using the two- and four-chamber views) and, per region, the time interval
between the onset of the QRS complex and the peak systolic velocity was obtained.
LV dyssynchrony was defined as the maximum delay between peak systolic velocities among these four LV regions.(6) Substantial LV dyssynchrony was defined as LV
dyssynchrony ≥65 ms.(6) Inter- and intra-observer agreement for assessment of LV
dyssynchrony were reported previously (90% and 96%, respectively).(16)
Chapter 4 : LV dilatation after LV dyssynchrony
Statistical analysis
Most continuous variables were not normally distributed (as evaluated by Kolmogorov-Smirnov tests). For reasons of uniformity, summary statistics for all continuous variables are therefore presented as medians together with the 25th and 75th
percentiles. Categorical data are summarized as frequencies and percentages.
Differences in baseline characteristics between patients who demonstrated substantial LV dyssynchrony versus those who did not were analyzed using WilcoxonMann-Whitney tests, Chi-square tests with Yates’ correction or Fisher’s exact tests,
as appropriate. Linear regression analysis was used to evaluate the relations between
baseline variables and the change in LVESV during follow-up. All statistical tests were
two-sided. Unless otherwise specified, a p value <.05 was considered statistically
significant.
Results
Baseline data of the study population
In the present study 124 patients were included (99 men and 25 women, median
age 61 (53, 71) years). During primary percutaneous coronary intervention TIMI-III
flow was achieved in all but 6 (5%) patients. Multi-vessel disease was observed in
67 (54%) patients. Median creatine phosphokinase (CPK) levels were 2469 (1023,
3702) U/L. Median WMSI was 1.50 (1.31, 1.63). Seven (6%) patients had a previous
myocardial infarction. At baseline, median LVESV and LVEDV were 65 (54, 83) ml and
129 (106, 151) ml, respectively, whereas the median LVEF was 48% (42%, 53%).
Median LV dyssynchrony as measured by TDI was 10 (0, 40) ms.
Six months follow-up
In the entire patient population, the mean LVESV remained unchanged at 6 months
follow-up (64 (51, 84) ml versus 65 (54, 83) ml at baseline, p = .11). LVEDV increased
significantly during follow-up (130 (110, 155) ml versus 129 (106, 151) ml at baseline,
p = .007). LVEF remained unchanged (49%(43%, 56%) versus 48 (42, 53) % at
baseline, p = .31).
LV dilatation in patients with baseline LV dyssynchrony
Patients were subsequently divided into patients with substantial LV dyssynchrony
(n = 22, 18%) and without LV dyssynchrony (n = 102, 82%) at baseline. Patients in
the group with substantial LV dyssynchrony had a median dyssynchrony of 85 (80,
79
80
100) ms, whereas median dyssynchrony among those without substantial LV dyssynchrony was 10 (0, 20) ms (p <.0001, by definition). Clinical and echocardiographic
patient characteristics of the 2 groups are summarized in Table 1 and 2, respectively.
Various baseline variables differed significantly between patients with and without
substantial LV dyssynchrony at baseline. Patients with LV dyssynchrony more often
had multi-vessel coronary artery disease. WMSI (as a reflector for infarct size) was
higher among those patients with LV dyssynchrony. In addition, peak levels of CPK
(reflecting enzymatic infarct size) were higher in the patients with LV dyssynchrony.
Baseline LV volumes and LVEF were similar between patients with and without LV
dyssynchrony at baseline. However, at 6 months follow-up LVESV and LVEDV were
All patients
(n = 124)
No LV
Dyssynchrony
(n = 102)
LV
Dyssynchrony
(n = 22)
p Value*
61 (53, 71)
61 (53, 71)
64 (56, 71)
0.50
Gender (M/F, %)
99/25 (80/20)
81/21 (79/21)
18/4 (82/18)
1.00
Previous MI (%)
7 (6)
7 (7)
0
0.35
94 (88, 104)
94 (90, 104)
95 (82, 106)
0.78
6 (5)
5 (5)
1 (5)
1.00
11 (9)
10 (10)
1 (5)
0.69
Age (yrs)
QRS duration
baseline (ms)
Wide QRS (≥120 ms, %)
Risk factors for CAD
Diabetes (%)
Hypertension (%)
37 (30)
29 (28)
8 (36)
0.54
Hyperlipidemia (%)
25 (20)
22 (22)
3 (14)
0.56
Smoking (%)
Peak CPK (U/L)
Multi-vessel disease (%)
59 (48)
50 (49)
9 (41)
0.48
2469 (1063, 3681)
2167 (946, 3395)
3703 (1584, 5616)
0.021
67 (54)
50 (49)
17 (77)
0.019
Medication at
6 months follow-up
Beta-blockers (%)
112 (90)
92 (90)
20 (91)
0.52
ACE-inhibitors/
ARBs (%)
122 (98)
100 (98)
22 (100)
0.11
Anti-coagulants (%)
124 (100)
102 (100)
22 (100)
1.00
Statins (%)
122 (98)
100 (98)
22 (100)
0.73
Table 1.
Baseline clinical characteristics of patients without versus with left ventricular dyssynchrony.
ACE: angiotensin-converting enzyme; ARB: angiotensin receptor blocker; CAD: coronary artery
disease; CPK: creatine phosphokinase; MI: myocardial infarction.
*
Patients with versus without LV dyssynchrony
Chapter 4 : LV dilatation after LV dyssynchrony
All patients
(n = 124)
No LV
Dyssynchrony
(n = 102)
LV
Dyssynchrony
(n = 22)
p Value*
81
Baseline
LV dyssynchrony (ms)
WMSI
10 (0, 40)
10 (0, 20)
85 (80, 100)
< 0.0001
1.50 (1.31, 1.63)
1.50 (1.25, 1.63)
1.56 (1.38, 1.69)
0.042
LVESV (ml)
65 (54, 82)
LVEDV (ml)
129 (106, 151)
65 (52, 79)
70 (54, 88)
0.55
129 (108, 149)
131 (101, 158)
0.82
LVEF (%)
48 (42, 53)
48 (42, 53)
47 (43, 51)
0.88
< 0.001
6-Months follow-up
LVESV (ml)
64 (51, 83)
62 (50, 78)
96 (64, 122)
LVEDV (ml)
130 (110, 155)
129 (109, 148)
147 (115, 184)
0.048
LVEF (%)
49 (43, 56)
50 (44, 56)
41 (35, 44)
< 0.0001
Table 2.
Echocardiographic data of patients without versus with left ventricular dyssynchrony.
Data in parentheses are 25th and 75th percentiles.
LVEDV: left ventricular end-diastolic volume; LVEF: left ventricular ejection fraction; LVESV: left
ventricular end-systolic volume; WMSI: wall motion score index.
*
Patients with
versus
LV dyssynchrony
Mollema
et al
LVwithout
Dilatation
after LV Dyssynchrony
enzymatic infarct size) at baseline. Thes
to be in concordance with the theor
strongly influences the extent of LV dy
The relation between LV dyssynchr
and the occurrence of LV dilatation st
No study thus far has systematically
sumed relationship. The clinical impor
tion was emphasized by White et al,12
that patients who died during follow-u
nificantly higher LV volumes and lowe
vivors. Furthermore, the authors indica
primary predictor of survival after MI.
early identification of patients with subst
after acute MI is of vital importance.
Observations from patients treated w
onstrated that patients with substantial
Figure 1.1
LV dyssynchrony acutely after MI was demonstrated to be
before implantation more often respon
Figure
strongly
related toacutely
changeafter
in LVESV
during
6 months of
tients
without
LV
dyssynchrony
MI was
demonstrated
tofollow-up.
be strongly related to
change
in LVESVsubstantial LV dyssync
who did respond to CRT demonstrated a
during 6 months follow-up.
the procedure). Zhang et al17 investigated 47 patients after
and a decrease in LV volumes, a pro
first acute MI. The majority of patients were treated with
reverse remodeling. Therefore, a relatio
thrombolytic therapy. The authors observed that almost
synchrony and LV dilatation after MI i
70% of patients had LV dyssynchrony. This large difference
In the present study, LV dyssynchro
in prevalence can be (partially) explained by differences in
strongly related to the extent of long-t
mean infarct size between both studies, as infarct size corMore than 90% of the patients with sub
relates with LV dyssynchrony.17 However, no adequate
chrony at baseline developed long-ter
comparison regarding infarct size can be made owing to
during 6 months of follow-up. In con
82
significantly larger in the patients with LV dyssynchrony. Moreover, the LVEF was
significantly lower in the patients with LV dyssynchrony. Importantly, LV remodeling
at 6 months follow-up was demonstrated in 91% of patients with substantial LV
dyssynchrony, whereas only 2% of patients without substantial LV dyssynchrony
had LV remodeling.
Baseline variables and relation with LV dilatation
No significant relation was found between WMSI and the extent of LV dilatation at 6
months follow-up. A modest relation was noted between the peak plasma levels of
CPK (y = -5.25 + 0.003x, n = 124, r = 0.34, p <.001) and the extent of LV dilatation
at 6 months follow-up. A strong relation was observed between the severity of LV
dyssynchrony and the extent of LV dilatation (y = -7.52 + 0.35x, n = 124, r = 0.73, p
<.0001; Figure 1).
Discussion
The main findings of the present study can be summarized as follows: 1) substantial
LV dyssynchrony was present in 18% of patients early after acute myocardial infarction treated with primary percutaneous coronary intervention; 2) patients with substantial LV dyssynchrony more often had multi-vessel coronary artery disease, higher
WMSI and higher peak levels of CPK at baseline; 3) 91% of patients with substantial
LV dyssynchrony developed long-term LV remodeling; and 4) LV dyssynchrony at
baseline was strongly related to the extent of long-term LV dilatation.
In the present study, 18% of the patients demonstrated substantial LV dyssynchrony early after myocardial infarction followed by successful primary percutaneous coronary intervention (TIMI-III flow was achieved in all but 6 patients during
the procedure). Zhang et al. investigated 47 patients after first acute myocardial
infarction.(17) The majority of patients were treated with thrombolytic therapy. The
authors observed that almost 70% of patients had LV dyssynchrony. This large difference in prevalence can (partially) be explained by differences in mean infarct size
between both studies, as infarct size correlates with LV dyssynchrony.(17) However,
no adequate comparison regarding infarct size can be made due to differences in
assessment of infarct size (contrast-enhanced magnetic resonance imaging versus
echocardiographic wall motion score index in the current study). Fahmy et al. demonstrated LV dyssynchrony in 77.5% of 155 patients.(18) Mean WMSI, as a reflector
Chapter 4 : LV dilatation after LV dyssynchrony
of infarct size, was higher in their study population compared to the population in the
current study (1.78 versus 1.47, respectively).
In addition to differences in infarct size, the definition of LV dyssynchrony may
be of importance to explain the difference in prevalence of LV dyssynchrony after
myocardial infarction. Both Zhang et al. and Fahmy et al. used the assessment of the
standard deviation of time to peak systolic velocity (Ts-SD) as expression for LV dyssynchrony, though different cut-off values based on measurements in control patients
were used (Ts-SD >32 ms versus >22.14 ms, respectively).(17,18) In the present
study, LV dyssynchrony was defined as the maximum delay between peak systolic
velocities among the anterior, inferior, septal and lateral walls and a predefined cutoff
of ≥65 ms was used.(6) Of note, assessment of LV dyssynchrony using TDI may
become jeopardized when basal segments are akinetic, although assessment of LV
dyssynchrony was feasible in all patients in the present study.
Both Zhang et al. and Fahmy et al. described the significant impact of infarct size
on LV dyssynchrony.(17,18) They demonstrated that the degree of LV dyssynchrony is
mainly determined by the infarct size. In the present study, patients with substantial
LV dyssynchrony more often had multi-vessel coronary artery disease, higher WMSI
(reflector for infarct size) and higher peak levels of CPK (reflector for enzymatic
infarct size) at baseline. These observations seem in concordance with the theory
that infarct size strongly influences the extent of LV dyssynchrony.
The relation between LV dyssynchrony early after myocardial infarction and the
occurrence of LV dilatation still remains unclear. No study thus far has systematically examined this presumed relationship. The clinical importance of LV dilatation
was emphasized by White et al., who demonstrated that patients who died during
follow-up after myocardial infarction had significantly higher LV volumes and lower
LV ejection fractions than survivors.(12) Furthermore, the authors indicated LVESV
as the primary predictor of survival after myocardial infarction. As a consequence,
early identification of patients with substantial LV dilatation after acute myocardial
infarction is of vital importance.
Observations from patients treated with CRT have demonstrated that patients
with substantial LV dyssynchrony before implantation more often respond to CRT
than patients without substantial LV dyssynchrony.(6-8) Patients who did respond to
CRT demonstrated an increase in LV ejection fraction and a decrease in LV volumes,
a process referred to as reverse remodeling. Therefore, a relation between LV dyssynchrony and LV dilatation after myocardial infarction is presumed.
In the present study, LV dyssynchrony at baseline was strongly related to the extent
of long-term LV dilatation. More than 90% of the patients with substantial LV dyssyn-
83
84
chrony at baseline developed long-term LV remodeling during 6 months follow-up.
In contrast, no significant relation was found between WMSI, which reflects infarct
size, and LV dilatation. Only a modest relation was noted between peak CPK level,
which reflects enzymatic infarct size, and LV dilatation.
Still, at this stage it remains uncertain what mainly determines / predicts LV dilatation; the current data suggest that LV dyssynchrony plays a role, but a causal relation
cannot be concluded yet and further studies are needed.
Conclusion
LV dyssynchrony after acute myocardial infarction is strongly related to LV dilatation and most patients with substantial LV dyssynchrony immediately after acute
myocardial infarction develop LV dilatation during 6 months follow-up. Further large
studies are needed to confirm these findings.
Chapter 4 : LV dilatation after LV dyssynchrony
References
1.
Abraham WT, Hayes DL: Cardiac resynchronization therapy for heart failure. Circulation.
2003;108:2596-603.
2.
Auricchio A, Abraham WT: Cardiac resynchronization therapy: current state of the art: cost
versus benefit. Circulation. 2004;109:300-7.
3.
Jarcho JA: Resynchronizing ventricular contraction in heart failure. N Engl J Med.
2005;352:1594-7.
4.
Leclercq C, Kass DA: Retiming the failing heart: principles and current clinical status of
cardiac resynchronization. J Am Coll Cardiol. 2002;39:194-201.
5.
Leclercq C, Hare JM: Ventricular resynchronization: current state of the art. Circulation.
2004;109:296-9.
6.
Bax JJ, Bleeker GB, Marwick TH, Molhoek SG, Boersma E, Steendijk P, van der Wall EE,
Schalij MJ: Left ventricular dyssynchrony predicts response and prognosis after cardiac
resynchronization therapy. J Am Coll Cardiol. 2004;44:1834-40.
7.
Penicka M, Bartunek J, De Bruyne B, Vanderheyden M, Goethals M, De Zutter M, Brugada
P, Geelen P: Improvement of left ventricular function after cardiac resynchronization therapy
is predicted by tissue Doppler imaging echocardiography. Circulation. 2004;109:978-83.
8.
Sogaard P, Egeblad H, Kim WY, Jensen HK, Pedersen AK, Kristensen BO, Mortensen PT:
Tissue Doppler imaging predicts improved systolic performance and reversed left ventricular remodeling during long-term cardiac resynchronization therapy. J Am Coll Cardiol.
2002;40:723-30.
9.
Fukuda K, Oki T, Tabata T, Iuchi A, Ito S: Regional left ventricular wall motion abnormalities
in myocardial infarction and mitral annular descent velocities studied with pulsed tissue
Doppler imaging. J Am Soc Echocardiogr. 1998;11:841-8.
10.
Liem SS, van der Hoeven BL, Oemrawsingh PV, Bax JJ, van der Bom JG, Bosch J, Viergever
EP, van Rees C, Padmos I, Sedney MI, van Exel HJ, Verwey HF, Atsma DE, van der Velde ET,
Jukema JW, van der Wall EE, Schalij MJ: MISSION!: optimization of acute and chronic care
for patients with acute myocardial infarction. Am Heart J. 2007;153:14-1.
11.
Schiller NB, Shah PM, Crawford M, DeMaria A, Devereux R, Feigenbaum H, Gutgesell H,
Reichek N, Sahn D, Schnittger I, .: Recommendations for quantitation of the left ventricle
by two-dimensional echocardiography. American Society of Echocardiography Committee
on Standards, Subcommittee on Quantitation of Two-Dimensional Echocardiograms. J Am
Soc Echocardiogr. 1989;2:358-67.
85
86
12.
White HD, Norris RM, Brown MA, Brandt PW, Whitlock RM, Wild CJ: Left ventricular
end-systolic volume as the major determinant of survival after recovery from myocardial
infarction. Circulation. 1987;76:44-51.
13.
Yu CM, Fung JW, Chan CK, Chan YS, Zhang Q, Lin H, Yip GW, Kum LC, Kong SL, Zhang Y,
Sanderson JE: Comparison of efficacy of reverse remodeling and clinical improvement for
relatively narrow and wide QRS complexes after cardiac resynchronization therapy for heart
failure. J Cardiovasc Electrophysiol. 2004;15:1058-65.
14.
Broderick TM, Bourdillon PD, Ryan T, Feigenbaum H, Dillon JC, Armstrong WF: Comparison
of regional and global left ventricular function by serial echocardiograms after reperfusion in
acute myocardial infarction. J Am Soc Echocardiogr. 1989;2:315-23.
15.
Sawada SG, Segar DS, Ryan T, Brown SE, Dohan AM, Williams R, Fineberg NS, Armstrong
WF, Feigenbaum H: Echocardiographic detection of coronary artery disease during dobutamine infusion. Circulation. 1991;83:1605-14.
16.
Bleeker GB, Schalij MJ, Molhoek SG, Verwey HF, Holman ER, Boersma E, Steendijk P, van
der Wall EE, Bax JJ: Relationship between QRS duration and left ventricular dyssynchrony
in patients with end-stage heart failure. J Cardiovasc Electrophysiol. 2004;15:544-9.
17.
Zhang Y, Chan AK, Yu CM, Lam WW, Yip GW, Fung WH, So NM, Wang M, Sanderson JE:
Left ventricular systolic asynchrony after acute myocardial infarction in patients with narrow
QRS complexes. Am Heart J. 2005;149:497-503.
18.
Fahmy EM, Mahfouz BH, Helmy Abo ET, Shawky AE: Asynchrony of left ventricular systolic
performance after the first acute myocardial infarction in patients with narrow QRS complexes: Doppler tissue imaging study. J Am Soc Echocardiogr. 2006;19:1449-57.
Chapter 5
Left ventricular dyssynchrony acutely
after myocardial infarction predicts
left ventricular remodeling
Sjoerd A. Mollema
Su San Liem
Matthew S. Suffoletto
Gabe B. Bleeker
Bas L. van der Hoeven
Nico R. van de Veire
Eric Boersma
Eduard R. Holman
Ernst E. van der Wall
Martin J. Schalij
John Gorcsan 3rd
Jeroen J. Bax
J Am Coll Cardiol 2007;50:1532–40
88
Abstract
Objectives
We sought to identify predictors of left ventricular (LV) remodeling after acute myocardial infarction.
Background
LV remodeling after myocardial infarction is associated with adverse long-term prognosis. Early identification of patients prone to LV remodeling is needed to optimize
therapeutic management.
Methods
A total of 178 consecutive patients presenting with acute myocardial infarction who
underwent primary percutaneous coronary intervention were included. Within 48
hours of intervention, two-dimensional echocardiography was performed to assess
LV volumes, LV ejection fraction (LVEF), wall motion score index (WMSI), left atrial
(LA) dimension, E/E’ ratio and severity of mitral regurgitation. LV dyssynchrony was
determined using speckle-tracking radial strain analysis. At 6 months follow-up, LV
volumes, LVEF and severity of mitral regurgitation were reassessed.
Results
Patients showing LV remodeling at 6 months follow-up (20%) had comparable baseline characteristics to patients without LV remodeling (80%), except for higher peak
troponin T levels (p < 0.001), peak creatine phosphokinase levels (p < 0.001), WMSI
(p < 0.05), E/E’ ratio (p < 0.05) and a larger extent of LV dyssynchrony (p < 0.001).
Multivariable analysis demonstrated that LV dyssynchrony was superior in predicting
LV remodeling. Receiver-operating characteristic (ROC) curve analysis demonstrated
that a cutoff value of 130 ms for LV dyssynchrony yields a sensitivity of 82% and a
specificity of 95% to predict LV remodeling at 6 months follow-up.
Conclusions
LV dyssynchrony immediately after acute myocardial infarction predicts LV remodeling at 6 months follow-up.
Chapter 5 : LV dyssynchrony predicts remodeling after AMI
Introduction
The occurrence of left ventricular (LV) dilatation after acute myocardial infarction is
not uncommon. Giannuzzi et al. noted severe LV remodeling 6 months after infarction
in 16% of the patients.(1) The clinical importance of LV remodeling was emphasized
by White et al., who demonstrated that patients who died during follow-up after myocardial infarction had significantly higher LV volumes and lower LV ejection fractions
(LVEF) than survivors.(2) Furthermore, they indicated LV end-systolic volume (LVESV)
as the primary predictor of survival after myocardial infarction. As a consequence,
early identification of patients with LV remodeling after acute myocardial infarction
is of vital importance.
Previous studies demonstrated relations between preexisting hypertension,
infarct size and anterior location of the infarct, and the occurrence of LV remodeling
after myocardial infarction.(3-6) Recently, Zhang et al. demonstrated that myocardial
infarction has a significant impact on LV synchronicity and that the degree of LV
dyssynchrony is mainly determined by the infarct size.(7)
In this work, we hypothesize that LV dyssynchrony occurring early after myocardial
infarction may predict LV remodeling at 6 months follow-up. In the current study,
the relation between LV dyssynchrony, as assessed by speckle-tracking radial strain
analysis, occurring early after myocardial infarction and LV remodeling at 6 months
follow-up was evaluated.
Methods
Patients
A total of 194 consecutive patients, admitted with an acute myocardial infarction,
were evaluated. To acquire a homogenous study population, patients who were
treated conservatively (n = 6) or who underwent thrombolysis (n = 4) or coronary
artery bypass grafting (n = 2) in the acute setting were excluded from the study. Four
patients died during follow-up and therefore did not have the follow-up assessment.
These patients were excluded from the study. The final study population comprised
178 patients who all underwent primary percutaneous coronary intervention.
Study protocol
Two-dimensional (2D) echocardiography was performed within 48 hours of admission
(baseline) and at 6 months follow-up. At baseline, 2D echocardiography was used to
89
90
assess LV volumes, LVEF, wall motion score index (WMSI), left atrial (LA) dimension,
the mitral inflow peak early velocity (E)/mitral annular peak early velocity (E’), or
E/E’ ratio, and severity of mitral regurgitation. LV dyssynchrony was quantified using speckle-tracking radial strain analysis. At 6 months follow-up, LV volumes, LVEF
and severity of mitral regurgitation were reassessed.(8) The study was approved
by the institutional ethics committee, and informed consent was obtained from all
patients.
Echocardiography
Patients were imaged in the left lateral decubitus position using a commercially available system (Vivid Seven, General Electric-Vingmed, Milwaukee, Wisconsin, USA).
Standard images were obtained using a 3.5-MHz transducer, at a depth of 16 cm in
the parasternal (long- and short-axis images) and apical (2- and 4-chamber images)
views. Standard 2D and color Doppler data, triggered to the QRS complex, were
saved in cine-loop format. LV volumes (end-systolic and end-diastolic) and LVEF were
calculated from the conventional apical 2- and 4-chamber images, using the biplane
Simpson’s technique.(9) LA dimension was measured at end-systole using M-mode.
(10)
Pulsed-wave mitral inflow Doppler was obtained by placing the Doppler sample
volume between the tips of the mitral leaflets. The E/E’ratio was obtained by dividing
E by E’ at the basal septal segment.(11)
Severity of mitral regurgitation was graded semiquantitatively from color-flow Doppler data in the conventional parasternal long-axis and apical views. Mitral regurgitation was characterized as: mild = 1+ (jet area/left atrial area < 10%), moderate = 2+
(jet area/left atrial area 10% to 20%), moderately severe = 3+ (jet area/left atrial area
20% to 45%), and severe = 4+ (jet area/left atrial area > 45%).(12)
The LV was divided into 16 segments. A semiquantitative scoring system (1,
normal; 2, hypokinesia; 3, akinesia; 4, dyskinesia) was used to analyze each study.
Global WMSI was calculated by the standard formula: sum of the segment scores
divided by the number of segments scored.(13,14)
All echocardiographic measurements were obtained by 2 independent observers
without knowledge of the clinical status of the patient. Inter- and intra-observer
agreement for assessment of LV volumes were 90% and 93% for LVESV, and 92%
and 93% for left ventricular end-diastolic volume (LVEDV), respectively.
Chapter 5 : LV dyssynchrony predicts remodeling after AMI
Speckle-tracking radial strain analysis
Radial strain was assessed on LV short-axis images at the papillary muscle level,
using speckle-tracking analysis.(15,16) This novel technique tracks frame-to-frame
movement of natural acoustic markers on standard gray scale images of the myocardium. Off-line analysis of radial strain was performed on digitally stored images.
The speckle-tracking software makes use of natural acoustic markers, or speckles,
that are present on standard ultrasound tissue images. The software automatically
subdivides the short-axis images of the LV into blocks of approximately 20 to 40
pixels containing stable patterns of speckles. These speckles move together with
the myocardium, and can be followed accurately from frame-to-frame (frame rate
varied from 40 to 80 frames/s). A dedicated algorithm tracks the location of the
speckles throughout the cardiac cycle, using correlation criteria and sum of absolute
differences.(15) Local 2D tissue velocity vectors are then derived from the spatial
and temporal data of each speckle. Myocardial strain can then be assessed from
temporal differences in the mutual distance of neighboring speckles. The change
in length / initial length of the speckle pattern over the cardiac cycle can be used to
calculate radial strain, with myocardial thickening represented as positive strain, and
myocardial thinning as negative strain.
To assess regional LV strain, a region of interest was manually drawn at the
endocardial-cavity boundary on a single frame at end-systole. The speckle-tracking
software then automatically created a second larger circle at the epicardial level,
such that the region of interest spans the LV myocardium. The automatically created circle width could be adjusted manually by the operator, depending on the LV
wall thickness. Starting at the selected frame at end-systole, the speckle-tracking
algorithm automatically tracked the region of interest and calculated radial strain
throughout the cardiac cycle. Ultimately, the user-defined region of interest covered
the entire myocardial wall during the entire cardiac cycle.
Finally, the traced endocardium was automatically divided into 6 standard segments: septal, anteroseptal, anterior, lateral, posterior, and inferior, respectively. The
software provided a score for all 6 segments marked in green for good quality and
in red for poor quality. Signals from all 6 segments had to be of good quality in
order to be able to adequately determine radial strain. Time-strain curves for all 6
segments were then constructed and time from QRS onset to peak radial strain was
obtained. Consequently, the location of the earliest and latest activated segments
was determined. Inter- and intra-observer agreement for assessment of the absolute
difference in time-to-peak radial strain for the earliest versus the latest activated
segments was 87% both.
91
92
Statistical analysis
Most continuous variables were not normally distributed (as evaluated by Kolmogorov-Smirnov tests). For reasons of uniformity, summary statistics for all continuous variables are therefore presented as medians together with the 25th and 75th
percentiles. Categorical data are summarized as frequencies and percentages. LV
remodeling at 6 months follow-up was defined as an absolute increase in LVESV of
at least 15%.(2,17,18) Differences in baseline characteristics between patients who
developed LV remodeling versus those who did not were analyzed using WilcoxonMann-Whitney tests, Chi-square tests with Yates’ correction or Fisher’s exact tests,
as appropriate. Echocardiographic changes that occurred over time (LVESV, LVEDV
and LVEF) were studied by subtracting the baseline values from the values at 6
months follow-up for each individual patient. These changes were then summarized
as median values together with 25th and 75th percentiles. Differences in changes
between patients with and without LV remodeling were studied by applying the
Wilcoxon-Mann-Whitney test.
LV dyssynchrony was defined as the absolute difference in time-to-peak radial
strain for the earliest versus the latest activated segments. Univariable and multivariable linear regression analyses were performed to evaluate the relation between LV
dyssynchrony at baseline and LVESV at 6 months follow-up, as well as the change
in LVESV (indicating the magnitude of LV remodeling) after 6 months follow-up
compared to the baseline value. The number of covariates in the final multivariable
regression models was limited via a backward selection procedure, and all variables
with a p value < 0.15 were maintained.
Additionally, univariable and multivariable logistic regression analyses were applied
(with a similar model-building process), relating LV dyssynchrony (continuous variable) to LV remodeling (dichotomous outcome). We realize that dichotomization of a
continuous variable (LVESV) will result in loss of statistical power to reveal relevant
relations. Still, these analyses are useful from clinical point of view, as patients with
a change in LVESV ≥ 15% constitute a cohort at increased risk of adverse events.
(17,18) Crude and adjusted odds ratios with their corresponding 95% confidence
intervals are reported.
LV dyssynchrony was associated with LV remodeling. To determine the ‘optimal’
threshold of LV dyssynchrony for the prediction of LV remodeling, receiver operating
characteristic (ROC) curve analysis was applied. This optimum was defined as the
value for which the sum of sensitivity and specificity was maximized. As a result
of the cut off p value (< 0.15) based on which covariates were included in the final
multivariable regression model, the absoluteness of the obtained cut off value for LV
Chapter 5 : LV dyssynchrony predicts remodeling after AMI
dyssynchrony can be discussed. All statistical tests were 2-sided. For all tests, a p
value < 0.05 was considered statistically significant.
Results
Baseline data of the study population
The study sample consisted of 178 patients (140 men, median age 61 (25th, 75th
percentiles: 53, 70) years). During primary percutaneous coronary intervention,
Thrombolysis In Myocardial Infarction flow grade III flow was obtained in all but 7
(4%) patients. The infarct-related artery was the left anterior descending coronary
artery (LAD) in 92 (52%) patients, the left circumflex coronary artery (LCX) in 40
(22%) and the right coronary artery (RCA) in 44 (25%) patients. Multi-vessel disease
was present in 95 (53%) patients.
At baseline, median WMSI was 1.50 (1.31, 1.63). Median peak cardiac troponin T
and creatine phosphokinase levels were 6.5 μg/L (2.3, 10.3 μg/L) and 2133 U/L (1006,
3570 U/L), respectively. Eight (4%) patients had a previous myocardial infarction.
Median LVESV and LVEDV were 66 ml (54, 83 ml) and 128 ml (106, 150 ml), respectively, whereas median LVEF was 47% (42%, 52%). Median LA dimension was
38 mm (35, 42 mm). The median E/E’ ratio at baseline was 12.4 (9.8, 16.2). In 8 (4%)
patients moderate to severe mitral regurgitation (≥ grade 2+) was observed.
Median LV dyssynchrony, as measured by speckle-tracking radial strain analysis,
was 47 ms (13, 106 ms). In 14 (8%) of patients assessment of LV dyssynchrony using
speckle-tracking radial strain analysis was not feasible due to poor quality of the 2D
echocardiographic images.
LV remodeling at 6 months follow-up
In the entire patient population, median LVESV at 6 months follow-up was 63 ml (48,
80 ml), median LVEDV was 128 ml (104, 152 ml),whereas median LVEF was 49%
(43%, 56%). The number of patients with moderate to severe mitral regurgitation (≥
grade 2+) was 13 (7%) at 6 months follow-up.
Patients were then divided into patients with LV remodeling (n = 36, 20%) and
without LV remodeling (n = 142, 80 %) at 6 months follow-up. Baseline patient characteristics of these 2 groups are summarized in Table 1. At baseline, no significant
differences were observed between the patients with and without LV remodeling
except for the fact that peak levels of cardiac enzymes (reflecting enzymatic infarct
size) were higher in the patients with LV remodeling.
93
No LV
Remodeling
(n = 142)
LV
Remodeling
(n = 36)
p Value
61 (53, 69)
67 (56, 72)
NS
Gender (M/F, %)
110/32 (77/23)
30/6 (83/17)
NS
Previous MI (%)
6 (4)
2 (6)
NS
94 ± 13
96 ± 15
NS
6 (4)
2 (6)
NS
94
Age (yrs)*
QRS duration baseline (ms)
Wide QRS (≥120 ms, %)
Risk factors for CAD
Diabetes (%)
13 (9)
4 (11)
NS
Hypertension (%)
43 (30)
12 (33)
NS
Hyperlipidemia (%)
27 (19)
6 (17)
NS
Smoking (%)
76 (54)
16 (44)
NS
Family history of CAD (%)
Peak cTnT level (μg/L)*
Peak CPK level (U/L)*
64 (45)
11 (31)
NS
5.2 (1.9, 9.8)
10.1 (6.3, 15.3)
< 0.001
1893 (868, 3236)
3877 (1816, 5597)
< 0.001
22 (61)
NS
Infarct-related artery
LAD (%)
70 (49)
RCA (%)
38 (27)
6 (17)
NS
LCX (%)
33 (23)
7 (19)
NS
Multi-vessel disease (%)
73 (51)
22 (61)
NS
Medication at 6 months follow-up
Beta-blocker (%)
126 (89)
34 (94)
NS
ACE-inhibitor/ARB (%)
139 (98)
35 (97)
NS
Anti-coagulants (%)
142 (100)
36 (100)
NS
Statin (%)
137 (96)
36 (100)
NS
Table 1. Baseline characteristics of patients without versus with left ventricular remodeling (n = 178).
ACE: angiotensin-converting enzyme; ARB: angiotensin receptor blocker; CAD: coronary artery
disease; CPK: creatine phosphokinase; cTnT: cardiac troponin T; LAD: left anterior descending
coronary artery; LCX: left circumflex coronary artery; MI: myocardial infarction; RCA: right
coronary artery. * Values are expressed as n (25th, 75th percentiles).
The echocardiographic data of the patients with and without LV remodeling are
shown in Table 2. At baseline, no significant differences in LV volumes and LVEF were
observed. At 6 months follow-up however, the LVESV (according to the definition of
LV remodeling) and LVEDV were significantly larger in the patients with LV remodeling. Moreover, the LVEF was significantly lower in the patients with LV remodeling.
Chapter 5 : LV dyssynchrony predicts remodeling after AMI
No LV
Remodeling
(n = 142)
LV
Remodeling
(n = 36)
p Value
Baseline
LVESV (ml)
64 (54, 70)
76 (54, 91)
NS
LVEDV (ml)
128 (106, 148)
139 (108, 160)
NS
LVEF (%)
WMSI
LA dimension (mm)
E/E’ ratio
MR (moderate-severe, %)
LV dyssynchrony (ms)
47 (42, 52)
47 (42, 51)
NS
1.50 (1.25, 1.63)
1.56 (1.38, 1.69)
< 0.05
38 (34, 42)
41 (37, 43)
NS
11.7 (9.7, 15.7)
14.8 (12.3, 18.4)
< 0.05
6 (4)
2 (6)
NS
31 (12, 77)
148 (134, 180)
< 0.001
6 Months follow-up
LVESV (ml)
58 (46, 74)
112 (70, 130)
< 0.001*
LVEDV (ml)
121 (103, 144)
170 (127, 202)
< 0.001
LVEF (%)
52 (46, 57)
39 (34, 44)
< 0.001
MR (moderate-severe, %)
7 (5)
6 (17)
< 0.05
Table 2. Echocardiographic parameters of patients without versus with left ventricular remodeling.
Values are expressed as n (25th, 75th percentiles) unless otherwise indicated. *Per definition
E/E’: mitral inflow peak early velocity (E) / mitral annular peak early velocity (E’); LA: left atrial;
LVEDV: left ventricular end-diastolic volume; LVEF: left ventricular ejection fraction; LVESV: left
ventricular end-systolic volume; MR: mitral regurgitation; WMSI: wall motion score index.
Moderate to severe mitral regurgitation (≥ grade 2+) was more often present in the
patients with LV remodeling.
At baseline, WMSI, E/E’ ratio and LV dyssynchrony (Figure 1) were the only baseline
echocardiographic variables that were significantly different between patients with
and without LV remodeling. In the patients with LV remodeling median WMSI was
1.56 (1.38, 1.69), whereas median WMSI in patients without LV remodeling was 1.50
(1.25, 1.63; p < 0.05). The median value for E/E’ ratio in patients with LV remodeling
measured 14.8 (12.3, 18.4) and the patients without LV remodeling had a median
E/E’ ratio of 11.7 (9.7, 15.7; p < 0.05).
Median LV dyssynchrony was 148 ms (134, 180 ms) in the patients with LV remodeling, compared with 31 ms (12, 77 ms) in the patients without LV remodeling (p <
0.001). The individual data are demonstrated in Figure 2.
Figure 3 shows the prevalence for each LV segment as being the latest activated
segment in the patients with LV remodeling after 6 months of follow-up. According
to the high prevalence of the LAD as infarct-related artery, the anteroseptal and
95
1536
Mollema et al.
LV Dyssynchrony Predicts Remodeling After AMI
JACC Vol. 50, No. 16, 2007
October 16, 2007:1532–40
96
Figure 1
Extent of LV Dyssynchrony Was Significantly Larger in Patients
With LV Remodeling During Follow-Up Versus Those Without LV Remodeling
Left panel demonstrates time-strain curves of a patient without dyssynchrony at baseline. This patient did not show left ventricular (LV) remodeling du
ventricular end-systolic volume [LVESV] was 84 vs. 73 ml, baseline vs. 6-month follow-up). Right panel demonstrates time-strain curves of a patient w
chrony at baseline (earliest activated segments: purple, green, and dark-blue, latest activated segments: light-blue, yellow, and red). This patient sho
during follow-up (LVESV was 77 vs. 122 ml, baseline vs. 6-month follow-up).
Figure 1.
Extent of LV Dyssynchrony Was Significantly Larger in Patients
Figure
1 of
Extent
LVLVdyssynchrony
was
significantly
larger
in patients
with
With
Remodeling During
Follow-Up
Versus Those
Without
LV Remodeling
LV remodeling during follow-up
versus
those
without
LV
remodeling
Left panel
demonstrates
time-strain
curves of a patient without
baseline.
patientms)
did not in
show left ventricular
(LV) remodeling during
follow-up (left
Median
LV
dyssynchrony
wasdyssynchrony
148
msat follow-up).
(134,This
180
infarct-related
artery,
the anteroseptal and
ventricular
end-systolic
volume [LVESV] was 84
vs. 73 ml, baseline
vs. 6-month
Rightwithout
panel demonstrates
time-strain curves
a patient withThis
LV dyssynLeft panel
demonstrates
time-strain
curves
of a patient
dyssynchrony
at ofbaseline.
chrony
baseline (earliest
activated
purple, green, and
dark-blue, latestwith
activated31
segments:
and red). This
patient
showed LV remodeling
the atpatients
with
LVsegments:
remodeling,
compared
ms light-blue,
(12, yellow,ments
are
activated
late
in a considerable pr
patient
did
notwasshow
leftml,ventricular
(LV)follow-up).
remodeling during follow-up (left ventricular end-systolic
during
follow-up
(LVESV
77 vs. 122
baseline vs. 6-month
77
ms)
in
the
patients
without
LV
remodeling
(p
�
0.001).
with LV remodeling.
volume (LVESV) was 84 vs. 73 ml, baseline vs. 6-month follow-up). Rightpatients
panel demonstrates
The
individual
data
are demonstrated
in Figure
2.
Determinants
of LV
LVsegremodeling. Patien
time-strain
curves
of
a
patient
with
LV
dyssynchrony
at
baseline
(earliest
activated
segments:
Median LV dyssynchrony was 148 ms (134, 180 ms) in
infarct-related artery, the anteroseptal
and septal
Figure
shows
the prevalence
for
LV
segment
asyellow,
dyssynchrony
thepurple,
patients
with3LV
remodeling,
compared
31 mseach
(12,
green,
and
dark-blue,
latest with
activated
segments:
light-blue,
red). LV
Thisproportion
patient of the at baseline had a
ments
are activated
late extensive
in and
a considerable
77being
ms) in the
patients
without
LV remodeling
(p in
�
0.001).
with
LV remodeling.
the
latest
activated
segment
the patients
with
showed
LV
remodeling
during
follow-up
(LVESV
waspatients
77 vs.
122 LV
ml,
baseline
vs. 6-monthfollow-up
follow-up). (Fig. 4, left panel)
at 6-month
The individual data are demonstrated in Figure 2.
Determinants
of LV remodeling. Patients with more
remodeling
after 6-month follow-up. According
to the high
remained
adjustment
Figure 3 shows the prevalence for each LV segment as
extensive LV dyssynchrony
at baseline after
had a larger
LVESV for the baseline
prevalence
of
the
left
anterior
descending
coronary
artery
as
being the latest activated segment in the patients with LV
at 6-month follow-up (Fig.
panel). This
relation T, and history o
level4,ofleftcardiac
troponin
remodeling after 6-month follow-up. According to the high
remained after adjustment
for the
baseline LVESV,
(these
variables
had
a
ppeak
value �0.15 in the fi
prevalence of the left anterior descending coronary artery as
level of cardiac troponin T, and history of hypertension
2
R value
thefinal
final
model
(these variables had a p value
�0.15 of
in the
model;
the was 0.73). Each
R2 value of the final model
was
0.73).
Each
10-ms
increase
in LV dyssynchrony was associated with a
in LV dyssynchrony was associated with a 1.2 ml (95%
30
20
Percentage of patients
Percentage of patients
30
10
0
Lateral
Inferior
Anterior
20
10
Posterior
Anteroseptal
Septal
LV segment of latest activation
Figure 2
LV Dyssynchrony in Patients Without
Versus With LV Remodeling at 6-Month Follow-Up
Box-whisker plot indicates median, first quartile, third quartile, and range.
Median left ventricular (LV) dyssynchrony was significantly higher (p � 0.001)
in the patients with LV remodeling versus without LV remodeling (148 ms
[134, 180 ms] vs. 31 ms [12, 77 ms], respectively).
Figure 3
Distribution of Latest Activated
0
Lateral
Inferior
LV Segments in Patients With LV
Remodeling
Anterior
Posterior
Anteros
According to the high prevalence of the left anterior descending coronary artery
LV segment of latest activation
(LAD) as infarct-related artery, the anteroseptal and septal left ventricular (LV)
segments are activated late in a considerable proportion of the patients with
LV remodeling.
Figure 2.
LV Dyssynchrony in Patients Without
Distribution of Latest Activated
Figure
2
Figure 3
LV
dyssynchrony
in patients
versus
LV remodeling
Versus
With LVwithout
Remodeling
atwith
6-Month
Follow-Up at 6-Month follow-up LV Segments in Patients With LV Re
Box-whisker plot indicates median, first quartile, third quartile, and range. Median left ventricular
Box-whisker
plot indicates
first quartile,
third
and
According
to the high
prevalence of the left anterior descend
(LV)
dyssynchrony
was median,
significantly
higher
(p quartile,
< 0.001)
inrange.
the patients with LV
remodeling
versus
Median left ventricular (LV) dyssynchrony was significantly higher (p � 0.001)
(LAD) as infarct-related artery, the anteroseptal and septal le
without
LV remodeling (148 ms (134, 180 ms) vs. 31 ms (12, 77 ms), respectively).
in the patients with LV remodeling versus without LV remodeling (148 ms
[134, 180 ms] vs. 31 ms [12, 77 ms], respectively).
segments are activated late in a considerable proportion of
LV remodeling.
ollow-Up
range.
p � 0.001)
148 ms
remained after adjustment for the baseline LVESV, peak
level of cardiac troponin T, and history of hypertension
(these variables had a p value �0.15 in the final model; the
Chapter
5 : LV dyssynchrony
predicts remodeling after AMI
R2 value of the final model was 0.73).
Each
10-ms increase
in LV dyssynchrony was associated with a 1.2 ml (95%
97
30
Percentage of patients
to the high
ry artery as
20
10
0
Lateral
Inferior
Anterior
Posterior
Anteroseptal
Septal
LV segment of latest activation
Figure 3.
Activated
Distribution
latest activatedof
LV Latest
segments
in patients with LV remodeling
Figure 3 of Distribution
LVhigh
Segments
Withdescending
LV Remodeling
According to the
prevalenceinofPatients
the left anterior
coronary artery (LAD) as infarctrelated artery, the anteroseptal and septal left ventricular (LV) segments are activated late in a
According to the
high prevalence
of the with
left anterior
descending coronary artery
considerable
proportion
of the patients
LV remodeling.
(LAD) as infarct-related artery, the anteroseptal and septal left ventricular (LV)
segments are activated late in a considerable proportion of the patients with
LV remodeling.
septal LV segments are activated late in a considerable proportion of the patients
with LV remodeling.
Determinants of LV remodeling
Patients with more extensive LV dyssynchrony at baseline had a higher LVESV at
6 months follow-up (Figure 4, left panel). This relation remained after adjustment
for the baseline LVESV, peak level of cardiac troponin T and history of hypertension
(these variables had a p value < 0.15 in the final model; the R2 value of the final
model was 0.73). Each 10 ms increase in LV dyssynchrony is associated with a
1.2 ml (95% confidence interval (CI) 0.8 to 1.6 ml; p < 0.001) larger LVESV at 6
months.
Patients with more extensive LV dyssynchrony at baseline also had a higher change
in LVESV in the 6 months period of follow-up (Figure 4, right panel). Of note, the
extent of LV dyssynchrony was largest in patients with significant LV remodeling
(increase in LVESV ≥15%) (Figure 5). After adjustment for the baseline LVESV, peak
level of cardiac troponin T and history of hypertension, each 10 ms increase in LV
dyssynchrony is associated with an 1.2 ml (95% CI 0.8 to 1.6 ml) higher change in
98
LVESV (note that the ‘change model’ had similar covariables as the ‘absolute value’
model; the R2 value of the final ‘change model’ was 0.41).
LV dyssynchrony at baseline was also associated with an increased risk of LV remodeling at 6 months follow-up. Table 3 presents the univariable relations between
a range of clinical and echocardiographic variables, and the incidence of LV remodeling at 6 months follow-up. Among the variables studied, LV dyssynchrony showed
the strongest relation. This relation remained after adjustment for the peak level of
cardiac troponin T (p = 0.015 in the final model), hypertension (p = 0.10), baseline
LVESV (p = 0.14), and baseline LVEDV (p = 0.14). Each millisecond increase in LV
Baseline Variable
Odds ratio
95% Confidence interval
p Value
LV dyssynchrony (per ms)
1.03
1.02 – 1.05
< 0.001
Peak cTnT level (per μg/L)
1.14
1.07 – 1.22
< 0.001
Peak CPK level (per U/L)
1.44
1.20 – 1.72
< 0.001
E/E’ ratio
1.09
1.01 – 1.17
0.019
WMSI
8.11
1.39 – 47.0
0.020
Age (per year)
1.03
1.00 – 1.07
0.073
LA dimension (per mm)
1.07
0.99 – 1.15
0.081
LVESV (per ml)
1.02
1.00 – 1.03
0.090
LVEDV (per ml)
1.01
1.00 – 1.02
0.094
Positive family history
0.54
0.25 – 1.17
0.12
Culprit vessel LAD
1.96
0.73 – 5.26
0.18
QRS duration (per ms)
1.01
0.99 – 1.04
0.39
Gender
1.45
0.56 – 3.80
0.45
Number of diseased vessels
1.20
0.78 – 1.97
0.46
MR
1.19
0.66 – 2.15
0.57
Culprit vessel LCX
1.34
0.41 – 4.40
0.63
LVEF (per %)
0.99
0.94 – 1.04
0.72
Diabetes
1.24
0.38 – 4.06
0.72
Hypertension
1.15
0.53 – 2.51
0.72
Previous MI
1.33
0.26 – 6.90
0.73
Hyperlipidemia
0.85
0.32 – 2.25
0.75
Smoking
0.94
0.44 – 1.98
0.86
Table 3. Relation between clinical and echocardiographic parameters and LV remodeling.
Abbreviations as in Tables 1 and 2.
Change i
LVE
50
-25
0
-50
0
100
200
300
400
0
LV dyssynchrony (ms)
100
200
300
400
LV dyssynchrony (ms)
Chapter 5 : LV dyssynchrony predicts remodeling after AMI
JACC Vol. 50, No. 16, 2007
Figure 4
October 16, 2007:1532–40
Mollema
et al.
1537
Correlation Between LV Dyssynchrony at Baseline and LVESV and Change in LVESV at
6-Month
Follow-Up
LV Dyssynchrony Predicts Remodeling After AMI
200
y = 55.4 + 0.20x
2
Change in LVESV (ml) at 6 months follow-up
A significant relation existed between baseline left ventricular (LV) dyssynchrony and absolute
value for left ventricular end-systolic volume (LVESV) (left panel) and change in LVESV (right panel) at follow-up.
100
99
y = -8.9 + 0.15x
2
LVESV (ml) at 6 months follow-up
= 0.25
R = 0.21
confidence interval [CI] 0.8 to 1.6 ml;
p � 0.001) larger
tween a range ofR clinical
and echocardiograp
75
LVESV150at 6 months.
and the incidence of LV remodeling at 6-mon
Patients with more extensive LV dyssynchrony at baseline
Among the variables studied, LV dyssynchron
50
also had a higher change in LVESV in the 6-month period
strongest relation. This relation remained aft
100
of follow-up
(Fig. 4, right panel). Of note, the extent25of LV
for the peak level of cardiac troponin T (p �
dyssynchrony was largest in patients with significant
LV
final model), hypertension (p � 0.10), bas
0
remodeling
(increase in LVESV �15%) (Fig. 5). After
(p � 0.14), and baseline LVEDV (p �
50
adjustment for the baseline LVESV, peak level of-25cardiac
millisecond increase in LV dyssynchrony w
troponin T and history of hypertension, each 10-ms increase in
with a 3% increased risk of LV remodeling (
0
-50
LV dyssynchrony
was
associated
with
a
1.2
ml
(95%
CI
0.8
to
per 300
ms; 95%400CI 1.02 to 1.05; p �
0
100
200
300
400
0
100ratio 1.03
200
Relation
Echocardiographic
Between
Clinical
Parameters
and and LV Remodeling
1.6 ml) higher change
in
LVESV
(note
that
the
“change
LV dyssynchrony (ms)
LV dyssynchrony (ms)
Relation Between Clinical and
model” had similar covariables as the “absolute value” model;
Table 3
Echocardiographic Parameters and LV
4. of the final “change model” was 0.41).
the Figure
R2 value
Figure 4
Correlation
Between
LV Dyssynchrony at Baseline and LVESV and Change in LVESV at 6-Month Follow-Up
Correlation between LV dyssynchrony at baseline and LVESV and change in LVESV at 6-Month
Left ventricular dyssynchrony at baseline was also asso95% Confide
follow-up
A significant relation
existed
between
left ventricular
dyssynchrony
and absolute
Baseline Variable
Odds Ratio
Interval
ciated
with
anbaseline
increased
risk of(LV)
LV
remodeling
at 6-month
A
significant
relation
existed
between
baseline
left
ventricular
(LV)
dyssynchrony
and
absolute
value
for
value for left ventricular end-systolic volume (LVESV) (left panel) and change in LVESV (right panel) at follow-up.
LV dyssynchrony, per ms
1.03
1.02–0.05
follow-up.
Table
3
presents
the
univariable
relations
beleft ventricular end-systolic volume (LVESV) (left panel) and change in LVESV (right panel) at follow-up.
Peak cTnT level, per �g/l
1.14
Peak CPK level, per U/l
1.44
1.07–1.22
LV dyssynchrony (ms)
1.20–1.72
confidence interval [CI] 0.8 to 1.6 ml; p � 0.001) larger
tween a range of clinical and echocardiographic variables,
200
E/E= ratio
1.09
1.01–1.17
LVESV at 6 months.
and the incidence of LV remodeling at 6-month follow-up.
WMSI
8.11
1.39–47.0
Patients with more extensive LV dyssynchrony at baseline
Among the variables
studied, LV dyssynchrony
showed
the
Age, per year
1.03
1.00–1.07
150 in LVESV in the 6-month period
also had a higher change
strongest relation.
This
relation
remained
after
adjustment
LA dimension, per mm
1.07
0.99–1.15
of follow-up (Fig. 4, right panel). Of note, the extent of LV
for the peak levelLVESV,
of cardiac
troponin T (p1.02� 0.015 in
the
per ml
1.00–1.03
dyssynchrony was largest in patients with significant LV
final model), hypertension
baseline LVESV
LVEDV, per ml (p � 0.10), 1.01
1.00–1.02
100
remodeling (increase in LVESV �15%) (Fig. 5). After
(p � 0.14), and
baseline
LVEDV (p 0.54
� 0.14). 0.25–1.17
Each
Positive
family history
Culprit vessel
LAD dyssynchrony
1.96was associated
0.73–5.26
adjustment for the baseline LVESV, peak level of cardiac
millisecond increase
in LV
QRS duration,
ms remodeling
1.01(adjusted0.99–1.04
troponin T and history of50 hypertension, each 10-ms increase in
with a 3% increased
risk ofperLV
odds
Gender
LV dyssynchrony was associated with a 1.2 ml (95% CI 0.8 to
ratio 1.03 per ms;
95% CI 1.02 to 1.05; p1.45
� 0.001). 0.56–3.80
ofand
diseased
1.20
0.78–1.97
Relation Between Number
Echocardiographic
Clinical
Parameters
andvessels
LV Remodeling
1.6 ml) higher change in LVESV (note that the “change
0
MR
1.19
0.66–2.15
ESV as
=
ESV value”
↓ the ESV
↑ < 10% ESV
↑ 10-15% ESV ↑ ≥ 15%
Relation Between Clinical and
model” had similar covariables
“absolute
model;
Table 3
Culprit vessel LCXParameters and1.34
0.41–4.40
2
n = 36
Echocardiographic
LV
Remodeling
n = 39
n=8
n = 92
n=3
the R value of the final “change model” was 0.41).
LVEF, per %
0.99
0.94–1.04
Change
in
LVESV
relative
to
baseline
Left ventricularFigure
dyssynchrony
at baseline was also asso95% Confidence
5.
Diabetes
1.24
0.38–4.06
Baseline Variable
Odds Ratio
Interval
p Value
ciated with an increased
riskofofLVLV
remodeling
at 6-month
The extent
dyssynchrony
according
to changes in LVESV
during follow-up
Hypertension
1.15
0.53–2.51
The Extent of LV Dyssynchrony
LV dyssynchrony, per ms
1.03
1.02–0.05
<0.001
5 the
follow-up. TableFigure
3 note,
presents
the univariable
relations
beOf
extent
ofto
leftChanges
ventricular
(LV) dyssynchrony
was
largest in patients
with
Previous
MI significant LV
1.33
0.26–6.90
According
in LVESV
During Follow-Up
1.14
1.07–1.22
Peak cTnT level, per �g/l
remodeling (increase in left ventricular end-systolic volume
(LVESV) ≥15%).
ESV = end-systolic
volume.
Hyperlipidemia
0.85
CPK level, per U/l
1.44
1.20–1.72
Of note, the extent of left ventricular (LV) dyssynchrony was largest inPeak
patients
Smoking
0.94
ratio
1.09
1.01–1.17
with significant LV remodeling (increase in left ventricular end-systolicE/E=
volume
[LVESV] �15%). ESV � end-systolic volume.
WMSI
8.11
1.39–47.0
Values in bold indicate
statistical significance.
200
dyssynchrony was associated with a 3% increased risk of LV remodeling (adjusted
LV dyssynchrony (ms)
Age, per year
odds ratio 1.03 per ms; 95% CI 1.02 to 1.05; p < 0.001).
150
Abbreviations as in
Tables 1 and 2. 1.00–1.07
1.03
LA dimension, per mm
1.07
0.99–1.15
To identify the optimal extent of LV dyssynchrony
that was predictive
LVESV, per ml
1.02 for LV re1.00–1.03
LVEDV, per was
ml
1.01
modeling at 6 months follow-up, ROC curve analysis
performed (Figure
6). At1.00–1.02
a
100
0
ESV ↓
ESV =
n=3
ESV ↑ < 10% ESV ↑ 10-15% ESV ↑ ≥ 15%
n = 39
n=8
Change in LVESV relative to baseline
n = 36
0.073
0.081
0.090
0.094
0.54
0.25–1.17
0.12
Culprit vessel LAD
1.96
0.73–5.26
0.18
Gender
1.45
0.56–3.80
0.45
Number of diseased vessels
1.20
0.78–1.97
0.46
MR
1.19
0.66–2.15
0.57
Culprit vessel LCX
1.34
0.41–4.40
0.63
LVEF, per %
0.99
0.94–1.04
0.72
Diabetes
1.24
0.38–4.06
0.72
of 82% with a specificity of 95% to predict LVQRS
remodeling
at 6 months1.01
follow-up.0.99–1.04
duration, per ms
n = 92
0.020
Positive family history
cutoff value of 130 ms for LV dyssynchrony, ROC curve analysis revealed a sensitivity
50
<0.001
0.32–2.25
<0.001
0.44–1.98
0.019
0.39
remodeling was previously noted by McKay
authors demonstrated that infarct size, as a
extent of wall motion abnormalities, was d
tional to the magnitude of LV remodeling d
phase of infarction.
The predictive value of infarct size was fur
by Popović et al. (5), who described initial in
anterior wall acute myocardial infarction as
minant of infarct expansion and ventricul
Furthermore, the importance of the infarc
patency as predictor for infarct expansion aft
100%
Specificity
95%
myocardial infarction was emphasized. Unfo
tematic information on vessel patency was n
80%
82%
the current study.
The variables LA dimension and E/E= ra
ated
for their relation with long-term LV
60%
previous studies, both variables demonstr
clinical importance (10,11). In the present s
40%
ence of these variables on LV remodeling w
LV dyssynchrony at baseline appeared supe
tion of LV remodeling.
20%
Recently, Zhang et al. (7) emphasized
130 msec
impact
of acute myocardial infarction on re
Sensitivity
dial
contractility
and systolic LV synchronic
0%
course,
even
in
the
absence of QRS widen
0
100
200
300
400
branch block. The authors concluded that th
LV dyssynchrony (ms)
systolic dyssynchrony was mainly determined
size. The infarct size was assessed by con
Figure 6.
ROC Curve Analysis to Determine the Optimal Cutoff
Figure
6 analysis
magnetic
resonance
imaging and was signifi
ROC
curve
to
determine
the
optimal
cutoff
value
for
LV
dyssynchrony
to predict
LV remodeling
Value for LV Dyssynchrony to Predict LV Remodeling
Using a cutoff value of 130 ms, a sensitivity of 82% and a specificity of 95%
were with
obtained
to
patients
anterior
infarction (n � 24
Using a cutoff
value of 130(LV)
ms, aremodeling.
sensitivity of 82%
and=a receiver-operating
specificity of 95% were characteristic.
predict
left ventricular
ROC
inferior infarction (21.3 � 12.1% vs. 13.3 �
obtained to predict left ventricular (LV) remodeling. ROC � receiver-operating
tively). Of note, a larger extent of LV dys
characteristic.
demonstrated in patients with anterior than
Miocardico)-3 Echo Substudy, Giannuzzi et al. (1) showed
comparable results. Using the end-diastolic volume index as
a marker of remodeling, the authors noted severe LV
remodeling at 6-month after infarction in 16% of the
patients.
Cardiac remodeling is recognized as an important trigger
for the progression of cardiovascular disease. Increasing
LVESV (index) and declining LVEF post-infarction are
100
Discussion
The main findings of the present study can be summarized as follows: 1) 20% of the
patients exhibited LV remodeling at 6 months after acute myocardial infarction, 2)
patients in which LV remodeling occurred had higher baseline peak levels of cardiac
enzymes, WMSI, E/E’ ratio and a larger extent of LV dyssynchrony, 3) baseline LV
dyssynchrony of 130 ms or more, as assessed by speckle-tracking radial strain analysis, had a sensitivity of 82% and a specificity of 95% to predict LV remodeling at 6
months after acute infarction.
Prediction of LV remodeling
During follow-up, 20% of the study group showed remodeling of the left ventricle.
Accordingly, in these patients LVESV and LVEDV increased, while LVEF declined. In
the GISSI (Gruppo Italiano per lo Studio della Sopravvivenza nell’Infarto Miocardico)-3
Echo Substudy, Giannuzzi et al. showed comparable results. Using the end-diastolic
volume index as a marker of remodeling, the authors noted severe LV remodeling at
6 months after infarction in 16% of the patients.(1)
Chapter 5 : LV dyssynchrony predicts remodeling after AMI
Cardiac remodeling is recognized as an important trigger for the progression of
cardiovascular disease. Increasing LVESV (index) and declining LVEF post-infarction
are important predictors of mortality.(2,19,20) White et al. measured LV volumes,
LV ejection fractions, and severity of coronary occlusions and stenoses in 605 male
patients under 60 years of age at 1 to 2 months after a first (n = 443) or recurrent
(n = 162) myocardial infarction. During a follow-up period of 78 months there were
101 cardiac deaths. Multivariable analysis showed that LVESV had greater predictive
value for survival than LVEDV or LVEF. LVESV was significantly higher in patients who
died from a cardiac cause (122 ± 65 ml) than in survivors (72 ± 36 ml).(2) Therefore,
early identification of patients with LV remodeling after acute myocardial infarction
is of vital importance. In order to identify patients at high risk, parameters with
adequate predictive values are needed.
In the current study, it was shown that patients with LV remodeling had significantly
higher peak levels of cardiac enzymes, WMSI, E/E’ ratio and a significantly larger
extent of LV dyssynchrony, compared with the patients without LV remodeling.
Significant relations have been described between cardiac troponin T levels after
myocardial infarction and scintigraphic estimate of myocardial infarct size.(21,22) The
importance of the infarct size as determinant of LV remodeling was previously noted
by McKay et al.(3) The authors demonstrated that infarct size, as assessed by the
extent of wall motion abnormalities, was directly proportional to the magnitude of
LV remodeling during the acute phase of infarction. The predictive value of infarct
size was further confirmed by Popović et al, who described initial infarct size after
anterior wall acute myocardial infarction as a major determinant of infarct expansion
and ventricular remodeling. Furthermore, the importance of the infarct-related artery
patency as predictor for infarct expansion after anterior wall myocardial infarction
was emphasized.(5) Unfortunately, systematic information on vessel patency was
not available in the current study.
The variables LA dimension and E/E’ ratio were evaluated for their relation with
long-term LV remodeling. In previous studies, both variables demonstrated to be of
clinical importance.(10,11) In the present study, the influence of these variables on
LV remodeling was limited, and LV dyssynchrony at baseline appeared superior for
prediction of LV remodeling.
Recently, Zhang et al. emphasized the significant impact of acute myocardial infarction on regional myocardial contractility and systolic LV synchronicity early in the
course, even in the absence of QRS widening or bundle-branch block. The authors
concluded that the degree of LV systolic dyssynchrony was mainly determined by
the infarct size. The infarct size was assessed by contrast-enhanced magnetic reso-
101
102
nance imaging and was significantly larger in patients with anterior infarction (n = 24)
compared to inferior infarction (21.3 ± 12.1% vs. 13.3 ± 6.1%, respectively). Of note,
a greater extent of LV dyssynchrony was demonstrated in patients with anterior than
inferior myocardial infarction (46.8 ± 13.9 vs. 34.6 ± 8.5 ms, p = 0.002).(7)
LV dyssynchrony predicts long-term LV remodeling
A novel finding in the current study is that the extent of LV dyssynchrony was demonstrated to be an independent predictor of LV remodeling at 6 months follow-up.
Moreover, multivariable analysis showed that LV dyssynchrony, measured at baseline
after myocardial infarction, was superior to other variables in the prediction of LV
remodeling. To identify a cutoff value to predict LV remodeling, we performed an
ROC curve analysis and identified an optimal cutoff value of 130 ms. This cutoff
value yielded a sensitivity and specificity of 82% and 95% to predict LV remodeling
at 6 months follow-up. These findings suggest that assessment of LV dyssynchrony
immediately after acute myocardial infarction may provide incremental predictive
value for the identification of patients prone to the development of LV remodeling.
Speckle-tracking radial strain analysis to assess LV dyssynchrony
In the present study, the location of the earliest and latest activated segments was determined using speckle-tracking software applied to standard short-axis images. The
definition of LV dyssynchrony was based on the absolute difference in time-to-peak
radial strain for the earliest versus the latest activated segments. Speckle-tracking
radial strain analysis is a novel technique that allows angle-independent measurement of regional strain and time-to-peak radial strain of different LV segments.(15,16)
Recently, this technique has been validated against magnetic resonance imaging.
(23) Furthermore, Suffoletto et al. demonstrated that speckle-tracking radial strain
analysis can quantify LV dyssynchrony, and can accurately predict response to cardiac
resynchronization therapy. (24) In contrast to tissue velocity imaging-derived strain,
speckle-tracking radial strain is angle-independent and not limited by tethering.(25)
Therefore, speckle-tracking radial strain analysis permits an accurate quantification
of regional wall strain, with a high reproducibility.(23,25)
Clinical implications
Recently, numerous reports have been published on LV dyssynchrony, mainly in
relation to prediction of response to cardiac resynchronization therapy.(17) In these
studies, the presence of LV dyssynchrony in severely dilated left ventricles is predictive for response to cardiac resynchronization therapy.
Chapter 5 : LV dyssynchrony predicts remodeling after AMI
According to the present study, a significant degree of dyssynchrony is highly
predictive for the long-term development of LV remodeling after acute myocardial
infarction. This finding offers a unique possibility to identify patients at risk for LV
remodeling early after infarction and to subsequently intensify treatment of these
patients.
There is an important role for medical therapy in the prevention of LV remodeling
after myocardial infarction, especially for angiotensin-converting enzyme inhibitors
and beta-blockers.(26-33) The SOLVD (Studies of Left Ventricular Dysfunction) prevention trial for instance demonstrated that enalapril (partially) reversed LV dilatation
in patients with LV dysfunction.(27) Moreover, beta-blocker therapy has been shown
to reduce LVEDV and LVESV indexes in patients with LV dysfunction.(32,33)
In addition to further optimization of medical therapy, early cardiac resynchronization therapy could be considered in patients with severe LV dyssynchrony early after
acute myocardial infarction. However, it is currently unclear whether large infarction
results in LV dilatation, or whether LV dyssynchrony is most important for LV dilatation. Only when LV dyssynchrony is the main determinant of LV dilatation, cardiac
resynchronization may be beneficial. Further studies are needed to explore these
issues.
Conclusions
Patients with LV remodeling after acute myocardial infarction show significant LV
dyssynchrony at baseline, as compared to patients without LV remodeling. Using a
cutoff value of 130 ms, a sensitivity of 82% and a specificity of 95% were obtained
to predict the LV remodeling at 6 months follow-up. LV dyssynchrony may be used to
identify patients at high risk for development of LV remodeling after infarction.
103
104
References
1.
Giannuzzi P, Temporelli PL, Bosimini E et al. Heterogeneity of left ventricular remodeling
after acute myocardial infarction: results of the Gruppo Italiano per lo Studio della Sopravvivenza nell’Infarto Miocardico-3 Echo Substudy. Am Heart J 2001;141:131-8.
2.
White HD, Norris RM, Brown MA, Brandt PW, Whitlock RM, Wild CJ. Left ventricular
end-systolic volume as the major determinant of survival after recovery from myocardial
infarction. Circulation 1987;76:44-51.
3.
McKay RG, Pfeffer MA, Pasternak RC et al. Left ventricular remodeling after myocardial
infarction: a corollary to infarct expansion. Circulation 1986;74:693-702.
4.
Pirolo JS, Hutchins GM, Moore GW. Infarct expansion: pathologic analysis of 204 patients
with a single myocardial infarct. J Am Coll Cardiol 1986;7:349-54.
5.
Popovic AD, Neskovic AN, Marinkovic J, Thomas JD. Acute and long-term effects of thrombolysis after anterior wall acute myocardial infarction with serial assessment of infarct
expansion and late ventricular remodeling. Am J Cardiol 1996;77:446-50.
6.
Richards AM, Nicholls MG, Troughton RW et al. Antecedent hypertension and heart failure
after myocardial infarction. J Am Coll Cardiol 2002;39:1182-8.
7.
Zhang Y, Chan AK, Yu CM et al. Left ventricular systolic asynchrony after acute myocardial
infarction in patients with narrow QRS complexes. Am Heart J 2005;149:497-503.
8.
Liem SS, van der Hoeven BL, Oemrawsingh PV et al. MISSION!: optimization of acute and
chronic care for patients with acute myocardial infarction. Am Heart J 2007;153:14-1.
9.
Schiller NB, Shah PM, Crawford M et al. Recommendations for quantitation of the left
ventricle by two-dimensional echocardiography. American Society of Echocardiography
Committee on Standards, Subcommittee on Quantitation of Two-Dimensional Echocardiograms. J Am Soc Echocardiogr 1989;2:358-67.
10. Benjamin EJ, D’Agostino RB, Belanger AJ, Wolf PA, Levy D. Left atrial size and the risk of
stroke and death. The Framingham Heart Study. Circulation 1995;92:835-41.
11.
Naqvi TZ, Padmanabhan S, Rafii F, Hyuhn HK, Mirocha J. Comparison of usefulness of
left ventricular diastolic versus systolic function as a predictor of outcome following
primary percutaneous coronary angioplasty for acute myocardial infarction. Am J Cardiol
2006;97:160-6.
12.
Thomas JD. How leaky is that mitral valve? Simplified Doppler methods to measure regurgitant orifice area. Circulation 1997;95:548-50.
Chapter 5 : LV dyssynchrony predicts remodeling after AMI
13.
Broderick TM, Bourdillon PD, Ryan T, Feigenbaum H, Dillon JC, Armstrong WF. Comparison
of regional and global left ventricular function by serial echocardiograms after reperfusion in
acute myocardial infarction. J Am Soc Echocardiogr 1989;2:315-23.
14.
Sawada SG, Segar DS, Ryan T et al. Echocardiographic detection of coronary artery disease
during dobutamine infusion. Circulation 1991;83:1605-14.
15.
Leitman M, Lysyansky P, Sidenko S et al. Two-dimensional strain-a novel software for
real-time quantitative echocardiographic assessment of myocardial function. J Am Soc
Echocardiogr 2004;17:1021-9.
16.
Reisner SA, Lysyansky P, Agmon Y, Mutlak D, Lessick J, Friedman Z. Global longitudinal strain:
a novel index of left ventricular systolic function. J Am Soc Echocardiogr 2004;17:630-3.
17.
Bax JJ, Bleeker GB, Marwick TH et al. Left ventricular dyssynchrony predicts response and
prognosis after cardiac resynchronization therapy. J Am Coll Cardiol 2004;44:1834-40.
18.
Yu CM, Fung JW, Chan CK et al. Comparison of efficacy of reverse remodeling and clinical
improvement for relatively narrow and wide QRS complexes after cardiac resynchronization
therapy for heart failure. J Cardiovasc Electrophysiol 2004;15:1058-65.
19.
Cohn JN, Ferrari R, Sharpe N. Cardiac remodeling--concepts and clinical implications: a consensus paper from an international forum on cardiac remodeling. Behalf of an International
Forum on Cardiac Remodeling. J Am Coll Cardiol 2000;35:569-82.
20.
Gaudron P, Eilles C, Kugler I, Ertl G. Progressive left ventricular dysfunction and remodeling after myocardial infarction. Potential mechanisms and early predictors. Circulation
1993;87:755-63.
21.
Licka M, Zimmermann R, Zehelein J, Dengler TJ, Katus HA, Kubler W. Troponin T concentrations 72 hours after myocardial infarction as a serological estimate of infarct size. Heart
2002;87:520-4.
22.
Panteghini M, Cuccia C, Bonetti G, Giubbini R, Pagani F, Bonini E. Single-point cardiac
troponin T at coronary care unit discharge after myocardial infarction correlates with infarct
size and ejection fraction. Clin Chem 2002;48:1432-6.
23.
Amundsen BH, Helle-Valle T, Edvardsen T et al. Noninvasive myocardial strain measurement by speckle tracking echocardiography: validation against sonomicrometry and tagged
magnetic resonance imaging. J Am Coll Cardiol 2006;47:789-93.
24.
Suffoletto MS, Dohi K, Cannesson M, Saba S, Gorcsan J, III. Novel speckle-tracking radial
strain from routine black-and-white echocardiographic images to quantify dyssynchrony and
predict response to cardiac resynchronization therapy. Circulation 2006;113:960-8.
105
106
25.
Cho GY, Chan J, Leano R, Strudwick M, Marwick TH. Comparison of two-dimensional
speckle and tissue velocity based strain and validation with harmonic phase magnetic
resonance imaging. Am J Cardiol 2006;97:1661-6.
26.
Konstam MA, Rousseau MF, Kronenberg MW et al. Effects of the angiotensin converting
enzyme inhibitor enalapril on the long-term progression of left ventricular dysfunction in
patients with heart failure. SOLVD Investigators. Circulation 1992;86:431-8.
27.
Konstam MA, Kronenberg MW, Rousseau MF et al. Effects of the angiotensin converting enzyme inhibitor enalapril on the long-term progression of left ventricular dilatation
in patients with asymptomatic systolic dysfunction. SOLVD (Studies of Left Ventricular
Dysfunction) Investigators. Circulation 1993;88:2277-83.
28.
Greenberg B, Quinones MA, Koilpillai C et al. Effects of long-term enalapril therapy on
cardiac structure and function in patients with left ventricular dysfunction. Results of the
SOLVD echocardiography substudy. Circulation 1995;91:2573-81.
29.
Groenning BA, Nilsson JC, Sondergaard L, Fritz-Hansen T, Larsson HB, Hildebrandt PR.
Antiremodeling effects on the left ventricle during beta-blockade with metoprolol in the
treatment of chronic heart failure. J Am Coll Cardiol 2000;36:2072-80.
30.
Pfeffer MA, Braunwald E, Moye LA et al. Effect of captopril on mortality and morbidity in
patients with left ventricular dysfunction after myocardial infarction. Results of the survival
and ventricular enlargement trial. The SAVE Investigators. N Engl J Med 1992;327:669-77.
31.
Effect of enalapril on mortality and the development of heart failure in asymptomatic patients with reduced left ventricular ejection fractions. The SOLVD Investigattors. N Engl J
Med 1992;327:685-91.
32.
Randomised, placebo-controlled trial of carvedilol in patients with congestive heart failure
due to ischaemic heart disease. Australia/New Zealand Heart Failure Research Collaborative Group. Lancet 1997;349:375-80.
33.
Doughty RN, Whalley GA, Walsh HA, Gamble GD, Lopez-Sendon J, Sharpe N. Effects of
carvedilol on left ventricular remodeling after acute myocardial infarction: the CAPRICORN
Echo Substudy. Circulation 2004;109:201-6.
Chapter 6
Sirolimus-eluting stents versus bare-metal
stents in patients with ST-Segment elevation
myocardial infarction: 9-month angiographic
and intravascular ultrasound results and
12-month clinical outcome Results from
the MISSION! Intervention Study
Bas L. van der Hoeven
Su-San Liem
J. Wouter Jukema
Navin Suraphakdee
Hein Putter
Jouke Dijkstra
Douwe E. Atsma
Marianne Bootsma
Katja Zeppenfeld
Pranobe V. Oemrawsingh
Ernst E. van der Wall
Martin J. Schalij
J Am Coll Cardiol 2008;51:618–26
108
Abstract
Objectives
Our purpose was to evaluate the efficacy and safety of drug-eluting stents in the
setting of primary percutaneous coronary intervention for ST-segment elevation
myocardial infarction (STEMI).
Background
There is inconsistent and limited evidence about the efficacy and safety of drugeluting stents in STEMI patients.
Methods
A single-blind, single-center, randomized study was performed to compare baremetal stents (BMS) with sirolimus-eluting stents (SES) in 310 STEMI patients. The
primary end point was in-segment late luminal loss (LLL) at 9 months. Secondary
end points included late stent malapposition (LSM) at 9 months as determined by
intravascular ultrasound imaging and clinical events at 12 months.
Results
In-segment LLL was 0.68 ± 0.57 mm in the BMS group and 0.12 ± 0.43 mm in the
SES group with a mean difference of 0.56 mm, 95% confidence interval 0.43 to 0.68
mm (p < 0.001). Late stent malapposition at 9 months was present in 12.5% BMS
patients and in 37.5% SES patients (p < 0.001). Event-free survival at 12 months
was 73.6% in BMS patients and 86.0% in SES patients (p = 0.01). The target-vesselfailure-free survival was 84.7% in the BMS group and 93.0% in the SES group (p =
0.02), mainly because of a higher target lesion revascularization rate in BMS patients
(11.3% vs. 3.2%; p = 0.006). Rates of death, myocardial infarction, and stent thrombosis were not different.
Conclusions
Sirolimus-eluting stent implantation in STEMI patients is associated with a favorable
midterm clinical and angiographic outcome compared with treatment with BMS.
However, LSM raises concern about the long-term safety of SES in STEMI patients
(MISSION!; ISRCTN62825862).
Chapter 6 : SES versus BMS in STEMI patients
Introduction
Percutaneous coronary intervention (PCI) is the preferred revascularization strategy
in patients presenting with ST-segment elevation myocardial infarction (STEMI).(1)
Percutaneous coronary intervention is directed at restoring coronary flow, stabilizing
the ruptured plaque, and reducing infarct size, thereby improving short- and longterm clinical outcome. Implantation of a bare-metal coronary artery stent (BMS)
during primary PCI further improves outcome compared with balloon angioplasty
alone by reducing the number of acute complications and the restenosis rate.(2,3)
Drug-eluting stents have been proven effective in reducing restenosis in patients
with stable and unstable angina.(4–7) Inconsistent and limited results have been
presented about the efficacy and safety of drug-eluting stents in STEMI patients.
(8,9) In particular, stent thrombosis occurring late after implantation of drug-eluting
stents, possibly related to late malapposition of the stent struts, has raised safety
concerns.(10,11) Therefore, this randomized prospective study was designed to
evaluate midterm angiographic outcome and clinical efficacy of third-generation
BMS compared with that seen in sirolimus-eluting stents (SES) in STEMI patients. To
address the issue of late stent malapposition (LSM), intravascular ultrasound (IVUS)
imaging was performed in both groups at 9-month follow-up.
Methods
Study design
This is a single-center, single-blind, randomized prospective noninferiority study to
evaluate clinical, angiographic, and IVUS results in STEMI patients treated with either
BMS or SES. The study protocol was approved by the institutional ethical committee. Written informed consent was obtained from all patients before enrollment and
before the follow-up catheterization. Patients and operators performing the follow-up
angiography were blinded to the treatment assignment. The study was conducted
from February 2004 to October 2006. During the study period, all patients were
treated according to the institutional STEMI protocol, which included standardized
outpatient follow-up.(12)
Patient selection
Patients were eligible if STEMI symptoms started <9 h before the procedure and
the electrocardiogram (ECG) demonstrated STEMI (ST-segment elevation ≥0.2 mV in
109
110
≥2 contiguous leads in V1 through V3 or ≥0.1 mV in other leads, or [presumed] new
left bundle branch block). Furthermore, the target lesion length should be ≤24 mm.
Exclusion criteria were: 1) age <18 years or >80 years; 2) left main stenosis of ≥50%;
3) triple-vessel disease, defined as ≥50% stenosis in ≥3 major epicardial branches;
4) previous PCI or coronary artery bypass grafting of the infarct-related artery; 5)
thrombolytic therapy for the index infarction; 5) target vessel reference diameter
<2.25 mm or >3.75 mm; 6) need for mechanical ventilation; 7) contraindication to
the use of aspirin, clopidogrel, heparin, or abciximab; 8) known renal failure; or 9) a
life expectancy <12 months.
After crossing the target lesion with a guidewire and after visual estimation of the
target vessel reference diameter, randomization to treatment with a BMS (Vision,
Guidant Corp. Indianapolis, Indiana) or SES (Cypher, Cordis Corp., Miami Lakes,
Florida) was performed in a 1:1 ratio.
Study procedure
Before the procedure all patients received 300 mg of aspirin, 300 to 600 mg of
clopidogrel, and an intravenous bolus of abciximab (25 μg/kg), followed by a continuous infusion of 10 μg/kg/min for 12 h. At start of the procedure, 5,000 IU of heparin
was given. Lesions were treated according to current interventional practice. Direct
stenting was allowed. If more than 1 stent was required, additional assigned study
stents were used. Stent size and length selection was based on visual estimation.
Before and immediately after the intervention, 2 angiograms in orthogonal projections were obtained. Intravascular ultrasound imaging was performed after stent
implantation (motorized pull-back [0.5 mm/s]), starting >10 mm distal to the stent and
ending at the coronary ostium, using a 2.9-F 20-MHz catheter and a dedicated IVUS
console (Eagle Eye, Volcano Corp., Rancho Cordova, California) (13) Intravascularultrasound-guided stenting was not performed to reflect routine angiographic stent
implantation. Each angiogram and ultrasound sequence was preceded by 200 to 300
μg of intracoronary nitroglycerin.
Follow-up and data collection
Patients were seen at the outpatient clinic at 30 days, 3, 6, and 12 months.(12) Aspirin (80 to 100 mg/day) was prescribed indefinitely and clopidogrel (75 mg/day) for 12
months. Patients were treated with betablocking agents, statins, and angiotensinconverting enzyme inhibitors or angiotensin II blockers. Follow-up angiography and
IVUS imaging was performed at 9 months.
Chapter 6 : SES versus BMS in STEMI patients
Quantitative coronary angiography (QCA) and IVUS analysis
Angiograms were analyzed off-line by analysts blinded for the assigned treatment
using validated QCA systems (CMS version 6.1, Medis, Leiden, the Netherlands).
Measurements were made in a single projection showing the most severe stenosis following standardized operating procedures.(14) The minimal lumen diameter
(MLD) was measured, and the percentage diameter stenosis was calculated using
the interpolated reference diameter approach. Late luminal loss (LLL) was defined as
the difference between the post-procedural MLD and follow-up MLD. Angiographic
restenosis was defined as ≥50% diameter stenosis at 9-months, follow-up.
Intravascular ultrasound images were analyzed off-line, using quantitative IVUS
analysis software (QCU-CMS version 4.14, Medis). The stented segment (+5 mm
proximally and distally to the stent) was analyzed. The stent and lumen boundaries were determined in all individual frames. In case of malapposition, the stent
boundaries were used as lumen boundaries. The volume within the stent and the
luminal volume were calculated applying Simpson’s rule.(15) Stent malapposition
was defined as a separation of at least 1 stent strut, not overlapping a side branch,
from the intimal surface with IVUS evidence of blood speckles behind the strut.
(16,17) The site of malapposition was classified as: 1) the body of the stent; 2) the
proximal stent edge; or 3) the distal stent edge. Malapposition was persistent if it
was present immediately after stent implantation and at follow-up, and acquired if it
was present at follow-up only.
Study end points
The primary end point of the study was in-segment LLL at 9-month follow-up angiography. Secondary end points were angiographic restenosis and LSM at 9 months.
Additional secondary end points were death, myocardial infarction (MI), target
vessel revascularization, target lesion revascularization, target vessel failure, stent
thrombosis, procedural success, and clinical success. All deaths were defined as
cardiac, unless it was unequivocally proven noncardiac. Myocardial infarction during
follow-up was defined as a troponin-T rise >0.03 μg/l with symptoms or PCI, a rise of
troponin-T >0.15 μg/l after coronary artery bypass grafting, or a rerise of troponin-T
>25% after recent MI in the presence of symptoms or re-PCI, or the development of
new Q waves on ECG.(18,19) All infarctions were categorized as spontaneous or procedure related (nonindex procedure).(18,19) Procedural success was defined as the
achievement of <50% diameter stenosis by QCA with achievement of Thrombolysis
In Myocardial Infarction flow grade 3. Clinical success was defined as procedural
success without death or reinfarction during the index hospitalization. Target vessel
111
112
and target lesion revascularization were defined as any revascularization procedure
of the target vessel or target lesion (from 5 mm distally to the stent up to 5 mm
proximally to the stent), respectively. Clinically driven target lesion revascularization
was defined as repeated revascularization procedure of the target lesion (showing
≥50% diameter stenosis) driven by clinical symptoms at rest in conjunction with
electrocardiographic evidence of ischemia or a positive stress test (in the presence or
absence of clinical symptoms). Target vessel failure was defined as the composite of
cardiac death or recurrent MI attributable to the target vessel or any revascularization
procedure of the target vessel. If events could not unequivocally be attributed to a
nonculprit vessel, they were considered culprit vessel related. Stent thrombosis was
defined as angiographically documented thrombus within the stent and/or typical
chest pain with recurrent ST-segment elevation in the territory of the infarct-related
vessel in combination with a significant rise of troponin levels and/or the presence
of new Q waves in the territory of the infarct related vessel. Stent thrombosis was
classified as acute if it occurred <24 h after the index procedure, as subacute if it occurred between 1 to 30 days, and as late if it occurred >30 days.(9) All clinical events
were adjudicated by a clinical events committee whose members were blinded for
the assigned stent type.
Statistical design and analysis
The study objective was to assess whether the outcome of treatment with BMS
was noninferior to the outcome of treatment with SES. To prove noninferiority, a
difference of ≤0.35 mm angiographic in-segment LLL at 9 months was considered
clinically insignificant. The sample size to demonstrate noninferiority of BMS was 244
patients (1-sided) based on the following assumptions: 1) angiographic in-segment
LLL at 9 months is 0.40 mm in the SES group and 0.60 mm in the BMS group, with
a common within-group standard deviation of 0.40 mm (power 0.90, alpha error
of 0.05). To compensate for unsuccessful interventions, crossovers, and losses to
follow-up, the sample size was increased to a total of 316 patients. All analyses were
conducted according to the intention-to-treat principle. Analysis of post-procedural
and follow-up angiographic and IVUS data was conducted according to the number
of patients for which complete data were available. All continuous variables were
compared between the treatment groups with a t test or, in case of non-normality as
tested by Shapiro-Wilk’s statistics, with an equivalent nonparametric test. Categorical variables were compared with Pearson’s chi-square test or Fisher exact test in
case of 1 or more cells in the contingency table with expectation <5. Event-free and
target-vessel-failure-free survival were computed using Kaplan-Meier estimates and
Chapter 6 : SES versus BMS in STEMI patients
compared between treatment groups with the log-rank test. The hazard ratio (HR)
was calculated by Cox regression with treatment group as sole covariate. To correct
for differences in baseline characteristics, the appropriate multivariate analysis was
performed. All p values were 2-sided, and a p value of less than 0.05 was considered
statistically significant. All analyses were conducted with SPSS version 12.0.1 statistical analysis software (SPSS Inc., Chicago, Illinois).
Results
Patients
A total of 316 STEMI patients were enrolled in the study (Table 1, Fig. 1). Six patients
were subsequently excluded because the assigned study stent was not available,
and 310 patients (152 assigned to BMS and 158 assigned to SES) were included in
the analysis. With exception of a larger reference diameter in the BMS group, the
groups were comparable. One patient crossed over from SES to BMS because of
the inability to cross the lesion with the SES. Procedural characteristics are summarized in Table 2.
Angiographic results
Post-procedural and follow-up angiographic data were available for 124 BMS patients
(81.6%) and 131 SES patients (82.9%). Patients with and without follow-up angiography had similar baseline characteristics. Six patients without follow-up angiography
died during follow-up (4 BMS and 2 SES patients). The median time to angiographic
follow-up was 272 days (10th to 90th percentiles: 268 to 295 days) in the BMS group
and 272 days (10th to 90th percentiles: 270 to 290 days) in the SES group (p = 0.66).
Post-procedural and follow-up QCA results are summarized in Table 3. The mean
difference between BMS and SES patients in in-segment LLL was 0.56 mm (95%
confidence interval [CI] 0.43 to 0.68, p<0.001) at 9 months. This difference remained
significant after adjustment for baseline characteristics as listed in Table 1 (mean
difference 0.60 mm, 95% CI 0.48 to 0.72, p < 0.001). The in-segment angiographic
restenosis rate was 22.6% in the BMS group and 3.8% in the SES group (relative
risk 5.92, 95% CI 2.36 to 14.84). The cumulative percentage diameter stenosis distribution after the procedure and at follow-up angiography is shown in Figure 2.
113
114
Characteristic
SES (n = 158)
BMS (n = 152)
p Value
Age (yrs)
59.2 ± 11.2
59.1 ± 11.6
0.99
Male sex
118 (74.7)
123 (80.9)
0.19
Diabetes mellitus
20 (12.7)
10 (6.6)
0.07
Current smoker
84 (53.2)
85 (55.9)
0.63
Hypercholesterolemia
37 (23.4)
25 (16.4)
0.13
Hypertension
48 (30.4)
39 (25.7)
0.36
Family history of CAD
73 (46.2)
60 (39.5)
0.23
Prior myocardial infarction
7 (4.4)
5 (3.3)
0.60
Prior PCI
4 (2.5)
1 (0.7)
0.37*
Prior CABG
1 (0.6)
1 (0.7)
1.00*
88 (47–153)
106 (71–151)
0.11*
183 (133–258)
195 (153–257)
0.19*
Times minutes: median (inter-quartile range)
Symptoms onset to first ECG
Symptoms onset to balloon inflation
Target vessel
LAD
87 (55.1)
83 (54.6)
RCA
40 (25.3)
51 (33.6)
RCX
31 (19.6)
18 (11.8)
56 (35.4)
50 (32.9)
90 (59.2)
Multivessel disease
0.09
0.64
TIMI flow before
0
96 (60.8)
1
18 (11.4)
15 (9.9)
2
20 (12.6)
24 (15.8)
3
24 (15.2)
23 (15.1)
0.87
Maximal creatinine phosphokinase, U/l
Median
Interquartile range
1844
2079
863–3413
1012–3792
0.25*
13.9 ± 5.6
15.0 ± 8.6
0.47
Reference diameter, mm
2.76 ± 0.54
2.92 ± 0.56
0.02
Minimal luminal diameter, mm
0.21 ± 0.35
0.27 ± 0.41
0.19*
Stenosis, % of luminal diameter
91.0 ± 13.6
92.5 ± 12.4
0.35*
QCA before procedure
Lesion length, mm
Table 1. Baseline clinical and angiographic characteristics
Data are expressed as number (%) or mean ± standard deviation. All comparisons between
groups were performed with t test (continuous variables) or Pearson’s chi-square test (categorical
variables) except as indicated (*).
BMS = bare-metal stent; CABG = coronary artery bypass grafting; CAD = coronary artery disease;
ECG = electrocardiogram; LAD = left anterior descending coronary artery; LCX = left circumflex
artery; PCI = percutaneous coronary intervention; QCA = quantitative coronary angiography; RCA
= right coronary artery; SES = sirolimus-eluting stent; TIMI = Thrombolysis In Myocardial Infarction.
Figure 1.
van der Hoeven et al.
SES Versus BMS in STEMI Patients
JACC Vol. 51, No. 6, 2008
February 12, 2008:618–26
patients and 3.2% in SES patients (p � 0.006). The
clinically driven target lesion revascularization rate was
7.9% in BMS patients and 2.5% in SES patients (p �
115
the BMS group and 93.0% in the SES group (HR 2.24,
95% CI 1.09 to 4.60) (Fig. 3B). Clinical event rates were
not significantly different between patients who under-
BMS � bare metal stent; CAG � coronary angiography; IVUS � intravascular ultrasound;
QCA � quantitative coronary angiography; SES � sirolimus-eluting stent; TLR � target lesion revascularization.
quantitative coronary angiography; SES = sirolimus-eluting stent; TLR = target lesion revascularization.
FigurePatient
1 Patient
Flow
Chart, Enrollment,
andBMS
Outcomes
flow chart,
enrollment,
and outcomes
= bare metal stent; CAG = coronary angiography; IVUS = intravascular ultrasound; QCA =
622
Chapter 6 : SES versus BMS in STEMI patients
116
Characteristic
SES (n = 158)
BMS (n = 152)
p Value
Direct stenting
57 (36.1)
59 (38.8)
0.62
Number of stents in the culprit lesion
1.34 ± 0.61
1.38 ± 0.63
0.57*
Implanted stent length, mm
26.5 ± 12.8
26.4 ± 11.1
0.95*
Maximum stent diameter, mm
3.31 ± 0.26
3.37 ± 0.35
0.05
Maximum balloon diameter, mm
3.37 ± 0.31
3.40 ± 0.30
0.30
Maximal balloon pressure, bar
12.3 ± 2.5
12.2 ± 3.0
0.70
Maximal balloon to artery ratio
1.17 ± 0.17
1.15 ± 0.19
0.26
TIMI flow after
0
1 (0.6)
0 (0.0)
1
1 (0.6)
1 (0.7)
2
10 (6.4)
10 (6.6)
3
146 (92.4)
141 (92.7)
158 (100.0)
151 (99.3)
0.49*
10 (6.3)
8 (5.3)
0.69
Procedural success
146 (92.4)
141 (92.8)
0.90
Clinical success
146 (92.4)
140 (92.1)
0.92
Abciximab therapy
Multivessel intervention during
the index procedure
1.00*
Table 2. Procedural characteristics
Data are expressed as number (%) or mean ± standard deviation. All comparisons between
groups were performed with t test (continuous variables) or Pearson’s chi-square test (categorical
624
der Hoeven
et al. (*). Abbreviations as in Table 1.
variables)van
except
as indicated
SES Versus BMS in STEMI Patients
JAC
Febru
Clinical Events During 12-Months Follow-Up
Table 5
Clinical Events During 12-Months Fol
Event
Death
Noncardiac
Cardiac
Target vessel related
Recurrent myocardial infarction
Spontaneous
Target vessel related
Procedure related
SIRIUS (Sirolimus-Eluting Stent in Coronary Lesions)
(16.3%) and RAVEL (A Randomized Comparison of a
Sirolimus-Eluting Stent With a Standard Stent for Coronary Revascularization) (21%) studies, both comparing SES
4 (2
—
2 (1
2 (1.3)
2 (1
2 (1.3)
2 (1
9 (5.7)
14 (9
2 (1.3)
3 (2
2 (1.3)
3 (2
7 (4.4)
11 (7
Target vessel related
2 (1.3)
6 (3
19 (12.0)
35 (2
17 (10.8)
30 (1
CABG
Abbreviations as in Figure 1.
BMS (n
2 (1.3)
Revascularization procedure†
PCI
Figure 2. Cumulative
rateRate
of in-segment
percentage diameter stenosis
Cumulative
of In-Segment
Figure 2
Abbreviations
as in FigureDiameter
1.
Percentage
Stenosis
SES (n � 158)
2 (1.3)
5 (3
8 (5.1)
20 (1
PCI
6 (3.8)
17 (1
CABG
2 (1.3)
3 (2
5 (3.2)
17 (1
PCI
3 (1.9)
14 (9
CABG
2 (1.3)
3 (2
Clinically driven
4 (2.5)
12 (7
Target vessel revascularization†
Target lesion revascularization†
Any event
22 (13.9)
40 (2
Target vessel failure
11 (7.0)
23 (1
2 (1.3)
3 (2
Stent thrombosis
Chapter 6 : SES versus BMS in STEMI patients
Characteristic
SES (n=131)
BMS (n=124)
P-value
Post-procedure
Stented segment length – mm
22.3±10.0
22.6±8.4
0.77*
Reference diameter – mm
2.94±0.49
3.02±0.53
0.20
Minimal luminal diameter – mm
In-segment
2.36±0.50
2.41±0.52
0.44
In-stent
2.67±0.38
2.71±0.37
0.33
Proximal margin
2.84±0.52
2.95±0.58
0.15
Distal margin
2.35±0.53
2.40±0.56
0.49
20.4±9.1
0.67
Stenosis – % of luminal diameter
In-segment
20.0±8.2
In-stent
11.1±6.9
12.4±7.2
0.14
Proximal margin
11.4±9.4
10.8±9.7
0.64
Distal margin
15.1±10.9
14.9±10.8
0.91
2.96±0.47
2.92±0.50
0.59
Follow-up
Reference diameter – mm
Minimal luminal diameter – mm
In-segment
2.24±0.55
1.74±0.59
<0.001
In-stent
2.48±0.52
1.77±0.59
<0.001
Proximal margin
2.64±0.58
2.60±0.62
0.67
Distal margin
2.33±0.57
2.24±0.60
0.26
Late luminal loss – mm
In-segment
0.12±0.43
0.68±0.57
<0.001
In-stent
0.19±0.39
0.95±0.55
<0.001
Proximal margin
0.20±0.33
0.34±0.48
0.01
Distal margin
0.03±0.31
0.16±0.45
0.007
Stenosis – % of luminal diameter
In-segment
24.3±12.7
40.8±17.5
<0.001
In-stent
16.2±13.0
39.7±18.0
<0.001
Proximal margin
16.0±11.8
16.6±12.7
0.71
Distal margin
15.0±11.4
17.4±14.5
0.16
Angiographic restenosis
In-segment
5 (3.8)
28 (22.6)
<0.001
In-stent
3 (2.3)
28 (22.6)
<0.001
Proximal margin
1 (0.9)
2 (1.9)
0.61
Distal margin
1 (0.8)
2 (1.7)
0.61
Table 3. Results of quantitative coronary angiography post-procedure and at follow-up
Data are expressed as number (%) or mean ± standard deviation. All comparisons between groups
were performed with a t test except as indicated(*). Abbreviations as in Table 1.
117
JACC Vol. 51, No. 6, 2008
February 12, 2008:618–26
118
van der Hoeve
SES Versus BMS in STEMI P
Stent vs. Abciximab and Bare-Metal Stent
Infarction) study (comparing SES with tirofi
with abciximab in STEMI patients) (27). T
cases of acute stent thrombosis (�24 h), poss
the intensive antithrombotic regimen applied
administration of abciximab in all patien
thrombosis (�30 days) occurred in 1 BMS
Study limitations. With regard to the outc
inferiority design of the study is a relative lim
the time of conception of the study, only lim
tion about the efficacy of SES and third-gene
STEMI patients was available. It was assume
limited differences in late loss, third-generat
not inferior to drug-eluting stents with reg
whereas adverse effects of drug-eluting stent
and delayed re-endothelialization could be av
BMS (11). Another limitation is that the an
clinical results of this study cannot be translat
daily clinical practice, as this was a single-c
selected patients, and patients were followed
guideline-based follow-up protocol, which i
practice yet. Moreover, this study was un
detect differences in safety events such as d
MI, or stent thrombosis. Since IVUS follo
possible in some BMS patients because of
cannot exclude that LSM was underestimate
group, although this is unlikely since thes
more neointimal growth. Finally, we canno
the routine angiographic follow-up did resu
revascularization procedures, magnifying th
clinical outcome between BMS and SES.
Figure
freeFree
andand
TVFTVF
freeFree
survival
Figure 3.
3 Event
Event
Survival
(A) Kaplan-Meier estimates of survival free from any events among patients treated with BMS
(A) Kaplan-Meier
estimates
of survival
from any survival
events among
and
those treated
with SES.
The free
event-free
waspatients
significantly higher in the SES group than
treated
withgroup
BMS and
treated
with SES. The event-free
survival
was sig- free from target vessel failure
the
BMS
(p =those
0.01).
(B) Kaplan-Meier
estimates
of survival
nificantly higher in the SES group than the BMS group (p � 0.01). (B) Kaplan(TVF) among patients treated with BMS and those treated with SES. TheConclusions
TVF free survival was
Meier estimates of survival free from target vessel failure (TVF) among patients
significantly
higher
in
the
SES
group
than
the
BMS
group
(p
=
0.02).
Abbreviations
treated with BMS and those treated with SES. The TVF free survival was signifiThe SES implantation
as
in Figure
1.the SES group than the BMS group (p � 0.02). Abbreviations
cantly
higher in
in STEMI patient
with
superior
midterm
clinical and angio
as in Figure 1.
compared with BMS implantation. How
frequently observed in STEMI patients trea
IVUS results
raising concern about long-term safety wa
the
PASSION
Eluting
StentforVersus
ConvenFollow-up
IVUS(Paclitaxel
results were
available
93 (61.2%)
BMS patients and 115 (72.8%)
term clinical follow-up. Therefore, based on
tional Stent in ST-Segment Elevation Myocardial InfarcSES patients (p = 0.03). Inability to cross the stented segment with the IVUS catheter
cannot recommend or discourage SES u
tion) study, comparing paclitaxel-eluting stents and BMS in
in patients
with significant
restenosis was
an important
for the lower number
patients.
STEMI
patients,
failed to demonstrate
a reduction
in thereason
of IVUS
studies
in BMS
Quantitative IVUS stent
data are summarized in Table 4.
target
vessel
failure
ratepatients.
in the paclitaxel-eluting
group (8). This difference may be explained by differences
Acknowledgments
in baseline characteristics such as a larger reference
The authors wish to thank the following mem
diameter and shorter implanted stent length, differences
Clinical Events Committee: A.V.G. Brusch
in stent design and drug efficacy, or the lack of angiographic
Leiden, the Netherlands and S.A.I.P. Trine
follow-up in the PASSION study (26).
Leiden University Medical Center, Leiden, th
Mortality and MI rates were low in both groups. The MI
Chapter 6 : SES versus BMS in STEMI patients
At follow-up, the minimal luminal area was 4.01 ± 1.38 mm2 in the BMS group and
5.67 ± 1.59 mm2 in the SES group (p < 0.001). The percentage neointimal volume
was 27.0 ± 11% in the BMS group and 3.3 ± 5.0% in the SES group (p < 0.001). Late
stent malapposition was present in 12.5% BMS patients and 37.5%SES patients.
Late stent malapposition was persistent in 11.3% BMS patients and 18.3% SES
patients (p = 0.19). Late stent malapposition was acquired in 5.0% BMS patients and
Characteristic
SES (n = 115)
BMS (n = 93)
p Value
6.05 ± 1.56
6.54 ± 1.41
0.02
Area, mm
2
Minimal stent area
In-stent MLA
5.67 ± 1.59
4.01 ± 1.38
<0.001
Proximal margin MLA
6.81 ± 2.15
6.57 ± 2.53
0.55
Distal margin MLA
5.77 ± 2.09
5.52 ± 2.10
0.45
0.32
Volume, mm3
Stent volume
188 ± 86
199 ± 77
Lumen volume
181 ± 81
145 ± 60
<0.001
Neointimal volume
7 ± 12
54 ± 31
<0.001*
Percentage neointimal volume
3.3 ± 5.0
27.0 ± 11.0
<0.001*
Late stent malapposition†
Number evaluated
Any site‡
104
80
39 (37.5)
10 (12.5)
<0.001
Persistent
19 (18.3)
9 (11.3)
0.19
Acquired
26 (25.0)
4 (5.0)
<0.001*
17 (16.3)
7 (8.8)
0.13
Proximal stent edge
Persistent
14 (13.5)
7 (8.8)
0.32
Acquired
3 (2.9)
0 (0.0)
0.26*
27 (26.0)
2 (2.5)
<0.001*
Persistent
6 (5.8)
1 (1.3)
0.14*
Acquired
21 (20.2)
1 (1.3)
<0.001*
Distal stent edge
13 (12.5)
4 (5.0)
0.08*
Stent body
Persistent
6 (5.8)
2 (2.5)
0.47*
Acquired
7 (6.7)
2 (2.5)
0.30*
Table 4. Results of coronary ultrasound analysis at follow-up
Data are expressed as number (%) or mean ± standard deviation. All comparisons between
groups were performed with t test (continuous variables) or Pearson’s chi-square test (categorical
variables) except indicated (); †Data are presented for patients with paired (post-procedural and
follow-up) intravascular ultrasound results; ‡Some patients had both persistent and acquired late
stent malapposition (6 SES, 3 BMS).MLA = minimal luminal area; other abbreviations as in Table 1.
119
120
in 25% SES patients (p < 0.001). Acquired LSM within the body of the stent occurred
almost exclusively in SES patients (20.2% vs. 1.3% in BMS patients, p < 0.001).
Event
SES (n=158)
BMS (n=152)
Death
2 (1.3)
4 (2.6)
0.44*
-
2 (1.3)
0.24*
Non-cardiac
Cardiac
P-value
2 (1.3)
2 (1.3)
1.00*
2 (1.3)
2 (1.3)
1.00*
Recurrent myocardial infarction
9 (5.7)
14 (9.2)
0.24
2 (1.3)
3 (2.0)
0.68*
2 (1.3)
3 (2.0)
0.68*
7 (4.4)
11 (7.2)
0.29
2 (1.3)
6 (3.9)
0.17*
Revascularization procedure†
19 (12.0)
35 (23.0)
0.01
PCI
17 (10.8)
30 (19.7)
0.03
CABG
0.28*
Spontaneous
Target vessel related
Target vessel related
Procedure related
Target vessel related
2 (1.3)
5 (3.3)
Target vessel revascularization†
8 (5.1)
20 (13.2)
PCI
6 (3.8)
17 (11.2)
CABG
2 (1.3)
3 (2.0)
0.68*
5 (3.2)
17 (11.2)
0.006
Target lesion revascularization†
0.01
0.01
PCI
3 (1.9)
14 (9.2)
0.005
CABG
2 (1.3)
3 (2.0)
0.68*
Clinically driven revascularization
4 (2.5)
12 (7.9)
0.03
22 (13.9)
40 (26.3)
0.01‡
Target vessel failure
11 (7.0)
23 (15.1)
0.02‡
Stent thrombosis
2 (1.3)
3 (2.0)
0.68*
-
-
-
2 (1.3)
2 (1.3)
1.00*
-
1 (0.7)
0.49*
1 (0.6)
1 (0.7)
1.00*
Any event
Acute (<24 hours)
Subacute (1 day – 30 days)
Late (>30 days)
Angiographically documented
Table 5. Clinical events during 12-Months follow-up
Data are expressed as number (%). All comparisons between groups were performed with
Pearson’s chi-square test (categorical variables), except as indicated (Fisher exact test*; log-rank
test‡); †If the patient underwent more than 1 procedure, for every type of revascularization
procedure (revascularization, target vessel revascularization, or target lesion revascularization) the
first event per patient was counted. Abbreviations as in Table 1.
Chapter 6 : SES versus BMS in STEMI patients
Clinical outcome
No patients were lost to follow-up. Adverse events during follow-up are listed in Table
5. The event-free survival was 73.6% in BMS patients and 86.0% in SES patients
(HR 1.96, 95% CI 1.17 to 3.30) (Fig. 3A). During follow-up 6 patients died (1.9%),
4 BMS patients and 2 SES patients (p = 0.44). Recurrent MI occurred in 9.2% of
BMS patients and 5.7% of SES patients (p = 0.24); in 7.2% and in 4.4% of the
patients this was related to a re-PCI procedure, respectively (p = 0.29). Spontaneous
MI, all related to stent thrombosis, occurred in 2.0% of BMS patients and in 1.3%
of SES patients (p = 0.68). Target lesion revascularization rate was 11.2% in BMS
patients and 3.2% in SES patients (p = 0.006). The clinically driven target lesion
revascularization rate was 7.9% in BMS patients and 2.5% in SES patients (p =
0.03). Target-vessel-failure-free survival was 84.7% in the BMS group and 93.0% in
the SES group (HR 2.24, 95% CI 1.09 to 4.60) (Fig. 3B). Clinical event rates were not
significantly different between patients who underwent follow-up angiography and
patients who did not.
Discussion
Compared with treatment with BMS, both in-segment LLL and target vessel failure
rates were significantly lower after treatment with SES in patients with acute MI.
However, after SES implantation LSM was seen more often than after implantation
of BMS.
Angiographic results
Angiographic in-segment LLL at 9-months’ follow-up was chosen as the primary
end point, since it reflects the luminal response of the treated segment, including
the segments just outside the stent. Late luminal loss is a surrogate but powerful
end point to compare the efficacy of stents for the prevention of restenosis.(20) Insegment LLL in the SES group was comparable to the LLL found in the angiographic
subgroup of the recently published TYPHOON (Trial to Assess the Use of the Cypher
Stent in Acute Myocardial Infarction Treated With Angioplasty).(9) The SES LLL was
in fact comparable to the LLL in stable angina patients and superior to LLL achieved
with BMS in other STEMI studies.(2,5,6) The rate of LLL in the BMS group was
slightly higher than in the TYPHOON study, which may be explained by the longer
implanted stent length in our study.
121
122
IVUS results
As in patients with stable angina, SES treatment in STEMI patients is associated with
negligible neointimal hyperplasia, whereas BMS treatment is associated with significant hyperplasia at follow-up.(21) This finding explains the low angiographic in-stent
restenosis rate in the SES group. However, despite excellent angiographic results, a
significant rate of LSM (37.5%) was observed in the SES group. The majority of these
malappositions was not present immediately after implantation but developed during
follow-up, predominantly along the body of the stent (20.2%). The rate of LSM after
SES in STEMI patients is even higher than observed in the SIRIUS (Sirolimus-Eluting
Stent in Coronary Lesions) (16.3%) and RAVEL (A Randomized Comparison of a
Sirolimus-Eluting Stent With a Standard Stent for Coronary Revascularization) (21%)
studies, both comparing SES with BMS in patients with stable and unstable angina.
(5,22) In line with our findings, acquired LSM in the SIRIUS study was also mainly
located alongside the body of stent.(22) There are only limited data about LSM after
stenting in STEMI patients. Hong et al.(23) reported an LSM rate of 11.5% after BMS
implantation. In contrast, LSM after drug-eluting stent implantation was present in
31.8% in an observational study of the same group.(24)
Late stent malapposition may be caused by 3 different factors: 1) insufficient stent
deployment during implantation; 2) resolution of thrombus and/or plaque behind the
stent; or 3) positive remodeling of the vessel wall. Persistent LSM, mainly involving
the proximal or distal edges of the stents, may be caused by insufficient stent deployment and is thought to be of minor clinical importance.(23) In contrast, acquired
LSM, especially when located along the body of the stent, may be due to an adverse
effect of the drug on the vessel wall resulting in positive remodeling. This type of
LSM cannot be avoided during stent implantation and raises concern about long-term
safety, as LSM has been related to very late (>1 year) stent thrombosis.(11,25)
Clinical outcome
The reduction of target vessel failure rate after SES implantation in STEMI patients
was in line with the results of the TYPHOON study.(9) In contrast, the PASSION
(Paclitaxel Eluting Stent Versus Conventional Stent in ST-Segment Elevation Myocardial Infarction) study, comparing paclitaxel-eluting stents and BMS in STEMI
patients, failed to demonstrate a reduction in the target vessel failure rate in the
paclitaxel-eluting stent group.(8) This difference may be explained by differences in
baseline characteristics such as a larger reference diameter and shorter implanted
stent length, differences in stent design and drug efficacy, or the lack of angiographic
follow-up in the PASSION study.(26)
Chapter 6 : SES versus BMS in STEMI patients
Mortality and MI rates were low in both groups. The MI rate was slightly higher
than in the TYPHOON study, possibly because of the strict definitions used in our
study. Of interest, the stent thrombosis rate at 12 months was lower and comparable to the results of the STRATEGY (Single High-Dose Bolus Tirofiban and
Sirolimus-ElutingStent vs. Abciximab and Bare-Metal Stent in Myocardial Infarction)
study (comparing SES with tirofiban and BMS with abciximab in STEMI patients).
(27) There were no cases of acute stent thrombosis (<24 h), possibly because of the
intensive antithrombotic regimen applied, including the administration of abciximab
in all patients. Late stent thrombosis (>30 days) occurred in 1 BMS patient (0.7%).
Study limitations
With regard to the outcome, the noninferiority design of the study is a relative limitation.(28) At the time of conception of the study, only limited information about the
efficacy of SES and third-generation BMS in STEMI patients was available. It was
assumed that, despite limited differences in late loss, third-generation BMS were
not inferior to drug-eluting stents with regard to efficacy, whereas adverse effects of
drug-eluting stents such as LSM and delayed re-endothelialization could be avoided
by using BMS.(11) Another limitation is that the angiographic and clinical results
of this study cannot be translated into general daily clinical practice, as this was a
single-center study in selected patients, and patients were followed using a strict
guideline-based follow-up protocol, which is not common practice yet. Moreover,
this study was underpowered to detect differences in safety events such as death,
recurrent MI, or stent thrombosis. Since IVUS follow-up was not possible in some
BMS patients because of restenosis, we cannot exclude that LSM was underestimated in the BMS group, although this is unlikely since these patients had more
neointimal growth. Finally, we cannot exclude that the routine angiographic follow-up
did result in additional revascularization procedures, magnifying the difference in
clinical outcome between BMS and SES.
Conclusions
The SES implantation in STEMI patients is associated with superior midterm clinical
and angiographic results compared with BMS implantation. However, LSM is frequently observed in STEMI patients treated with SES, raising concern about longterm safety warranting long-term clinical follow-up. Therefore, based on this study,
we cannot recommend or discourage SES use in STEMI patients.
123
124
Acknowledgement
Clinical Events Committee: A.V.G. Bruschke, MD, PhD, Leiden, The Netherlands
and S.A.I.P. Trines, MD, PhD, Leiden University Medical Center, Leiden, The Netherlands.
Chapter 6 : SES versus BMS in STEMI patients
References
1.
Zijlstra F, Hoorntje JC, de Boer MJ, et al. Long-term benefit of primary angioplasty as
compared with thrombolytic therapy for acute myocardial infarction. N Engl J Med
1999;341:1413-9.
2.
Grines CL, Cox DA, Stone GW, et al. Coronary angioplasty with or without stent implantation for acute myocardial infarction. Stent Primary Angioplasty in Myocardial Infarction
Study Group. N Engl J Med 1999;341:1949-56.
3.
Stone GW, Grines CL, Cox DA, et al. Comparison of angioplasty with stenting, with or
without abciximab, in acute myocardial infarction. N Engl J Med 2002;346:957-66.
4.
Fajadet JF, Wijns WF, Laarman GJ, et al. Randomized, double-blind, ulticenter study of the
Endeavor zotarolimus-eluting phosphorylcholine-encapsulated stent for treatment of native
coronary artery lesions: clinical and angiographic results of the ENDEAVOR II trial. Circulation 2006;114:798-806.
5.
Morice MC, Serruys PW, Sousa JE, et al. A randomized comparison of a sirolimus-eluting
stent with a standard stent for coronary revascularization. N Engl J Med 2002;346:177380.
6.
Moses JW, Leon MB, Popma JJ, et al. Sirolimus-eluting stents versus standard stents in
patients with stenosis in a native coronary artery. N Engl J Med 2003;349:1315-23.
7.
Stone GW, Ellis SG, Cox DA, et al. A polymer-based, paclitaxel-eluting stent in patients with
coronary artery disease. N Engl J Med 2004;350:221-31.
8.
Laarman GJ, Suttorp MJ, Dirksen MT, et al. Paclitaxel-eluting versus uncoated stents in
primary percutaneous coronary intervention. N Engl J Med 2006;355:1105-13.
9.
Spaulding C, Henry P, Teiger E, et al. Sirolimus-eluting versus uncoated stents in acute
myocardial infarction. N Engl J Med 2006;355:1093-1104.
10.
McFadden EP, Stabile E, Regar E, et al. Late thrombosis in drug-eluting coronary stents
after discontinuation of antiplatelet therapy. Lancet 2004;364:1519-21.
11.
Joner M, Finn AV, Farb A, et al. Pathology of drug-eluting stents in humans: delayed healing
and late thrombotic risk. J Am Coll Cardiol 2006;48:193-202.
12.
Liem SS, van der Hoeven BL, Oemrawsingh PV, et al. MISSION!: Optimization of acute and
chronic care for patients with acute myocardial infarction. Am Heart J. 2007 Jan;153:14.
e1-11
13.
Oemrawsingh PV, Mintz G, Schalij M, et al. Intravascular ultrasound guidance improves
angiographic and clinical outcome of stent implantation for long coronary artery stenoses:
125
final results of a randomized comparison with angiographic guidance (TULIP Study). Circulation 2003;107:62-7.
126
14.
Doucet S, Schalij MJ, Vrolix MC, et al. Stent placement to prevent restenosis after angioplasty in small coronary arteries. Circulation 2001;104:2029-33.
15.
Koning GF, Dijkstra JF, von Birgelen CF, et al. Advanced contour detection for three-dimensional intracoronary ultrasound: a validation - in vitro and in vivo. Int J Cardiovasc Imaging
2002;18:235-48.
16.
Mintz GS, Nissen SE, Anderson WD, et al. American College of Cardiology Clinical Expert
Consensus Document on Standards for Acquisition, Measurement and Reporting of Intravascular Ultrasound Studies (IVUS). A report of the American College of Cardiology Task
Force on Clinical Expert Consensus Documents. J Am Coll Cardiol 2001;37:1478-92.
17.
Mintz GS, Shah VM, Weissman NJ. Regional remodeling as the cause of late stent malapposition. Circulation 2003;107:2660-3.
18.
Alpert JS, Thygesen K, Antman E, et al. Myocardial infarction redefined--a consensus
document of The Joint European Society of Cardiology/American College of Cardiology
Committee for the redefinition of myocardial infarction. J Am Coll Cardiol 2000;36:959-69.
19.
Apple FS, Wu AH, Jaffe AS. European Society of Cardiology and American College of
Cardiology guidelines for redefinition of myocardial infarction: how to use existing assays
clinically and for clinical trials. Am Heart J 2002;144:981-6.
20.
Mauri LF, Orav EJ, Kuntz RE. Late loss in lumen diameter and binary restenosis for drugeluting stent comparison. Circulation 2005;111:3435-42.
21.
Serruys PW, Degertekin M, Tanabe K, et al. Intravascular ultrasound findings in the multicenter, randomized, double-blind RAVEL (RAndomized study with the sirolimus-eluting
VElocity balloon-expandable stent in the treatment of patients with de novo native coronary
artery Lesions) trial. Circulation 2002;106:798-803.
22.
Ako J, Morino Y, Honda Y, et al. Late incomplete stent apposition after sirolimus-eluting stent
implantation: a serial intravascular ultrasound analysis. J Am Coll Cardiol 2005;46:1002-5.
23.
Hong MK, Mintz GS, Lee CW, et al. Incidence, mechanism, predictors, and long-term
prognosis of late stent malapposition after bare-metal stent implantation. Circulation
2004;109:881-6.
24.
Hong MK, Mintz GS, Lee CW, et al. Late stent malapposition after drug-eluting stent
implantation: an intravascular ultrasound analysis with long-term follow-up. Circulation
2006;113:414-9.
25.
Cook S, Wenaweser P, Togni M, et al. Incomplete stent apposition and very late stent
thrombosis after drug-eluting stent implantation. Circulation 2007;115:2426-36.
Chapter 6 : SES versus BMS in STEMI patients
26.
Kastrati A, Dibra A, Eberle S, et al. Sirolimus-eluting stents vs paclitaxel-eluting stents
in patients with coronary artery disease: meta-analysis of randomized trials. JAMA
2005;294:819-25.
27.
Valgimigli MF, Percoco GF, Malagutti PF, et al. Tirofiban and sirolimus-eluting stent vs
abciximab and bare-metal stent for acute myocardial infarction: a randomized trial. JAMA
2005;293:2109-17.
28.
Piaggio G, Elbourne DR, Altman DG, et al. Reporting of noninferiority and equivalence
randomized trials: an extension of the CONSORT statement. JAMA 2006;295:1152-60.
127
Chapter 7
Cardiovascular risk in young
apparently healthy descendents
from Asian Indian migrants in the
Netherlands: the SHIVA study
Su San Liem
Pranobe V. Oemrawsingh
Suzanne C. Cannegieter
Saskia Le Cessie
Joop Schreur
Frits R. Rosendaal
Martin J. Schalij
Accepted Netherlands Heart Journal
130
Abstract
Background
Asian Indian migrants in the Western world are highly susceptible for ischaemic
heart disease (IHD). Until now, most IHD risk studies were performed in first and
second generation Asian Indian expatriates. For optimal prevention, knowledge of
the cardiovascular risk profile of younger generations is crucial.
Method
In a cross-sectional study we assessed the prevalence of conventional IHD risk
factors and Framingham risk score in asymptomatic third to seventh generation
Asian Indian descendants, compared with Europeans. Subjects were classified as
asymptomatic if they did not have documented IHD, diabetes, hypertension or high
cholesterol.
Results
A total of 1790 Asian Indians (45% men, age 35.9±10.7 years) and 370 native Dutch
hospital employees (23% men, age 40.8±10.1 years) were recruited. Asian Indians
had higher levels of total cholesterol, low-density lipoprotein, triglycerides, and lower
high-density lipoprotein levels than the Dutch. Glucose intolerance was present in
7.1 vs. 0.5% men, and in 6.1 vs. 1.4% women (both p<0.001). Asian Indian women
were more frequently obese (12 vs. 5%; p<0.001), and centrally obese (44 vs. 25%;
p<0.001) as compared with the Dutch women. Prevalence of most of the conventional
and modifiable cardiovascular risk factors in each ten-year age group was higher in
Asian Indians compared with controls, which reflected in higher Framingham risk
scores.
Conclusion
This study demonstrates the persistence of an unfavourable cardiovascular risk
profile in young, third to seventh generation migrated Asian Indians and supports an
aggressive screening and intervention strategy.
Chapter 7 : The SHIVA study
Introduction
Asian Indian people exhibit a high risk for the development of ischaemic heart disease (IHD).(1,2) This increased risk has been reported in emigrated Asian Indians as
well as in Asian Indians living in urban areas of their native countries.(1-3) In addition,
IHD becomes manifest at a younger age and is more often fatal, especially in young
Asian Indian men, as compared with other ethnic groups.(1,2,4)
The underlying mechanism of the higher risk of IHD in Asian Indians compared
with other ethnic groups is unclear. Conventional risk factors alone cannot explain
this excess risk, and other biological and environmental factors seem to play an
important role.(5) For example, although generally the degree of sub-clinical atherosclerosis is related to clinical cardiovascular events, Asian Indians appear to have less
atherosclerosis, yet they have more events.(5) Furthermore, clinical manifestations
of insulin resistance are consistently reported to be more frequent in Asian Indians
compared with other ethnic groups, irrespective of their geographical location.(6,7)
Insulin resistance is associated with the development of IHD and manifests as a
constellation of interrelated risk factors as notably elevated triglycerides levels, reduced high-density lipoprotein (HDL) levels, central obesity, hyperinsulinaemia and
an increased prevalence of diabetes type 2.(8) At a genetic level, explanations can be
found in adverse gene-environmental interactions and the thrifty gene hypothesis.
(9) Furthermore, the rural-urbanization shift in South Asia has the same deteriorating
effects on the risk profile and prevalence of IHD as the migration of Asian Indians to
Western countries.(3,10)
There is a large Asian Indian community in the Netherlands (approximately 200,000
persons). This community mainly consists of migrants from Surinam, a former South
American Dutch colony. Historically, the abolishment of slavery in 1863 was the start
of migration of Asian Indians from India to Surinam. These migrants were contract
workers on former plantations and were almost exclusively recruited from the Indian
state Bihar. The declaration of independence of Surinam in 1975 initiated a second
wave of migration of these Asian Indians, this time to the Netherlands. Nowadays,
these immigrants and their offspring form a third to seventh generation of Asian
Indians. As in other Western countries, these young generation Asian Indian descendants also exhibit higher rates of early onset cardiovascular morbidity and mortality
in comparison with the native Dutch population.(11)
Until now, most IHD risk studies in Asian Indians were performed in first and
second generation Asian Indian expatriates.(5,6,10,12,13) To optimize preventive
strategies in younger generations of this high-risk population, knowledge of the
131
132
current cardiovascular risk profile is crucial. Hence, we performed the SHIVA study
(Screening of HIndustans for cardioVAscular risk factors).
Methods
Design
SHIVA is a cross-sectional study, designed to assess the prevalence of conventional
IHD risk factors and the ten-year Framingham risk scores of asymptomatic third
to seventh generation Asian Indian migrants in the Netherlands.(14) All data were
compared with a control group comprising healthy native Dutch hospital employees.
Every participant provided written informed consent. The institutional ethical committee approved the study protocol.
Study population
Asian Indian subjects (aged 18 to 60 years) were recruited at the Milan cultural
festival held in The Hague in the Netherlands, in July 2004. This festival is organised
annually and attended by 50,000 to 60,000 Asian Indians. Subjects were classified
as Asian Indians if at least one parent’s ancestor originated from the Indian subcontinent. Considering the ancestors emigrated from South Asia in the latter part
of the 19th century, and based on one generation of 20 years, this group forms a
third to seventh generation of Asian Indian migrants. Asian Indians born in the Indian
subcontinent were excluded. The control group comprised healthy Dutch hospital
employees (Medical Center Haaglanden, The Hague, the Netherlands). Dutch origin
was defined as both parents being Dutch from European origin. Subjects were
classified as asymptomatic when they did not have documented IHD, diabetes,
hypertension or high cholesterol and were not receiving any form of treatment for
any of these conditions. All others were excluded.
A total of 2102 study participants and 560 controls were screened. Of them 502
subjects (19%) were excluded; 120 due to unknown or neither Asian Indian nor Dutch
origin; 122 Asian Indians because of unknown place of birth or born in the Indian
subcontinent; 214 participants for not being asymptomatic; and 46 subjects who did
not match the age range of interest (18 to 59 years). This left 1790 Asian Indians and
370 native Dutch subjects who were included in this analysis.
Chapter 7 : The SHIVA study
Procedures
Similar procedures were performed in both study and control group. The participants
completed a short questionnaire, including age, sex, medical history, family history
of cardiovascular disease, the use of medication, smoking habits, alcohol intake and
time of last meal. A positive family history was defined as a father, mother, brother or
sister who suffered from cardiovascular disease before the age of 60 years. Current
smoking was defined as using tobacco in the previous six months before participating in the SHIVA project.
Standardized anthropometric measurements, including height, weight and waist
circumference, were performed by trained nurses. The waist circumference was
defined as the narrowest circumference above the iliac crest and below the ribs. A
waist circumference of ≥94 cm (men) and ≥80 cm (women) was considered as outsized, a waist circumference of ≥102 cm (men) and ≥88 cm (women) was considered
as central obesity. Body mass index (BMI) was calculated (kg/m2), and overweight
was defined as a BMI ≥25 kg/m2 and obesity as a BMI ≥30 kg/m2.
Blood pressure was measured using an appropriately sized cuff in a sitting position. Hypertension was defined as a systolic blood pressure ≥160 mmHg and/or a
diastolic blood pressure ≥90 mmHg. The cut-off value for systolic hypertension was
set at 160 mmHg, while due to the setting, blood pressure measurements could be
performed only once instead of serially. In addition, we also estimated the prevalence
of subjects with the commonly used definition hypertension (systolic blood pressure
≥140 mmHg and/or a diastolic blood pressure ≥90 mmHg).(15)
Laboratory measurements were performed using the Cholestech LDX® analyser
(Cholestech Corporation, Hayward USA). From 35 µl of blood, drawn from the finger,
non-fasting total cholesterol, HDL cholesterol, triglycerides and glucose were measured. Low-density lipoprotein (LDL) cholesterol was estimated using Friedewald
formula.(16) Very-low-density lipoprotein (VLDL) was estimated by dividing the triglycerides value by a factor of 2.2. A total cholesterol of ≥6.5 mmol/l was considered
too high, and an HDL cholesterol ≤0.9 mmol/l too low. A non-fasting glucose of ≥7.8
mmol/l and ≤11 mmol/l was defined as impaired glucose tolerance. A non-fasting
glucose of >11 mmol/l was defined as diabetes mellitus.
Data collection
All data were entered into a customized database, and the ten-year Framingham
risk scores were calculated.(14) All participants received a printed copy of their risk
assessment and, if necessary, personal lifestyle recommendations.
133
134
Data analyses
Prevalence and mean of each risk factor were calculated for both groups. Since the
age distribution was different between control group and study group, risk factor data
of the control group were standardized for age by using the size of each five-year
age group of the study population as weights. Standard errors of these standardized values were obtained by calculation of a weighted average of the variances in
the age groups with the squared size of the age groups in the study population as
weights. 95% confidence intervals (CI) of the differences between the two groups
were calculated using the standard normal distribution.
To identify potentially modifiable risk factors in each age group, we assessed the
prevalence of risk factors in each ten-year age group. Moreover, as healthcare workers may be more health conscious, we also mirrored our ten-year age group risk
factor data with a Dutch population survey conducted on municipal health services
in 2001 (‘Regenboog’ project).(17) Individual estimated Framingham risk scores of
the Asian Indians were categorised as >10%, >15% and >20% for each five-year
age group, and for smokers and non-smokers.(14) All data were analysed with SPSS
v 12.0.1 (SPSS Inc., Chicago, Ill).
Results
Asian Indians on average were younger than Dutch subjects (men 35.8 years, 95%
CI 35.1 to 36.5 vs. 40.7 years, 95% CI 38.4 to 43.0, and women 36.0 years, 95% CI
35.3 to 36.7 vs. 40.8 years, 95% CI 39.7 to 42.0), although the age range was similar
(18 to 59 years). The groups were different with respect to sex distribution (men
45.4% in Asian Indians vs. 23.0% in the control group).
Prevalence of risk factors
Cardiovascular risk factors and blood chemistry measurements for both groups are
shown in table 1. Asian Indians had a higher prevalence of a positive family history of
cardiovascular disease, hypertension and diabetes compared with the control group.
Fewer Asian Indian women smoked compared with Dutch women. Both Asian Indian
men and women were more overweight compared with the control group. Asian
Indian women were more frequently obese and had more central obesity. These
differences were not seen in men.
Chapter 7 : The SHIVA study
In both Asian Indian men and women elevated cholesterol levels ≥6.5 mmol/l were
more prevalent compared with the controls. Asian Indians more frequently had a low
high-density lipoprotein (HDL). Mean low-density lipoprotein (LDL), triglycerides and
very-low-density lipoprotein (VLDL) levels were all higher in Asian Indians. Impaired
glucose tolerance was more common in Asian Indians compared with the controls.
Among the Asian Indians 0.7% men and 0.9% women were diagnosed as de novo
diabetes mellitus versus none in the control group.
Prevalence of risk factors per ten-year age group
To study the distribution of risk factors in each age group, prevalence of risk factors for each decade was determined in Asian Indians and Dutch subjects (table 2).
Several risk factors were already present in a considerable proportion of subjects
before the age of 30 years. Overweight, elevated cholesterol, low HDL and impaired
glucose tolerance were all more prevalent in Asian Indians compared with the Dutch
controls for both sexes regardless of age. Above the age of 40 years hypertension
was more prevalent in Asian Indians. Asian Indian men smoked more frequently
before the age of 50 compared with the control group. Asian Indian women had
more (central) obesity as compared with Dutch women in each age category.
Comparing ‘Regenboog’ data with data of Asian Indians, Asian Indian men had
more hypertension and lower HDL regardless of age, and in the youngest age group
central obesity was more prevalent. Asian Indian women exhibited more obesity
between the age of 40-49 years; more central obesity and low HDL in all age groups;
more hypertension between 30-49 years, and more diabetes de novo between 2029 years and 40-49 years.(17)
Framingham risk scores
In figure 1 the mean ten-year Framingham risk scores for each ten-year age group
are shown. Asian Indian men exhibited higher Framingham risk scores in all age
groups as compared with the controls. In Asian Indian women the same trend was
found.
Figure 2 presents the prevalence of increased ten-year Framingham risk (>10%)
in each five-year age group for smoking and non-smoking Asian Indians. As many
as 23% of smoking Asian Indian men aged 30-35 years had a risk >10%, whereas
non-smokers all had a risk ≤10%. In the age group 50-54 years all of the smoking
men had a ten-year risk >10%, and 77% had a risk >20%. In smoking Asian Indian
women between 40 and 44 years 29% had a ten-year risk >10%; this was all above
the age of 50 years.
135
380 (47)
Diabetes, n(%)
BMI ≥30 kg/m2, n(%)
1.01
291 (36)
HDL cholesterol (mmol/l)
≤0.9 mmol/l, n(%)
5.01
42 (5.2)
≥6.5 mmol/l, n(%)
Cholesterol (mmol/l)
340 (42)
79.1
Diastolic blood pressure (mmHg)
SBP ≥140 and/or DBP ≥90 mmHg, n(%)
136.8
Systolic blood pressure (mmHg)
168 (21)
135 (17)
-
≥102 cm for men or
≥88 cm for women, n(%)
SBP ≥160 and/or DBP ≥90 mmHg, n(%)
361 (44)
-
≥94 cm for men or
≥80 cm for women, n(%)
92.1
59 (7)
BMI ≥25 kg/m2, n(%)
Waist circumference
25.0
386 (47)
Body Mass Index (Kg/m2)
241 (30)
111 (14)
Smokers, n(%)
40-47
354 (44)
Hypertension, n(%)
Hyperlipidemia, n(%)
33-40
0.99-1.03
3.6-6.7
4.95-5.08
39-45
18-24
78.3-80.0
135.6-138.0
14-19
-
41-48
-
91.4-92.9
5-9
44-51
24.8-25.3
27-33
43-50
11-16
29-35
259 (32 )
Cardiovascular disease, n(%)
Family history of
95% CIb
Asian Indian
n=813
Men
12 (16)***
1.20***
0 (0)***
4.4***
38 (47)
17 (16)
79.0
138.0
13 (13)
-
36 (38)
-
90.5
6 (5)
34 (35)*
24.1*
19 (28)
14 (15)***
14 (19)
22 (24)***
19 (19)**
8-24
1.13-1.26
0.0-4.3
4.2-4.6
34-60
9-23
76.1-81.9
133.7-142.3
6-21
-
28-48
-
87.8-93.1
0.4-10
25-45
23.4-24.9
18-39
7-22
9-30
13-34
11-27
95% CIb
Dutch
n=85
a
102 (10)
1.24
33 (3.4)
4.75
239 (25)
163 (17)
78.1
125.3
429 (44)
705 (72)
86.4
116 (12)
445 (46)
24.9
132 (14)
497 (51)
183 (19)
487 (50)
297 (30)
9-12
1.23-1.26
2.2-4.5
4.69-4.80
22-27
14-19
77.4-78.9
124.2-126.4
41-47
69-75
85.7-87.1
10-14
42-49
24.6-25.2
11-16
48-54
16-21
47-53
28-33
95% CIb
Asian Indian
n=977
Women
3 (0.8)***
1.42***
3 (0.5)***
4.6*
71 (22)
44 (13)
77.3
126.0
77 (25)***
167 (54)***
81.6***
13 (5)***
79 (25)***
23.2***
61 (22)**
48 (15)***
67 (24)
122 (41)*
58 (19)***
0.0-1.8
1.38-1.45
0.0-1.1
4.5-4.7
17-26
9-17
76.1-78.4
124.2-127.9
20-31
48-61
80.3-82.8
2-7
20-30
22.8-23.6
16-27
11-20
18-29
35-47
14-24
95% CIb
Dutcha
n=285
136
1.0
5.3
VLDL (mmol/l)
Total cholesterol/HDL
6 (0.7)
0.1-1.3
5.4-8.9
5.8-6.0
49-56
5.2-5.4
0.98-1.06
2.5-2.7
2.82-2.94
0 (0)*
1 (0.5)***
5.1***
17 (20)***
3.9***
0.66***
1.6***
2.6**
0.0-4.3
0.03-6.4
4.8-5.3
13-28
3.6-4.1
0.58-0.75
1.3-1.9
2.4-2.7
9 (0.9)
59 (6.1)
5.86
160 (16)
3.98
0.77
1.72
2.73
0.3-1.5
4.6-7.6
5.77-5.94
14-19
3.92-4.05
0.74-0.79
1.66-1.77
2.68-2.78
0 (0)**
4 (1.4)***
5.3***
12 (3)***
3.3***
0.58***
1.26***
2.62*
0.0-1.3
0.0-2.9
5.1-5.4
1-5
3.2-3.4
0.54-0.61
1.18-1.34
2.53-2.70
Table 1. Cardiovascular risk factors of the Asian Indians and the Dutch control group by sex
a
In the Dutch control group: Means, % and 95% confidence intervals (CI) are standardised according to the age distribution of the Asian Indians.
b
95% CI of the mean in continuous variable and 95% CI of the percentage in categorical variable
* P<0.05; ** P<0.01; ***P<0.001; BMI, Body Mass Index; DBP, Diastolic blood pressure; SBP, Systolic blood pressure
58 (7.1)
>11 mmol/l, n(%)
5.9
≥7.8 mmol/l, n(%)
Non-fasting glucose
420 (52)
2.6
Triglycerides (mmol/l)
>5, n(%)
2.9
LDL cholesterol (mmol/l)
Chapter 7 : The SHIVA study
137
4
9
2
38
0
Body Mass Index ≥30 Kg/m2 (%)
Waist circumference ≥102 cm (%)
Cholesterol ≥6.5 mmol/L (%)
HDL cholesterol ≤0.9 mmol/l (%)
Glucose >11 mmol/L (%)
1
42
6
20
10
36
25
1
37
8
22
8
47
31
2
9
1
Cholesterol ≥6.5 mmol/L (%)
HDL cholesterol ≤0.9 mmol/l (%)
Glucose >11 mmol/L (%)
12
0
12
2
45
10
18
12
2
14
3
55
15
39
2
7
12
64
15
46
9
n=106
2
27
7
20
7
67
29
0
0
0
15
6
15
19
n=53
0
6
0
6
0
56
17
n=18
0
2
0
25
7
22
20
n=59
0
30
0
21
10
45
20
n=20
30-39
0
1
0
35
4
30
24
n=115
0
13
0
19
7
36
23
n=31
40-49
0
2
5
26
2
29
20
n=56
0
6
0
13
13
50
31
n=16
50-59
Dutch control group
20-29
0*
2
2
17
9
7
NA
n=89
0*
17
5
4
6
13
NA
n=75
0*
6
3
30
11
12
NA
n=177
2*
24
4
19
8
17
NA
n=151
30-39
0*
8
9
36
10
26
NA
n=159
4*
20
11
26
15
38
NA
n=176
40-49
2*
2
20
48
14
46
NA
n=180
5*
18
19
33
15
48
NA
n=192
50-59
“Regenboog” projectΨ
20-29
Ψ Viet AL, et al. (17) DBP, Diastolic blood pressure; HDL, High Density Lipoprotein; NA, data not available; SBP, Systolic blood pressure.
* Prevalence of fasting glucose ≥7.0 mmol/L in 50% of the men and 54% of the women
Table 2. Modifiable risk factors per 10-year age group by sex
11
26
Waist circumference ≥88 cm (%)
9
SBP ≥140 and/or DBP ≥90 mmHg (%)
Body Mass Index ≥30 Kg/m2 (%)
19
Smokers (%)
50-59
n=234 n=225 n=94
40-49
Asian Indian
30-39
n=243 n=251 n=310
35
SBP ≥140 and/or DBP ≥90 mmHg (%)
WOMEN
34
n=217
20-29
Smokers (%)
MEN
Age group (years)
138
Chapter 7 : The SHIVA study
Framingham risk score (%)
MEN
139
WOMEN
25
P=0.04
20
15
P<0.001
P<0.001
10
P=0.002
P=0.2
5
P<0.001
P=0.8
P=0.3
18-29
30-39
40-49
50-59
18-29
30-39
Age groups (years)
40-49
50-59
Age groups (years)
Asian Indians
Dutch control group
Figure 1.
Framingham risk score in men and women
SMOKERS
WOMEN
% of individuals
with a 10-yr risk >10%
MEN
% of individuals
with a 10-yr risk >10%
Figure 1
100
NON-SMOKERS
90
80
70
60
50
40
30
20
10
0
25-29
30-34
25-29
30-34
35-39 40-44
45-49
50-54 55-59
30-34
35-39
35-39 40-44
45-49
50-54 55-59
30-34
35-39
40-44
45-49
50-54
55-59
40-44
45-49
50-54
55-59
100
90
80
70
60
50
40
30
20
10
0
Age group (years)
Age group (years)
Risk score >10 -15%
Risk score >15 - 20%
Risk score >20%
Figure 2.
Prevalence of increased Framingham risk (>10%) in smoking and non-smoking Asian Indians
Figure 1
Figure 2
140
Discussion
The key finding of this study is the striking unfavourable IHD risk profile present
in young, apparently healthy third to seventh generation Asian Indians. Most of
the earlier studies of cardiovascular risk in Asian Indians involved first and second
generation migrants who were older than the subjects in this study.(5,6,10,12,13)
However, knowledge of the IHD risk profile of younger generations is of utmost
importance both for the development of prevention strategies and for the insight into
the aetiology of IHD disease in this high-risk population.
Prevalence of risk factors
In comparison with the Dutch control group, Asian Indians more often had a positive
family history for cardiovascular disease, hypertension, and diabetes. Furthermore,
levels of total cholesterol, VLDL and triglycerides were higher, HDL levels were lower,
and impaired glucose intolerance was more prevalent. These findings correspond
with prior studies reporting a high prevalence of insulin resistance in Asian Indians.
(18,19) Glucose intolerance, a predisposition to develop type 2 diabetes mellitus,
was diagnosed 14 times more often in Asian Indian men and four times more often
in Asian Indian women compared with Dutch controls.
Overweight was more common in both Asian Indian men and women compared
with the Dutch controls. With regard to the prevalence of (central) obesity a sex
difference was observed. In line with previous studies, Asian Indian women suffered
significantly more from obesity and central adiposity as compared with the control
group; no differences were found among men.(12,13,19) Furthermore, despite equal
proportion of (central) obesity in Asian Indian and Dutch men, Asian Indian men
exhibited higher rates of dyslipidaemia and glucose intolerance. This is in agreement
with the observation of Chandalia et al.(20) who reported that insulin resistance in
Asian Indian men is commonly present even in the absence of excessive body fat
content or abdominal obesity. Moreover, using the population specific cut-off points
from the International Diabetes Federation, the Asian Indian men had more central
obesity compared with the Dutch controls (59 vs. 38%), which suggests that Asian
Indians may easily be overlooked for adequate prevention interventions.(21)
Prevalence of risk factors with respect to age
Multiple modifiable risk factors were already present in a large number of Asian
Indians before the age of 30 years. Furthermore, prevalence of most risk factors was
higher in Asian Indians as compared with Dutch controls in each age group. Despite
Chapter 7 : The SHIVA study
the fact that 11% of the ‘Regenboog’ participants were known with hypertension and
3% with diabetes, important differences in the prevalence of risk factors remained
between our Asian Indians and the ‘Regenboog’ population.(17) As modification of
these cardiovascular risk factors affects long-term outcome, prevention strategies in
Asian Indians should focus on the younger age groups. Main targets should be to
revert conditions as overweight, dyslipidaemia and glucose intolerance, which can
be achieved by effective lifestyle changes and, if necessary, additional drug therapy.
(8) Adequate interventions can decrease the high prevalence of hypertension in
Asian Indians above the age of 40 years.(8,15) In addition, among Asian Indian men
smoking is an important issue to address.
Framingham risk score
The Asian Indians exhibited higher ten-year Framingham risk scores compared with
the control groups. Grundy et al.(22) stressed the importance of also focussing on
long-term risk (>10 years), which is especially interesting in young and middle-aged
adults. A risk score of 10% in a 30-year asymptomatic adult may still be considered
of limited clinical importance for the short-term; however, it will inevitably lead to
a risk >20% before the age of 50 years.(22) The guidelines of the joint European
societies have not defined a specific age threshold for screening.(23) In the Dutch
guidelines, an age of 50 years in smoking men and 55 years in smoking women
is recommended.(24) This is based on the chance to identify an individual with a
ten-year risk of IHD >10%.(24) Our prevalence data of Asian Indian subjects with a
Framingham risk >10% indicate that on the same basis, screening may be justified
in smoking Asian Indian men at the age of 30 and smoking Asian Indian women at
the age of 40. These screening time points can be extended with five years in the
non-smoking Asian Indian population. However, further study is necessary to assess
the health benefits and cost-effectiveness of this approach.
Limitations
There are some limitations to be discussed. First, persons with cardiovascular disease in the family might have been keener to participate than those without, hence
attracting volunteers with a higher risk profile for IHD than non-volunteers. A subanalysis in those without a known family history of cardiovascular disease resulted in
similar results with slight variations due to the smaller sizes of the groups.
141
142
Second, due to the setting, non-fasting blood samples were used for chemistry
measurements in most of the study and control subjects. This affected the VLDL,
LDL and triglycerides measurements.(25) Slight underestimation or overestimation
of the prevalence of glucose intolerance and de novo diabetes can not be excluded.
In addition, blood pressure measurements were performed only once instead of
serially, and white-coat effect also varies between different ethnicities.(26) Although
the cut-off value for systolic hypertension was chosen higher than commonly used,
overestimation of hypertension prevalence may have occurred.
Lastly, a recalibrated model for IHD risk prediction specified to Asian Indians does
not exist. Small sample size studies revealed that the Framingham model seems
to predict IHD outcomes in this group fairly well, whereas the SCORE model does
not.(27) Others recommend adjusting the underestimation of risk in Asian Indians
by multiplying IHD risk with factor 1.79 or to lower the risk threshold, which seems
reasonable regarding the higher prevalence of IHD in Asian Indians.(28,29) Additionally, risk factors such as obesity, a family history of premature cardiovascular disease
and elevated triglyceride levels are common in our study population, but not included
in the Framingham assessment.(22) Nevertheless, these risk function models are
still the best guiding tools for risk reduction management in daily clinical practice.
(22,23)
Conclusions
The results of this study demonstrate that conventional and modifiable risk factors
are already present at a young age in a significant number of apparently healthy
third to seventh generation Asian Indians. In order to modify this risk profile, and
thereby to decrease the chance of subsequent early onset of cardiovascular events,
screening followed by adequate treatment should start at a younger age than recommended in the current guidelines.
Acknowledgement
We thank Mrs A. Mahabier Panday (BBA) and Drs R.D.A. Baboeram for their support
in organizing and facilitating this study.
Chapter 7 : The SHIVA study
References
1.
Balarajan R. Ethnic differences in mortality from ischaemic heart disease and cerebrovascular disease in England and Wales. BMJ 1991;302:560-4.
2.
Enas EA, Yusuf S, Mehta JL. Prevalence of coronary artery disease in Asian Indians. Am J
Cardiol 1992;70:945-9.
3.
Singh RB, Sharma JP, Rastogi V, Raghuvanshi RS, Moshiri M, Verma SP, et al. Prevalence
of coronary artery disease and coronary risk factors in rural and urban populations of north
India. Eur Heart J 1997;18:1728-35.
4.
Yusuf S, Hawken S, Ounpuu S, Dans T, Avezum A, Lanas F, et al. Effect of potentially modifiable risk factors associated with myocardial infarction in 52 countries (the INTERHEART
study): case-control study. Lancet 2004;364:937-52.
5.
Anand SS, Yusuf S, Vuksan V, Devanesen S, Teo KK, Montague PA, et al. Differences in risk
factors, atherosclerosis, and cardiovascular disease between ethnic groups in Canada: the
Study of Health Assessment and Risk in Ethnic groups (SHARE). Lancet 2000;356:279-84.
6.
McKeigue PM, Ferrie JE, Pierpoint T, Marmot MG. Association of early-onset coronary heart
disease in South Asian men with glucose intolerance and hyperinsulinemia. Circulation
1993;87:152-61.
7.
Misra A, Vikram NK. Insulin resistance syndrome (metabolic syndrome) and obesity in
Asian Indians: evidence and implications. Nutrition 2004;20:482-91.
8.
Grundy SM, Cleeman JI, Daniels SR, Donato KA, Eckel RH, Franklin BA, et al. Diagnosis and
management of the metabolic syndrome: an American Heart Association/National Heart,
Lung, and Blood Institute Scientific Statement. Circulation 2005;112:2735-52.
9.
Khunti K, Samani NJ. Coronary heart disease in people of south-Asian origin. Lancet
2004;364:2077-8.
10.
Bhatnagar D, Anand IS, Durrington PN, Patel DJ, Wander GS, Mackness MI, et al. Coronary
risk factors in people from the Indian subcontinent living in west London and their siblings
in India. Lancet 1995;345:405-9.
11.
Bos V, Kunst AE, Keij-Deerenberg IM, Garssen J, Mackenbach JP. Ethnic inequalities in
age- and cause-specific mortality in The Netherlands. Int J Epidemiol 2004;33:1112-9.
12.
Bhopal R, Unwin N, White M, Yallop J, Walker L, Alberti KG, et al. Heterogeneity of coronary
heart disease risk factors in Indian, Pakistani, Bangladeshi, and European origin populations: cross sectional study. BMJ 1999;319:215-20.
143
144
13.
Cappuccio FP, Cook DG, Atkinson RW, Strazzullo P. Prevalence, detection, and management
of cardiovascular risk factors in different ethnic groups in south London. Heart 1997;78:55563.
14.
Wilson PW, D’Agostino RB, Levy D, Belanger AM, Silbershatz H, Kannel WB. Prediction of
coronary heart disease using risk factor categories. Circulation 1998;97:1837-47.
15.
Whitworth JA. 2003 World Health Organization (WHO)/International Society of Hypertension (ISH) statement on management of hypertension. J Hypertens 2003;21:1983-92.
16.
Friedewald WT, Levy RI, Fredrickson DS. Estimation of the concentration of low-density
lipoprotein cholesterol in plasma, without use of the preparative ultracentrifuge. Clin Chem
1972;18:499-502.
17.
Viet AL, van den Hof S, Elvers LH, Ocké MC, Vossenaar M, Seidel JC, et al. Risk factors and
health in the Netherlands: a survey on municipal health services (REGENBOOG project).
2001 http://www.rivm.nl/bibliotheek/rapporten/260854004.pdf
18.
Knight TM, Smith Z, Whittles A, Sahota P, Lockton JA, Hogg G, et al. Insulin resistance,
diabetes, and risk markers for ischaemic heart disease in Asian men and non-Asian in
Bradford. Br Heart J 1992;67:343-50.
19.
McKeigue PM, Shah B, Marmot MG. Relation of central obesity and insulin resistance with
high diabetes prevalence and cardiovascular risk in South Asians. Lancet 1991;337:382-6.
20.
Chandalia M, Abate N, Garg A, Stray-Gundersen J, Grundy SM. Relationship between generalized and upper body obesity to insulin resistance in Asian Indian men. J Clin Endocrinol
Metab 1999;84:2329-35.
21.
International Diabetes Federation. The IDF consensus worldwide definition of the metabolic
syndrome. 2005. http://www.idf.org/home/
22.
Grundy SM, Pasternak R, Greenland P, Smith S Jr, Fuster V. AHA/ACC scientific statement:
Assessment of cardiovascular risk by use of multiple-risk-factor assessment equations:
a statement for healthcare professionals from the American Heart Association and the
American College of Cardiology. J Am Coll Cardiol 1999;34:1348-59.
23.
De Backer G, Ambrosioni E, Borch-Johnsen K, Brotons C, Cifkova R, Dallongeville J, et al.
European guidelines on cardiovascular disease prevention in clinical practice. Third Joint
Task Force of European and Other Societies on Cardiovascular Disease Prevention in Clinical Practice. Eur Heart J 2003;24:1601-10.
24.
Dutch Society of General Practitioners. NHG-standard Cardiovascular Risk Management.
Houten, the Netherlands: Bohn Stafleu van Loghum, 2006.
25.
Rifai N, Merrill JR, Holly RG. Postprandial effect of a high fat meal on plasma lipid, lipoprotein cholesterol and apolipoprotein measurements. Ann Clin Biochem 1990;27:489-93.
Chapter 7 : The SHIVA study
26.
Agyemang C, Bhopal R, Bruijnzeels M, Redekop WK. Does the white-coat effect in people
of African and South Asian descent differ from that in White people of European origin? A
systematic review and meta-analysis. Blood Press Monit 2005;10:243-8.
27.
Bhopal R, Fischbacher C, Vartiainen E, Unwin N, White M, Alberti G. Predicted and observed
cardiovascular disease in South Asians: application of FINRISK, Framingham and SCORE
models to Newcastle Heart Project data. J Public Health 2005;27:93-100.
28.
Aarabi M, Jackson PR. Predicting coronary risk in UK South Asians: an adjustment method
for Framingham-based tools. Eur J Cardiovasc Prev Rehabil 2005;12:46-51.
29.
Cappuccio FP, Oakeshott P, Strazzullo P, Kerry SM. Application of Framingham risk estimates
to ethnic minorities in United Kingdom and implications for primary prevention of heart
disease in general practice: cross sectional population based study. BMJ 2002;325:1271.
145
Chapter 8
Role of calcified spots detected
by intravascular ultrasound in
patients with ST-segment elevation
acute myocardial infarction
Barend L. van der Hoeven
Su-San Liem
Pranobe V. Oemrawsingh
Jouke Dijkstra
J.Wouter Jukema
Hein Putter
Douwe E. Atsma
Ernst E. van der Wall
Jeroen J. Bax
Johan C. Reiber
Martin J. Schalij
Am J Cardiol 2006; 98: 309-13
148
Abstract
Background
Electron Beam Computed Tomography studies have demonstrated that the extent of
intracoronary calcium is related to the risk of coronary events.
Objective and methods
This study was performed to gain further insight in the distribution of focal calcifications and their relation to the site of plaque rupture within the culprit artery of
consecutive patients (n = 60) with an acute myocardial infarction (AMI) using Intravascular Ultrasound (IVUS) imaging. Calcifications in the culprit lesion and adjacent
segments were classified and counted according to their arc (<45, 45-90, 90-180,
>180º), length (<1.5, 1.5-3.0, 3.0-6.0, >6.0 mm) and dispersion (number of spots
per millimeter). Calcifications at the edge of a visible rupture or ulceration were
considered to be related to the AMI.
Results
Compared to adjacent proximal and distal segments, the culprit lesion contained
more calcified spots per millimeter (respectively 0.14, 0.10, and 0.21; p <0.05). Small
calcified spots (arc <45º, length of <1.5mm) were more common (p <0.05). Plaque
rupture or ulceration was manifest in 31 culprit lesions (52%) of which 14 (45%)
contained focal calcifications. These calcified spots extended more often to 90-180
degrees of the vessel circumference and were more often of moderate length (3-6
mm) when compared culprit lesions without visible plaque rupture (p <0.05).
Conclusions
We conclude that culprit lesions in patients with AMI contain more and smaller calcifications compared to adjacent segments. Calcifications related to plaque rupture
appear to be larger and extend over a wider arc compared to these calcified spots.
Those larger calcified spots may play a role in plaque instability in a subgroup of
lesions.
Chapter 8 : Calcified spots in patients with acute myocardial infarction
Introduction
Electron beam computer tomographic studies have demonstrated that the calcium
burden in coronary arteries is related to the incidence of acute coronary syndromes.
(1-6) However, several studies have reported that patients with unstable angina or
acute myocardial infarction (AMI) generally have less extensive calcification within the
culprit lesion compared with patients with stable angina.(7,8) The role of intracoronary
calcium in the pathogenesis of AMI is therefore not fully understood. In most patients
with acute coronary syndromes, the culprit lesion is characterized by a fibrofatty
plaque composition with positive remodeling and focal calcified spots.(9) Moreover,
the number of calcifications with an arc of <90 degrees within these lesions was larger
compared with the number in patients with stable angina. However, a causal relation
between intracoronary calcifications and plaque rupture remains to be demonstrated.
To gain further insight in the distribution of intracoronary calcifications and their relation with the site of plaque rupture, we performed an intravascular ultrasound (IVUS)
imaging study of culprit arteries in patients presenting with ST-segment elevation AMI.
Methods
From February to July 2004, 95 consecutive patients with ST-segment elevation AMI
who were referred to our hospital for primary percutaneous coronary intervention
(PCI) were considered for this study. Patients with previous PCI or bypass grafting
of the infarct-related artery (n = 8), refusal to sign informed consent (n = 2), or
anatomic factors comprising a potential risk from IVUS in the acute phase (n = 17)
were excluded. The institutional ethical committee approved the protocol. Written
informed consent was obtained from all patients before starting the PCI procedure.
Before the procedure all patients received 5,000U of heparin and a loading dose of
300 mg of acetylsalicylic acid and 300 mg of clopidogrel. Intravenous abciximab was
administered as a bolus (0.25 µg/kg) and infused at 0.125 µg/kg/min for 12 hours (maximum 10 µg/kg/min) in all patients. Abciximab was started before the PCI procedure.
IVUS was performed with 2.9Fr 20-MHz catheters (Eagle Eye, Volcano, Brussels,
Belgium). The ultrasound transducer was carefully advanced beyond the culprit
lesion under fluoroscopic guidance, immediately after crossing the stenosis with
the guidewire. Automated pullback at 0.5mm/s was performed from 15mm distal to
the culprit lesion to the coronary ostium after intracoronary nitroglycerin. All images
were acquired and stored digitally.
149
150
Quantitative analysis was performed with QCU-CMS 4.0 (Medis, Leiden, The
Netherlands).(10) From a distal major side branch to a proximal major side branch or
the coronary ostium, the vessel and lumen contours were detected semiautomatically. The reference lumen area of the culprit lesion was derived from interpolation
between the proximal and distal reference lumen areas. Start of the lesion was
defined as the point where the lumen decreased in comparison with the calculated
reference area. The end of the lesion was the point where the lumen equalized the
interpolated reference area.
Plaque type was determined to be fibrofatty if >70% of the plaque had a gray value
lower than the adventitia and fibrous if the gray value was equivalent or exceeded
the adventitia in >70% of the plaque.(11) A calcified plaque had an arc >180° of
calcium in ≥1 frame of the lesion. All other plaques were considered mixed. Plaque
eccentricity at the site of plaque rupture was calculated as: (maximal plaque thickness - minimal plaque thickness) / maximal plaque thickness. Plaque burden was
calculated from the formula: (vessel area - lumen area) / vessel area x 100%. Plaque
rupture was identified by a tear in a fibrous cap or clear ulceration of a coronary
plaque without enlargement of the external elastic membrane within 10mm of the
minimal lumen area. Calcifications at the edge of visible plaque rupture or inside an
ulceration were considered related to the AMI. The remodeling index was defined as
the ratio of the interpolated external elastic membrane cross-sectional area to the
observed external elastic membrane cross-sectional area at the site of the minimum
lumen area. Calcium was identified as a bright echogenic spot with acoustic shadowing. Calcified spots were described within the lesion and 15mm proximal and distal
of the lesion. If a calcified spot crossed the segment border, it was proportionally
attributed to the respective segment. Calcified spots were categorized according to
their maximum arc (<45°, 45°-90°, 90°-180°, ≥180°) and length (<1.5, 1.5 to 3, 3 to 6,
≥6 mm). The number of spots divided by segment length was calculated to evaluate
the dispersion of calcified spots. Figure 1 shows different plaque characteristics and
Figure 2 an example of the distribution of calcified spots within a culprit lesion and
adjacent segments.
Results are expressed as mean ± SD. Means of paired variables were compared
with paired-sample t test if the distribution was normal. Otherwise, Wilcoxon’s ranksum test was used. Categorical variables were evaluated with chi-square test. Correlation of sets of continuous variables was calculated by Pearson’s method. If the data
were normally distributed, 1-way analysis of variance was used to compare ≥3 paired
variables. Otherwise, the Kruskal-Wallis test was used. Bonferroni’s correction was
used if applicable. A p value <0.05 was considered statistically significant.
Chapter 8 : Calcified spots in patients with acute myocardial infarction
310
The American Journal of Cardiology (www.AJConline.org)
151
Proximal (A)
Lesion (B)
Distal (C)
Vessel (EEM) CSA
(green circles)
20.1 mm2
20.2 mm2
16.8 mm2
Lumen area
(red circles)
12.0 mm2
2.0 mm2
9.25 mm2
Plaque type
soft
soft
soft
Plaque eccentricity
(white lines)
0.65
0.68
0.76
no
single spot (240)
Remodeling index
Calcium (Arc)
1.09
single spot (210)
Figure 1. (A to C) Definition and examples of plaque characteristics and quantitative measurements of the culprit lesion and reference segments. CSA �
cross-sectional area; EEM � external elastic membrane.
Figure 1.
(A to C) Definition and examples of plaque characteristics and quantitative measurements of
the 1culprit lesion and reference segments. CSA = cross-sectional
area; EEM = external elastic
Table
Table 2
Baseline
characteristics (n � 60)
Plaque characteristics per segment
membrane.
Age (yrs)
Men
Diabetes mellitus
History of hypertension
History of hyperlipidemia or statin use
Smoker
Previous MI, PCI, or coronary bypass surgery
Culprit vessel
Left anterior descending artery
Right coronary artery
Left circumflex artery
Results
57.5 � 12.7
49 (82%)
5 (8%)
13 (21%)
9 (15%)
36 (59%)
3 (5%)
39 (65%)
Segment length (mm)
Plaque type
Fibrofatty
Fibrous
Mixed
Calcified
Plaque eccentricity
Calcified spots (n)
Calcified spots/segment (n)
Length (mm)
Median
Range
Maximum arc (°)
Median
Range
No. of spots/mm*
Length of all spots/mm†
Proximal
(n � 56)
Lesion
(n � 60)
Distal
(n � 59)
9.5 � 5.0
18.8 � 6.8
14.0 � 2.7
32 (57%)
9 (16%)
13 (23%)
2 (4%)
0.78 � 0.17
58
1.07 � 1.09
26 (43%)
7 (12%)
14 (23%)
13 (22%)
0.72 � 0.18
219
3.62 � 2.63
40 (68%)
10 (17%)
9 (15%)
0 (0.0%)
0.71 � 0.20
79
1.34 � 1.80
20 (33%)
In 68 patients who were eligible for
IVUS, adequate IVUS pullbacks for analysis were
1 (2%)
obtained in 60; their baseline characteristics are listed in Table 1. In 8 patients it
2.30
1.865) or 2.05
was not possible to advance the IVUS catheter beyond the stenosis
(n =
the
0.26–15.00
0.16–15.85
0.17–14.02
mm/s was performed from �15 mm distal to the culprit
lesion
to the coronary
ostium was
after intracoronary
motorized
pullback
of poor nitroglycquality (n = 3). At the start of50 the procedure,
35
45
38
erin. All images were acquired and stored digitally.
7–243
7–360
14–149
patients
(58%)
Thrombolysis
In Myocardial
Infarction grade
0 to 1 flow, whereas
Quantitative
analysishad
was performed
with QCU-CMS
4.0
0.14 � 0.16 0.21 � 0.16 0.10 � 0.14
(Medis, Leiden, The Netherlands).10 From a distal major
0.383�flow.
0.40 0.54 � 0.45 0.27 � 0.39
25
(42%)
had
Thrombolysis
In
Myocardial
Infarction
grade
2
to
side branch to a proximal major side branch or the coronary
* p �0.001, lesion versus distal; p � 0.001, lesion versus proximal; NS,
ostium,
the vesselwithin
and lumen
contours
werelesion
detected was
semi- detected
Calcium
the
culprit
in distal.
53 patients (88%). Within the
proximal versus
†
automatically. The reference lumen area of the culprit lesion
p �0.001, lesion versus distal; p �0.001, lesion versus proximal; NS,
proximal
and
distal
segments,
calcium
was
identified
in 41 (68%) and 32 (53%) segwas derived from interpolation between the proximal and
proximal versus distal.
ments, respectively. Of all calcified spots within the culprit lesion, 19 (9%) crossed
the proximal and 10 (5%) the distal lesion border. Of these 29 spots, the maximum
arc was located within the culprit lesion in 21 (72%). Additional plaque characteristics
of the culprit lesion in comparison with adjacent segments are presented in Table
Table 3
Distribution of calcified spots per segment, sorted by arc and length
Arc*
Proximal
Lesion
Distal
Length (mm)*
�45°
45–90°
90–180°
�180°
�1.5 mm
1.5–3 mm
3–6 mm
0.062† (27)
0.105 (105)
0.053† (44)
0.051 (21)
0.056 (63)
0.037 (26)
0.022 (8)
0.034 (38)
0.010† (9)
0.003† (2)
0.013 (13)
0.000† (0)
0.036† (19)
0.078 (88)
0.034† (28)
0.021 (11)
0.043 (49)
0.035 (29)
0.032 (17)
0.039 (44)
0.019 (16)
* Average number of spots per millimeter of segment (total number of spots).
p �0.05 versus lesion.
†
152
Figure 2. Example of distribution of calcified spots, visible as bright echogenic spots with acoustic shadowing (arrows), within the culprit lesion.
Figure 2.
Example
distribution
of of
calcified
spots,
visible as bright
withwere
acoustic
distal
referenceoflumen
areas. Start
the lesion
was defined
rupture echogenic
or inside anspots
ulceration
considered related to
shadowing
(arrows),
theinculprit
lesion.
as the
point where
the lumenwithin
decreased
comparison
with
the AMI. The remodeling index was defined as the ratio of
the calculated reference area. The end of the lesion was the
point where the lumen equalized the interpolated reference
area.
Age type was determined to be fibrofatty if �70% of
Plaque
the plaque had a gray value lower than the adventitia and
Men
fibrous if the gray value was equivalent or exceeded the
adventitia
in �70%
of the plaque.11 A calcified plaque had
Diabetes
mellitus
an arc �180° of calcium in �1 frame of the lesion. All other
History
of considered
hypertension
plaques
were
mixed. Plaque eccentricity at the
siteHistory
of plaque
rupture was calculated
as: use
(maximal plaque
of hyperlipidemia
or statin
thickness � minimal plaque thickness)/maximal plaque
Smoker
thickness. Plaque burden was calculated from the formula:
(vessel
area �
lumen area)/vessel
Previous
myocardial
infarction,area
PCI �
or 100%.
CABG Plaque
rupture was identified by a tear in a fibrous cap or clear
Culprit of
vessel
ulceration
a coronary plaque without enlargement of the
external elastic membrane within 10 mm of the minimal
Left anterior descending artery
lumen area. Calcifications at the edge of visible plaque
Right coronary artery
the interpolated external elastic membrane cross-sectional
area to the observed external elastic membrane cross-sectional area at the site of the minimum lumen area. Calcium
57.5 ± 12.7
was identified as a bright echogenic
spot yrs
with acoustic
shadowing. Calcified spots were described within the lesion
49 (82%)
and 15 mm proximal and distal of the lesion. If a calcified
spot crossed the segment border, 5it (8%)
was proportionally
attributed to the respective segment. Calcified spots were
13 (21%)
categorized according to their maximum
arc (�45°, 45° to
90°, 90° to 180°, �180°) and length9(�1.5,
(15%)1.5 to 3, 3 to 6,
�6 mm). The number of spots divided by segment length
36 (59%)
was calculated to evaluate the dispersion
of calcified spots.
Figure 1 shows different plaque characteristics
3 (5%) and Figure 2
an example of the distribution of calcified spots within a
culprit lesion and adjacent segments.
Results are expressed as mean � SD. Means of paired
39 (65%)
variables were compared with paired-sample t test if the
20 (33%)
Left circumflex artery
1 (2%)
Table 1. Baseline characteristics (n = 60)
2. The number of calcified spots and their mean length per millimeter of analyzed
segment were increased within the culprit lesion compared with proximal and distal
segments. As presented in Table 3, especially calcified spots with a small arc and a
short length were more frequent within the culprit lesion.
Chapter 8 : Calcified spots in patients with acute myocardial infarction
Proximal (n=56)
Lesion (n=60)
Distal (n=59)
9.5 ± 5.0
18.8 ± 6.8
14.0 ± 2.7
32 (57%)
26 (43%)
40 (68%)
Segment length (mm)
Plaque type
Fibrofatty
Fibrous
9 (16%)
7 (12%)
10 (17%)
Mixed
13 (23%)
14 (23%)
9 (15%)
Calcified
2 (4%)
13 (22%)
0 (0.0%)
Plaque eccentricity
0.78 ± 0.17
0.72 ± 0.18
0.71 ± 0.20
Calcified spots (n)
58
219
79
1.07 ± 1.09
3.62 ± 2.63
1.34 ± 1.80
Calcified spots / segment (n)
Length (mm)
Median
2.30
1.86
2.05
Range
0.26–15.00
0.16–15.85
0.17–14.02
Maximum arc (º)
Median
50
45
38
Range
7–243
7–360
14–149
0.14 ± 0.16
0.21 ± 0.16
0.10 ± 0.14
0.38 ± 0.40
0.54 ± 0.45
0.27 ± 0.39
Number of spots / mm*
Length of all spots / mm
†
Table 2. Plaque characteristics per segment
* p<0.001, lesion versus distal; p=0.001, lesion versus proximal; NS, proximal versus distal.
† p<0.001, lesion versus distal; p<0.001, lesion versus proximal; NS, proximal versus distal.
Arc *
<45º
Length (mm)*
45-<90º
90-<180º
≥180º
<1.5
0.051
(21)
0.022
(8)
0.003
(2)
0.036
(19)
1.5-<3
3-<6
≥6
†
0.021
(11)
0.032
(17)
0.019
(10)
Proximal
0.062
(27)
Lesion
0.105
(105)
0.056
(63)
0.034
(38)
0.013
(13)
0.078
(88)
0.043
(49)
0.039
(44)
0.027
(31)
Distal
0.053†
(44)
0.037
(26)
0.010†
(9)
0.000†
(0)
0.034†
(28)
0.035
(29)
0.019
(16)
0.006†
(5)
†
†
Table 3. Distribution of calcified spots per segment, sorted by arc and length
* Average number of spots / mm segment (total number of spots); † p<0.05 versus lesion
There was a significant positive correlation between the length and maximum arc
of calcified spots (R2=0.44, p=0.01). There was no relation between plaque thickness or eccentricity and number of calcified deposits per millimeter or maximum
calcium arc within the culprit lesion. Moreover, type of remodeling was not related
to maximum arc of calcium or number of calcified spots per millimeter.
153
154
Plaque rupture was observed in 31 patients (52%). The rupture was located at the
shoulder of the plaque in 22 (69%) of these lesions and at the center of the plaque
in 9 (31%). In 14 lesions (45%) with discernible plaque rupture, calcified spots were
present at the edge of a rupture or inside an ulceration. Lesions with a noticeable
plaque rupture related to a calcified spot had more calcified spots per millimeter
compared with lesions without a detectable rupture or lesions with an evident rupture without associated calcified spots (0.29 ± 0.17 vs. 0.17 ± 0.15 vs. 0.18 ± 0.17, p
<0.05). In these lesions, especially spots with an arc of 90° to 180° (0.069 ± 0.077
vs. 0.028 ± 0.046 vs. 0.009 ± 0.018) and a length of 3 to 6 mm (0.068 ± 0.065 vs.
0.029 ± 0.049 vs. 0.022 ± 0.035) were significantly more common (p <0.05 for the
2 comparisons). Figure 3 displays some examples of the relation between plaque
312rupture
and ulcerations inThedifferent
lesions.
American Journal
of Cardiology (www.AJConline.org)
Figure
3. Relation
between calcified
spots andcalcified
plaque ruptures
or ulcerations.
(A) Siteruptures
of plaque rupture
(arrow) within a fibrofatty plaque without evidence
Figure
3. Relation
between
spots
and plaque
or ulcerations.
of calcified spots. (B) Plaque rupture with calcified spots on the bottom of an ulceration, including a residual fibrous cap (arrow). (C) Plaque ulceration
(A) on
Site
ofaplaque
rupture
(arrow)
top of
large calcium
spot. (arrow) within a fibrofatty plaque without evidence of calcified spots. (B)
Plaque rupture with calcified spots on the bottom of an ulceration, including a residual fibrous cap
distribution
normal. Otherwise,
rupture
was spot.
located at the shoulder of the plaque in 22
(arrow). was
(C) Plaque
ulcerationWilcoxon’s
(arrow) onrank-sum
top of a large
calcium
test was used. Categorical variables were evaluated with
(69%) of these lesions and at the center of the plaque in 9
chi-square test. Correlation of sets of continuous variables
(31%). In 14 lesions (45%) with discernible plaque rupture,
was calculated by Pearson’s method. If the data were norcalcified spots were present at the edge of a rupture or inside
mally distributed, 1-way analysis of variance was used to
an ulceration. Lesions with a noticeable plaque rupture
compare
�3 paired variables. Otherwise, the Kruskal-Wallis
Discussion
related to a calcified spot had more calcified spots per
test was used. Bonferroni’s correction was used if applicable.
millimeter compared with lesions without a detectable rupA p value �0.05 was considered statistically significant.
ture or lesions with an evident rupture without associated
In 68 key
patients
who were
eligiblestudy
for IVUS,
calcified
spots (0.29
� 0.17 vs 0.17
� 0.15
vs 0.18
� 0.17, p
The
finding
of this
wasadequate
that culprit
lesions
in patients
with
AMI
contain
IVUS pullbacks for analysis were obtained in 60; their
�0.05). In these lesions, especially spots with an arc of 90° to
morecharacteristics
and smaller
calcified
compared
segments.
Moreover,
baseline
are listed
in Table 1.spots
In 8 patients
it
180°with
(0.069 adjacent
� 0.077 vs 0.028
� 0.046 vs 0.009
� 0.018) and
was not possible to advance the IVUS catheter beyond the
a length
3 to 6of
mmthese
(0.068 ruptures
� 0.065 vs 0.029
� 0.049 vs
plaque rupture was evident in 52% of patients
andof45%
contained
stenosis (n � 5) or the motorized pullback was of poor
0.022 � 0.035) were significantly more common (p �0.05 for
quality
(n � 3). Atcalcified
the start of deposits.
the procedure,
35 patients
associated
The
calcified spots,
which might
associated
with
the 2 comparisons).
Figure 3 be
displays
some examples
of the
(58%) had Thrombolysis In Myocardial Infarction grade 0
relation between plaque rupture and ulcerations in different
plaque
rupture
or
ulceration,
were
more
often
of
intermediate
arc
and
length
comto 1 flow, whereas 25 (42%) had Thrombolysis In Myocarlesions.
dialpared
Infarction
gradelesions
2 to 3 flow.
with
without evident plaque rupture or lesions with
plaque rupture
•••
Calcium within the culprit lesion was detected in 53
The
key
finding
of
this
study
was
that culprit lesions in
without
related
calcifications.
patients (88%). Within the proximal and distal segments,
patients with AMI contain more and smaller calcified spots
calcium was identified in 41 (68%) and 32 (53%) segments,
To our knowledge, no study has been published
assessed
distribution
comparedthat
withhas
adjacent
segments.the
Moreover,
plaque ruprespectively. Of all calcified spots within the culprit lesion,
turea culprit
was evident
in
52%
of
patients
and
45%
of these
19 and
(9%) characteristics
crossed the proximal of
andcalcified
10 (5%) thedeposits
distal lesionwithin
lesion and adjacent segments
ruptures contained associated calcified deposits. The calciborder. Of these 29 spots, the maximum arc was located
fied spots, which might be associated with plaque rupture or
within the culprit lesion in 21 (72%). Additional plaque
ulceration, were more often of intermediate arc and length
characteristics of the culprit lesion in comparison with adcompared with lesions without evident plaque rupture or
jacent segments are presented in Table 2. The number of
lesions with plaque rupture without related calcifications.
calcified spots and their mean length per millimeter of
To our knowledge, no study has been published that has
analyzed segment were increased within the culprit lesion
assessed the distribution and characteristics of calcified decompared with proximal and distal segments. As presented
posits within a culprit lesion and adjacent segments in
in Table 3, especially calcified spots with a small arc and a
1– 6
Chapter 8 : Calcified spots in patients with acute myocardial infarction
in patients who present with AMI.(1-6) Coronary calcium distribution as assessed
by electron beam computer tomography has an axial distribution comparable to
calcium plaque accumulation as observed in pathologic and angiographic studies.
(12) However, until now it was unclear whether the site of accumulation of calcium
was related to coronary events. Integrating distribution and size of calcified deposits
in electron beam computer tomographic coronary calcium scoring may therefore
improve its ability to predict events, although this will depend on the size of the
calcified spots, which can be detected by electron beam computer tomography.
A limitation of the present study is that the characteristics and distribution of
calcifications in culprit lesions in patients with stable angina were not evaluated. This
prohibits the conclusion that the reported distribution of calcium spots is typical for
unstable lesions. Further, the prevalence of calcified spots near a ruptured plaque
could be underestimated due to the presence of thrombus, because thrombus has
an ultrasound appearance similar to that of soft plaque. However, this seems to
play a minor role, because the prevalence of the different types of spots near a
rupture or ulceration was similar for lesions without calcified spots next to a rupture
or ulceration and lesions without a demonstrable plaque rupture.
155
156
References
1.
Agatston AS, Janowitz WR, Hildner FJ, et al. Quantification of coronary artery calcium using
ultrafast computed tomography. J Am Coll Cardiol 1990;15:827–32.
2.
Shaw LJ, Raggi P, Schisterman E, et al. Prognostic value of cardiac risk factors and coronary
artery calcium screening for all-cause mortality. Radiology 2003;228:826–33.
3.
Pohle K, Ropers D, Maffert R, et al. Coronary calcifications in young patients with first,
unheralded myocardial infarction: a risk factor matched analysis by electron beam tomography. Heart 2003;89:625–8.
4.
Raggi P, Callister TQ, Cooil B, et al. Identification of patients at increased risk of first unheralded acute myocardial infarction by electron-beam computed tomography. Circulation
2000;101:850–5.
5.
Arad Y, Spadaro LA, Goodman K, et al. Prediction of coronary events with electron beam
computed tomography. J Am Coll Cardiol 2000;36:1253–60.
6.
Wayhs R, Zelinger A, Raggi P. High coronary artery calcium scores pose an extremely
elevated risk for hard events. J Am Coll Cardiol 2002;39:225–30.
7.
Beckman JA, Ganz J, Creager MA, et al. Relationship of clinical presentation and calcification of culprit coronary artery stenoses. Arterioscler Thromb Vasc Biol 2001;21:1618 –22.
8.
Shemesh J, Stroh CI, Tenenbaum A, et al. Comparison of coronary calcium in stable angina
pectoris and in first acute myocardial infarction utilizing double helical computerized tomography. Am J Cardiol 1998;81:271–5.
9.
Ehara S, Kobayashi Y, Yoshiyama M, et al. Spotty calcification typifies the culprit plaque
in patients with acute myocardial infarction: an intravascular ultrasound study. Circulation
2004;110:3424–29.
10.
Koning G, Dijkstra J, von Birgelen C, et al. Advanced contour detection for three-dimensional intracoronary ultrasound: a validation—in vitro and in vivo. Int J Cardiovasc Imaging
2002;18:235–48.
11.
Potkin BN, Bartorelli AL, Gessert JM, et al. Coronary artery imaging with intravascular
highfrequency ultrasound. Circulation 1990;81:1575–85.
12.
Schmermund A, Mohlenkamp S, Baumgart D, et al. Usefulness of topography of coronary
calcium by electron-beam computed tomography in predicting the natural history of coronary atherosclerosis. Am J Cardiol 2000;86:127-32.
Summary, conclusions
and future perspectives
158
Summary
The main topic of this thesis was the design, implementation and subsequent evaluation of an all-phases integrated care program for patients with acute myocardial
infarction: the MISSION! protocol. The aim of MISSION! was to improve daily care
for patients with an acute myocardial infarction by implementation of the most recent
guidelines into clinical practice. Although prior surveys did show an improvement of
care over the years, still a major gap exists between optimal care and daily clinical
practice. Important aspect of MISSION! was the alignment of treatment strategies
of the different healthcare professionals involved in the treatment of AMI patients.
By doing so, unnecessary and harmful treatment delays were reduced and long-term
care for patients with an acute myocardial infarction was improved.
Within the implementation of the MISSION! protocol it became possible to perform clinical evaluation studies. For example, the development of left ventricular
remodeling after myocardial infarction was studied. By early identification of patients
prone to develop left ventricular dilatation it may become possible to intervene at
an early stage by optimizing drug-treatment, surgery or resynchronization therapy.
In this thesis, the results of two studies are reported aimed at identifying predictors
of left ventricular remodeling after acute myocardial infarction. Moreover, studies
were performed to investigate plaque characteristics of the infarct-related coronary
artery and to evaluate the use of drug-eluting stents in patients with acute myocardial infarction. In the SHIVA study, conventional cardiovascular risk factors and
Framingham-risk scores were assessed in asymptomatic 3rd to 7th generation Asian
Indian descendants, compared to Europeans. It appeared that young Asian Indians
exhibited frequently an unfavorable cardiovascular risk profile.
In Chapter 1 an overview is given of the epidemiology and pathophysiology of
ischemic heart disease. In this part, the treatment goals as recommended by the
guidelines are described. Furthermore, an explanation is given why implementation
of guidelines in daily clinical practice is often difficult. Cardiovascular diseases are
the number one cause of death worldwide and are projected to remain so for the
next decades. Ischemic heart disease is caused by atherosclerosis. Atherosclerosis
represents a chronic inflammatory response to the stress imposed by various risk
factors, i.e. male sex, tobacco use, psychosocial stress, unhealthy diet, diabetes, hypertension, obesity and physical inactivity. Rupture or erosion of the atherosclerotic
lesion causes partial or total occlusion of the coronary artery by forming a luminal
thrombus. Irreversible myocardial damage occurs already after 15 to 20 minutes
Summary, conclusions and future perspectives
of occlusion of the coronary artery. The extent of myocardial damage is inversely
related to the time of onset of the coronary artery occlusion (start symptoms) and
the restoration of blood flow. In the acute fase, it is essential to open the occluded
coronary as quickly as possible. This can be achieved by thrombolytic drugs or by
mechanical revascularization (Percutaneous Coronary Intervention, PCI). Nowadays,
stents are used in more than 90% of the PCI procedures, to scaffold the stenosis
and to seal dissections against the vessel wall. Hereby, the chance for restenosis is
significantly reduced compared to balloon angioplasty alone.
Since an acute myocardial infarction is the reflection of an acute exacerbation of
a chronic process, interventions have to focus not only on the acute event, but also
on a reduction of the burden of atherosclerosis and the complications of the myocardial infarction during follow-up. To achieve this, amongst other interventions, drug
therapy is of significant importance. Antithrombotic therapy reduces the risk of new
thrombotic events. Beta-blockers decrease myocardial oxygen demand and prevent
arrhythmias. ACE-inhibitors reduce left ventricular remodeling, and statins are given
to improve cholesterol levels and to achieve plaque stabilization. To lower the risk
of sudden cardiac death, an Implantable Cardioverter Defibrillator is implanted in
patients with a low ventricular ejection fraction after a large myocardial infarction. A
healthy lifestyle, like no tobacco use, healthy diet and regular exercise, is essential
for optimal secondary prevention. To achieve this, participation in a cardiac rehabilitation program can be very helpful for the patient.
To optimize care and outcome of patients with an acute myocardial infarction
many organizations, e.g. the European Society of Cardiology, the American College
of Cardiology with the American Heart Association, and The Netherlands Society of
Cardiology, have published guidelines for the treatment of patients with myocardial
infarction. Guidelines are systematically developed statements to assist practitioners
and patients in making evidence-based decisions about appropriate health care for
specific clinical conditions. Prior studies and surveys revealed that implementation
of guidelines in daily clinical practice will result in a lower number of complications:
i.e. fewer patients will develop heart failure related symptoms and re-infarctions, and
most important better adherence to guidelines will lower the short- and long-term
mortality.
Lack of implementation of guidelines can be explained by several factors: the
guidelines themselves, patient- and physician’s constrains, and organizational barriers. First, the guidelines themselves: the basis of these guidelines ranges from randomized clinical trials to expert panel opinions. The “generalisability” of trial data is
sometimes questionable due to the often highly selected study populations enrolled
159
160
in these randomized trials. Moreover, the guidelines are extensive and complex.
Second, some physicians judge guidelines as oversimplified, “cookbook” medicine
and a threat for the autonomy of the physicians. Third, patients play a central role in
the success of therapy. It takes a lot of effort, time and money to adopt and maintain a healthier behavior and to use all prescribed drugs. Fourth, optimal treatment
of patients with an acute myocardial infarction should be a continuum-of-care; it
should include acute and long-term. Therefore, regional ambulance services, general
physicians, regional hospitals, cardiologists, nurses and rehabilitation centers should
work all together. Guidelines of the different professionals should be aligned to make
smooth transition from one setting to the other possible. Besides optimizing care
processes, political, economical and financial issues have to be overcome.
Prior acute myocardial infarction quality improvement projects mainly focused on
acute cardiac care and secondary prevention strategies during the index hospitalization phase only. In the last few years, more and more projects installed pre-hospital
care systems: networks of collaborating emergency medical services, community
hospitals and interventional cardiac centers to foster early reperfusion therapy in patients with acute myocardial infarction. Although, as addressing systematically one
phase of myocardial infarction care improves outcome significantly, it can be expected
that further improvement of care and outcome can be achieved by maximizing the
use of evidence-based therapy during all essential phases of care for patients with
an acute myocardial infarction. Therefore, in 2004 we developed and implemented
an all-phases integrated quality improvement program: the MISSION! protocol.
Chapter 2 describes the rationale, design and implementation of the MISSION!
protocol. The aim of MISSION! is to improve acute and long-term care for patients
with acute myocardial infarction by implementation of the most recent guidelines of
the European Society of Cardiology and the American Heart Association/American
College of Cardiology. To our knowledge the concept of MISSION! is unique as it
contains all essential phases of acute myocardial infarction care: i.e. the prehospital,
inhospital, and outpatient phase, up to 1 year after the index event. By the use
of care-tools we created a clinical framework for decision making and treatment.
MISSION! concentrates on rapid diagnosis and early reperfusion, followed by active
lifestyle improvement and structured medical therapy. Because MISSION! covers
both acute and chronic phases of myocardial infarction care, this design implies an
intensive multidisciplinary collaboration among all regional health care providers.
Summary, conclusions and future perspectives
Chapter 3 presents the results of the MISSION! protocol on acute myocardial
infarction care. Using a before (n= 84, treated in 2003) and after implementation
cohort of patients with an acute myocardial infarction (n= 518, treated from 2004
to 2006) we assessed the impact of MISSION! by the use of performance indicators. In MISSION!, more patients benefited primary PCI (99% MISSION! vs. 94%
historical group), the occluded coronary was opened more rapidly (“door-to-balloon
time” decreased from 81 min to 55 min), and more patients were treated within
the guideline-recommended 90-minutes door-to-balloon time (79% vs. 66%). In
the acute phase, more patients received beta-blockers (84% vs. 64%) and ACEinhibitors (87% vs. 40%). At one-year follow-up more patients used clopidogrel (94%
vs. 72%), beta-blockers (90% vs. 81%), and ACE-inhibitors (98% vs. 66%). Target
total cholesterol levels <4.5 mmol/L were achieved more frequently in MISSION!
patients (80% vs. 58%). In conclusion, an all-phases integrated care program for
patients with an acute myocardial infarction is a strong tool to enhance adherence to
evidence based medicine and is likely to improve clinical outcome.
In Chapter 4 we evaluated the relation between left ventricular dyssynchrony early
after acute myocardial infarction and the occurrence of long-term left ventricular
dilatation. One out of 6 acute myocardial infarction patients develops left ventricular
dilatation (defined as an increase of left ventricle end-systolic volume of ≥15%). LV
dilation is associated with adverse long-term prognosis. Early identification of patients
prone to left ventricular remodeling is needed to optimize therapeutic management
(i.e. in the form of medication, resynchronization or surgical therapy), which likely
improves prognosis. In this study a total of 124 consecutive patients presenting with
acute myocardial infarction were included. Within 48 hours of intervention, patients
were examined with two-dimensional echocardiography; reassessment took place
at 6-months follow-up. Of all patients, 18% exhibited left ventricular dyssynchrony
(≥65 ms) immediately after acute myocardial infarction. Patients with left ventricular
dyssynchrony had comparable baseline characteristics to patients without substantial
left ventricular dyssynchrony, except for a higher prevalence of multi-vessel coronary
artery disease and a larger size of myocardial infarction. During 6 months follow-up,
91% of the patients with substantial left ventricular dyssynchrony immediately after
infarction developed left ventricular remodeling, compared to 2% in the patients
without left ventricular dyssynchrony. In conclusion, most patients with substantial
left ventricular dyssynchrony immediately after acute myocardial infarction develop
left ventricular dilatation during 6 months follow-up.
161
162
In the additional study, described in Chapter 5, we also sought to identify predictors
of left ventricular remodeling after acute myocardial infarction. However, instead
of examining left ventricular dyssynchrony using tissue Doppler technique, twodimensional “speckle-tracking strain” analysis was used. This new technique utilizes
the natural acoustic markers, or speckles, that are present on standard gray-scale
ultrasound tissue images. By following accurately these speckles from frame to
frame, velocities and deformations of the myocardium can be determined.
In total, 178 patients with acute myocardial infarction underwent echocardiographic
examination during index hospitalization and at 6 months follow-up. Of these patients
20% exhibited left ventricular dilatation at 6 months. Patients with left ventricular
dilatation had comparable baseline characteristics to patients without left ventricular
dilatation, except that myocardial infarction size was larger. Multivariable analysis
demonstrated that left ventricular dyssynchrony was superior in predicting left ventricular remodeling compared to other parameters. Receiver-operating characteristic
(ROC) curve analysis demonstrated that a cutoff value of 130 ms for left ventricular
dyssynchrony yields a sensitivity of 82% and a specificity of 95% to predict left
ventricular remodeling at 6 months follow-up.
In Chapter 6 the results of the MISSION! Intervention Study are described. Since
the introduction of PCI, recurrent luminal narrowing (restenosis) is a major drawback of PCI both in patients with stable angina and in patients with acute coronary
syndrome. With the introduction of the intracoronary stent, restenosis rates could
be lowered significantly to 7-15%. With the introduction of the drug-eluting stents
restenosis rates could be lowered even more in patients with stable or unstable
angina pectoris. However, patients with acute myocardial infarction were excluded
in most studies.
The aim of the MISSION! Intervention Study was to evaluate safety and effectiveness of drug-eluting stents compared with stents without any drug (i.e. bare
metal stents (BMS)) in patients with acute myocardial infarction. This study was
single-blind and performed in one center. In total 310 patients were randomized for
a drug-eluting stent (SES: Sirolimus-eluting stent) or BMS. The primary endpoint was
in-segment late luminal loss (LLL) at 9 months. Secondary endpoints included late
stent malapposition (LSM) at 9 months as determined by intravascular ultrasound
imaging and clinical events at 12 months. In-segment LLL was significant lower after
SES implantation (0.12 ± 0.43 mm vs. 0.68 ± 0.57 mm), with a mean difference of
0.56 mm (95% CI 0.43-0.68 mm). Moreover, the event free survival at 12 months was
higher in the SES group (86.0% vs. 73.6%) and the target vessel failure free survival
Summary, conclusions and future perspectives
was also higher in the SES group (93.0% vs. 84.7%). However, LSM at 9 months
was significantly more often present after SES implantation (37.5% vs. 12.5% in
the BMS group). Rates of death, myocardial infarction and stent thrombosis were
not different. Thus, SES implantation in patients with acute myocardial infarction is
associated with favorable mid-term clinical and angiographic outcome compared to
treatment with BMS. However, LSM raises concern about the long-term safety of
SES in patients with acute myocardial infarction.
In Chapter 7 the results of the SHIVA study are described. Prior studies revealed that
Asian Indians living in the Western world are more prone to develop cardiovascular
diseases and at an earlier age as compared with Europeans. Therefore, knowledge
of the cardiovascular risk profile of this high-risk population is of major importance
for development of adequate primary and secondary prevention strategies. Until
now, most studies are performed in 1st and 2nd generation emigrants. To optimize
prevention, knowledge of current risk profile of younger generations is needed.
There is a large Asian Indian community in the Netherlands (approximately 200,000
persons). This community mainly consists of migrants from Surinam, a former South
American Dutch colony. Historically, the abolishment of slavery in 1863 was the start
of migration of Asian Indians from India to Surinam. These migrants were contract
workers on former plantations and were almost exclusively recruited from the Indian
state Bihar. The declaration of independence of Surinam in 1975 initiated a second
wave of migration of these Asian Indians, this time to the Netherlands. Nowadays,
these immigrants and their offspring form a 3rd to 7th generation of Asian Indians.
In the SHIVA study, a cross-sectional study, we assessed the prevalence of conventional ischemic heart disease risk factors and the ten-years risk for ischemic heart
disease (Framingham risk score) in these young generation Asian Indian descendants,
compared with Europeans. Subjects were included if they were asymptomatic: i.e.
if they did not have documented ischemic heart disease, diabetes, hypertension or
high cholesterol. A total of 1790 Asian Indians (45% men, age 35.9 ± 10.7 years)
and 370 native Dutch hospital employees (23% men, age 40.8 ± 10.1 years) were
recruited. Asian Indians had higher levels of total cholesterol, low-density lipoprotein, triglycerides, and lower high-density lipoprotein levels than the Dutch. Glucose
intolerance was present in 7.1 vs. 0.5% men, and in 6.1 vs. 1.4% women. Asian
Indian women were more frequently obese (12 vs. 5%), and centrally obese (44 vs.
25%) as compared with the Dutch women. Prevalence of most of the conventional
and modifiable cardiovascular risk factors in each ten-year age group was higher in
Asian Indians compared with controls, which reflected in higher Framingham risk
163
164
scores. In conclusion, this study demonstrates the persistence of an unfavorable
cardiovascular risk profile in young, 3rd to 7th generation migrated Asian Indians and
supports an aggressive screening and intervention strategy.
Chapter 8 describes the results of a study investigating the distribution, arc and
location of calcified spots in the infarct-related coronary lesion (culprit lesion) of
patients with an acute myocardial infarction. From Electron Beam Computed Tomography studies it is known that the extent of intracoronary calcium is related to the
risk of coronary events. This study was performed in 60 patients using Intravascular
Ultrasound (IVUS) imaging. Calcifications in the culprit lesion and adjacent segments
were classified and counted according to their arc (<45, 45-90, 90-180, >180 0), length
(<1.5, 1.5-3.0, 3.0-6.0, >6.0 mm), and dispersion (number of spots per millimeter).
Calcifications at the edge of a visible rupture or ulceration were considered to be
related to the myocardial infarction. Compared to adjacent proximal and distal segments, the culprit lesion contained more calcified spots per millimeter (respectively
0.14, 0.10 and 0.21), which were mainly small calcified spots (arc <450, length <1.5
mm). Plaque rupture or ulceration was manifest in 31 culprit lesions (52%) of which
14 (45%) contained focal calcifications related to a plaque rupture of ulceration.
These calcified spots extended more often to 90-1800 of the vessel circumference
and were more often of moderate length (3-6 mm) when compared to culprit lesions
without visible plaque rupture. It was concluded that culprit lesions of patients with
an acute myocardial infarction contain more and smaller calcifications compared to
adjacent segments. Moreover, calcifications related to plaque rupture or ulceration
appear to be larger and extend over a wider arc. These larger calcifications may play
a role in plaque instability.
Conclusions
MISSION! is a multidisciplinary guideline-based treatment protocol for patients
with an acute myocardial infarction, containing all essential phases of care: i.e. the
prehospital, inhospital and outpatient phase, up to 1 year after the index event.
An all-phases integrated care program for patients with an acute myocardial infarction, like MISSION!, results in an increase of guideline adherence and improves
clinical outcome.
Summary, conclusions and future perspectives
Most patients with substantial left ventricular dyssynchrony immediately after acute
myocardial infarction will develop left ventricular dilatation during 6 months followup.
The optimal cutoff value for left ventricular dyssynchrony is 130 ms, which yields a
sensitivity of 82% and a specificity of 95% to predict left ventricular remodeling at
6 months follow-up.
Sirolimus-eluting stent implantation in patients with acute myocardial infarction is
associated with favorable mid-term clinical and angiographic outcome compared to
treatment with bare-metal stents. Late stent malapposition is however more common after sirolimus-eluting stent implantation.
Young 3rd to 7th generation Asian Indians exhibit an unfavourable risk profile for cardiovascular diseases compared to Europeans.
Culprit lesions in patients with acute myocardial infarction contain more and smaller
calcified spots (arc <450, length <1.5 mm) compared to adjacent segments. Calcifications related to plaque rupture or ulceration extend over a wider arc and are longer
(arc 90-180 0, length 3-6 mm).
Future perspectives
Development and implementation of a guideline-based treatment
protocol for patients with an acute myocardial infarction.
During the last two decades, treatment of patients with an acute myocardial infarction improved dramatically resulting in a significant decrease of mortality both
during the acute and chronic phase. As a result, the quality of daily care for patients
with acute myocardial infarction is improving; on the other hand to let the patients
benefit from all different options becomes a challenging process. Guidelines are
systematically developed statements to assist practitioners and patients in making
evidence-based decisions about appropriate care. Implementation of guidelines
in the real world remain however difficult. The results of the MISSION! protocol
proved the effectiveness of an all-phases integrated protocol to treat patients with
an acute myocardial infarction. By doing so, care is not only determined by clinical
experience, knowledge and intuition of the individual physician, but is based on a
165
166
multidisciplinary framework across the entire system of care. As a result, the interphysician and inter-patient variations decreased. Quality of care was assessed by
the use of performance-indicators, creating the possibility of evaluation, feedback
and continuously improvement. Using predefined quality of care performance indicators is importance to allow better evaluation of results. This transparency of care is
needed to improve the quality of care and for patients, the government, and the
health insurance companies to decide whether a care provider delivers good quality
care. Besides these positive effects one should be cautious when relying too much
on a guideline-based treatment protocol: it can restrain new insights. The guidelines
themselves: not all recommendations are evidence-based and the “generalisability” of trial data is sometimes questionable due to the often highly selected study
populations enrolled in these randomized trials. Additionally, it might be possible that
individual proven treatment strategies won’t be effective anymore or even harmful
for the patient when combined.
Lessons learned from MISSION! and recommendations for the future are: 1) to
develop and implement a treatment protocol for patients with an acute myocardial
infarction, all efforts should be focused on creating a close inter- and multidisciplinary
collaboration across the system of care. 2) Herein, the patient plays a central role. 3)
Only application of (inter-) national guidelines in daily care is not effective. Customization is required according to local and regional possibilities, capacity and finance. 4)
The use of care-tools in the form of medical orders and IT systems plays a crucial role
in the success of implementation 5) Continuous quality assessment is mandatory,
not only to verify if the protocol is applied correctly, but also to improve the protocol
itself according to new clinical data or scientific insights. 6) A protocol should function as a guide to facilitate and to make appropriate decisions, however it should
never replace a carefully considered clinical judgment.
Samenvatting, conclusies
en toekomstperspectief
168
Het hoofdonderwerp van dit proefschrift is het beschrijven en evalueren van een
intensief zorgprogramma voor patiënten met een acuut hartinfarct: het MISSION!
protocol. Het doel van MISSION! is de zorg voor patiënten met een acuut hartinfarct
te verbeteren middels implementatie van de meest recente richtlijnen in de dagelijkse
praktijk. Eerdere prestatieanalyses lieten zien dat ondanks het feit dat de zorg niet
slecht was, deze op veel fronten verbeterd kon worden. Belangrijke aspecten van
MISSION! zijn het op elkaar afstemmen van de verschillende behandelstrategieën
van de verschillende zorgaanbieders én het regionaliseren van de zorg om onder
andere onnodige vertraging in behandeling te voorkomen en om de nazorg voor deze
groep patiënten te verbeteren.
Binnen het MISSION! project zijn ook een aantal gerelateerde studies uitgevoerd.
Zo is gekeken naar linker kamer dilatatie. Als linker kamer dilatatie vroegtijdig kan
worden opgespoord kan wellicht door intensievere medicamenteuze of chirurgische
therapie verdere verslechtering worden voorkomen en kan de prognose van patiënten worden verbeterd. In dit proefschrift worden de resultaten beschreven van twee
studies waarin werd bekeken welke parameters van voorspellende waarde zijn voor
linker ventrikel dilatatie onmiddellijk na het hartinfarct. Verder werd er onderzoek
gedaan naar de zogenaamde plaquekarakteristieken van de bij het infarct betrokken
kransslagader van hartinfarctpatiënten en naar de behandeling van deze patiënten
met medicijn-afgevende stents (drug-eluting stents). In de SHIVA-studie werd het
risicoprofiel voor hart- en vaatziekten van Hindoestanen vergeleken met een Nederlandse controlegroep. Hieruit kwam naar voren dat jonge Hindoestanen vaak een
zeer ongunstig risicoprofiel laten zien.
In de introductie van dit proefschrift (Hoofdstuk 1) wordt een overzicht gegeven van de
epidemiologie en pathofysiologie van ischemische hartziekten. De behandeldoelen voor
patiënten met een acuut hartinfarct worden beschreven zoals ze geadviseerd worden in
de internationale richtlijnen. Tevens wordt een verklaring gegeven voor het feit dat de daadwerkelijke implementatie van de richtlijnen in de dagelijkse praktijk zo moeizaam gaat.
Hart- en vaatziekten zijn nog steeds doodsoorzaak nummer één in de wereld.
Dit blijft ook zo voor de komende decennia. Ischemische hartziekten ontstaan als
gevolg van atherosclerose. Dit is een chronisch ontstekingsproces als respons op
allerlei beïnvloedbare stressfactoren, zoals roken, psychosociale stress, ongezond
eten, suikerziekte, hoge bloeddruk, overgewicht en fysieke inactiviteit. Ruptuur of
erosie van een atherosclerotische plaque in de kransslagader van het hart zorgt voor
gedeeltelijke dan wel totale afsluiting van het bloedvat door een bloedstolsel. Na
Samenvatting, conclusies en toekomstperspectief
15 tot 20 minuten volledige afsluiting sterft hartweefsel af ten gevolge van zuurstof
tekort. De mate van schade aan het hart is gerelateerd aan de duur van afsluiting.
In de acute fase is het dan ook essentieel om de kransslagader zo snel mogelijk te
openen, middels bijvoorbeeld een dotterprocedure of met geneesmiddelen. Bij een
dotterprocedure wordt in de meeste gevallen een stent geplaatst, dit is een soort
pennenveer die in de acute fase het bloedvat beter openhoudt en ook de kans op
een hernieuwde vernauwing verkleint.
Essentieel is dat een hartinfarct een acute verergering is van een chronische
ziekte. Na de acute fase is het daarom van groot belang om de kans op complicaties,
een herhaling van het hartinfarct en progressie van het vaatlijden zoveel mogelijk
te verkleinen. Geneesmiddelen spelen hierbij een belangrijke rol. Plaatjesremmers
voorkomen vorming van nieuwe bloedstolsels. Bètablokkers zorgen voor een vermindering van de zuurstofbehoefte van de hartspier en voorkomen het optreden van
ritmestoornissen. ACE-remmers gaan het uitzetten van het hart tegen (linkerventrikel
dilatatie) en statines zorgen voor een verlaging van het cholesterol en voor plaque
stabilisatie. Patiënten met een groot infarct kunnen baat hebben van een implanteerbare defibrillator ter bescherming van levensbedreigende hartritmestoornissen.
Gezonde levenswijzen, zoals niet roken, gezonde voeding en voldoende bewegen
zijn van groot belang bij optimale secundaire preventie. De patiënt kan hierbij worden
geholpen door het volgen van een hartrevalidatieprogramma.
Instanties, zoals de European Society of Cardiology, de American Heart Association en de Nederlandse Vereniging voor Cardiologie, hebben richtlijnen opgesteld
waarin staat beschreven hoe een patiënt met een hartinfarct het beste kan worden
behandeld. Richtlijnen geven handvaten om gepaste en kwalitatief goede zorg te
leveren aan de patiënt. Richtlijnen zijn zoveel mogelijk gebaseerd op wetenschappelijk bewezen effectieve en doelmatige strategieën (evidence-based medicine).
Studies bevestigen ook dat het beter volgen van de richtlijnen resulteert in minder
complicaties zoals hartfalen en een herhaling van een infarct. Nog belangrijker, de
sterfte neemt af. Ondanks bewezen effectiviteit worden nog een significant aantal
patiënten onderbehandeld.
Redenen voor moeizame implementatie in de dagelijkse praktijk zijn multifactorieel:
1) de richtlijnen zelf: ze zijn meestal gebaseerd op uitkomsten van grote internationale studies. Deze studies hanteren strenge in- en exclusie criteria. Hierdoor komt
de studiepatiënt niet altijd overeenkomt met de patiënt in de dagelijkse praktijk. De
richtlijnen zijn erg uitgebreid en complex. 2) De arts heeft aversie tegen “kookboekgeneeskunde” of ziet het als een bedreiging voor zijn autonomie. 3) Voor de patiënt
kost het veel inspanning om alle voorgeschreven medicijnen te gebruiken en om
169
170
gezonde levenswijzen aan te leren en vol te houden. 4) Verder zijn er organisatorische problemen: optimale hartinfarctzorg begint bij de patiënt met pijn-op-de-borst
thuis, gaat door in het ziekenhuis en heeft een intensieve poliklinische follow-up. Dit
vereist een intensieve samenwerking tussen alle verantwoordelijke zorgverleners,
zoals de huisarts, ambulancepersoneel, cardiologen en revalidatieartsen. Richtlijnen
van deze meestal op zichzelf functionerende instanties moeten dan ook op elkaar
worden afgestemd. Naast het stroomlijnen van zorgprocessen, moeten financiële,
economische en politieke barrières worden overwonnen.
Eerdere kwaliteitsverbeterende zorgprogramma’s waren met name gericht op
de acute zorg in het ziekenhuis. De laatste jaren worden steeds meer regionale
ambulance-ziekenhuis systemen opgezet om onnodige behandelingsvertragingen te
voorkomen in de pre-hospitale setting. Verondersteld kan worden dat, als de richtlijnen worden toegepast in één fase en dit de zorg verbeterd, verdere optimalisatie
kan worden bewerkstelligd door implementatie van de richtlijnen in alle essentiële
zorgfasen (d.w.z. pre-hospitaal, in-hospitaal en poliklinisch). Dit heeft geleid tot het
ontwikkelen en implementeren van een intensief zorgprogramma voor patiënten
met een hartinfarct in regio “Hollands-Midden”: het MISSION! hartinfarctprotocol.
Hoofdstuk 2 beschrijft de ontwikkeling en implementatie van het MISSION!
hartinfarctprotocol. MISSION! heeft als doel de zorg voor de hartinfarctpatiënt te
verbeteren middels implementatie van de meest recente richtlijnen van de European
Society of Cardiology en de American Heart Association/American College of Cardiology. Het invoeren van één doelgericht en handzaam protocol, ondersteund door
zogenaamde zorghulpmiddelen (“care-tools”), creëert een raamwerk voor optimale
zorg in de dagelijkse praktijk. MISSION! is uniek ten opzichte van eerdere implementatieprogramma’s, aangezien het alle essentiële zorgfasen voor de patiënt met een
hartinfarct omvat (namelijk de preklinische, klinische en poliklinische fase tot één jaar
na het infarct). MISSION! is gericht op het zo snel mogelijk diagnosticeren van het
hartinfarct, snelle reperfusie van de afgesloten kransslagader en op gestructureerde
medische therapie en verbetering van levensstijl na de acute fase. Het bundelen
van zowel de acute als chronische zorg in één programma vraagt om een intensieve
multidisciplinaire samenwerking tussen de verschillende hulpverleners in de regio.
Hoofdstuk 3 beschrijft de resultaten van het MISSION! protocol op de zorg. Middels vooraf opgestelde prestatie-indicatoren werd de zorg in een historische groep
hartinfarctpatiënten net vóór implementatie van MISSION! (n=84, behandeld in
2003) vergeleken met een groep patiënten na implementatie van MISSION! (n=518,
Samenvatting, conclusies en toekomstperspectief
behandeld in 2004 tot en met 2006). MISSION! heeft ervoor gezorgd dat meer
patiënten profiteerden van een dotterbehandeling tijdens de acute fase (99% in de
MISSION! groep vs. 94% in de historische groep), de kransslagader sneller geopend
werd (“door-to-balloon” tijd 55 min vs. 81 min.) en dat dit vaker gebeurde binnen de
door de richtlijnen geadviseerde 90-minuten “door-to-balloon” tijd (79% vs. 66%). In
de acute fase kregen meer patiënten bètablokkers (84% vs. 64%) en ACE-remmers
(87% vs. 40%). Na één jaar gebruikte meer patiënten clopidogrel (94% vs. 72%),
bètablokkers (90% vs. 81%), en ACE-remmers (98% vs. 66%). Meer patiënten
behaalde de geadviseerde cholesterol waarde van minder dan 4.5 mmol/L (80%
vs. 58%). Geconcludeerd kon dan ook worden dat implementatie van een intensief
zorgprogramma voor patiënten met een acuut hartinfarct heeft geresulteerd in een
betere naleving van de richtlijnen en een significant betere uitkomst.
In Hoofdstuk 4 wordt gekeken welke parameters na een hartinfarct van voorspellende waarde zijn voor het ontstaan van linker kamer dilatatie (gedefinieerd als
toename van de linker kamer eind-systolische volume met ≥15%). Eerdere studies
toonden aan dat bij één op de zes hartinfarctpatiënten de linkerventrikel dilateert
en dat dit sterk geassocieerd is met sterfte. Namelijk, patiënten die sterven na een
hartinfarct hebben significant grotere linker kamer volumes en lagere linker kamer
ejectiefracties. Door vroegtijdig te voorspellen welke patiënten het risico lopen op
linker kamer dilatatie kan wellicht door intensievere therapie (medicamenteus, resynchronisatie therapie en/of door middel van chirurgie) de prognose van de patiënten
worden verbeterd. In deze studie werd de relatie tussen linker kamer dyssynchronie
onmiddellijk na het hartinfarct en linker kamer dilatatie 6 maanden na het infarct
bestudeerd.
In totaal werden 124 hartinfarctpatiënten geïncludeerd. Zij werden binnen 48 uur
na de primaire dotterbehandeling en 6 maanden na het infarct onderzocht middels
onder andere echocardiografie. Van alle patiënten vertoonde 18% linker kamer dyssynchronie net na het hartinfarct. De klinische karakteristieken van deze patiënten
waren vergelijkbaar met de karakteristieken van patiënten die geen linker kamer
dyssynchronie vertoonden, met uitzondering dat deze patiënten vaker afwijkingen
hadden in meerdere kransslagaders en een groter infarct hadden. Van de patiënten
met linker kamer dyssynchronie onmiddellijk na het infarct ontwikkelde 91% linker
kamer dilatatie in de 6 maanden na het hartinfarct ten opzichte van slechts 2% van
de patiënten zonder linker kamer dyssynchronie. Geconcludeerd kon dan ook worden
dat de meeste patiënten met linker kamer dyssynchronie onmiddellijk na het hartinfarct linker kamerdilatatie ontwikkelden gedurende de 6 maanden na het hartinfarct.
171
172
Dit is een belangrijk gegeven waar wellicht middels bijvoorbeeld resynchronisatie
therapie wat aan gedaan kan worden.
In Hoofdstuk 5 wordt tevens bestudeerd welke andere parameters van voorspellende waarde zijn voor linker kamer dilatatie. Echter linker kamer dyssynchronie werd
nu niet bepaald middels de tissue doppler techniek, maar met de tweedimensionale
“speckle tracking strain” analyse. Bij deze nieuwe techniek wordt gebruik gemaakt
van natuurlijke akoestische markers (de zogenaamde “speckles”) op standaard
gray-scale echo beelden. Door deze speckles frame per frame te vervolgen kunnen snelheden en vervormingen van het hartspierweefsel worden bepaald. In
totaal ondergingen 178 acute hartinfarctpatiënten een echocardiografische evaluatie
tijdens opname en na 6 maanden. Van deze 178 patiënten vertoonden 20% linker
kamer dilatatie na 6 maanden. Baseline karakteristieken waren nagenoeg hetzelfde
vergeleken met de patiënten zonder linker kamer dilatatie, echter patiënten met
linker kamer dilatatie hadden een significant groter infarct. Tevens was linker kamer
dyssynchronie frequenter en in grotere mate aanwezig. Multivariate analyse liet
zien dat de aan- of afwezigheid van linker kamer dyssynchronie superior was bij
het voorspellen van linker kamer dilatatie ten opzichte van andere parameters. Uit
analyse van de receiving-operating curve (ROC) bleek dat het optimale afkappunt
voor linker kamer dyssynchronie 130 ms was, waarmee een sensitiviteit van 82%
en een specificiteit van 95% werd behaald voor het voorspellen van linker kamer
dilatatie na 6 maanden follow-up.
In Hoofdstuk 6 worden de resultaten beschreven van de MISSION! Interventie
studie. Het plaatsen van een stent bij een patiënt met een acuut hartinfarct heeft
als doel het opnieuw vernauwen van de kransslagader (restenose) te voorkomen.
Een stent verhindert het acuut elastisch terugveren van de atherosclerotische vernauwing en voorkomt vorming van littekenweefsel. Echter door het plaatsen van
een stent is er meer groei van gladde spiercellen en extracellulaire matrix in de
stent (de vorming van neointima weefsel). Hierdoor is bij 7 tot 15% een tweede
dotterbehandeling of bypass operatie noodzakelijk. De meest recente ontwikkeling
in de dotterbehandeling van patiënten met ischemische hartziekten is de medicijnafgevende stent. Deze stent combineert het mechanische effect van het stutten van
de atherosclerotische vernauwing tegen de vaatwand met het afgeven van medicijn
om neointima vorming te voorkomen. Eerdere studies bewezen de effectiviteit en
veiligheid van deze medicijn-afgevende stents in patiënten met (in-)stabiele angina
pectoris of stille ischemie, echter patiënten met een acuut hartinfarct werden in deze
Samenvatting, conclusies en toekomstperspectief
studies geëxcludeerd. Het doel van de MISSION! Interventie studie was de werking
en veiligheid van medicijn-afgevende stents te evalueren in vergelijking met stents
zonder medicijn bij patiënten met een acuut hartinfarct. De studie was eenzijdig
geblindeerd en uitgevoerd in één centrum.
In totaal werden 310 patiënten met een acuut hartinfarct gerandomiseerd voor
een medicijn-afgevende stent (SES: Sirolimus-eluting stent) of een stent zonder
medicijn (BMS: Bare metal stent). Het primaire eindpunt was in-segment (gestente
vaatsegment ± 5mm) lumen diameter verlies (het verschil tussen de minimale lumen diameter net na de primaire dotterprocedure en de diameter na 9 maanden).
Secundaire eindpunten waren onder andere late stent malappositie na 9 maanden
en klinische gebeurtenissen na 12 maanden. Het in-segment lumen diameter verlies
was significant lager na SES implantatie (0.12 ± 0.43 mm vs. 0.68 ± 0.57 mm) met
een gemiddeld verschil van 0.56 mm (95% CI 0.43-0.68 mm). De overleving na 12
maanden (zonder nieuwe events) was hoger na SES implantatie (86.0% vs. 73.6%).
De overleving zonder hernieuwde revascularisatie van de kransslagader waarin de
stent was geplaatst, was tevens hoger in de SES groep (93% vs. 84.7%). Echter, late
stent malappositie na 9 maanden werd frequenter gezien na SES implantatie (37.5%
vs. 12.5%). Er was geen verschil in de kans op overlijden, hartinfarct of stent thrombose na 12 maanden. Geconcludeerd kon worden dat de behandeling met SES bij
patiënten met een acuut hartinfarct resulteerde in een betere middellange klinische
en angiografische uitkomst vergeleken met de behandeling met BMS. Frequente
late stent malapppositie geeft bedenkingen over de lange termijn veiligheid van SES
bij patiënten met een acuut hartinfarct.
In Hoofdstuk 7 worden de resultaten beschreven van de SHIVA studie. Eerdere
studies hebben laten zien dat mensen afkomstig uit Zuid-Azië en wonend in het
Westen frequenter en op vroegere leeftijd hart- en vaatziekten krijgen vergeleken
met de blanke westerse bevolking. Het goed in kaart hebben van het cardiovasculair
risicoprofiel van deze hoog-risico populatie is van groot belang voor adequate primaire en secundaire interventies. Tot nu toe zijn deze studies voornamelijk verricht
bij 1e en 2e generatie emigranten. Echter, voor optimale preventie is kennis van
jongere generaties nodig. In Nederland woont een grote Hindoestaanse gemeenschap, bestaande uit zo’n 200.000 mensen. Zij zijn oorspronkelijk afkomstig uit het
Indiase subcontinent. Zij emigreerde eind negentiende eeuw naar Suriname om
te werken als slavenarbeiders op de plantages. In 1975, na de onafhankelijk van
Suriname als Nederlandse kolonie volgde een 2de emigratiegolf naar Nederland. De
173
174
huidige populatie van Hindoestanen wonend in Nederland bestaat uit 3de tot 7de
generatie Hindoestanen.
Met SHIVA hebben we middels een cross-sectionele studie de prevalentie van
conventionele risicofactoren voor hart- en vaatziekten en het 10-jaars risico op
ischemisch hartlijden (Framingham-score) in deze groep onderzocht en vergeleken
met een Nederlandse controlegroep. Individuen werden geclassificeerd als asymptomatisch als ze niet bekend waren met ischemische hartziekte, suikerziekte, een te
hoge bloeddruk of te hoge cholesterolwaarden.In totaal werden 1790 Hindoestanen
(45% man, gemiddelde leeftijd 35.9 ± 10.7 jaar) en 370 autochtone Nederlandse ziekenhuismedewerkers (23% man, gemiddelde leeftijd 40.8 ± 10.1 jaar) geïncludeerd.
Hindoestanen hadden hogere totaal cholesterol-, LDL- en triglyceriden-waarden, en
lagere HDL-waarden vergeleken met de Nederlandse controlegroep. Glucose intolerantie kwam frequenter voor bij Hindoestanen (mannen 7.1% vs. 0.5%, vrouwen
6.1% vs. 1.4%). Hindoestaanse vrouwen vertoonden vaker overgewicht (12% vs.
5%) en centrale obesitas (toegenomen hoeveelheid buikvet, 44% vs. 25%) vergeleken met de Nederlandse vrouwen. Prevalentie van de meeste conventionele en
beïnvloedbare cardiovasculaire risicofactoren in elke 10-jaars leeftijdgroep was hoger
in de Hindoestaanse groep vergeleken met de Nederlandse controlegroep, wat zich
ook uitte in hogere Framingham risico scores. Geconcludeerd kon worden dat in
deze jonge 3de tot 7de generatie Hindoestanen een ongunstig risicoprofiel voor
hart- en vaatziekten aanwezig was. Deze onderzoeksresultaten ondersteunen een
agressief en structureel screeningsprogramma voor jonge Hindoestanen om de kans
tot ontwikkeling op vroegtijdig symptomatisch hart- en vaatziekte te verkleinen.
Hoofdstuk 8 beschrijft de resultaten van een studie naar de distributie, boog en
locatie van verkalkingen (calcificaties) in de infarct-veroorzakende atherosclerotische
plaque (culprit laesie) bij patiënten met een acuut hartinfarct. Uit eerdere CT-scan
studies is gebleken dat de mate van intracoronaire calcificatie gerelateerd is aan het
risico op een acuut coronair syndroom. Deze studie werd uitgevoerd bij 60 patiënten
met behulp van een intravasculaire echo (IVUS: intravasculaire ultrasound). Calcificaties in de culprit laesie en aanliggende vaatsegmenten werden geclassificeerd en
geteld naar hun boog (<45, 45-90, 90-180, >180o), lengte (<1.5, 1.5-3.0, 3.0-6.0, >6.0
mm) en spreiding (aantal calcificaties per millimeter). Calcificaties op de rand van een
zichtbaar ruptuur of ulceratie werden beschouwd als gerelateerd aan het hartinfarct.
Vergeleken met de aanliggende proximale en distale vaatsegmenten bevatten de
culprit laesies meer calcificaties per millimeter (respectievelijk 0.14, 0.10 en 0.21)
die met name klein waren (boog <45o, lengte < 1.5 mm). Plaque ruptuur of ulceratie
Samenvatting, conclusies en toekomstperspectief
was zichtbaar in 31 laesies (52%) waarvan er 14 (45%) calcificaties bevatten die
gerelateerd waren aan de ruptuur of ulceratie. Deze calcificaties hadden vaker een
boog van 90-180o en een lengte van 3-6 mm vergeleken met culprit laesies zonder
zichtbare plaque ruptuur of ulceratie. Concluderend bevatten culprit laesies van
patiënten met een acuut hartinfarct meer en kleinere calcificaties vergeleken met
aanliggende vaatsegmenten. Daarnaast zijn de calcificaties die gerelateerd zijn aan
een plaque ruptuur of ulceratie langer en hebben een grotere boog. Deze grotere
calcificaties spelen mogelijk een rol bij plaque instabiliteit.
Conclusies
MISSION! is een multidisciplinair, richtlijn gebaseerd behandelprotocol voor patiënten met een acuut hartinfarct, dat alle essentiële fasen van zorg omvat: namelijk de
preklinische, klinische en poliklinische fase tot één jaar na het hartinfarct.
Implementatie van een intensief zorgprogramma zoals MISSION! resulteert in
betere naleving van de richtlijnen voor patiënten met een acuut hartinfarct en een
betere uitkomst.
De meeste patiënten met linker kamer dyssynchronie onmiddellijk na het hartinfarct
ontwikkelen linker kamer dilatatie gedurende de 6 maanden na het hartinfarct.
Het optimale afkappunt voor linker kamer dyssynchronie is 130 ms, waarmee een
sensitiviteit van 82% en een specificiteit van 95% wordt behaald voor het voorspellen van linker kamer dilatatie 6 maanden na het hartinfarct.
Sirolimus-eluting stent implantatie bij patiënten met een acuut hartinfarct leidt tot
betere klinische en angiografische resultaten op middellange termijn vergeleken met
bare-metal stent implantatie. Late stent malapppositie wordt frequenter waargenomen na Sirolimus-eluting stent implantatie.
Jonge Hindoestanen -3de tot 7de generatie- vertonen een ongunstig risicoprofiel
voor hart- en vaatziekten ten opzichte van autochtone Nederlanders.
Culprit laesies bij patiënten met een acuut hartinfarct bevatten meer en kleinere
calcificaties (boog <45o, lengte < 1.5 mm) dan aanliggende vaatsegmenten. Culprit
175
176
laesies met een zichtbare plaque ruptuur of ulceratie bevatten calcificaties met een
grotere boog en lengte (boog 90-180o, lengte 3-6 mm) vergeleken met culprit laesies
waarbij geen ruptuur of ulceratie kan worden waargenomen.
Toekomstperspectief
Ontwikkeling en implementatie van een richtlijn gebaseerd
behandelprotocol voor patiënten met een acuut hartinfarct
Kennis en mogelijkheden in de behandeling van patiënten met een acuut hartinfarct
zijn in de afgelopen decennia enorm toegenomen. Nog steeds is er ontwikkeling
gaande in rap tempo. De zorg die hierdoor wordt geboden verbeterd, maar wordt
ook steeds complexer. Richtlijnen geven handvaten om gepaste en kwalitatief goede
zorg te leveren aan de patiënt. Deze richtlijnen zijn zoveel mogelijk gebaseerd op wetenschappelijk bewezen effectieve en doelmatige strategieën. Hoewel studies laten
zien dat implementatie van richtlijnen bij patiënten met een acuut hartinfarct zorgt
voor vermindering van sterfte, laat daadwerkelijke implementatie van de richtlijnen
in “real world” te wensen over. De resultaten van het MISSION! protocol laat zien
dat het invoeren van een handzaam protocol effectief is. Zorg wordt nu niet louter op
individuele basis bepaald -op basis van de klinische ervaring, kennis en intuïtie van
de dokter- maar wordt bepaald door een multidisciplinair en transmuraal gefundeerd
systeem. Hierdoor verminderen de inter-dokter en inter-patiënt variaties. Hulpprofessionals leggen verantwoording af aan het systeem en aan elkaar waarom iets wel
of niet volgens protocol is gedaan. De zorg kan getoetst worden met zogenaamde
prestatie-indicatoren en dit geeft weer de mogelijkheid tot evaluatie, feedback en een
continu proces tot verbetering. Transparantie wordt geschept voor externe instanties
zoals de overheid of zorgverzekeraars. Naast al deze positieve punten moet men
ook beducht zijn op het teveel leunen op een richtlijn gebaseerd behandelprotocol:
het kan een remmende werking hebben op nieuwe ontwikkelingen. Richtlijnen zelf
hebben beperkingen: niet alle gegeven adviezen zijn evidence-based en de kennis
verkregen uit grote klinische trials is gebaseerd op een selecte patiëntenpopulatie,
wat frequent niet overeenkomt met de dagelijkse patiënt. Verder bestaat de mogelijkheid dat individueel bewezen strategieën juist gecombineerd niet effectief of zelfs
schadelijk zijn.
Geleerde lessen uit MISSION! en adviezen voor de toekomst zijn: 1) er moet gestreefd worden naar een intra-, interdisciplinaire en transmurale samenwerking bij
Samenvatting, conclusies en toekomstperspectief
de ontwikkeling en implementatie van een behandelprotocol voor patiënten met een
acuut hartinfarct. 2) De patiënt moet hierin centraal staan. 3) Louter appliceren van
(inter-) nationale richtlijnen op de dagelijkse praktijk werkt niet. Aanpassing is vereist
naar lokale en regionale mogelijkheden, capaciteit en financiën. 4) “Care-tools” in de
vorm van medische orders en informaticasystemen dragen substantieel bij aan het
succes van implementatie. 5) Continue kwaliteitscontrole is vereist niet alleen om
na te gaan of het protocol goed wordt nageleefd, maar ook ter verbetering van het
protocol zelf naargelang nieuwe klinische en/of wetenschappelijke inzichten. 6) Een
protocol dient als leidraad om de juiste medische beslissingen te nemen, maar mag
nooit een weloverwogen klinisch oordeel vervangen.
Verder onderzoek naar kosteneffectiviteit zou het programma nog doelmatiger kunnen maken. Echter dit wordt bemoeilijkt door de betrokkenheid van de verschillende
instanties, en de ethische, maatschappelijke en politieke aspecten met betrekking
tot het volgen van richtlijnen. Tevens moet vermeld worden dat de studiepopulatie te
klein was om het effect van MISSION! primair te toetsen op harde klinische eindpunten. Deze gegevens hopen we in de nabije toekomst te kunnen leveren, aangezien
de inclusie van patiënten in het MISSION! protocol doorgaat.
177
List of publications
180
List of publications
van Looij MA*, Liem SS*, van der Burg H, van der Wees J, De Zeeuw CI, van Zanten BG.
Impact of conventional anesthesia on auditory brainstem responses in mice. Hear
Res. 2004;193(1-2):75-82
van der Wees J, van Looij MA, de Ruiter MM, Elias H, van der Burg H, Liem SS, Kurek
D, Engel JD, Karis A, van Zanten BG, de Zeeuw CI, Grosveld FG, van Doorninck JH.
Hearing loss following Gata3 haploinsufficiency is caused by cochlear disorder.
Neurobiol Dis. 2004;16(1):169-178
Van der Velde ET, Liem SS, van der Hoeven BL, Witteman TA, Foeken H, Oemrawsingh
PV, Schalij MJ
Multi-vendor solution for reception and review of ECG to shorten treatment delay in
AMI patients. Computers in Cardiology 2005; 32:61-63
van der Hoeven BL, Liem SS, Oemrawsingh PV, Dijkstra J, Jukema JW, Putter H,
Atsma DE, van der Wall EE, Bax JJ, Reiber JC, Schalij MJ.
Role of calcified spots detected by intravascular ultrasound in patients with STsegment elevation acute myocardial infarction. Am J Cardiol. 2006;98(3):309-313
Liem SS, van der Hoeven BL, Oemrawsingh PV, Bax JJ, van der Bom JG, Bosch J,
Viergever EP, van Rees C, Padmos I, Sedney MI, van Exel HJ, Verwey HF, Atsma DE,
van der Velde ET, Jukema JW, van der Wall EE, Schalij MJ
MISSION!: Optimization of acute and chronic care for patients with acute myocardial
infarction. Am Heart J 2007;153:14.e1214.e11
Liem SS, Jukema JW, Schalij MJ
Response to the letter to the Editor by van de Werf. Am Heart J 2007;153:e35.
Mollema SA, Bleeker GB, Liem SS, Boersma E, van der Hoeven BL, Holman ER, van
der Wall EE, Schalij MJ, Bax JJ.
Does left ventricular dyssynchrony immediately after acute myocardial infarction
result in left ventricular dilatation? Heart Rhythm. 2007;4(9):1144-1148
Mollema SA, Liem SS, Suffoletto MS, Bleeker GB, van der Hoeven BL, van de Veire
NR, Boersma E, Holman ER, van der Wall EE, Schalij MJ, Gorcsan J 3rd, Bax JJ.
List of publications
Left ventricular dyssynchrony acutely after myocardial infarction predicts left ventricular remodeling. J Am Coll Cardiol. 2007;50(16):1532-1540
van der Hoeven BL, Liem SS, Jukema JW, Suraphakdee N, Putter H, Dijkstra J, Atsma
DE, Bootsma M, Zeppenfeld K, Oemrawsingh PV, van der Wall EE, Schalij MJ.
Sirolimus-eluting stents versus bare-metal stents in patients with ST-segment elevation myocardial infarction: 9-month angiographic and intravascular ultrasound results
and 12-month clinical outcome results from the MISSION! Intervention Study. J Am
Coll Cardiol. 2008; 51(6):618-626
de Jager SC, Kraaijeveld AO, Grauss RW, de Jager W, Liem SS, van der Hoeven BL,
Prakken BJ, Putter H, van Berkel TJ, Atsma DE, Schalij MJ, Jukema JW, Biessen EA.
CCL3 (MIP-1 alpha) levels are elevated during acute coronary syndromes and show
strong prognostic power for future ischemic events. J Mol Cell Cardiol. 2008;
45(3):446-452
Hassan AKM, Liem SS, van der Kley F, Bergheanu SC, Wolterbeek R, Bosch J, van
der Laarse A, Atsma DE, Jukema JW, Schalij MJ
In-ambulance abciximab administration in STEMI patients prior to primary PCI is
associated with smaller infarct size, improved LV function and lower incidence of
heart failure. Eur Heart J. 2008; Supplement:136
Liem SS, van der Hoeven BL, Mollema SA, Bosch J, van der Bom JG, Viergever EP,
van Rees C, Bootsma M, van der Velde ET, Jukema JW, van der Wall EE, Schalij MJ
Optimization of acute and long-term care for acute myocardial infarction patients:
The Leiden MISSION! project. Submitted
Liem SS, Oemrawsingh PV, Cannegieter SC, Le Cessie S, Schreur J, Rosendaal FR,
Schalij MJ
Cardiovascular risk in young apparently healthy descendents from Asian Indian migrants in the Netherlands: the SHIVA study. Netherlands Heart Journal (in press)
Hassan AKM, Bergheanu SC, Hasan-Ali H, Liem SS, van der Laarse A, Wolterbeek R,
Atsma DE, Schalij MJ, Jukema JW
Usefulness of peak troponin-T to predict infarct size and long-term outcome in
patients with first acute myocardial infarction after primary percutaneous coronary
intervention. Am J Cardiol. (in press)
181
Curriculum Vitae
Curriculum Vitae
Su-San Liem, the author of this thesis, was born on June 18, 1976 in Tegelen, The
Netherlands. After having been awarded her Gymnasium (high school) diploma by
the Collegium Marianum in Venlo, she started studying medicine at the Catholic
University of Leuven in Belgium in 1994. There she obtained her candidature diploma
and completed the first two doctoral years. She returned to the Netherlands and
carried out research at the Department of Anatomy at the Erasmus University of
Rotterdam for a period of seven months. The research was in the field of “Auditory
Brainstem Response” in mice and was carried out under the supervision of Prof.
Dr. L. Feenstra and Prof. Dr. C.I. de Zeeuw. In 2001 she started her internship at the
Erasmus University and obtained her medical degree with distinction in April 2003.
For a short period of time she worked as a resident at the Department of Internal
Medicine at the Reinier de Graaf Hospital in Delft. In February 2004, she started her
official training in cardiology under an “AGIKO” scholarship at the Leiden University
Medical Center. Under the supervision of Prof. Dr. M.J. Schalij and Prof. Dr. E.E. van
der Wall she implemented an all-phased integrated care program for patients with
an acute myocardial infarction: the MISSION! protocol. The results of this protocol
and other studies carried out are described in this thesis. Over the course of her
time carrying out scientific research she was an abstract grader of the “Quality of
Care and Outcomes Research in Cardiovascular Disease and Stroke Conference” of
the American Heart Association in 2007. She was a finalist for the “Geoffrey Rose
Young Investigator Award” at the “EuroPRevent” congress of the European Society
of Cardiology in Madrid 2007. Furthermore, she was active in the “Committee of
Cardiovascular Prevention and Cardiac Rehabilitation” of The Netherlands Society
of Cardiology. Since September 2007, she has been working at the Department of
Internal Medicine at the Bronovo hospital, The Hague (pre-training for cardiologist,
educational head Dr. J.W. van ‘t Wout). Her traineeship will be continued at the
Department of Cardiology at the HAGA hospital in The Hague (educational head Dr.
B.J.M. Delemarre), and at the Department of Cardiology at the Leiden University
Medical Center (educational head Prof. Dr. E.E. van der Wall).
Su-San Liem, de auteur van dit proefschrift, werd geboren op 18 juni 1976, te Tegelen.
In 1994 behaalde zij het β-gymnasium eindexamen aan het Collegium Marianum te
Venlo. In hetzelfde jaar startte zij met de studie geneeskunde aan de Katholieke Universiteit Leuven in Leuven, België. Zij behaalde daar haar diploma kandidatuursjaren
en de eerste twee doctoraaljaren. Hierna ging zij terug naar Nederland. Gedurende
7 maanden deed zij onderzoek op het gebied van “Auditory Brainstem Response” bij
muizen, onder begeleiding van prof. dr. L. Feenstra en prof. dr. C.I. de Zeeuw op de
185
186
afdeling anatomie van de Erasmus Universiteit te Rotterdam. In 2001 startte ze met
haar co-schappen geneeskunde eveneens aan de Erasmus Universiteit te Rotterdam
en behaalde haar artsexamen “cum laude” in april 2003. Hierna was ze korte tijd
werkzaam als AGNIO Interne geneeskunde in het Reinier de Graaf ziekenhuis te
Delft. Sinds februari 2004 is zij als “AGIKO” verbonden aan de afdeling hartziekten
van het Leids Universitair Medisch Centrum te Leiden. Onder begeleiding van prof.
dr. M.J. Schalij en prof. dr. E.E. van der Wall zette zij een intensief zorgprogramma op
voor patiënten met een acuut hartinfarct: het MISSION! protocol. De resultaten van
dit protocol en andere door haar verrichte studies staan beschreven in dit proefschrift.
Tijdens haar onderzoeksperiode was zij “abstract grader” voor de “Quality of Care
and Outcomes Research in Cardiovascular Disease and Stroke Conference” van de
American Heart Association in 2007. Zij was finaliste voor de “Geoffrey Rose Young
Investigator Award” tijdens EuroPRevent van de European Society of Cardiology in
Madrid 2007. Verder was zij actief in de Commissie Cardiovasculaire Preventie en
Hartrevalidatie van de Nederlandse Vereniging voor Cardiologie. Op 1 september
2007 startte zij met het klinische gedeelte van haar opleiding tot cardioloog op de
afdeling Interne Geneeskunde in het Bronovo Ziekenhuis, te Den Haag (opleider dr.
J.W. van ’t Wout). Dit zal vervolgd worden op de afdeling cardiologie van het HAGA
ziekenhuis, te Den Haag (opleider dr. B.J.M Delemarre) en de afdeling cardiologie
van het Leids Universitair Medisch Centrum, te Leiden (opleider prof. dr. E.E. van
der Wall).


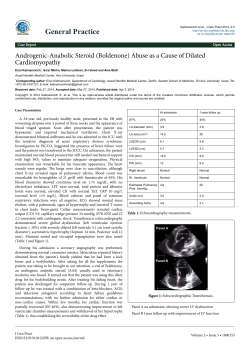


© Copyright 2026